An alternative splicing program promotes adipose tissue thermogenesis
- University of Massachusetts Medical School, United States
- Howard Hughes Medical Institute, United States
Figures
Figure 1 with 5 supplements

Diet-induced obesity causes changes in alternative pre-mRNA splicing in adipose tissue.
(A) RNA-seq analysis demonstrates that the consumption (16 wk) of a HFD, compared with a CD, causes significant changes in mRNA expression genes (q<0.05; absolute log2-fold change >0.75) and differential exon inclusion/exclusion (FDR<0.05; absolute ∆Inc level >0.1) in the epididymal adipocyte transcriptome. (B) Genes that are significantly differentially expressed and genes that are subjected to alternative pre-mRNA splicing are depicted using a Venn diagram. (C,D) Classification of HFD-induced alternative splicing events (C) and selected examples (D) are presented. (E) Enrichment of NOVA CLIP-seq tags with significantly (FDR<0.05; absolute ∆Inc level >0.1) alternatively spliced exons (± 500 bp of intron/exon junctions) compared with non-alternatively spliced exons (FDR≥0.05) and random genomic sequences. (F) Immunoblot analysis of NOVA proteins in lysates prepared from hepatocytes and epididymal adipocytes. (G) Nova1 and Nova2 mRNA expression by epididymal adipocytes of wild-type and obese ob/ob mice (6 wk old) was examined by quantitative RT-PCR (mean ± SEM; n=5; *p<0.05; ***p<0.001). The source data are included as Figure 1—source data 1. (H) Wild-type mice were fed a CD or an HFD (16 wk). Nova1 and Nova2 mRNA expression by epididymal adipocytes was measured by quantitative RT-PCR analysis (mean ± SEM; n=7; *p<0.05). The source data are included as Figure 1—source data 2.
-
Figure 1—source data 1
Source data for Figure 1G.
- https://doi.org/10.7554/eLife.17672.004
-
Figure 1—source data 2
Source data for Figure 1H.
- https://doi.org/10.7554/eLife.17672.005
Figure 1—figure supplement 1
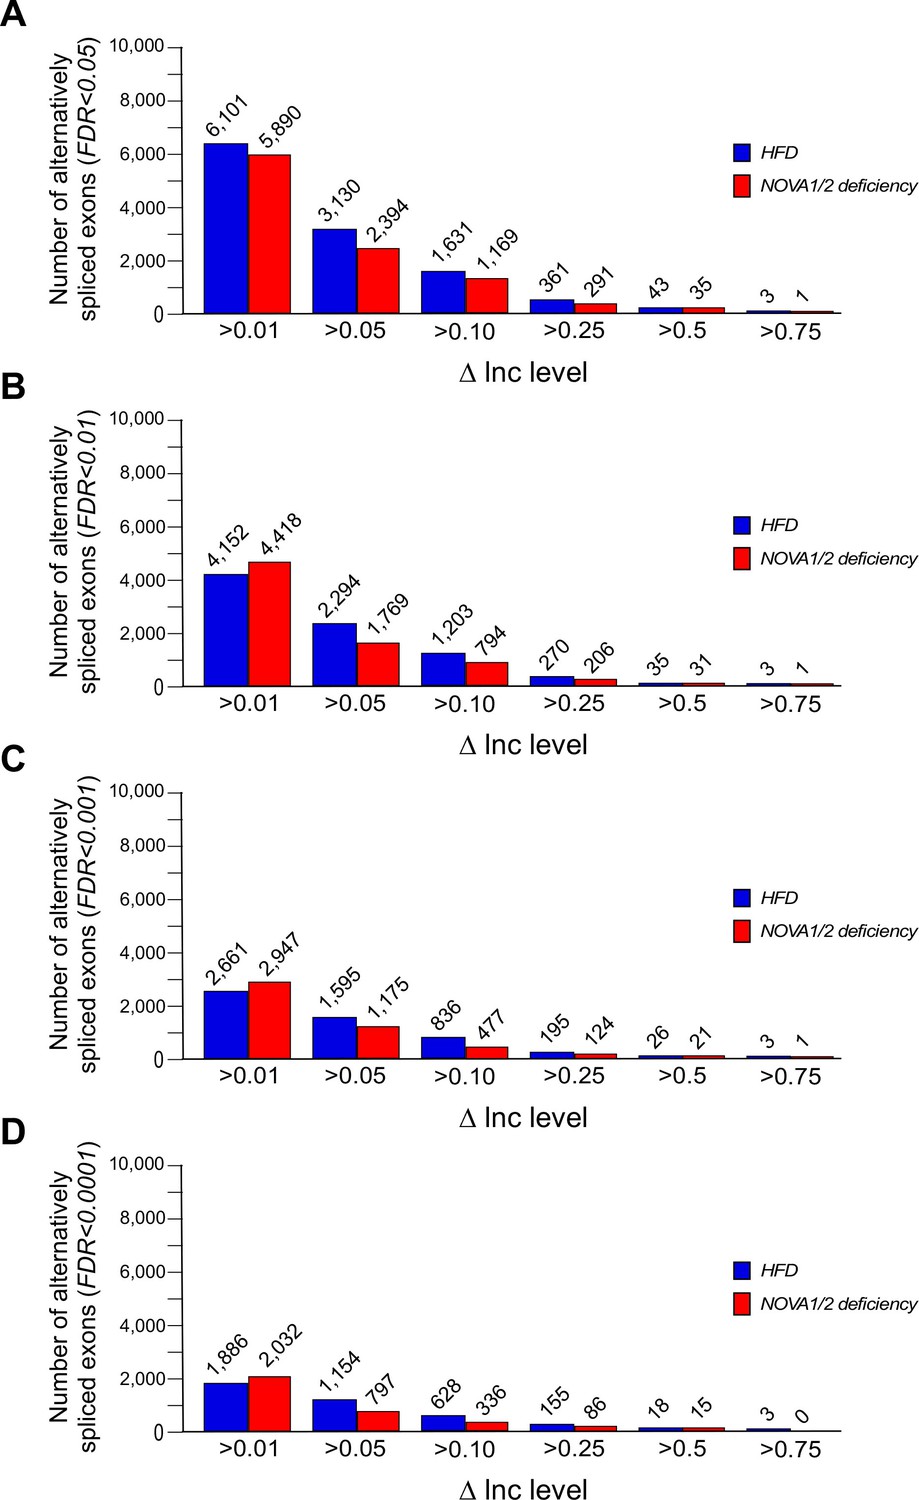
Alternative pre-mRNA splicing in adipocytes.
(A–D) Alternatively spliced exons identified by comparison of adipocytes of CD and HFD mice (Figure 1) and comparison of adipocytes of FWT and F∆N1,2 mice (Figure 2) are presented. The number of significantly alternatively spliced exons (∆Inc level >0.01, >0.05, >0.1, >0.25, >0.5, and >0.75) is presented with FDR<0.05 (A), FDR<0.01 (B), FDR<0.001 (C), and FDR<0.0001 (D).
Figure 1—figure supplement 2
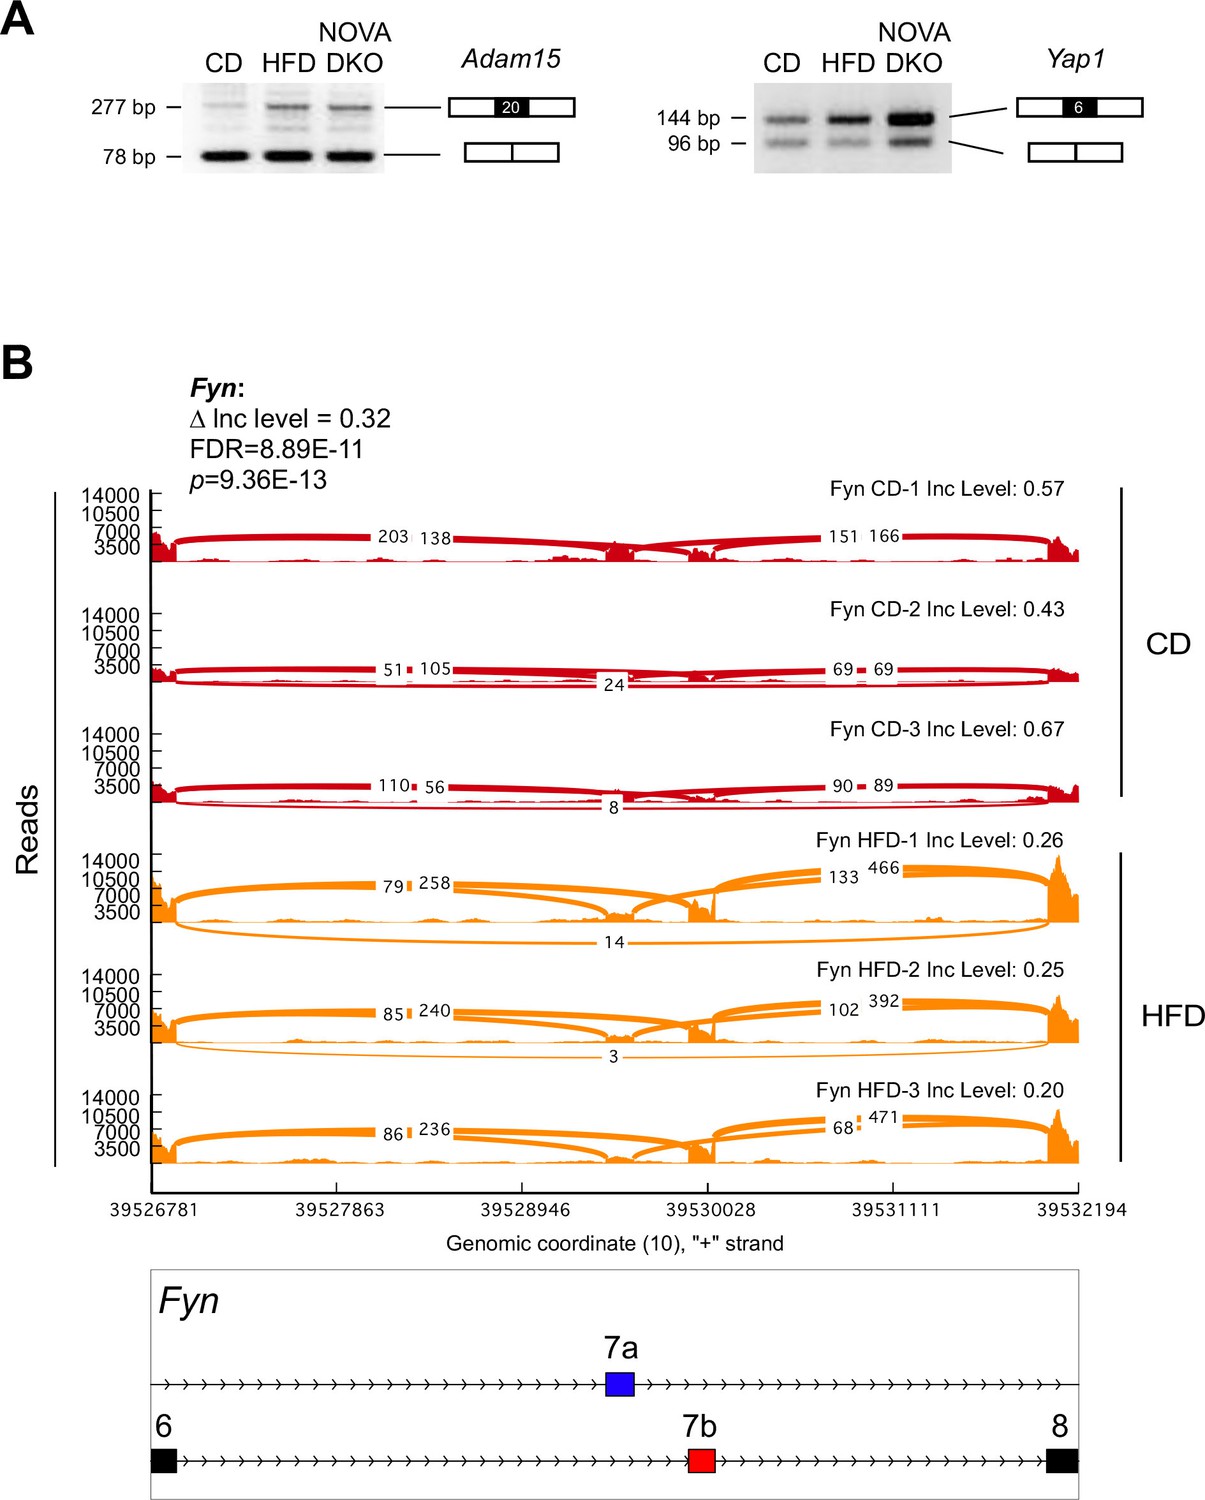
Alternative pre-mRNA splicing in adipocytes.
(A) Semi-quantitative RT-PCR analysis of epididymal adipocyte mRNA isolated from CD-fed mice, HFD-fed mice, and F∆N1,2 mice (NOVA DKO) was performed to detect alternative splicing of Adam15 mRNA (skipping exon 20) and Yap1 mRNA (skipping exon 6). (B) Mutually exclusive inclusion of exons 7a and 7b in Fyn mRNA by adipocytes of CD-fed and HFD-fed mice is presented as a sashimi plot.
Figure 1—figure supplement 3
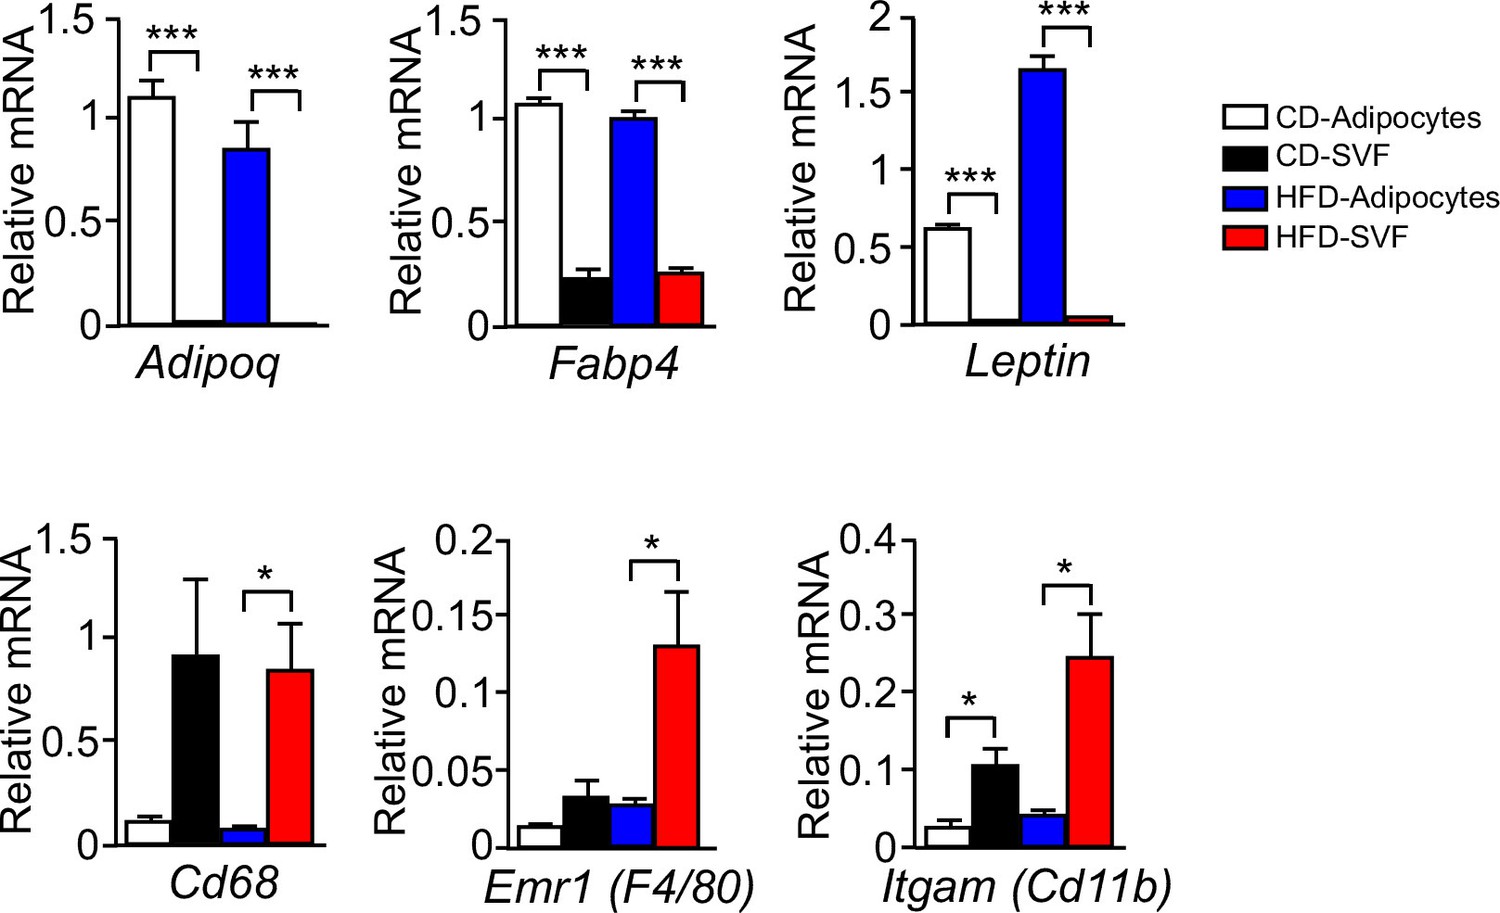
Expression of adipocyte and stromal vascular fraction marker genes.
Epididymal fat pads of CD-fed and HFD-fed (16 wk) wild-type mice were used to isolate adipocytes and the stromal vascular fraction (SVF). The expression of adipocyte and SVF marker genes were examined by measurement of mRNA by quantitative RT-PCR (mean ± SEM; n = 4~6; *p<0.05; ***p<0.001). These data demonstrate that adipocyte marker genes Adipoq and Leptin were not expressed by the SVF, but low level expression of the SVF marker genes Emr1 (F4/80), Itgam (Cd11b), and Cd68 was detected the adipocyte fraction. This SVF contamination of the adipocyte fraction may be mediated by lipid-loaded macrophages (Xu et al., 2013). Control studies were performed using a gene (Fabp4) that is expressed by both adipocytes and SVF.
Figure 1—figure supplement 4
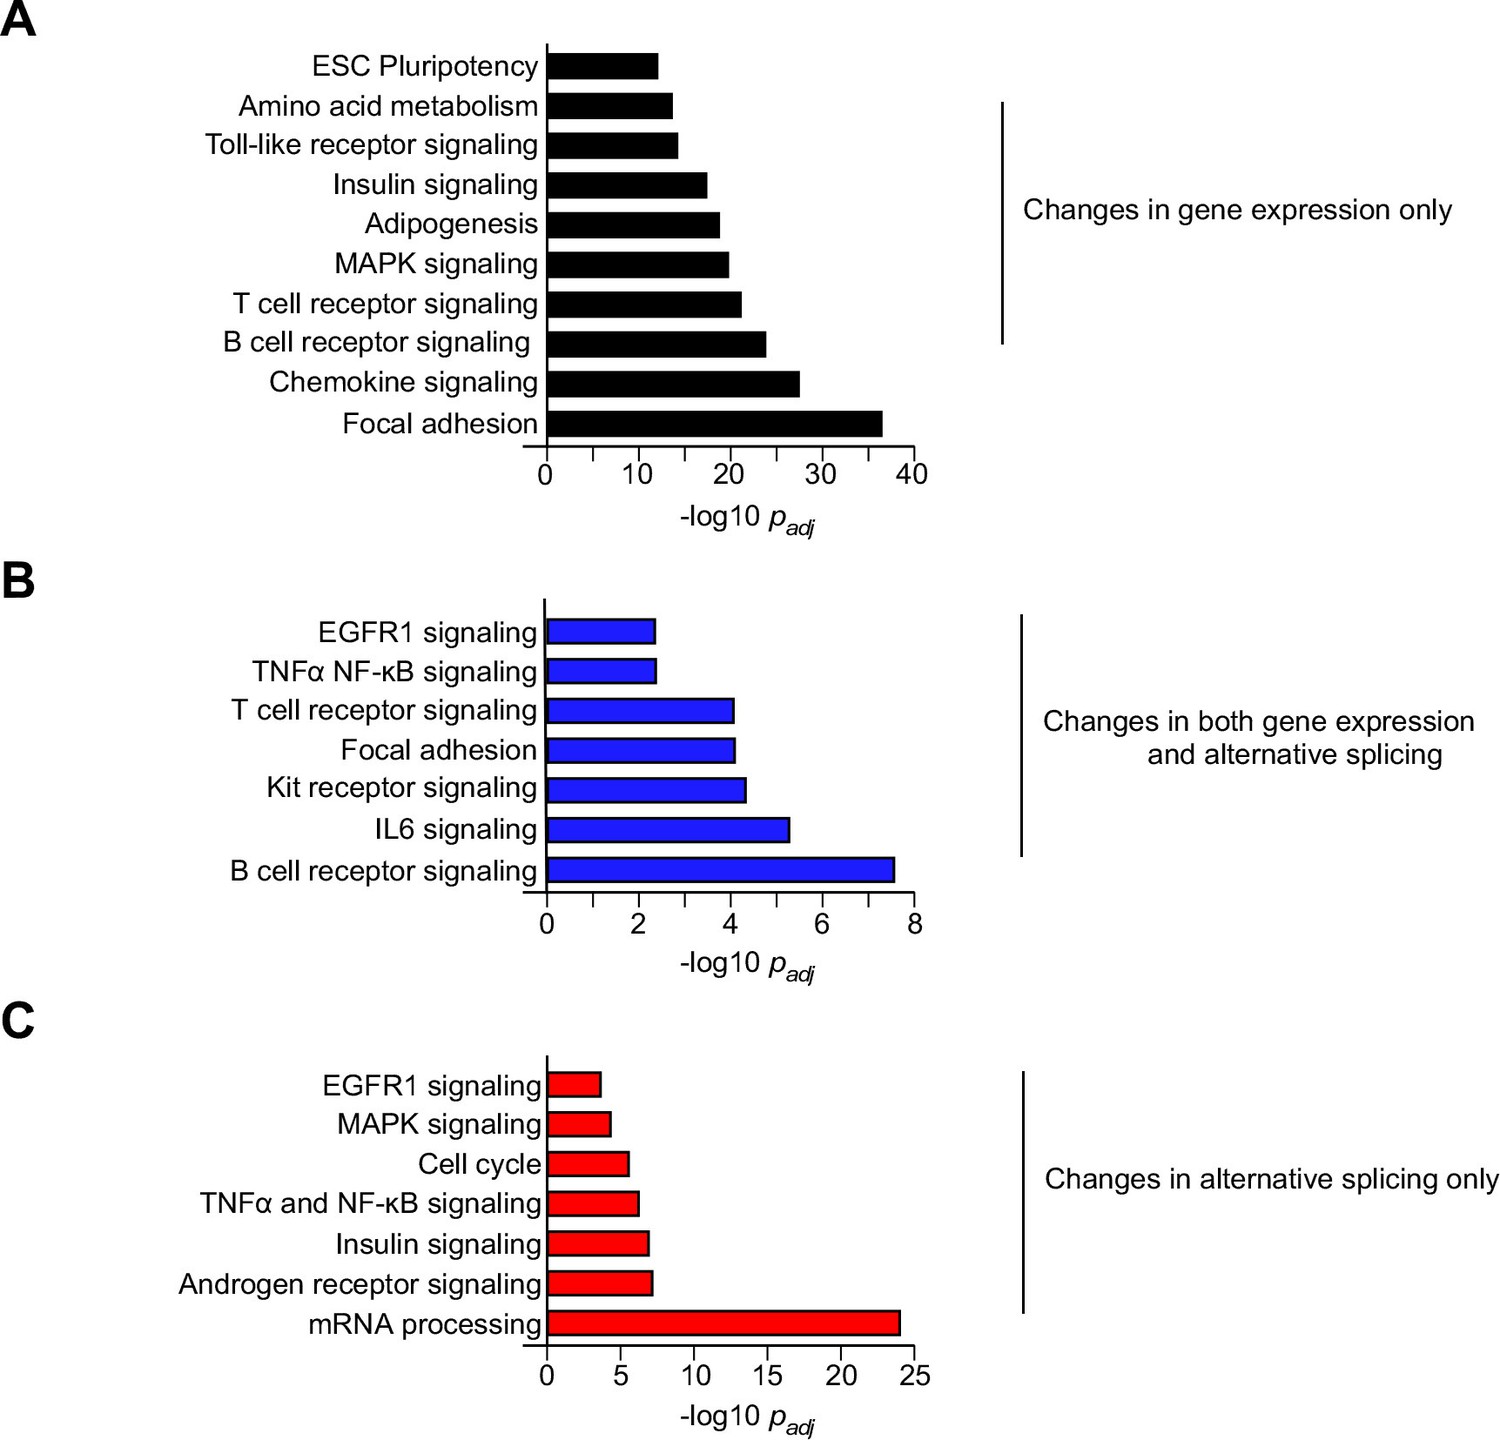
Biological pathway enrichment analysis of differential gene expression and alternative pre-mRNA splicing caused by feeding a HFD.
Genes that are differentially expressed and/or alternatively spliced in response to the consumption of a HFD (Figure 1B) were examined by pathway analysis to detect significant enrichment for specific biological processes.
Figure 1—figure supplement 5
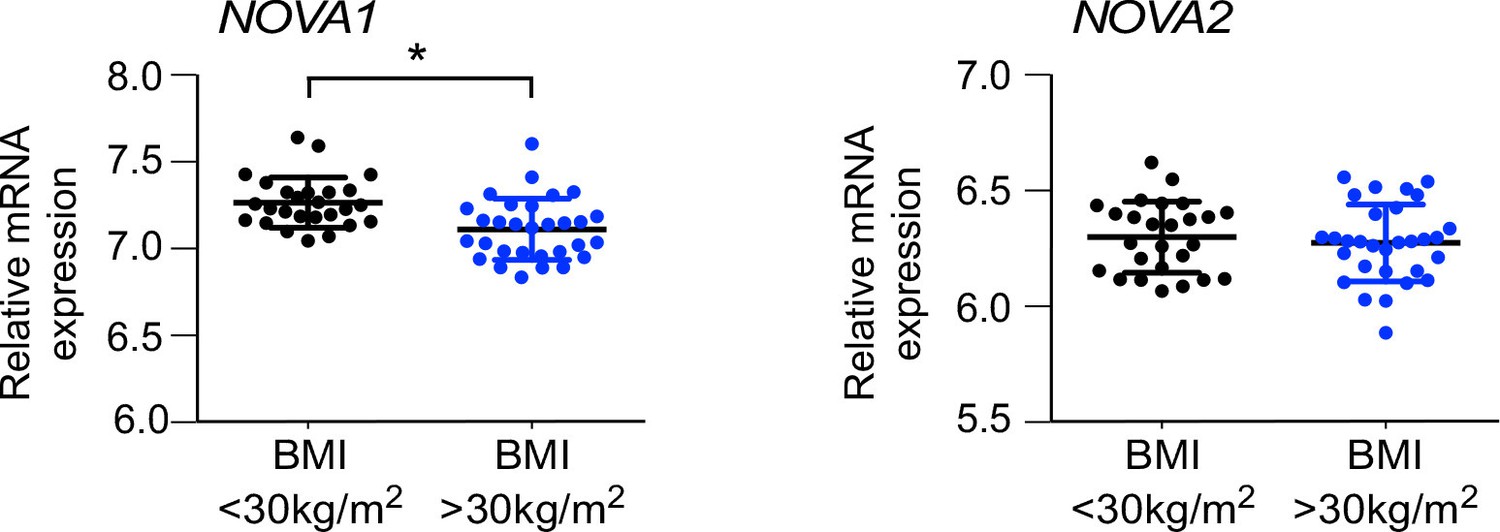
NOVA expression in human subcutaneous adipose tissue.
NOVA1 and NOVA2 mRNA expression in abdominal subcutaneous adipose of obese (BMI>30 kg/m2) and non-obese (BMI<30 kg/m2) matched humans was examined (mean ± SEM; n = 30 obese, n = 26 non-obese; *p<0.05).
Figure 2 with 1 supplement
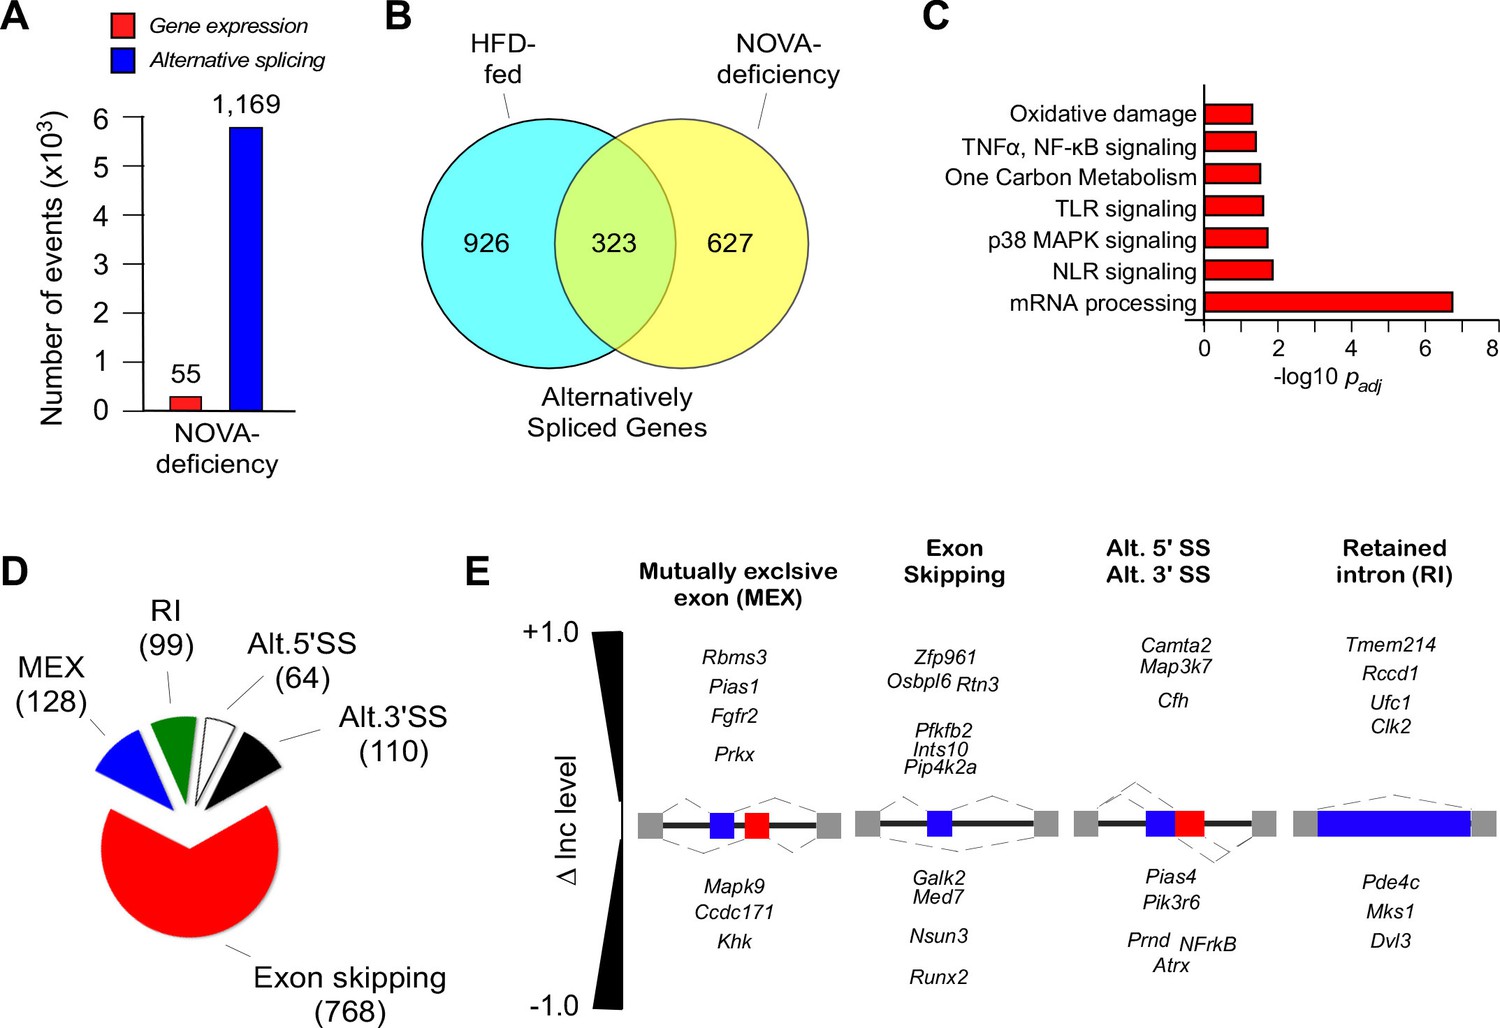
NOVA proteins contribute to alternative pre-mRNA splicing associated with diet-induced obesity.
(A) RNA-seq analysis of FWT and F∆N1,2 mice fed an HFD (16 wk) identifies significant changes in gene expression (q<0.05; absolute log2-fold change >0.75) and differential exon inclusion/exclusion (FDR<0.05; absolute ∆Inc level >0.1) in the epididymal adipocyte transcriptome. (B) The number of genes with significant differential alternative splicing (CD-fed vs HFD-fed WT mice and HFD-fed FWT mice vs HFD-fed F∆N1,2 mice) are depicted using a Venn diagram. (C) Biological pathway enrichment analysis of the 323 genes co-regulated by alternative pre-mRNA splicing following HFD consumption and NOVA deficiency. (D,E) Classification of alternative splicing events caused by NOVA deficiency (D) and selected examples (E) are presented.
Figure 2—figure supplement 1
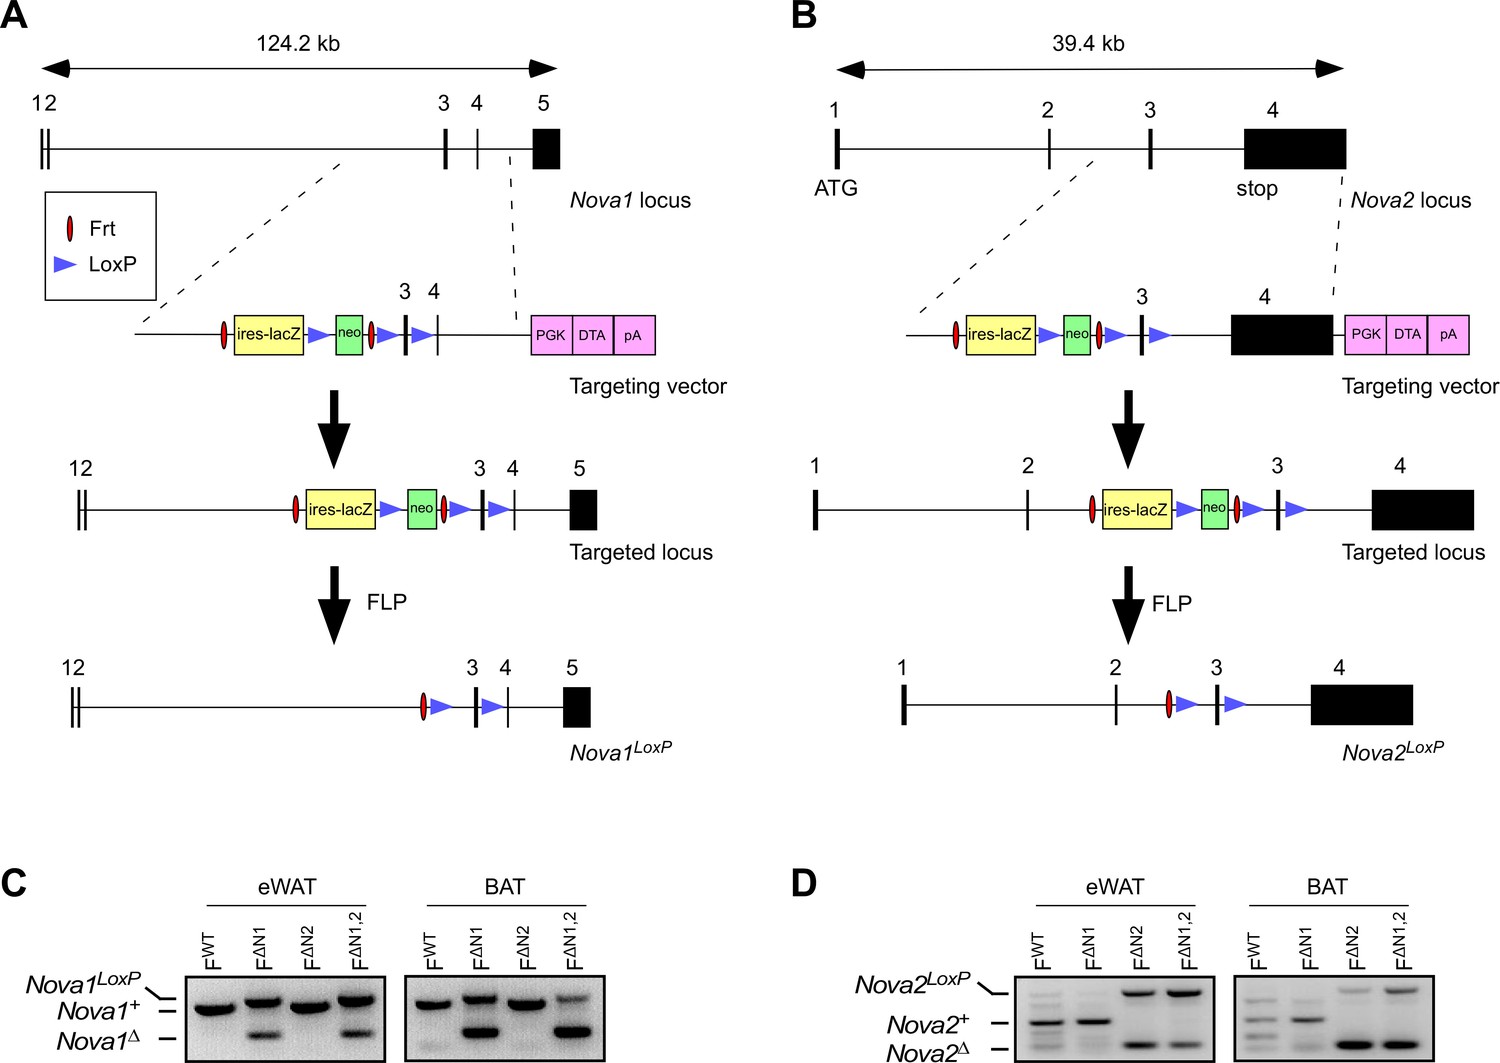
Establishment of Nova1LoxP/LoxP and Nova2LoxP/LoxP mice.
(A,B) The methods used to create the floxed Nova1 and floxed Nova2 alleles by homologous recombination are illustrated schematically. (C,D) PCR analysis of genomic DNA isolated epididymal white adipose tissue (eWAT) and interscapular brown adipose tissue (BAT) of Adipoq-cre+ (FWT) mice, Adipoq-cre+ Nova1LoxP/LoxP(F∆N1) mice, Adipoq-cre+ Nova2LoxP/LoxP (F∆N2) mice, and Adipoq-cre+ Nova1LoxP/LoxP Nova2LoxP/LoxP (F∆N1,2) mice.
Figure 3 with 3 supplements
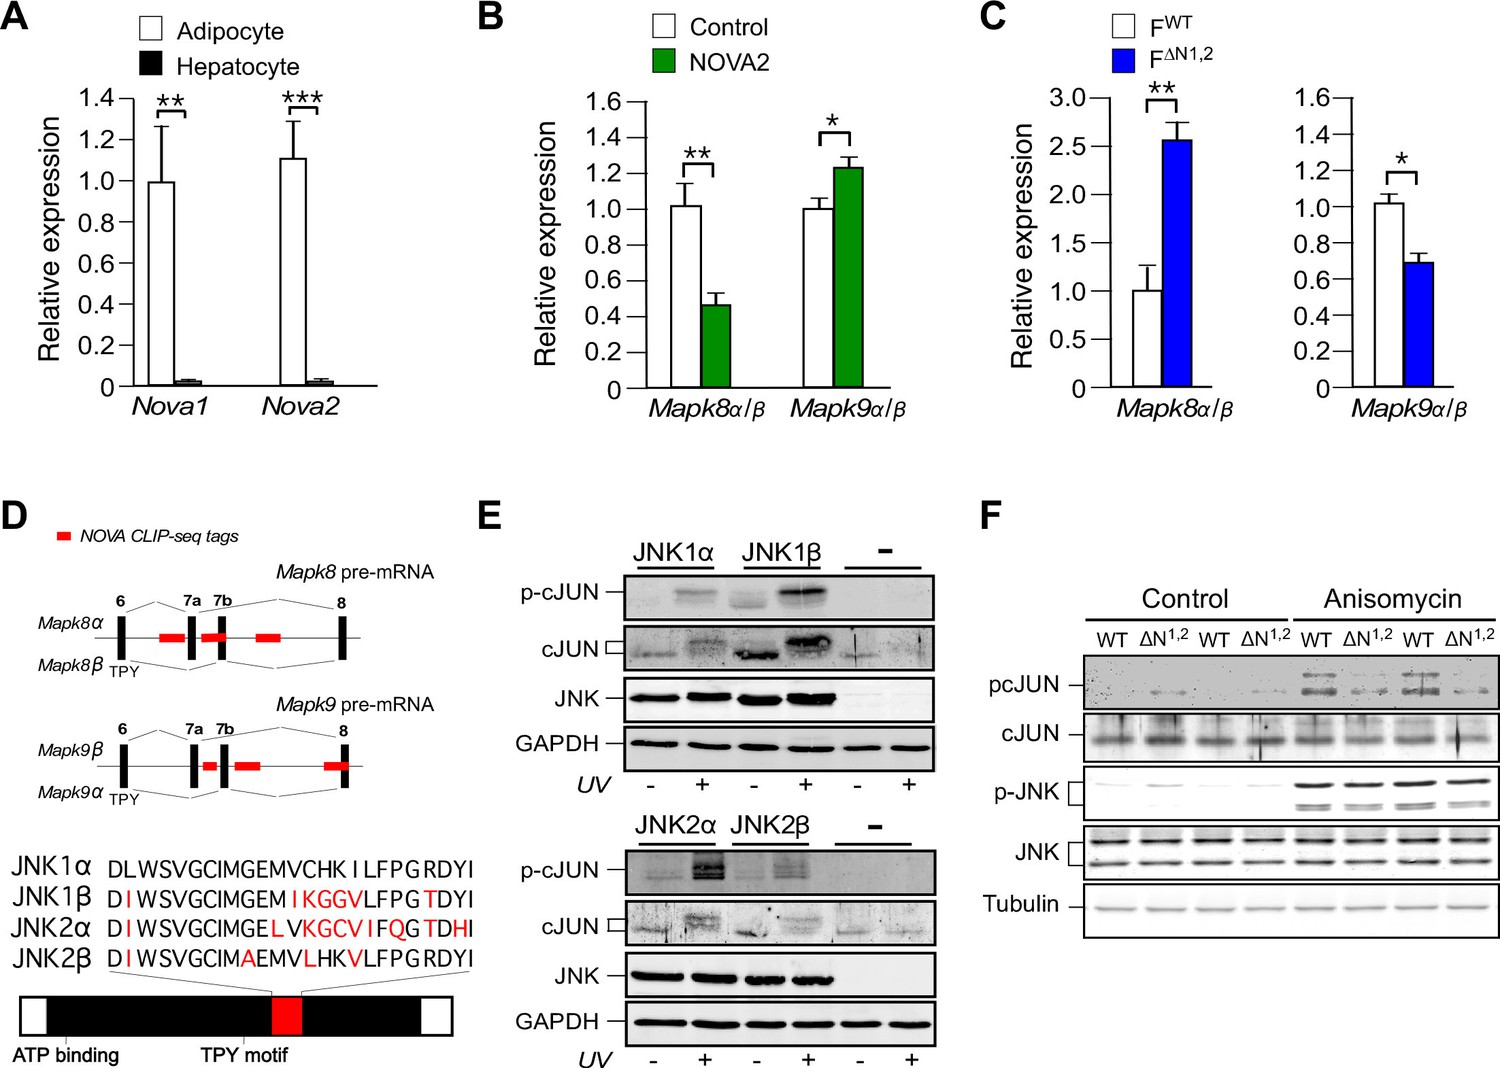
NOVA promotes signal transduction by JNK in adipose tissue.
(A) The expression of Nova mRNA in adipocytes and hepatocytes was measured by quantitative RT-PCR (mean ± SEM; n=7~8; **p<0.01; ***p<0.001). The source data are included as Figure 3—source data 1. (B) The α / β expression ratios of Mapk8 and Mapk9 mRNA by hepatocytes was measured by quantitative RT-PCR (mean ± SEM; n=10; *p<0.05; **p<0.01). The effect of hepatic expression of GFP (Control) or NOVA2 using adenoviral vectors was examined. The source data are included as Figure 3—source data 2. (C) The expression ratio of the α and β isoforms of Mapk8 and Mapk9 mRNA by FWT and F∆N1,2 adipocytes was measured by quantitative RT-PCR (mean ± SEM; n=5~8; *p<0.05; **p<0.01). The source data are included as Figure 3—source data 3. (D) The mutually exclusive inclusion of exons 7a or 7b in Mapk8 and Mapk9 mRNA is illustrated. NOVA CLIP-seq tags are highlighted in red. (E) Mapk8∆/∆ Mapk9-/- MEF transduced with retroviruses expressing JNK1α, JNK1β, JNK2α, JNK2β or empty vector (-) were exposed without and with 60 J/m2 UV (60 min) and lysates were examined by immunoblot analysis. (F) Adipocytes prepared from FWT and F∆N1,2 mice were treated without and with 1 µg/ml anisomycin (10 min) and lysates were examined by immunoblot analysis.
-
Figure 3—source data 1
Source data for Figure 3A.
- https://doi.org/10.7554/eLife.17672.015
-
Figure 3—source data 2
Source data for Figure 3B.
- https://doi.org/10.7554/eLife.17672.016
-
Figure 3—source data 3
Source data for Figure 3C.
- https://doi.org/10.7554/eLife.17672.017
Figure 3—figure supplement 1
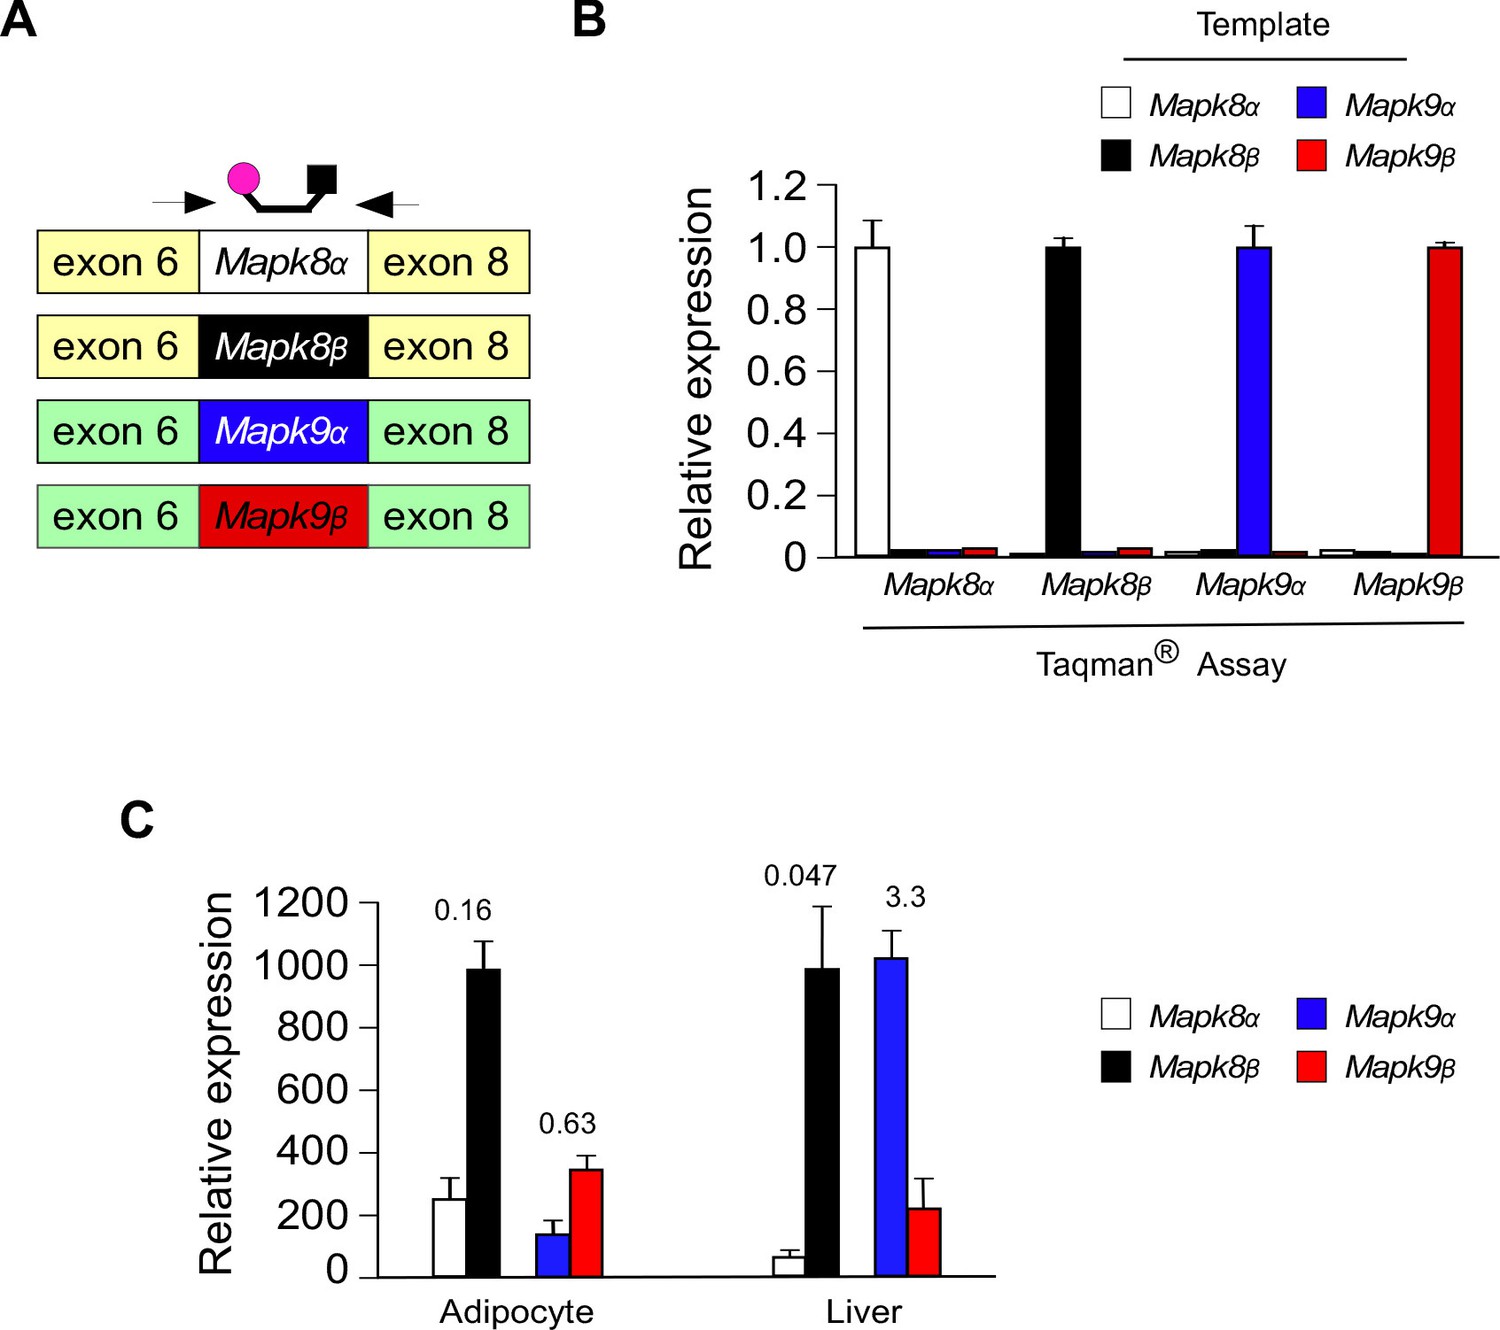
Design and validation of Taqman assays to detect inclusion of the mutually exclusive exons 7a and 7b in Mapk8 and Mapk9 mRNA.
(A) Schematic illustration of the design of Taqman assays to detect expression of Mapk8α, Mapk8β, Mapk9α, and Mapk9β mRNA. (B) Taqman assays were performed using 1 ng of cDNA template (Mapk8α, Mapk8β, Mapk9α, and Mapk9β cDNA) and probes designed to detect Mapk8α, Mapk8β, Mapk9α, and Mapk9β. The data presented are the mean ± SEM (n = 3). (C) The relative expression of Mapk8α, Mapk8β, Mapk9α, and Mapk9β mRNA in epididymal adipocytes and hepatocytes was measured by RT-PCR analysis (mean ± SEM; n = 3). The numbers above the bars represents the α/β ratio.
Figure 3—figure supplement 2
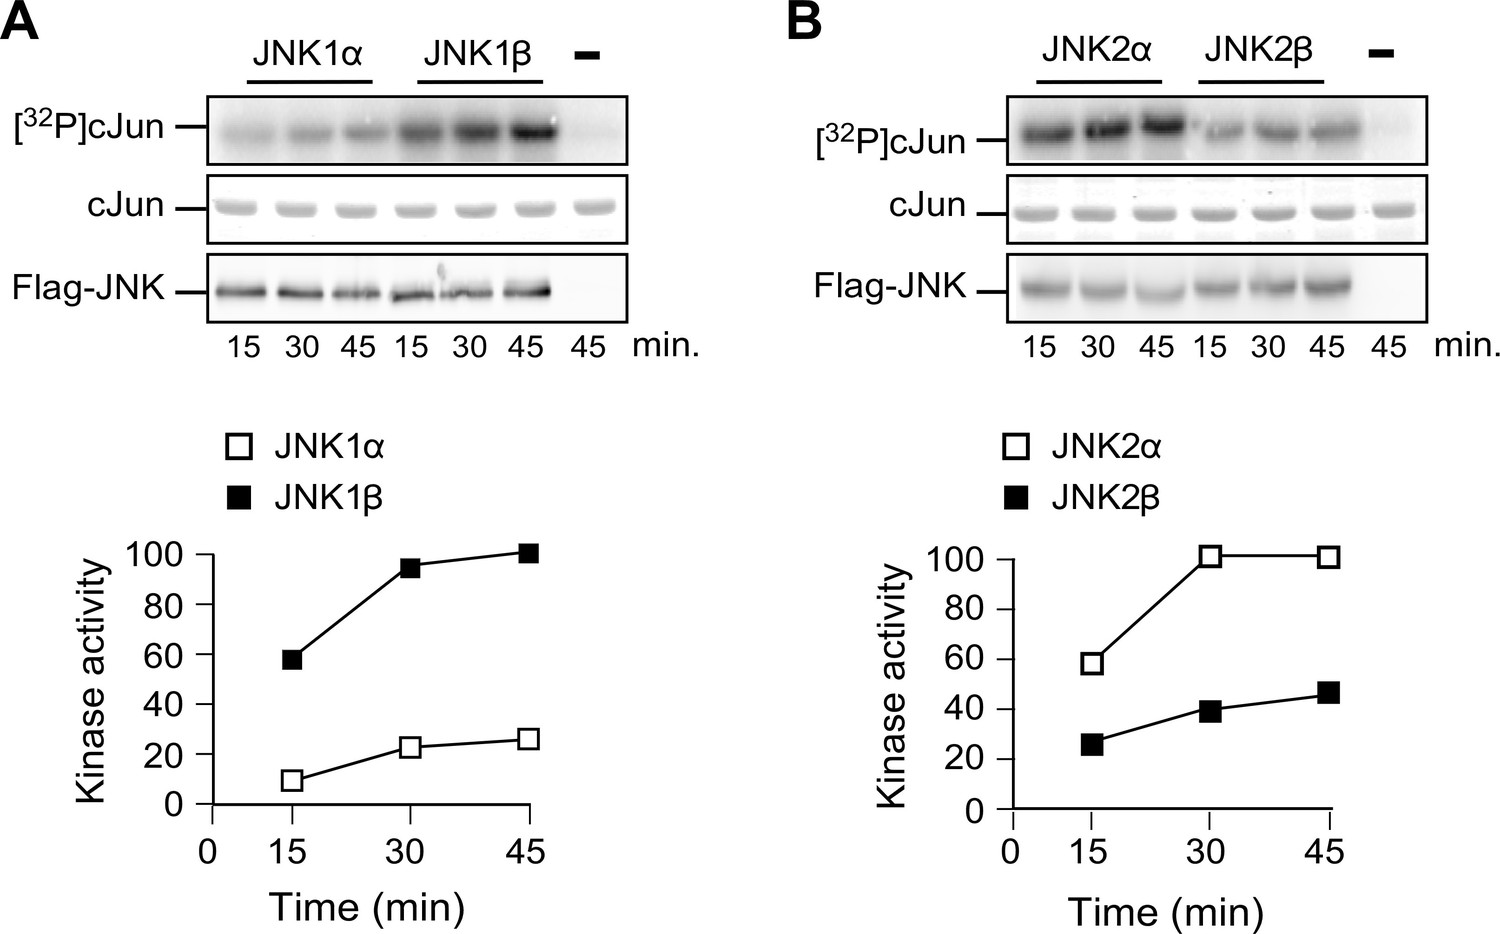
Comparison of JNKα and JNKβ protein kinase activity in vitro.
(A) Flag-tagged JNK1α1 and JNK1β1 expressed in 293T cells were isolated by immunoprecipitation using anti-Flag (M2) agarose. Protein kinase activity was measured with an in vitro assay using GST-cJun and [γ-32P] ATP as substrates. The amount of JNK in each assay was examined by immunoblot analysis. The amount of phosphorylated cJun was examined by Phosphorimager analysis. (B) In vitro kinase assays were performed using Flag-tagged JNK2α2 and JNK2β2.
Figure 3—figure supplement 3
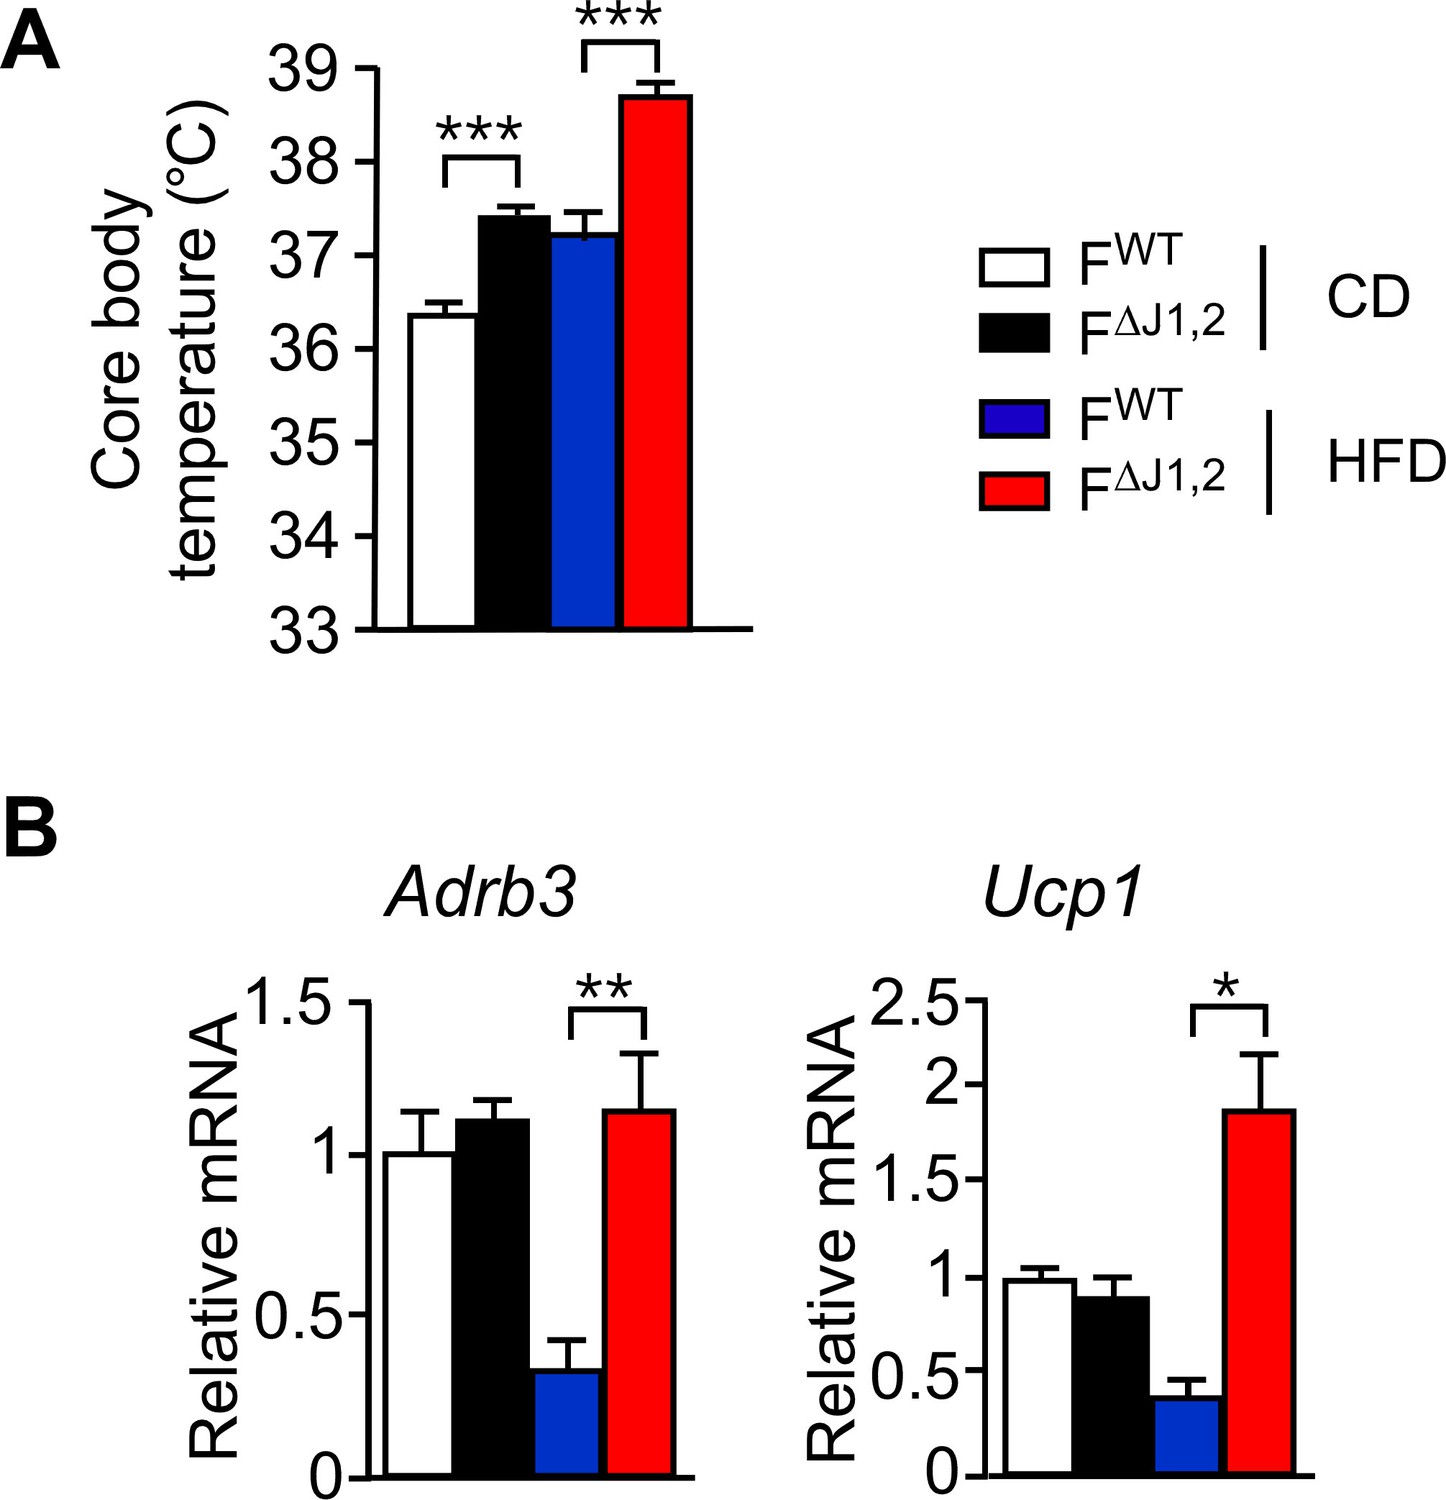
Effect of adipocyte-specific JNK-deficiency on thermogenic gene expression.
(A) Core body temperature of FWT and F∆J1,2 mice fed a CD or n HFD (16 wk) was measured by telemetry using an implanted probe (mean ± SEM; n = 7~10). (B) FWT and F∆J1,2 mice were fed a CD or an HFD (16 wk). Gene expression by sub-cutaneous inguinal adipocytes was examined by measurement of mRNA by RT-PCR (mean ± SEM; n=5~8). Statistically significant differences between FWT and F∆J1,2 mice are indicated: *p<0.05; **p<0.01; ***p<0.001.
Figure 4 with 5 supplements
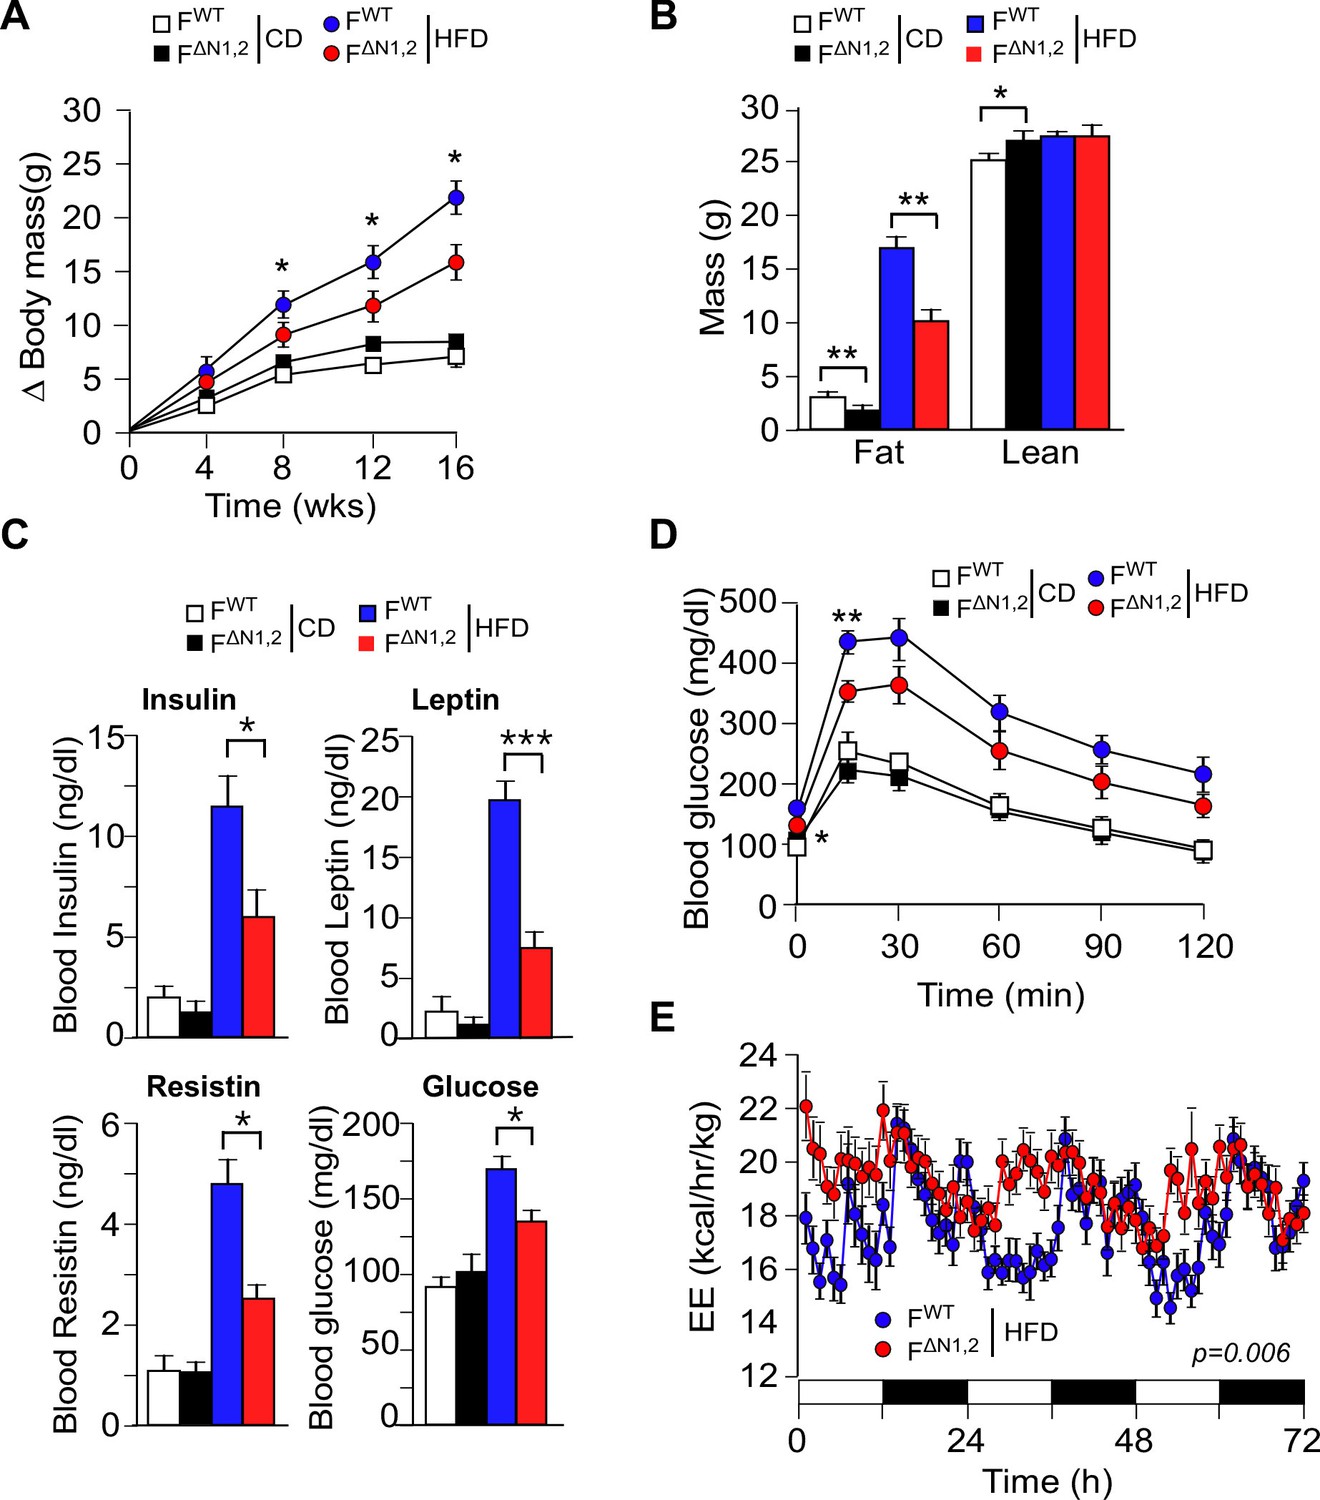
NOVA promotes the development of diet-induced obesity.
(A) The change in body mass of FWT and F∆N1,2 mice fed a CD or a HFD is presented (mean ± SEM; n=8~30; *p<0.05). (B) Body composition was examined by proton magnetic resonance spectroscopy (mean ± SEM; n=8~22; *p<0.05; **p<0.01). The source data are included as Figure 4—source data 1. (C) Blood insulin, leptin, resistin, and glucose in overnight starved CD-fed and HFD-fed (12 wks) FWT and F∆N1,2 mice were measured (mean ± SEM; n=8~16; *p<0.05; ***p<0.001). The source data are included as Figure 4—source data 2. (D) CD-fed and HFD-fed (12 wks) FWT and F∆N1,2 mice were examined by glucose tolerance tests (mean ± SEM; n=8~26; *p<0.05; ***p<0.001). The source data are included as Figure 4—source data 3. (E) Energy expenditure (EE) by HFD-fed (4 wks) FWT mice (n = 9) and F∆N1,2 mice (n = 8) was examined using metabolic cages over 3 days (12 hr light; 12 hr dark). The source data are included as Figure 4—source data 4.
-
Figure 4—source data 1
Source data for Figure 4B.
- https://doi.org/10.7554/eLife.17672.022
-
Figure 4—source data 2
Source data for Figure 4C.
- https://doi.org/10.7554/eLife.17672.023
-
Figure 4—source data 3
Source data for Figure 4D.
- https://doi.org/10.7554/eLife.17672.024
-
Figure 4—source data 4
Source data for Figure 4E.
- https://doi.org/10.7554/eLife.17672.025
Figure 4—figure supplement 1
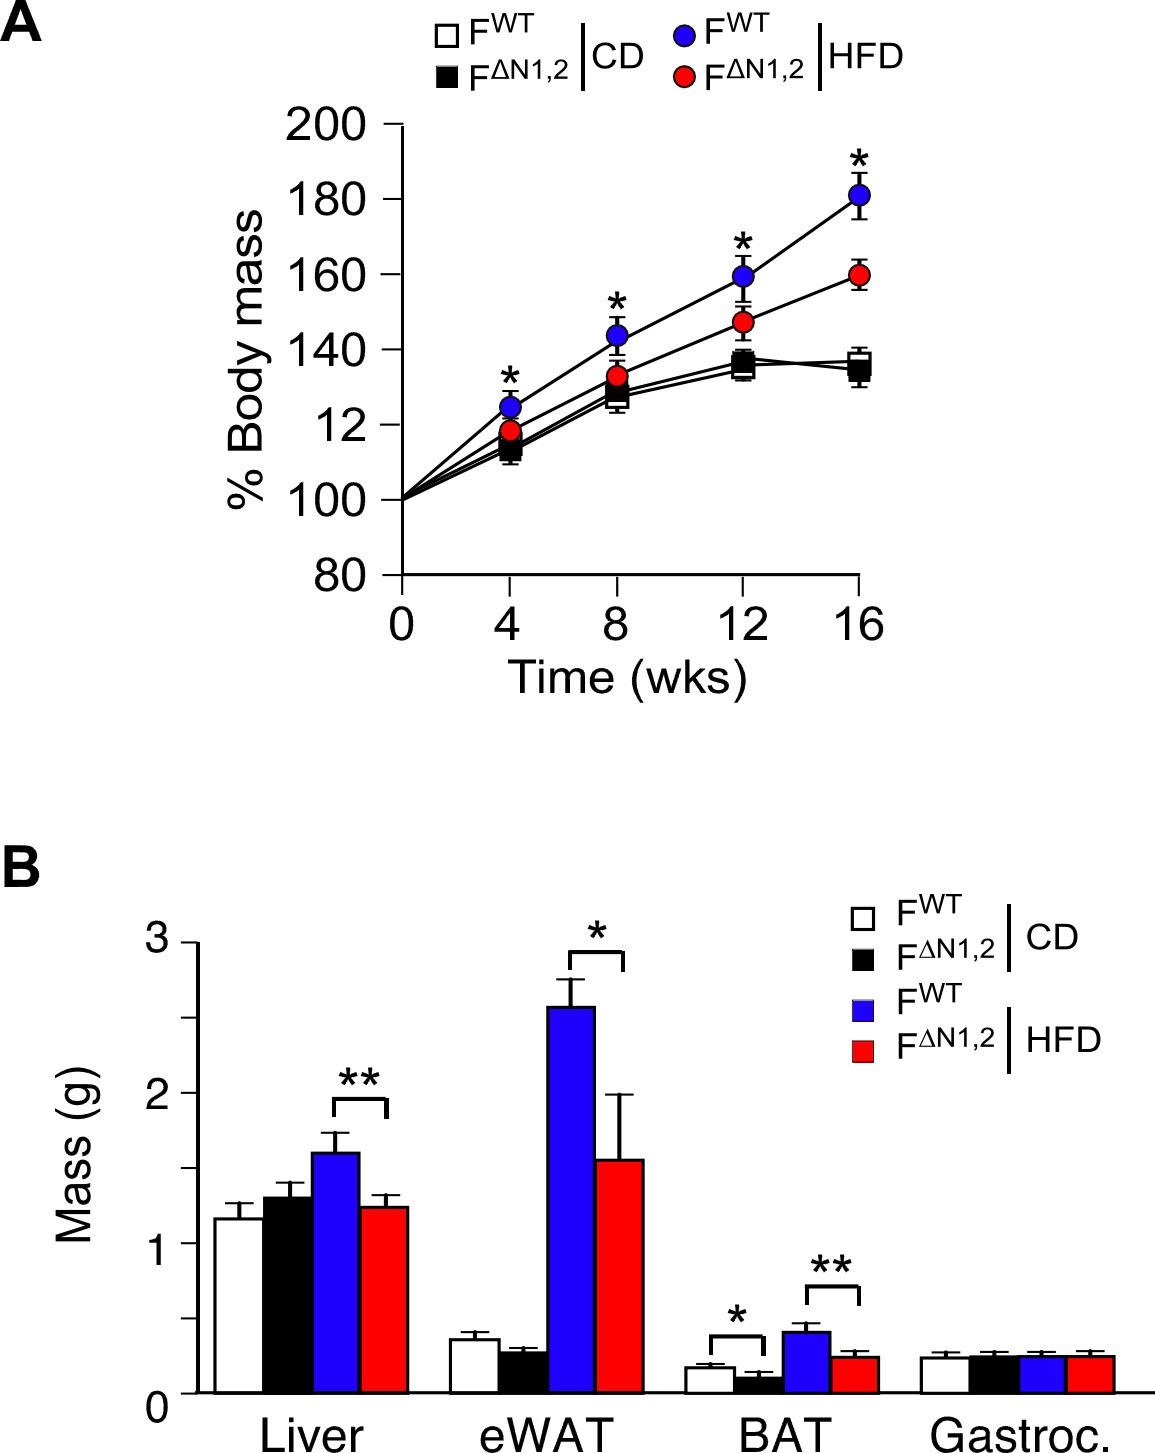
Effect of adipose tissue-specific NOVA1/2-deficiency on organ mass.
(A) The change in% body mass of FWT and F∆N1,2 mice fed a CD or ais presented (mean ± SEM; n=8~30; *p<0.05). (B) The mass of the liver, epididymal white adipose tissue (eWAT), interscapular brown adipose tissue (BAT), and gastrocnemius muscle (Gastroc.) of FWT and F∆N1,2 mice fed a CD or a(16 wk) is presented (mean ± SEM; n=21). Statistically significant differences between FWT and F∆N1,2 mice are indicated: *p<0.05; **p<0.01.
Figure 4—figure supplement 2
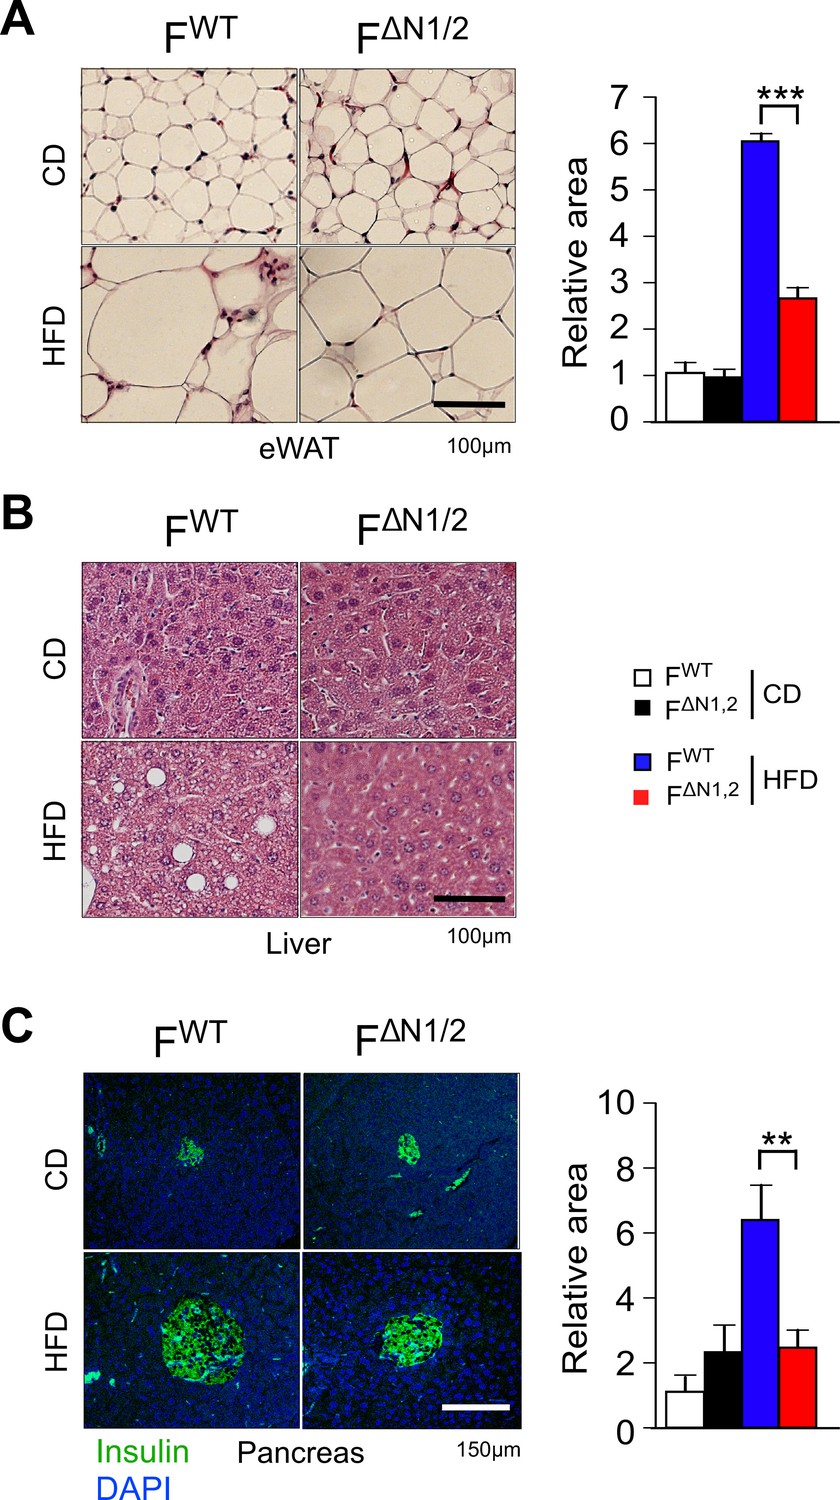
Comparison of adipose tissue, liver, and pancreas in FWT and F∆N1,2 mice.
(A) Analysis of hematoxylin & eosin-stained tissue sections prepared from epididymal adipose tissue of CD-fed and HFD-fed (16 wk) FWT and F∆N1,2 mice. The relative area of adipocytes is presented (mean ± SEM; n=6 mice). (B) Representative hematoxylin & eosin-stained liver sections are presented (n=6). (C) Sections of the pancreas were stained with an antibody to insulin (green). DNA was stained with DAPI. The relative area of islets is presented (mean ± SEM; n=6 mice). Statistically significant differences between FWT and F∆N1,2 mice are indicated: **p<0.01; ***p<0.001.
Figure 4—figure supplement 3
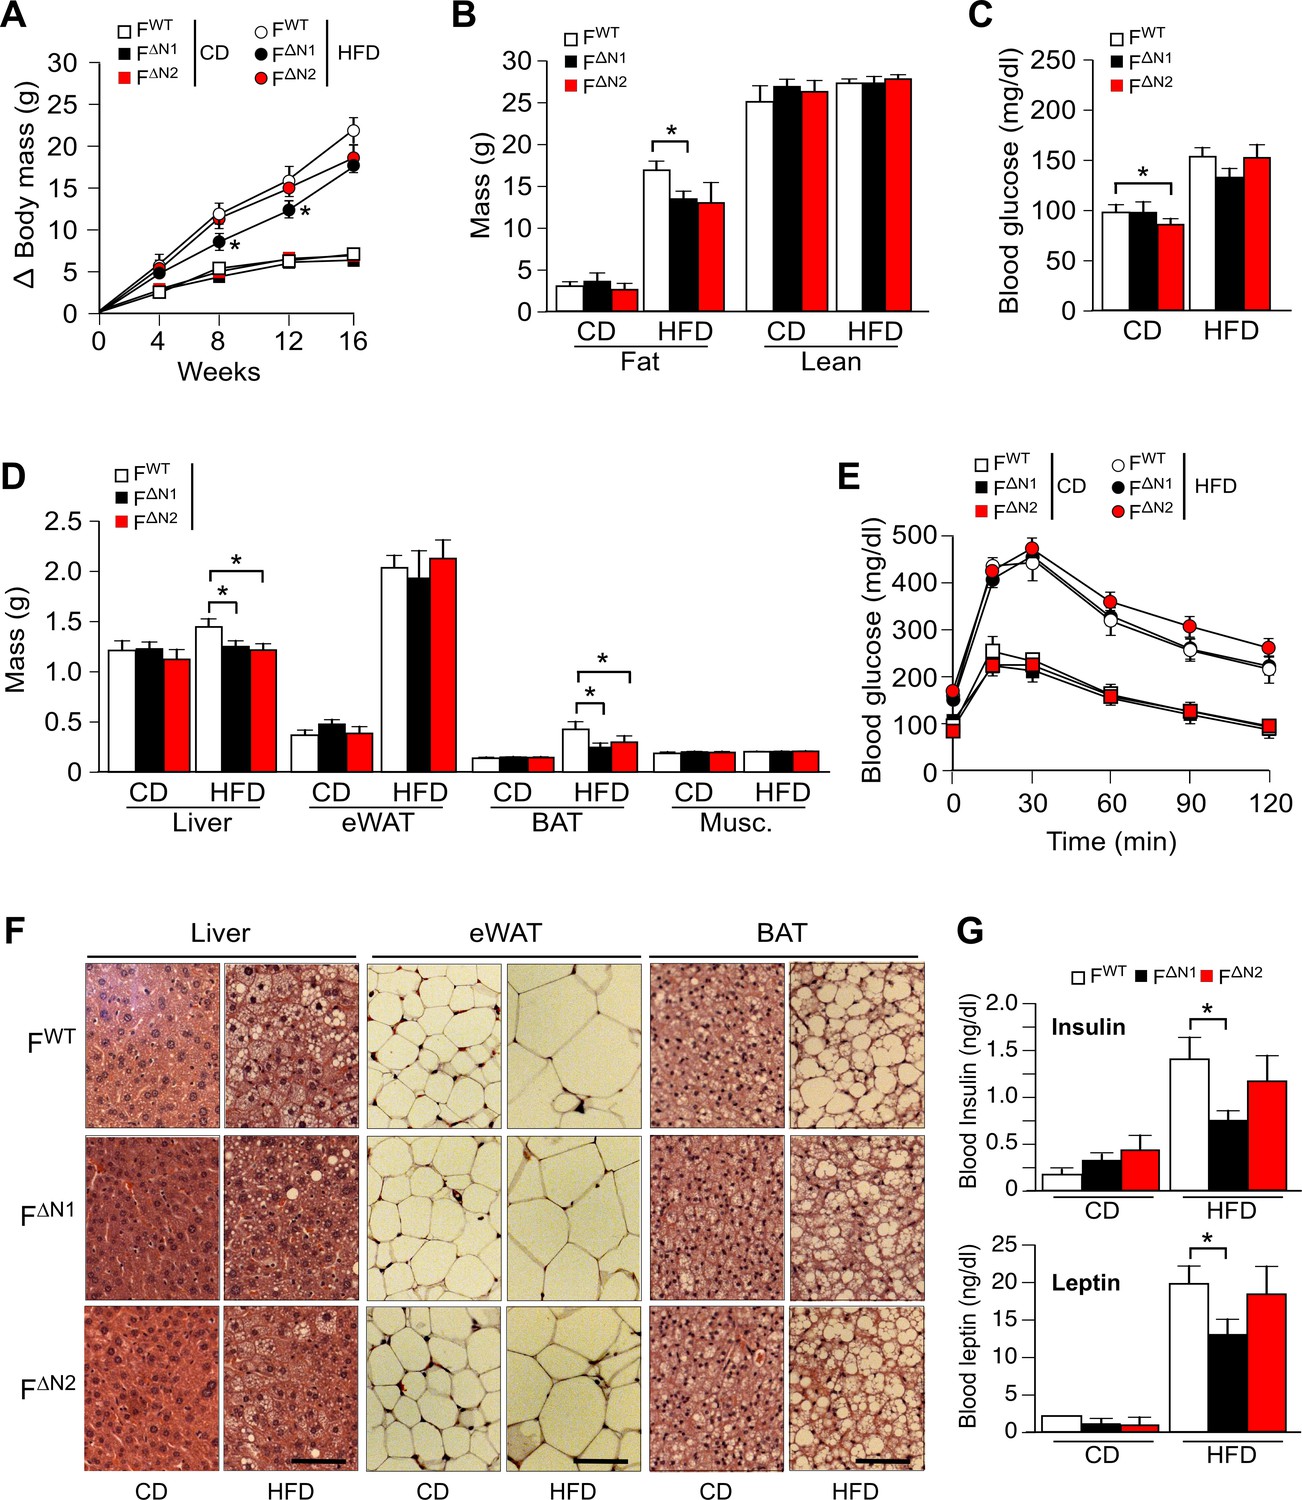
Effect of adipose tissue-specific ablation of the Nova1 or Nova2 genes.
(A) The change in body mass of FWT, F∆N1 and F∆N2 mice fed a CD or ais presented (mean ± SEM; n=8~21). (B) Body composition was examined by proton magnetic resonance spectroscopy (mean ± SEM; n=8~21). (C) Blood glucose concentration in overnight starved CD-fed and HFD-fed (16 wks) mice (mean ± SEM; n=8~21). (D) The mass of the liver, epididymal white adipose tissue (eWAT), interscapular brown adipose tissue (BAT), and gastrocnemius muscle (Musc.) of FWT and F∆N1,2 mice fed a CD or a(16 wk) is presented (mean ± SEM; n=8~21). (E) CD-fed and HFD-fed (16 wks) mice were examined by glucose tolerance tests (mean ± SEM; n=8~21). (F) Sections of the liver, eWAT, and BAT were stained with hematoxylin and eosin (n=6). Scale bar, 100 µm. (G) Blood insulin and leptin in overnight starved mice were measured (mean ± SEM; n=8~21). Statistically significant differences between Control and NOVA-deficient mice are indicated: *p<0.05.
Figure 4—figure supplement 4
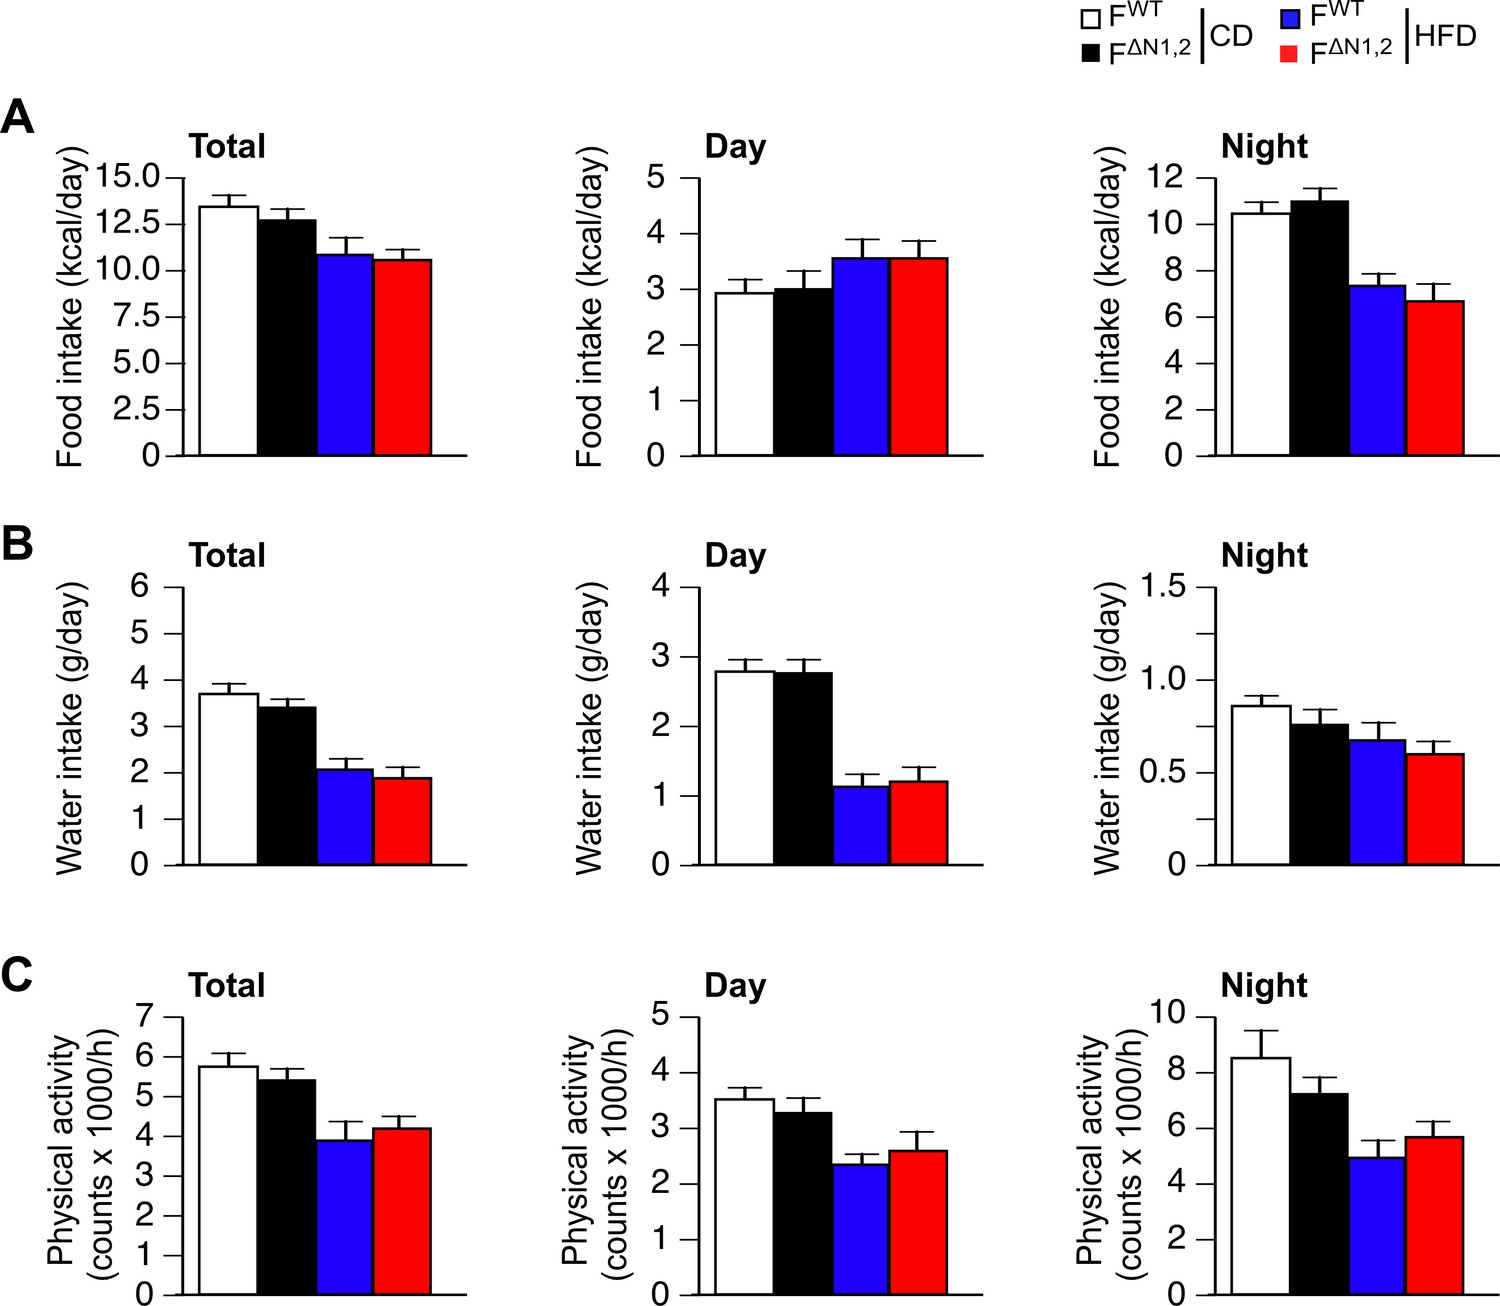
Metabolic cage analysis of physical activity and the consumption of food and water.
(A) Food consumption (B) water consumption, and (C) physical activity were measured using metabolic cages (3 days; 12 hr light and 12 hr dark) using FWT and F∆N1,2 mice fed a CD or a(4 wk). The data presented are the mean ± SEM (n=9 mice). No statistically significant differences between FWT and F∆N1,2 mice were detected (p>0.05). The source data are included as Figure 4—figure supplement 4—source data 1.
-
Figure 4—figure supplement 4—source data 1
Source data for Figure 4—figure supplement 4.
- https://doi.org/10.7554/eLife.17672.030
Figure 4—figure supplement 5
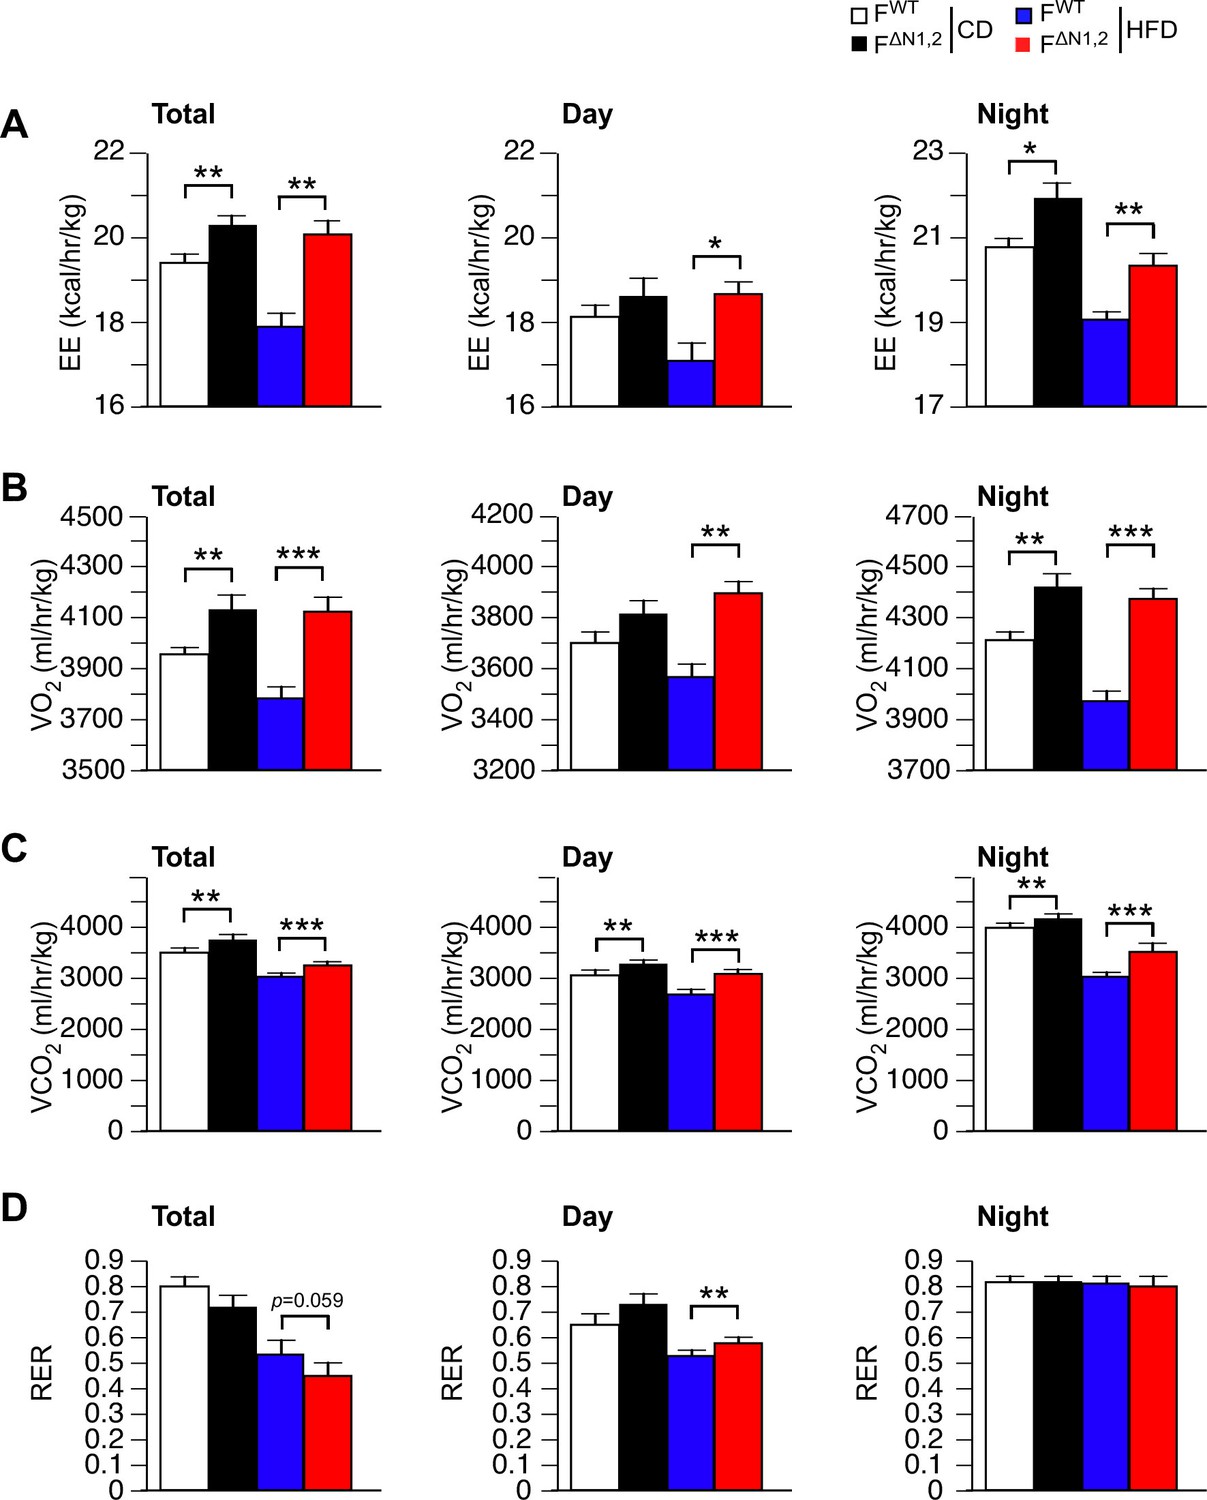
Metabolic cage analysis of gas exchange and energy expenditure.
(A) Energy expenditure (EE), (B) VO2, (C) VCO2, and (D) respiratory exchange ratio (RER) were measured using metabolic cages (3 days; 12 hr light and 12 hr dark) using FWT and F∆N1,2 mice fed a CD or a(4 wk). The data presented are the mean ± SEM (n=7~9 mice). Statistically significant differences between FWT and F∆N1,2 mice are indicated: *p<0.05; **p<0.01; ***, 0.001. The source data are included as Figure 4—figure supplement 5—source data 1.
-
Figure 5—figure supplement 5—source data 1
Source data for Figure 4—figure supplement 5.
- https://doi.org/10.7554/eLife.17672.032
Figure 5 with 2 supplements
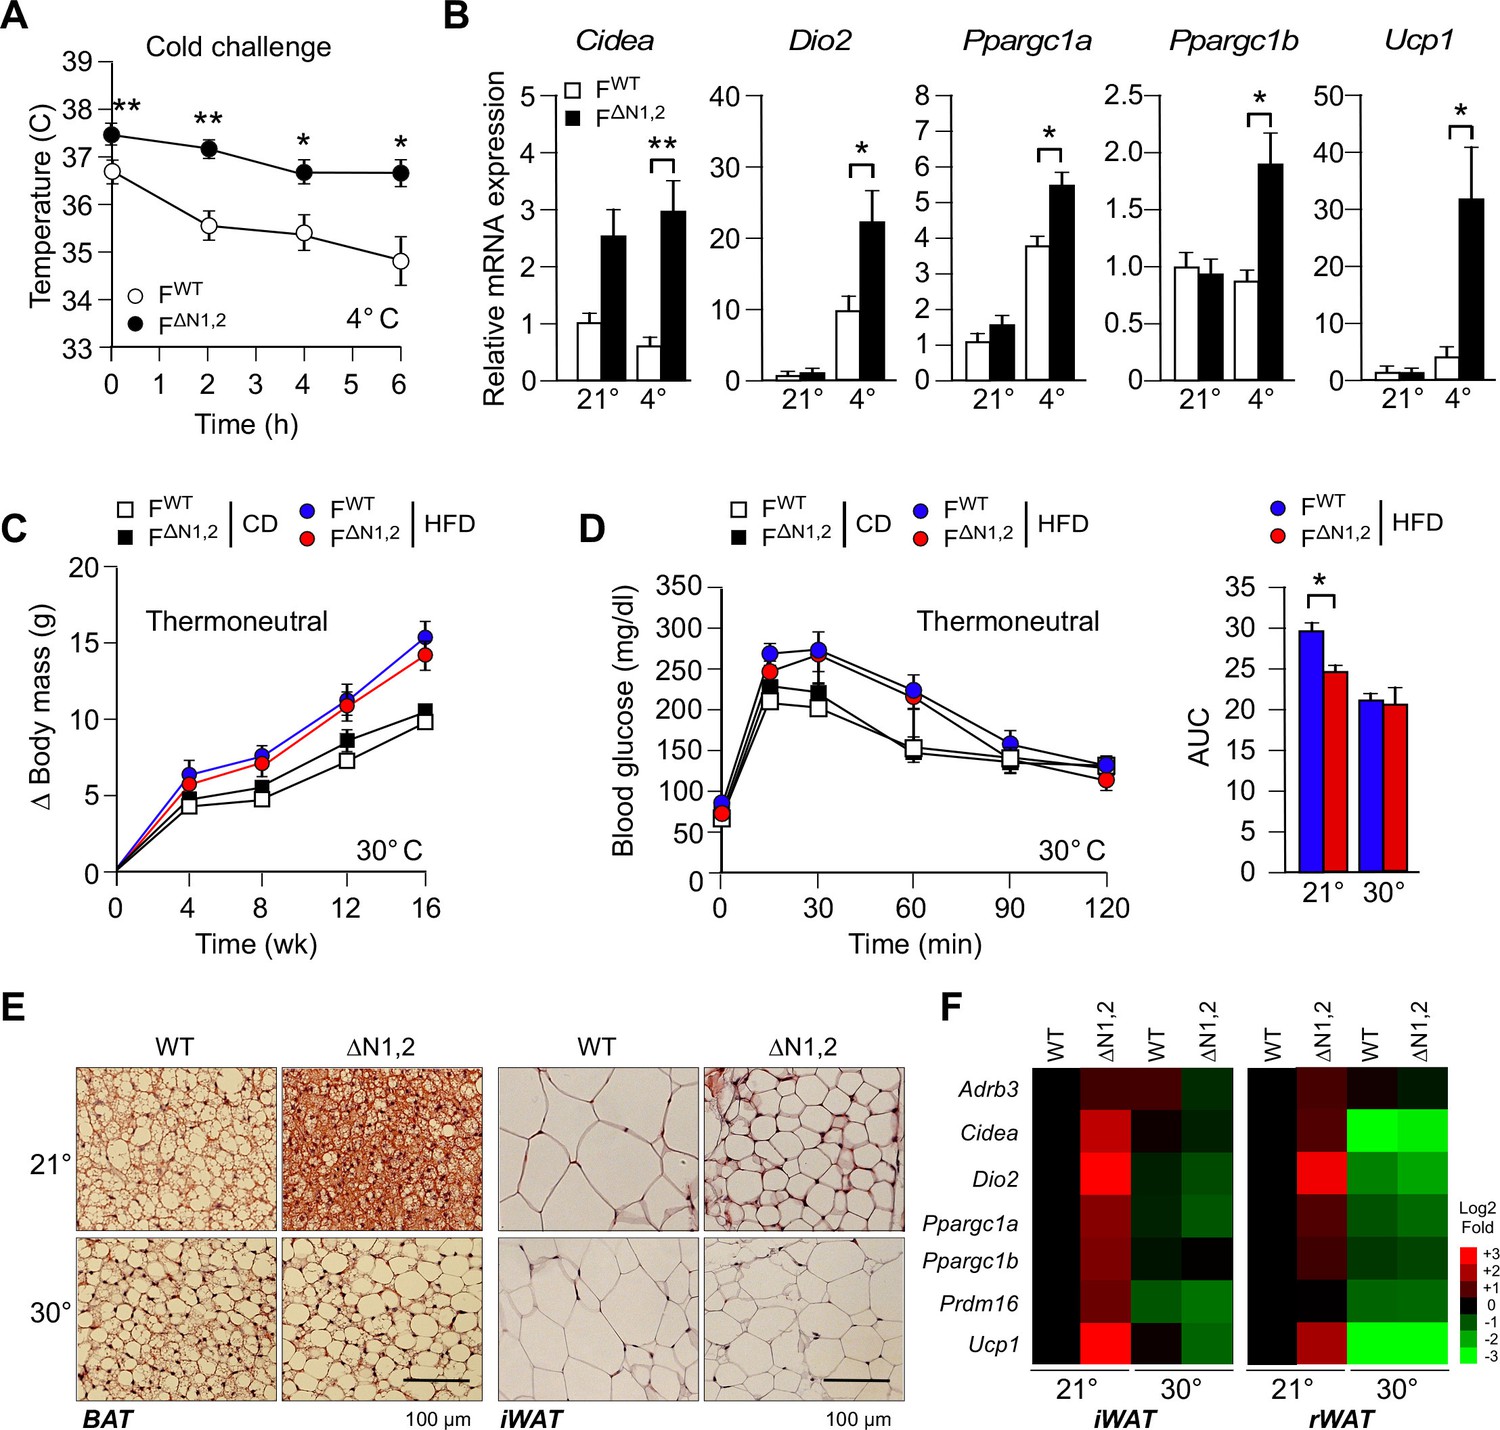
NOVA regulates a thermogenic program in adipose tissue.
(A) FWT and F∆N1,2 mice were subject to cold challenge (4°C). Core body temperature was measured by telemetry using an implanted probe (mean ± SEM; n=8; *p<0.05; **p<0.01). The source data are included as Figure 5—source data 1. (B) The effect of cold challenge (4°C, 6 hr) on gene expression by inguinal adipocytes (iWAT) of FWT and F∆N1,2 mice was examined by quantitative RT-PCR (mean ± SEM; n=6~8; *p<0.05; **p<0.01). The source data are included as Figure 5—source data 2. (C) FWT and F∆N1,2 mice were housed under thermal neutral conditions (30°C). The change in body mass of CD and HFD-fed mice is presented (mean ± SEM; n=7~18). (D) Glucose tolerance tests were performed on FWT and F∆N1,2 mice housed under thermoneutral conditions (30°C). The effect of feeding a CD or a HFD (16 wk) is presented (mean ± SEM; n=8). The source data are included as Figure 5—source data 3. (E) Sections of brown adipose tissue (BAT) and iWAT of HFD-fed (16 wk) mice housed at 21°C and 30°C were stained with hematoxylin & eosin. The data shown are representative of 6 mice per group. (F) FWT and F∆N1,2 mice housed at 21°C and 30°C were fed a HFD (16 wk). Gene expression by adipocytes of iWAT and retroperitoneal adipose tissue (rWAT) was examined by quantitative RT-PCR (mean, n=8). The data are presented as a heat map.
-
Figure 5—source data 1
Source data for Figure 5A.
- https://doi.org/10.7554/eLife.17672.034
-
Figure 5—source data 2
Source data for Figure 5B.
- https://doi.org/10.7554/eLife.17672.035
-
Figure 5—source data 3
Source data for Figure 5D.
- https://doi.org/10.7554/eLife.17672.036
Figure 5—figure supplement 1
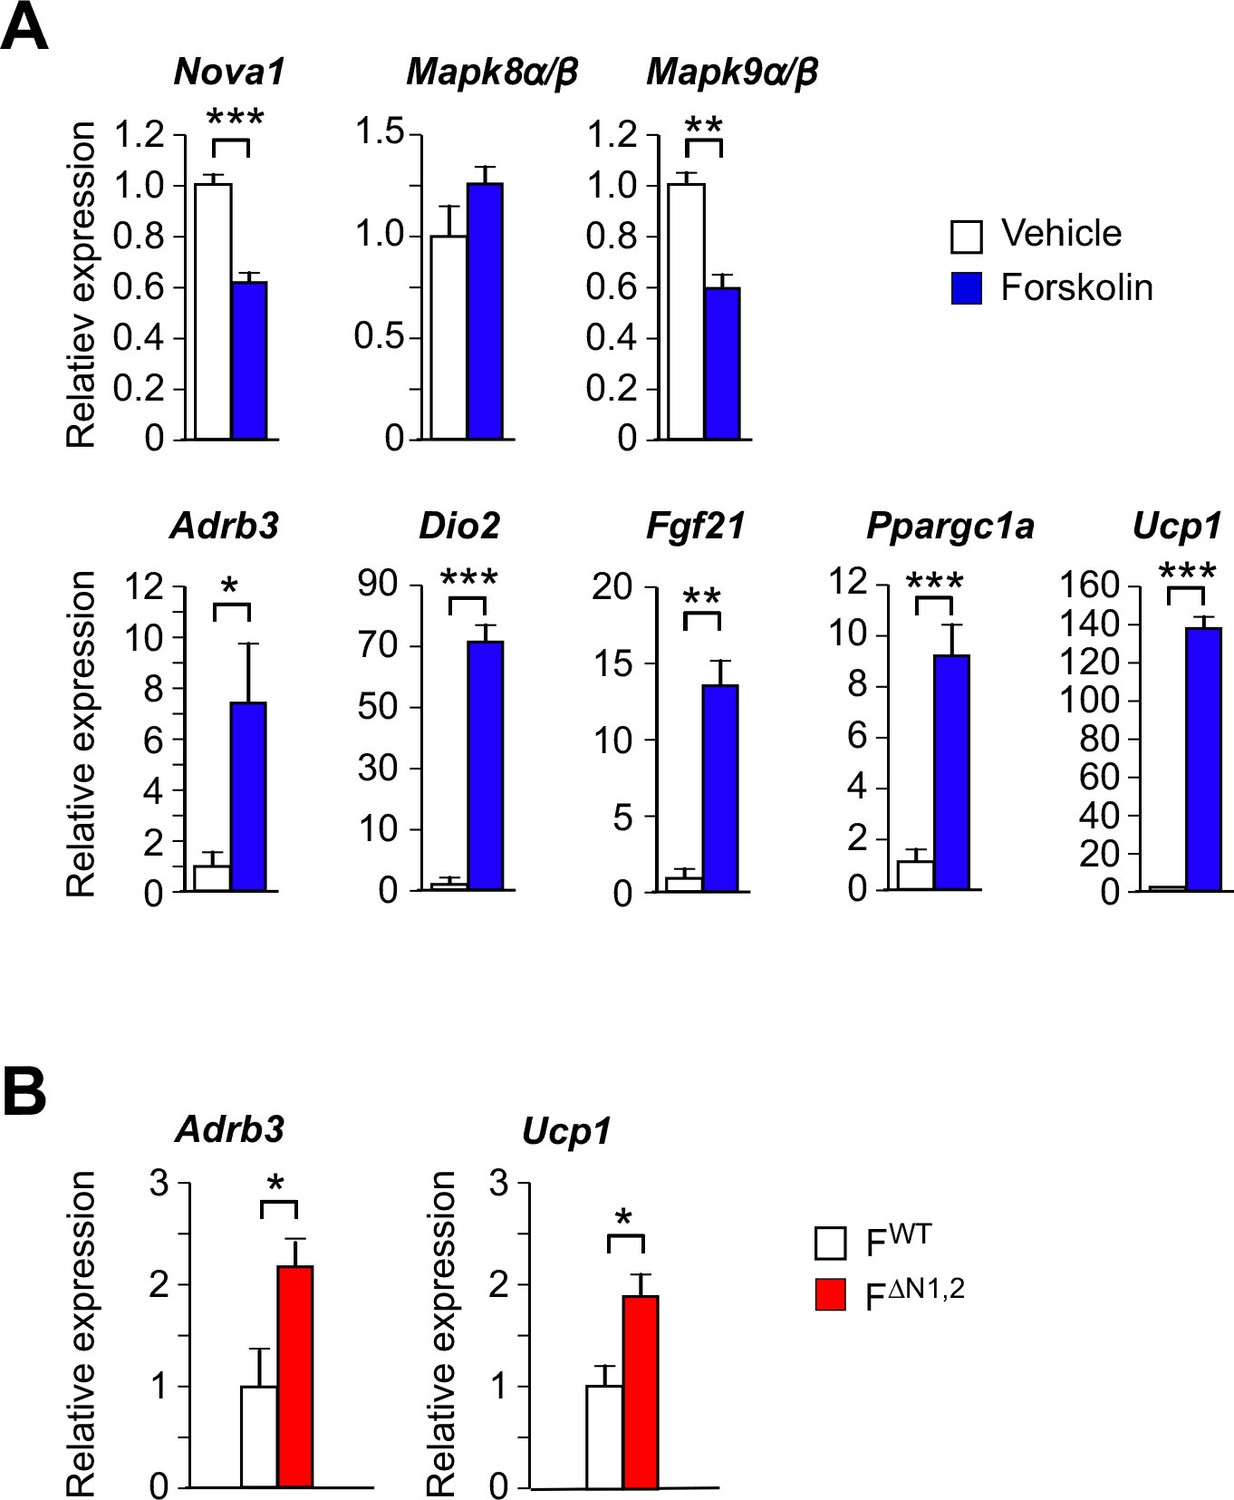
Thermogenic gene expression by primary adipocytes.
(A) Primary pre-adipocytes were treated with 10 µM forskolin (4 hr). Gene expression was examined by measurement of mRNA by RT-PCR (mean ± SEM; n=6). Statistically significant differences between Control and Forskolin-treated adipocytes are indicated: *p<0.05; **p<0.01; ***, 0.001. (B) Primary adipocytes were cultured from FWT and F∆N1,2 mice and treated with forskolin (4 hr). Gene expression was examined by measurement of mRNA by RT-PCR (mean ± SEM; n=6). Statistically significant differences between FWT and F∆N1,2 adipocytes are indicated: *p<0.05.
Figure 5—figure supplement 2
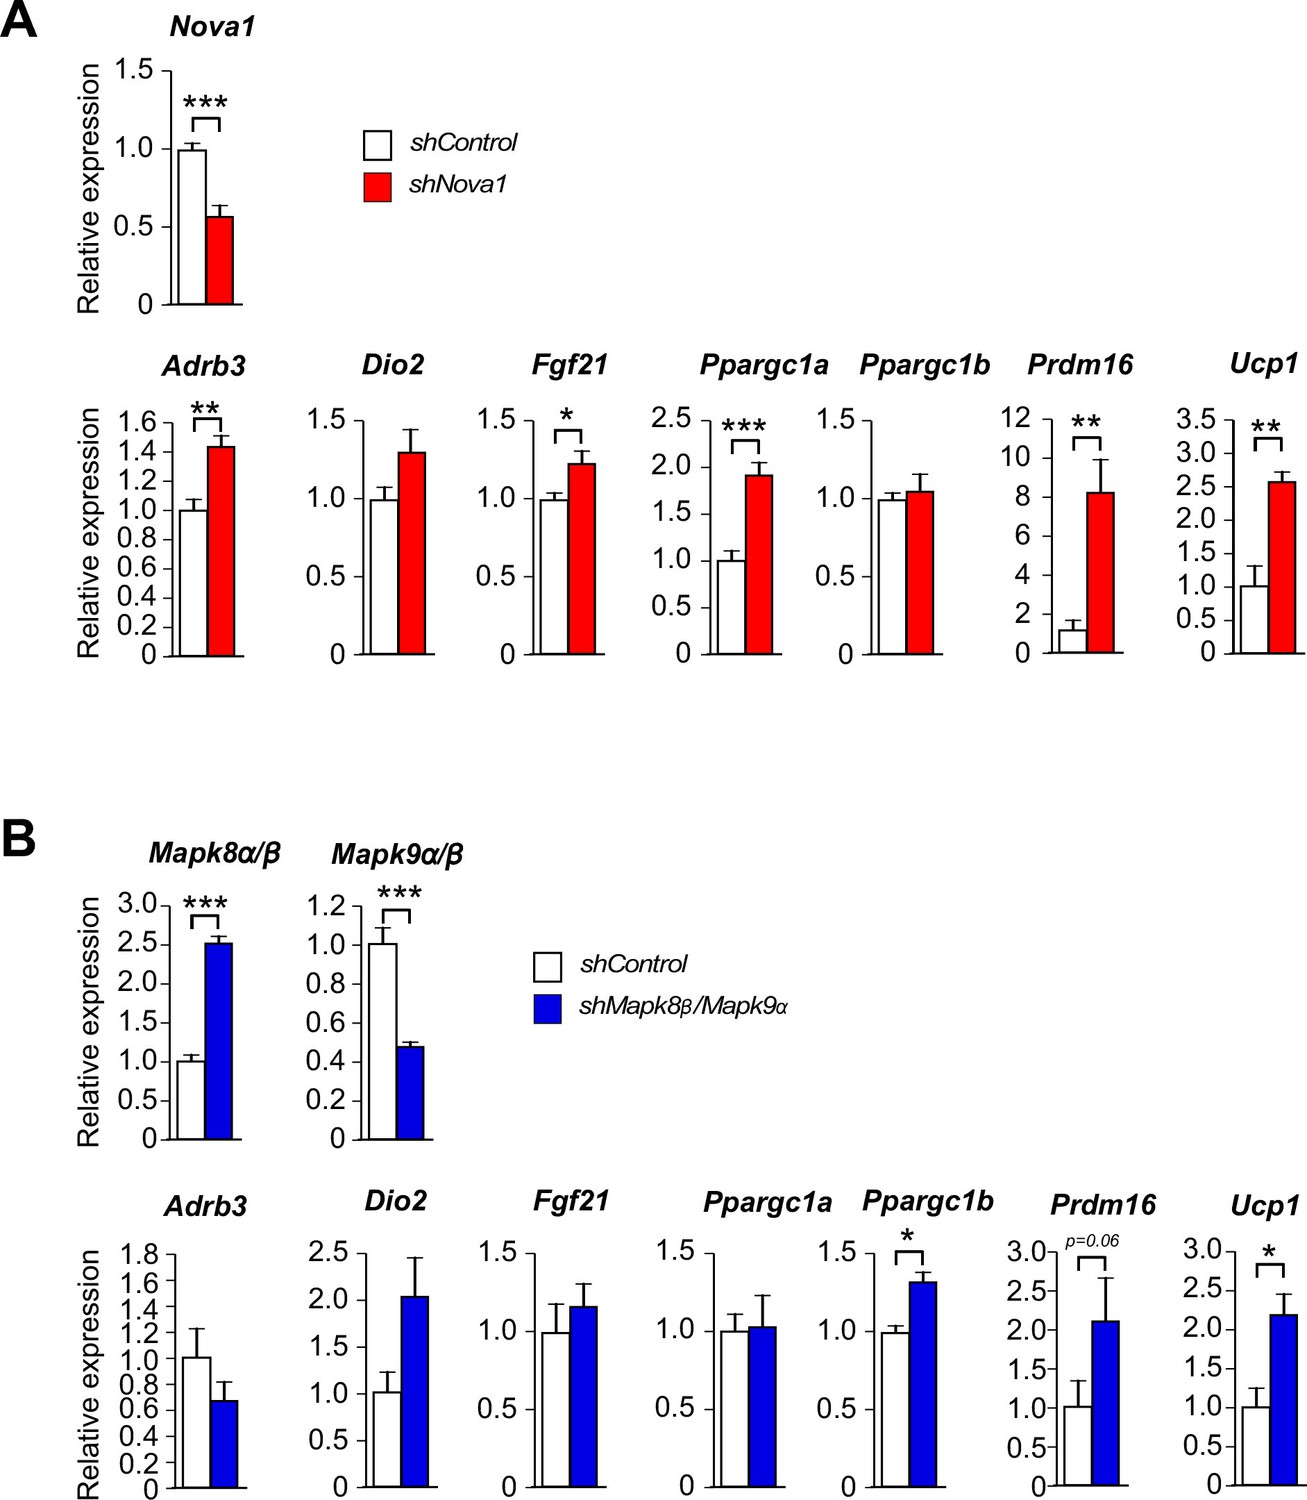
Thermogenic gene expression is increased by shRNA-mediated suppression of Nova1 or Mapk8β/Mapk9α.
(A) An shNova1 lentiviral vector was used to suppress Nova1 gene expression in 3T3 L1 adipocytes. Nova2 expression was not detected in these cells. Gene expression was examined by measurement of mRNA by RT-PCR (mean ± SEM; n=6). (B) Lentiviral vectors expressing shMapk8β and shMapk9α were used to suppress Mapk8β and Mapk9α mRNA expression in 3T3 L1 adipocytes. Gene expression was examined by measurement of mRNA by RT-PCR (mean ± SEM; n=6). Statistically significant differences between Control and shRNA knock-down adipocytes are indicated: *p<0.05; **p<0.01; ***p<0.001.
Tables
Table 1
Summary of RNA-seq data.
| GEO Accession Subseries/ Superseries | Biological groups | Sample number | Platform | Mean read number / sample (after trimming, if applicable) | Read length (after trimming, if applicable) | Mean read alignment rate |
|---|---|---|---|---|---|---|
| GSE76294/ GSE76134 | FWT (3) F∆N1 (3) F∆N2 (3) | 9 | Illumina HiSeq 2000/ 2 x 100 bp | 135,500,000 | 100 bp | 89.4% |
| GSE76133/ GSE76134 | CD (3) HFD (3) | 6 | Illumina NextSeq 500/ 2 x 150 bp | 406,200,000 | 90 bp | 74.9% |
| GSE76317/ GSE76134 | FWT (4) F∆N1,2 (4) | 8 | Illumina NextSeq 500/ 2 x 150 bp | 319,700,000 | 130 bp | 92.5% |
Additional files
-
Source code 1
Custom Perl Script 1.
- https://doi.org/10.7554/eLife.17672.039
-
Source code 2
Custom Perl Script 2.
- https://doi.org/10.7554/eLife.17672.040
Download links
A two-part list of links to download the article, or parts of the article, in various formats.
Downloads (link to download the article as PDF)
Open citations (links to open the citations from this article in various online reference manager services)
Cite this article (links to download the citations from this article in formats compatible with various reference manager tools)
An alternative splicing program promotes adipose tissue thermogenesis
eLife 5:e17672.
https://doi.org/10.7554/eLife.17672


