Patched1 and Patched2 inhibit Smoothened non-cell autonomously
- University of California, Berkeley, United States
Figures
Figure 1 with 1 supplement
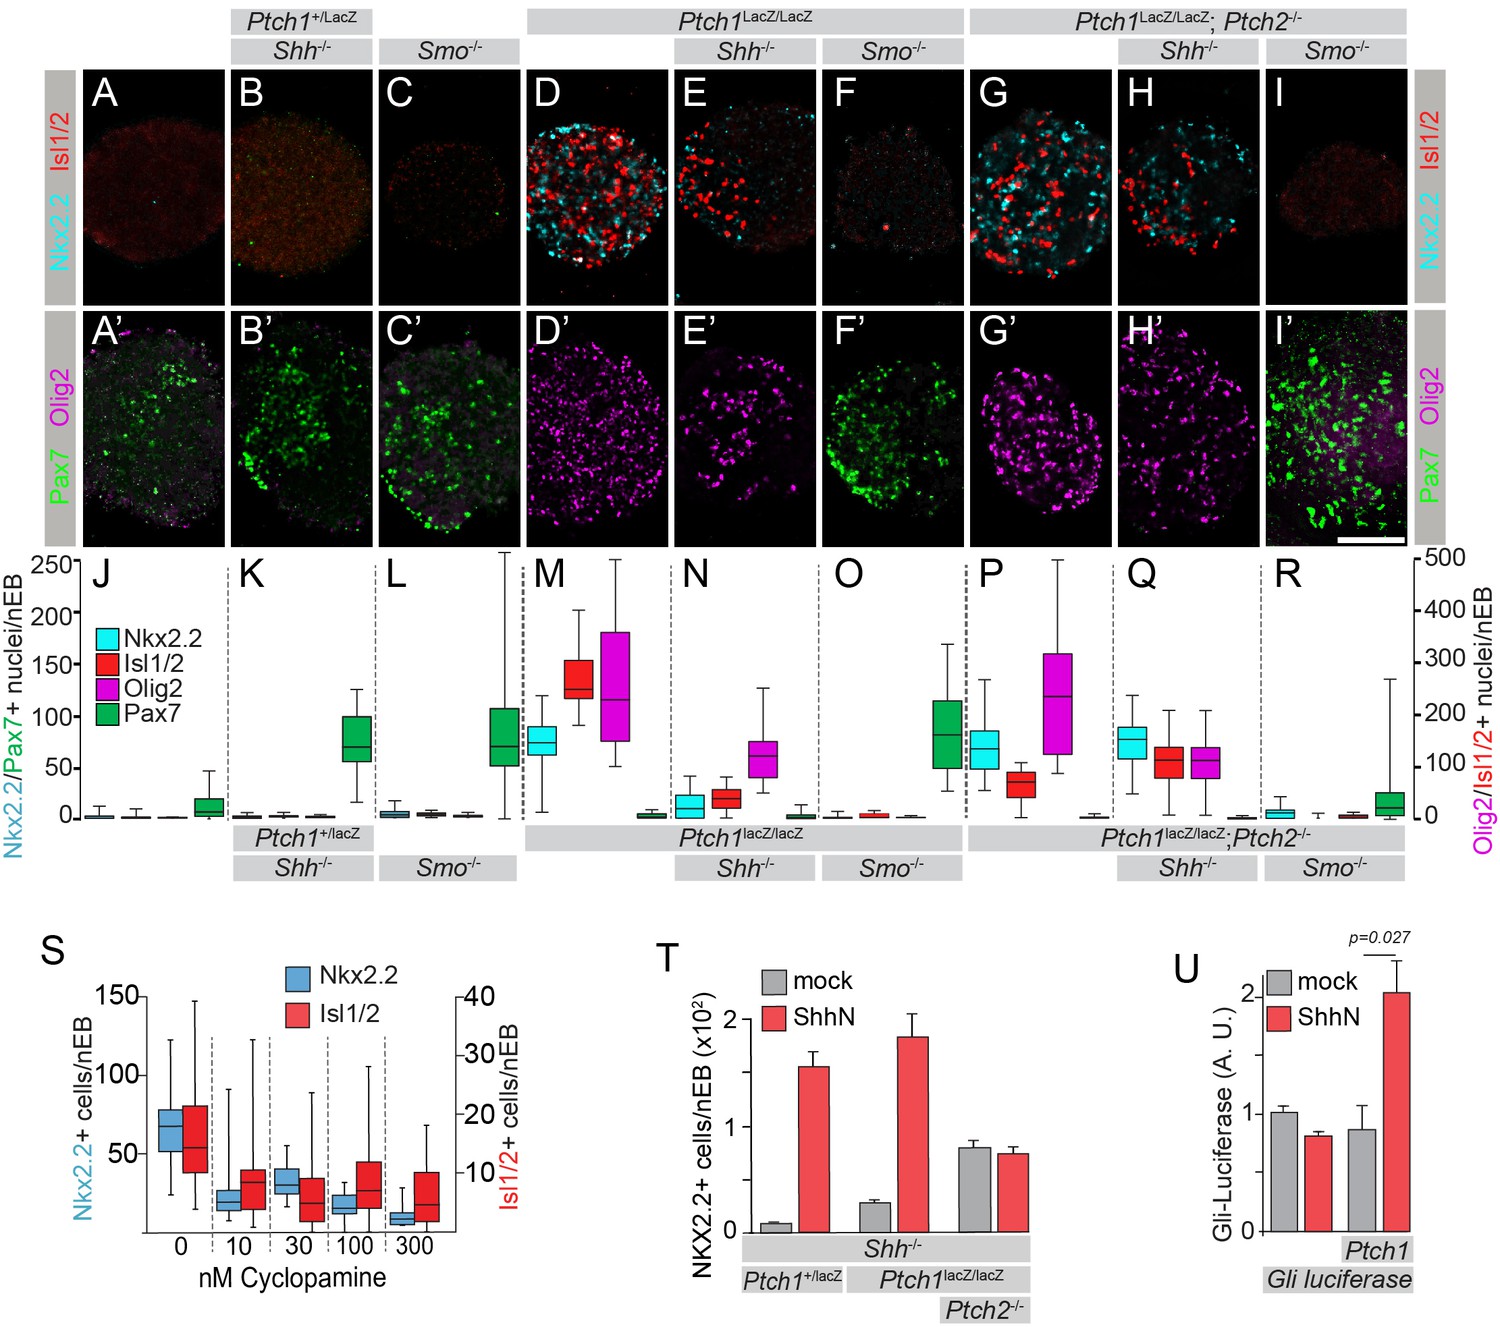
Ptch1/2 disruption enhances Smo-dependent activation of the Hh response.
(A–I’) Genome-edited mESCs with various genotypes were differentiated into nEBs and stained for ventral markers Nkx2.2 (Cyan), Olig2 (Magenta) and Isl1/2 (Red), indicating Hh pathway activation, and the dorsal marker Pax7 (Green) indicating Hh pathway inactivity. (J–R) Nkx2.2, Isl1/2, Olig2 or Pax7 staining quantification (box and whiskers). WTnEBs have a quiescent Hh response (A,A’,J). Loss of Shh (Ptch1+/L (B,B’,K) or Smo (Smo-/-) (C,C’,L) in cells with intact Ptch1/2 function (Ptch1LacZ is null) increases Pax7. nEBs without Ptch1 (Ptch1LacZ/LacZ, D,D’,M) have an activated Hh response. Loss of Shh (Ptch1LacZ/LacZ;Shh-/-, E,E’,N) decreases the response. Ptch1LacZ/LacZ;Smo-/- nEBs acquire Pax7 (F,F’,O) and are devoid of all three ventral markers. nEBs lacking all Ptch1/2 activity (Ptch1LacZ/LacZ;Ptch2-/-) have an activated Hh response pathway (G,G’,P). Ptch1LacZ/LacZ;Ptch2-/-;Shh-/- nEBs retain similar ventral identity (H,H’,Q). Ptch1LacZ/LacZ;Ptch2-/-;Smo-/- nEBs lose ventral identity and express Pax7 (I,I’,R). Scale bar is 100 µm. (S) Nkx2.2 and Isl1/2 expression in Ptch1LacZ/LacZ;Ptch2-/- nEBs is quantified (box and whisker) in the presence of 0–300 nM cyclopamine. (T) Ptch1+/LacZ;Shh-/- and Ptch1LacZ/LacZ;Shh-/-, but not Ptch1LacZ/LacZ;Ptch2-/-;Shh-/- retain their ability to respond to exogenously supplied ShhN by inducing Nkx2.2 expression. (U) Fibroblast-like cells derived from Ptch1LacZ/LacZ;Ptch2-/- mESCs were transfected with a Gli:luciferase construct alone or together with Ptch1. Independently, Ptch1LacZ/LacZ;Ptch2-/- cells were mock transfected or transfected with ShhN. Gli:Luciferase is quantified in co-cultures. Ptch1LacZ/LacZ;Ptch2-/- cells expressing Ptch1 can respond to ShhN supplied in co-cultured cells. p-value is indicated, n = 6. Variance is s.e.m. in A–U.
Figure 1—figure supplement 1
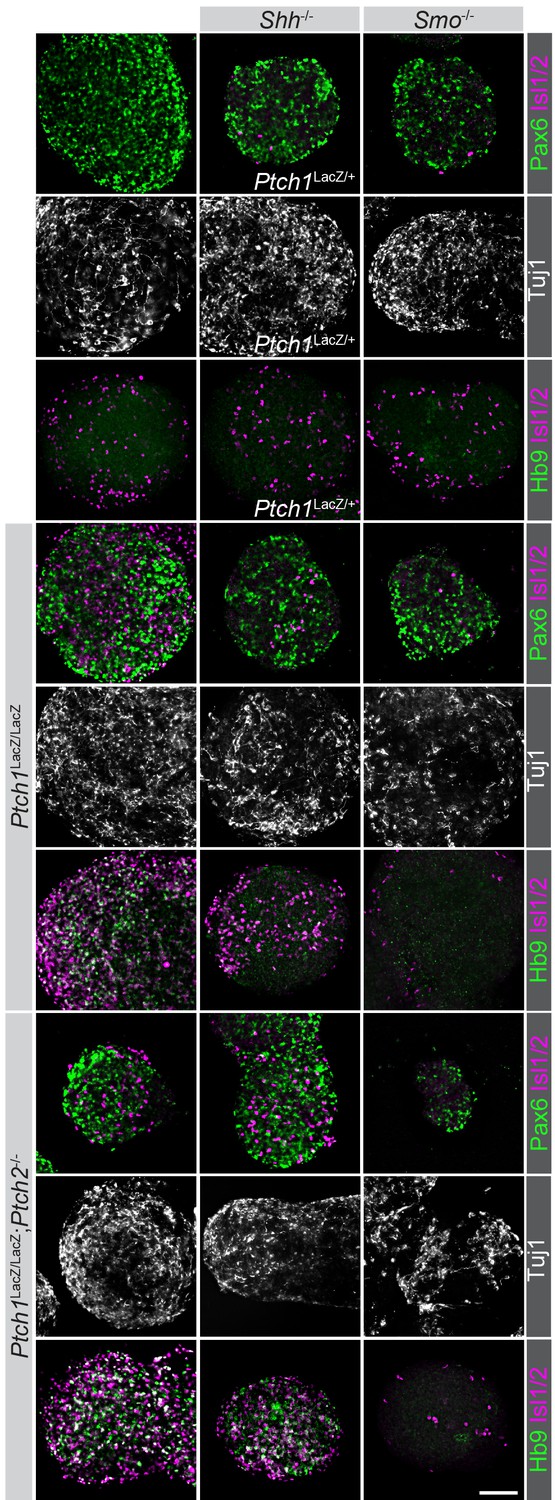
Neural differentiation proceeds normally in all modified cell lines.
Cell lines used were stained for Pax6, HB9, Isl1/2 and Tuj1 expression after in vitro neuralization. Although not all nEBs were equally sized, invariably they express Pax6 and Tuj1, indicating the acquisition of neural progenitor fates, regardless of their genotype (indicated). Scale bar is 100 µm. One biological replicate performed.
Figure 2 with 1 supplement
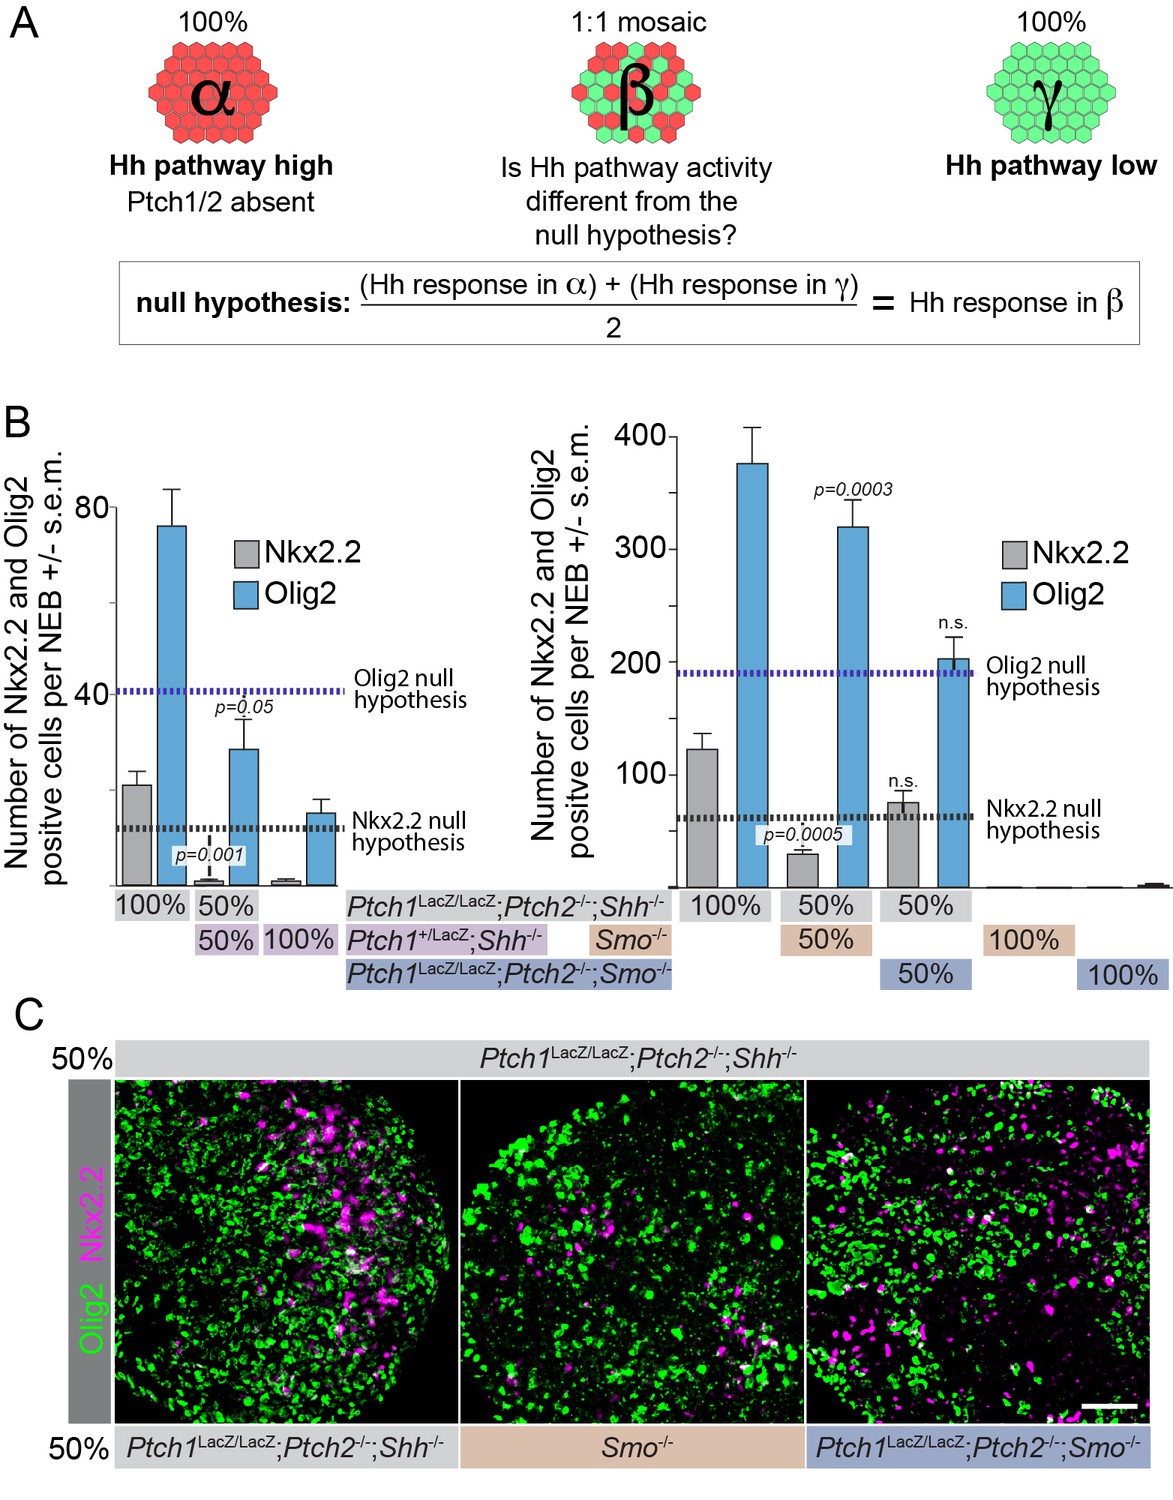
The Hh response in cells lacking Ptch1/2 can be inhibited non-cell autonomously by Ptch1/2 competent cells.
(A) Diagram showing the experimental approach. Rejection of the null hypothesis provides evidence for non-cell autonomous activity of Ptch1/2. (B) Mosaic nEBs consisting 1:1 of Ptch1+/LacZ;Shh-/- and Ptch1LacZ/LacZ;Ptch2-/-;Shh-/- cells have fewer Nkx2.2+ and Olig2+ cells than predicted based on unmixed Ptch1+/LacZ;Shh-/- and Ptch1LacZ/LacZ;Ptch2-/-;Shh-/- nEBs (null hypothesis values, dotted lines). (C) Representative images of B, Scale bar is 50 µm. Two biological replicates were performed in B.
Figure 2—figure supplement 1
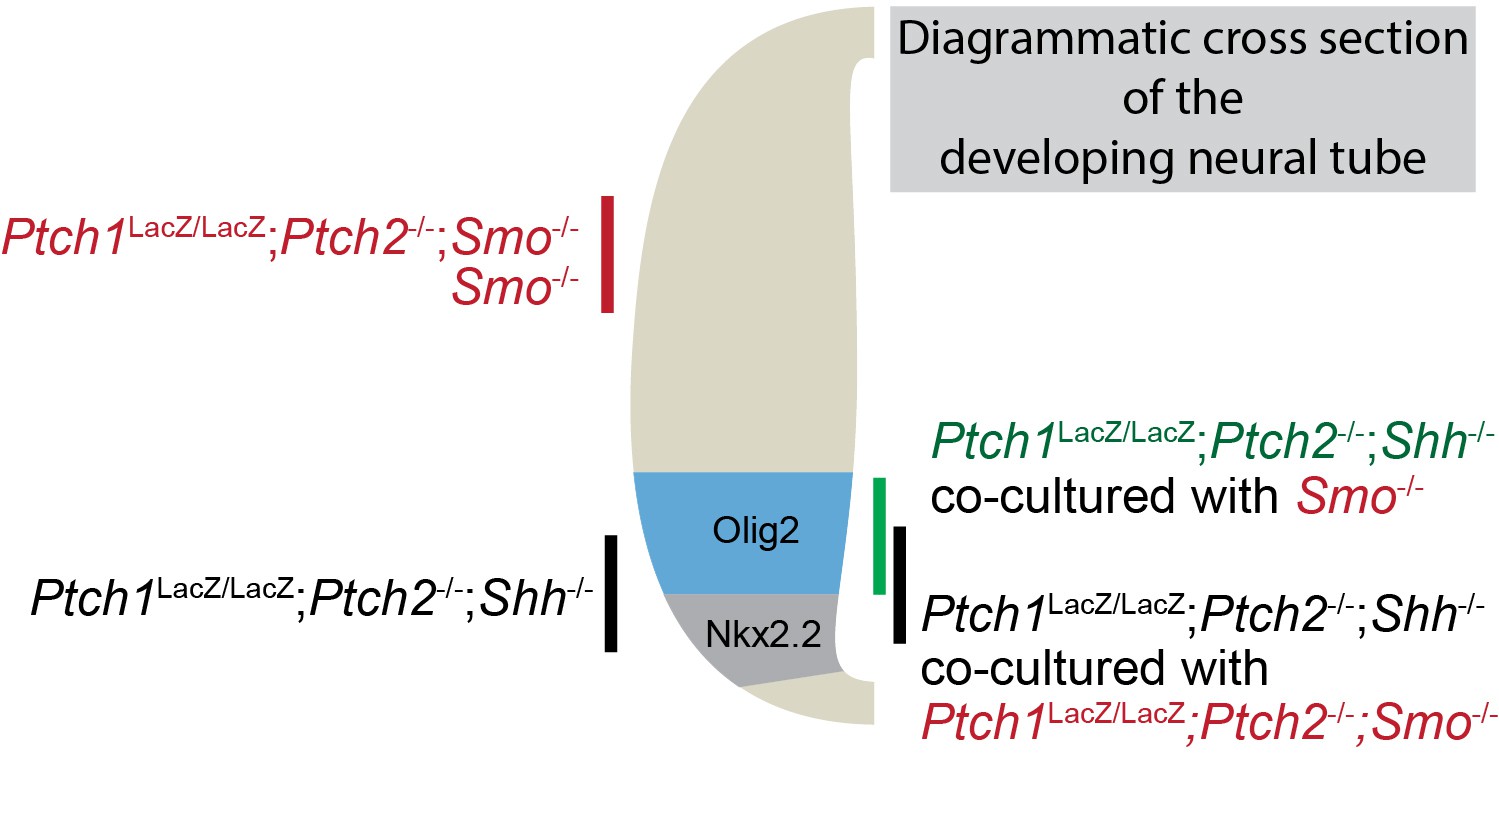
Acquisition of a more dorsal identity in Ptch1LacZ/LacZ;Ptch2-/-;Shh-/- cells results in an increase in Olig2+ cells at the expense of Nkx2.2+ cells.
nEBs cultured with equal contributions of Ptch1LacZ/LacZ;Ptch2-/-;Shh-/- cells and either Smo-/- or Ptch1LacZ/LacZ;Ptch2-/-;Smo-/- cells were quantified for the number of Nkx2.2+ and Olig2+ cells. Cells lacking Smo never have an upregulated Shh response, confining Nkx2.2+ and Olig2+ staining to Ptch1LacZ/LacZ;Ptch2-/-;Shh-/- cells. Smo-/- cells with intact Ptch1/2 cause a loss in the predicted number of Nkx2.2+ cells, and an increase in Olig2+ cells, indicating a less ventral identity in the Ptch1LacZ/LacZ;Ptch2-/-;Shh-/- cells as a consequence of Ptch1/2 activity in the surrounding cells. Diagram depicts how a subtle dorsalization in the identity of Ptch1LacZ/LacZ;Ptch2-/-;Shh-/- cells can increase Olig2 expression while decreasing Nkx2.2 expression.
Figure 3
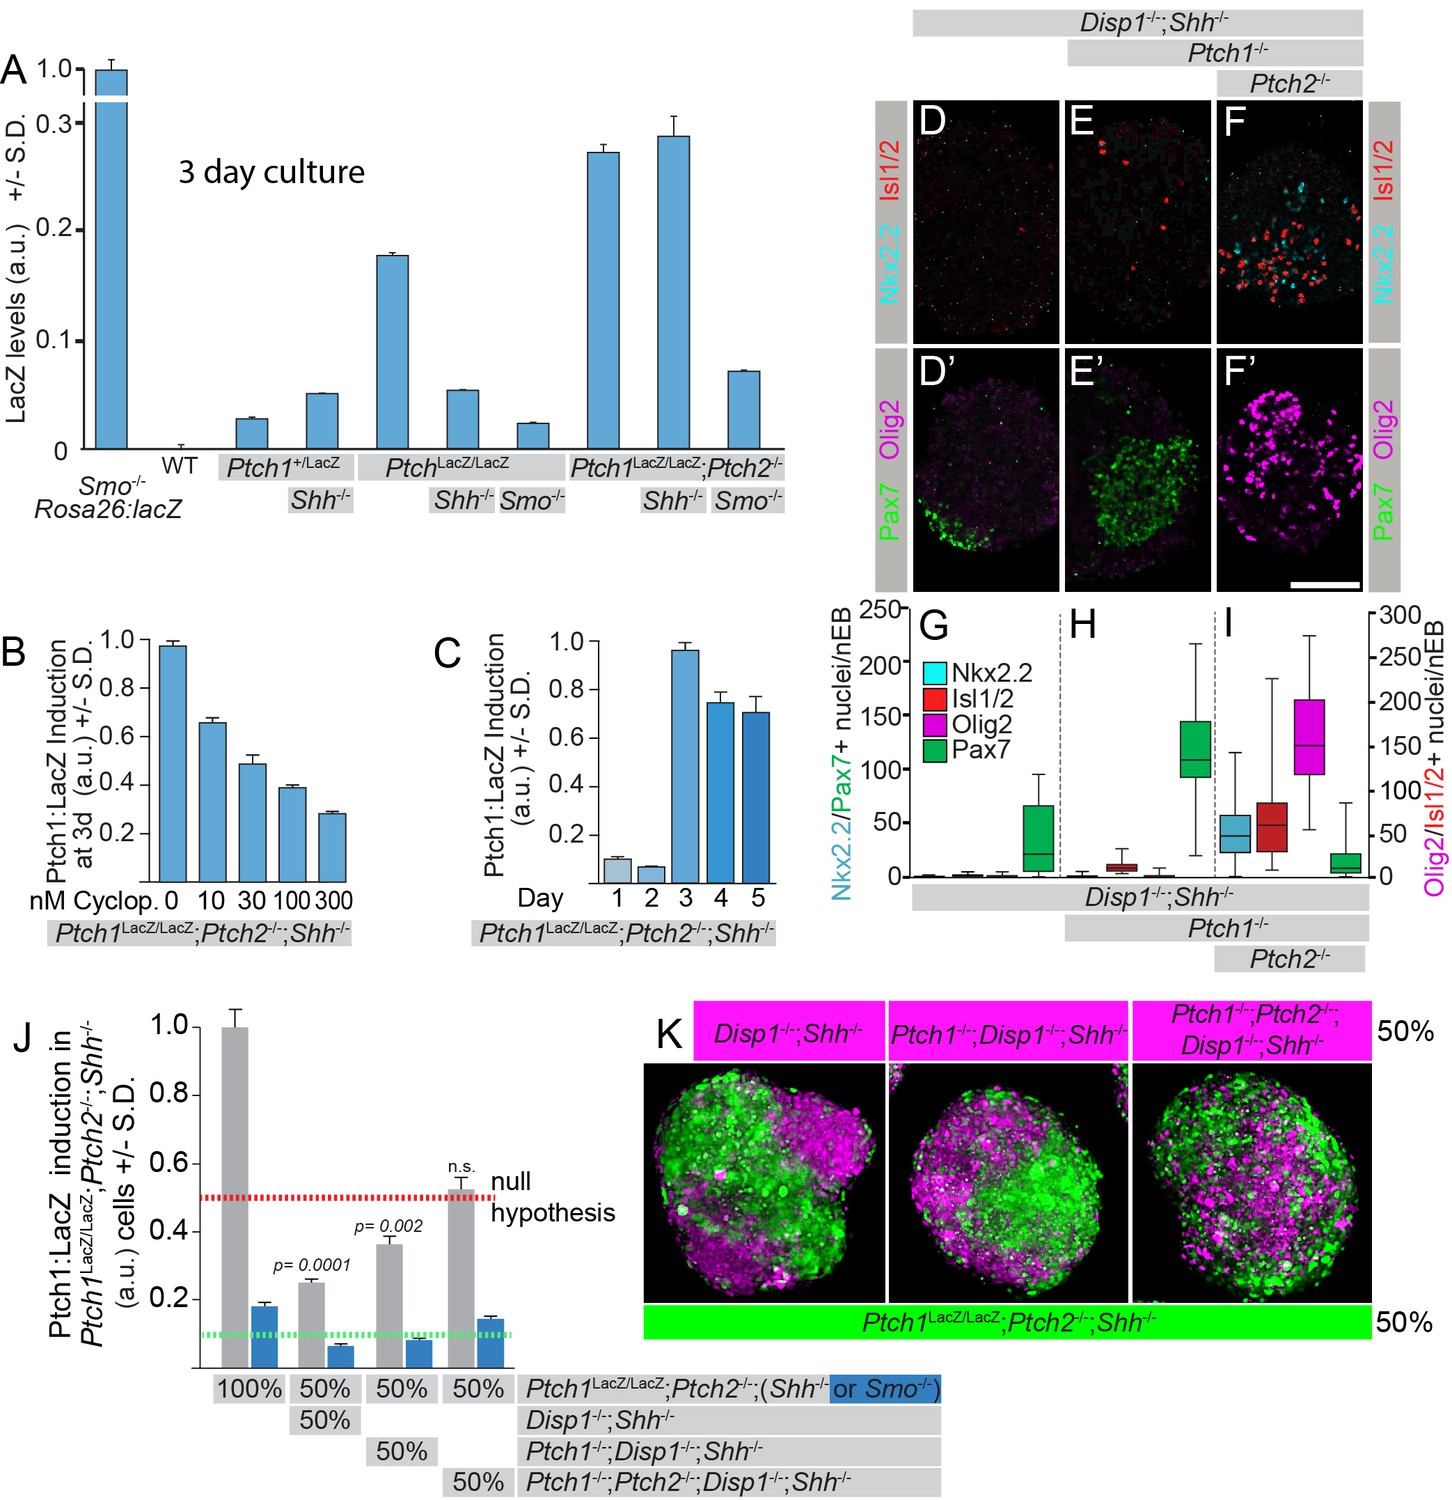
Ptch1/2 inhibit Ptch1:LacZ expression both cell autonomously and non-cell autonomously.
(A) Ptch1:LacZ is a lineage-restricted measure of Ptch1 expression, and thus Hh pathway activity. Ptch1:LacZ is activated by sequential loss of Ptch1/2, and this activation requires Smo activity. Genetic loss of Shh reduces the level of Hh pathway activation in Ptch1LacZ/LacZ, but not in Ptch1LacZ/LacZ;Ptch2-/- cells (B) Ptch1LacZ/LacZ;Ptch2-/-;Shh-/- nEBs were cultured in 0–300 nM cyclopamine and Ptch1:LacZ was measured at 72 hr. Ptch1:LacZ levels in 30 nM cyclopamine were approximately half those of untreated nEBs. (C) Ptch1:LacZ levels were measured up to 5 days after nEB formation. (D–I) Additional loss of Disp1 does not alter the consequences of the loss of Ptch1/2 activity on neural progenitor identity. (J) Ptch1:LacZ expression in mosaic nEBs consisting of 50% Ptch1LacZ/LacZ;Ptch2-/-;Shh-/- cells and 50% Disp1-/-;Shh-/-, Disp1-/-;Shh-/-;Ptch1-/-, or Disp1-/-;Shh-/-;Ptch1-/-;Ptch2-/- cells (indicated). Ptch1:LacZ levels in the Ptch1LacZ/LacZ;Ptch2-/-;Shh-/- cells were assessed after 72 hr in culture. LacZ levels were compared to half (red dotted line, signifying the null hypothesis) the LacZ activity measured in nEBs comprised of 100% Ptch1LacZ/LacZ;Ptch2-/-;Shh-/- cells. Error bars are s.d., p-values are indicated (t-test, n = 3 measurements) and relate to comparison of each value with the null hypothesis. Ptch1LacZ/LacZ;Ptch2-/-;Smo-/- cells have a low Ptch1:LacZ activity in this assay regardless of the genotype of the surrounding cells. (K) Ptch1LacZ/LacZ;Ptch2-/-;Shh-/- mESCs were loaded with green fluorescent cell tracker dye, and the Disp1-/-;Shh-/-, Disp1-/-;Shh-/-;Ptch1-/-, and Disp1-/-;Shh-/-;Ptch1-/-;Ptch2-/- mESCs with blue fluorescent dye (magenta). Mosaic nEBs as described in A were cultured for 48 hr, and imaged. 1:1 contribution reflecting the initial mosaic contributions is maintained throughout the experiment. p values are indicated (t-test). D–I are box-and-whisker plots.
Figure 4
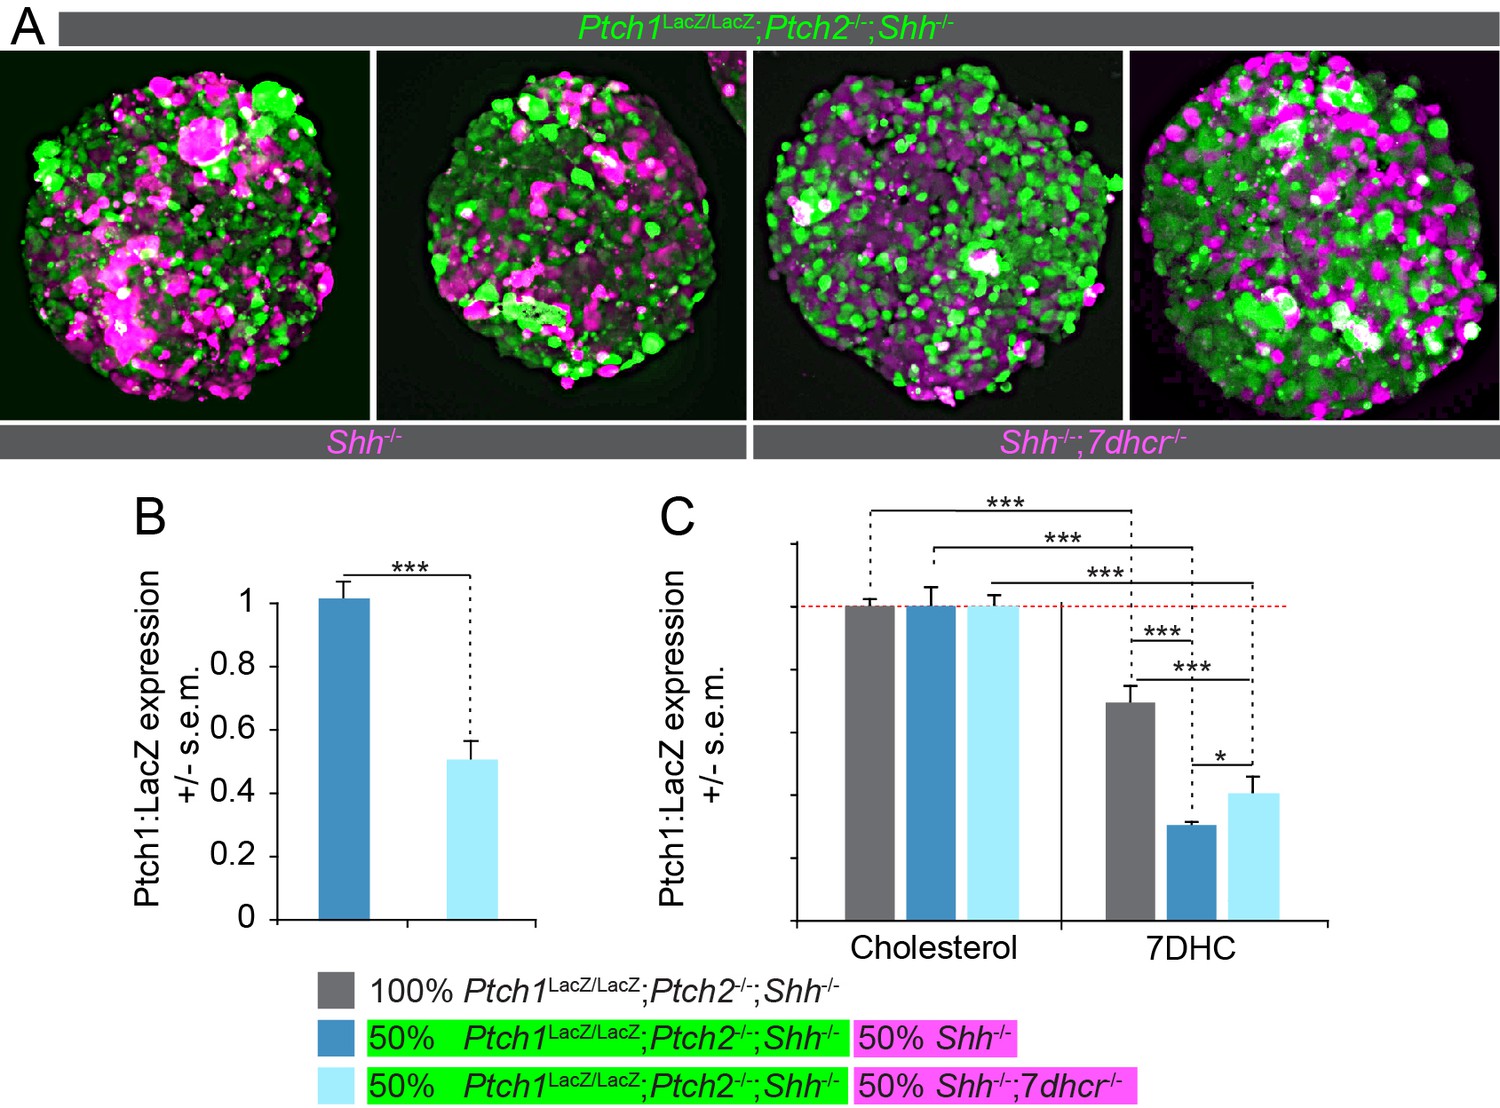
Loss of 7dhcr enhances non-cell autonomous suppression of the Hh response.
(A) nEBs consisting of 50% Ptch1LacZ/LacZ;Ptch2-/-;Shh-/- cells (green) and 50% Shh-/- cells or 50% Shh-/-; 7dhcr -/- cells (magenta) were labeled with cell tracking vital dyes. (B) LacZ quantification in nEBs described in (A). 7dhcr ablation enhances non-cell autonomous inhibition of the Hh response in Ptch1LacZ/LacZ;Ptch2-/-;Shh-/- cells. (C) The Hh response in Ptch1LacZ/LacZ;Ptch2-/-;Shh-/- cells is inhibited by 7-Dehydrocholesterol (7DHC) as compared to cholesterol. The ability of 7DHC to inhibit the Hh response in Ptch1LacZ/LacZ;Ptch2-/-;Shh-/- cells is exacerbated by the inclusion of Shh-/- cells, and to a lesser extent by Shh-/-;7dhcr-/- cells. n > 8, *p<0.05, ***p<0.001, n.s., not significant (t-test).
Figure 5
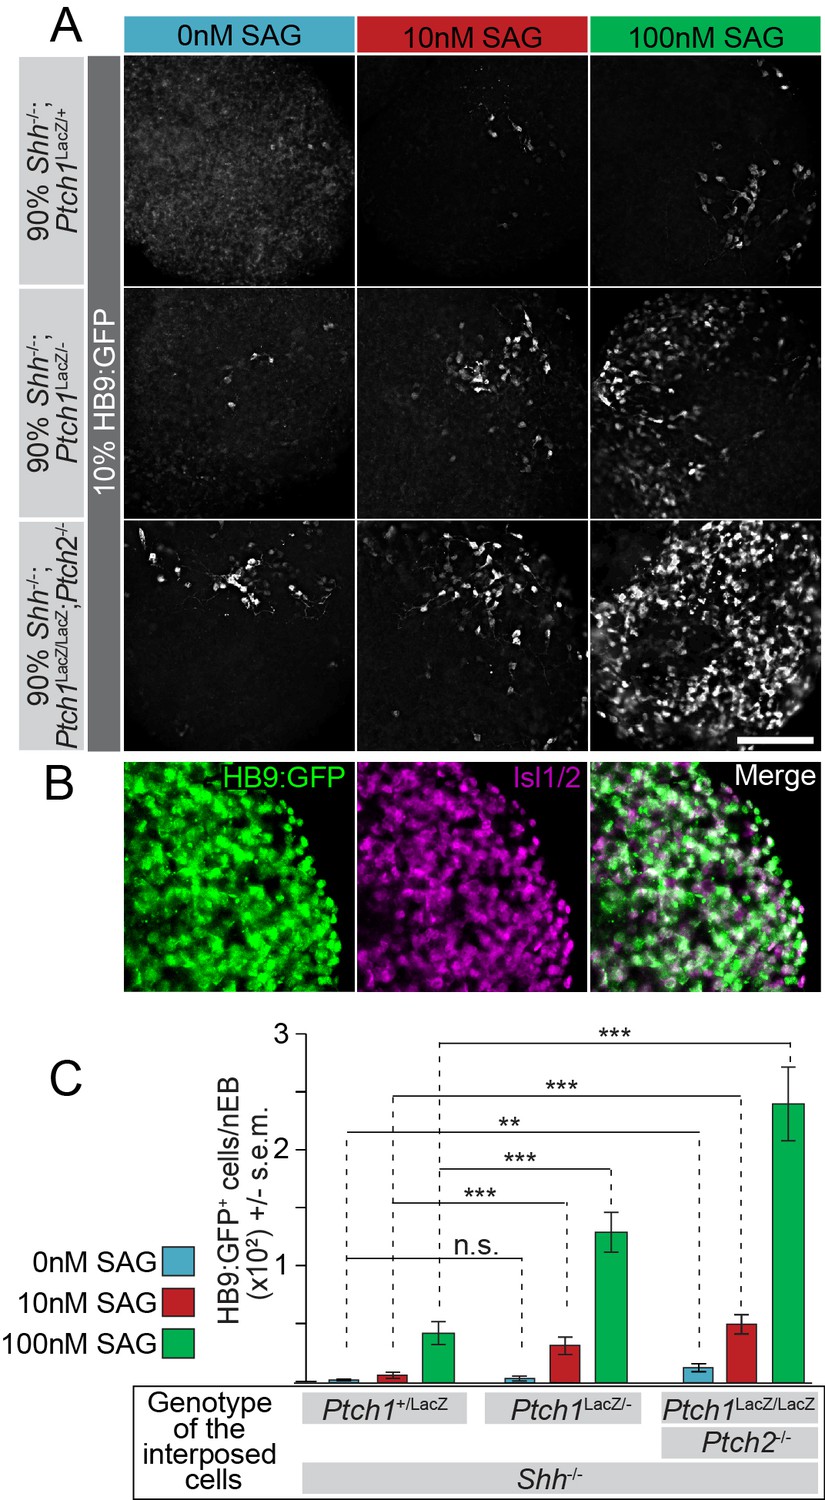
The Hh response to the Smo agonist SAG in HB9:GFP cells is enhanced by the absence of Ptch1/2 in neighboring cells.
(A) Images of mosaic nEBs consisting of 10% HB9:GFP cells and 90% Ptch1+/LacZ;Shh-/-, Ptch1LacZ/-;Shh-/- or Ptch1LacZ/LacZ;Ptch2-/-;Shh-/- cells (indicated). Mosaic nEBs were cultured in 0 nM (blue), 10 nM (red) or 100 nM (green) SAG. GFP expression in HB9:GFP cells indicates motor neuron differentiation, a measure of Hh pathway upregulation. (B) Isl1/2 (magenta) and HB9:GFP (green) is largely confined to the same cells, indicating that HB9:GFP serves as a motor neuron marker. (C) HB9:GFP+ cells were quantified. n > 20, **p<0.01, ***p<0.001, n.s., not significant (t-test). Scale bar is 100 µm for A, 200 µm for B.
Figure 6 with 1 supplement
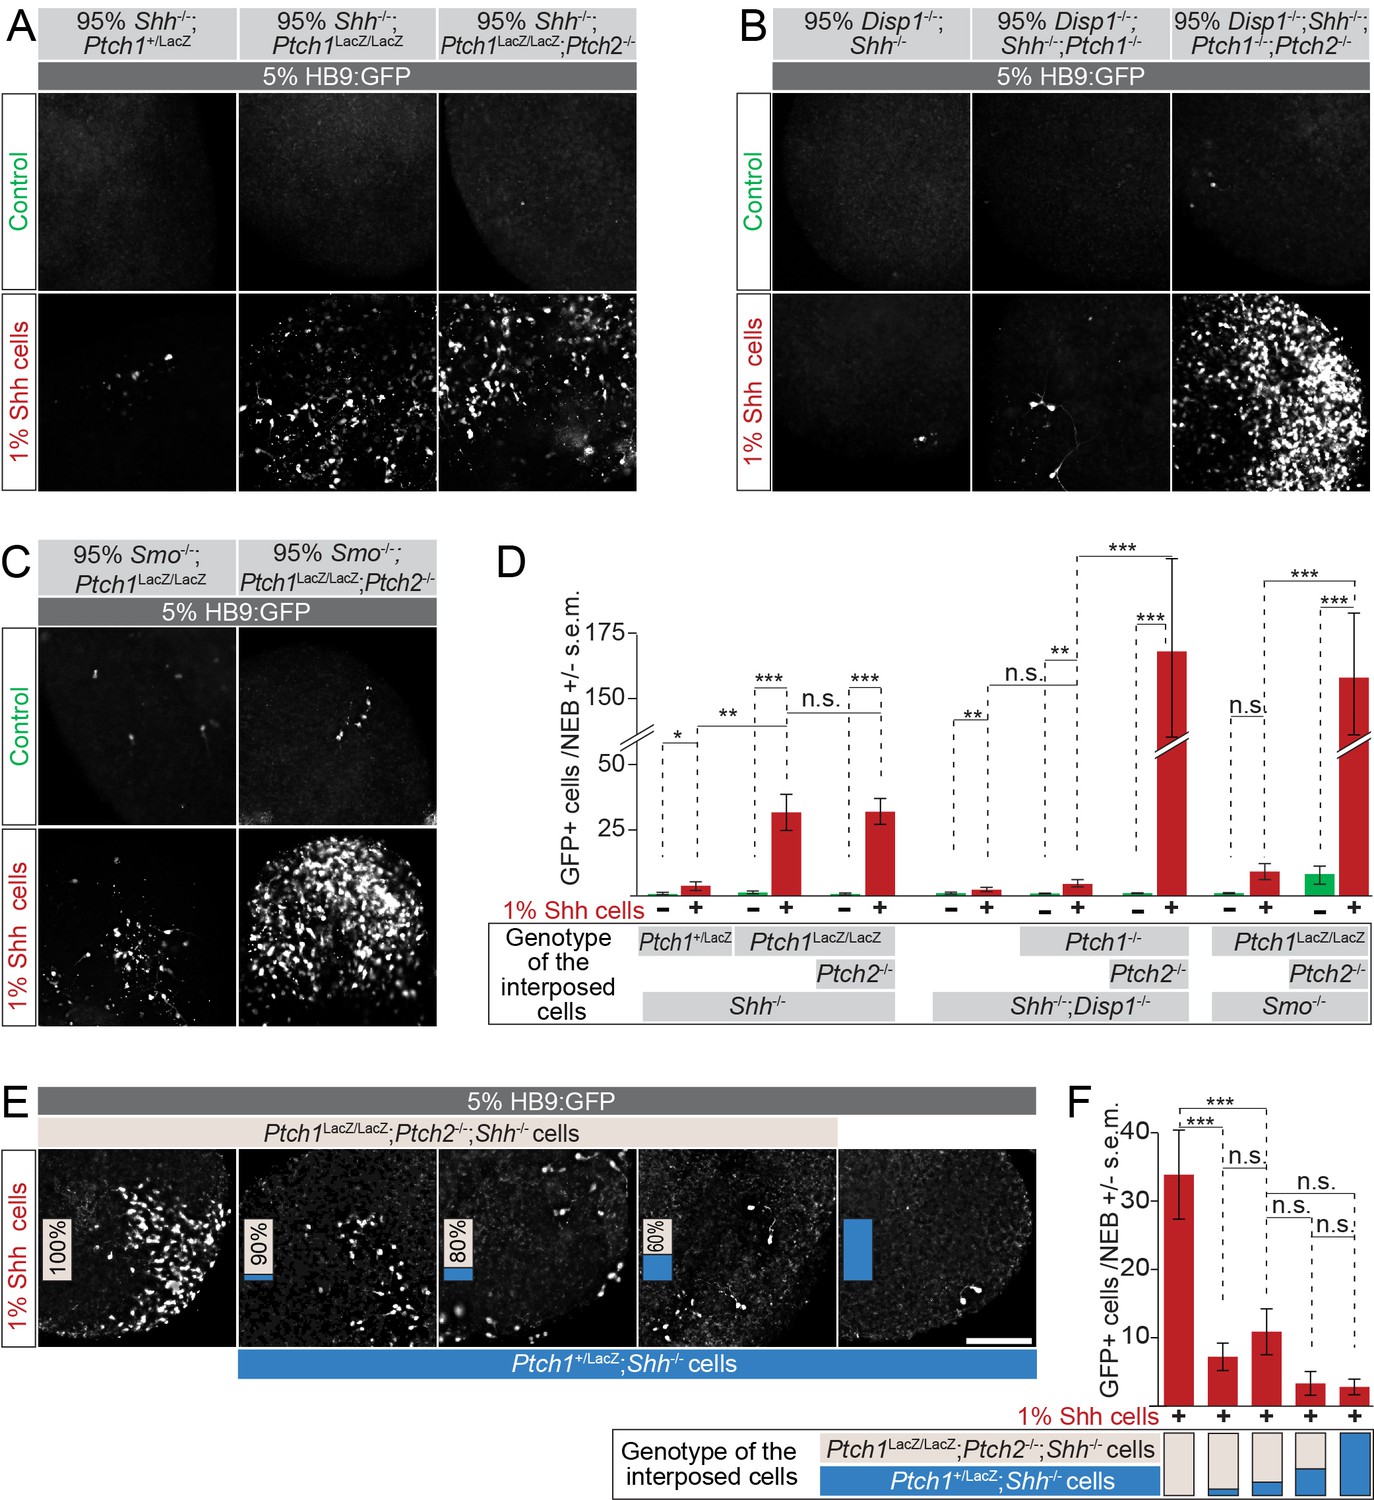
Loss of Ptch1 and Ptch2 in neighboring cells enhances the response to Shh in HB9:GFP cells.
(A–C) Images of two-part and three-part mosaic nEBs showing GFP expression in HB9:GFP cells. All nEBs included 5% HB9:GFP cells, and 1% Shh-expressing cells where indicated. (A) The remaining 94%/95% of cells were Ptch1+/LacZ;Shh-/-, Ptch1LacZ/LacZ;Shh-/- or Ptch1LacZ/LacZ;Ptch2-/-;Shh-/- (indicated). (B) The remaining 94%/95% of cells were Disp1-/-;Shh-/-, Disp1-/-;Shh-/-;Ptch1-/-, or Disp1-/-;Shh-/-;Ptch1-/-Ptch2-/- (indicated). (C) Remaining 94%/95% of cells were Ptch1-/-;Smo-/- or Ptch1-/-;Ptch2-/-;Smo-/- (indicated). Under all conditions, Ptch1/2 absence greatly enhanced Shh-dependent motor neuron differentiation in HB9:GFP cells. (D) HB9:GFP+ cells in (A), (B) and (C) were quantified per mosaic nEB. (E) Images of three-part and four-part mosaic nEBs showing HB9:GFP+ cells. All nEBs included 5% HB9:GFP cells and 1% Shh-expressing cells. Remaining cells were Ptch1LacZ/LacZ;Ptch2-/-;Shh-/- (gray) and Ptch1+/LacZ;Shh-/- (blue) in indicated ratios. Ptch1+/LacZ;Shh-/- cells suppress Shh-mediated motor induction. (F) HB9:GFP+ cells in (E) were quantified. *p<0.05, **p<0.01, ***p<0.001, n.s., not significant (t-test). Scale bar is 100 µm.
Figure 6—figure supplement 1
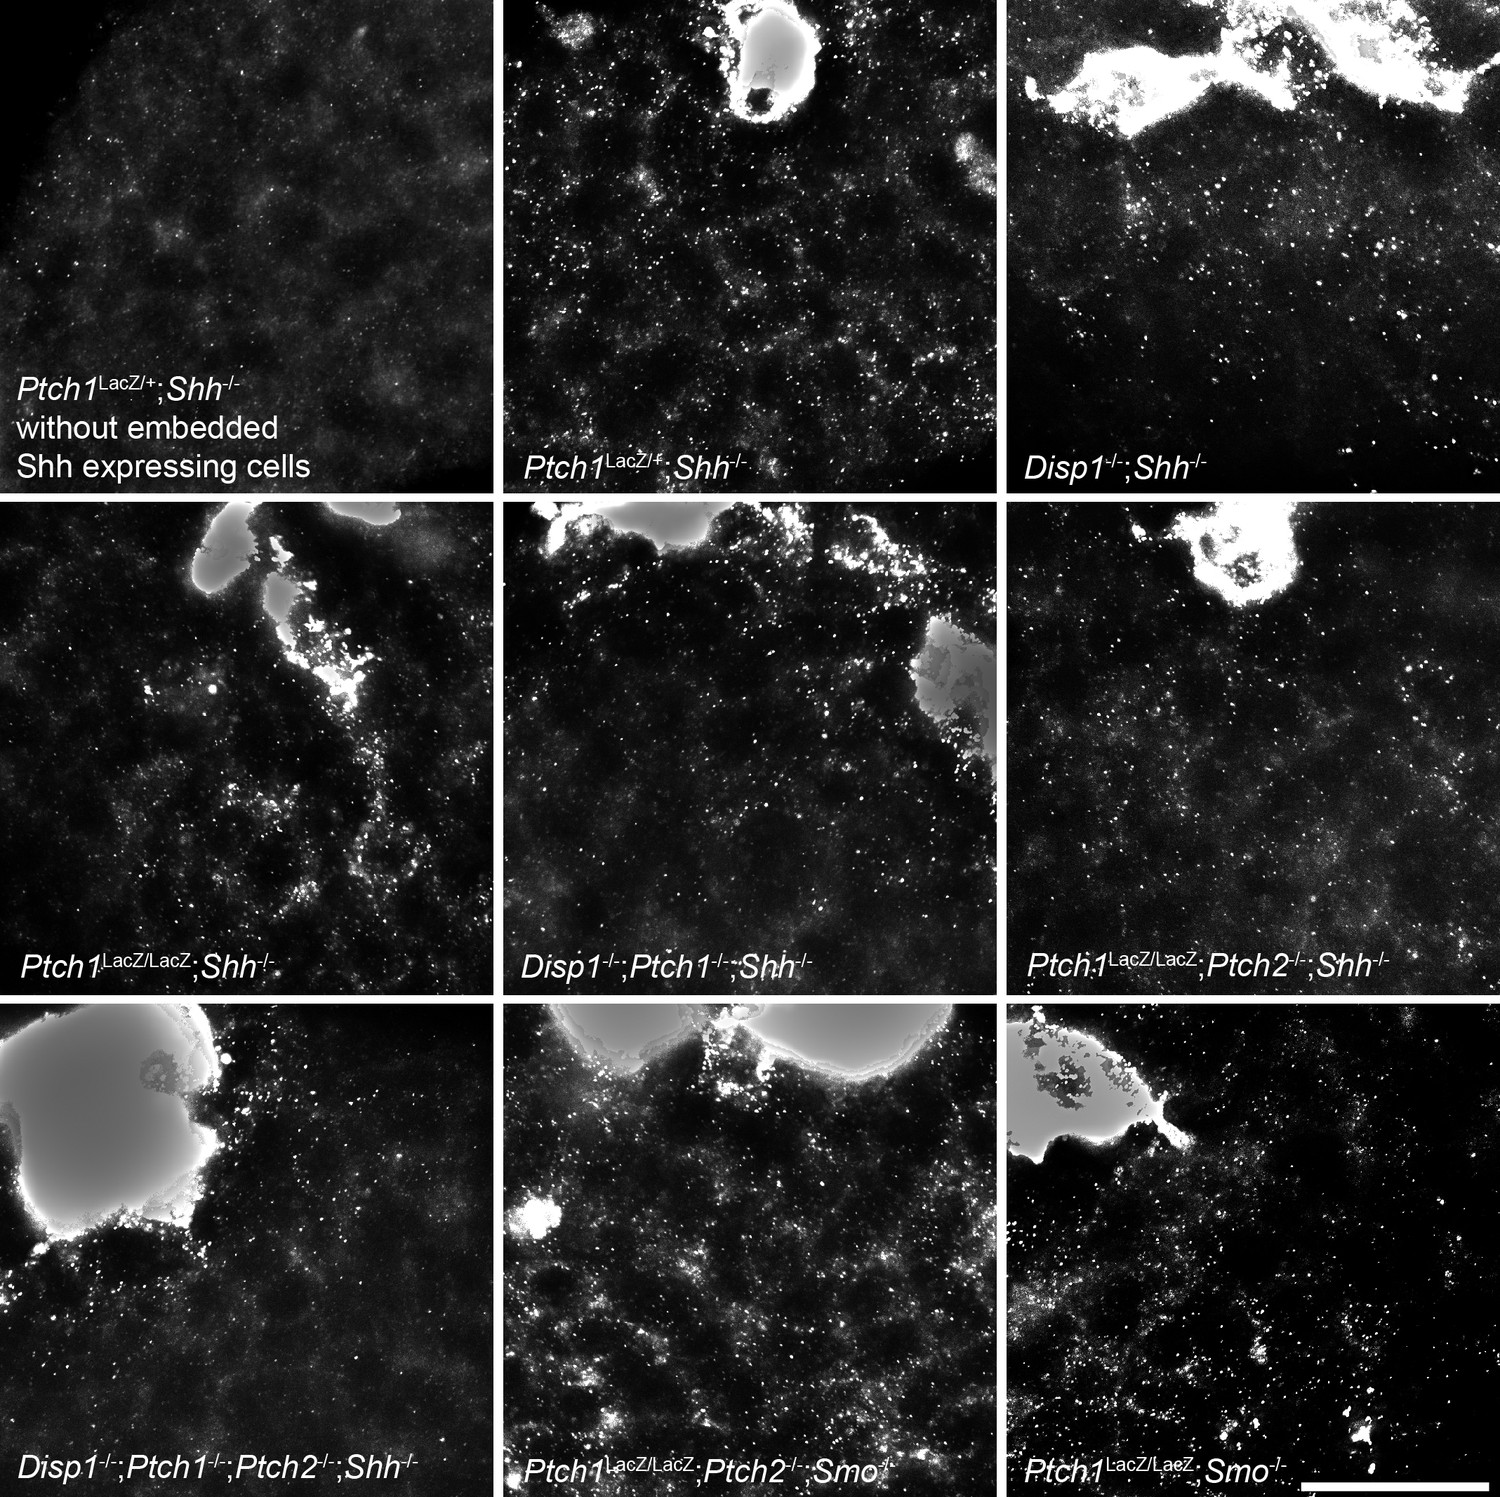
Shh distribution away from the sites of synthesis is not affected by the absence of Ptch1/2 in the tissue.
Shh-expressing cells (overexposed after live 5E1 stain) were incorporated into Shh-/- tissues lacking combinations of Ptch1, Ptch2, Disp1 and Smo. Genotypes are indicated. A Ptch1+/LacZ;Shh-/- EB without embedded Shh-expressing cells is shown in the top left panel. Scale bar is 50 µm.
Author response image 1
Download links
A two-part list of links to download the article, or parts of the article, in various formats.
Downloads (link to download the article as PDF)
Open citations (links to open the citations from this article in various online reference manager services)
Cite this article (links to download the citations from this article in formats compatible with various reference manager tools)
Patched1 and Patched2 inhibit Smoothened non-cell autonomously
eLife 5:e17634.
https://doi.org/10.7554/eLife.17634


