Discovery of methylfarnesoate as the annelid brain hormone reveals an ancient role of sesquiterpenoids in reproduction
- University of Vienna, Vienna Biocenter (VBC), Austria
- University of Vienna, Austria
Figures
Figure 1 with 2 supplements

Vitellogenin expression in eleocytes is a quantitative measure for the maturation stage of Platynereis, allowing for the establishment of a bioassay to purify the enigmatic brain hormone, nereidin.
(A) Scheme summarising the critical role of the brain hormone nereidin in energy expenditure, as derived from classical experiments: Before maturation (left), high nereidin levels sustain somatic growth, but repress reproduction; drops in nereidin activity levels initiate the generation of germ cells and sexual maturation (right). (B) Eleocytes in the worm’s coelom have a central role in reproductive commitment, as they synthesise the yolk protein precursor Vitellogenin (Vtg); after release into the coelomic fluid, Vtg is endocytosed by the developing oocytes, leading to oocyte growth. (C) Expression levels of vtg in eleocytes are significantly up-regulated during maturation, confirming vtg as a suitable molecular marker to quantify maturation state. qRT-PCR quantification of vtg levels in eleocytes sampled at different stages of sexual maturation (as assessed by oocyte diameter). The increase in vtg transcripts from premature eleocytes (oocyte diameter: 50 and 60 µm) to those from mature eleocytes (oocytes diameter: 170 µm) is evident; expression levels were calculated against the arithmetic mean of the reference genes cdc5 and rps9, and normalised to the expression of vtg in eleocytes from animals with an oocyte diameter of 50 µm. Statistical significance was tested an one-way ANOVA. ***p<0.001. n: number of biological replicates. (D) Resulting bioassay for the purification of nereidin from head extracts: primary cell cultures were derived from coelomic cells of premature animals; vtg levels were quantified after overnight incubation with different fractions of head extract to determine those fractions containing significant inhibitory activity (nereidin). Data for panel (C) provided in Figure 1—source data 1.
-
Figure 1—source data 1
Data for the graphs in Figure 1C, Figure 1—figure supplement 2A, Figure 1—figure supplement 2B (vtg expression levels over the time course of maturation).
- https://doi.org/10.7554/eLife.17126.004
-
Figure 1—source data 2
Alignment file for the phylogenetic tree of Vitellogenins (Figure 1—figure supplement 1B).
- https://doi.org/10.7554/eLife.17126.005
Figure 1—figure supplement 1
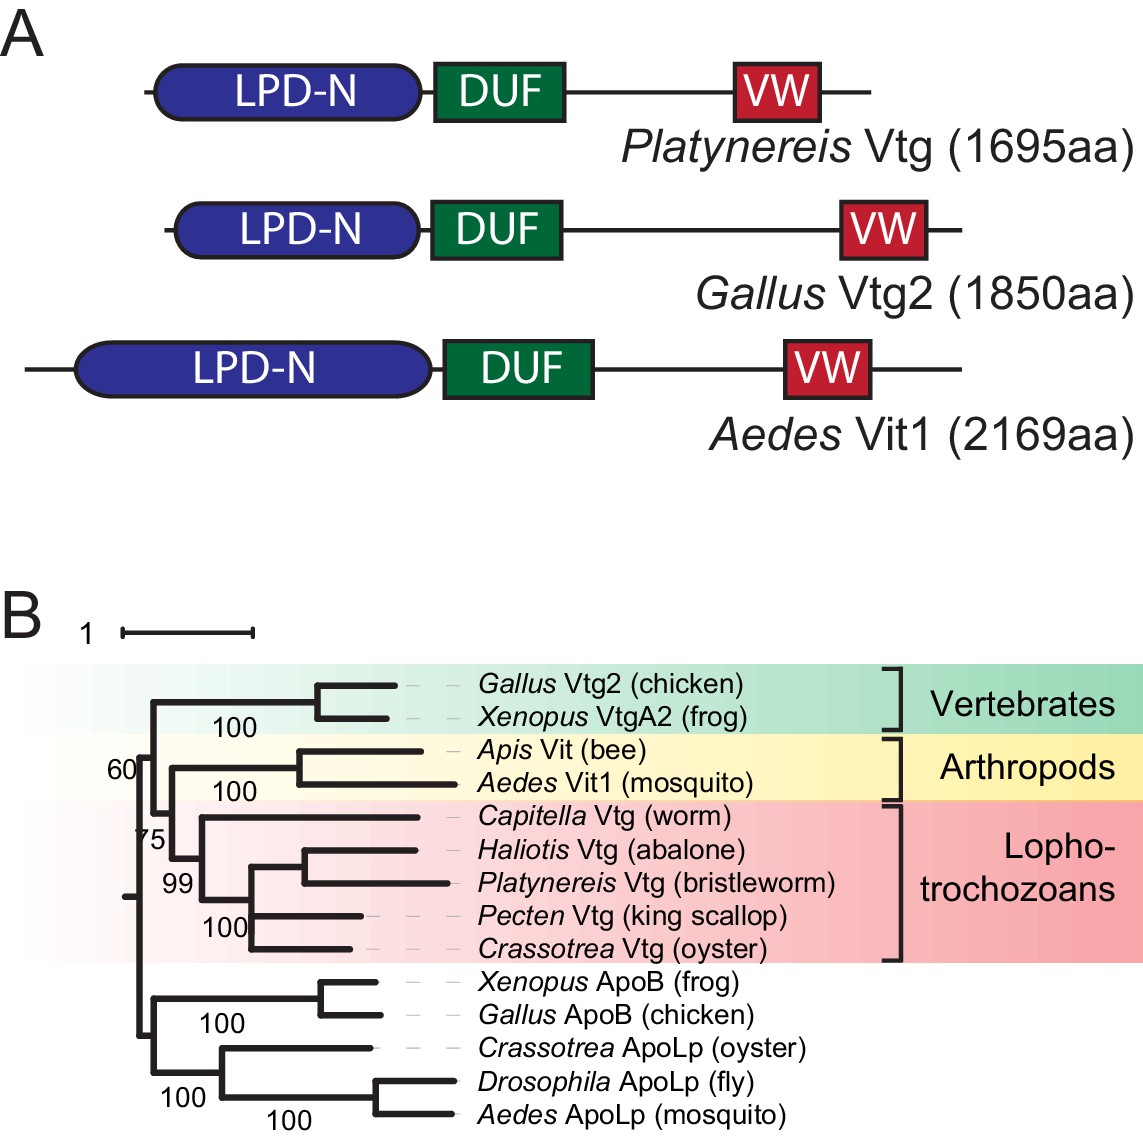
Identification of a Platynereis Vitellogenin orthologue.
(A) Domain analysis for the protein encoded by the identified Platynereis cDNA (top) as well as chicken Vtg2 (middle) and mosquito Vit1 (bottom) reveals that Platynereis Vtg shares three conserved domains with other bilaterian Vitellogenins that are arranged in the same order: a Lipoprotein N-terminal Domain (LPD-N, SMART accession SM000638, blue), a DUF1943 domain (DUF, SMART accession SM001169, green), and a van Willebrand factor D domain (VW, SMART accession SM000216, red). (B) Molecular phylogenetic analysis supports the orthology of Platynereis Vtg with representatives of other invertebrate and vertebrate Vitellogenins. Maximum likelihood tree constructed with IQtree 1.3.12 (Minh et al., 2013; Nguyen et al., 2015), using apolipophorins as an outgroup. By parameter optimisation, the LG+F+I+G4 substitution model was selected. Numbers at each node show confidence levels derived from 1000 replicates. Sequences accessions: Gallus Vtg2: NP_001026447.1; Xenopus VtgA2: P18709.1; Apis Vit1: Q868N5.1; Aedes Vit1: Q16927.2; Capitella Vtg: ELU00944.1; Haliotis Vtg: BAF98238.1; Platynereis Vtg: KU756287 (this study); Pecten Vtg: CAQ06469.2; Crassotrea Vtg: EKC30345.1; Xenopus ApoB: XP_002934538.2; Gallus ApoB: NP_001038098.1; Crassotrea ApoLp: EKC20363.1; Drosophila ApoLp: Q7KTG2; Aedes ApoLp: Q17BE3. Alignment file for panel (B) provided as Figure 1—source data 2.
Figure 1—figure supplement 2
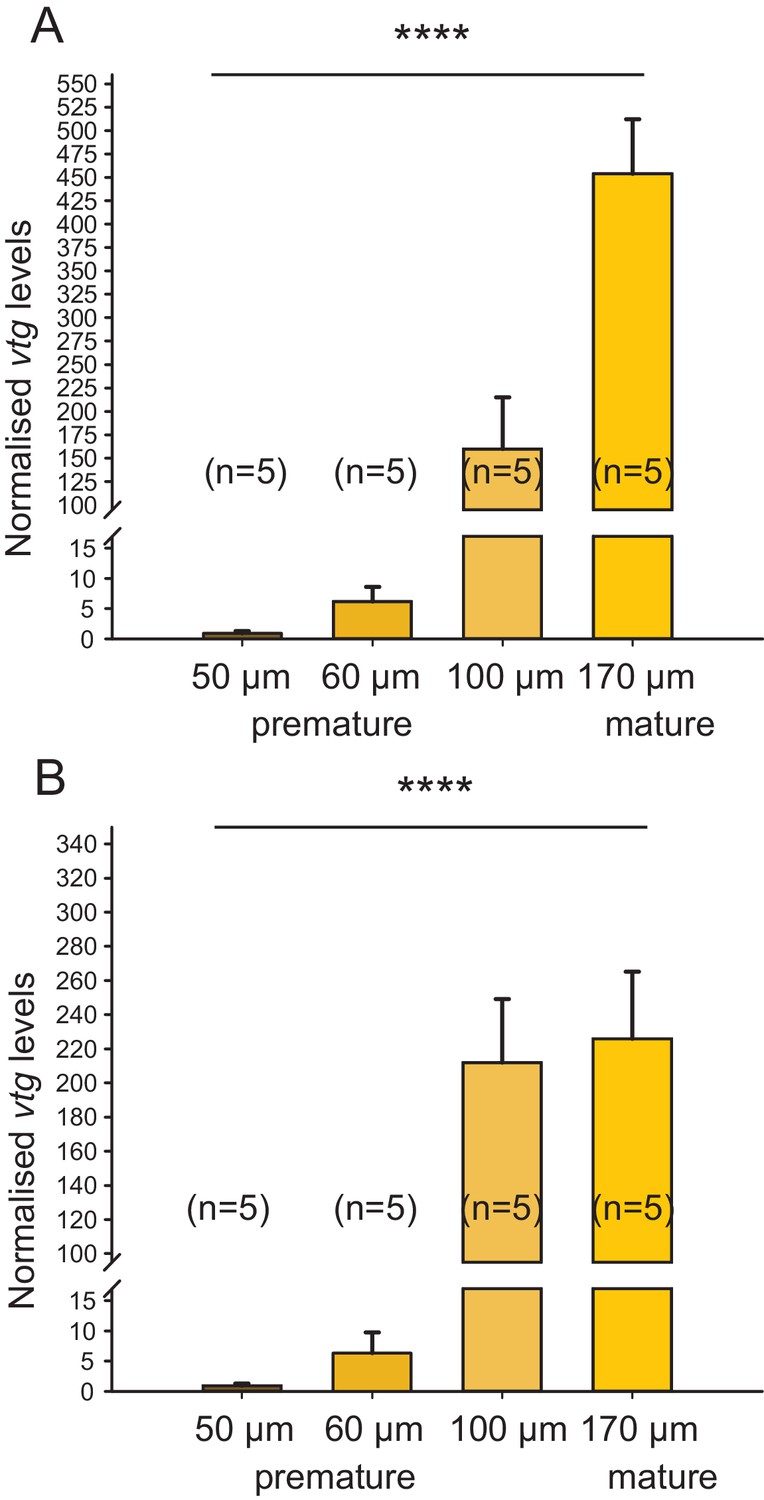
Irrespective of the chosen reference gene, vitellogenin is regulated over the course of maturation.
The figure shows the same data as Figure 1C, but with the results for the individual reference genes plotted separately. In the range relevant for the bioassay (early premature stage), the observed relative expression of vitellogenin (vtg) in eleocytes is independent of the reference gene used for normalisation; differences in levels close to spawning are likely caused by the divergent role of rps9 and cdc5 in protein translation and the cell cycle, respectively. (A) rps9 used as reference gene for normalisation. The vtg expression levels relative to the expression in eleocytes from animals with an oocyte diameter of 50 µm were 6.20, 159.81 and 453.86 for eleocytes from animals with oocyte diameters of 60, 100 and 170 µm, respectively. (B) cdc5 used as reference gene for normalisation. The vtg expression levels relative to the expression in eleocytes from animals with an oocyte diameter of 50 µm were 6.36, 212.01 and 225.80 for eleocytes from animals with oocyte diameters of 60, 100 and 170 µm, respectively. Statistical test as in Figure 1C. ****p<0.0001. Data for panels (A) and (B) provided in Figure 1—source data 1.
Figure 2 with 2 supplements
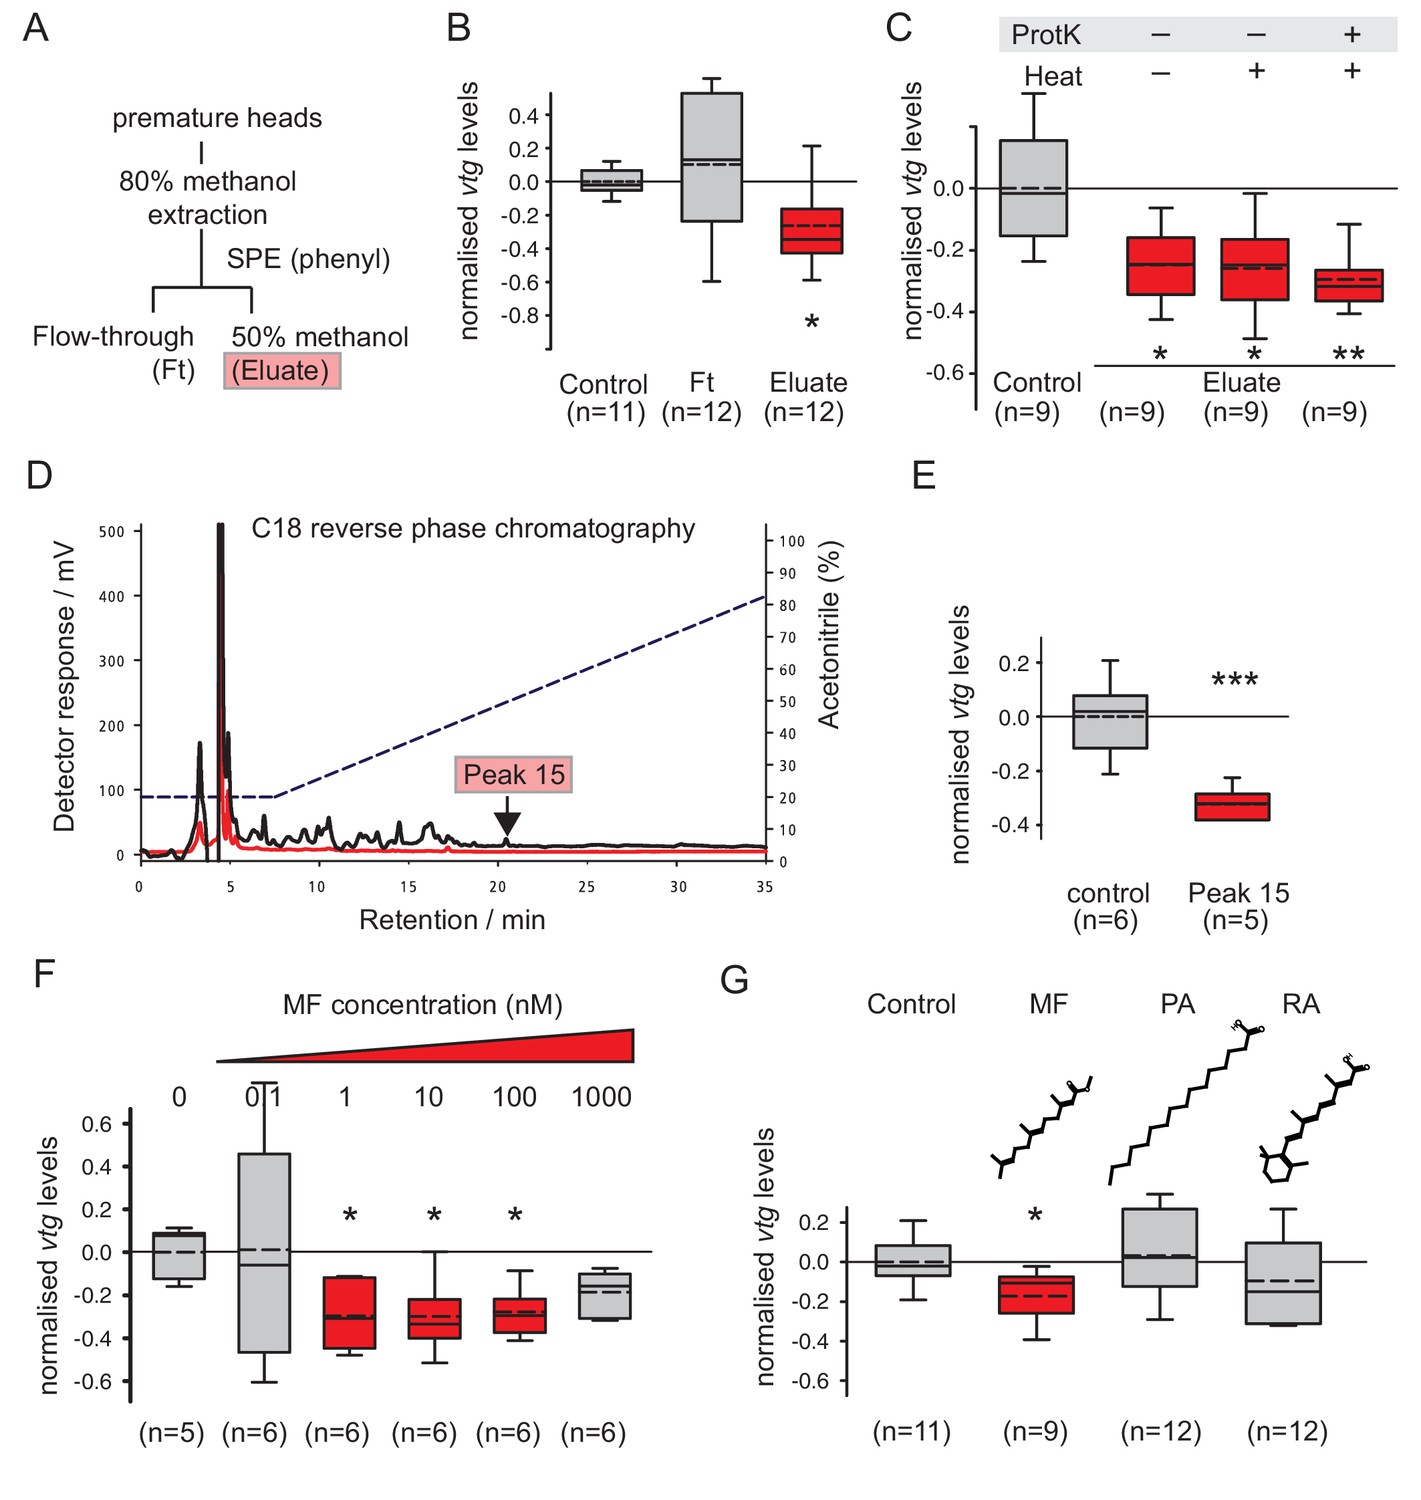
Methylfarnesoate, not protein, constitutes the main nereidin/brain hormone activity.
(A–C) Nereidin activity elutes in lipophilic fractions of head extracts but is not proteinaceous as previously hypothesised. (A) Schematised fractionation of premature Platynereis head extracts, expected to recover the described nereidin activity in the methanolic eluate of SPE. (B) Relative coelomocyte vtg levels after overnight incubation with flowthrough or eluate of (a), normalised against control samples. (C) Insensitivity of nereidin activity against proteinase and heat treatment. Experiment as in (b), with pretreatment of eluate by proteinase K (‘ProtK’) and/or subsequent heat treatment (5’, 95°C; ‘Heat’). Results indicate that the repressive effect of nereidin on eleocyte vtg levels is neither sensitive to proteinase nor heat. (D–G) Identification of methylfarnesoate as a major component of nereidin. (D) Further fractioning of the brain hormone activity (eluate from b) by C18-reverse phase column chromatography. Absorption of eluent at 280 nm (red line) and 215 nm (black line) during application of acetonitrile gradient (dashed line, right ordinate). Peak 15 (marked red), containing the nereidin activity, elutes at a retention time of 20.5 min. (E) Peak 15, containing methylfarnesoate (MF), significantly suppresses vtg levels in the coelomocyte bioassay when compared to the controls. (F) Authentic MF recapitulates the observed effect at physiological concentration ranges; relative vtg levels in coelomocytes treated with 0.1 nM – 1000 nM MF in 0.01% DMSO, normalised to the control group of DMSO-treated cells. (G) Specificity of the repressive effect caused by MF; comparison of coelomocyte vtg levels after incubation in 10 nM MF, palmitic acid (PA) or retinoic acid (RA). Graphs in (B,C,E,F,G) show qRT-PCR quantification of vtg levels after overnight (20 hr) treatment of primary coelomocyte cultures. Expressions values were calculated with respect to the reference gene rps9, and normalised to the levels of controls (untreated cells). Boxplots show the first and third quartile, the median (solid line), and the mean (dashed line). Whiskers denote the 10th and 90th percentile. Statistical significance was tested by a one-sided t-test of the treatment group against the control, or, in case of multiple comparisons, first with an ANOVA, followed by a one-sided t-test with adjustment of the p-values for multiple testing to assess differences between the different groups. *p<0.05. **p<0.01, ***p<0.001. n: number of biological replicates. Raw data for panels B,C,E,F,G provided in Figure 2—source data 1.
-
Figure 2—source data 1
Data for Figure 2B,C,E,F,G (vtg expression levels normalised to the respective control treatment) and Figure 2—figure supplement 2 (stability of Ct values for rps9).
- https://doi.org/10.7554/eLife.17126.009
Figure 2—figure supplement 1
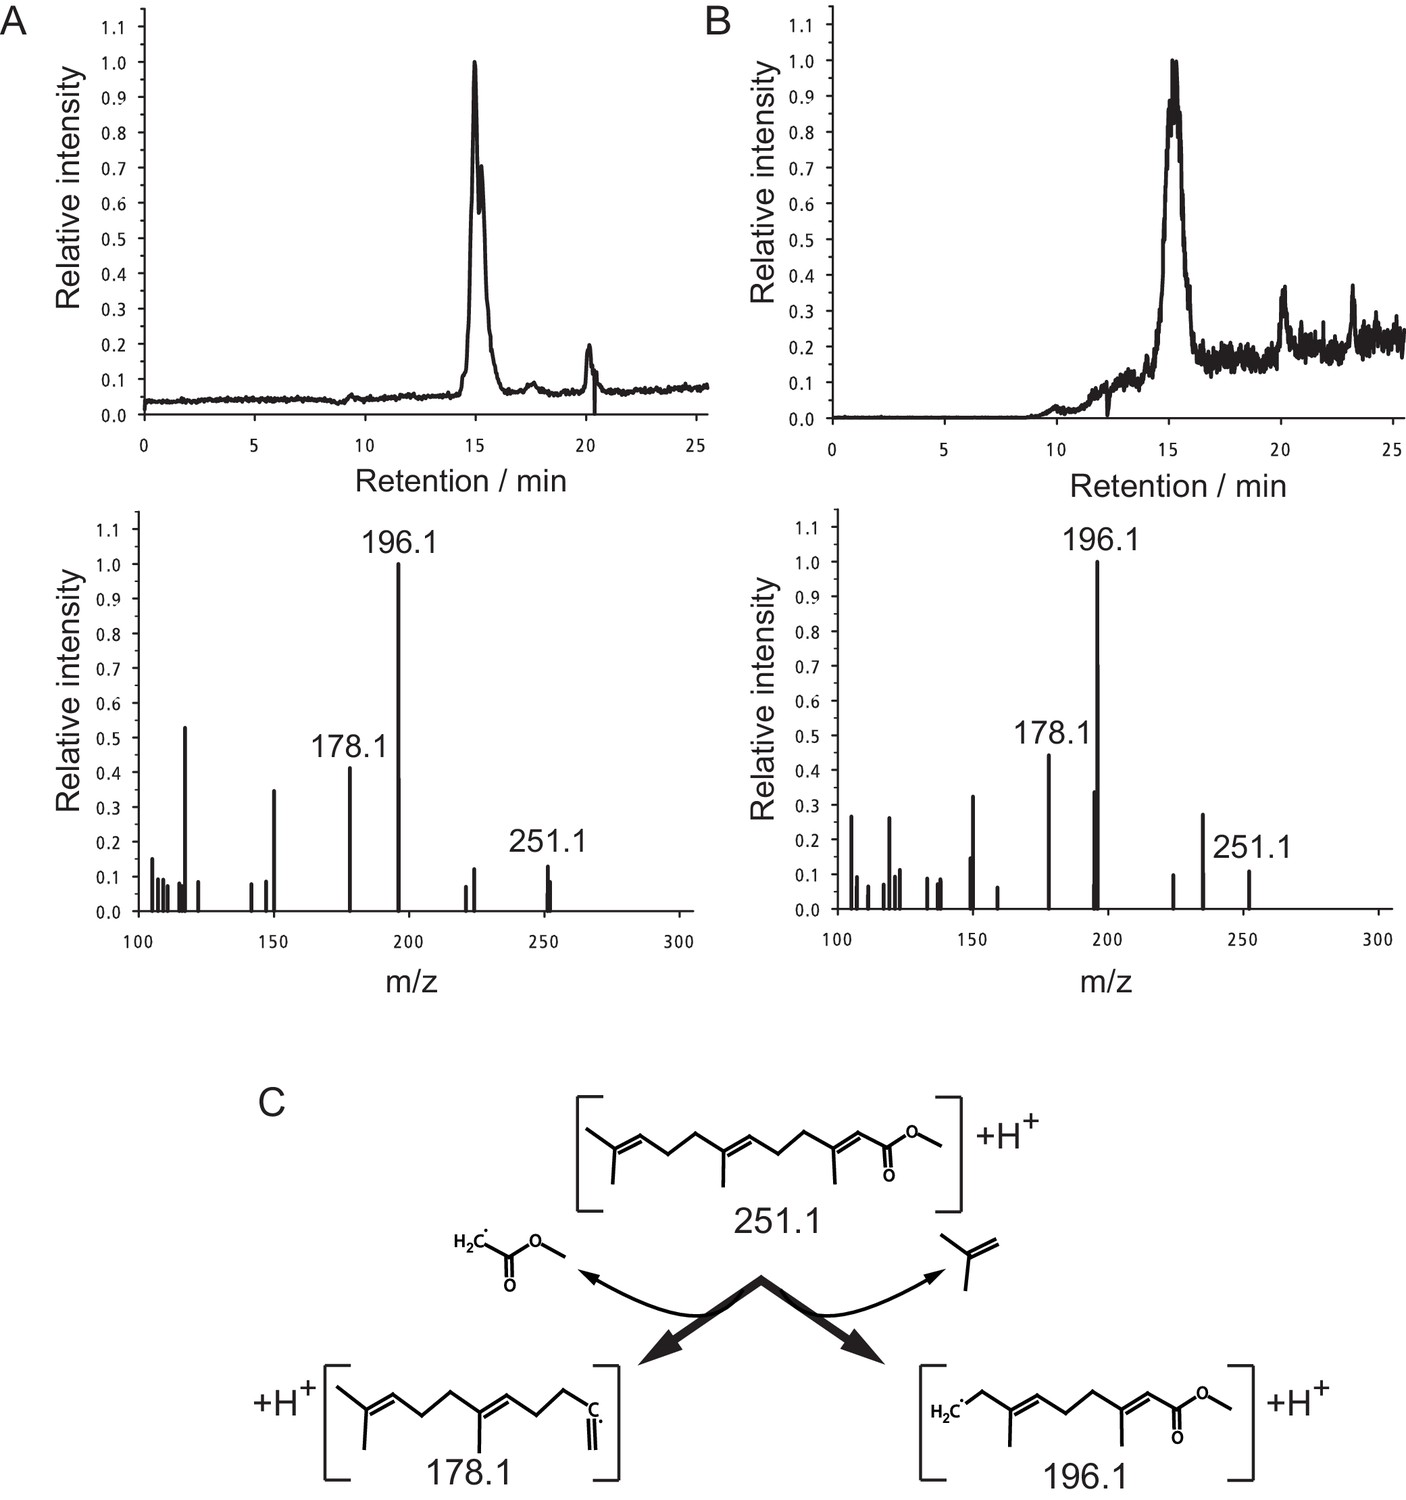
Identification of MF as the principal component in peak 15.
(A,B) The panels shows the selected ion currents (SIC) in the range of m/z 251.0–251.5 (top panels) and the selected MS2-spectrum of the precursor ion at m/z 251.1 (lower panels). (A) Peak 15. Note the single peak eluting at a retention time of 15.0 min in the upper panel, and the fragment pattern of the main peak. The fragment spectrum is characterised by the three major fragments at m/z 251.1 (parent ion), 196.1 and 178.1, with peak ratios of 0.13:1.00:0.41, respectively. (B) Authentic MF. Only one major fraction is eluting from the column with a retention time of 15.1 min (upper panel). The derived MS2-spectrum again shows the characteristic ions at m/z 251.1, 196.1 and 178.1. with peak ratios of 0.11:1.00:0.44, respectively. (C) Structure of the observed ions at m/z 251.1, 196.1 and 178.1, and the neutral loss occurring during fragmentation.
Figure 2—figure supplement 2
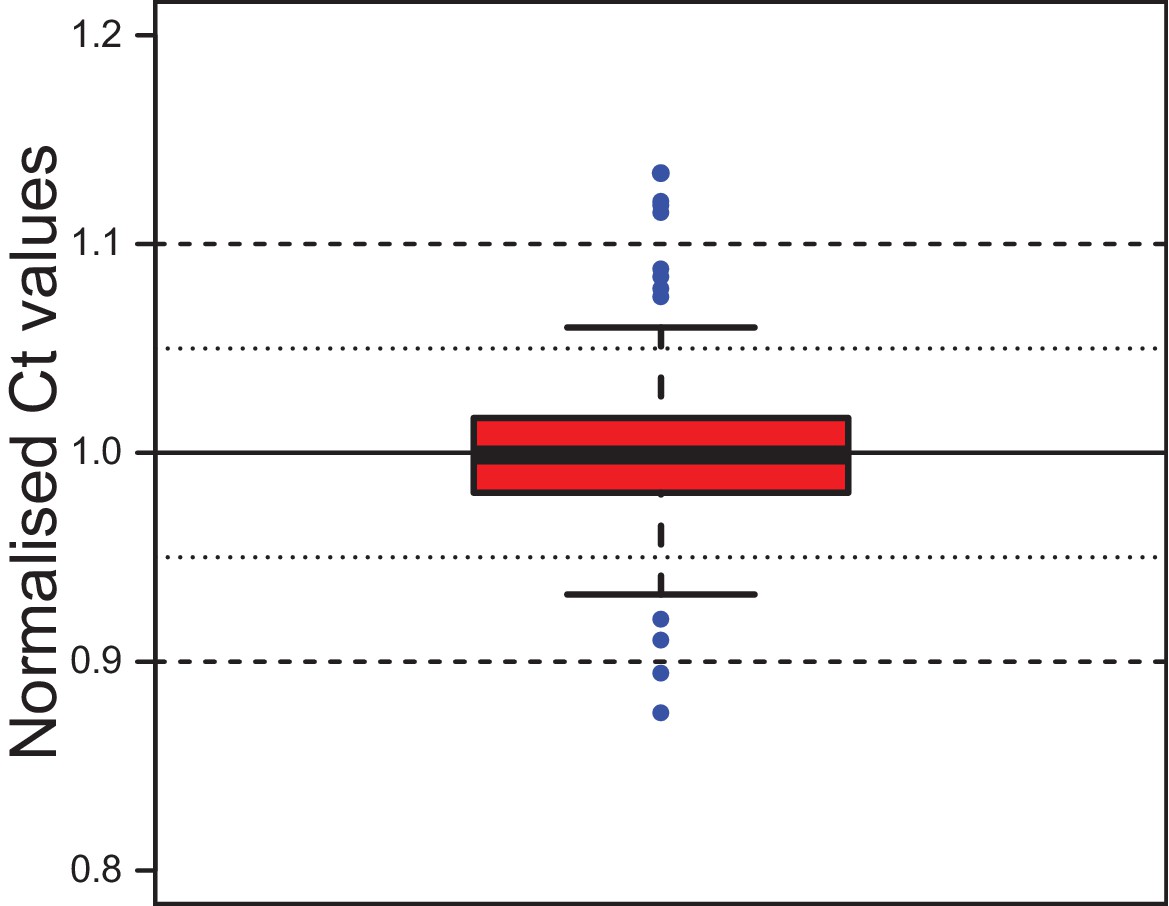
Stability of the reference gene rps9 in coelomocyte culture.
Ct values for rps9 were normalised to the mean of each experimental series. The box shows the first and third quartile and the median (solid line). Whiskers denote the 1.5x fold range of the interquartile range. Blue dots denote the 12 outliers (out of 292 data points). The minimum value is 0.876, the maximum 1.134. The mean is at 1.000 and the median at 0.999, the standard deviation is 0.032. The inter-quartile range (50% of data) lies between 0.981 and 1.017. Grubb`s test for outliers called the minimal and maximal values as statistically significant outliers. Data provided in Figure 2—source data 1.
Figure 3 with 4 supplements
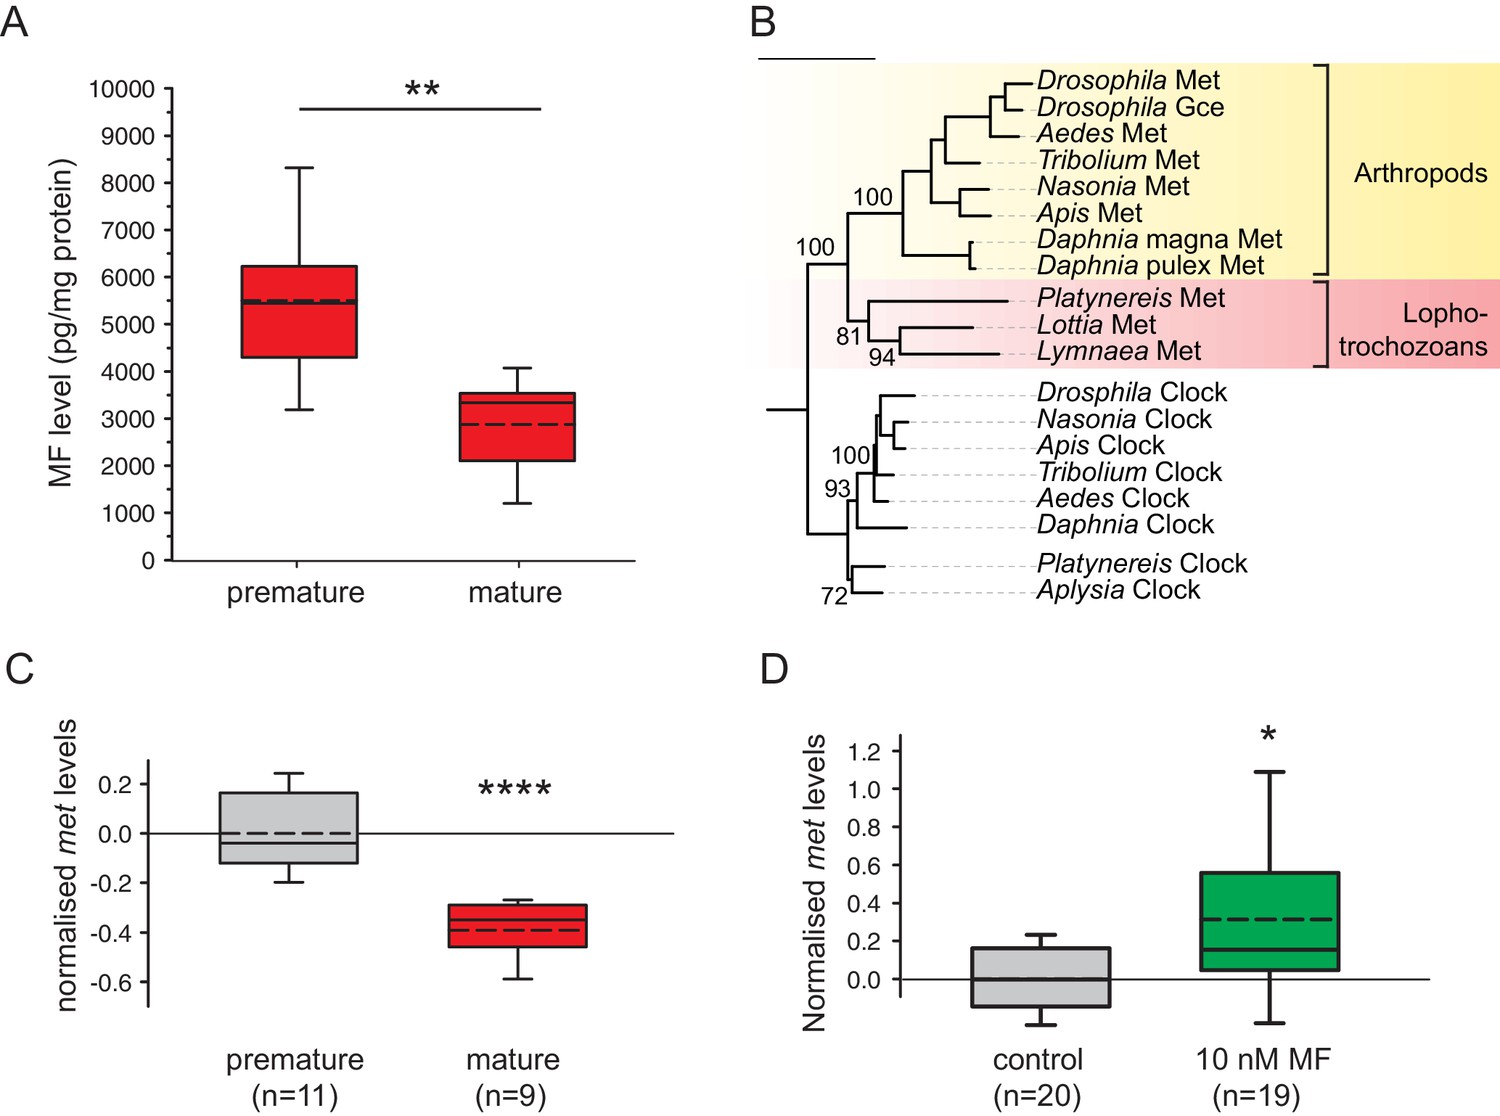
Levels of MF as well as the sesquiterpenoid receptor orthologue Met drop over the course of maturation.
(A) Significant decrease of MF levels between premature and mature heads; boxplots show amounts of MF normalised to the total protein content of the respective head sample. Heads of premature animals contain ~5510 ± 660 (S.E.M) pg MF per mg protein, whereas heads from mature animals contain ~2870 ± 495 pg MF per mg protein, thus roughly 50% of the amount found in heads of premature animals. Amounts are corrected for a MF recovery rate of 85%. The boxes show the first and third quartile, the median (solid line), and the mean (dashed line). Whiskers denote the 10th and 90th percentile. Significance was tested with a one-sided t-test, **p<0.01. n: number of biological replicates. (B–D) Platynereis possesses an orthologue of arthropod sesquiterpenoid receptors that shows co-regulation with MF titres. (B) Maximum Likelihood tree supporting the identity of Platynereis Met as orthologue of the validated arthropod sesquiterpenoid receptors Methoprene-tolerant (Met) and Germ cells expressed (Gce). Phylogeny reconstructed with IQ-TREE 1.3.12 (Minh et al., 2013; Nguyen et al., 2015). By parameter optimisation, the LG+F+I+G4 substitution model was selected. Numbers refer to confidence levels (in %) of major nodes derived from 1000 replicates. Accessions: Drosophila Met: NP_511126.2; Drosophila Gce: NP_511160.2; Aedes Met: AAW82472.1; Nasonia Met: XP_001606775.2; Apis Met: XP_395005.4; Tribolium Met: NP_001092812.1; Daphnia pulex Met: BAM83853.1; Daphnia magna Met: BAM83855.1; Platynereis Met: KU756288 (this study); Lottia Met: XP_009046608.1, Lymnaea Met: FX197139.1. Drosophila Clock: NP_523964.2; Nasonia Clock: XP_008214438.1; Apis Clock: XP_394233.1; Aedes Clock: XP_001662706.1; Tribolium Clock: NP_001106937.1; Daphnia Clock: EFX7997.1; Platynereis Clock: AGX93013.1; Aplysia Clock: XP_005112430.1. (C) Eleocyte met levels drop by ~39% in the course of maturation. qRT-PCR analysis of met transcript levels in eleocytes sampled from premature and mature animals. Relative met levels were calculated with respect to the arithmetical mean of the reference genes sams and cim6pr, and normalised to the level of the premature sample. (D) Eleocyte met levels are increased by the addition of MF. Similar analysis as in (C), indicating that met levels in MF-treated cultured eleocytes (right) are ~30% higher than in untreated controls (left). Relative met levels were calculated with respect to the reference gene rps9, and normalised to the level of the control sample. Boxplots (C,D) show the first and third quartile, the median (solid line), and the mean (dashed line). Whiskers denote the 10th and 90th percentile. Statistical significance in (B,C) was determined by a two-sided t-test.*: p<0.05. ****p<0.0001. n: number of biological replicates. Raw data for panels A,C,D provided in Figure 3—source data 1. Alignment for panel B provided as Figure 3—source data 2.
-
Figure 3—source data 1
Data for the graphs in Figure 3A (MF content in pg normalised to mg protein per head), Figure 3C (met expression levels normalised to premature eleocytes) and Figure 3D (met expression levels normalised to the control treatment); data for the graphs in Figure 3—figure supplement 2 and Figure 3—figure supplement 3 (MF content in pg per head), Figure 3—figure supplement 4A and Figure 3—figure supplement 4B(met expression levels quantified against individual reference genes).
- https://doi.org/10.7554/eLife.17126.013
-
Figure 3—source data 2
Alignment file for the phylogenetic tree of Met homologs (Figure 3B).
- https://doi.org/10.7554/eLife.17126.014
Figure 3—figure supplement 1

Quantification of MF in the heads of Platynereis by GC-MS.
Representative Selected Ion Mode (SIM) chromatograms from premature Platynereis heads and authentic MF (upper panel). The lower panel shows the selected ions at m/z 114.0, 136.0 and 219.0. (A) SIM chromatogram of 2.5 premature Platynereis heads, the peak with a retention time of 9.09 min represents MF as evident from the selected ion mass spectrum (lower panel). The ions at m/z 114.0, 136.0 and 219.0 show peak ratios of 1.00:0.46:0.19, respectively. (B) SIM chromatogram of authentic MF eluting 9.09 min. Peaks eluting after 10 min are due to plasticisers. The base line jump at 10 min is due to a change in SIM ions from m/z 114.0, 136.6 and 219.0 to ions at m/z 191.0, 235.0 and 278.0 for the detection of methoprene (not shown). The ions at m/z 114.0, 136.0 and 219.0 have peak ratios of 1.00:0.34:0.17, respectively (lower panel). (C) Structures of MF and the monitored SIM ions.
Figure 3—figure supplement 2
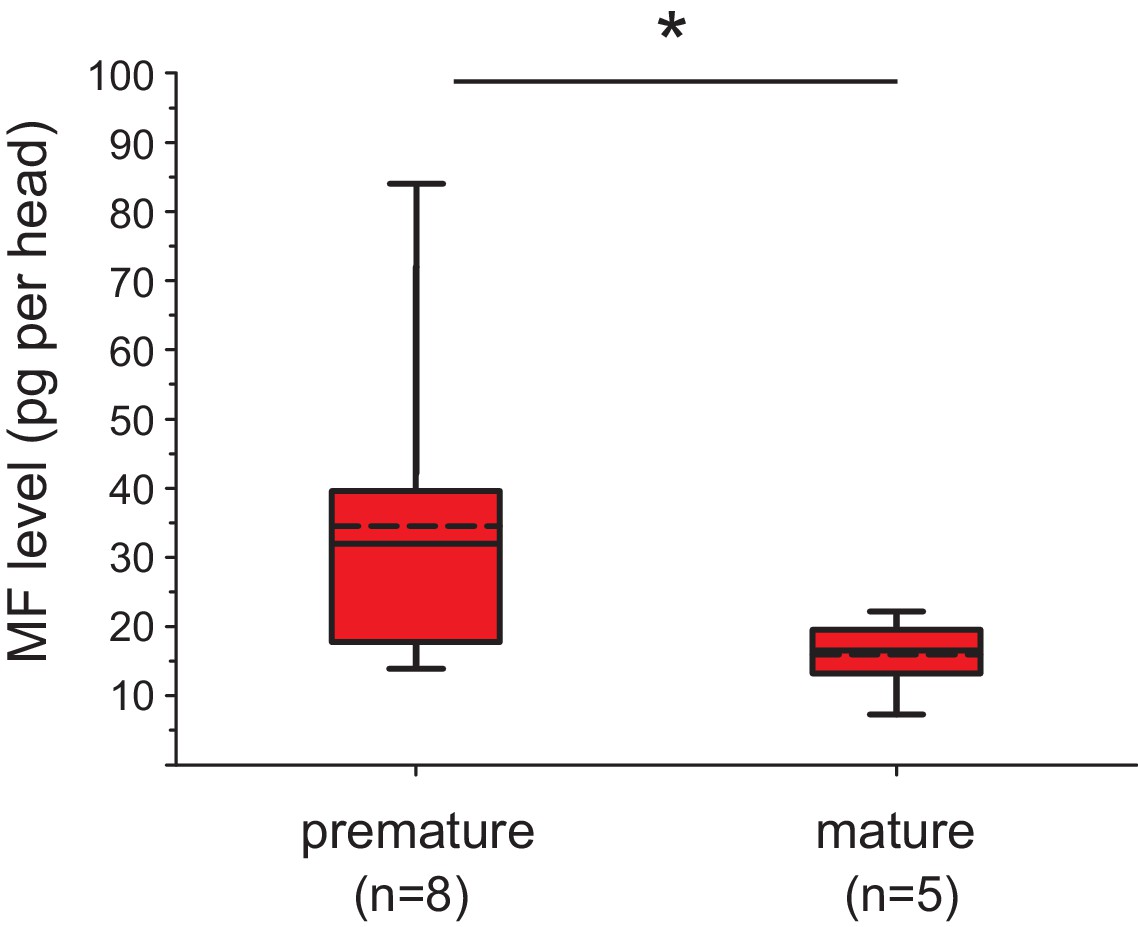
The levels of MF per head drop over the course of maturation.
Significant decrease of MF levels between premature and mature heads; the boxplot shows the quantified amounts of MF normalised per head. Heads of premature animals contain on average ~ 34.6 ± 8.0 (S.E.M) pg MF per head, whereas heads from mature animals contain ~15.4 ± 2.5 pg MF per head, thus roughly 46% of the amount found in heads of premature animals. The amounts are corrected for a MF recovery rate of 85%. The box shows the first and third quartile, the median (solid line), and the mean (dashed line). The whiskers denote the 10th and 90th percentile. Significance was tested with a one-sided t-test, *p<0.05. n: number of biological replicates. Raw data provided in Figure 3—source data 1.
Figure 3—figure supplement 3
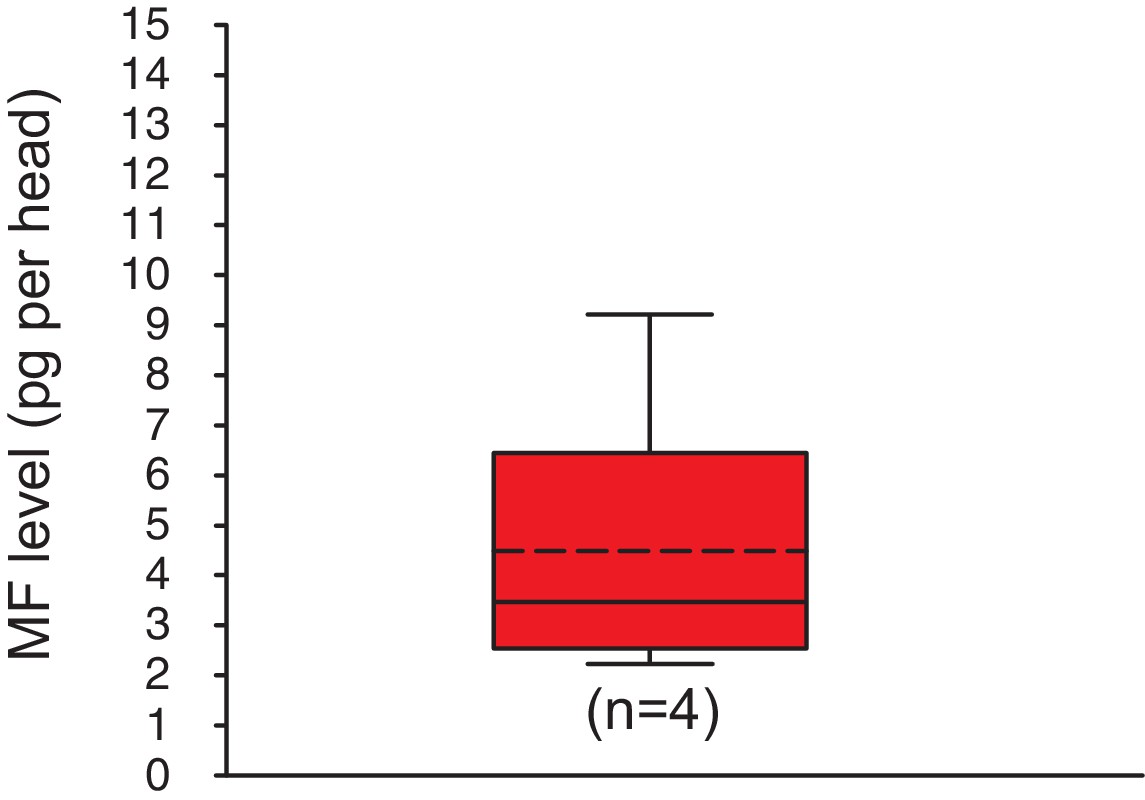
Methylfarnesoate is found in the heads of earthworms.
The head of earthworms contain on average ~ 5.3 ± 1.9 (S.E.M) pg MF per head. The data range is between ~2.1 and ~9.8 pg MF per head. The amounts are corrected for a MF recovery rate of 85%. The box shows the first and third quartile, the median (solid line), and the mean (dashed line). The whiskers denote the data range. n: number of biological replicates. Raw data provided in Figure 3—source data 1.
Figure 3—figure supplement 4
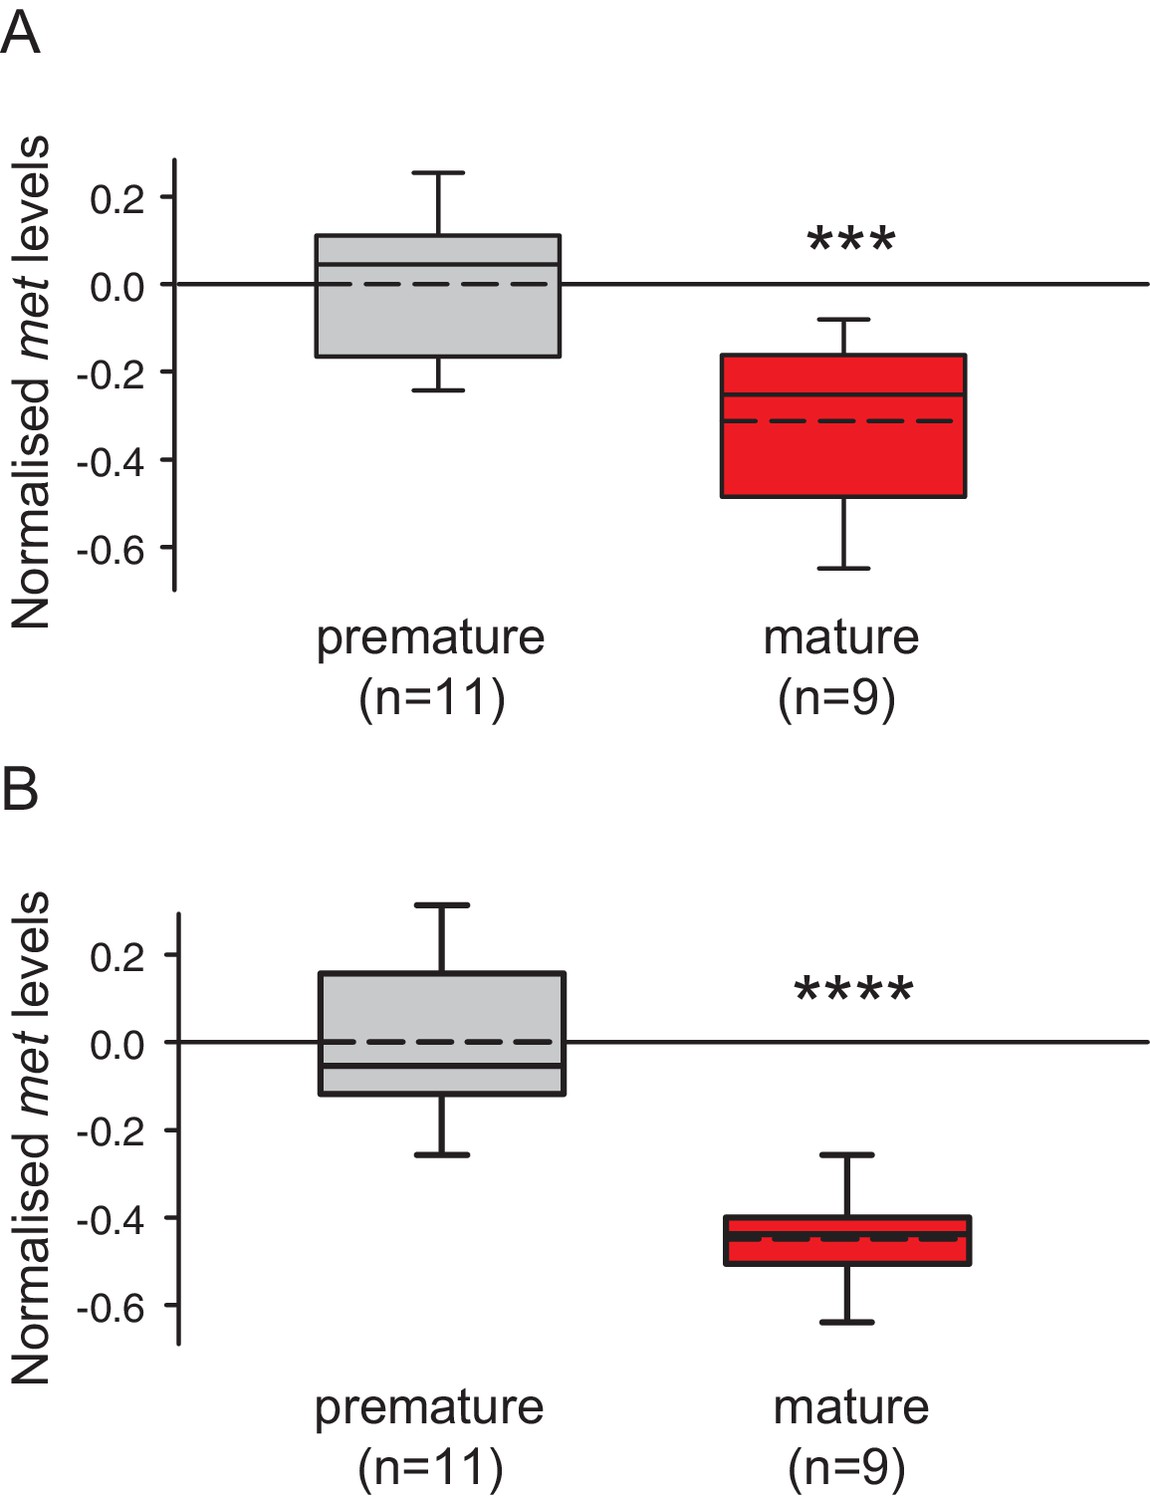
The choice of reference genes does not impact on the observed down-regulation of met.
The figure shows the same data as Figure 3C, but with the results for the individual reference genes plotted separately. The observed relative expression of met in eleocytes is independent of the reference gene used for normalisation (sams or cim6pr), (A) With sams used for normalisation, the expression levels of met in eleocytes from mature animals are ~30% lower than in the eleocytes from premature animals. (B) With cim6pr used for normalisation, the expression levels of met in eleocytes from mature animals are ~45% lower than in the eleocytes from premature animals. Boxes show the first and third quartile, the median (solid line), mean (dashed line) and the whiskers denote the 10th and 90th percentile. Statistical tests as in Figure 3C. ***p<0.001, ****p<0.0001. Raw data provided in Figure 3—source data 1.
Figure 4 with 1 supplement
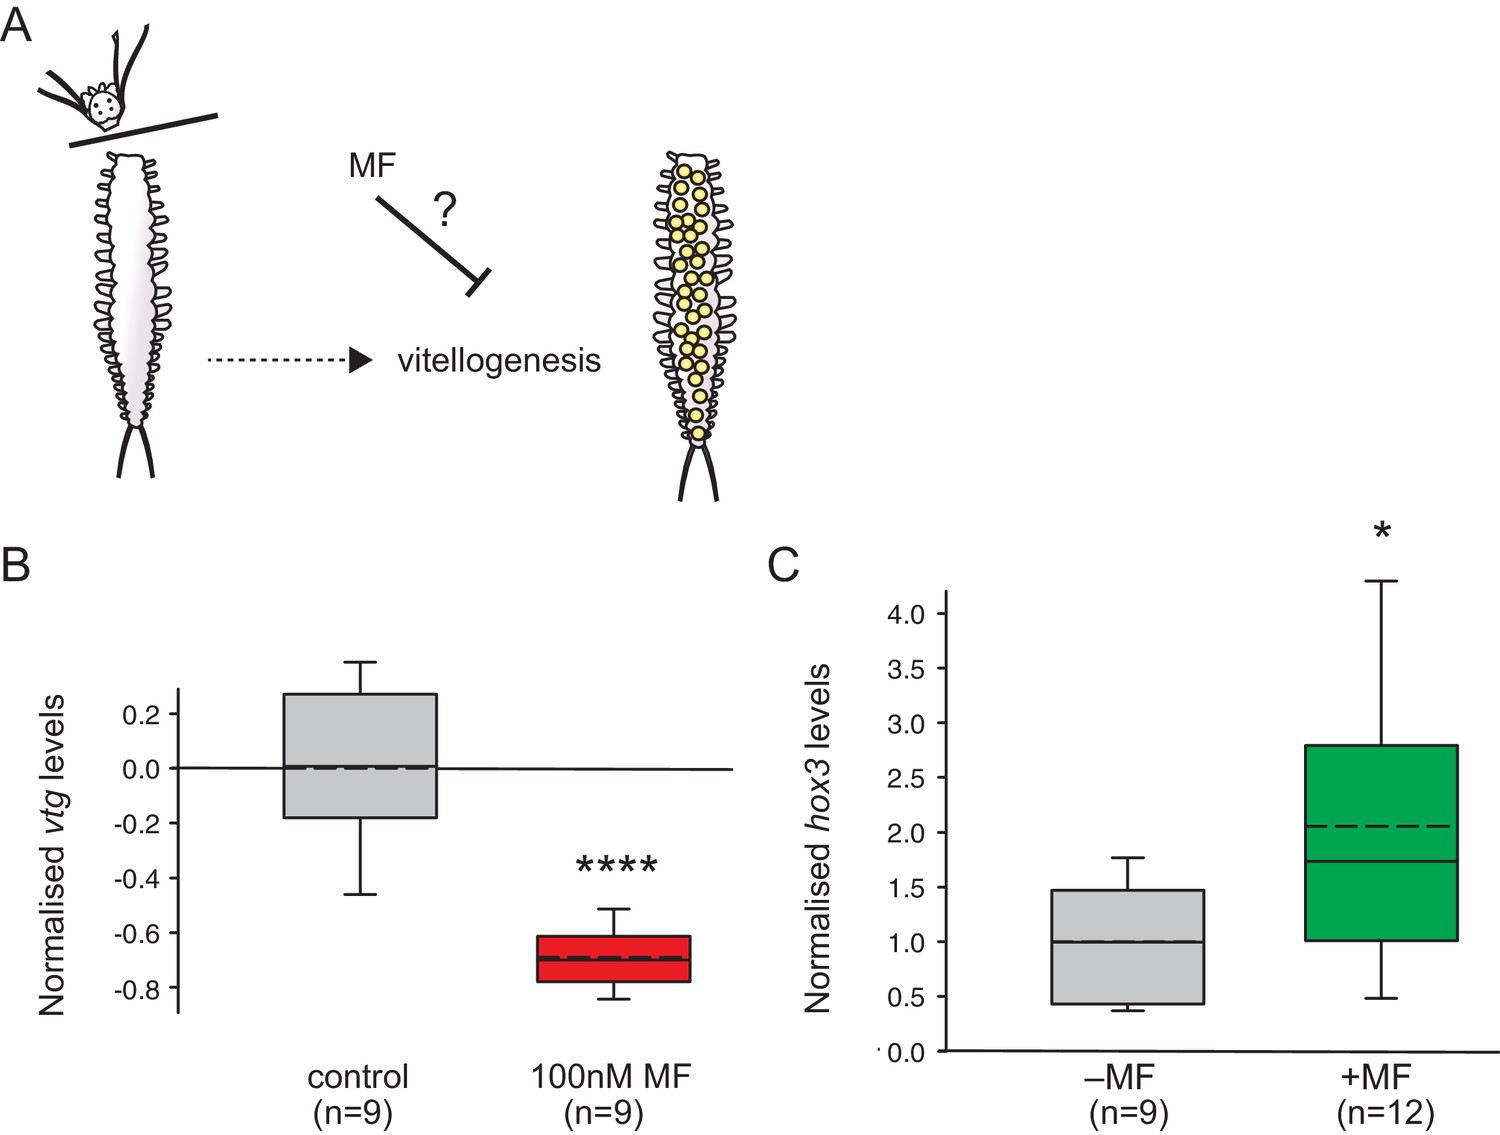
MF also represses vtg expression in vivo, and sustains expression of a marker for caudal growth upon posterior amputation.
(A) Setup of experiment testing the ability of MF to interfere with vitellogenesis in vivo. Following decapitation, female individuals are known to start vitellogenesis, reflecting loss of nereidin; treatment with MF tests if the repressive effect of nereidin on vtg observed in primary cultures of coelomic cells also occurs in the normal context of these cells. (B) qRT-PCR analysis of vtg expression in decapitated animals 5 days after decapitation. The animals were either treated with 0.1% DMSO (control) or in 100 nM MF in 0.1% DMSO for five days. Expression levels of vtg upon presence of MF are ~70% lower than in treated animals. vtg levels were related to the arithmetical mean of the reference genes rps9 and sams and normalised to the vtg-expression level of the control. (C) MF sustains expression of hox3, a marker diagnostic for caudal regeneration. qRT-PCR analysis of hox3 expression in Platynereis fragments 5 days after posterior amputation. Headless worm fragments treated with 100 nM MF in 0.1% DMSO (right) show twice as high levels of hox3 than headless control fragments (left) only treated with 0.1% DMSO. Hox3-expression is relative to that of the arithmetical mean of the reference genes rps9 and sams and normalised to the hox3-expression level of the untreated samples. (B,C) Boxplots show the first and third quartile, the median (solid line), and the mean (dashed line). Whiskers denote the 10th and 90th percentile. Statistical significance was tested by a one-sided (B) and a two-sided t-test (C), respectively. *p<0.05. ****p<0.0001. n: number of biological replicates. Raw data for panels B,C provided in Figure 4—source data 1.
-
Figure 4—source data 1
Data for the graphs in Figure 4B and Figure 4C (vtg/hox3 expression levels normalised to the respective control treatment).
- https://doi.org/10.7554/eLife.17126.020
Figure 4—figure supplement 1

The choice of reference genes does not impact on the observed down-regulation of vtg.
The figure shows the same data as Figure 4B, but with the results for the individual reference genes plotted separately. The observed relative expression of vtg in whole animals treated with either with 0.1% DMSO (control) or 100 nM MF in 0.1% MF (100 nM) is independent of the reference gene used for normalisation (rps9 or sams). (A) With rps9 used for normalisation, the expression levels of vtg are ~65% lower in treated animals than in the control group. (B) With sams used for normalisation, the expression levels of vtg are ~75% lower in treated animals than in the control group. Boxes show the first and third quartile, the median (solid line), mean (dashed line) and the whiskers denote the 10th and 90th percentile. Statistical tests as in Figure 4B. ****p<0.0001. Raw data provided in Figure 4—source data 1.
Figure 5
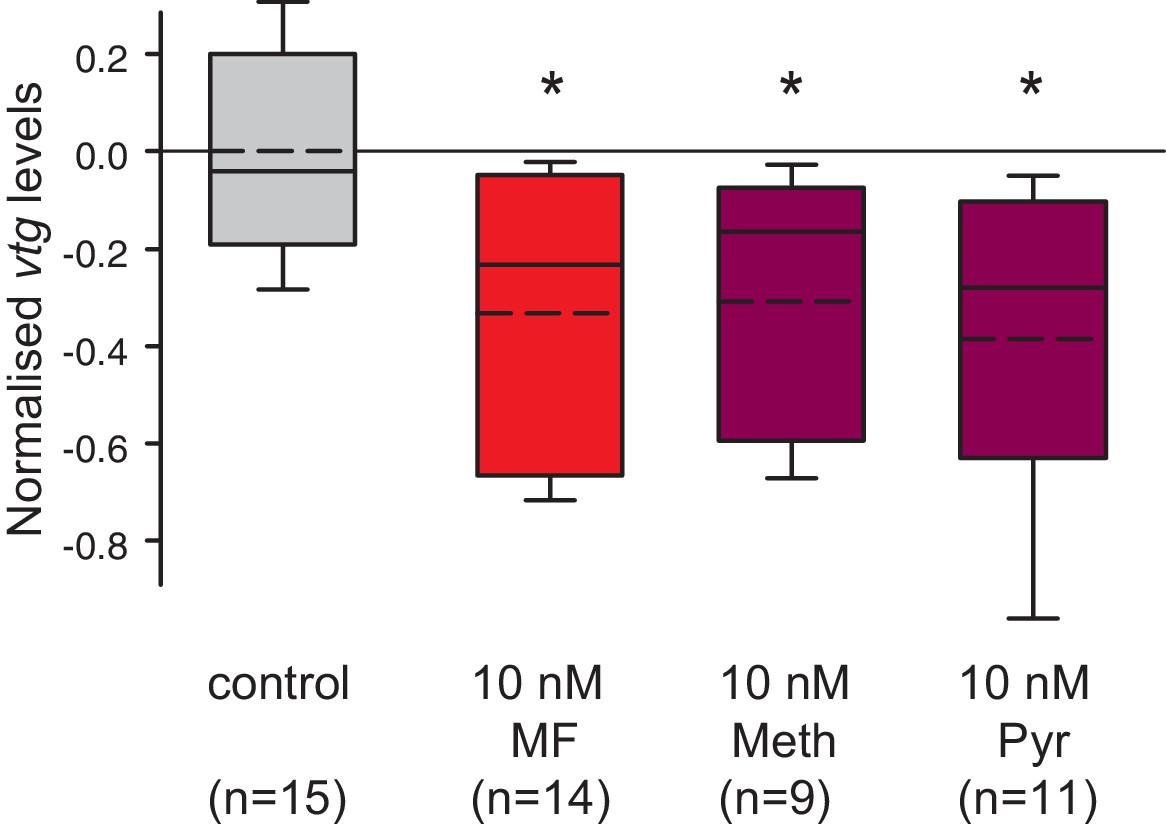
Vitellogenin expression in worm coelomocytes is suppressed by the hormone agonists methoprene and pyriproxyfen that are considered to act exclusively on insects.
Expression levels of vtg in coelomocytes are significantly down-regulated by treatment with 10 nM methoprene (Meth) and 10 nM pyriproxyfen (Pyr) in 0.01% DMSO. The graph shows qRT-PCR quantification of vtg levels after over night (20 hr) treatment of primary coelomocyte cultures; expression levels are relative to those of the reference gene rps9 and are normalised to the vtg-expression level of the control (DMSO-treated cells). The Boxplots show the first and third quartile, the median (solid line), and the mean (dashed line). Whiskers denote the 10th and 90th percentile. Statistical significance was tested first by an ANOVA, followed by a two-sided t-test with adjustment of the p-values for multiple testing to assess differences between the different groups. *p<0.05. n: number of biological replicates. Raw data provided in Figure 5—source data 1.
-
Figure 5—source data 1
Data for the graph in Figure 5 (vtg expression levels normalised to the control treatment).
- https://doi.org/10.7554/eLife.17126.023
Tables
Table 1
List of primers used for qRT-PCR, including predicted melting temperature.
Name | Sequence 5’→3’ | Tm / °C | Efficiency |
|---|---|---|---|
Pdu vtg qPCR1 F | ACAGGCCATCACATTCACAA | 56.4 | 101% |
Pdu vtg qPCR1 R | TCTGCTCACGTCTCTTTCCA | 58.4 | |
Pdu met qPCR1 F | GGATGATTATGATGTATACCTGCAAC | 62.9 | 102% |
Pdu met qPCR1 R | AGACCGAACTGGCGTTTG | 56.3 | |
Pdu hox3 qPCR1 F | CTACCCCTGGATGAGGGAAT | 60.5 | 95% |
Pdu hox3 qPCR1 R | ACTTCCGGTTCCTGGTCC | 58.4 | |
Pdu rps9 F | CGCCAGAGAGTTGCTGACT | 59.5 | 102% |
Pdu rps9 R | ACTCCAATACGGACCAGACG | 60.5 | |
Pdu sams qPCR1 F | CAGCAACGGTGAAATAACCA | 56.4 | 101% |
Pdu sams qPCR1 R | CATCACTCACTTGATCGCAAA | 57.5 | |
Pdu cim6pr qPCR1 F | ACTTCCCCTGCTGATGAGTG | 60.5 | 99% |
Pdu cim6pr qPCR1 R | TTCGTAAGTCAGGTTTCCATTG | 58.4 | |
Pdu cdc5 F | CCTATTGACATGGACGAAGATG | 60.1 | 100% |
Pdu cdc5 R | TTCCCTGTGTGTTCGCAAG | 57.5 |
Table 2
List of primers used for cloning and sequence validation.
Name | Sequence 5’→3’ | Tm / °c |
|---|---|---|
Pdu vtg 1F | ATGAAGACTCTCCTGATCTTCG | 60.1 |
Pdu vtg 1R | CTAGTAGTAGAATCTTGGTCCTTCAC | 64.6 |
Pdu vtg_seq 1F | AGCCCTAGAAGCTGCCTCTG | 62.5 |
Pdu vtg_seq 2F | ATTGCTCAATCTGAACTCCCATGC | 63.6 |
Pdu vtg_seq 3F | GCTGTTCCACAGGAAATTGC | 58.4 |
Pdu vtg_seq 4F | GCTTTGGTCAGTGGACTTCC | 60.5 |
Pdu vtg_seq 1R | GGCAATCCTCTGATGTAAACATTCTC | 64.6 |
Pdu vtg_seq 2R | CAAGCGTTTCACGACCAAGAGG | 64.2 |
Pdu vtg_seq 3R | GAAGAGCTTCTTGCTGGAGC | 60.5 |
Pdu vtg_seq 4R | AAGACCAGCTGGCGCGTTATG | 63.2 |
Pdu met F | ATGGAGCCGAATTCGGAGCAGAATTCGG | 71.8 |
Pdu met R | TCAACATGTCTCAGTTTCTTTTTGAGCG | 65.6 |
Pdu hox3 F | CCCCGGGGCTCTTGGTTTT | 61.6 |
Pdu hox3 R | GCCATCTCTATTCTCCTCGGCCG | 68.3 |
Download links
A two-part list of links to download the article, or parts of the article, in various formats.
Downloads (link to download the article as PDF)
Open citations (links to open the citations from this article in various online reference manager services)
Cite this article (links to download the citations from this article in formats compatible with various reference manager tools)
Discovery of methylfarnesoate as the annelid brain hormone reveals an ancient role of sesquiterpenoids in reproduction
eLife 5:e17126.
https://doi.org/10.7554/eLife.17126


