Kinase-dead ATM protein is highly oncogenic and can be preferentially targeted by Topo-isomerase I inhibitors
- Institute for Cancer Genetics, Columbia Unviersity, United States
- Columbia University, United States
- University of California San Diego, United States
- Saint Louis University School of Medicine, United States
Figures
Figure 1 with 1 supplement
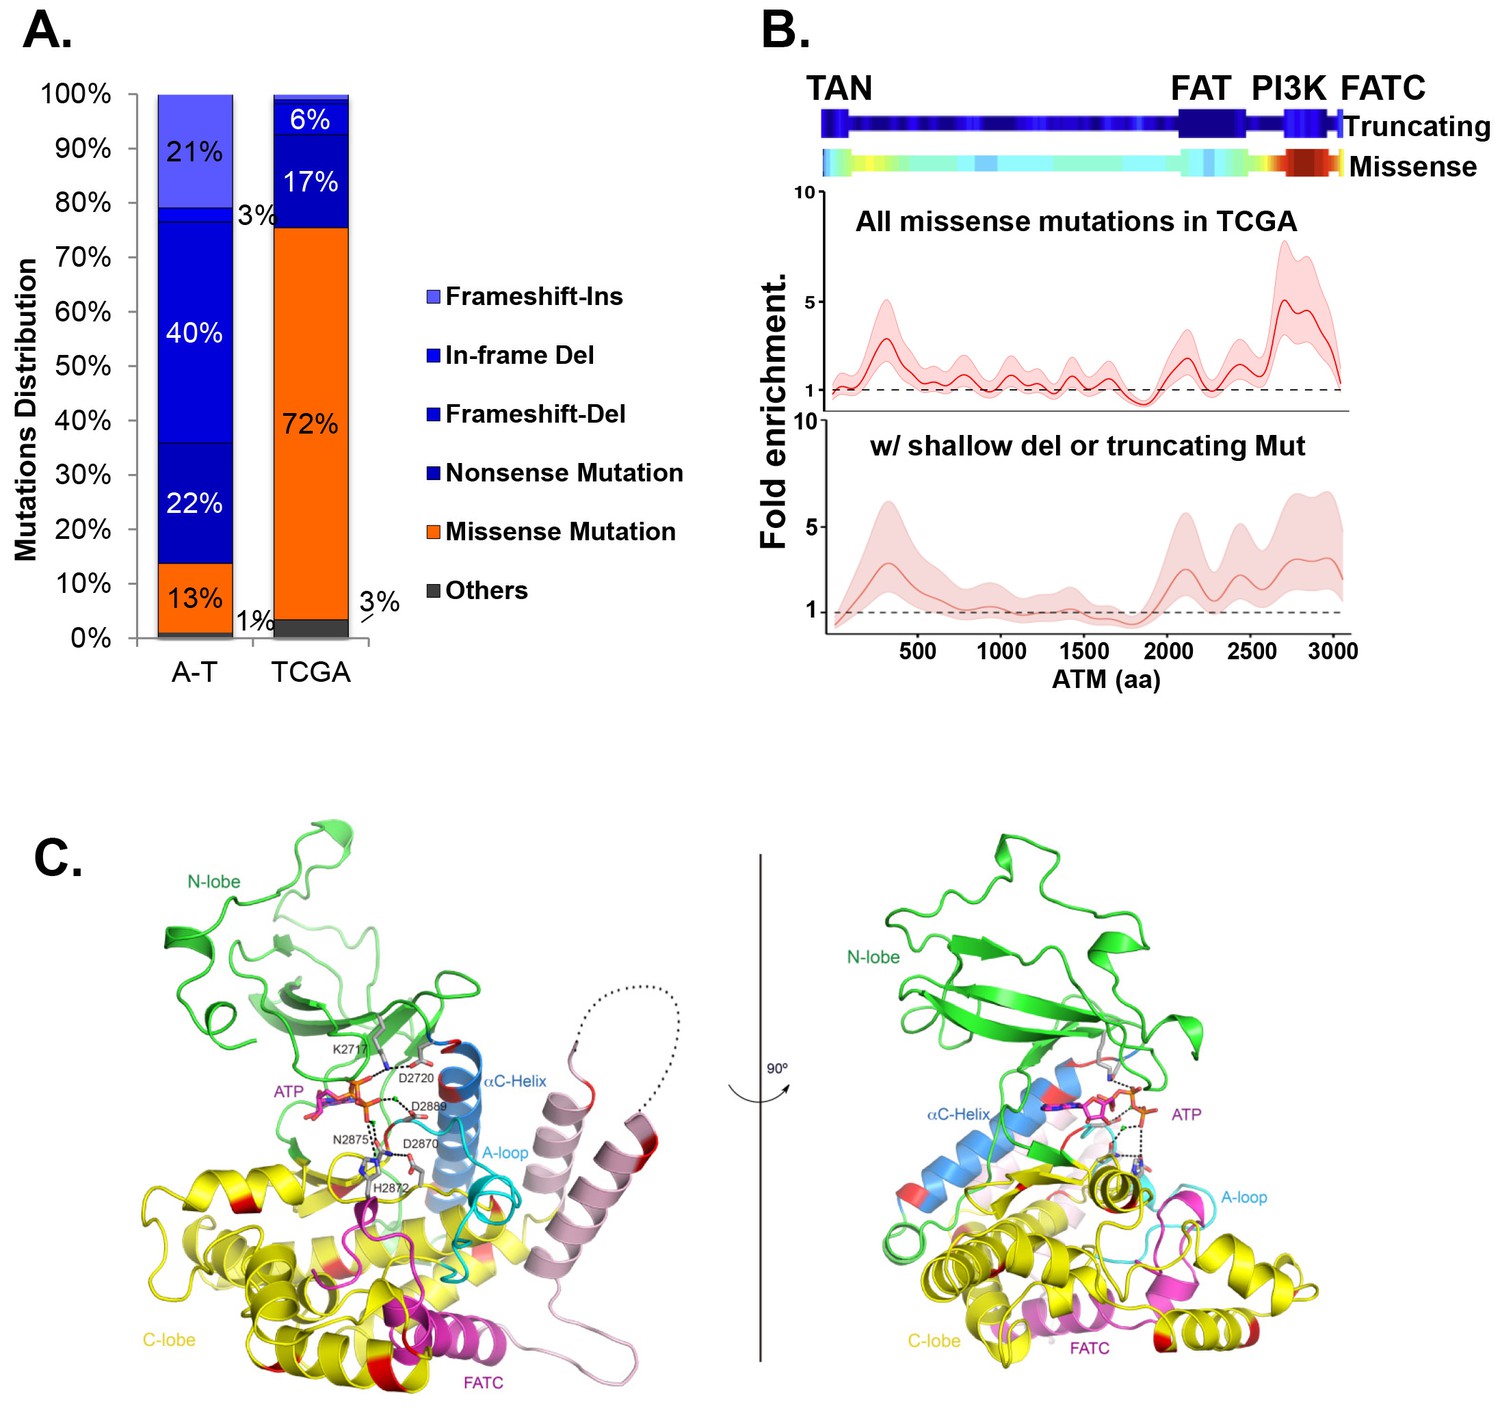
Cancer-associated ATM mutations are enriched for kinase domain missense mutations.
(A) Classification of unique and nonsynonymous mutations reported for A-T patients (n > 1000) in the Leiden open variable database (http://chromium.lovd.nl/LOVD2/home.php?select_db=ATM) (Supplementary file 1A) or unique mutations from 5402 cancer cases in TCGA (Supplementary file 1B). 'Others' includes splice-site and stop codon mutations. (B) Heatmaps for the frequency of cancer-associated truncating mutations (upper panel) or nonsynonymous substitutions (missense) mutations (lower panel) along the human ATM polypeptide obtained using Gaussian kernel based analyses (see Materials and methods). Warmer colors indicate denser mutation distribution. The shadowed curves in the middle and the bottom panel reflect the ratio of actual over expected mutation frequencies, calculated by Gaussian kernel method in all TCGA ATM missense mutations (middle) or only missense mutations with concurrent shallow deletion/truncating mutations (bottom). The confidence intervals (shadows) are estimated by fitting a binomial distribution (see Materials and methods). The dashed line at 1 represents the expected rate of mutations. The x-axis is the amino acid number (from 1–3057, including stop code) along the human ATM protein. (C) Homology model of the human ATM kinase domain is shown in two views rotated by 90°. The N-lobe (aa 2640–2774) is shown in green; the C-lobe (aa 2775–3057,) is shown in yellow; the activation loop (aa 2883–2907) is shown in cyan; the FATC domain (aa 3029–3056) is shown in purple and the ka9b (aa 2942–2956) and ka10 (aa 3002–3026) is shown in pink. The αC-helix (aa 2722–2741), which is a part of the N-lobe and contains residues critical for catalysis is shown in blue. ATP and residues critical for catalysis are shown in the stick model. Mg2+ ions are shown as spheres. The black dotted loops indicate the disordered region between ka9b and ka10. The amino acids that are conserved between human ATM and mTOR and mutated in TCGA cases are shown in red.
Figure 1—figure supplement 1
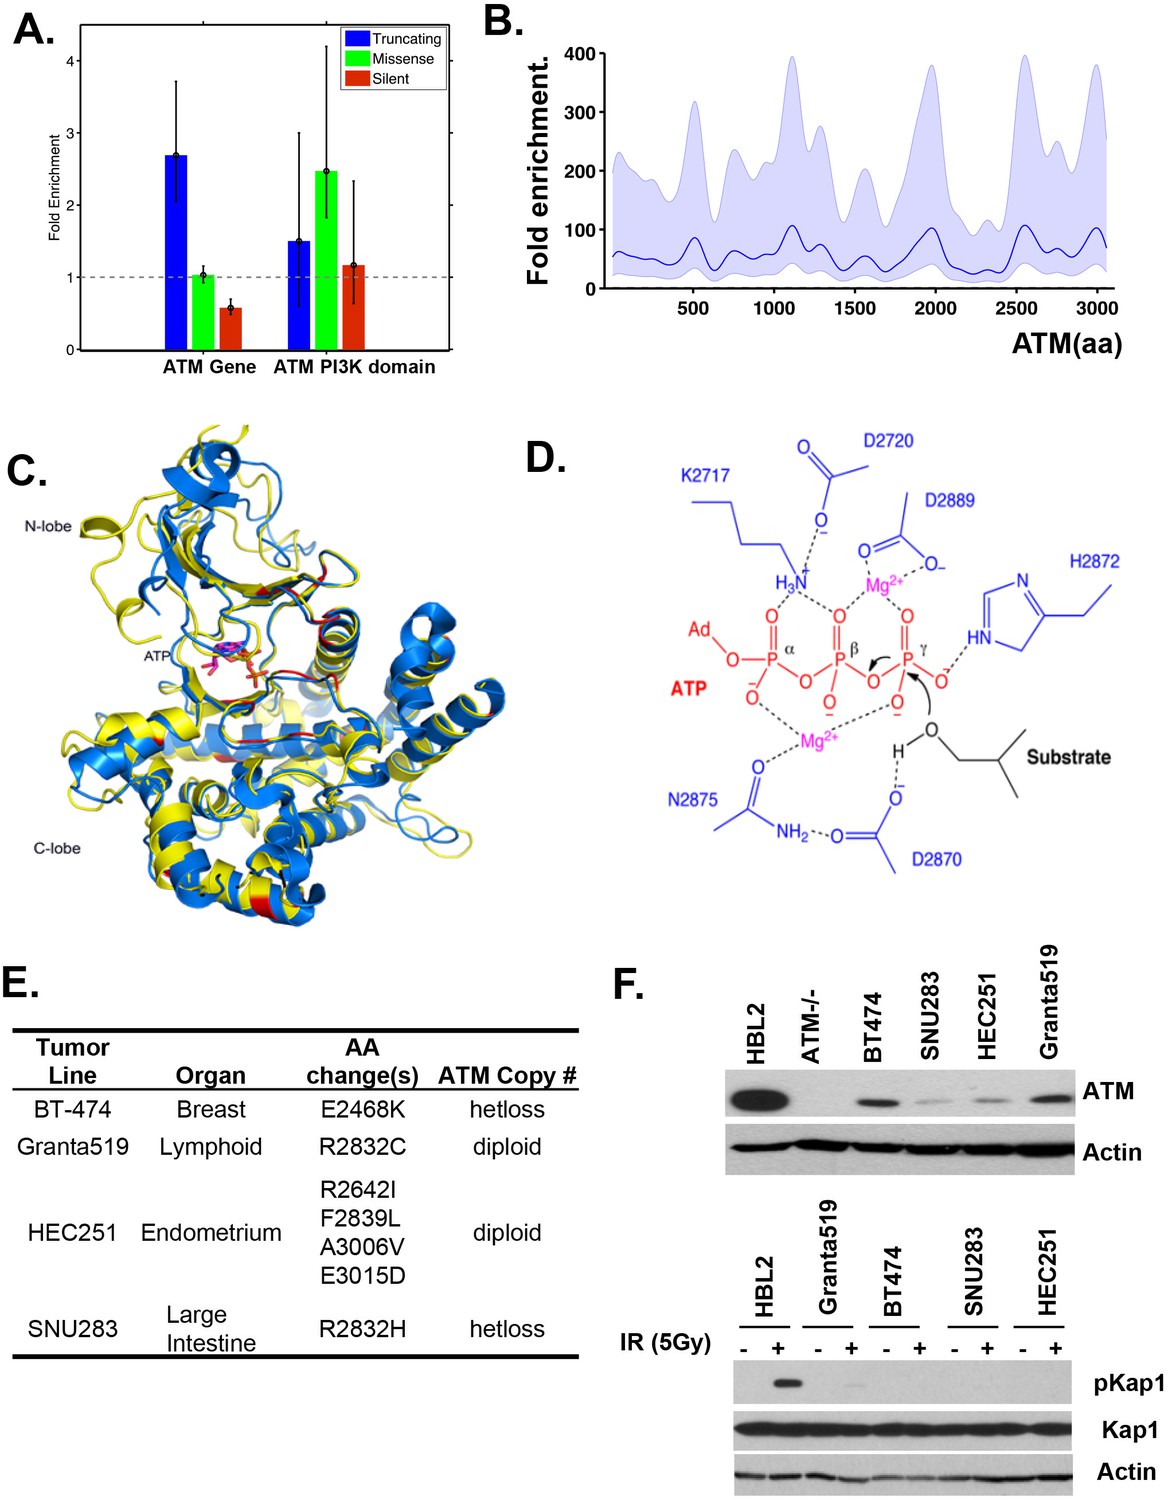
Cancer associated ATM mutations are enriched for kinase domain missense mutations that disrupt kinase activity.
(A) Permutation analyses of actual truncation or missense mutation frequencies within the ATM gene or within the ATM kinase domain over the expected mutation frequency based on the size of the gene and the frequency of non-synonymous mutation. The dash line marks the expected mutation rate. (B) The density distribution of truncation/frame shift mutations in A-T patients (see Figure 1B legend and method for more details). (C) Superposition of the human ATM model (yellow) and the crystal structure of human mTOR (blue) suggest close structural homology, especially around the catalytic center. Mutations conserved between ATM and mTOR are shown in red. (D) The active site architecture of human ATM predicted based on homology modeling is colored as follows: ATP is shown in red, Mg2+ ion is shown in purple, the catalytic residues from ATM are shown in blue and the substrate is colored black. (E) Table with the annotated ATM mutations in selected human cancer cells. (F) Western blots of total cell lysates harvested from the indicated human tumor lines for ATM (upper), and pKap1 (lower) with (+) or without (-) 5 Gy Irradiation (IR).
Figure 2 with 2 supplements
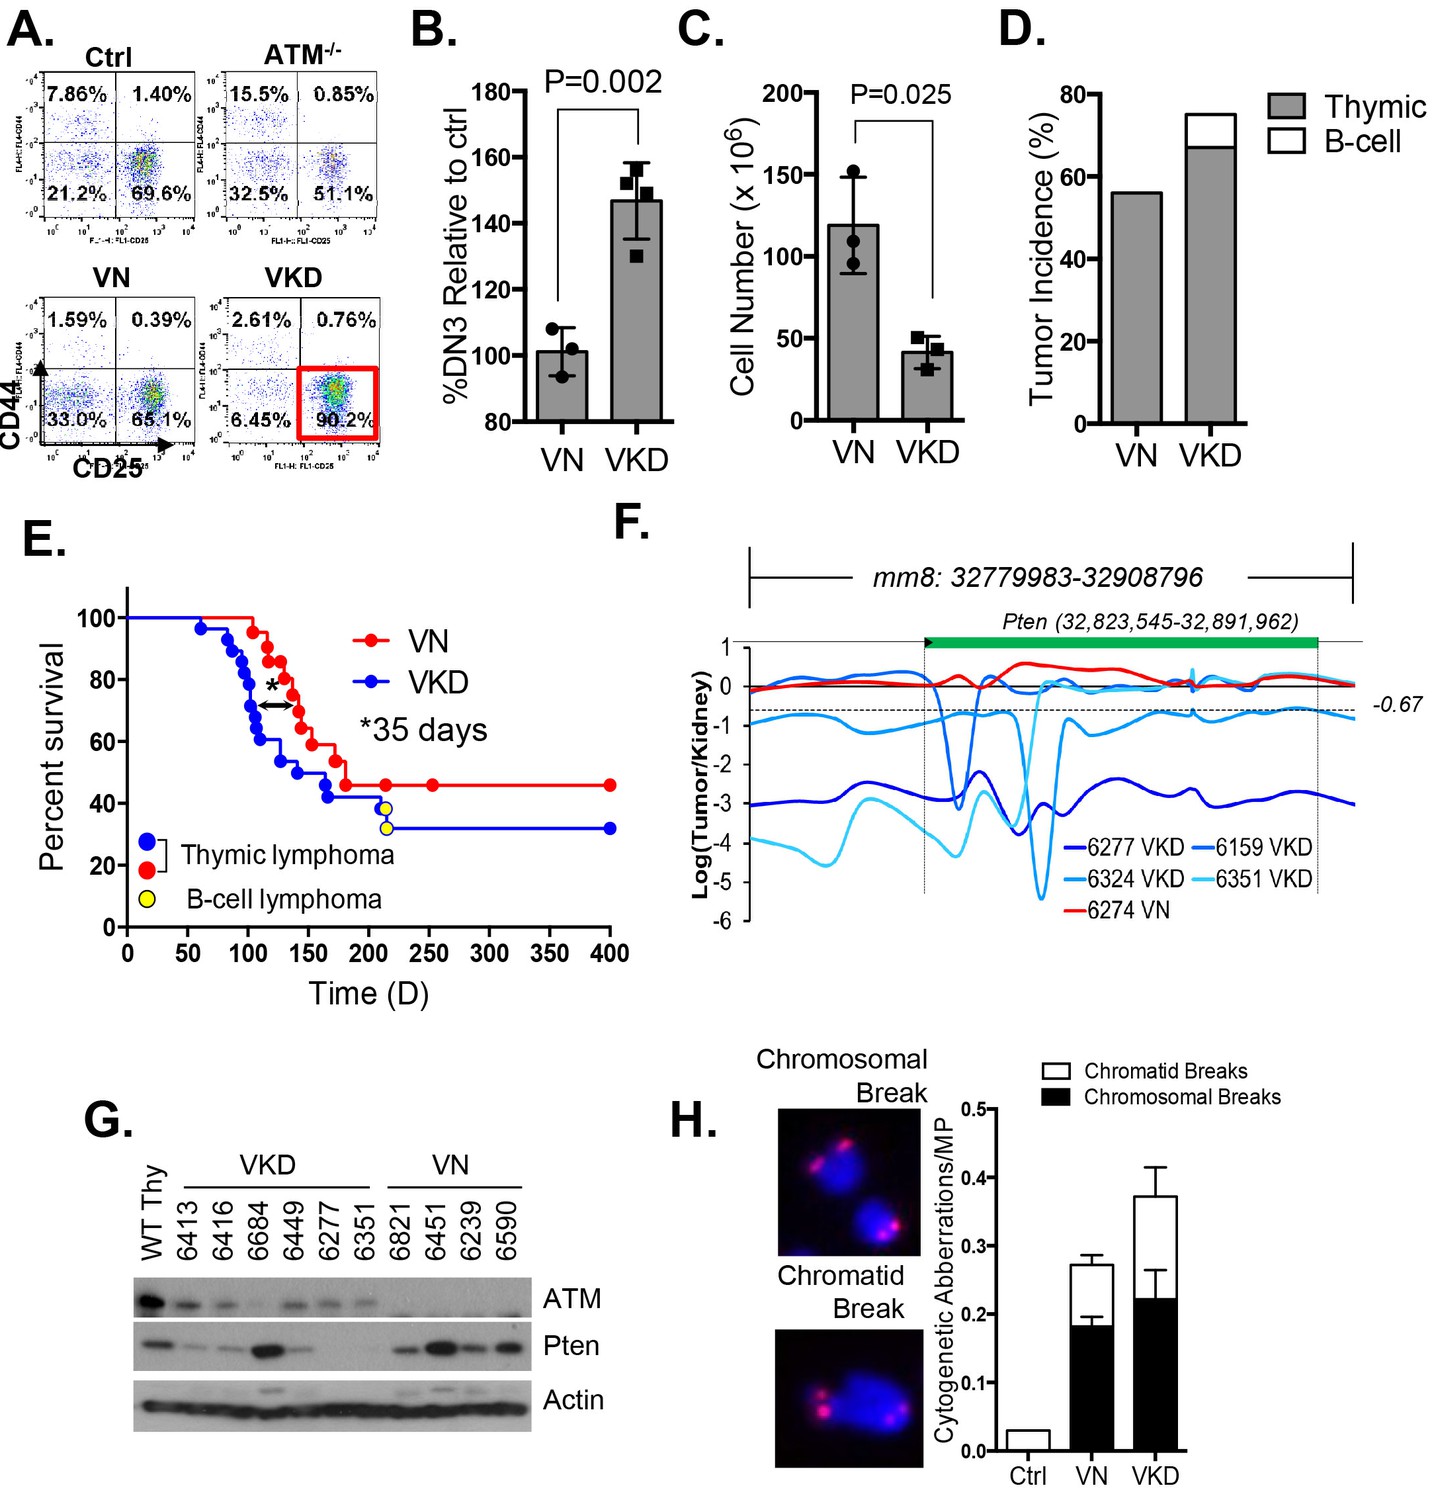
Expression of ATM-KD protein (AtmKD/-) is more oncogenic than loss of ATM (Atm-/-).
(A) Representative FACS analyses of DN thymocytes from 4-week old VavCre-AtmC/KD (Ctrl, littermate), germline Atm-knockout (Atm-/-), VavCre+AtmC/C (VN) and VavCre+AtmC/KD (VKD) mice. DN cells are defined as thymocytes negative for surface staining of CD8, CD4 and TCRγδ. (B) The average relative DN3% (CD44-CD25+) (among all DN thymocytes) in VN (n = 3) and VKD (n = 4) mice. The relative DN3% was calculated by normalizing to the absolute DN3% to the DN3% of control littermate VavCre- (cre negative) mice stained at the same time. The error bars represent SEMs. (C) The averages and standard SEMs of total thymocyte number from 4–8 weeks old VN (n = 3) and VKD (n = 3) mice. (D) The life time risk of B or T cell lymphomas in VN, VKD mice in 400 days. (E) Kaplan-Meier (K-M) survival curve of littermate matched VN (n = 18) and VKD (n = 24) mice. The red and blue dots denote thymic lymphomas from the VN and VKD cohorts, respectively. The yellow dots denote the B cell lymphomas in the VKD cohort. The T1/2 for thymic lymphoma is 139.5 days (VN) and 104.0 days (VKD). The asterisk marks the difference in T1/2 of thymic lymphoma development between the two cohorts. *p=0.03 per Mantel-Cox/log-rank test. (F) Copy number analyses of the region around Pten (chromosome 19, mm8: 32,779,983–32,908,796). The y-axis is the natural log ratio of tumor/kidney genomic DNA from the same mouse. Log ratio of −0.67 (dotted line) indicates heterozygous deletion. (G) Immunoblot of Pten, total Atm and β-actin for Atm+/+ (WT Thy), VKD, and VN thymic lymphomas. (H) Telomere FISH analyses of metaphases spreads from ConA activated T-cells (72 hr). Bar graphs represent the average and SEMs of the number of cytogenetic aberrations per metaphase (MP). All p-values in this figure were calculated using a two-tailed student’s t-test assuming unequal variances, unless otherwise noted.
Figure 2—figure supplement 1
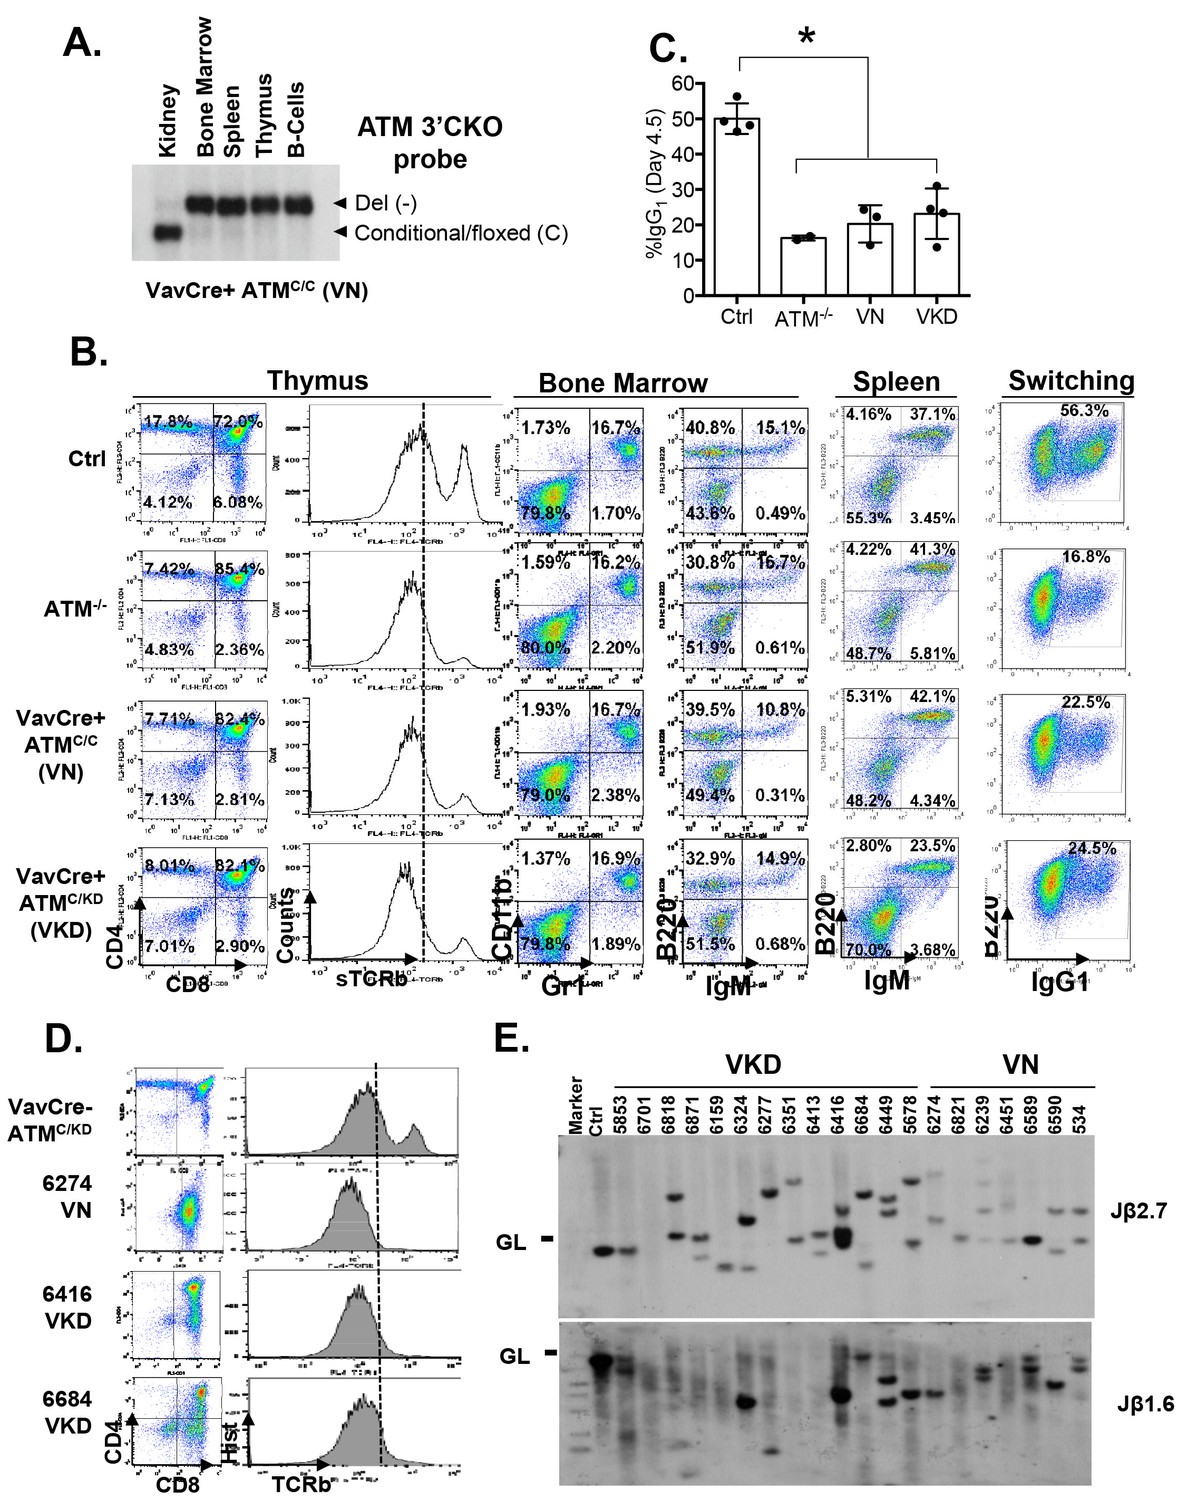
Lymphocyte development in VKD and VN mice.
(A) Southern Blot for the Atm conditional vs deleted allele in kidney, bone marrow, splenocytes, thymocytes and activated splenic B cells (CD43-, LPS stimulated) of a representative VN mouse, indicating complete deletion of Atm in lymphoid lineage. KpnI-digested genomic DNA was probed with ATMCKO3’ probe. (B) Representative FACS analyses of bone marrow, thymus and spleen show normal B cell and myeloid development, thymocyte development defects and CSR defects in VN and VKD mice. (C) Quantification of IgG1+% of purified B cells stimulated with LPS and IL-4 for 4.5 days. (D) FACS analyses of thymocytes harvested from VN and VKD mice with thymic lymphomas. The dash line marks the level of surface TCRβ expression in control thymocytes. (E) Southern blot analyses of thymocyte DNA digested with EcoRI and probed with TCRJβ1.6 and TCRJβ2.7 probes. Marker: Molecular Weight Marker. Ctrl: Kidney DNA harvested from a VavCre- AtmC/KD mouse, GL-Germline.
Figure 2—figure supplement 2
Analyses of the T cell lymphomas from VKD and VN mice.
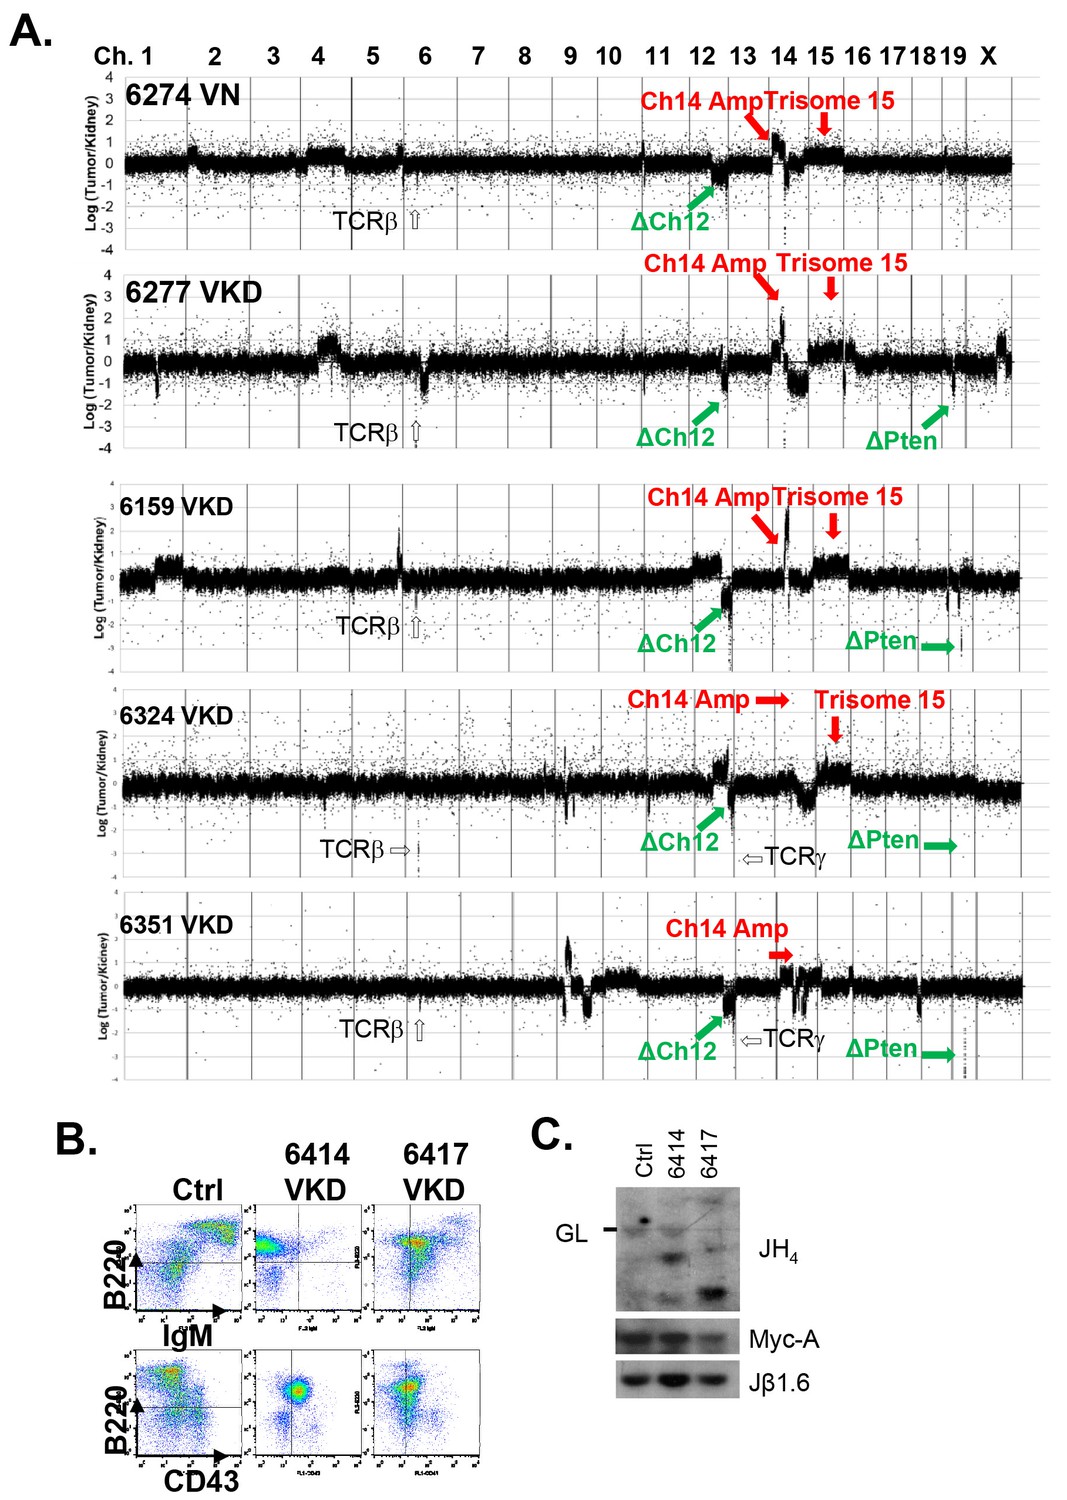
(A) CGH analyses of 4 VKD and 1 VN thymic lymphomas. The Y axis is the Log ratio (base 2) of tumor/kidney DNA from the same mouse. The red arrow heads indicate trisomy 15 and regions amplified on chromosome 14, and the green arrow heads point to the deletion in chromosomes 12 and the deletion around the Pten gene. Each chromosome is demarcated by gray lines, and the chromosome numbers are marked at the top of the CGH panels. (B) Representative FACS analyses of the splenocytes from control and two VKD mice with B-cell lymphomas. (C) Southern blot analyses of splenocyte DNA harvested from VKD mice with B-cell lymphomas digested with EcoRI and probed using JH4, Myc-A, and TCRJβ1.6 probes. Ctrl: Kidney DNA harvested from a VavCre- AtmC/KD mouse, GL-Germline.
Figure 3 with 1 supplement
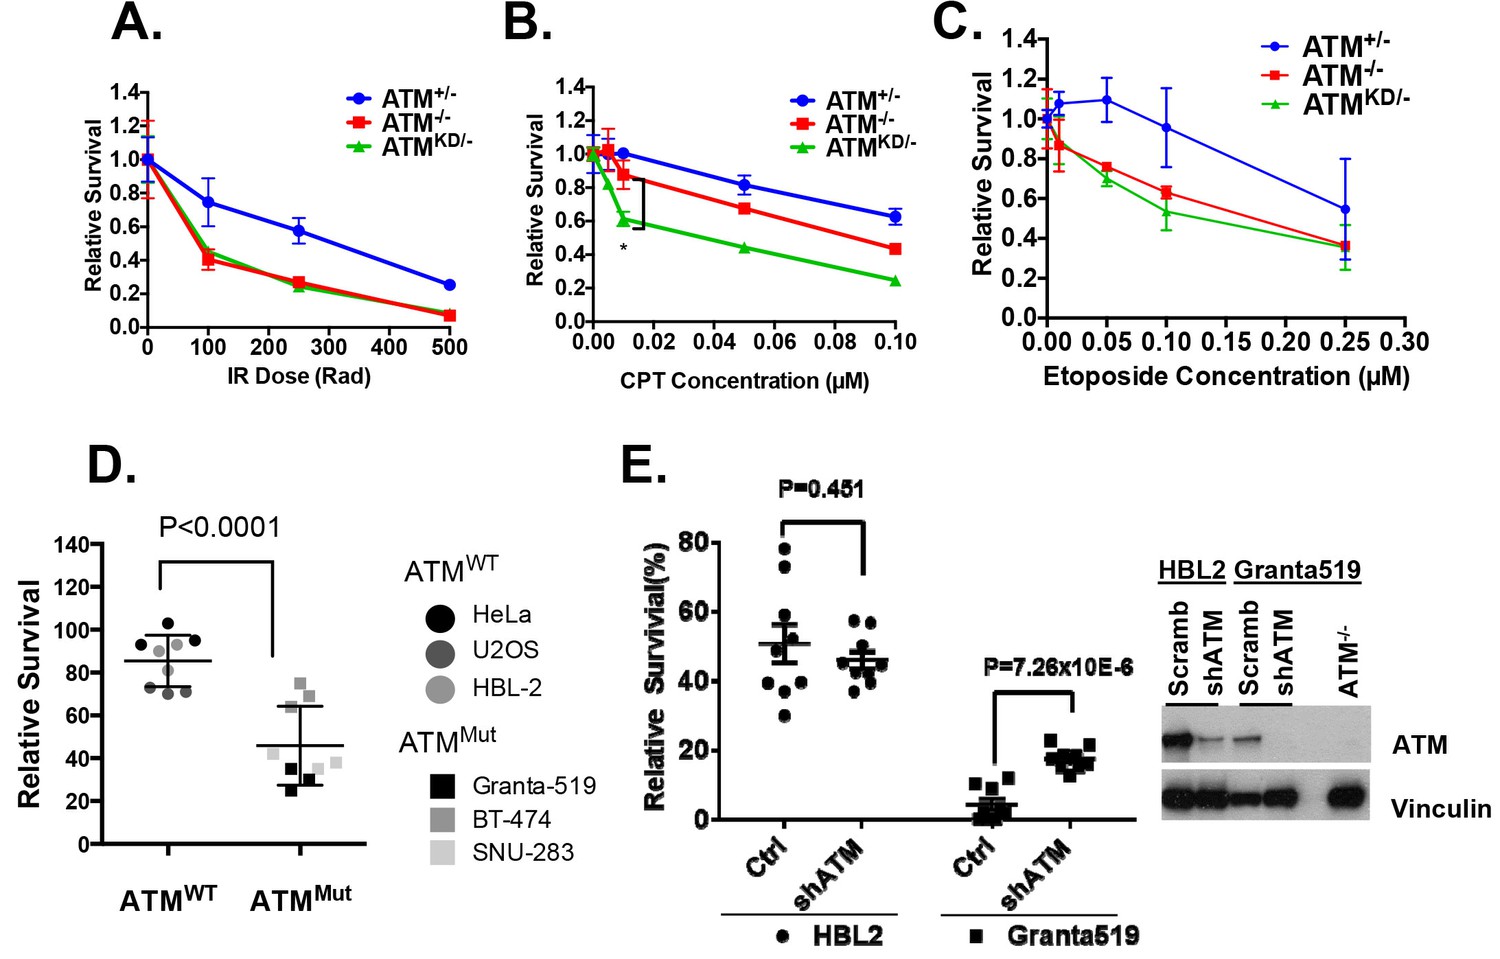
AtmKD/- murine embryonic fibroblasts (MEFs) and human cancer cell lines are hypersensitive to Topo isomerase I inhibitors in vitro.
Representative sensitivity plots of Atm+/-, Atm-/- and AtmKD/- MEFs to (A) IR, (B) Camptothecin (CPT) and (C) Etoposide. *p<0.001. At least three independent experiments on two independently derived MEF lines from each genotype were performed. (D) Sensitivity of 6 human tumor cell lines with wildtype (ATM+/+) or mutant ATM (ATMMut/- or Mut/Mut) to 2.5 nM CPT observed after 48 hr of treatment. (E) shRNA mediated knockdown of ATM in Granta591 human lymphoma cell lines rescued the CPT sensitivity in vitro (after 72 hr of 5 nM CPT treatment). Three independent experiments were performed. The p value were obtained based on student t-test.
Figure 3—figure supplement 1
Analyses of immortalized AtmKD/- and control MEFs.
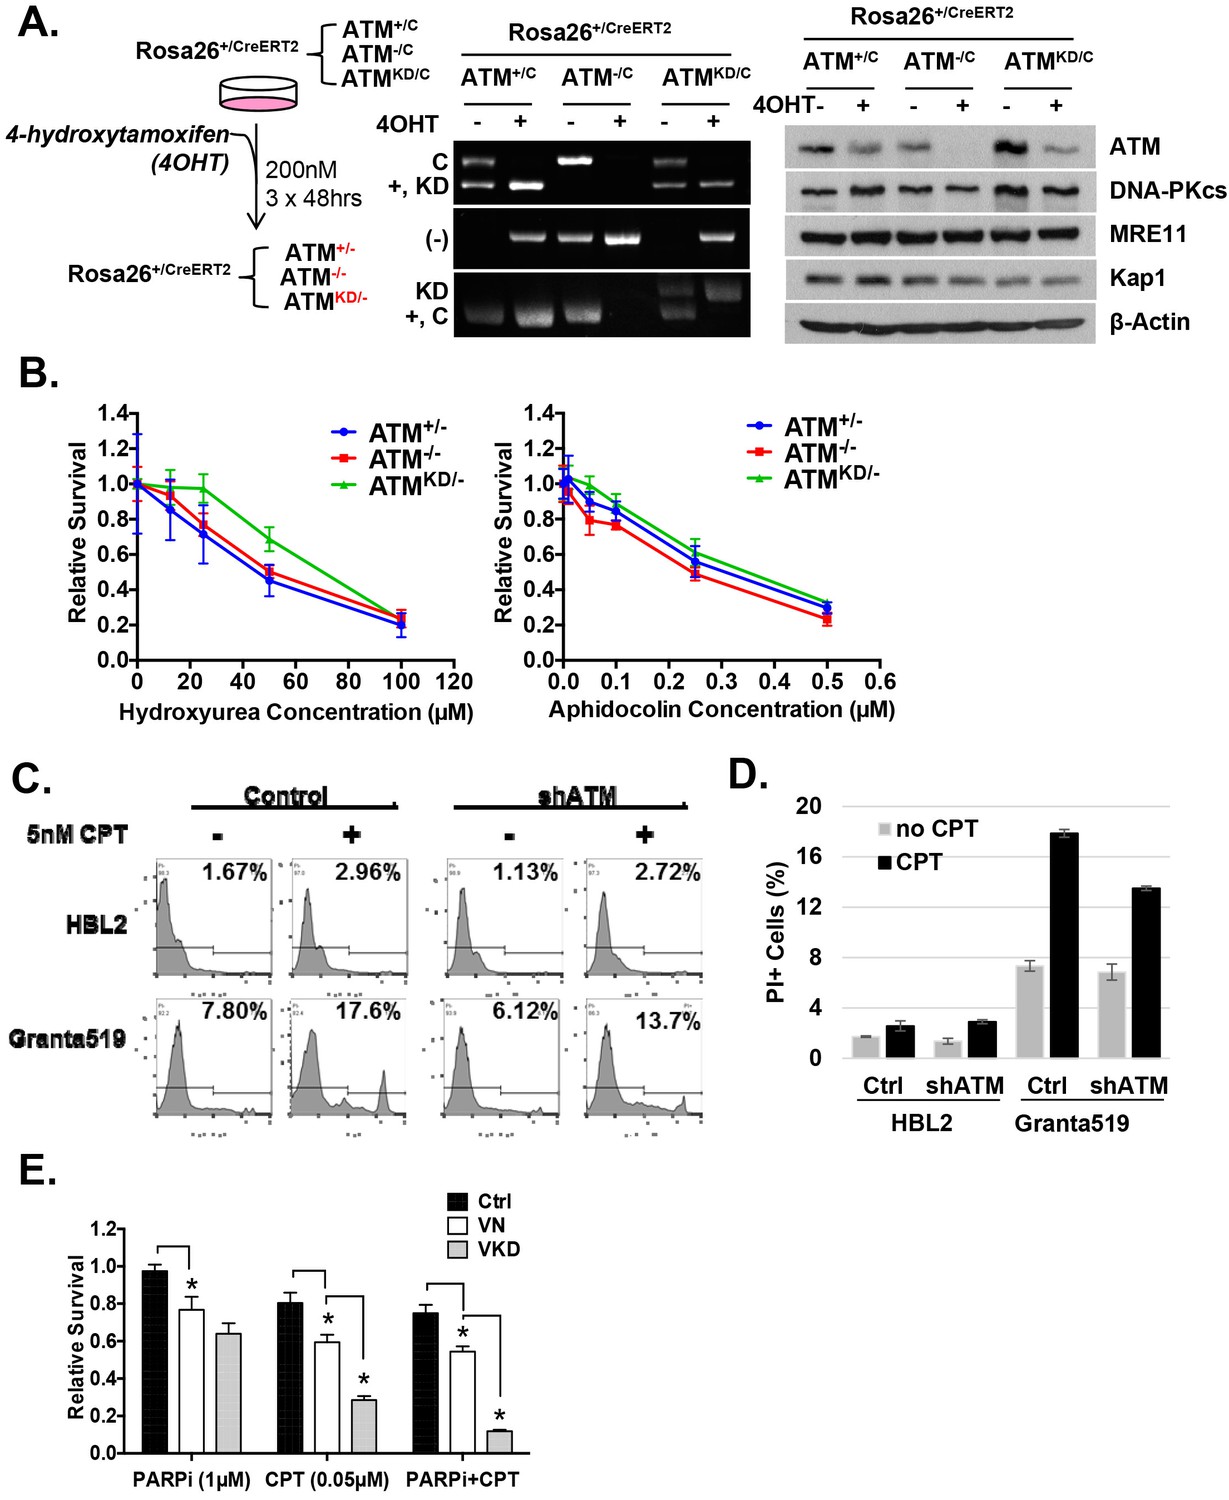
(A) Treatment scheme of immortalized Rosa-CreERT2 MEFs. PCR and Western blot analyses of the MEFs before and after three rounds of 4OHT treatment (200 nM, 48 hr each round) confirmed the efficient ATM deletion and the expression of kinase-dead ATM protein. The Western blot also shows the normal expression of DNA-PKcs, Mre11 and Kap1 in the AtmKD/- cells. (B) Representative result of the sensitivity assay for Hydroxyurea and Aphidocolin. See method section for details. (C) Representative FACS analyses for apoptotic cells (PI staining) in HBL2 and Granta591 cells with or without shRNA knockdown of ATM. (D) CPT (5 nM, 48 hr) induced apoptosis in HBL2 and Granta591 cells measured by PI staining. (E) Relative survival of ConcanavalinA (ConA)-activated purified (CD43+) splenic T-cells to Olaparib (PARPi, 1 µM) or CPT (0.1 µM), or the combination (PARPi+CPT). Cells were stimulated for 24 hr and exposed to drugs for another 48 hr and relative survival was determined by MTT assay.
Figure 4 with 1 supplement
AtmKD/- leukemia are hypersensitive to Topo isomerase I in vivo.
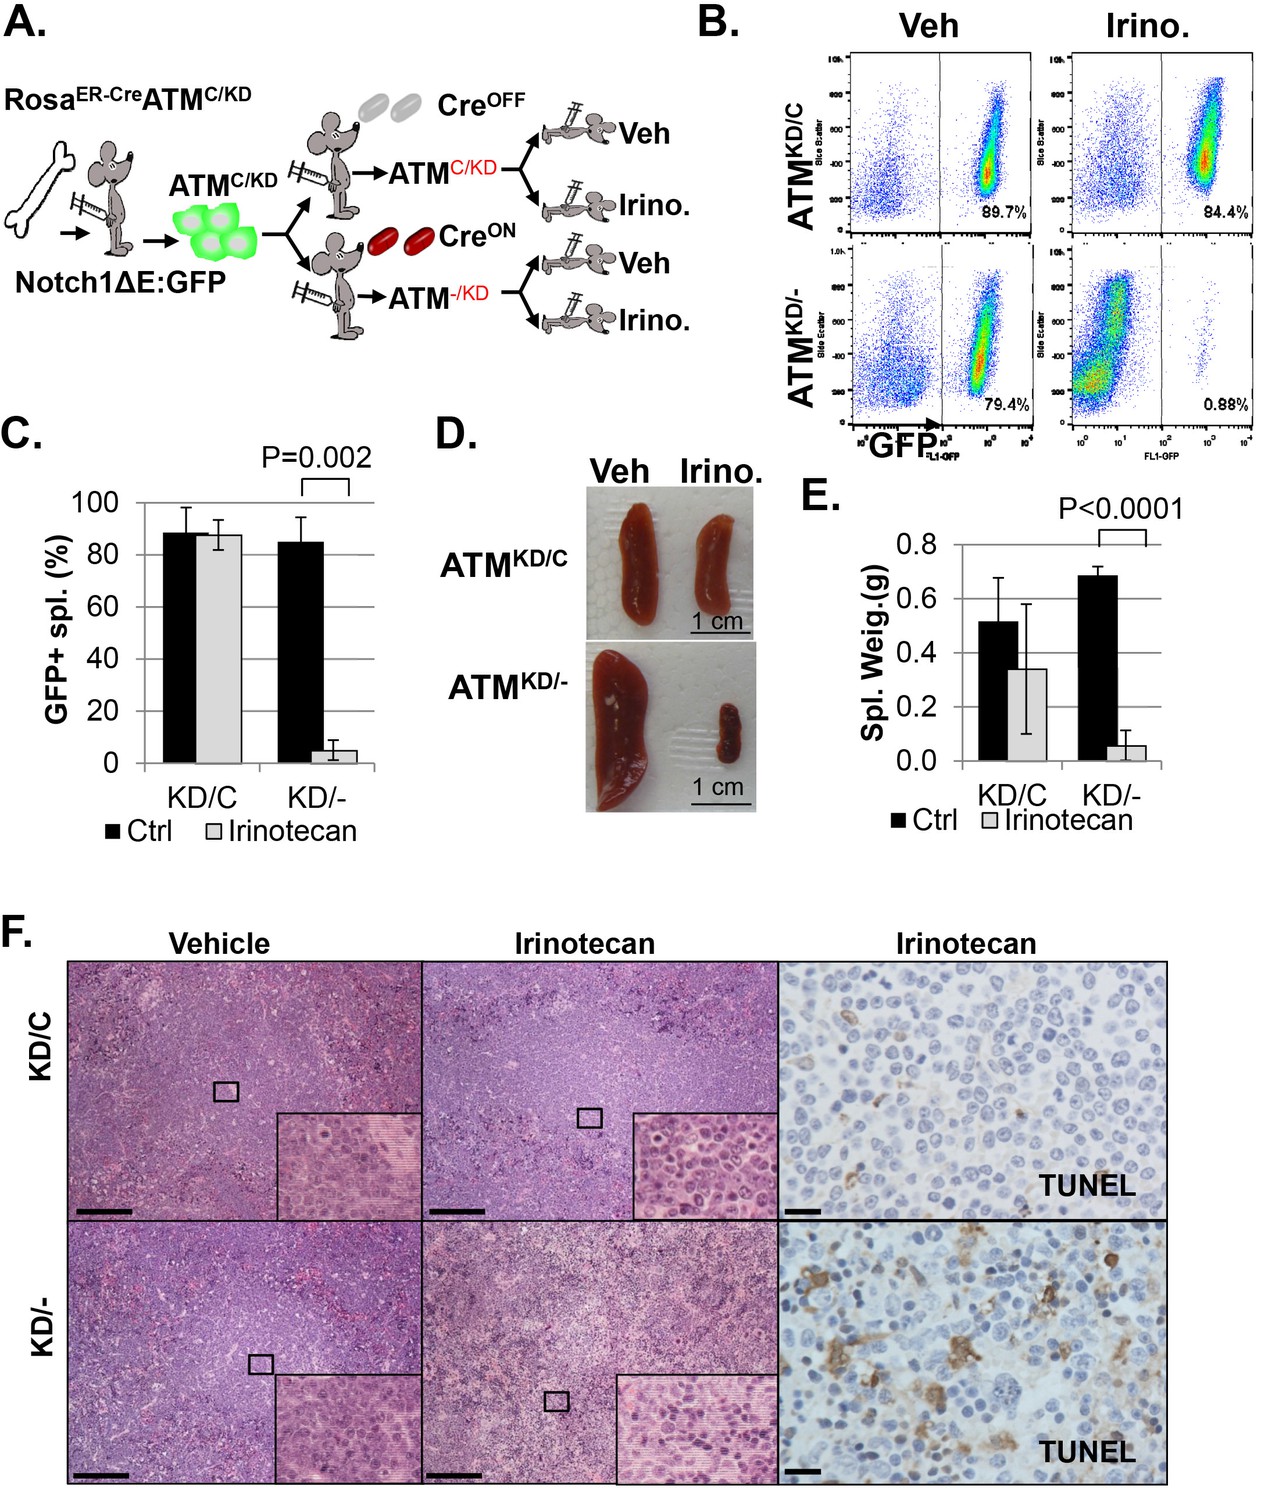
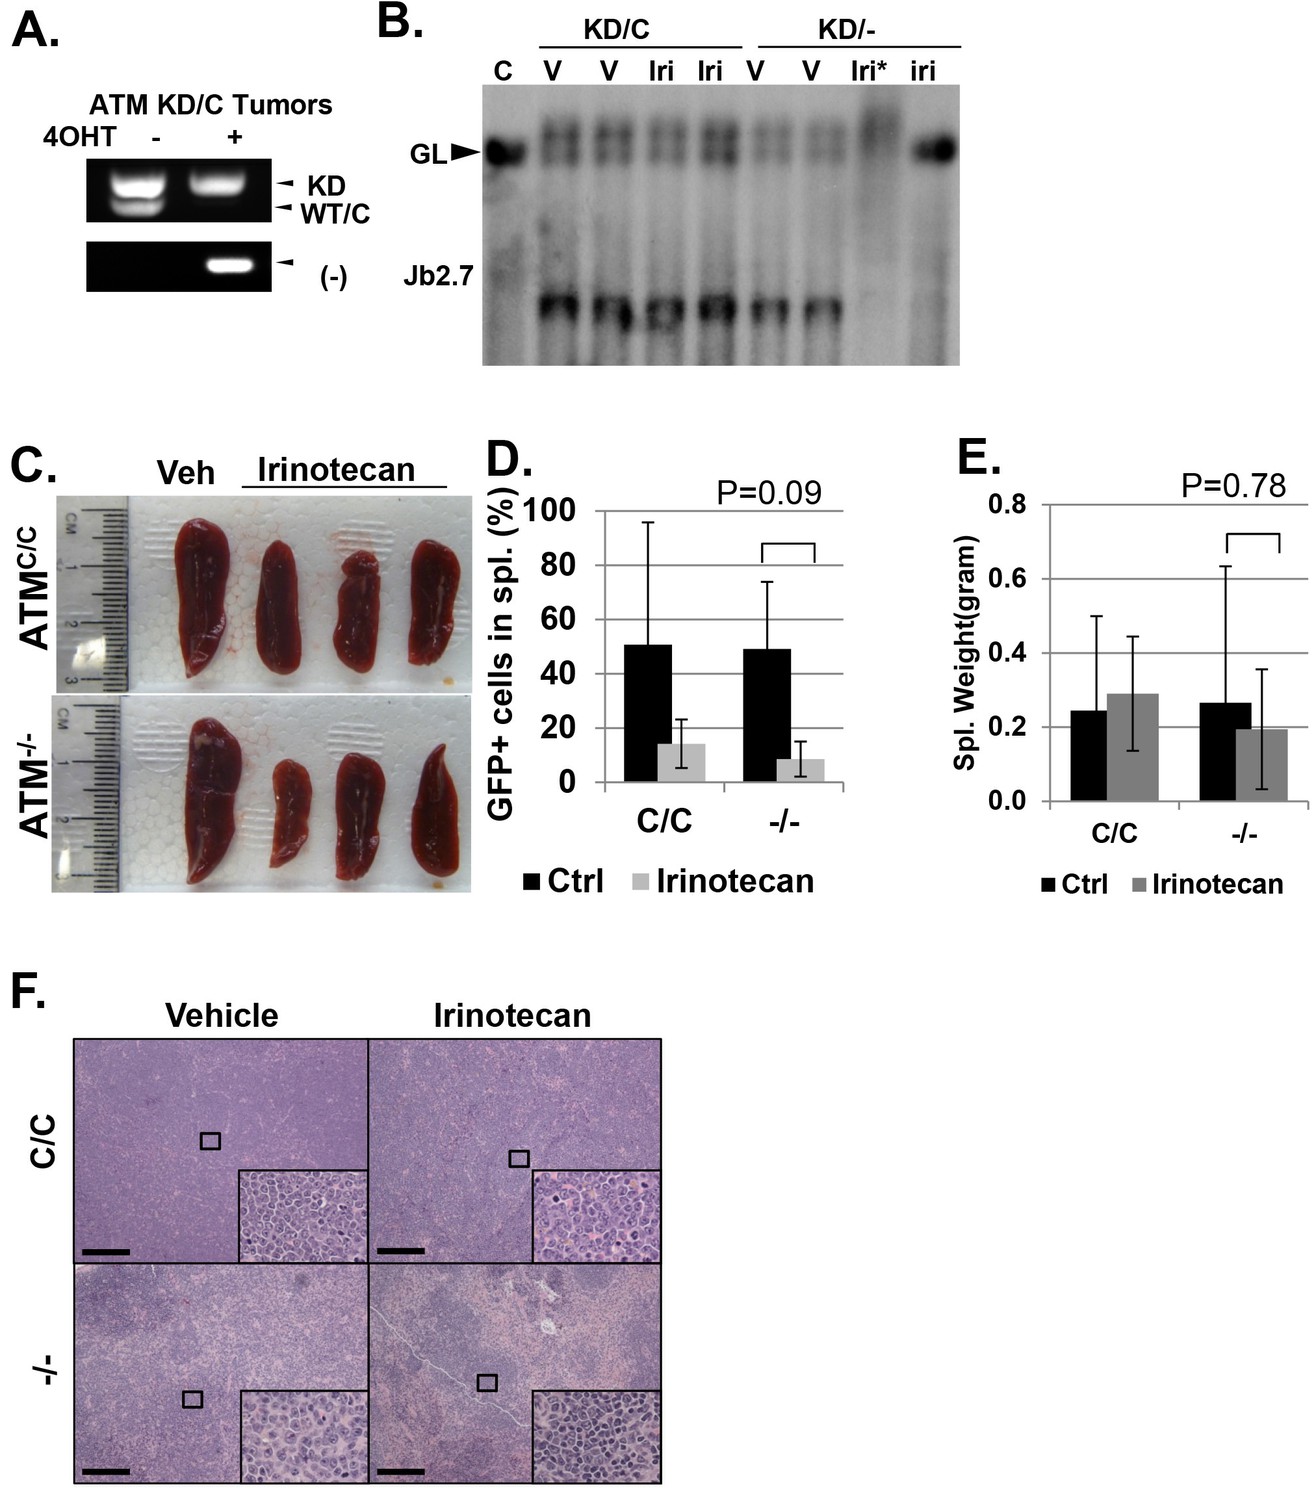
(A) Experimental scheme outlining the treatment of isogenic AtmKD/- and AtmKD/C leukemia in vivo. Please see on-line methods for details. Clonal Rosa+/CreERT2 AtmC/KD leukemia was established by transducing the bone marrow with activated Notch and GFP. Isogenic AtmKD/- or AtmKD/C leukemia were then established and confirmed in secondary recipients upon exposure to oral tamoxifen, which induces Cre nuclear translocation. 1 × 10^6 AtmKD/- and AtmKD/C leukemic blasts were injected into tertiary recipients, which were treated with daily doses of Irinotecan (10 mg/kg) or vehicle for 5 consecutive days. Representative FACS analyses for GFP+ leukemia blast (B) and pictures (D) of spleens from mice transduced with isogenic AtmKD/C or AtmKD/- leukemia and treated or not treated with irinotecan (Irino, 10 mg/Kg for 5 days). The untreated mice received vehicle (Veh). Quantification (Average ± SEMs) of GFP+% splenocytes (C) and spleen weights (E) of mice transduced with AtmKD/C or AtmKD/- leukemia and treated with either vehicle (black) or Irinotecan (grey) for 5 days. (F) Representative field of H&E (left 2 panels) and TUNEL-stained spleen sections Scale Bars: 200 µm (in H&E section), 20 µm (TUNEL).
Figure 4—figure supplement 1
Analyses of isogenic paired AtmKD/- vs AtmKD/C or Atm-/- vs AtmC/C leukemia.
(A) PCR confirming the AtmKD/- and AtmKD/C genotypes of the leukemia harvested from secondary recipients after the tamoxifen treatment. (B) Southern blot using the Jβ2.7 probe on AtmKD/- and AtmKD/C tumors harvested after vehicle (V) or Irinotecan (Iri) treatment. *denoted degraded DNA. Spleens from Irinotecan treated mice with AtmKD/- leukemia had very few leukemia cells and only the germline TCRβ bands. (C) Representative spleens harvested from tertiary recipients transduced with isogeneic AtmC/C or Atm-/- leukemia treated with either Vehicle (Veh) or Irinotecan. Quantification (Average ± SEMs) of GFP+% splenocytes (D) and spleen weights (E) of mice transduced with AtmC/C or Atm-/- leukemia and treated with either vehicle (black) or Irinotecan (grey) for 5 days. (F) Representative fields of H&E stained spleen sections. Scale Bars: 200 µm.
Figure 5 with 1 supplement
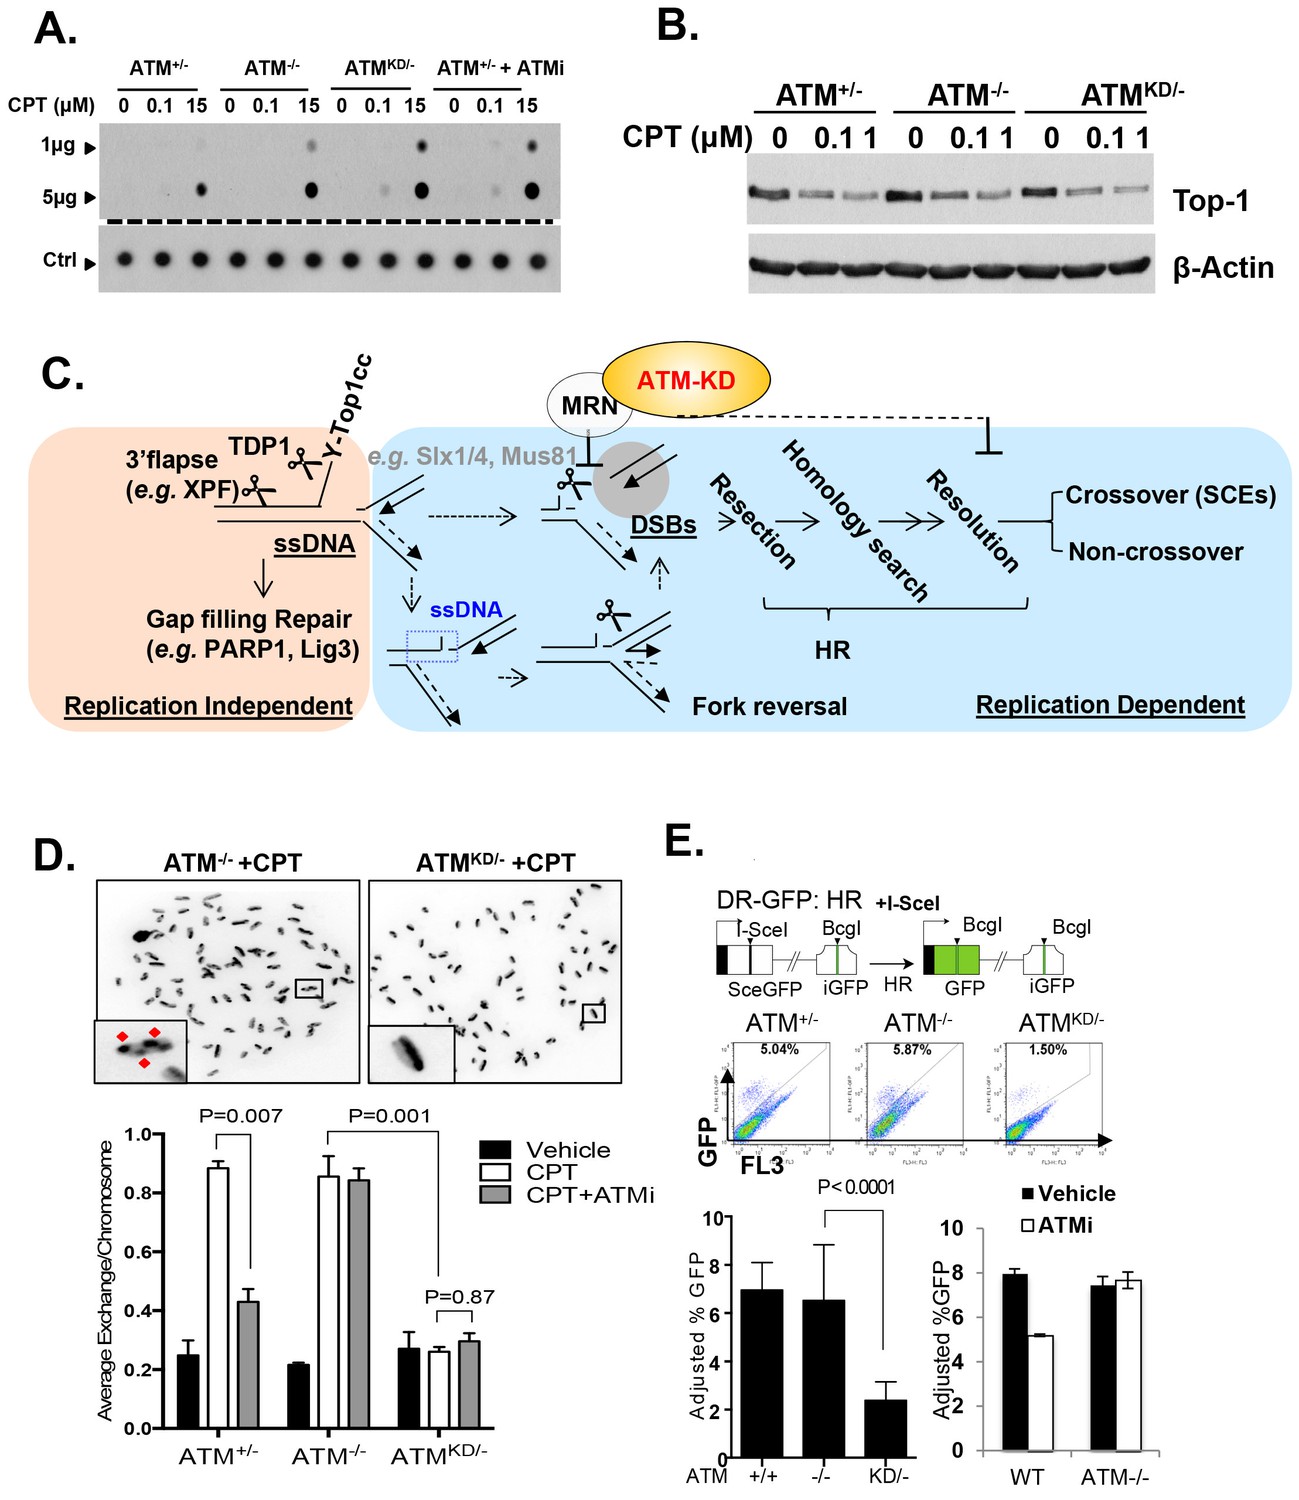
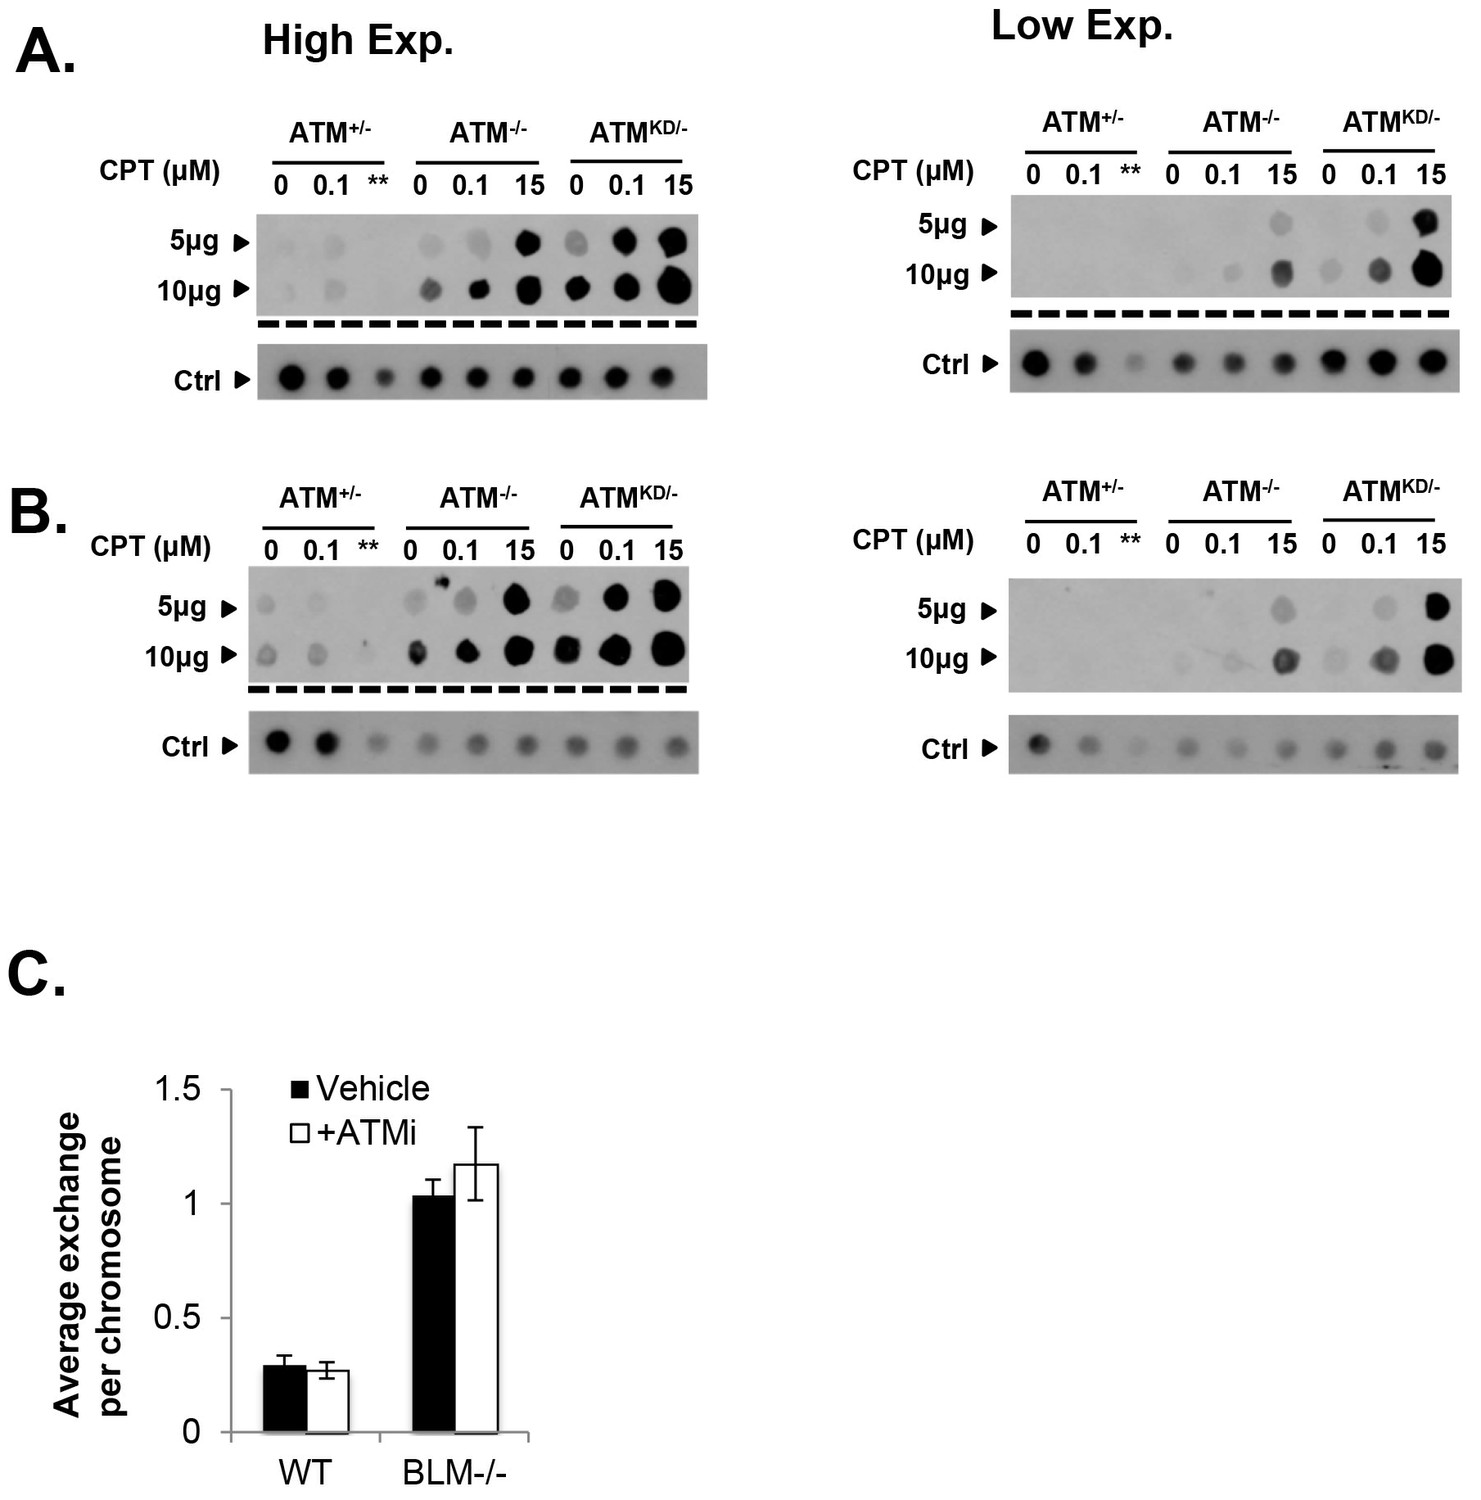
Accumulation of Top1cc and reduced homologous recombination in AtmKD/- cells.
(A) Representative In-vitro Complex of Enzymes (ICE) assay (see Materials and method). The top panel was blotted by anti-Topo1 antibody and the bottom panel was probed by p32 labeled total mouse genomic DNA. The amounts of genomic DNA (in μg) loaded on each row are marked on the left. (B) Western blot for full length Topo1 on MEFs treated with indicated concentrations of CPT for 2 hr. (C) Diagram of replication-dependent (blue shade) and replication-independent (pink shade) Top1cc removal pathways. Top1cc is removed by TDP1 or 3’ flapases to generate a single stand gap, which can be repaired by PARP1 and Ligase3-mediated pathways independent of replication. In replicating cells, replication forks collide with Top1cc, lead to uncoupling of the leading and the lagging strand, accumulation of single strand DNA (blue dashed box), which promotes fork reversal and eventually a subset of the forks were cleaved. The stalled fork could also be directly converted to breaks (top row, dash arrow). The resulting single-ended DSBs (grey shade circle) can only be repaired by HR (through end resection, homology search and resolution) to generate cross over (CO) (scored as SCEs) or non–crossover. ATM-KD protein selectively inhibits fork breakage in a MRN dependent manner, and could also potentially suppress the same nucleases (Mus81/SLX4) implicated in holiday junction resolution in a later step of HR. (D) Representative images and the average (and SEMs) of SCEs per chromosome for vehicle (DMSO) or CPT (1 µM) treated MEFs. Red diamonds point to exchange events. (E) Diagram of the DR-GFP reporter, representative FACS plots of the GFP+ cells 48 hr after I-SceI transfection. The bar graphs represent the adjusted GFP%, calculated based on raw GFP% and the I-SceI transfection efficiency. At least two independent ES cell lines per genotype were assayed in >3 independent experiments. Bar graphs represent the average ± SEMs. In the right panel, the cells were either treated with vehicle (DMSO) or ATMi (15 µM Ku55933) for 36 hr (12 hr after I-SceI transfection).
Figure 5—figure supplement 1
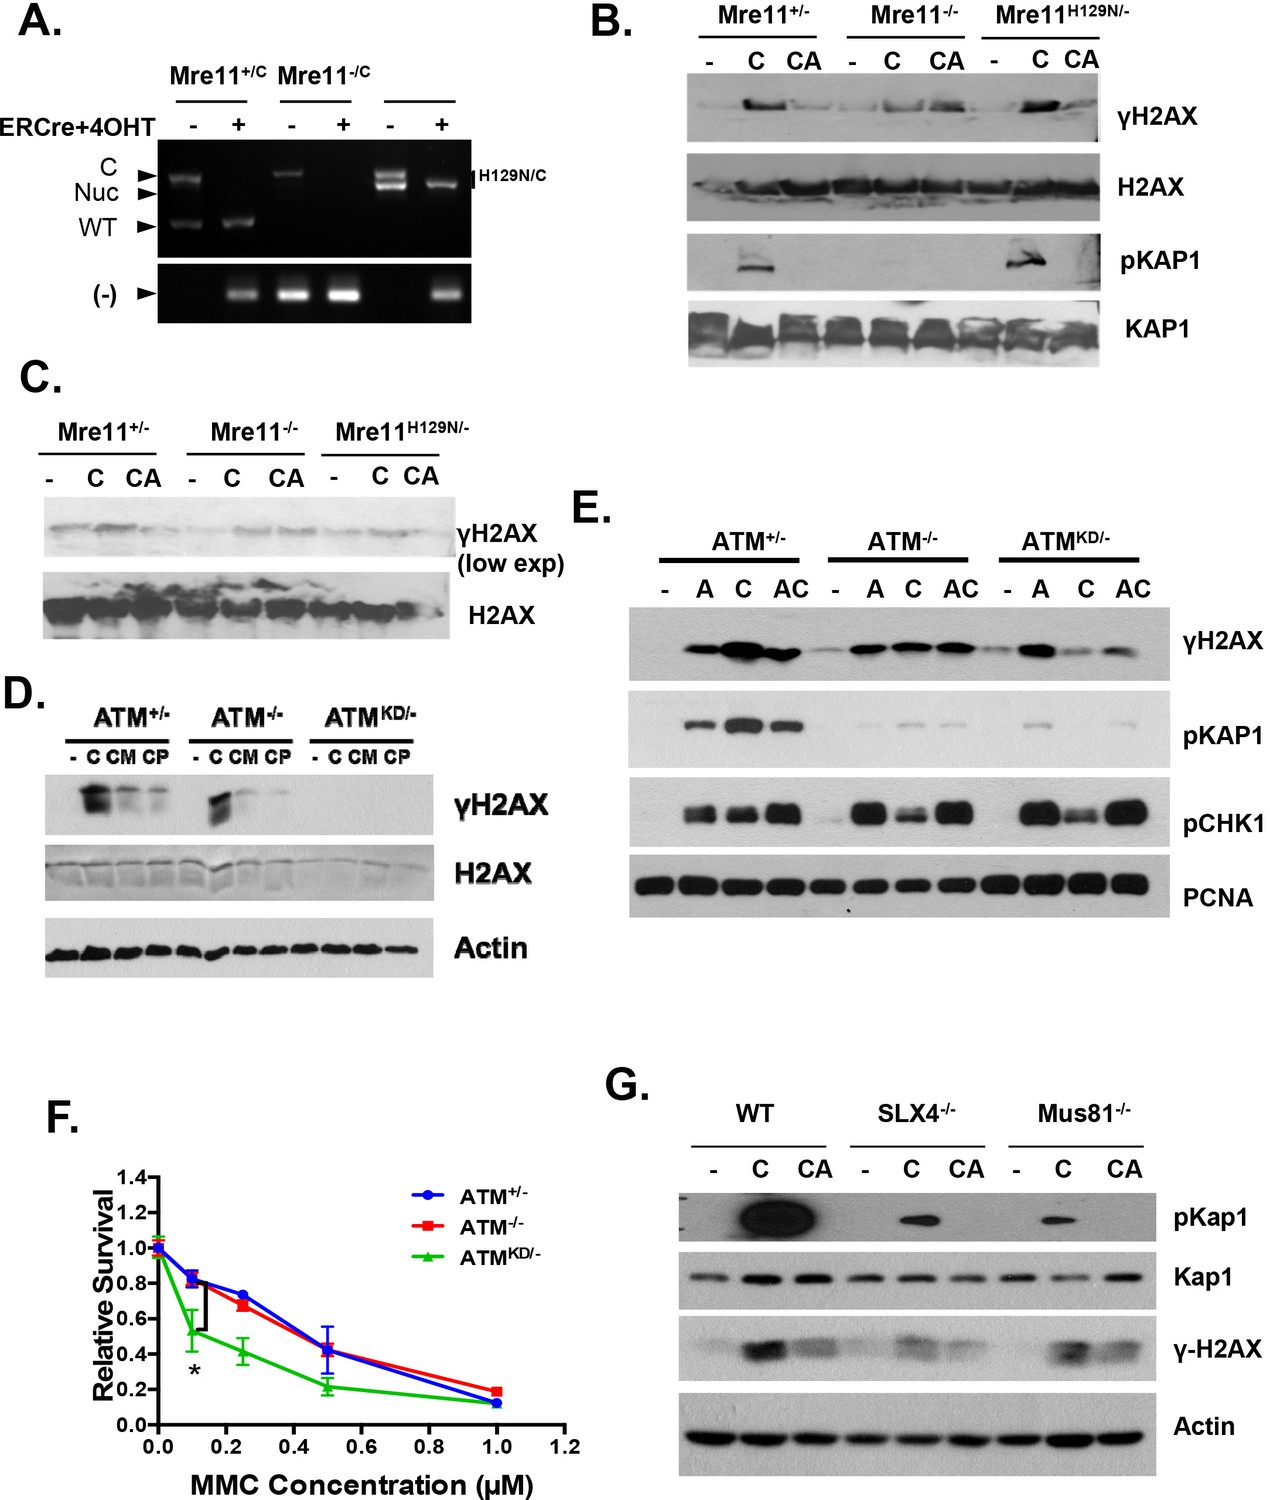
Analyses of immortalized AtmKD/- MEFs and Mre11-deficient cells.
(A and B) Two independent In-vitro Complex of Enzymes (ICE) assay results (see Materials and method). The top panel was blot by anti-Topo1 antibody and the bottom panel was probed by P32 labeled total mouse genomic DNA. The amounts of genomic DNA (in μg) loaded on each row are marked on the left. The ** lanes represents Atm+/- cells treated with 15 μM CPT that were lost during centrifugation due to an equipment error. (C) The number of sister chromatid exchange (SCE) per chromosome in Blm+/+ (WT) or Blm-/- cells treated with vehicle (DMSO) or ATMi (15 µM KU55933 for second doubling period) for 24 hr.
Figure 6 with 1 supplement
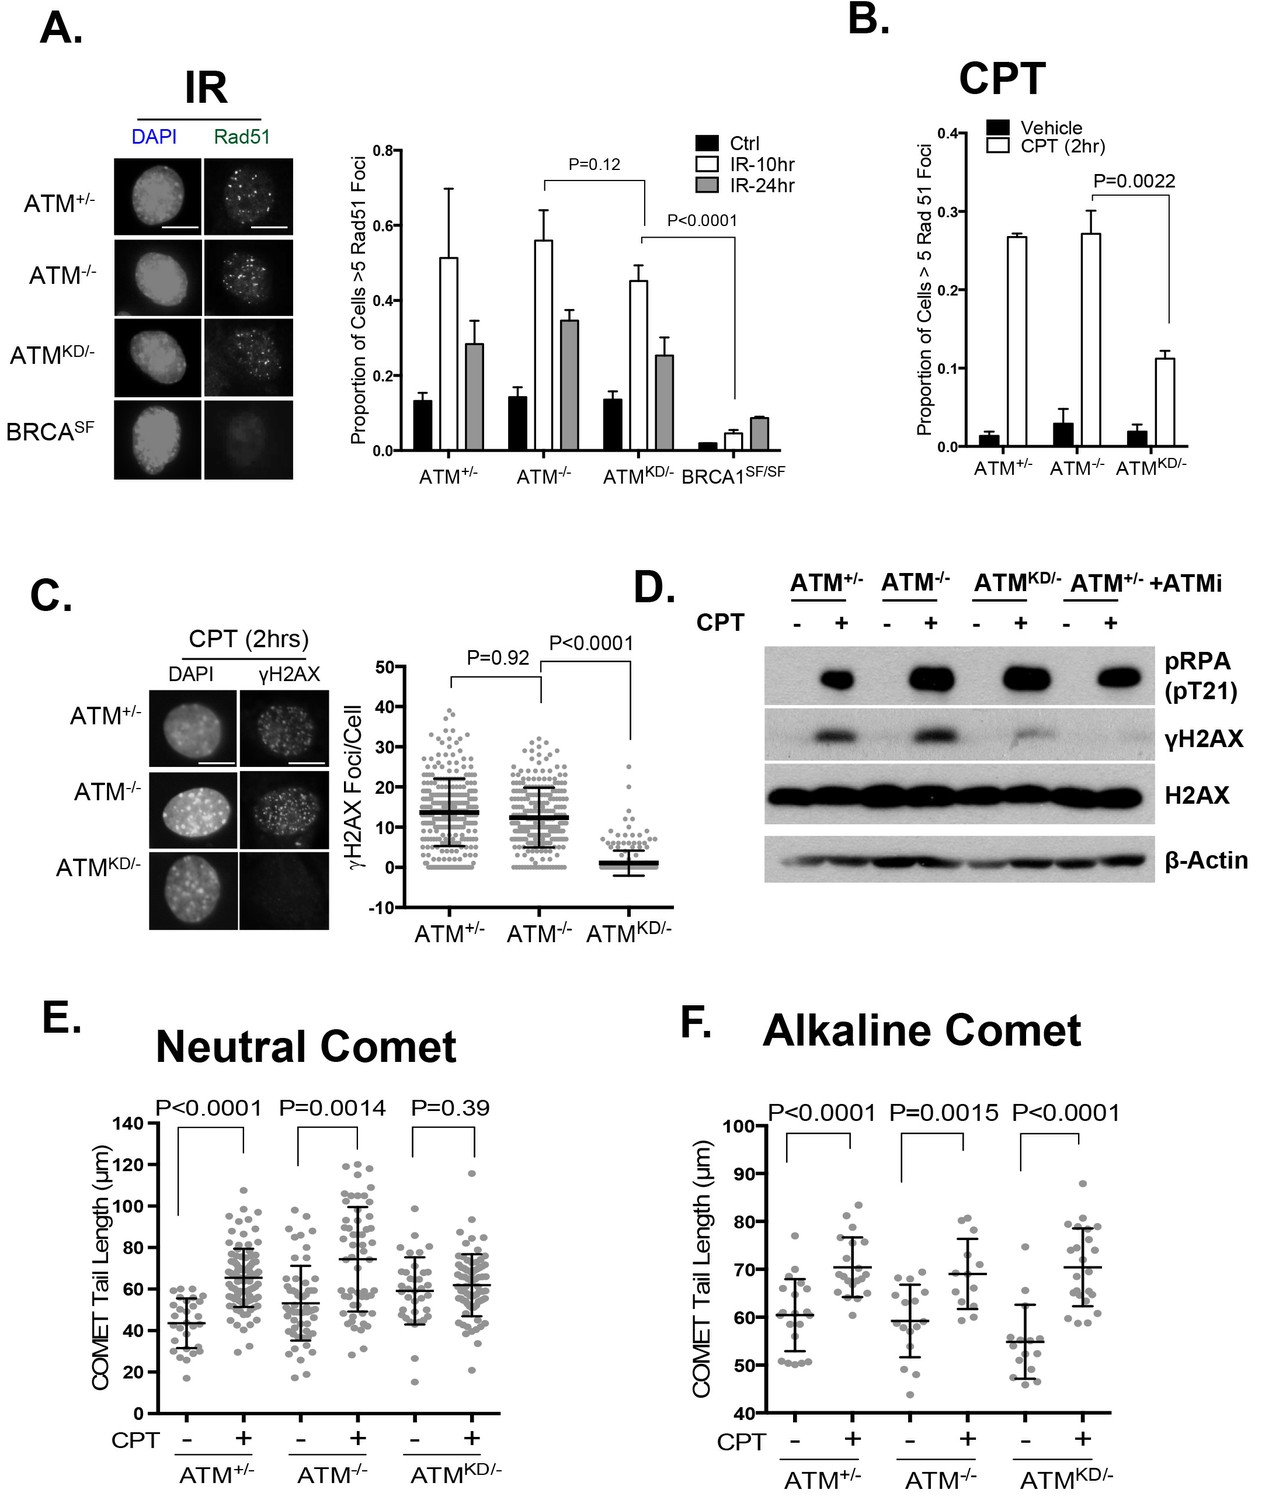
ATM-KD blocks CPT-induced double stand breaks formation in replicating cells.
(A) Representative images and the frequency of cells with >5 Rad51 foci per cell (Average ± SEMs) at 10 hr after 5 Gy of IR. Brca1SF/SF cells homozygous for the S1598F mutation(Shakya et al., 2011) were used as a control for the lack of Rad51 foci. Scale bar ~10 µm. (B) The proportion of cells with >5 Rad51 foci after CPT (0.1 µM, 2 hr) treatment. The bar graph represents the average and SEMs from 3 independent experiments. All p-values in this figure were calculated based on two-tailed student’s t-test assuming unequal variances. (C) Representative images and quantification of CPT-induced γH2AX foci (0.1 µM, 2 hr). The dot plot represents average and SEMs in three biological replicates with >200 nuclei per genotype per condition. Scale bar ~10 µm. (D) Western blots for pRPA(T21), γH2AX, and total H2AX of cells treated with either Vehicle (−, DMSO) or CPT (+, 0.1 µM) for 2 hr. ATM inhibitor (15 µM, Ku55933) was added 1 hr prior to CPT/vehicle treatment as indicated. (E) Quantification of Neutral COMET tail lengths in cells treated with Vehicle (−, DMSO) or CPT (+, 0.1 µM) for 1 hr. The graph represents the average ± SEMs from two independent experiments with over 50 comets quantified for each. (F) Quantification of Alkaline COMET tail lengths of cells treated with Vehicle (−, DMSO) or CPT (+, 0.1 µM) for 1 hr. Two replicates of the experiments were performed with over 50 comets quantified for each.
Figure 6—figure supplement 1
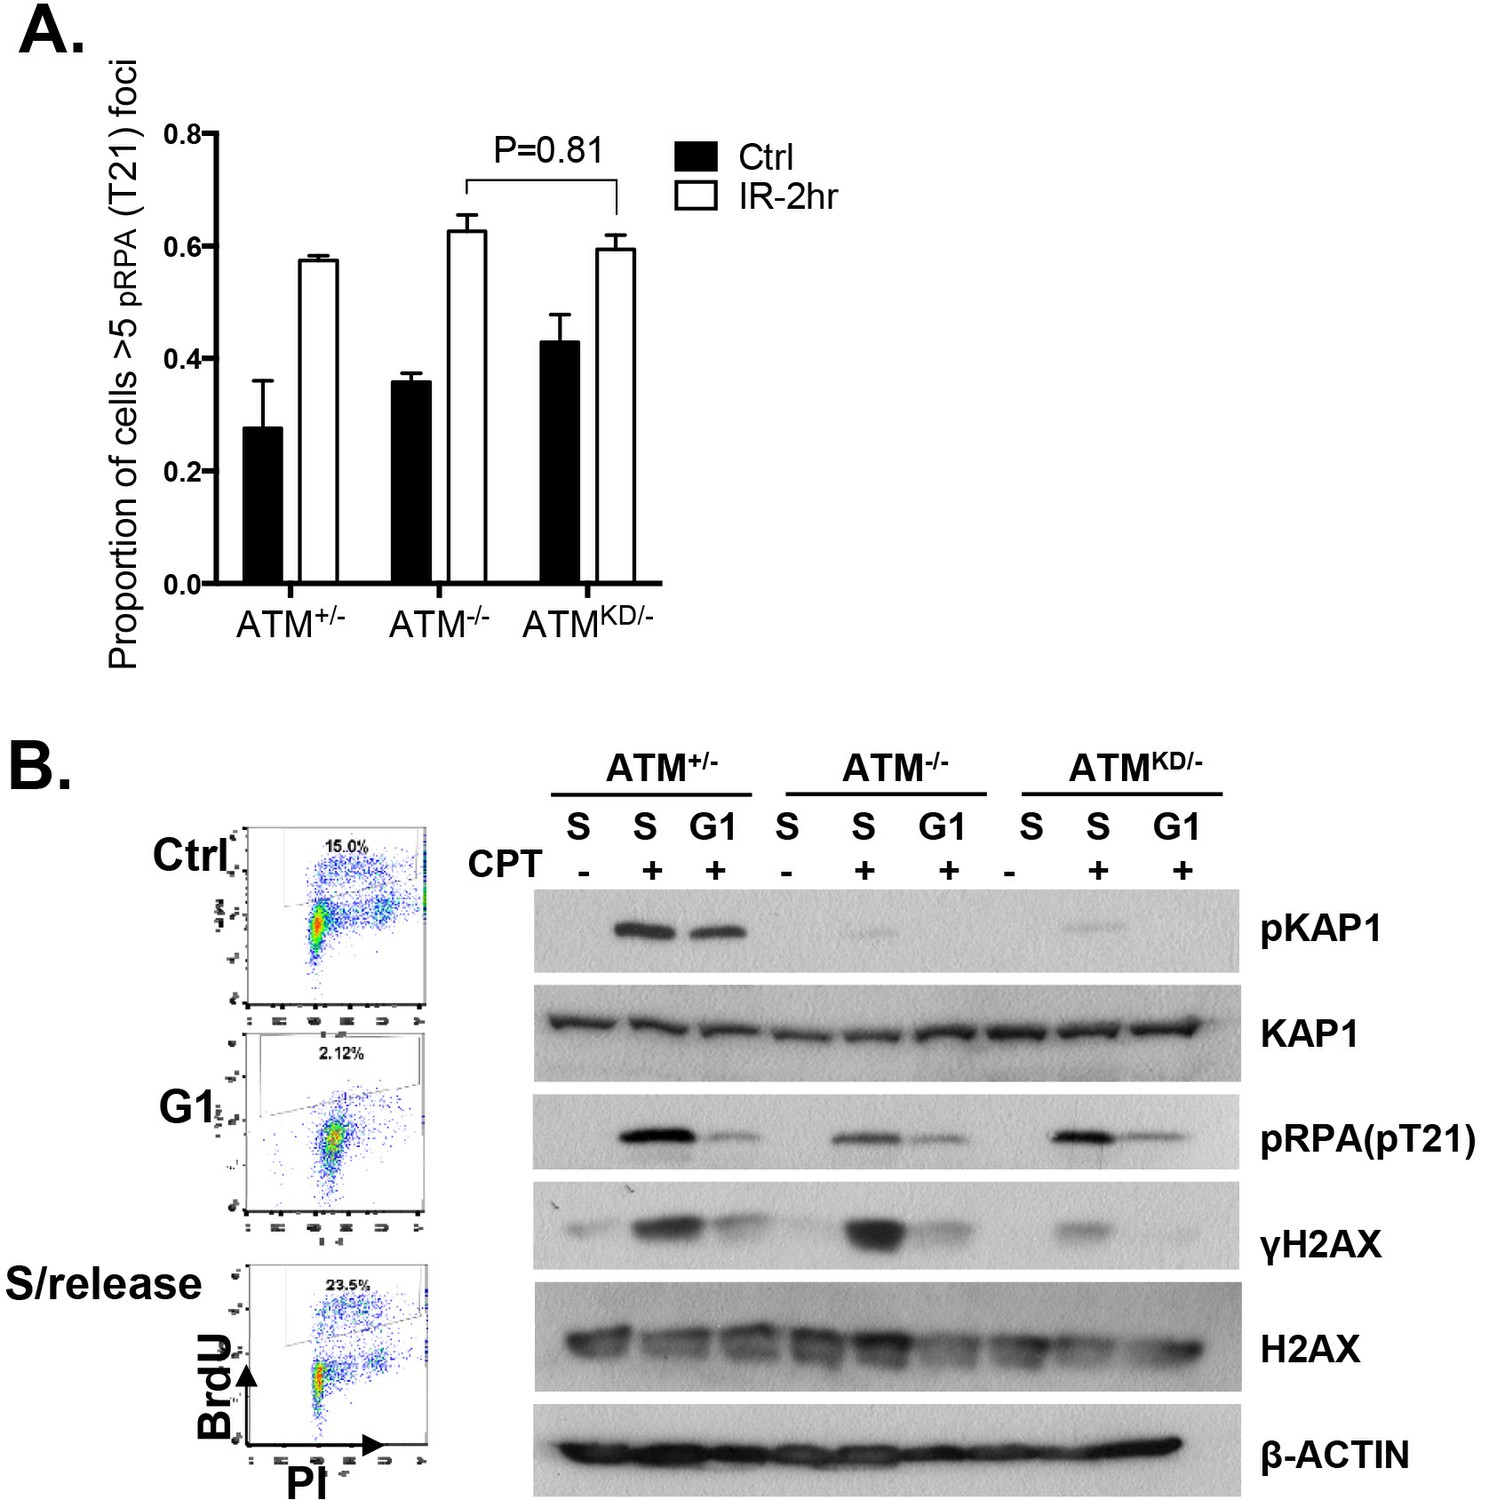
Analyses of cell cycle dependent reduction of CPT induced DSBs.
(A) Proportion of cells with greater than 5 pRPA (pT21) foci 2 hr post 5 Gy IR treatment. (B) Representative FACS plots for Bromodeoxyuridine (BrdU) and Propidium Iodide (PI) of ATM+/- MEFs growing at log phase (ctrl), undergoing double thymidine (DT) Block (G1), and cells released into fresh medium for 6 hr after wash-off (S/Release). For DT block, cells were treated for two intervals of 24 hr with 2 mM Thymidine, with a 9 hr wash-off in between with fresh medium. Western blot of whole-cell lysates collected from MEFs treated with indicated concentrations of CPT for 2 hr.
Figure 7 with 1 supplement
Atm-KD physically blocks the cleavage of CPT-stalled replication fork independent of fork reversal.
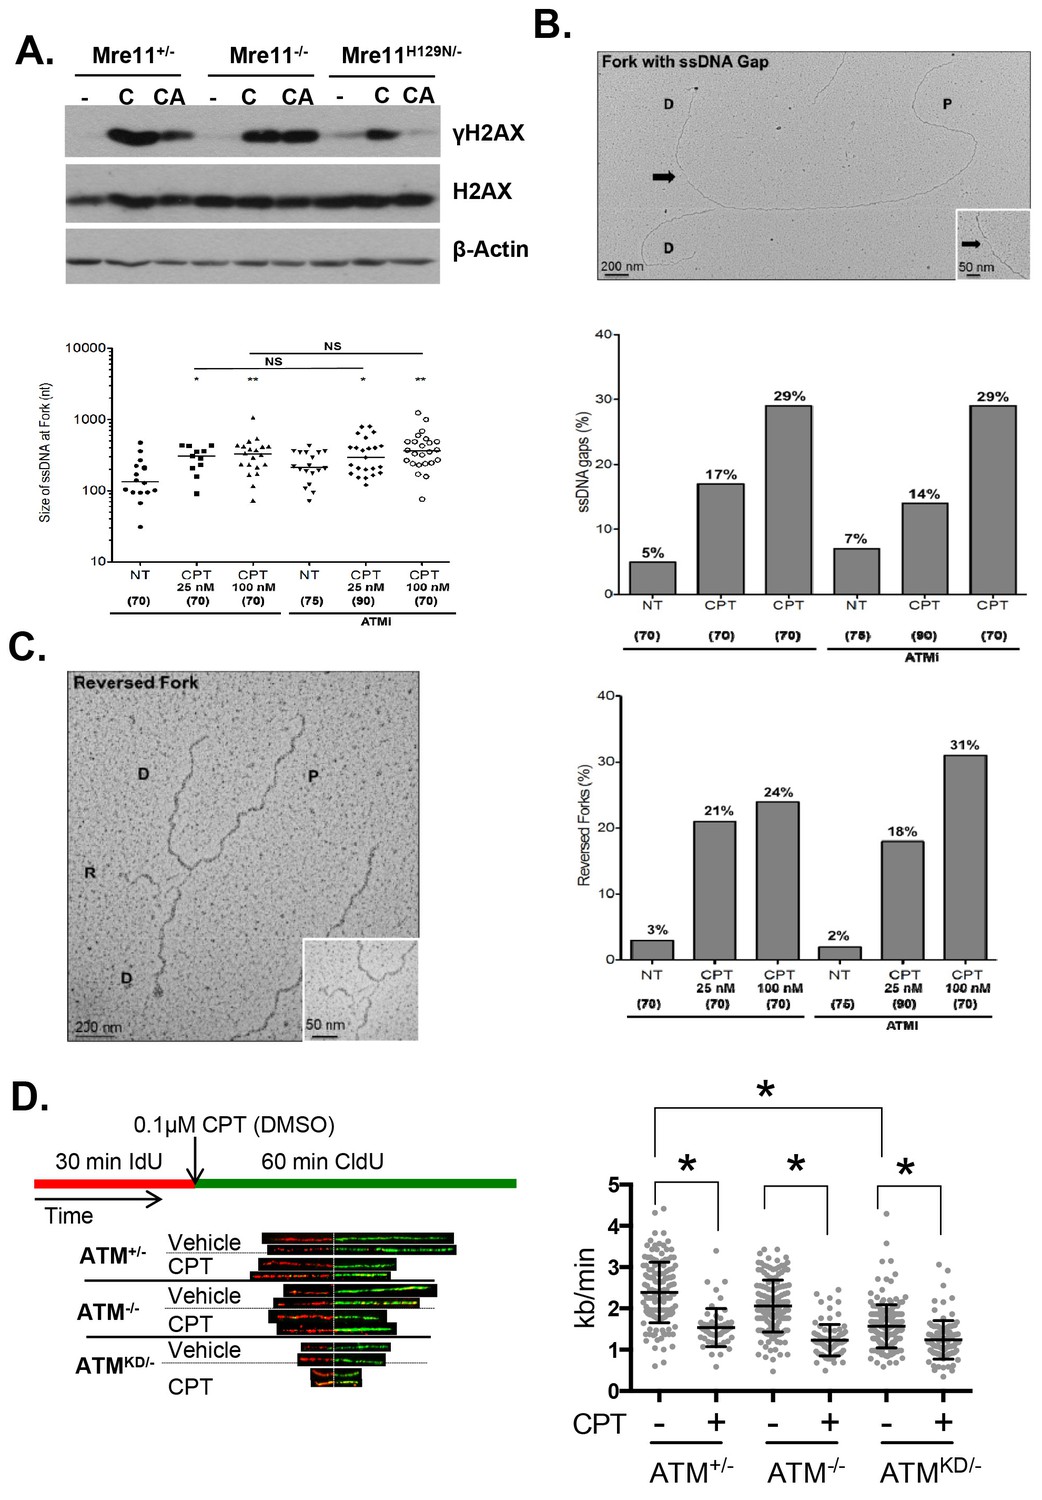
(A) Western blots of Mre11+/-, Mre11-/- or Mre11H129N/- (refereed as Nuc/- in the text) MEFs treated with CPT (C, 0.1 µM, 2 hr) or pretreated with ATM kinase inhibitor (CA, ATMi 15 µM, 1 hr, then together with CPT 0.1 µM, 2 hr). (B) Visualization and quantification of ssDNA at replication fork junctions in not treated (NT) cells and upon treatment with CPT with and without the ATM inhibitor (15 µM). Statistical analysis t-test according to Mann–Whitney results are *p≤0.1; **p≤0.01; ***p≤0.001. (C) Representative images and quantification of fork reversal by electron microscopy upon CPT (25 or 100 nM) and CPT+ATMi (Ku55933, 15 µM) treatment. P: parental DNA; D: daughter DNA strands, and R: reversed fork DNA. 70 replication forks were quantified for each genotype at each condition. Statistical analysis t test according to Mann–Whitney results are *p≤0.1; **p≤0.01; ***p≤0.001. (D) Representative images and quantification of the DNA fiber assay. Cells were incubated 30 min with 25 µM IdU, followed by 250 µM of CldU along with either vehicle (DMSO) or CPT (1 µM). The dot plot represents the summary of two independent experiments. *p<0.0001.
Figure 7—figure supplement 1
Replication fork analyses in cells treated with CPT.
(A) Mre11+/C, Mre11C/- and Mre11C/H129N immortalized MEFs were stably infected with retrovirus expressing ER-CRE- IRES-hCD2, MACS purified for hCD2+ cells and then induced with 4OHT (200 nM) for 48 hr. PCR confirmed the efficient conversion of the Mre11 conditional allele to the null alleles. PCRs were performed as previously described (Buis et al., 2008). (B and C) Independent Western blot analyses of Mre11+/-, Mre11-/- or Mre11H129N/- MEFs treated with CPT (C, 0.1 µM, 2 hr) or pretreated with ATM kinase inhibitor (CA, ATMi 15 µM, 1 hr, then together with CPT 0.1 µM, 2 hr). (D) Western blot analyses of Atm+/-, Atm-/- or AtmKD/- MEFs treated with CPT (C, 0.1 µM, 2 hr) or pretreated with Mre11 nuclease inhibitors (CM for Mirin at 500 µM, or CP for PFM01 (Shibata et al., 2014) (200 µM, for 1 hr) then with CPT (0.1 µM) together for 2 more hours. (E) Western blot analyses of cells treated with Aphidicolin (A) or CPT (C) or first Aphidicolin for 1 hr, then together with CPT for 2 hrs (AC). (F) Representative sensitivity assay to mitomycin C (MMC). (G) Western blot analyses of immortalized MEFs treated with CPT (C) or CPT and ATM kinase inhibitor (CA) together for 2 hr.
Additional files
-
Supplementary file 1
Nonsynonymous mutations reported for A-T patients (A) in the Leiden open variable database (http://chromium.lovd.nl/LOVD2/home.php?select_db=ATM) or The Cancer Genome Atlas (TCGA) at the time of primary analyses (5402 cases, (B).
At the time of primary analyses, 2 TCGA cancer cases (1 and 2 in the table below) have mutations involving N2875 of human ATM. Among them, the first case also has 'shallow del' in ATM region, consistent with Mut/- genotype. Since then, one additional prostate cancer (case 3) was reported to have N2875S mutations. While ATM region deemed 'diploid', the allele frequency of the N2875S allele is 0.92 (92% of the reads in this region are mutated), consistent with phenotypically - homozygous status. 1) TCGA-EW-A1J6-01 breast cancer N2875S shallow del; 2) TCGA-G9-7521-01 prostate cancer N2875K diploid; 3) TCGA-YL-A8S9-01 prostate cancer N2875S diploid; allele freq = 0.92.
- https://doi.org/10.7554/eLife.14709.018
Download links
A two-part list of links to download the article, or parts of the article, in various formats.
Downloads (link to download the article as PDF)
Open citations (links to open the citations from this article in various online reference manager services)
Cite this article (links to download the citations from this article in formats compatible with various reference manager tools)
Kinase-dead ATM protein is highly oncogenic and can be preferentially targeted by Topo-isomerase I inhibitors
eLife 5:e14709.
https://doi.org/10.7554/eLife.14709


