Parallel encoding of sensory history and behavioral preference during Caenorhabditis elegans olfactory learning
- Howard Hughes Medical Institute, The Rockefeller University, United States
- University of California, United States
Figures
Figure 1
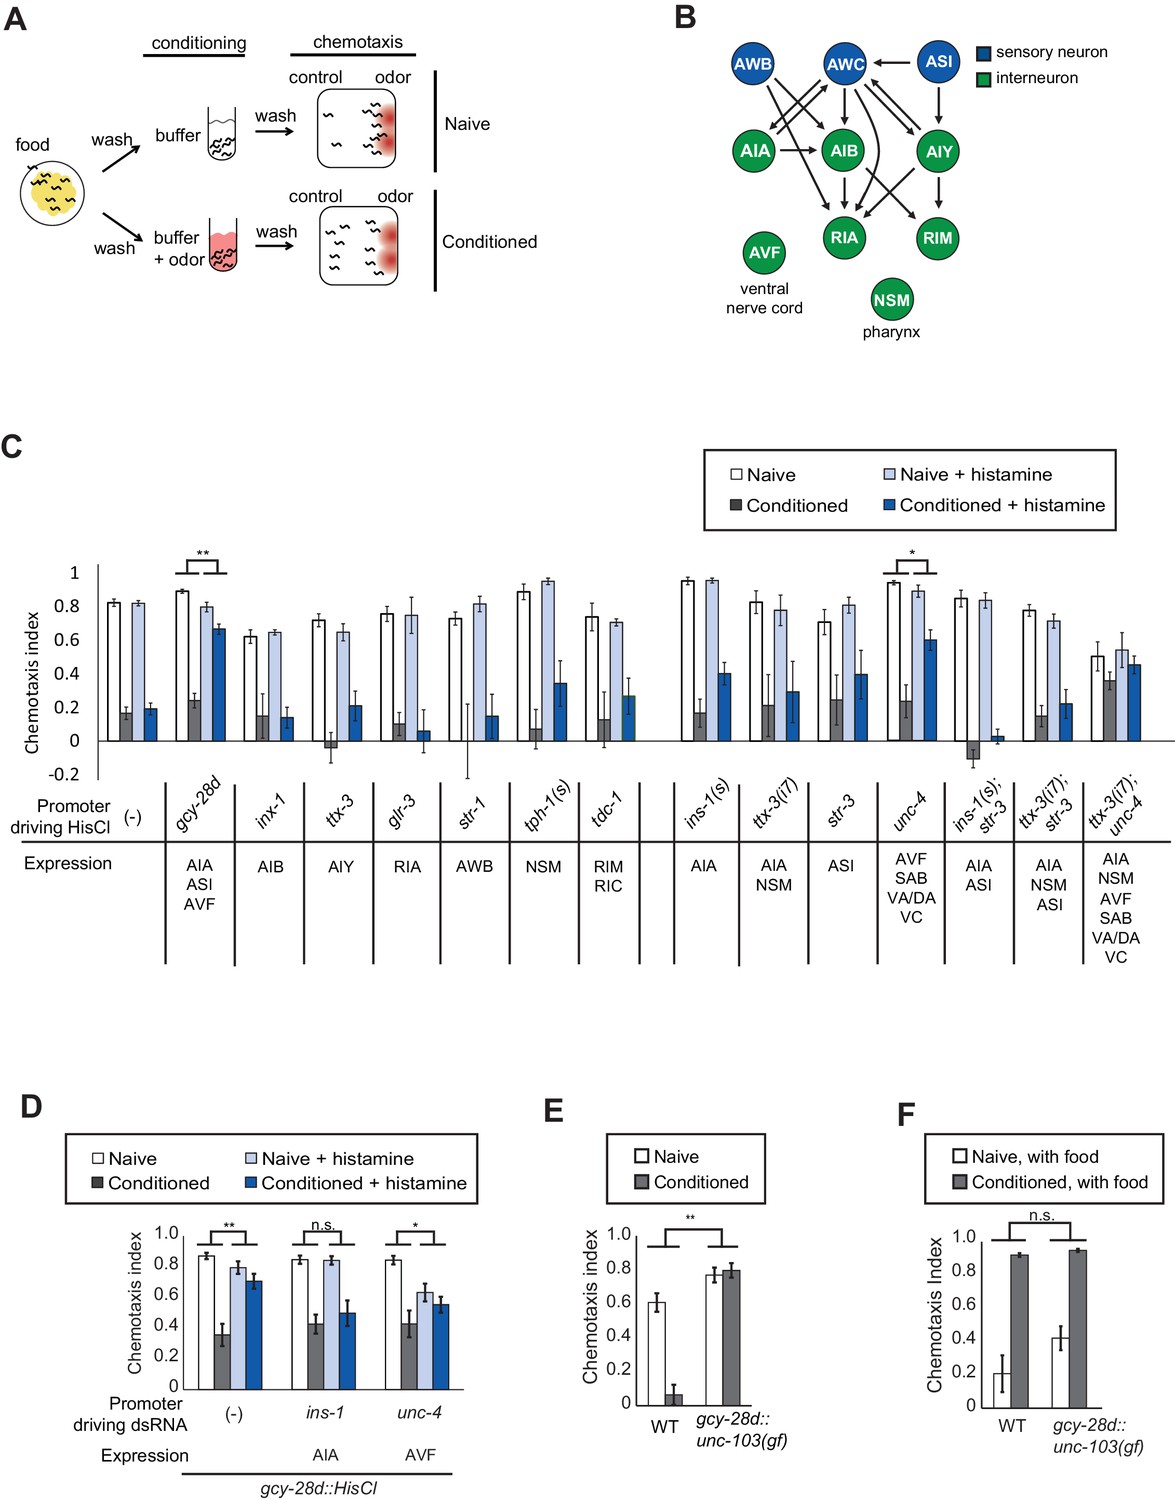
Neurons required during odor conditioning for aversive olfactory learning.
(A) Schematic of aversive olfactory learning assay. Adult worms are washed off food and conditioned with odor in buffer for 90 min, then washed again before being tested in a butanone chemotaxis assay for 1–2 hr. (B) Partial C. elegans wiring diagram showing neurons tested for effects on aversive learning and their synaptic connections with AWC and each other. (C) Aversive learning in animals expressing the histamine-gated chloride channel (HisCl1) under cell-specific promoters, assayed with or without 10 mM histamine in the conditioning medium. Chemotaxis assays (1:1000 butanone dilution) were performed on histamine-free plates. Error bars represent S.E.M. P values were generated by 2-way ANOVA for interaction of odor condition and presence of histamine (**p<0.001, *p<0.05). n = 3–61 assays, 50–200 animals/assay. (D) Aversive learning in animals carrying the gcy-28d::HisCl transgene and a second transgene expressing dsRNA that targets HisCl. Tested as in (B). Error bars represent S.E.M. P values were generated by 2-way ANOVA for interaction of odor condition and presence of histamine (**p<0.001, *p<0.05, n.s. not significant). n = 9–15 assays, 50–200 animals/assay. (E) Aversive learning in animals expressing the gain-of-function potassium channel UNC-103 under the gcy-28d promoter. P values were generated by 2-way ANOVA for interaction of genotype and condition (**p<0.001). n = 8 assays, 50–200 animals/assay. (F) Appetitive learning in wild-type and gcy-28d::unc-103(gf) animals after conditioning with butanone and food (1:10 butanone dilution). 2-way ANOVA for interaction of genotype and condition (n.s. not significant). n = 8 assays per condition, 50–200 animals/assay.
-
Figure 1—source data 1
Individual chemotaxis indices for Figure 1C–F.
- https://doi.org/10.7554/eLife.14000.004
Figure 2
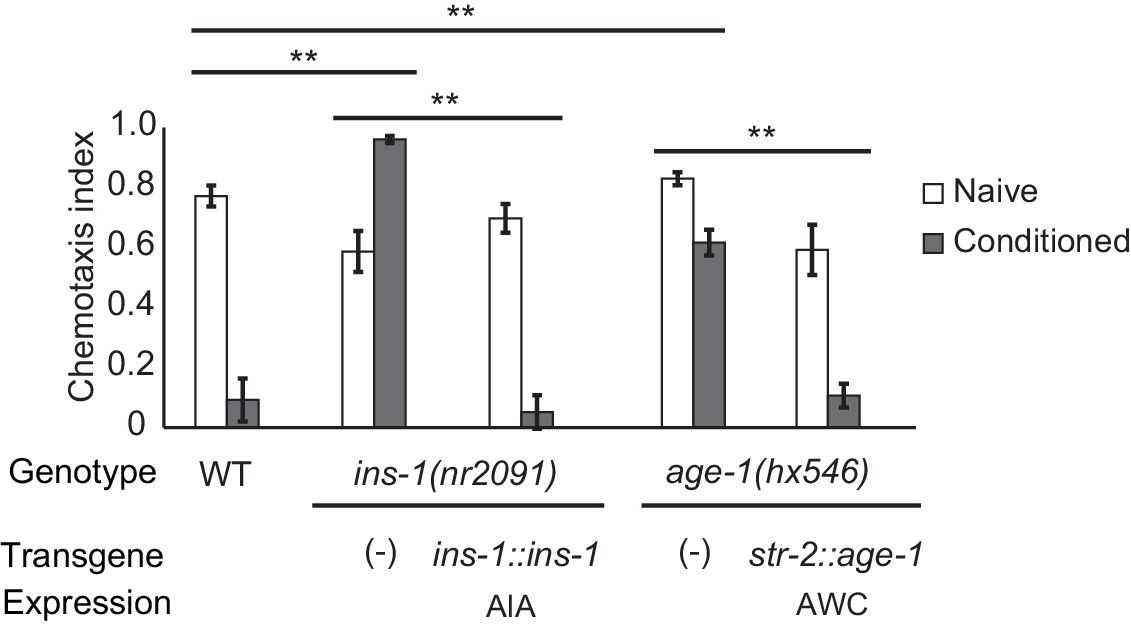
Cell-specific requirements for the insulin signaling pathway in aversive olfactory learning.
Aversive olfactory learning in mutants of the insulin signaling pathway, with or without cell-specific transgenes expressing cDNAs for the insulin gene ins-1 and the PI3 kinase gene age-1. Error bars represent S.E.M. P values were generated by 2-way ANOVA for interaction of genotype and condition (**All comparisons significant at p<0.01 after Bonferroni correction). n = 4–26 assays, 50–200 animals/assay.
-
Figure 2—source data 1
Individual chemotaxis indices for Figure 2.
- https://doi.org/10.7554/eLife.14000.006
Figure 3
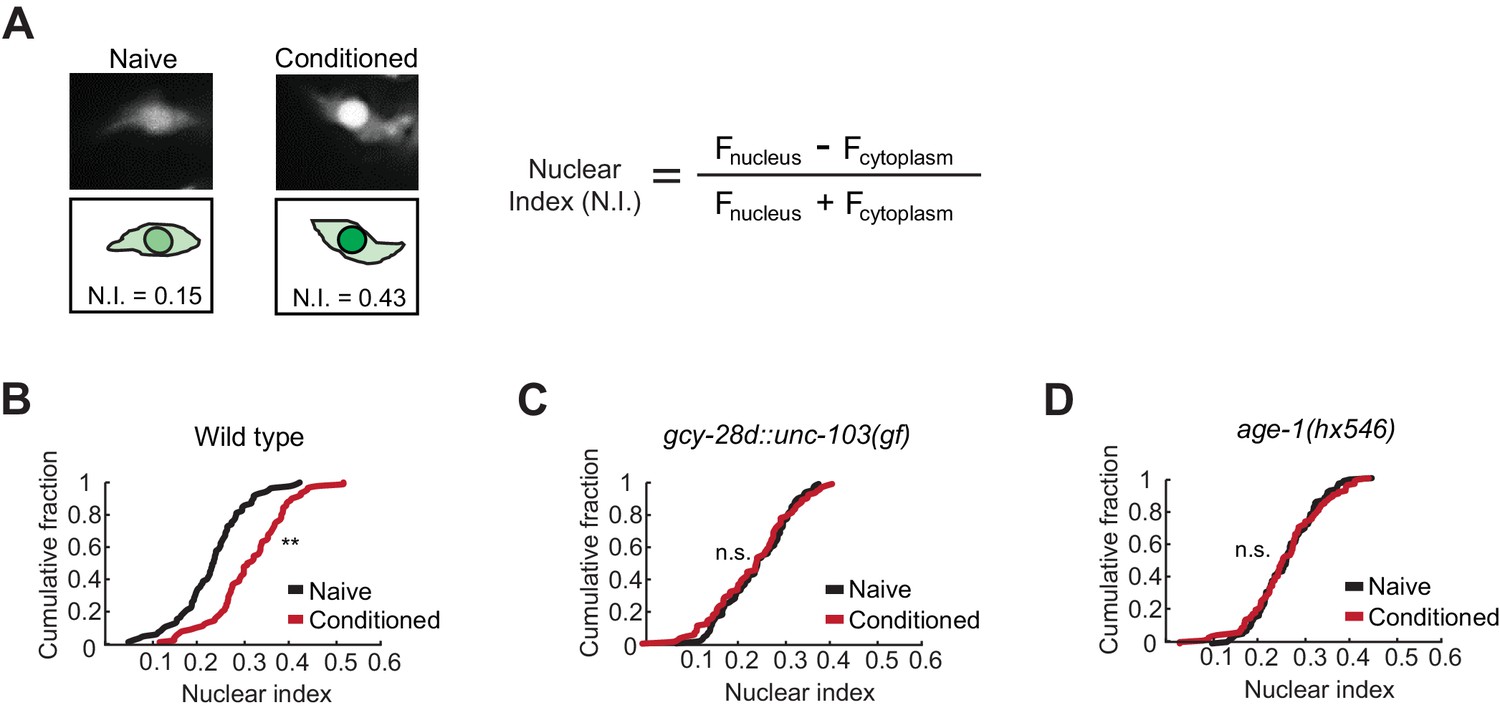
Nuclear enrichment of EGL-4 in AWC neurons after odor conditioning.
(A) Representative images of EGL-4::GFP fluorescence and nuclear index in the AWC of naive and conditioned animals (left), and the equation used to quantify the degree of EGL-4 nuclear localization (right). Fnucleus, Fcytoplasm = fluorescence measured in AWC nucleus or cytoplasm of the same neuron. (B,C,D) Cumulative distribution (AWC nuclear index) for EGL-4::GFP in wild-type, gcy-28d::unc-103(gf), and age-1(hx546) animals after conditioning. An increase in AWC nuclear index is observed after conditioning wild-type (B) but not gcy-28d::unc-103(gf) (C) or age-1(hx546) (D). P values were generated by nonparametric Kolmogorov-Smirnov test (**p<0.001). n = 79–90 animals per condition.
-
Figure 3—source data 1
Individual nuclear indices for Figure 3B,C,D.
- https://doi.org/10.7554/eLife.14000.008
Figure 4
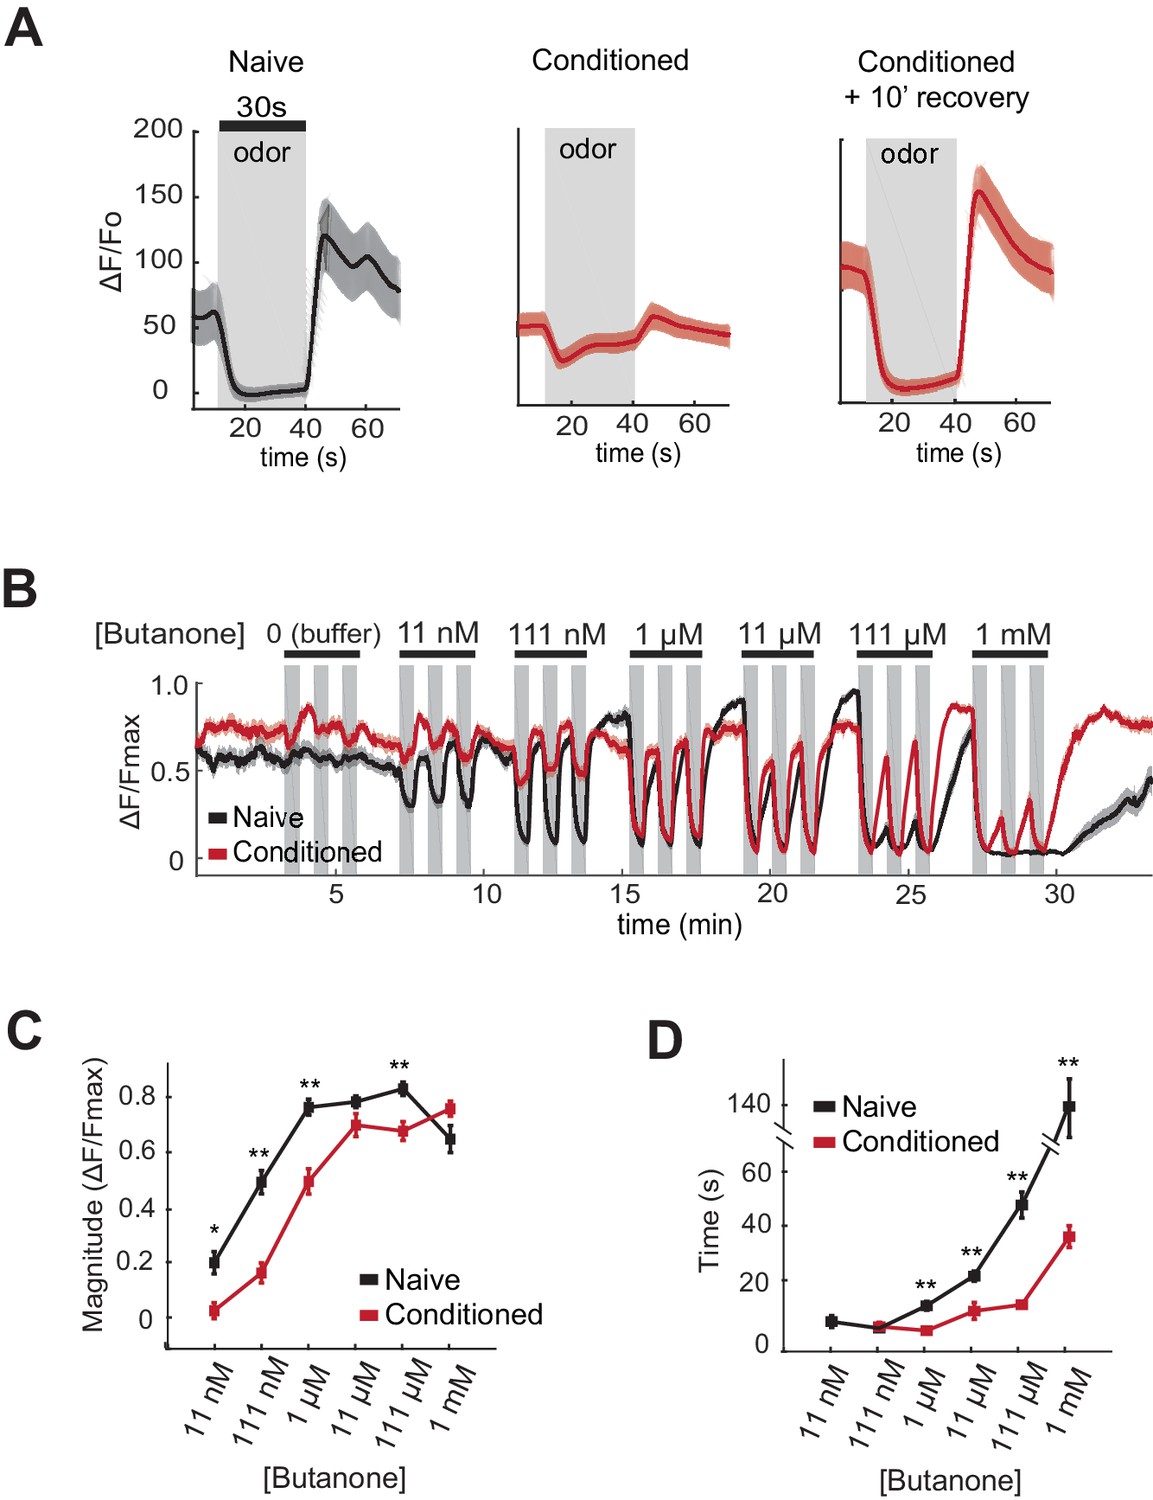
AWCON butanone responses shift after odor conditioning.
(A) Average AWCON calcium responses to a 30-second pulse of 1 µM butanone in naive animals, conditioned animals, or conditioned animals after 10 min of recovery in buffer. Gray represents odor. Shaded region represents S.E.M. n = 8–27 animals. (B) AWCON calcium responses of naive animals and conditioned animals to a range of butanone concentrations. Animals were washed in buffer for 15 min after conditioning. Gray represents odor (30 s pulses). Shaded region represents S.E.M. n = 25–26 animals. (C) Average response magnitude after butanone addition (first of three pulses, data from (B)). (D) Half-time of recovery after butanone removal (last of three pulses, data from (B)). P values were generated by t-test at each odor concentration with correction for unequal variance (**p<0.001, *p<0.05). Error bars represent S.E.M.
-
Figure 4—source data 1
Data and heat map showing individual responses for Figure 4B.
- https://doi.org/10.7554/eLife.14000.010
-
Figure 4—source data 2
Data for response magnitude and recovery time in Figure 4C,D.
- https://doi.org/10.7554/eLife.14000.011
Figure 5
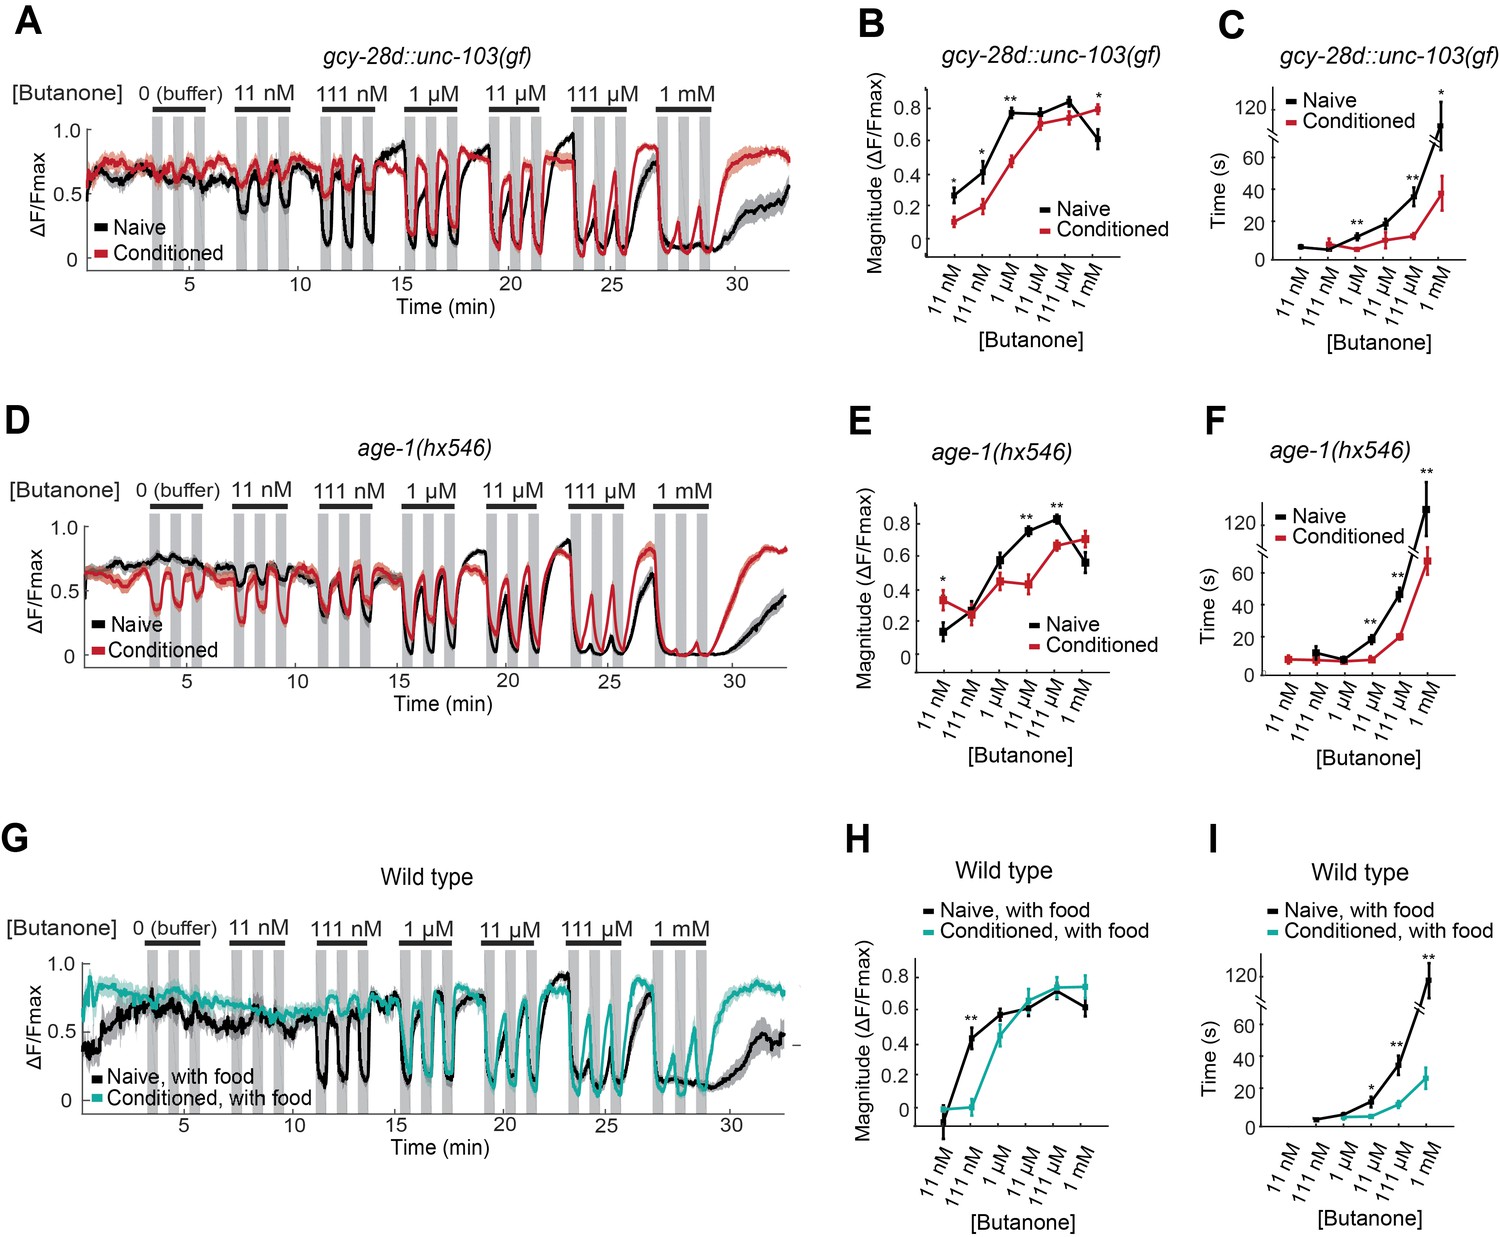
AWCON butanone responses report odor history.
(A–F) AWCON calcium responses are altered by aversive conditioning in mutants that do not learn. (A–C) gcy-28d::unc-103(gf) (D–F) age-1(hx546). (G–I) AWCON calcium responses of wild-type animals after appetitive conditioning with odor and food. Note that the well-fed naive and conditioned groups in (G–I) are less sensitive to odor than the food-deprived groups in Figure 4. (A,D,G) Calcium responses to a concentration series with three 30 sec pulses per concentration. Gray represents odor. (B,E,H) Average response magnitude after butanone addition (first of three pulses). (C,F,I) Half-time of recovery after butanone removal (last pulse). n = 11–24 animals. P values were generated by t-test at each odor concentration with correction for unequal variance (**p<0.001, *p<0.05). Error bars in (B,C,E,F,H,I) and shaded regions in (A,D,G) represent S.E.M.
-
Figure 5—source data 1
Data and heat map showing individual responses in Figure 5A,D,G.
- https://doi.org/10.7554/eLife.14000.013
-
Figure 5—source data 2
Data for response magnitude and recovery time in Figure 5B,C,E,F,H,I.
- https://doi.org/10.7554/eLife.14000.014
Figure 6
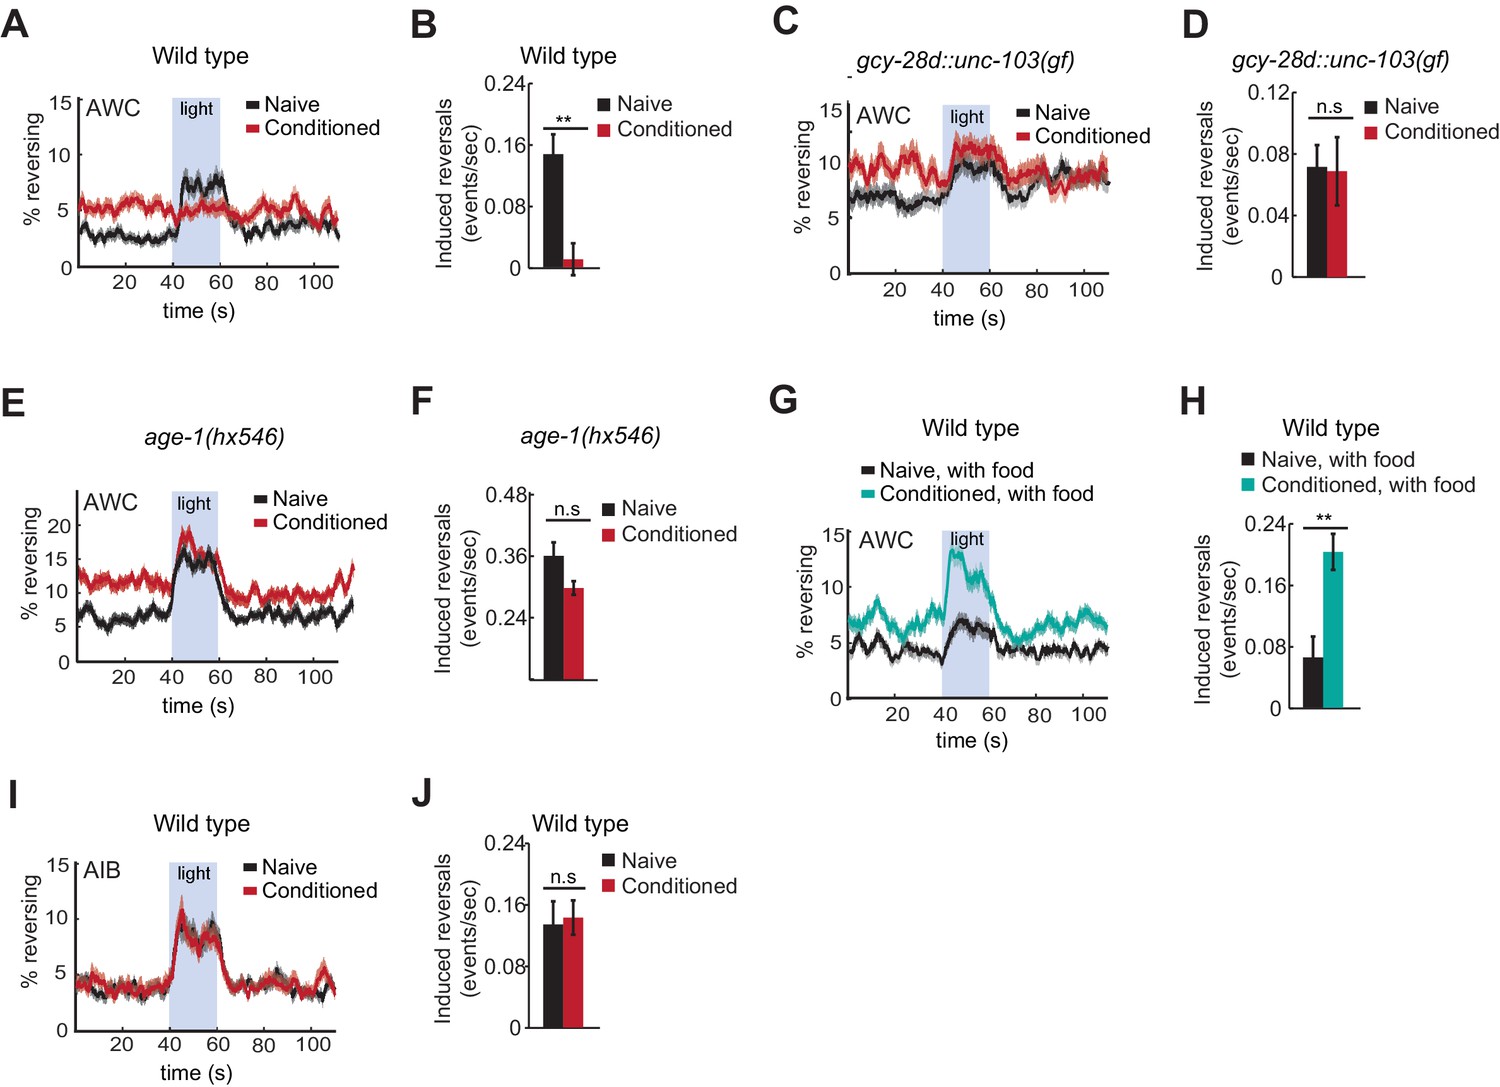
Behavioral responses to acute neuronal activation after odor conditioning.
(A,B) Light-induced reversals in naive or conditioned wild-type animals expressing Channelrhodopsin (ChR2) in AWCON. Data show the average fraction of animals executing reversals over time (A), or the difference between the number of reversals initiated during and after stimulation (20 sec each, B). (C,D) Light-induced reversals in naive or conditioned gcy-28d::unc-103(gf) animals expressing AWCON::ChR2. Note increased basal frequency of reversals, a known property of AIA inactivation (Chalasani et al., 2010). (E,F) Light-induced reversals in naive or conditioned age-1(hx546) animals expressing AWCON::ChR2. (G,H) Light-induced reversals in wild-type AWCON::ChR2 animals after appetitive conditioning. (I,J) Light-induced reversals in AIB::ChR2 animals after aversive conditioning. Pale blue regions in (A,C,E,G,I) represent blue light stimulation. Shaded regions and error bars represents S.E.M. n = 7–14 assays per condition, 18–25 animals stimulated five times per assay. P values were generated by t-test with correction for unequal variance (**p<0.001, n.s. not significant).
-
Figure 6—source data 1
Data for induced reversal frequency in Figure 6B,D,F,H,J.
- https://doi.org/10.7554/eLife.14000.016
Figure 7
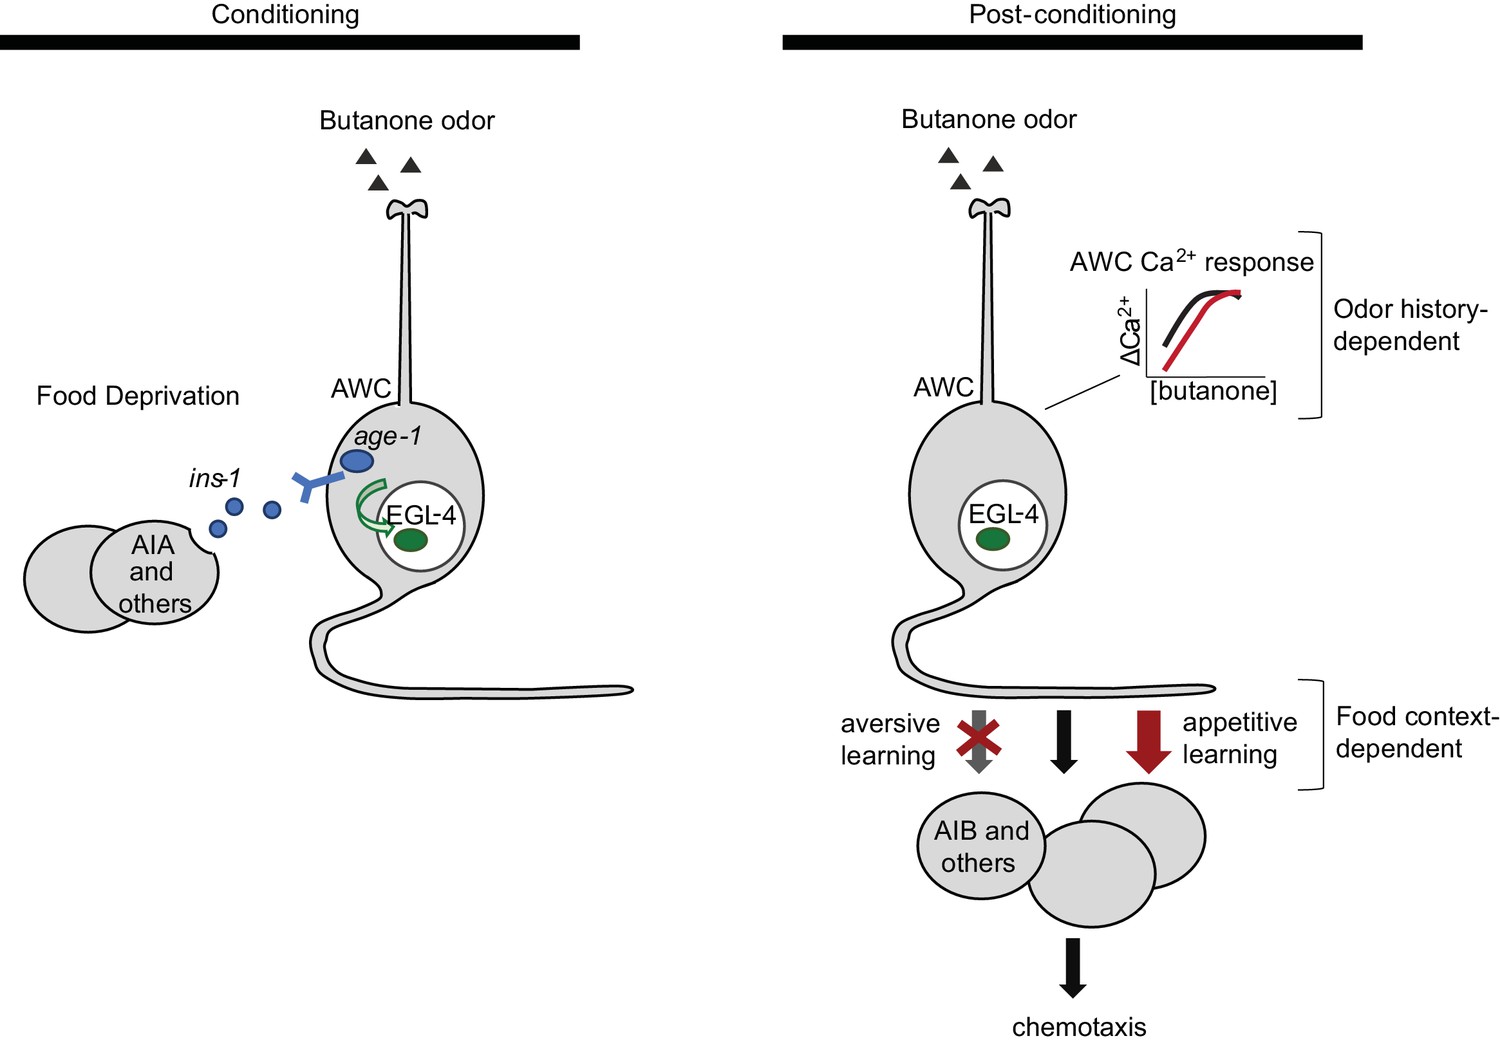
Two sites of plasticity in aversive olfactory learning.
Left Odor conditioning. During pairing of odor with food deprivation, retrograde signals from the AIA circuit to AWCON lead to EGL-4 accumulation in the AWC nucleus. This molecular event is associated with changes in AWCON gene expression (Juang et al., 2013), and is required for aversive olfactory learning (Lee et al., 2010). Right Odor experience has two distinct effects on AWCON. A similar shift in AWCON dynamic range occurs after both aversive and appetitive conditioning, representing non-associative sensory adaptation. A change in AWCON synaptic output is associative and bidirectional, leading to opposite behavioral changes in aversive and appetitive learning. The AIA circuit is required only for the change in AWC synaptic output.
Additional files
-
Source code 1
Calcium Imaging Suite: Image J and Matlab scripts for tracking and analysis of calcium imaging assays in Figures 4 and 5.
- https://doi.org/10.7554/eLife.14000.018
-
Source code 2
Optogenetics Assay Suite: Matlab scripts for tracking and analysis of channelrhodopsin-induced turning assays in Figure 6.
- https://doi.org/10.7554/eLife.14000.019
Download links
A two-part list of links to download the article, or parts of the article, in various formats.
Downloads (link to download the article as PDF)
Open citations (links to open the citations from this article in various online reference manager services)
Cite this article (links to download the citations from this article in formats compatible with various reference manager tools)
Parallel encoding of sensory history and behavioral preference during Caenorhabditis elegans olfactory learning
eLife 5:e14000.
https://doi.org/10.7554/eLife.14000


