COPI selectively drives maturation of the early Golgi
- The University of Chicago, United States
Figures
Figure 1
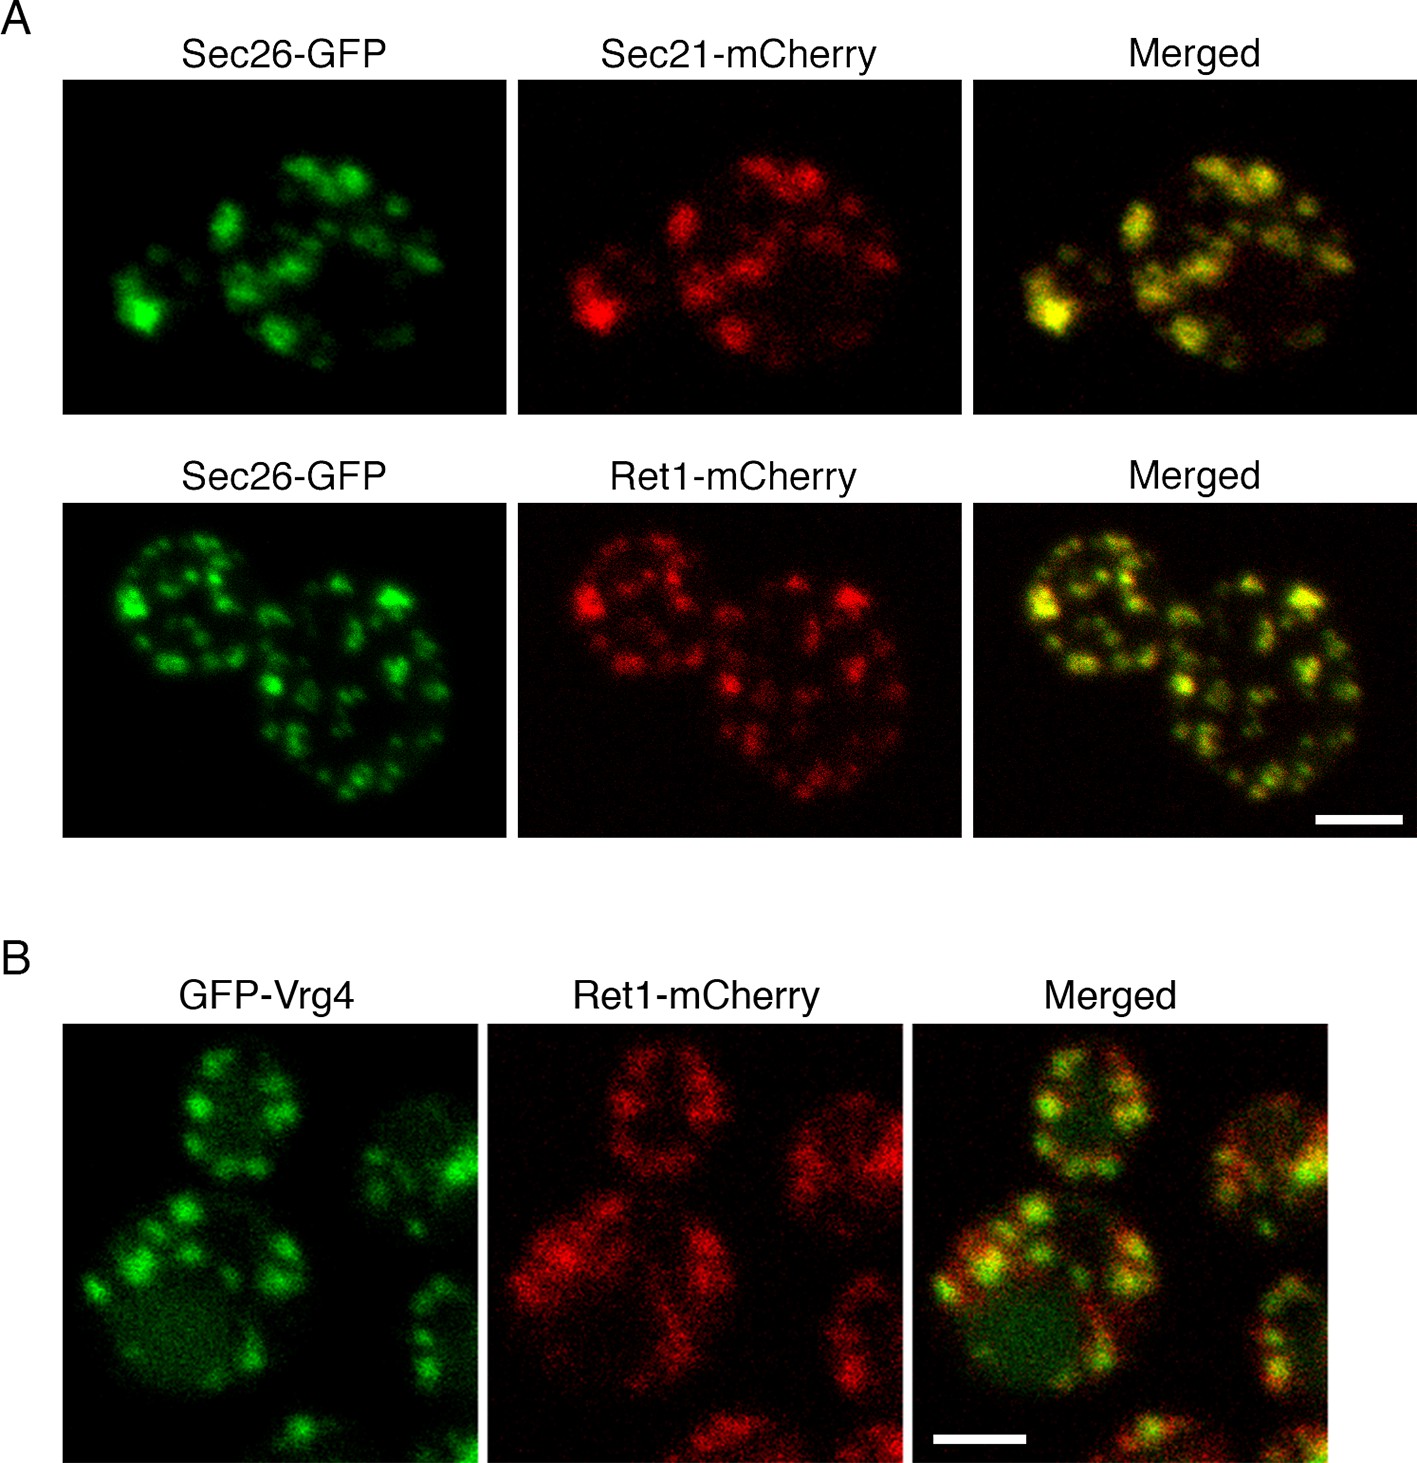
Localization of COPI subunits in yeast.
(A) COPI subunits were tagged by gene replacement to generate Sec26-GFP, Sec21-mCherry, or Ret1-mCherry. Cells grown in NSD medium at 23°C were imaged by confocal microscopy, and two-color Z-stacks were average projected. Projections from the red and green channels were overlaid to generate merged images. Representative cells are shown. Scale bar, 2 μm. (B) Ret1-mCherry was expressed together with the early Golgi marker GFP-Vrg4. Imaging conditions were as in (A). Scale bar, 2 μm.
Figure 2 with 2 supplements

Evaluation of tag-anchor combinations by growth curve analysis.
TOR1-1 fpr1△ strains were grown with shaking in YPD medium at 30°C to mid-log phase, then diluted in fresh medium to an optical density at 600 nm (OD600) of 0.15. Where indicated, rapamycin (“Rap”) was then added to 1 μg/mL. After further incubation at 30°C, aliquots were taken at the indicated time points to measure the OD600. (A) The function of Sec21 is preserved after tagging with wild-type FRB but is compromised after tagging with mutant FRB(T2098L). Gene replacement was used to extend Sec21 at the C-terminus with either wild-type FRB, or FRB(T2098L), or an FRB-MBP dual tag, or an FRB(T2098L)-MBP dual tag. A control strain expressed wild-type Sec21. (B) COPI can be inactivated by extending Sec21 with a single FRB tag followed by anchoring to ribosomes using the Rpl13A-FKBPx2 anchor, or by extending Sec21 with a double FRB tag followed by anchoring to mitochondria using the OM45-FKBPx4 anchor. (C) COPII can be inactivated by extending Sec31 with a single or double FRB tag followed by anchoring to either ribosomes or mitochondria.
Figure 2—figure supplement 1
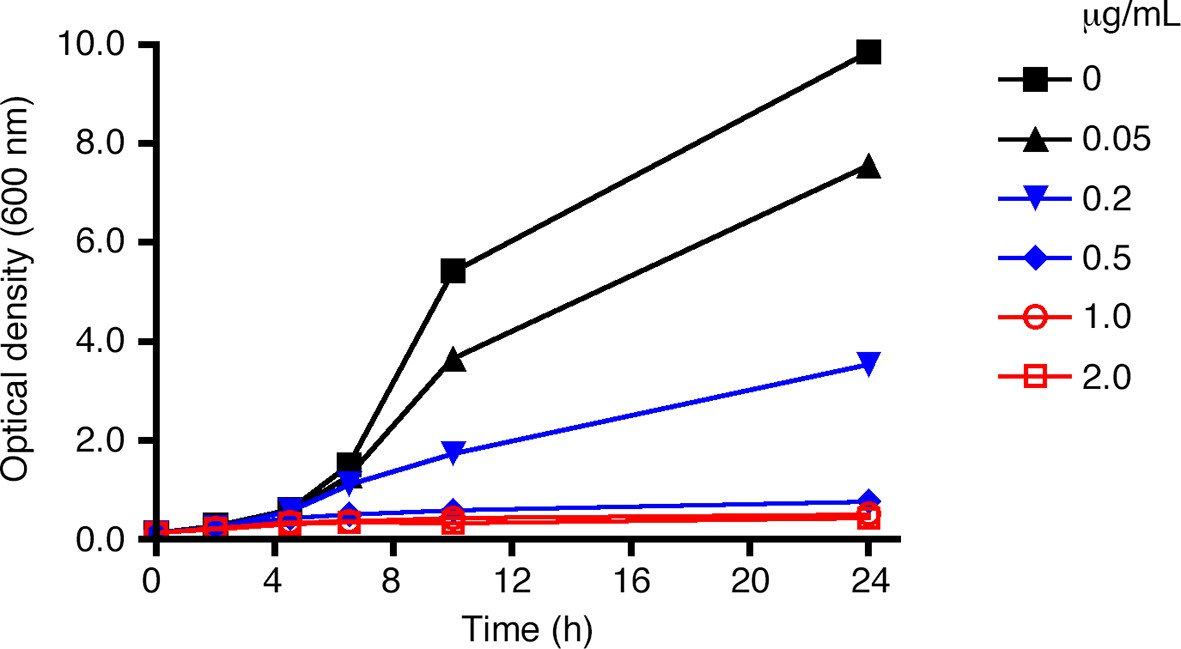
Effect of rapamycin concentration on anchor- mediated growth inhibition.
As in Figure 2, liquid cultures from a strain expressing Sec21-FRB and the Rpl13A-FKBPx2 anchor were treated with rapamycin, and growth was tracked by measuring the optical density at 600 nm for up to 24 hr. Rapamycin concentrations are indicated in μg/mL.
Figure 2—figure supplement 2
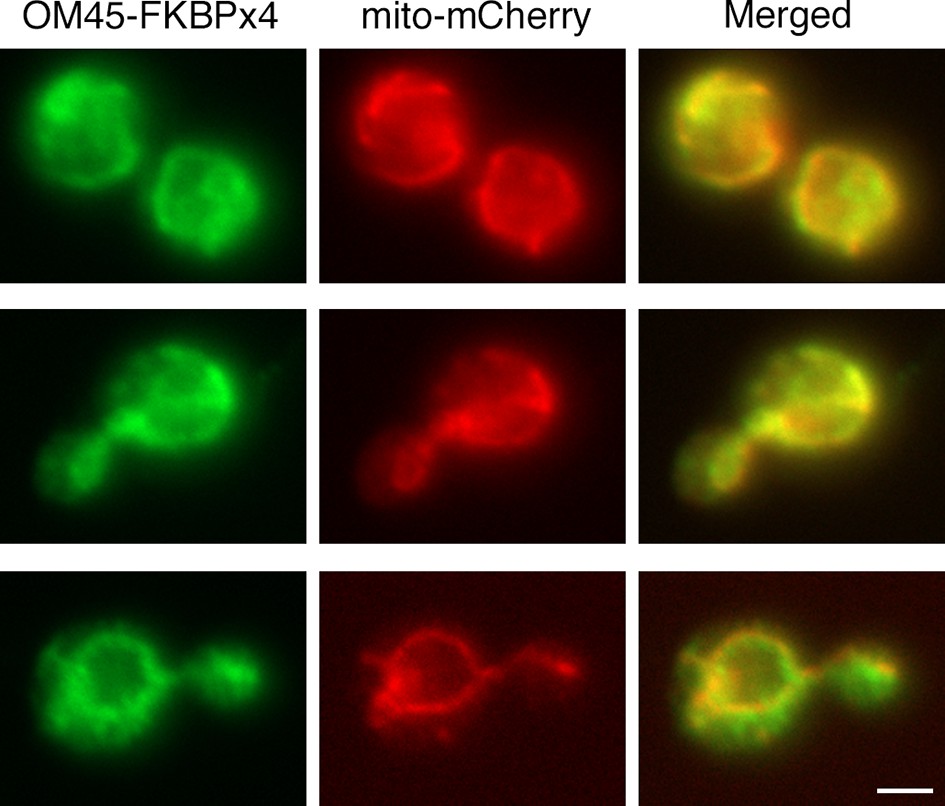
Localization of FKBP-tagged OM45 to mitochondria.
Cells containing mitochondria labeled with matrix-targeted mCherry (red) were engineered to express OM45-FKBPx4, which includes a single C-terminal HA epitope tag. The cells were processed for immunofluorescence microscopy using a polyclonal rabbit anti-HA antibody followed by Alexa Fluor 488-conjugated goat anti-rabbit IgG (green). Samples were then visualized by widefield microscopy. Merged images show colocalization of the green and red signals. Scale bar, 2 μm.
Figure 3 with 1 supplement
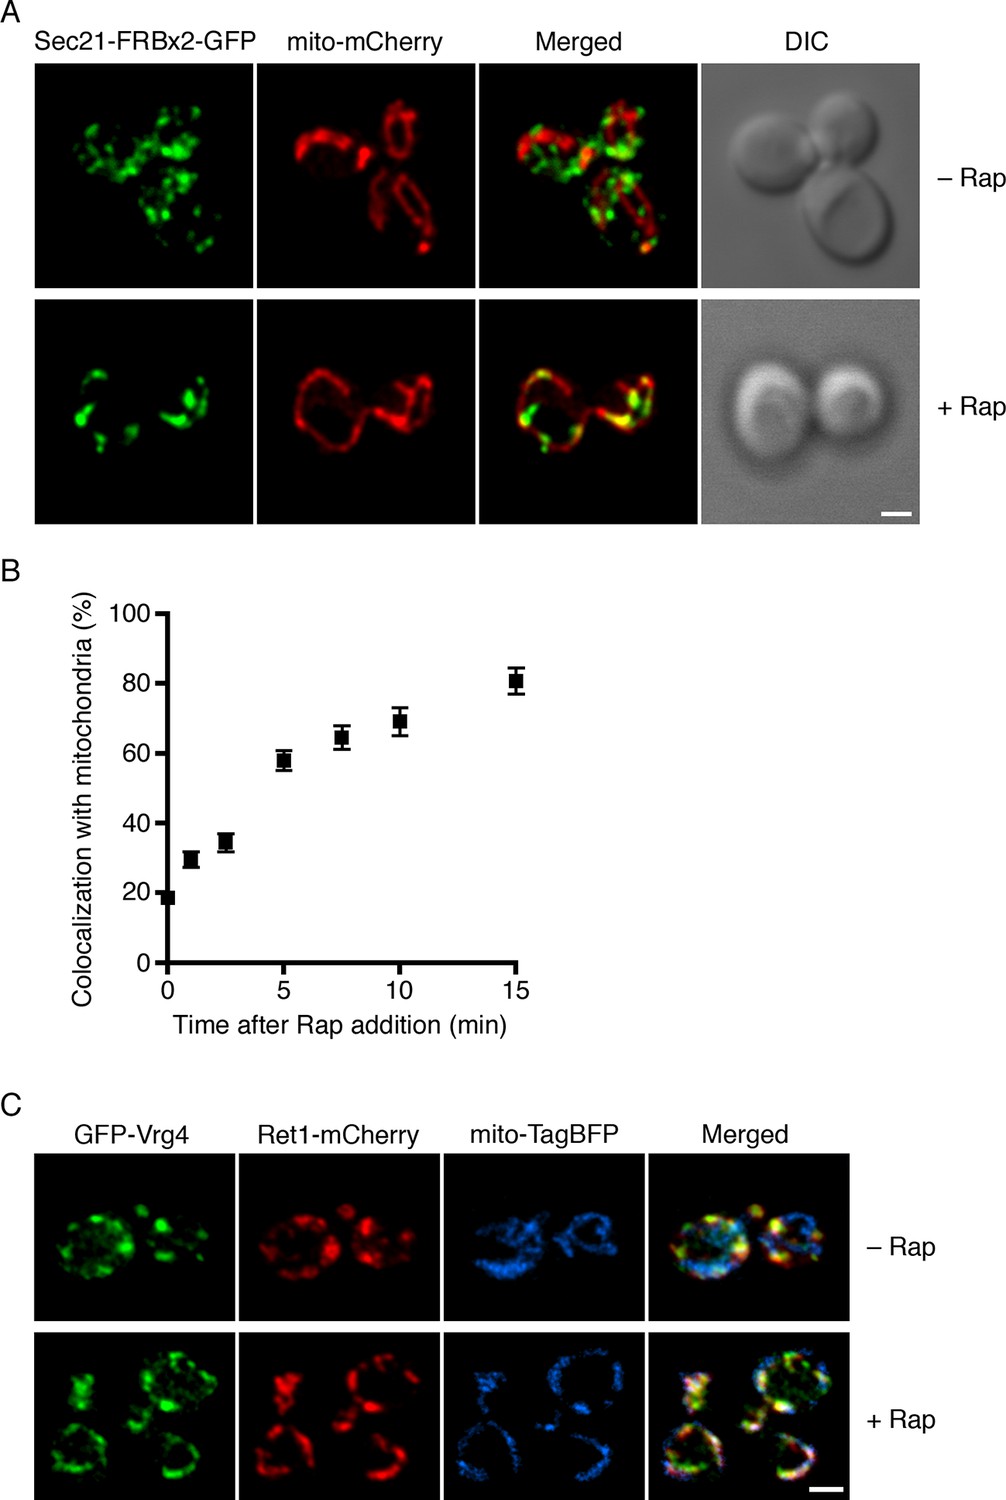
Visualization of COPI anchoring to mitochondria.
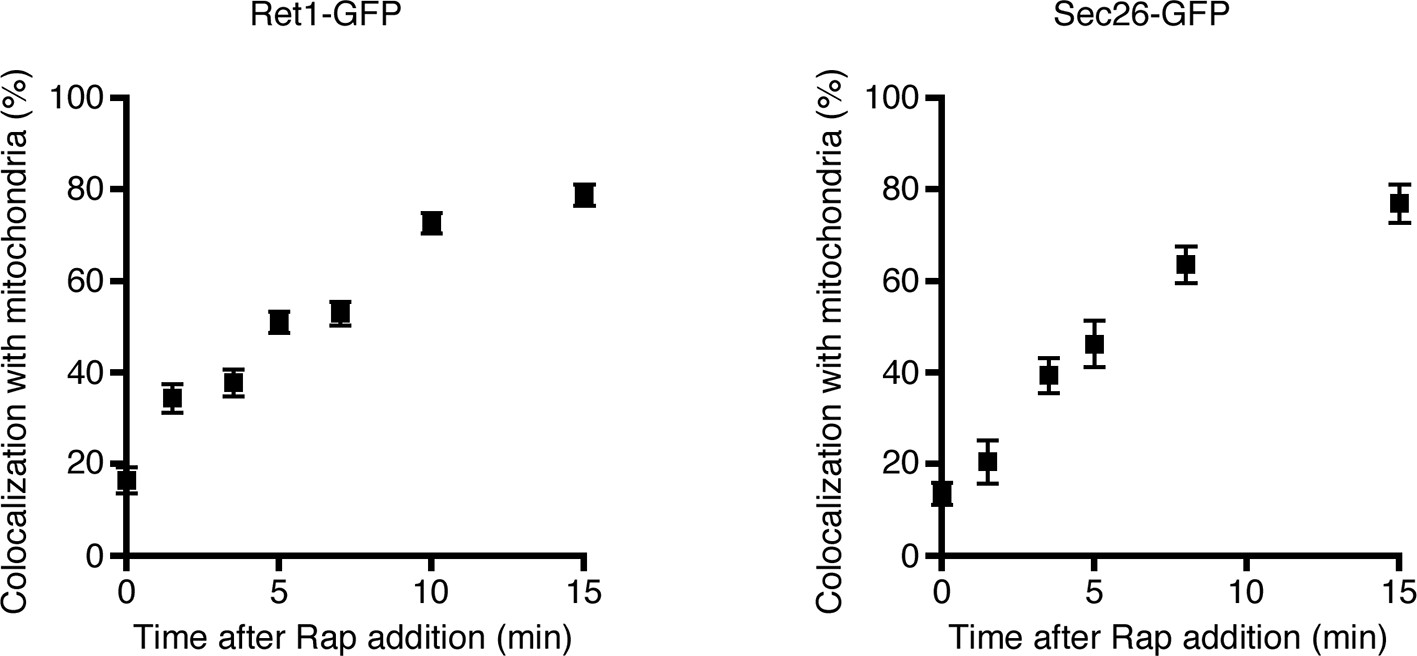
(A) Sec21 tagged with FRBx2-GFP can be anchored to mitochondria containing OM45-FKBPx4. The mitochondrial matrix was labeled with mCherry. Representative cells are shown before drug treatment, and after treatment for 10 min at 23°C with 1 μg/mL rapamycin (“Rap”). Cells were imaged by confocal microscopy followed by deconvolution. Scale bar, 2 µm. (B) Maximal anchoring to mitochondria occurs within 10–15 min. Anchoring of Sec21-FRBx2-GFP was quantified by measuring the fraction of the GFP signal that colocalized with the mCherry signal (Levi et al., 2010) at different times after rapamycin addition at 23°C. Approximately 20–30 cells were analyzed at each time point. Error bars show s.e.m. (C) Anchoring COPI also anchors early Golgi cisternae. Sec21 was tagged with FRBx2 in a strain with the OM45-FKBPx4 mitochondrial anchor. The strain also expressed GFP-Vrg4 to label early Golgi cisternae, Ret1-mCherry to label COPI, and mito-TagBFP to label the mitochondrial matrix. Cells were imaged before or after rapamycin addition as in (A).
Figure 3—figure supplement 1
Simultaneous anchoring of multiple COPI subunits to mitochondria.
Quantitation of time-dependent anchoring to mitochondria was performed as in Figure 3B, except that Sec21 was tagged with FRBx2 and the GFP tag was appended to either Ret1 or Sec26.
Figure 4 with 1 supplement

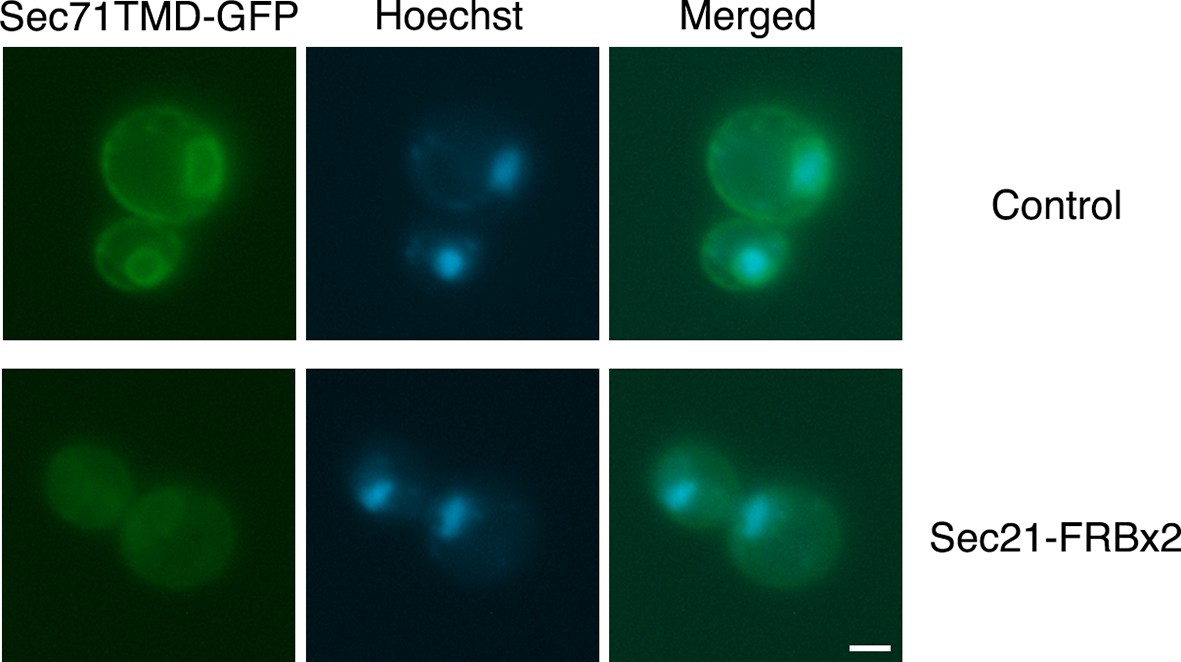
Depletion of Sec71TMD-GFP from the ER after COPI inactivation.
(A) Sec71TMD-GFP requires Rer1 for normal ER localization. An expression vector for Sec71TMD-GFP was integrated into the wild-type JK9-3da strain or into an isogenic rer1△ strain. Cells grown to log phase in NSD at 30°C were compressed beneath a coverslip and visualized in a single focal plane by widefield microscopy. Representative images taken at the same exposure are shown. Scale bar, 2 μm. (B) Anchoring of COPI causes loss of Sec71TMD-GFP from the ER. Both of the strains shown here contained integrating vectors for expressing the mitochondrial anchor OM45-FKBPx4 as well as Sec71TMD-GFP, and one strain also expressed Sec21-FRBx2 to anchor COPI. Cells growing at 30°C were incubated for 10 min with 0.0002% Hoechst 33342 to stain nuclei, followed by an additional treatment for up to 60 min with 1 μg/mL rapamycin (“Rap”). At the indicated time points after rapamycin addition, cells were compressed beneath a coverslip and visualized in a single focal plane by widefield microscopy. Representative images of GFP fluorescence are shown. Scale bar, 2 μm. (C) The data from (B) were quantified by measuring the GFP fluorescence signals from nuclei as a proxy for the ER signals. For this purpose, the signal in the blue channel was used to select nuclei in ImageJ using the Magic Wand tool. These selections were expanded by 12 pixels to include the nuclear envelope, and the GFP fluorescence from the selected areas in the green channel was quantified. Plotted are average fluorescence signals per unit area. Each data point was derived from approximately 40–80 cells, and was adjusted by subtracting an average background signal from nuclei in the parental strain lacking GFP. The dashed line represents the average background-corrected nuclear fluorescence signal from rer1Δ cells that exhibited low to moderate vacuolar fluorescence.
Figure 4—figure supplement 1
Labeling of nuclei to quantify Sec71TMD-GFP fluorescence in the nuclear envelope.
Representative cells are shown from the analysis in Figure 4B,C at 60 min after rapamycin addition. The Sec71TMD-GFP fluorescence signal is shown in green, and cellular DNA stained with Hoechst dye is shown in blue. Hoechst-labeled nuclei were used to identify the nuclear envelope component of the Sec71TMD-GFP signal.
Figure 5 with 3 supplements
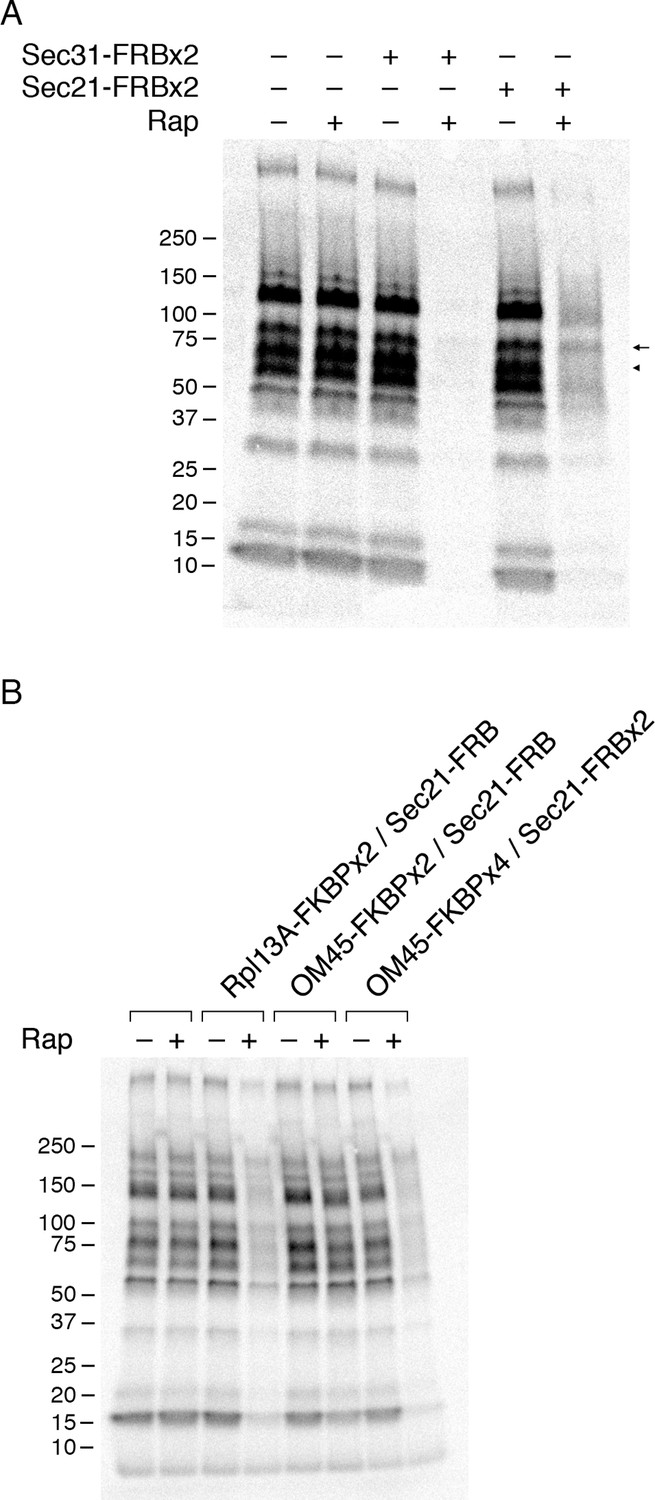
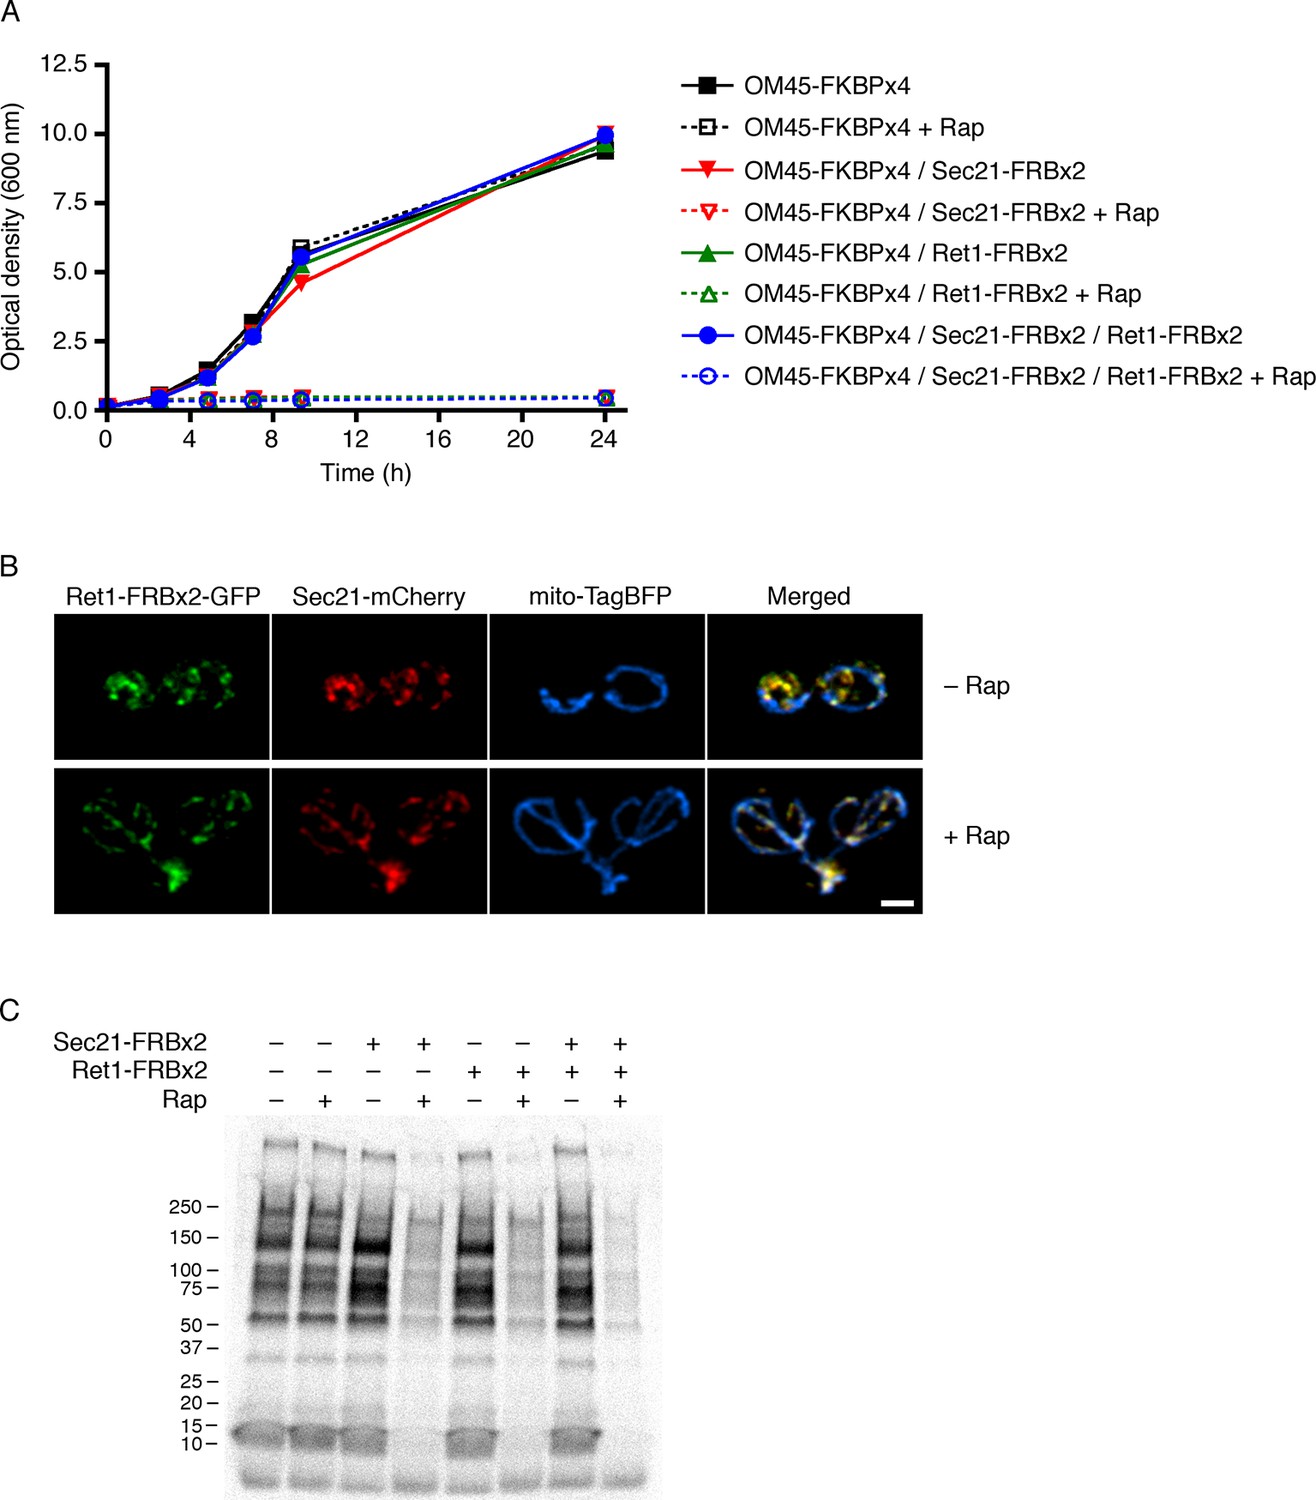
Effects of anchoring COPI or COPII on general secretion.
(A) Anchoring COPII inhibits secretion more strongly than anchoring COPI. The yeast strains used here all expressed the mitochondrial anchor OM45-FKBPx4. Where indicated, a strain also expressed either Sec31-FRBx2 to anchor COPII, or Sec21-FRBx2 to anchor COPI. Cells growing at 30°C were either left untreated or treated for 10 min with 1 μg/mL rapamycin (“Rap”), then pulsed for 10 min with 35S amino acids, then chased for 30 min. The culture medium was analyzed by SDS-PAGE and autoradiography to detect secreted proteins that had been labeled during the pulse. Numbers represent the molecular weight in kDa of marker proteins. After anchoring COPI, the arrow marks a band of secreted protein that was only partially diminished, and the arrowhead marks a band of secreted protein that was severely diminished. (B) Efficient anchoring of Sec21 requires two copies of FRB with a mitochondrial anchor but only one copy of FRB with a ribosomal anchor. General secretion was visualized by a pulse-chase procedure as in (A), except that the control strain expressed neither an anchor nor an FRB-tagged protein. Where indicated, a strain expressed either a ribosomal Rpl13A-FKBPx2 anchor or a mitochondrial OM45-FKBPx2 or OM45-FKBPx4 anchor, plus either Sec21-FRB or Sec21-FRBx2.
Figure 5—figure supplement 1
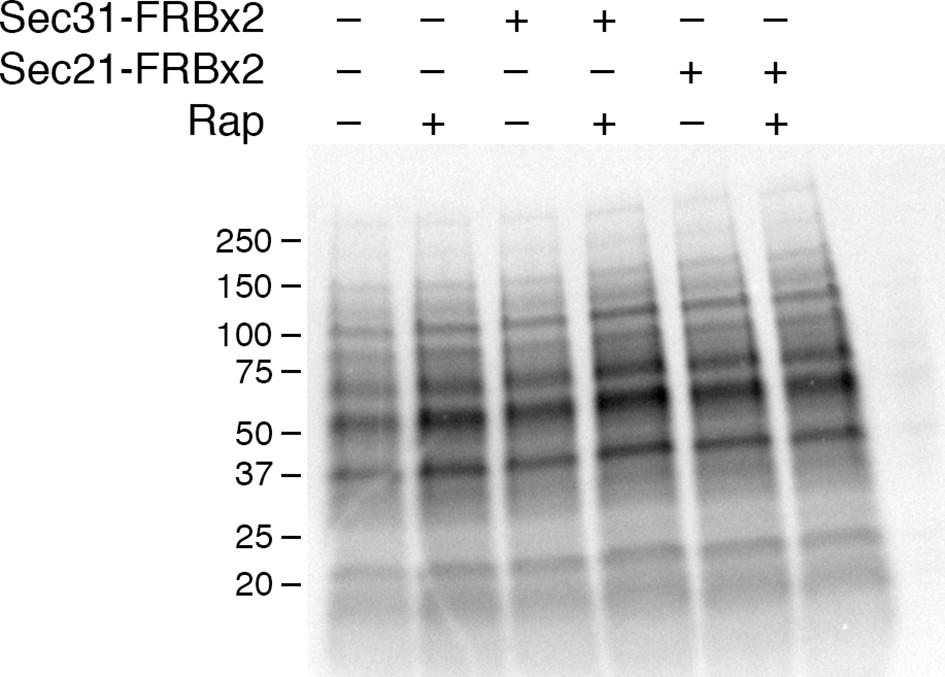
Insensitivity of cellular protein synthesis to rapamycin.
The experimental procedure was identical to the one in Figure 5A, except that cellular proteins were analyzed rather than proteins secreted into the culture medium. A control (data not shown) confirmed that as in Figure 5A, rapamycin inhibited general secretion completely when COPII was anchored away, but only partially when COPI was anchored away. Numbers represent the molecular weight in kDa of marker proteins.
Figure 5—figure supplement 2
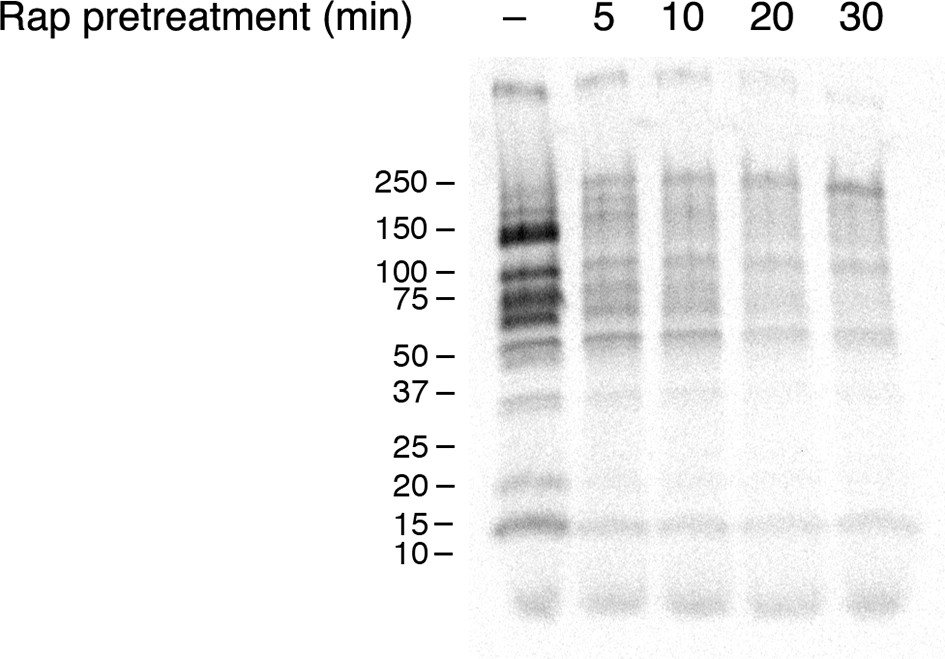
Time course of the rapamycin effect on general secretion.
The yeast strain expressed the mitochondrial anchor OM45-FKBPx4, and also expressed Sec21-FRBx2 to anchor COPI. Cells growing at 30°C were either left untreated or treated for the indicated times with 2 μg/mL rapamycin (“Rap”), then pulsed for 10 min with 35S amino acids, then chased for 30 min. The culture medium was analyzed by SDS-PAGE and autoradiography to detect secreted proteins that had been labeled during the pulse. Numbers represent the molecular weight in kDa of marker proteins.
Figure 5—figure supplement 3
Partial inhibition of secretion after anchoring different COPI subunits.
(A) Growth was monitored with or without rapamycin addition as in Figure 2. The parental strain carried the OM45-FKBPx4 anchor. Where indicated, the strains also carried Sec21-FRBx2 or Ret1-FRBx2 or both. (B) A strain carrying the OM45-FKBPx2 anchor was modified to express Ret1-FRBx2-GFP and Sec21-mCherry. Confocal microscopy revealed that addition of 1 μg/mL rapamycin (“Rap”) for 10 min at 23°C anchored both tagged COPI subunits to mitochondria, which were labeled with mito-TagBFP. Scale bar, 2 μm. (C) The strains in (A) were subjected to pulse-chase analysis to detect general secretion as in Figure 5A.
Figure 6 with 2 supplements
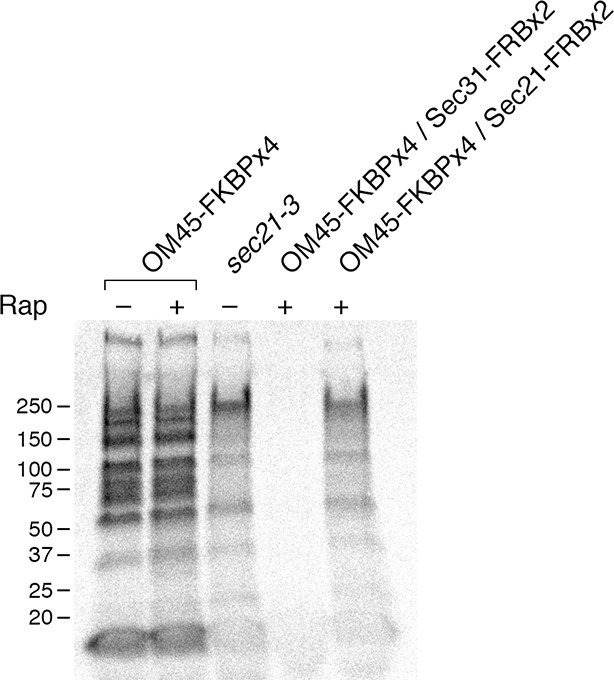
Comparison of methods for inactivating Sec21.
General secretion was visualized by a pulse-chase analysis as in Figure 5A, except that cells were grown at 23°C and then shifted to 37°C for 30 min before the procedure. A control strain expressed the mitochondrial OM45-FKBPx4 anchor. Where indicated, a strain expressed OM45-FKBPx4 plus either Sec31-FRBx2 to anchor COPII or Sec21-FRBx2 to anchor COPI. The sec21-3 mutation was in the parental strain background. “Rap” indicates a 10-min treatment with 1 μg/mL rapamycin prior to the pulse. Numbers represent the molecular weight in kDa of marker proteins.
Figure 6—figure supplement 1
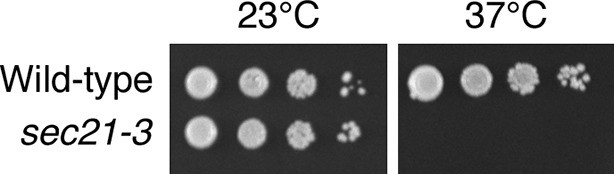
Thermosensitivity of the sec21-3 strain.
Ten μL of 10-fold serial dilutions of wild-type or isogenic sec21-3 mutant cells were spotted in parallel on two YPD plates. The plates were then incubated for two days at either 23°C or 37°C.
Figure 6—figure supplement 2
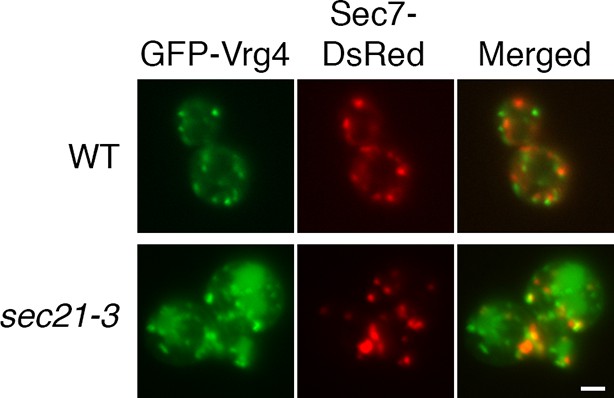
Perturbed Golgi structure in sec21-3 cells at the permissive temperature.
A wild-type strain or an isogenic sec21-3 strain were transformed to express the early Golgi marker GFP-Vrg4 and the late Golgi marker Sec7-DsRed. Cells were imaged at 23°C by widefield microscopy. Representative cells are shown. Scale bar, 2 µm.
Figure 7 with 2 supplements
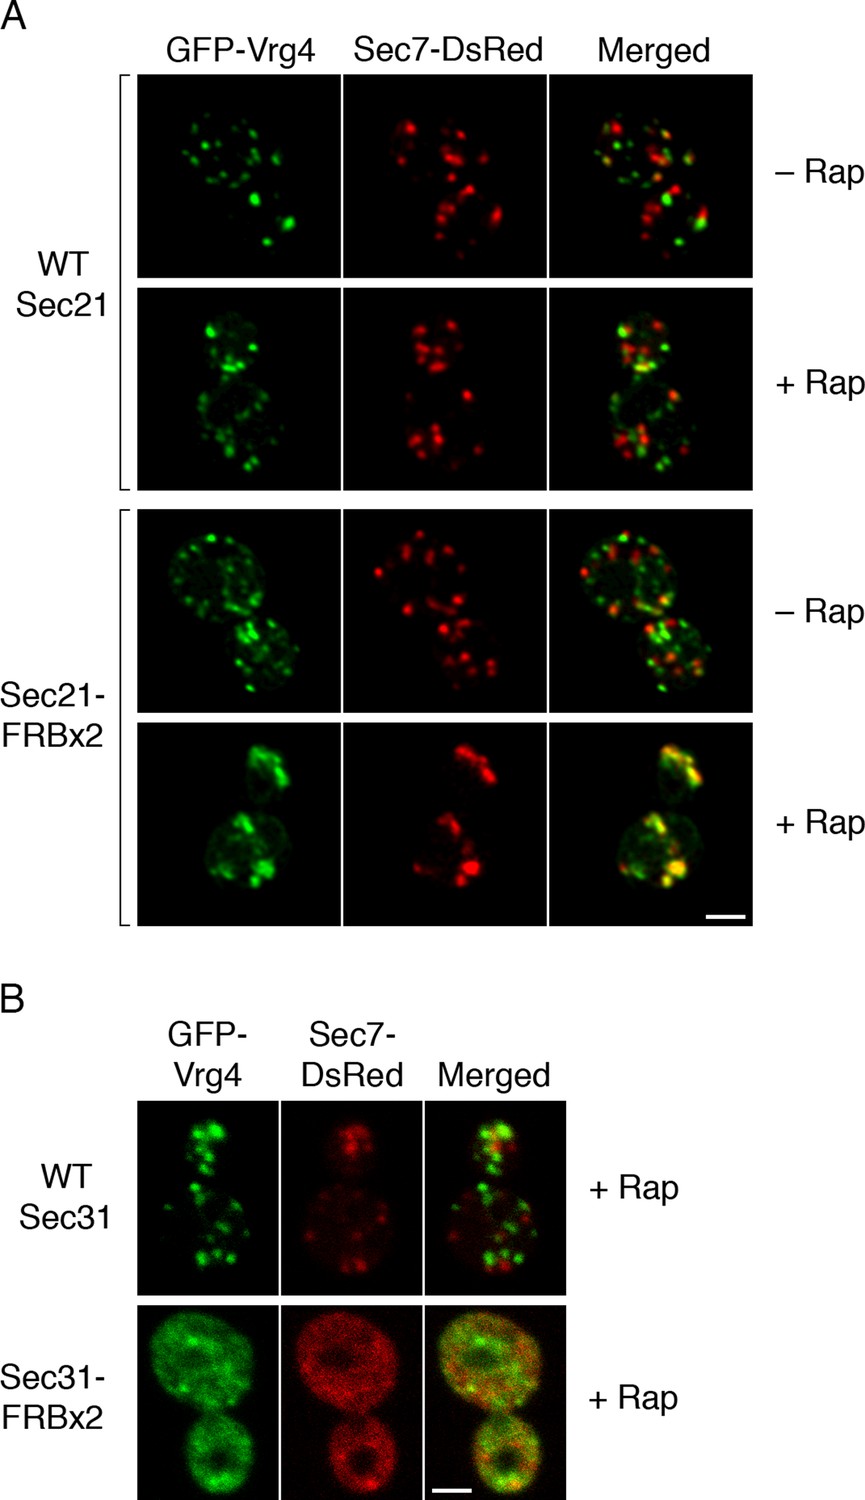
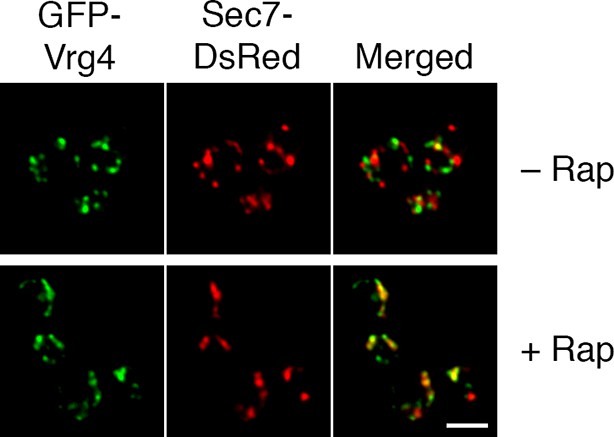
Effects of anchoring COPI or COPII on Golgi organization.
(A) Anchoring COPI leads to association of early and late Golgi markers. A strain carrying the OM45-FKBPx4 anchor was transformed to express the early Golgi marker GFP-Vrg4 and the late Golgi marker Sec7-DsRed. A derivative strain also expressed Sec21-FRBx2 to anchor COPI. Cells were grown and imaged as in Figure 1, except that the confocal images were deconvolved. “+ Rap” indicates a 10-min treatment with 1 μg/mL rapamycin prior to imaging. Scale bar, 2 μm. (B) Anchoring COPII does not lead to association of early and late Golgi markers. The experiment was performed with rapamycin addition as in (A), except that the strain expressed Sec31-FRBx2 to anchor COPII, and deconvolution was omitted. Similar results were seen when COPII was anchored to mitochondria by incubating with rapamycin for 10 min as in the figure, or for 20 min (data not shown).
Figure 7—figure supplement 1
Formation of hybrid Golgi structures with a ribosomal anchor.
The analysis was performed as in the lower half of Figure 7A, except that the strain carried the Rpl13A-FKBPx2 ribosomal anchor plus Sec21-FRB to anchor COPI. Scale bar, 2 μm.
Figure 7—figure supplement 2
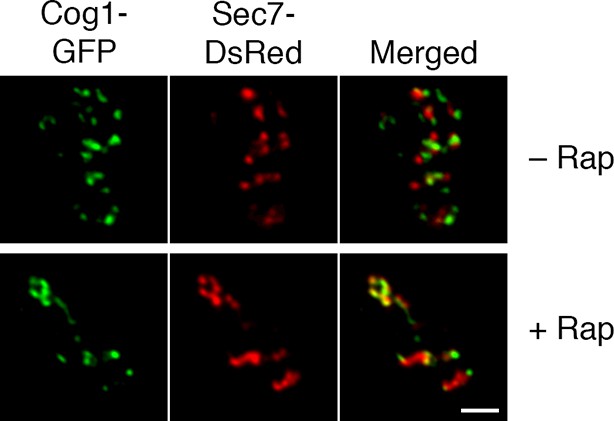
Visualization of hybrid Golgi structures with an alternative early Golgi marker.
The analysis was performed as in the lower half of Figure 7A, except that the early Golgi was marked with Cog1-GFP. Scale bar, 2 μm.
Figure 8
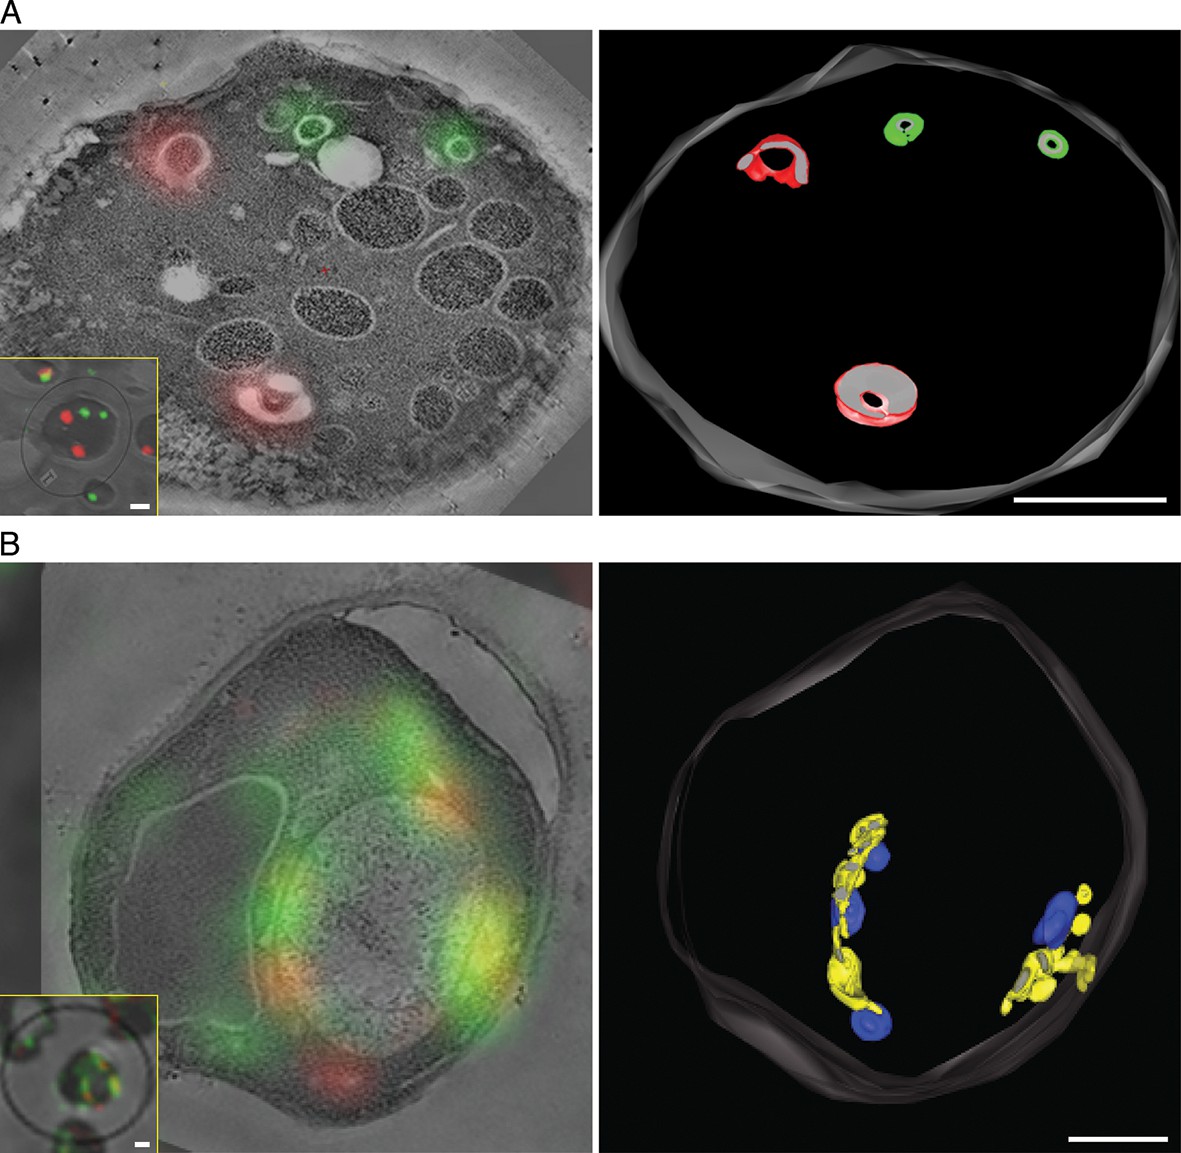
Correlative fluorescence microscopy and electron tomography of the yeast Golgi.
The yeast strain expressed GFP-Vrg4 and Sec7-DsRed, as well as OM45-FKBPx4 as a mitochondrial anchor plus Sec21-FRBx2 to anchor COPI. Cells were frozen, freeze substituted, and embedded in plastic in a manner that preserved fluorescence. Plastic sections were then examined by fluorescence microscopy followed by STEM tomography. The figures show either (A) a section ~0.5 μm thick from a representative untreated cell, or (B) a section ~1.0 μm thick from a representative cell after treatment for 10 min with 1 μg/mL rapamycin. In each case, the left panel shows the fluorescence signals overlaid on a projection of five 3- to 4-nm tomographic slices, the inset shows fluorescence and differential interference contrast analysis of the same cell, and the right panel shows a tomographic model of the relevant labeled structures. Full tomographic reconstructions for the untreated and rapamycin-treated cells are animated in Video 1 and Video 2, respectively. Green indicates early Golgi cisternae, red indicates late Golgi cisternae, yellow indicates hybrid Golgi structures, and blue indicates mitochondria. Scale bars, 1 μm.
Figure 9 with 1 supplement
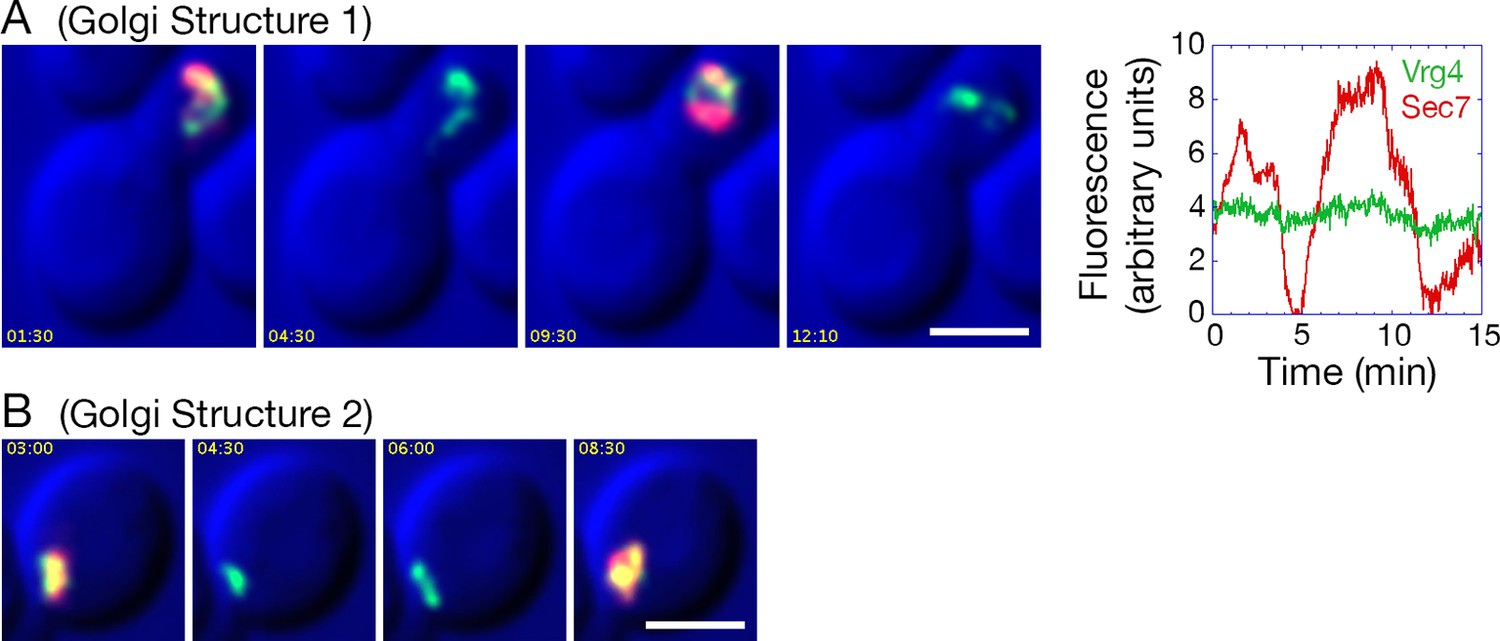
Effects of anchoring COPI on Golgi maturation dynamics.
A strain expressing the OM45-FKBPx4 anchor as well as Sec21-FRBx2 was transformed to express the early Golgi marker GFP-Vrg4 and the late Golgi marker Sec7-DsRed. Logarithmically growing cells were attached to a coverglass-bottom dish, and were then treated with 1 μg/mL rapamycin for 10 min, followed by dual-color 4D confocal imaging to generate Video 3. Edited data sets were generated to analyze the two hybrid Golgi structures marked in Figure 9—figure supplement 1, yielding Video 4 for Golgi Structure 1 and Video 5 for Golgi Structure 2. Times are indicated in min:sec format. Scale bars, 2 μm. (A) Representative frames are shown from Video 4, and the green and red fluorescence intensities from Golgi Structure 1 are plotted versus time. (B) Representative frames are shown from Video 5.
Figure 9—figure supplement 1
Sample frame from Video 3.
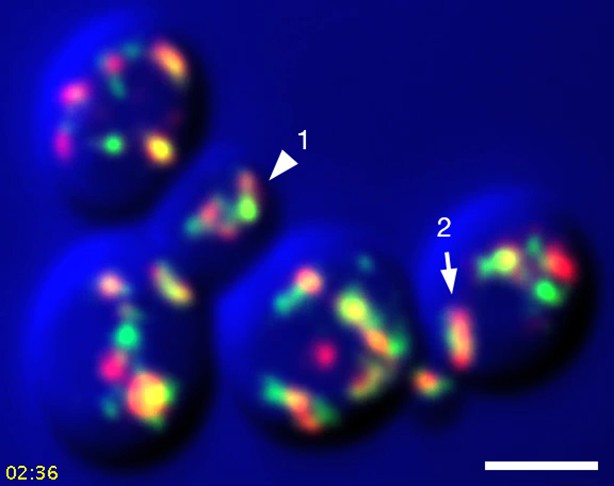
This frame from Video 3 shows the two cisternae that were analyzed in Video 4, Video 5, and Figure 9. The arrowhead indicates Golgi Structure 1 and the arrow indicates Golgi Structure 2.
Figure 10 with 1 supplement
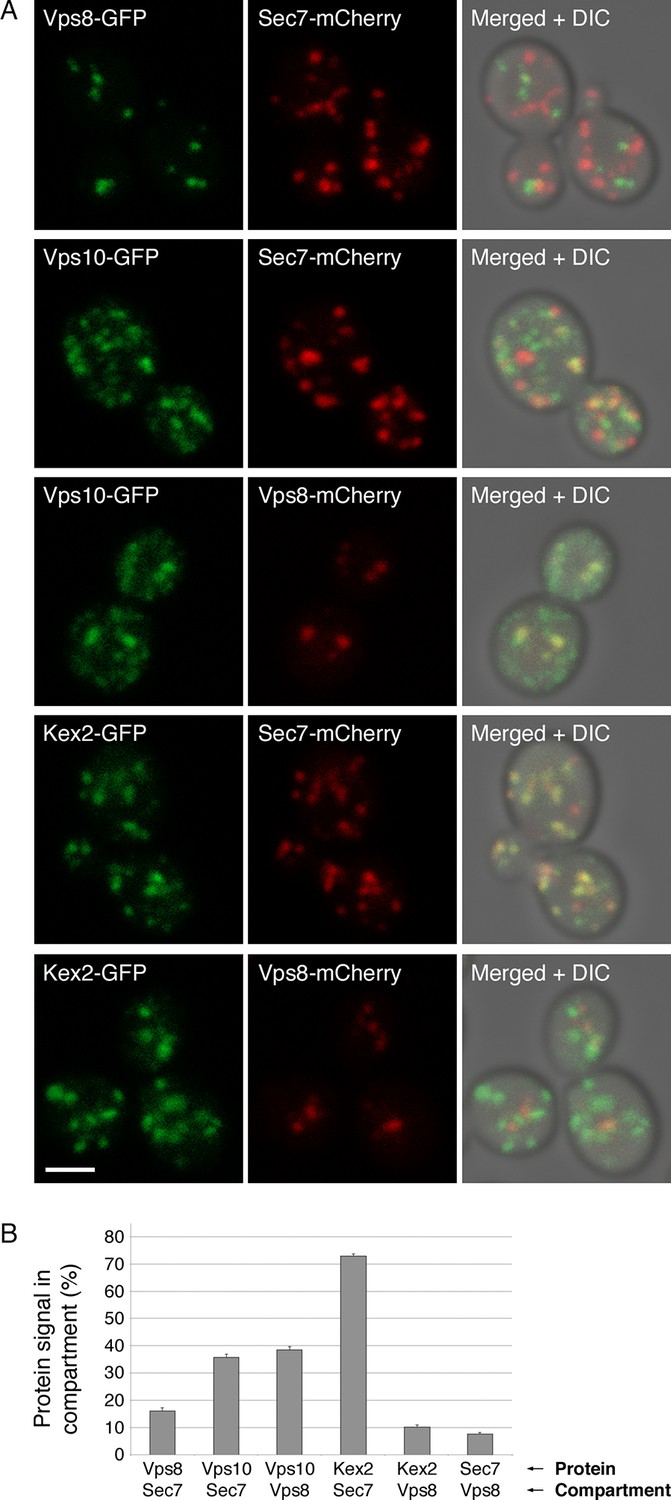
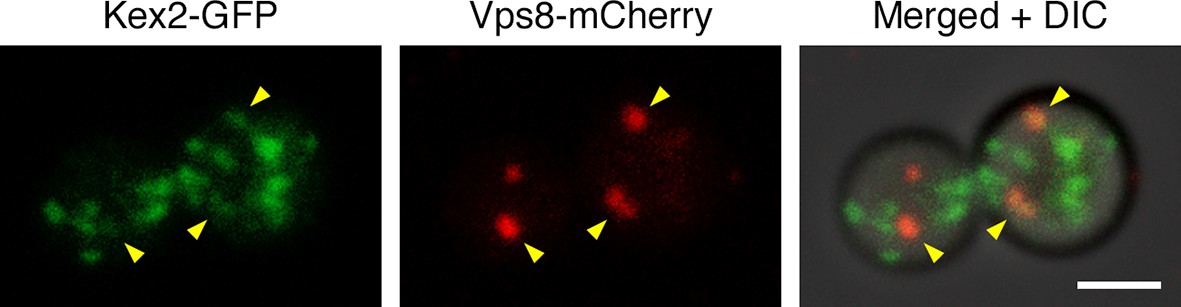
Distinct localization patterns of tagged Vps10 and Kex2.
(A) Vps10-GFP localizes to both the Golgi and prevacuolar endosomes whereas Kex2-GFP is largely restricted to the Golgi. Late Golgi compartments were tagged with Sec7-mCherry, or else prevacuolar endosome compartments were tagged with Vps8-mCherry. The localizations of the Vps10-GFP and Kex2-GFP proteins were then examined with reference to these two compartments. As a control, Vps8-GFP was expressed together with Sec7-mCherry to confirm that the two compartments were separate. Representative projected confocal images are shown. Scale bar, 2 μm. (B) Quantitation of the data from (A). To analyze an image, a mask was created from the punctate compartment signal, and the percentage of the protein signal visible through the mask was then measured (Levi et al., 2010). For each strain, 40 images with ~2–4 cells per image were quantified. Bars represent mean percentage values with s.e.m. Based on the analysis of Vps8 and Sec, the background signal due to chance overlap in this assay was approximately 8–16%.
Figure 10—figure supplement 1
Example of an unusual cell with some Kex2-GFP visible in prevacuolar endosomes.
In the experiment of Figure 10A,a fraction of the cells had weak but detectable Kex2-GFP signal overlapping with the Vps8-mCherry signal from prevacuolar endosomes, as indicated by the arrowheads in this example. Scale bar, 2 μm.
Figure 11 with 1 supplement
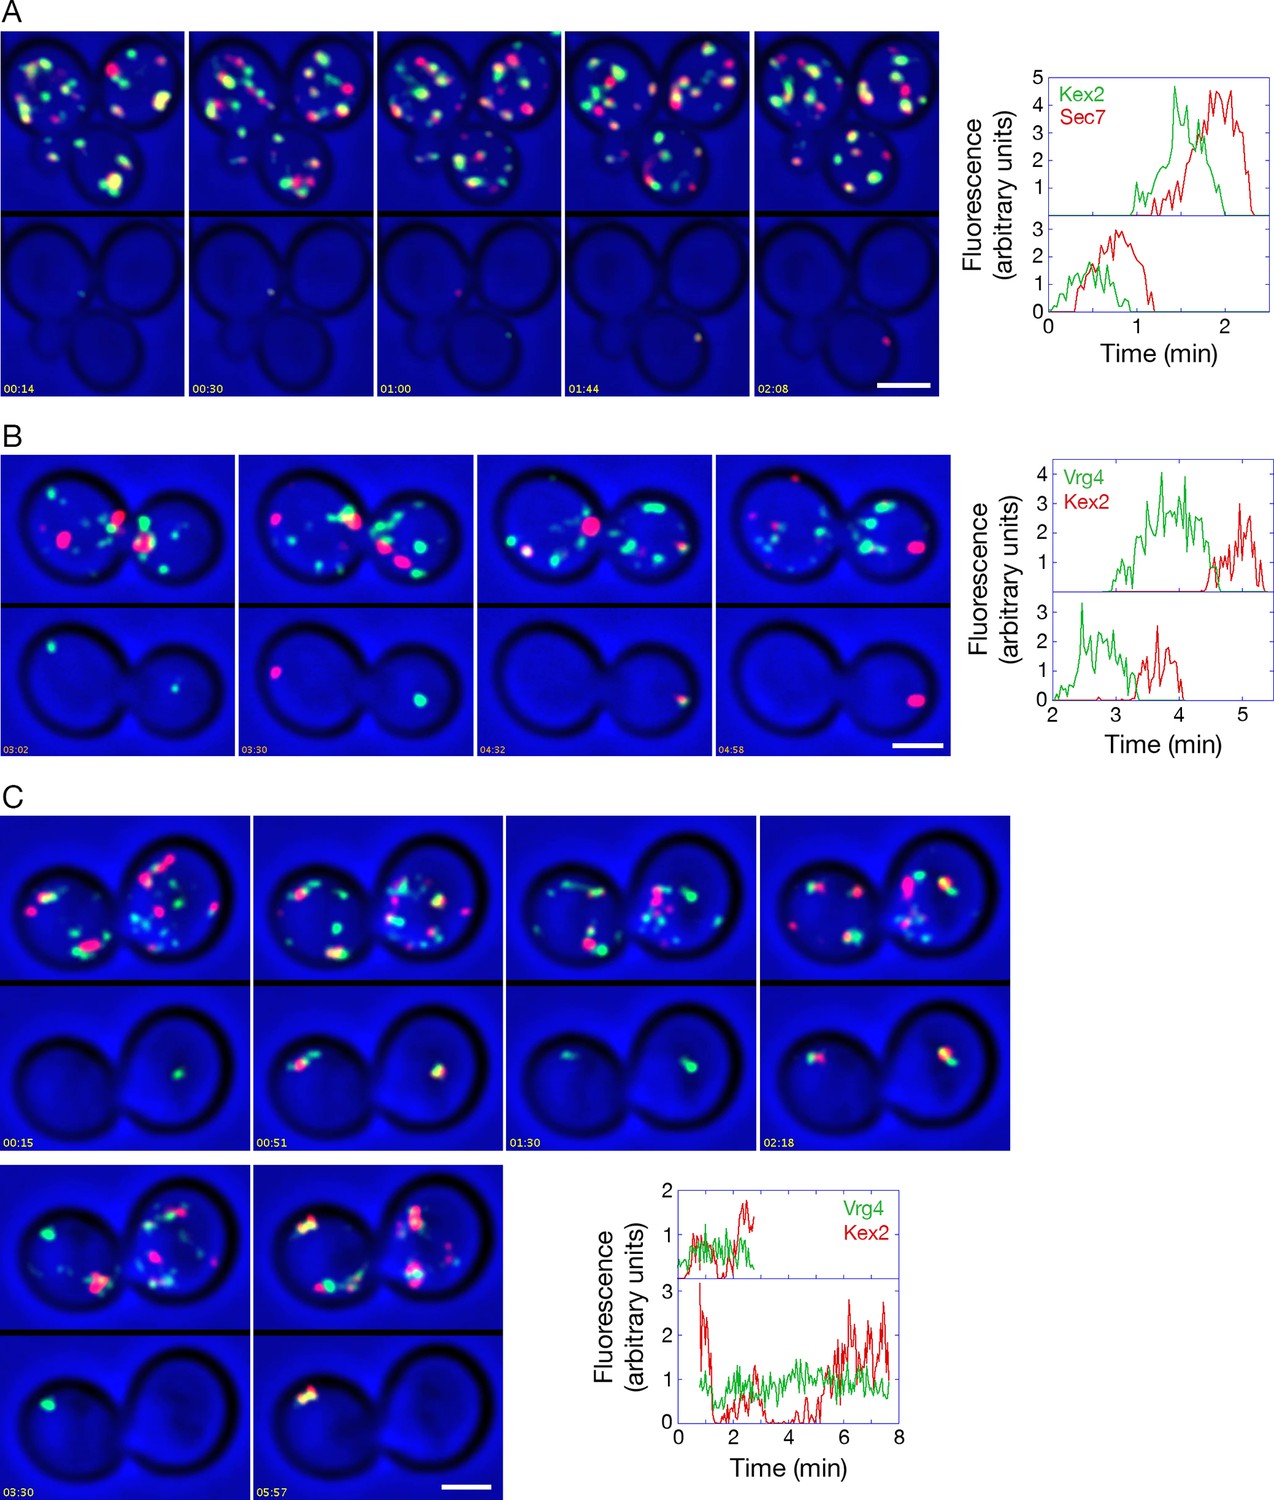
Analysis of Kex2 maturation dynamics with functional or inactivated COPI.
(A) Kex2 maturation dynamics are slightly offset from those of Sec7. Cells expressing Kex2-GFP and Sec7-mCherry were attached to a coverglass-bottom dish and imaged by dual-color 4D confocal microscopy to generate Video 6, in which the top panel is the unedited movie and the bottom panel was generated from edited data sets used to quantify the fluorescence intensities from two cisternae. Representative frames from Video 6 are shown together with the quantitation. Plotted in the bottom panel is fluorescence from the cisterna in the cell at the upper left, and plotted in the top panel is fluorescence from the cisterna in the cell at the lower right. Scale bar, 2 μm. (B) GFP-Vrg4 departs as Kex2-mCherry arrives during cisternal maturation. Imaging was performed as in (A), and representative frames from Video 8 are shown together with the quantitation. Plotted in the bottom panel is fluorescence from the cisterna in the cell at the left, and plotted in the top panel is fluorescence from the cisterna in the cell at the right. Scale bar, 2 μm. (C) After COPI inactivation, GFP-Vrg4 persists in Golgi structures while Kex2-mCherry cycles. Imaging was performed as in (A), and representative frames from Video 9 are shown together with the quantitation. Plotted in the bottom panel is fluorescence from the Golgi structure in the cell at the left, and plotted in the top panel is fluorescence from the Golgi structure in the cell at the right. These two Golgi structures were tracked for as long as they could be resolved from other fluorescent structures. Scale bar, 2 μm.
Figure 11—figure supplement 1
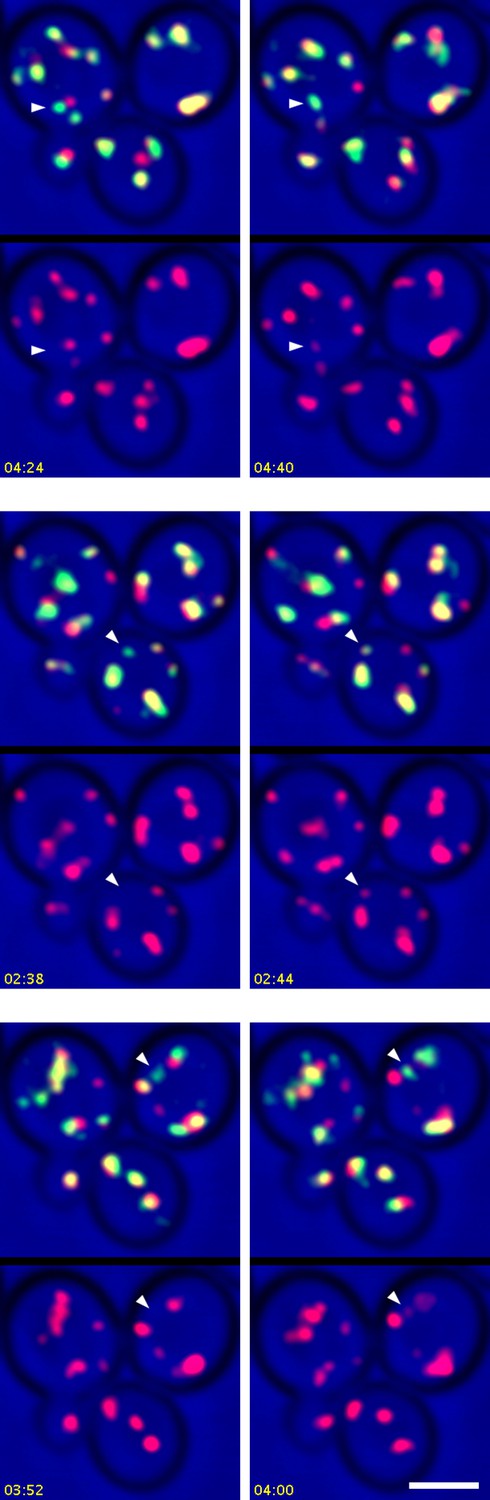
Additional examples showing the appearance of Sec7 in Kex2-containing structures.
In Video 7, Kex2-GFP-containing structures from Video 6 were analyzed only if they could be tracked for at least 30 s after becoming visible, but additional structures that could not be tracked for the full 30 s showed initial labeling with Kex2-GFP and subsequent appearance of Sec7-mCherry. Three examples are illustrated here. See Video 7 for further details.
Figure 12
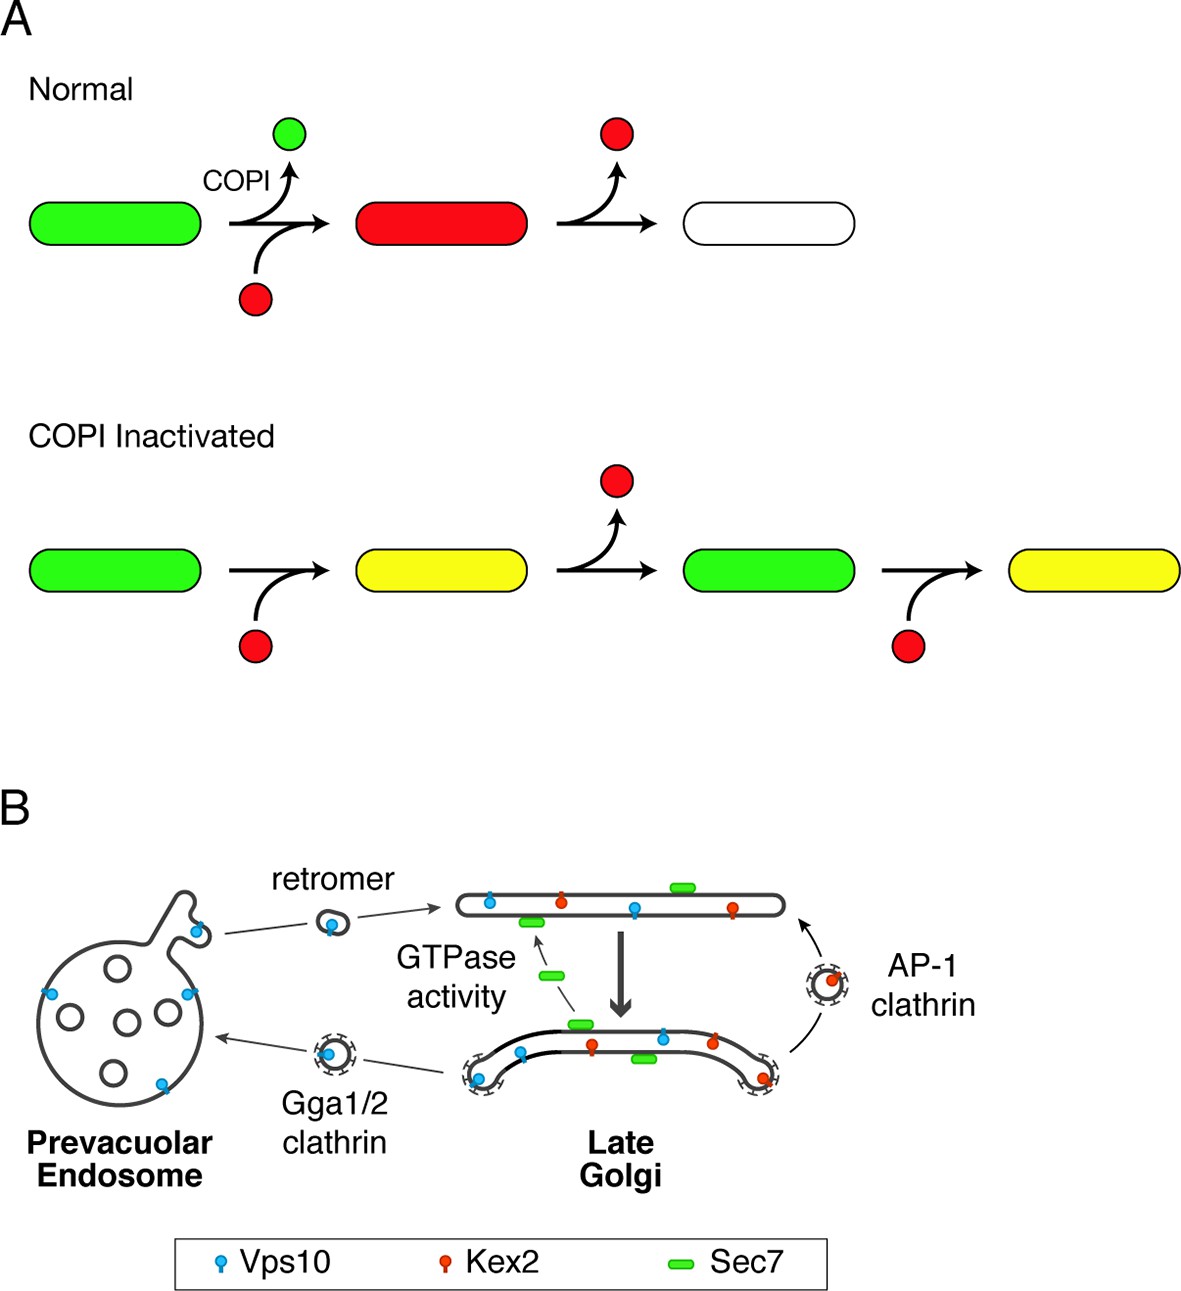
Working hypotheses for Golgi protein recycling by COPI-dependent and COPI-independent pathways.
(A) The existence of multiple intra-Golgi recycling pathways can explain why inactivating COPI generates hybrid structures that repeatedly gain and lose late Golgi proteins. Green represents early Golgi proteins that recycle in COPI vesicles, and red represents late Golgi proteins that recycle by COPI-independent pathways. Under normal conditions, early Golgi proteins depart while late Golgi proteins arrive, and then late Golgi proteins depart in turn. When COPI is inactivated, the recycling of early Golgi proteins is inhibited, so when late Golgi proteins arrive, a hybrid structure is generated. This hybrid structure can subsequently lose late Golgi proteins by COPI-independent pathways, and then the process begins again. (B) During maturation of the late Golgi, proteins are likely to recycle by several pathways. The thick arrow represents cisternal maturation that occurs during and after conversion to a late Golgi compartment (Daboussi et al., 2012; Day et al., 2013). Peripheral membrane proteins such as Sec7 are recruited to late Golgi cisternae by activated GTPases, and are subsequently released from the membrane by GTP hydrolysis. Some transmembrane proteins such as Vps10 travel to the prevacuolar endosome in clathrin-coated vesicles with the aid of the Gga1 and Gga2 adaptors, and then recycle to newly formed late Golgi cisternae with the aid of cargo scaffolds such as retromer. Other transmembrane proteins such as Kex2 are postulated to recycle from older to younger late Golgi cisternae in clathrin-coated vesicles with the aid of the AP-1 adaptor.
Videos
Video 1
Tomographic reconstruction of Golgi cisternae in an untreated cell.
Yeast cells were analyzed by STEM tomography as described in Figure 8. The first third of the movie shows every tenth tomographic slice. The second third of the movie shows the same tomographic slices after contours were traced to label early Golgi membranes green and late Golgi membranes red. The final third of the movie shows a rotation of the tomographic model. See also Figure 8A.
Video 2
Tomographic reconstruction of hybrid Golgi structures in a cell that was treated with rapamycin to inactivate COPI.
The procedure was the same as for Video 1, except that COPI was inactivated prior to freezing the cells. Putative Golgi membranes are labeled yellow and mitochondrial outer membranes are labeled blue. See also Figure 8B.
Video 3
Dynamics of Vrg4 and Sec7 after anchoring COPI.
Cells in which Sec21 had been anchored to mitochondria were imaged by dual-color 4D confocal microscopy to visualize the dynamics of the early Golgi marker GFP-Vrg4 and the late Golgi marker Sec7-DsRed. Scattered light images were recorded in the blue channel. Complete Z-stacks were collected every 2 s for 15 min, and the data were deconvolved, bleach corrected, and average projected. See also Figure 9.
Video 4
Edited movie showing Golgi Structure 1 from Video 3.
Video 3 was cropped to include only a single budded cell. At each time point, a montage of the Z-stack was generated, and fluorescence signals were erased for all structures except the one marked with the arrowhead in Figure 9—figure supplement 1. This structure was designated Golgi Structure 1. An edited version of the cropped movie was then generated. See also Figure 9A.
Video 5
Edited movie showing Golgi Structure 2 from Video 3.
Video 3 was cropped to include only a single cell. The procedure was the same as for Video 4, except that this edited movie displays Golgi Structure 2, which is marked with an arrow in Figure 9—figure supplement 1. See also Figure 9B.
Video 6
Combined original and edited movie comparing the dynamics of Kex2 and Sec7.
Cells expressing Kex2-GFP and Sec7-mCherry were imaged by dual-color 4D confocal microscopy. Scattered light images were recorded in the blue channel. Complete Z-stacks were collected every 2 s for 5 min, and the data were deconvolved, bleach corrected, and average projected. Edited movies tracking two representative cisternae were generated, merged, and appended below the original movie. See also Figure 11A.
Video 7
Frame pairs from Video 6 showing the consistent appearance of Sec7 in Kex2-containing structures.
Video 6 was analyzed to identify structures that labeled for Kex2-GFP but not Sec7-mCherry, and that could be followed for at least 30 s after becoming visible. Each frame pair highlights a single Kex2-GFP-containing structure at two closely spaced time points. In the left or right half of the frame pair, the merged green and red fluorescence signals are at the top and the red fluorescence signal is at the bottom. The arrowheads in the left half of the frame pair indicate the structure prior to the appearance of Sec7-mCherry, and the arrowheads in the right half of the frame pair indicate the same structure after the appearance of Sec7-mCherry. For convenience, the 26 frame pairs corresponding to distinct Kex2-GFP-containing structures are displayed as frames in a single movie. See also Figure 11A and Figure 11—figure supplement 1.
Video 8
Combined original and edited movie showing the dynamics of GFP-Vrg4 and Kex2-mCherry.
Cells expressing GFP-Vrg4 and Kex2-mCherry were analyzed as in Video 6, except that the duration of the movie was 7 min. See also Figure 11B.
Video 9
Combined original and edited movie showing the dynamics of GFP-Vrg4 and Kex2-mCherry after anchoring COPI.
Cells in which Sec21 had been anchored to mitochondria were imaged as in Video 7 to visualize the dynamics of GFP-Vrg4 and Kex2-mCherry, except that the duration of the movie was 10.5 min and the interval between Z-stacks was 3 s. See also Figure 11C.
Additional files
-
Supplementary file 1
A zip archive of 34 annotated plasmid sequence files for constructs used in this study.
- https://doi.org/10.7554/eLife.13232.038
-
Supplementary file 2
A zip archive of three Microsoft Word files describing how yeast 4D confocal data are collected, processed, and analyzed, together with six relevant ImageJ plugins.
- https://doi.org/10.7554/eLife.13232.039
Download links
A two-part list of links to download the article, or parts of the article, in various formats.
Downloads (link to download the article as PDF)
Open citations (links to open the citations from this article in various online reference manager services)
Cite this article (links to download the citations from this article in formats compatible with various reference manager tools)
COPI selectively drives maturation of the early Golgi
eLife 4:e13232.
https://doi.org/10.7554/eLife.13232


