The yin–yang of kinase activation and unfolding explains the peculiarity of Val600 in the activation segment of BRAF
- Centre for Genomic Regulation, Spain
- Universitat Pompeu Fabra, Spain
- Barcelona Institute of Science and Technology, Spain
- Institució Catalana de Recerca i Estudis Avançats, Spain
Figures
Figure 1 with 3 supplements
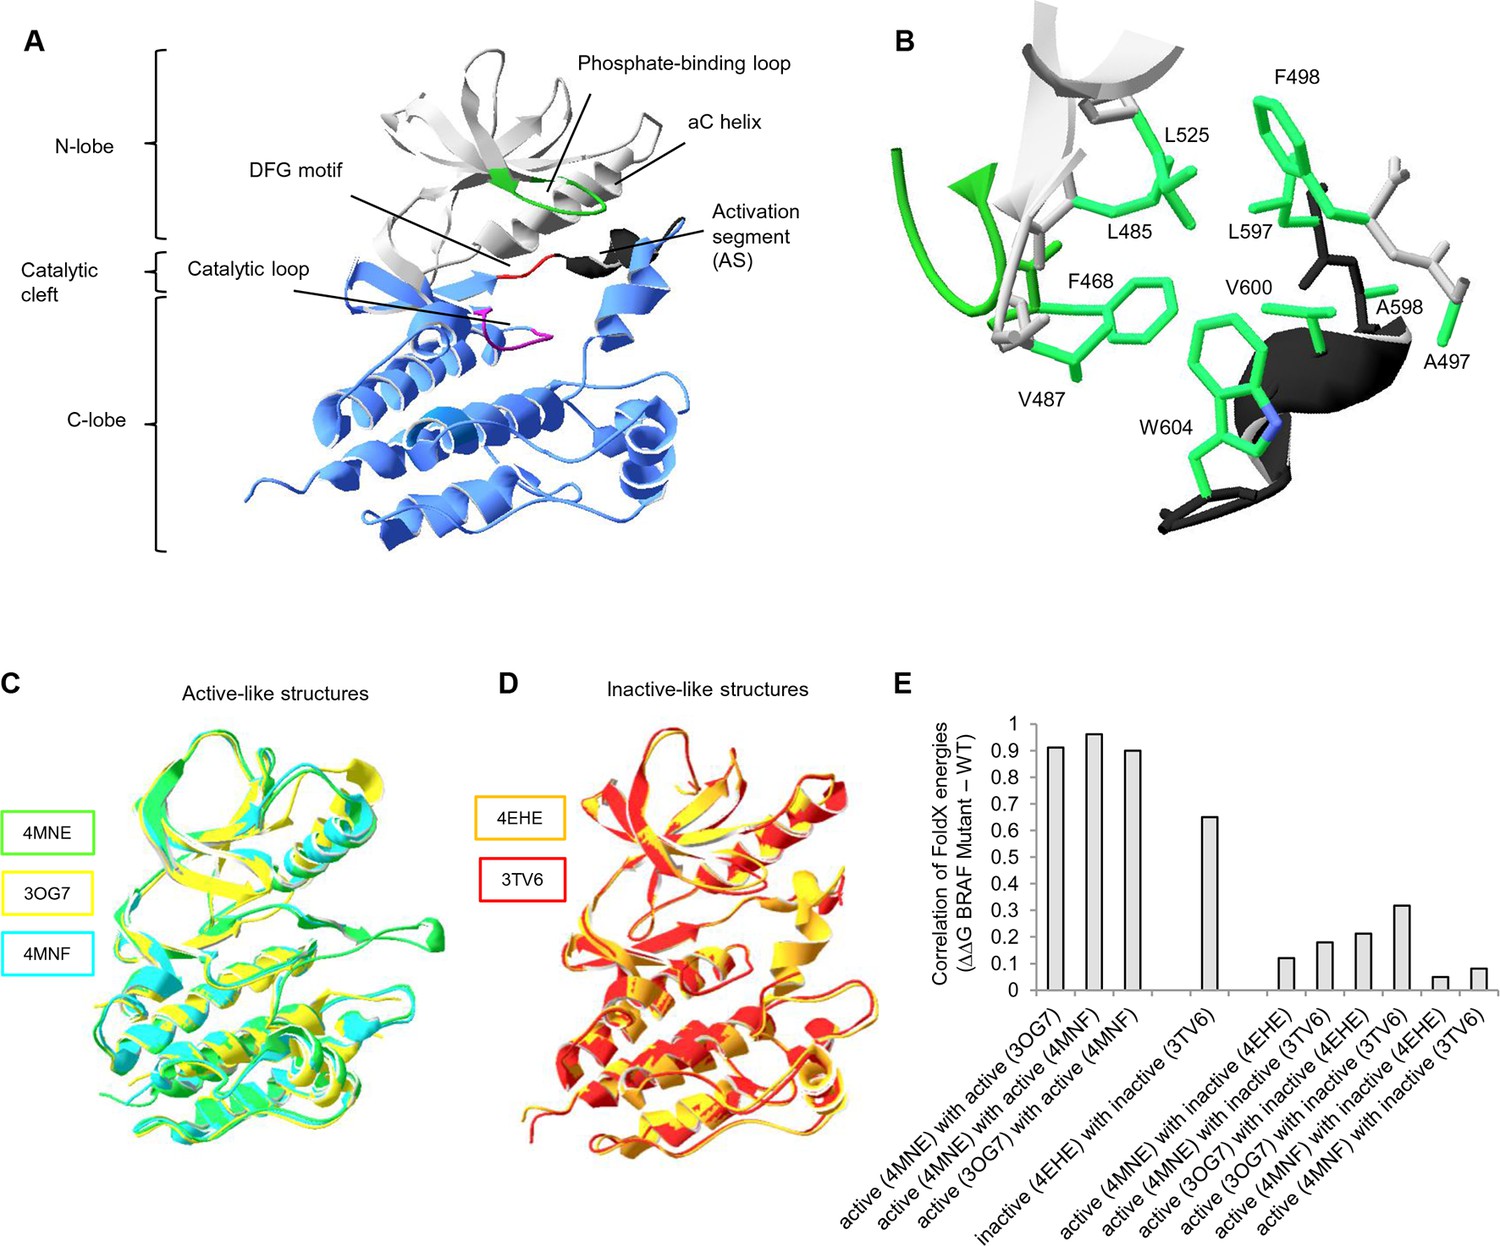
Overall structure of the kinase domain of BRAF, zoom into the hydrophobic pocket of BRAF, and active- and inactive-like BRAF kinase domain 3D structures used for structure-energy calculation.
(A) Structure of the BRAF kinase, with functional regions indicated. The BRAF kinase domain has two subdomains, a small N-terminal lobe and a large C-terminal lobe. The small lobe contains the nucleotide-binding pocket and the phosphate-binding loop, while the large lobe binds the proteins substrates and contains the catalytic loop. The two lobes are spatially connected through the activation segment (AS) of the large lobe. Sequentially, the N- and C-terminal lobes are connected by the hinge, and the AS is part of the C-lobe that interacts with the N-lobe. Movement of the two lobes relative to each other opens and closes the cleft. (B) The hydrophobic pocket around amino acid Val600 represented using the backbone and side chain view. Backbone residues are colored according to their location in the protein (see Figure 1A). Specifically, Leu597, Ala598, Val600, and Trp604 of the AS together with, Phe468, Leu525, Leu485, Val487, Phe498, and Ala497 of the N-terminal subdomain build the hydrophobic pocket. All BRAF structural representations were done with SwissPdbViewer, using PDB entry 4EHE (chain B of the crystallographic unit). (C) Superimposition of active-like BRAF kinase structures. The structural representations were made using SwissPdbViewer (PDB entries 4MNE, 3OG7 and 4MNF). (D) Superimposition of inactive-like BRAF kinase structures. Structural representations were made using SwissPdbViewer (PDB entries 4EHE and 3TV6). (E) Pairwise correlation of FoldX energies for mutations in the hydrophobic pocket derived from active and inactive structures. Similar correlation results were obtained from FoldX energies using a recently published 3D structure of inactive monomeric BRAF (Thevakumaran et al. (2015); PDB entry 4WO5, which is missing four residues in the AS/ data not shown).
Figure 1—figure supplement 1
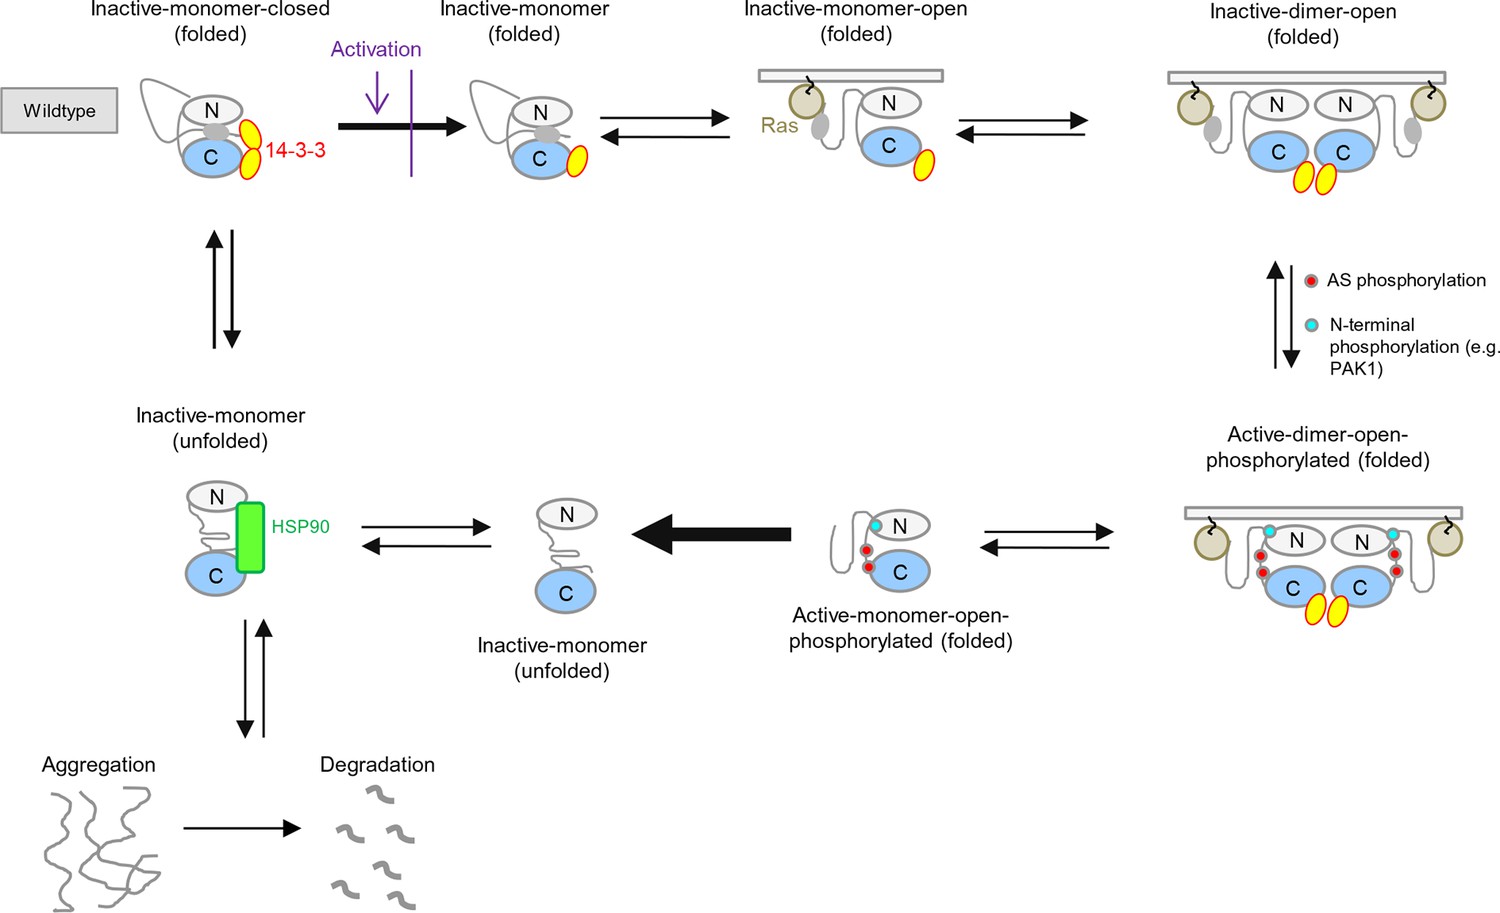
BRAF activation cycle.
The 14-3-3 dimer binds to Ser365 at the N-terminus and to Ser729 at the C-terminus, maintaining the kinase in a closed, inactive conformation. Dephosphorylation of the N-terminal phospho-Ser365 by phosphatase PPII sets free the Ras-binding domain to interact with Ras at the plasma membrane, which releases autoinhibition and enables either homodimerization or heterodimerization with CRAF, ARAF, or KSR1. Heterodimerization is favored by 14-3-3 dimer binding to the C-terminal, phosphorylated Ser729 of BRAF. The wild-type activation cycle is depicted with the N-terminal kinase lobe in grey and the C-terminal one in blue.
Figure 1—figure supplement 2
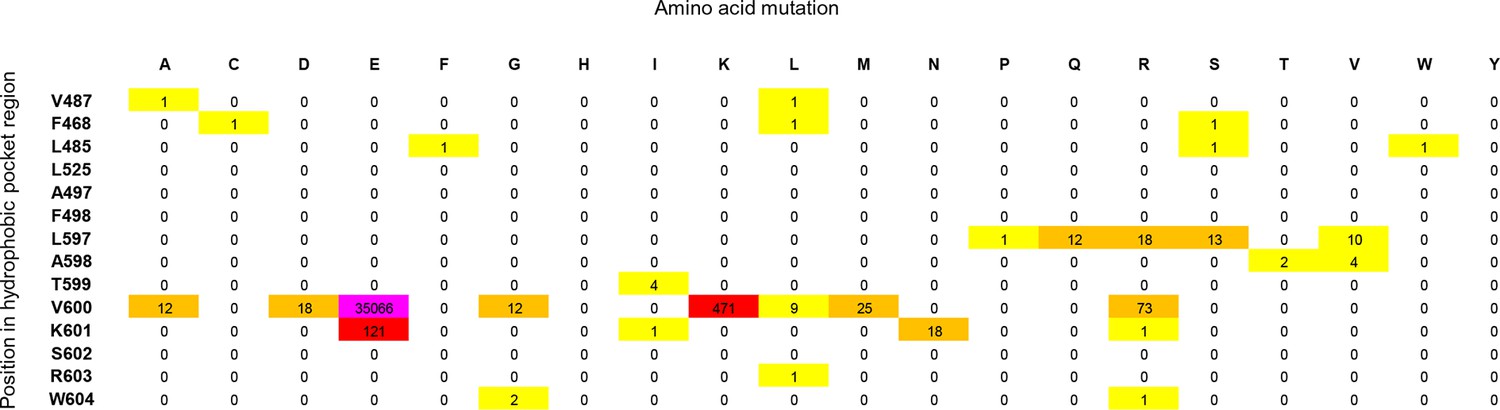
Cancer mutation frequencies in the hydrophobic pocket of BRAF.
Each position in the hydrophobic pocket region is shown (rows) and mutation frequencies for the respective mutations (columns). The mutation frequencies are colored according to the absolute number (yellow: >0 to <10; orange: 10 to <100; red: 100 to <1000; pink: V600E, > 20.000).
Figure 1—figure supplement 3
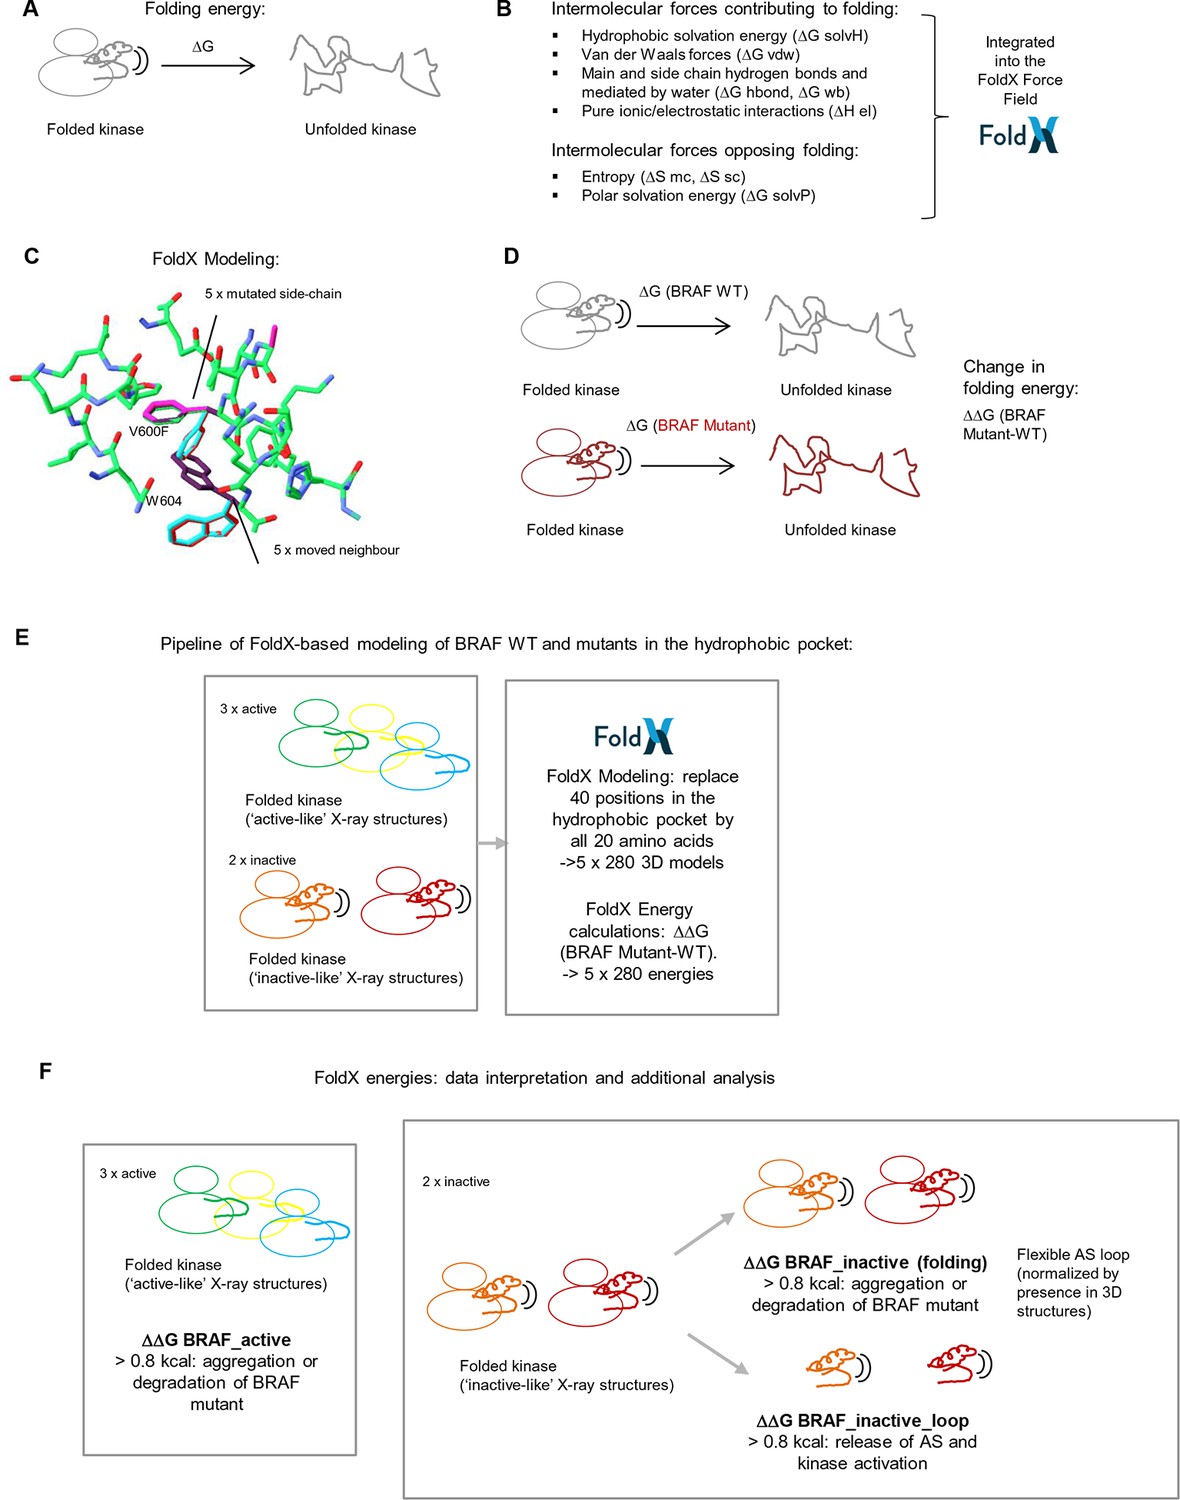
Basic principles of the FoldX force field, FoldX-based modeling, and the application of structure-energy calculations on mutations in BRAF’s hydrophobic pocket.
(A) Basic scheme of a folded and unfolded kinase and the associated folding energy (△G). (B) List of intramolecular forces contributing and opposing folding, which is integrated into the FoldX force field (see energy function in the 'Materials and methods' section). (C) Example of amino acid side chain mutations performed using FoldX. Different rotamers are shown for the mutation of Val600 to Phe, as well as for the movement of the neighboring residue, Trp604. (D) Example of change in folding energy when comparing WT to Mutant [△△G (BRAF Mutant-WT)]. (E) Pipeline of FoldX-based modeling of BRAF WT and mutants in the hydrophobic pocket. (F) Interpretation of FoldX energies and additional analysis.
Figure 2

AS loop residues in 28 BRAF kinase structures and comparison with B-factors.
(A) Percentage of the 28 BRAF X-ray structures that have a given AS residue solved. (B) Percentage of presence of AS loop amino acids in the X-ray structures, mapped onto a BRAF ribbon diagram (see legend for the color code). The structural representation was made using SwissPdbViewer (PDB entry 4EHE). (C) Normalized B-factor averages for loop residues from inactive structures (PDB entries 4EHE and 3TV6) plotted against the percentage of presence in the 28 BRAF X-ray structures.
Figure 3 with 4 supplements
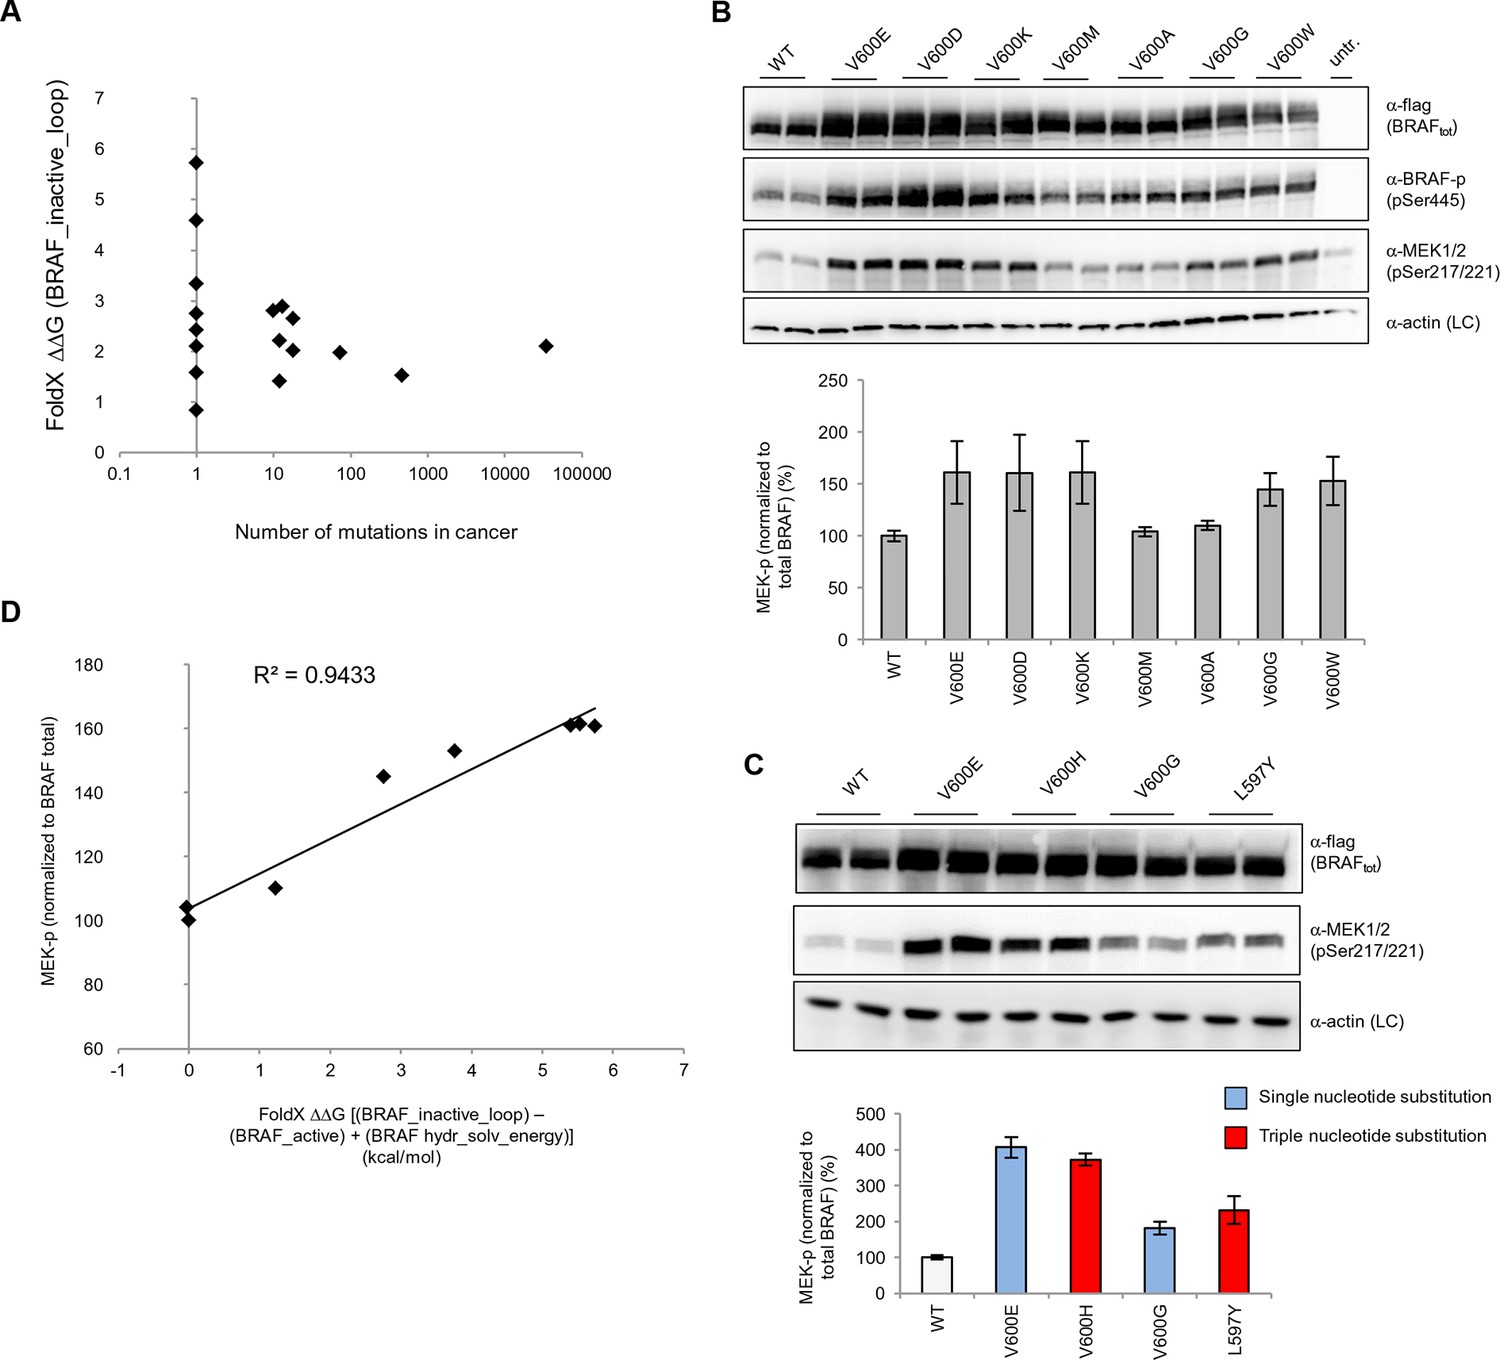
Structure-energy predictions and experimental analysis of mutations in the hydrophobic pocket of BRAF.
(A) Comparison of the number of cancer mutations (>0) with destabilization of the hydrophobic pocket as predicted by FoldX (average energy values of 1EHE and 3TV6, ‘FoldX △△G BRAF_inactive_loop’). (B) Representative Western blot (upper panel) for selected Val600 mutations expressed 24 hr in normal medium and quantified using ImageJ (lower panel). Two out of at least six biological replicates are shown. Bar graph shows the results of six biological replicates for the abundance of MEK-P normalized to total BRAF. (C) Representative Western blot (upper panel) analysis for selected single and triple nucleotide substitution BRAF mutations expressed 24 hr in normal medium and quantified using ImageJ (lower panel). Two out of at four biological replicates are shown. Bar graphs show the results of two biological and two technical replicates for the abundance of MEK-P normalized to total BRAF. (D) Correlation of FoldX energies with MEK phosphorylation normalized by the total BRAF levels. FoldX energies were calculated from the inactive loop energy [BRAF_inactive_loop] minus the FoldX energies derided from active structures [BRAF_active] plus the hydrophobic solvation energy as a factor in the FoldX force field [BRAF hydr_solv_energy].
Figure 3—figure supplement 1
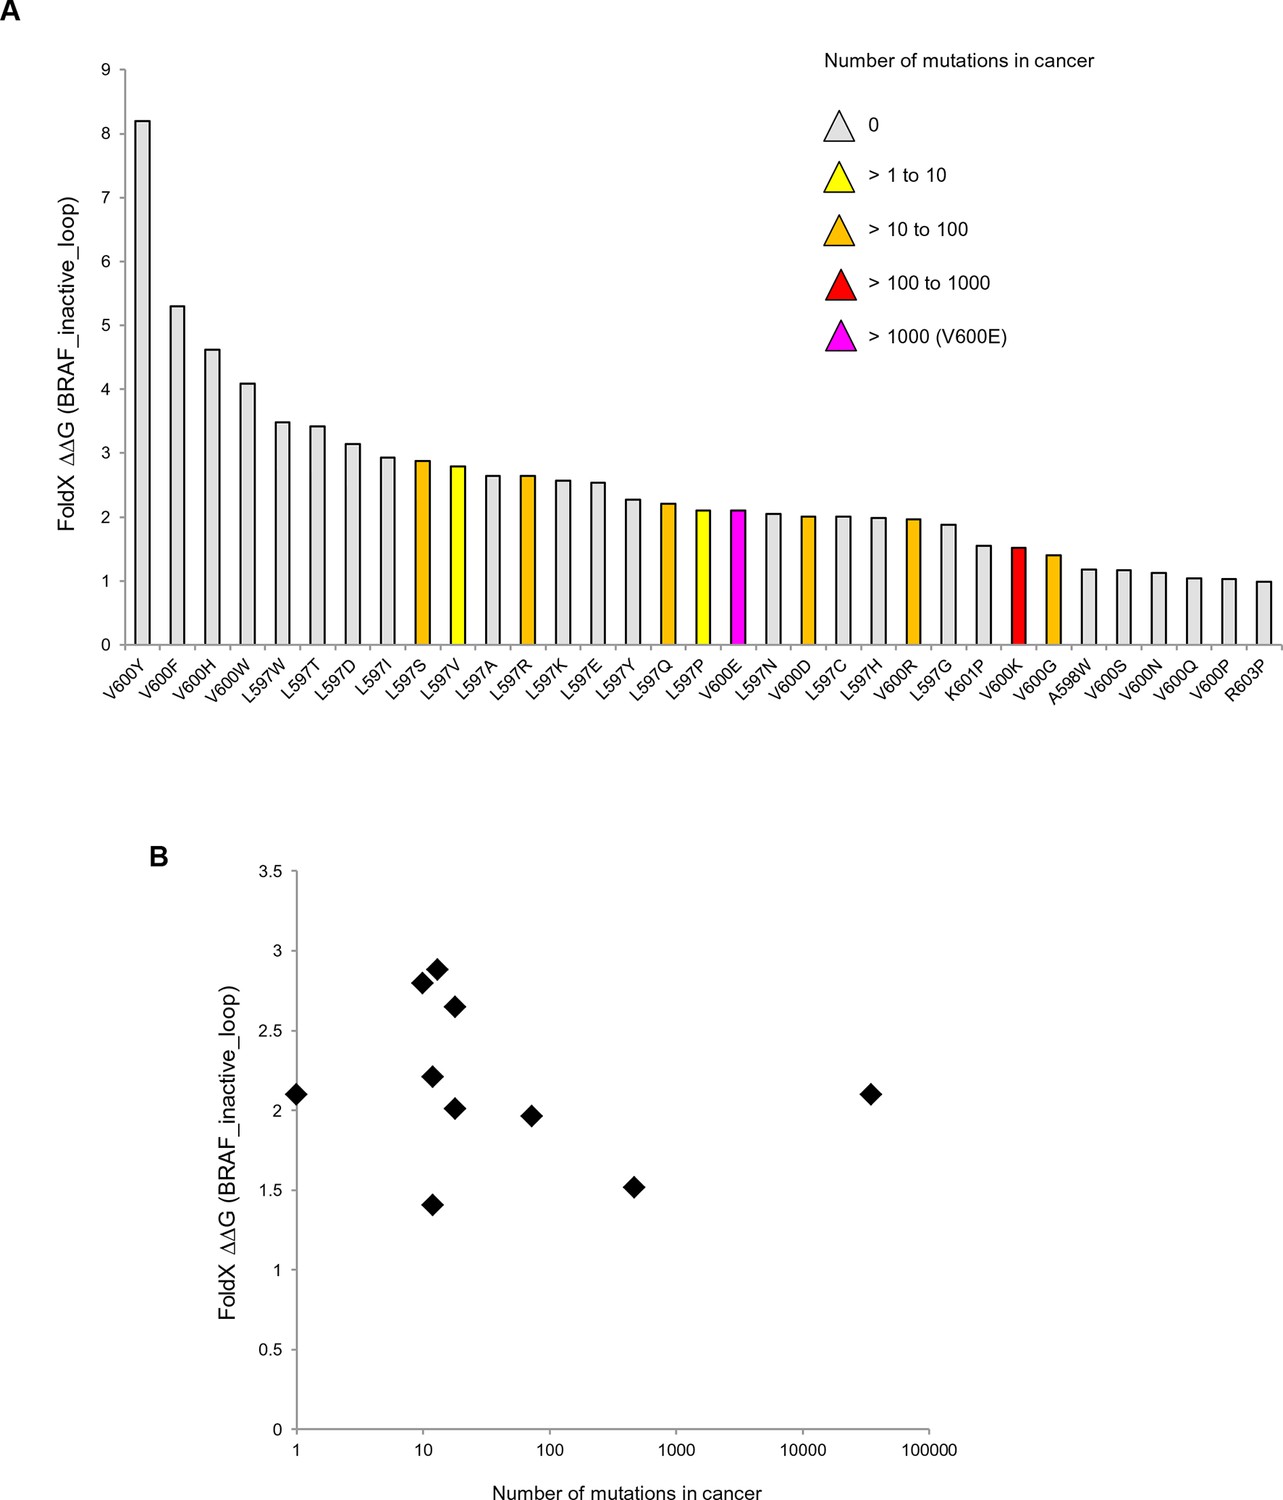
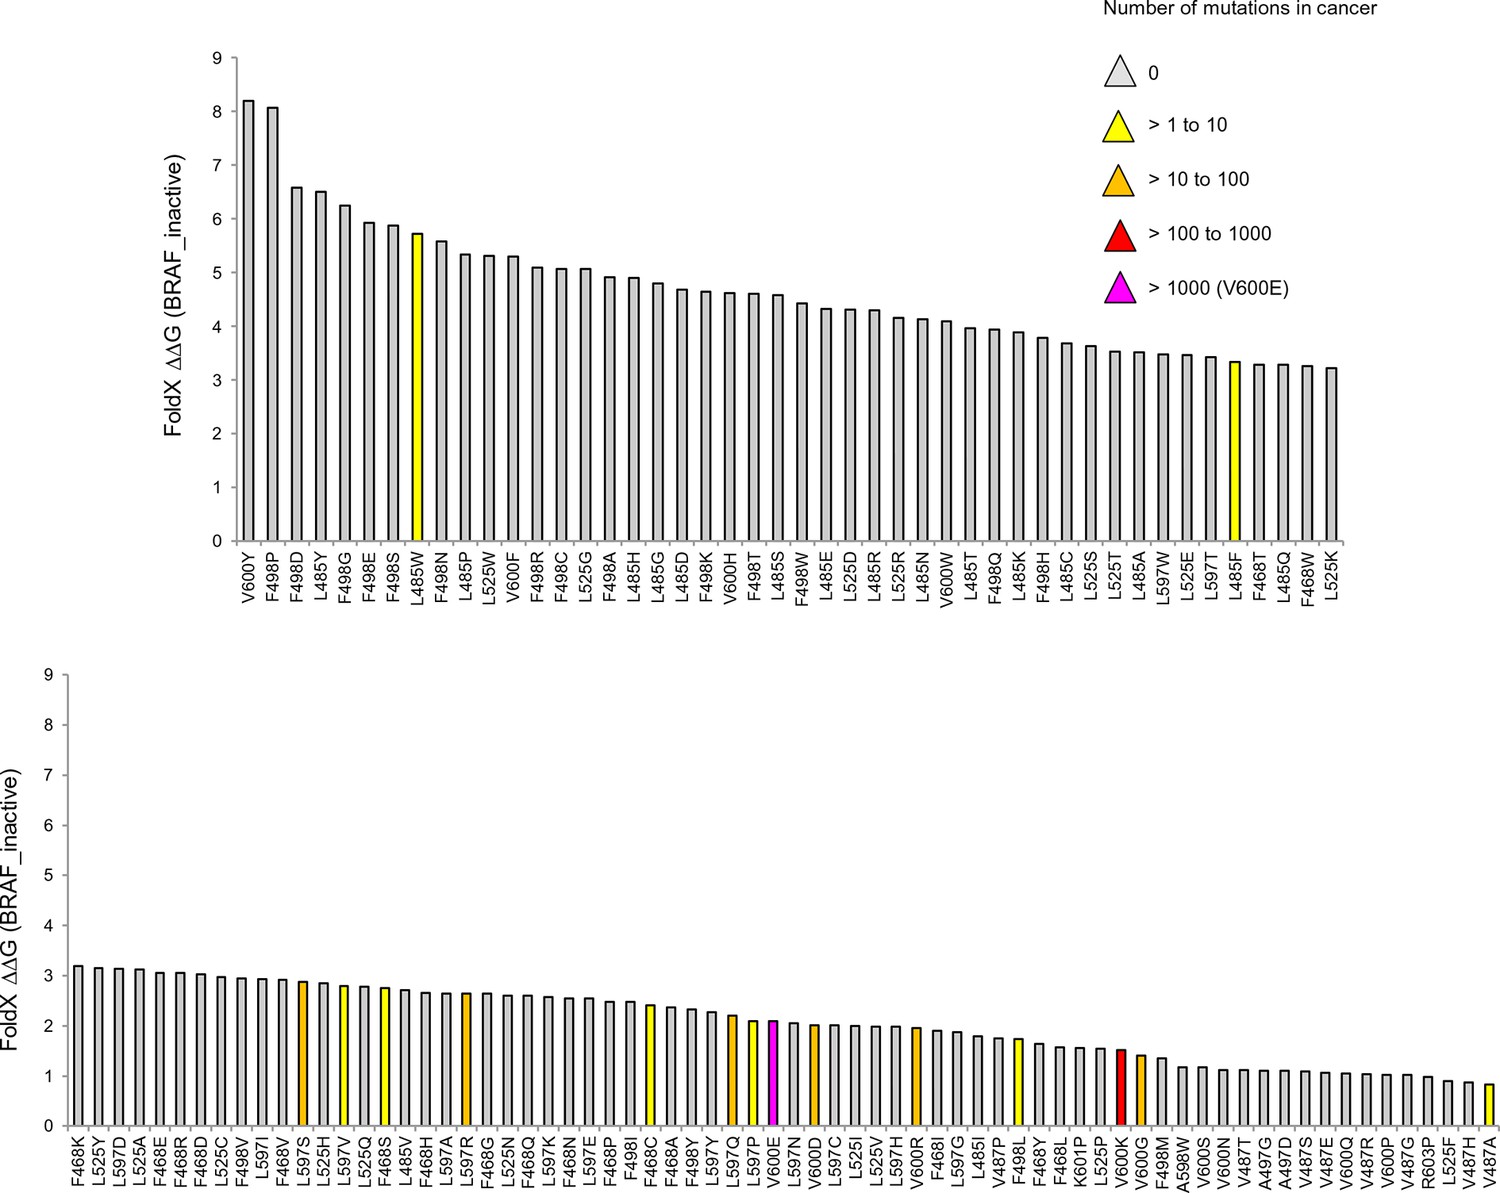
Mutations causing destabilization of the inactive loop and comparison with cancer frequencies.
(A) Mutations having destabilization of the inactive loop above the threshold (‘loop energy’), sorted by decreasing energy value. Colors indicate the number of cancer mutations. (B) Comparison of number of cancer mutations (>0) with destabilization of the hydrophobic pocket as predicted by FoldX (average energy values of 1EHE and 3TV6, normalized by its presence in the structure/B-factor).
Figure 3—figure supplement 2
Mutations causing destabilization of the inactive structure above the threshold.
Colors indicate the number of cancer mutations.
Figure 3—figure supplement 3
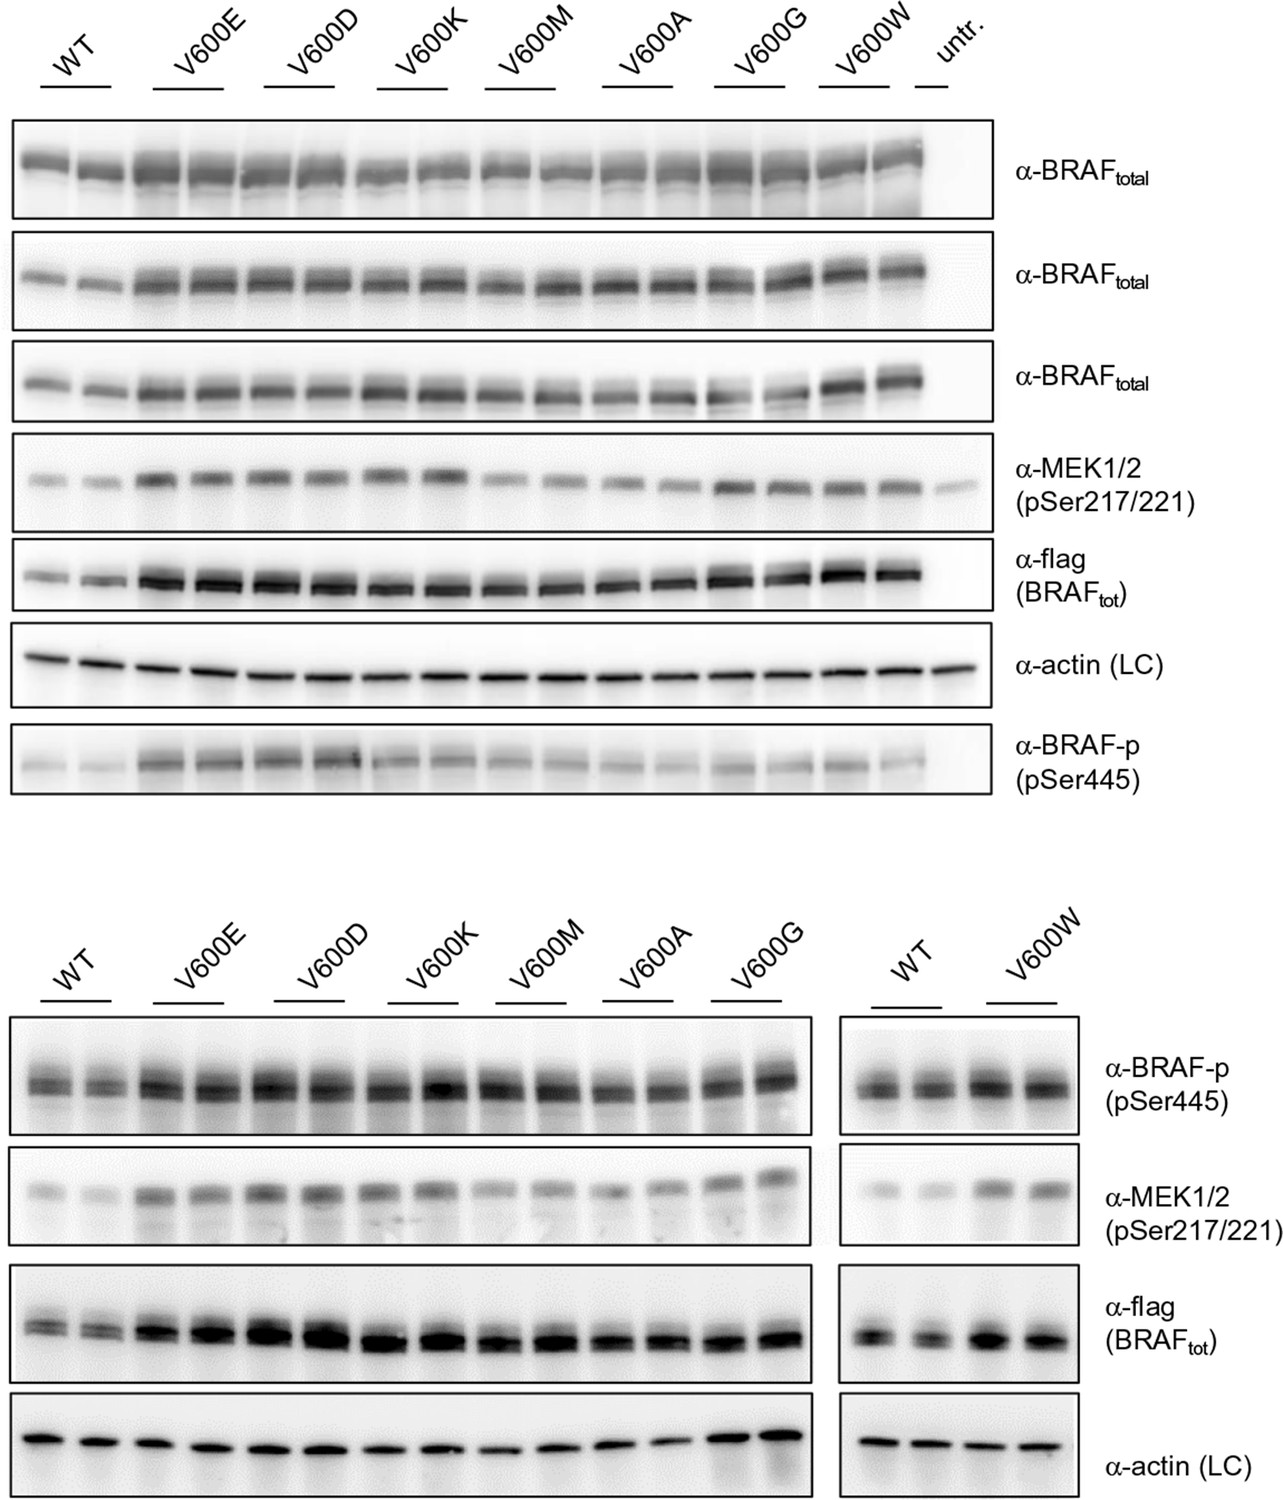
Additional Western blots supporting Figure 3B.
Western blots of biological replicates of BRAF WT, V600E, V600D, V600K, V600M, V600A, V600G, and V600W used for the quantifications shown in the bar diagram of Figure 3B.
Figure 3—figure supplement 4
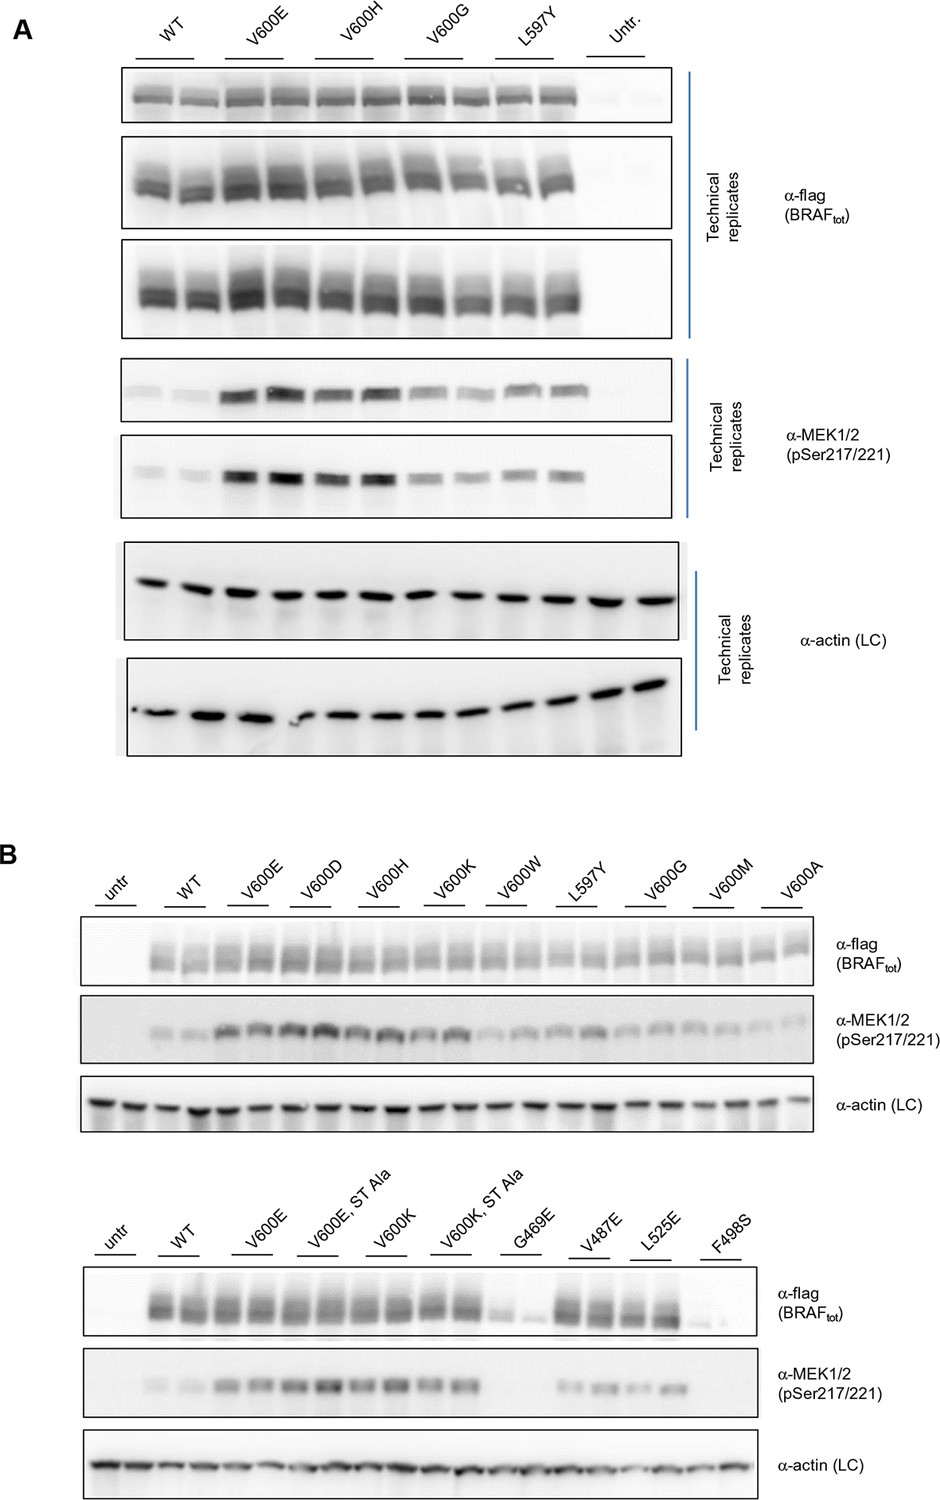
Additional Western blots supporting Figure 3C.
(A) Western blots of technical replicates of BRAF WT, V600E, V600H, and L597Y used for the quantifications shown in the bar diagram of Figure 3C. (B) Additional biological replicates for all BRAF mutants studied in this work.
Figure 4 with 6 supplements
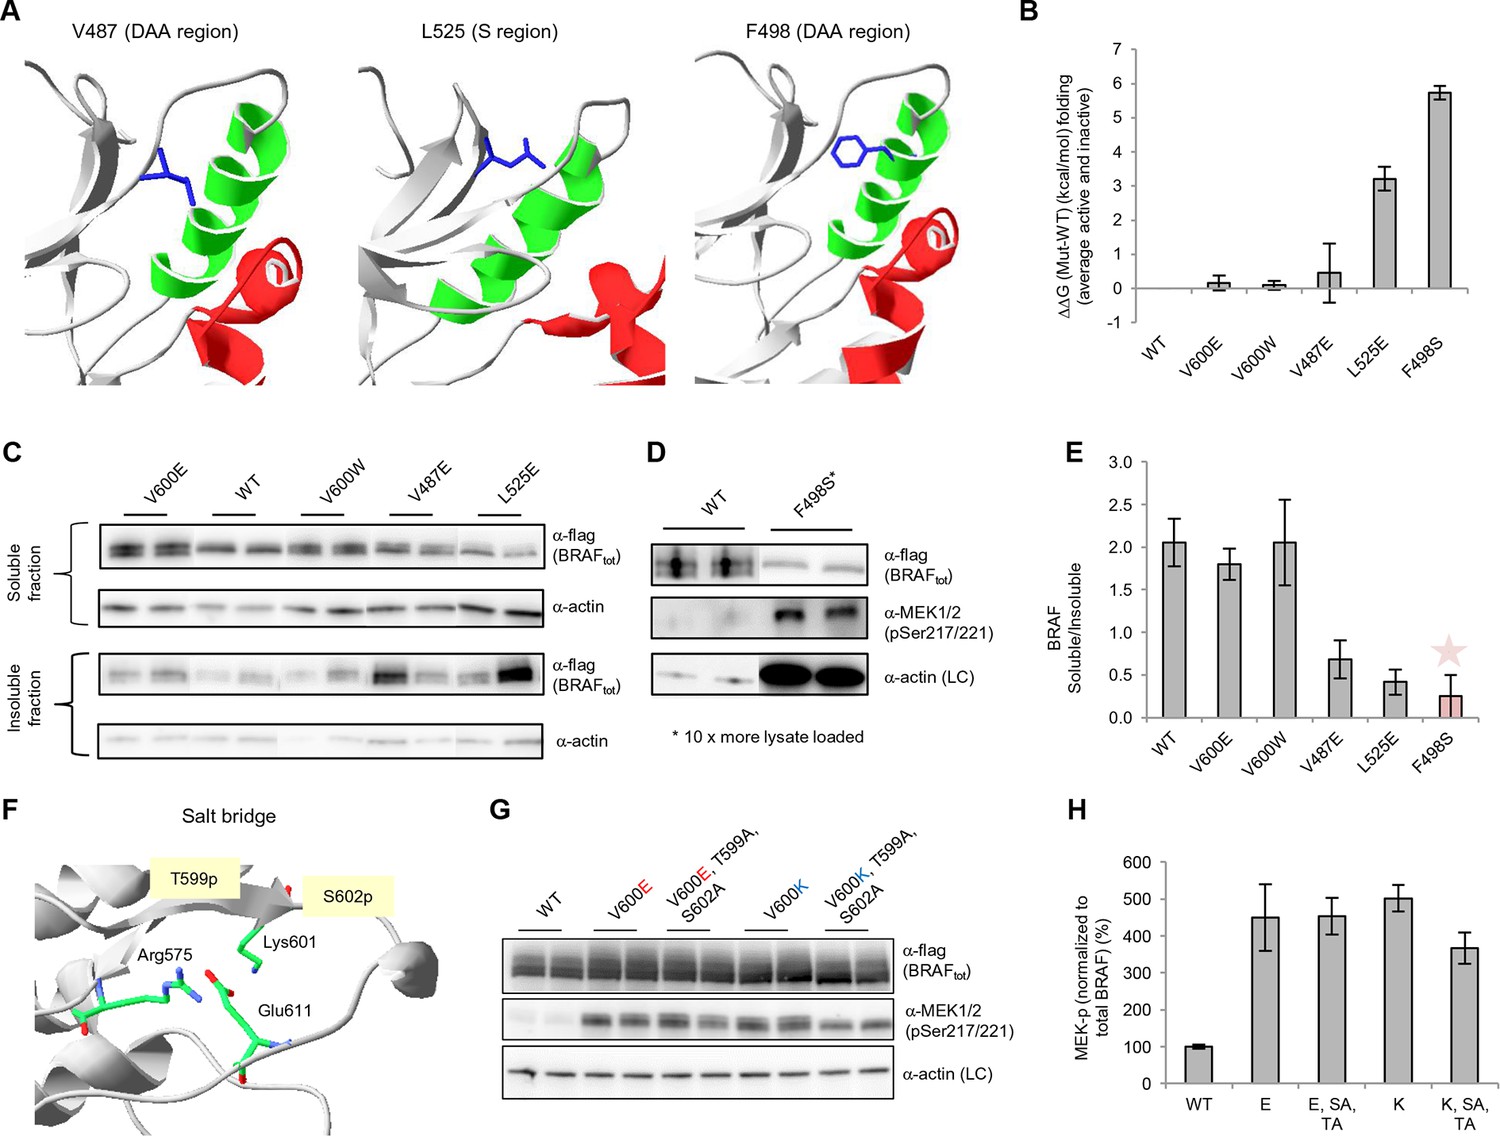
Structure-energy predictions and experimental analysis of mutations affecting the folding of BRAF and analysis of phosphorylation of Thr599 and Ser602 to keep the AS in a fixed active state.
(A) Structural representations of the localization of Val487, Leu525, and Phe498 in BRAF (PDB entry 4EHE). (B) Destabilization of inactive and active states for V487E, L525E, and F498S BRAF (folding mutants) as predicted by FoldX. (C) Western blot analysis for BRAF mutations affecting folding. (D) Western blot analysis for BRAF F498S folding mutations. (E) Plot of BRAF soluble to insoluble ratios for the WT and mutations shown in the Western blots from pane (C) and (D), sorted in a similar order as in Figure 3B. Bar graphs show the results from two biological replicates. The soluble/insoluble value for BRAF F498S was estimated (see main text and represented with a star). (F) Illustration of the salt bridges that are proposed to stabilize the active conformation. The structural representation was done with the SwissPdbViewer, using PDB entry 4MNE. (G) Western blot analysis for the selected V600E and V600K mutations in combination with the T599A/S602A mutations expressed 24h in normal medium. (H) Quantifications of MEK phosphorylation levels normalized by total BRAF from (G) using ImageJ. Bars represent at least four biological replicates for the abundance of MEK-P normalized to total BRAF.
Figure 4—figure supplement 1
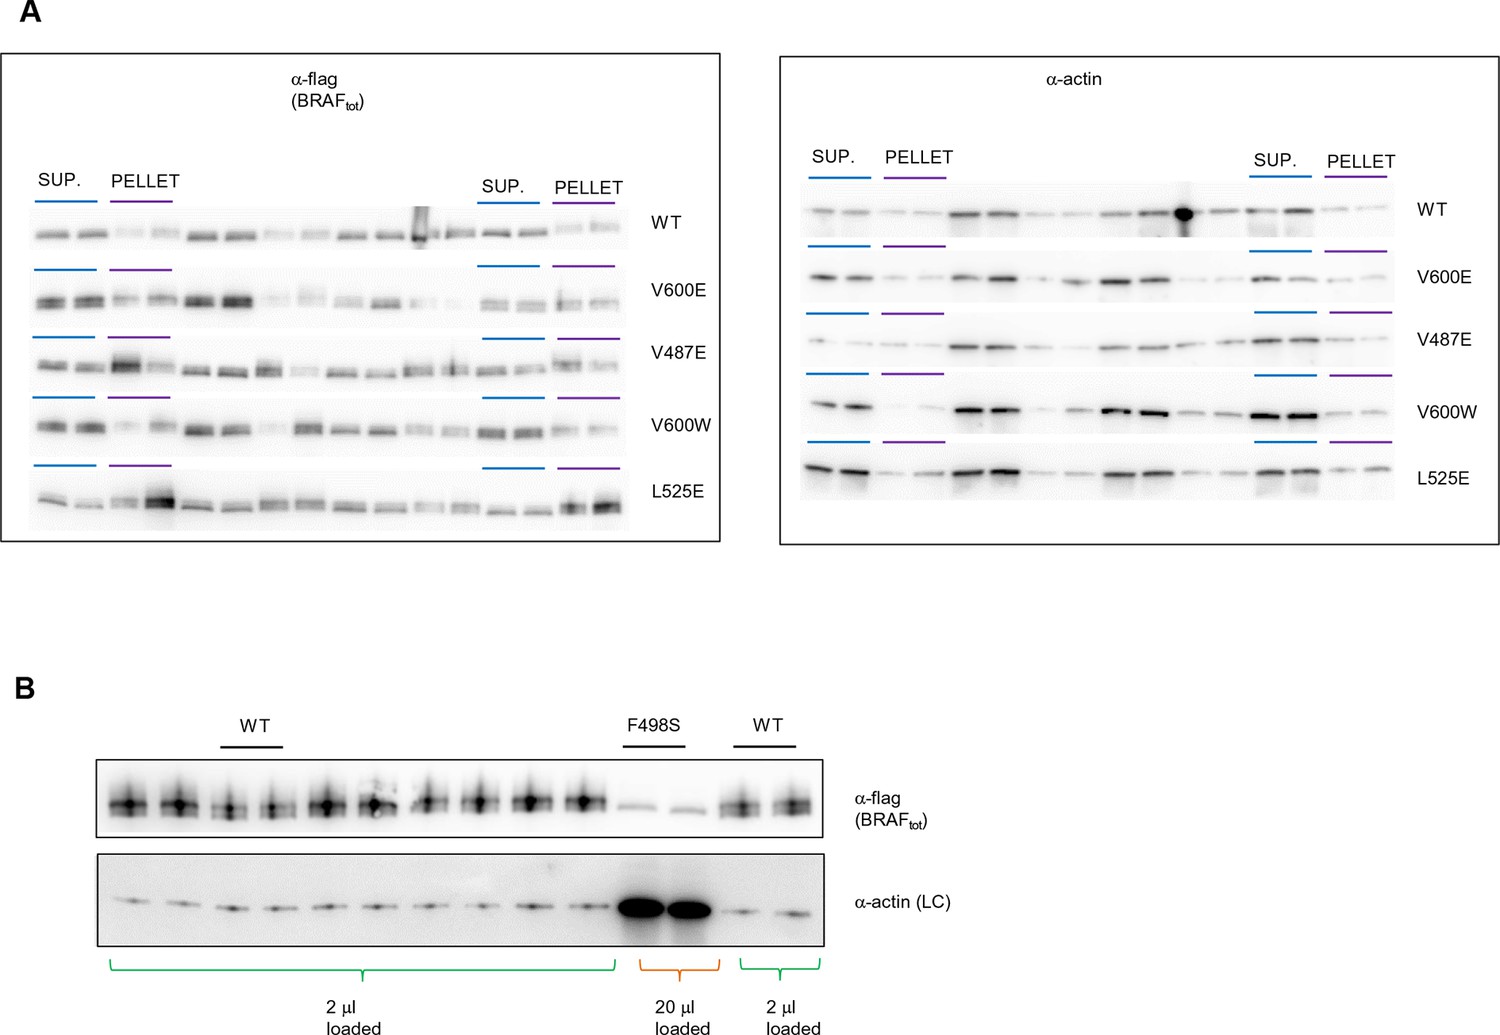
Original western blots of spliced out lanes shown in Figure 4C and D.
(A) Original Western blot and experimental procedure supporting Figure 4C. Supernatant (‘SUP’) or pellet (‘PELLET’) fractions of BRAF WT and mutants V600E, V487E, V600W, and L525E were each run on one SDS gel (five gels in total). Each gel was spliced into parts, one with the expected size of BRAF and one with the expected size of actin. All gel pieces for BRAF were placed on the iBlot (Invitrogen) Western blot membrane and transferred simultaneously. We proceeded similarly for the five actin gel pieces. As such, BRAF WT and mutants were treated similarly during gel transfer and Western blot antibody incubation, washing, and subsequent ECL development. (B) Original Western blot supporting Figure 4D. A 10-fold higher amount of lysate was loaded for BRAF mutant F498S compared to WT. WT, wild type.
Figure 4—figure supplement 2
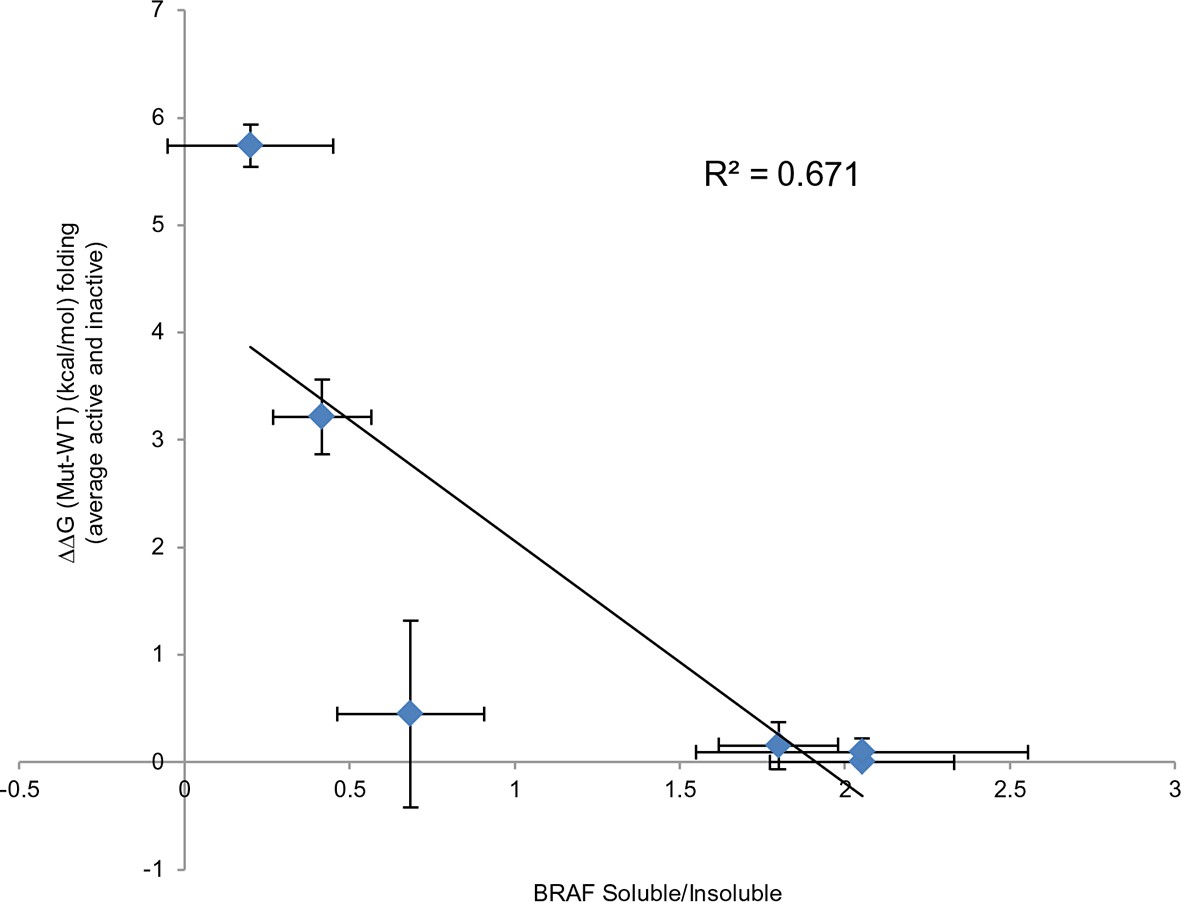
Comparing experimental protein solubility with FoldX predicted folding energies.
Comparing the ratios of BRAF expressed in the soluble and insoluble fractions with the FoldX folding energies. The correlation coefficient is 0.67.
Figure 4—figure supplement 3
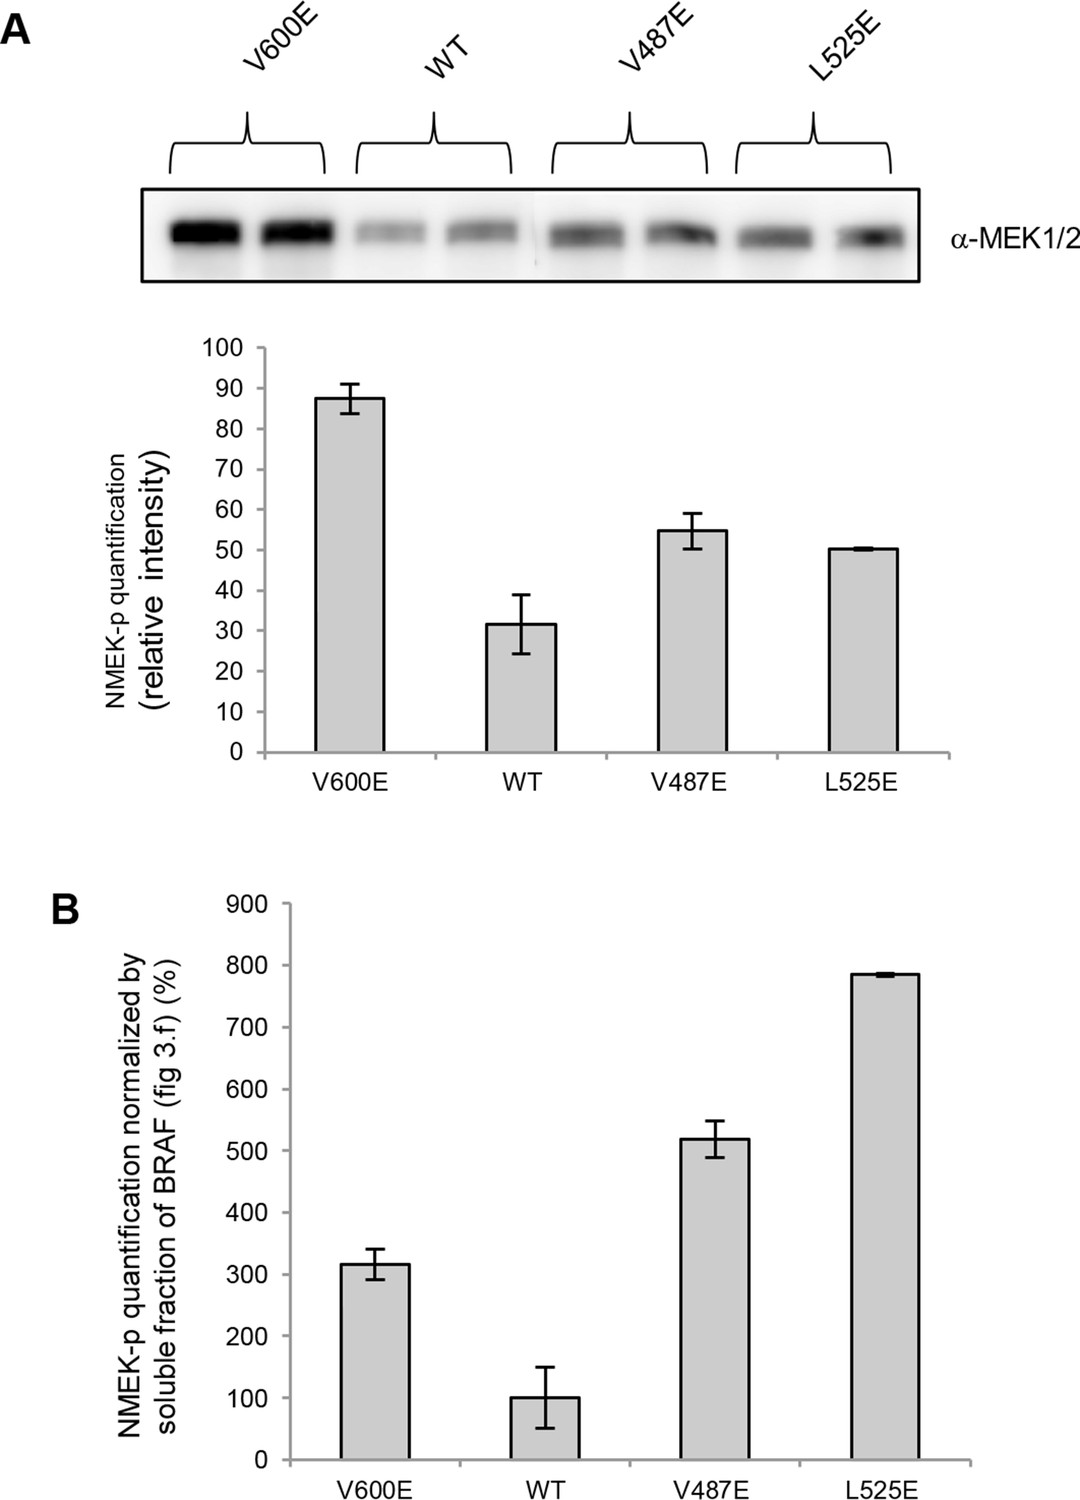
MEK phosphorylation of wild-type and V600E, V487E, and L525E mutant BRAF in the supernatant.
(A) Western blot analysis of MEK-phosphorylation after expression for 24 hr in normal medium and ImageJ quantification (using two biological replicates). (B) MEK-phosphorylation levels normalized by the soluble fraction of BRAF (as shown in Figure 4C).
Figure 4—figure supplement 4
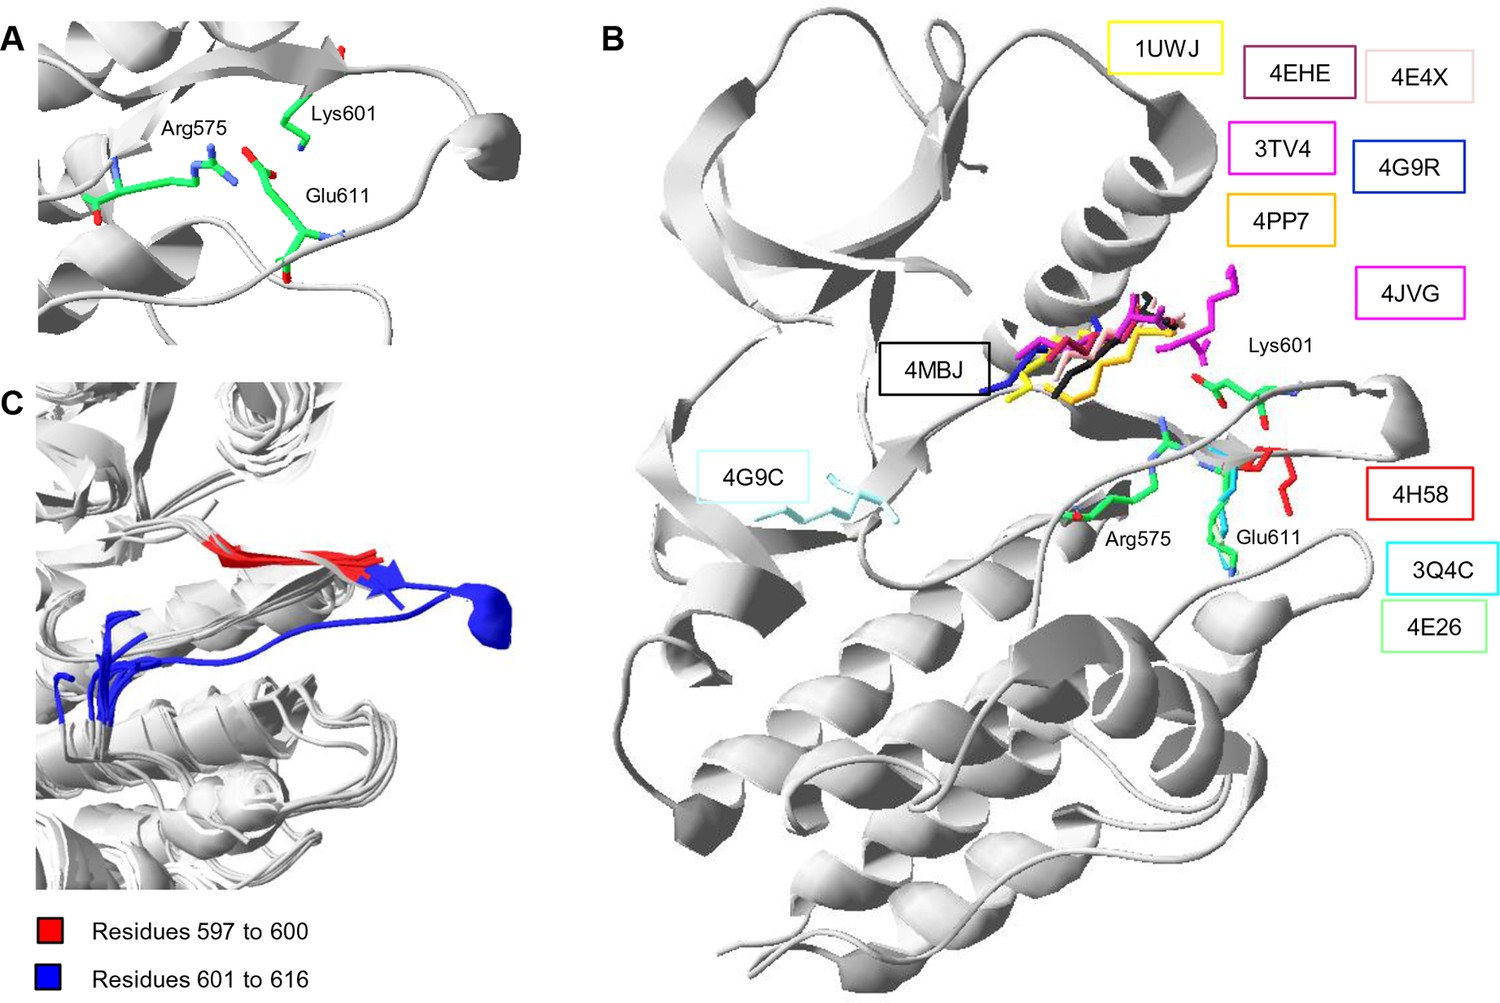
Conformations of Lys601 found in all structures having position 601 solved, and an overlay of ten active-like BRAF structures.
(A) Close-up of the 4MNE structure indicating the salt bridge between Arg575 and Glu611 that is conserved in all Raf kinases. Lys601 points in the direction of this salt bridge. (B) Superimposition of all BRAF kinases that are solved at K601. For 4MNE, the ribbon representation is shown in grey, and the residues are as in panel (A). For the remaining structures, only the backbone and side chain of K601 is shown. The structural representations were made using SwissPdbViewer (PDB entries 4MNE, 1UWJ, 3TV4, 4E4X, 4EHE, 4G9R, 4PP7, 4JVG, 4MBJ, 4H58, 3Q4C, 4E26, and 4G9C). (C) Overlay of 10 active-like BRAF structures. Residues 597–600 (red) are very similar between the different structures, while resides 601–616 (blue) are more flexible. The structural representation was made using SwissPdbViewer (PDB entries 2FB8, 3D4Q, 3OG7, 3PPJ, 3PPK, 3PRI, 3PSB, 4H58, 4MNE, and 4MNF).
Figure 4—figure supplement 5
Biological replicates in minimal (serum-free) growth medium.
https://doi.org/10.7554/eLife.12814.018
Figure 4—figure supplement 6

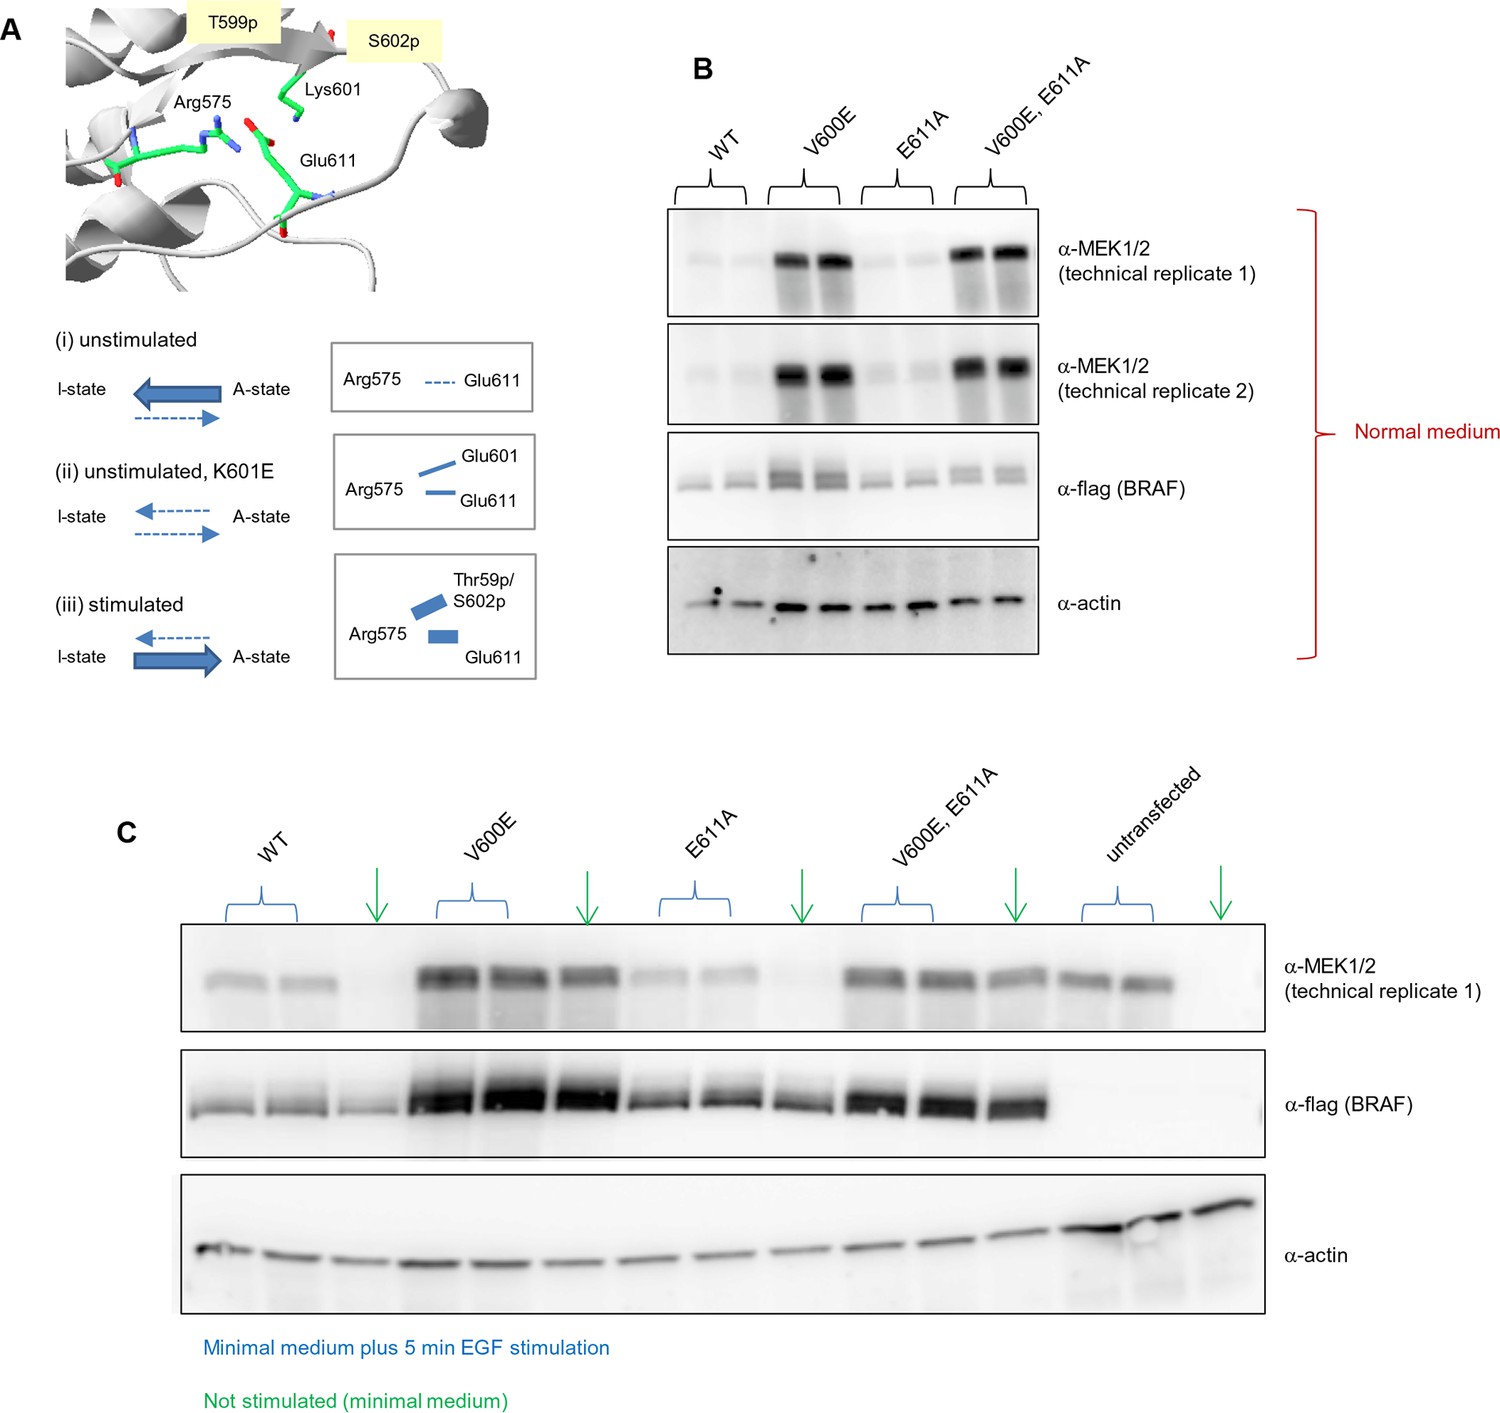
Analysis of the interactions in the BRAF RD motif, and expression levels of BRAF wild-type and the single V600E, E611A, and double V600E/E6111A mutants.
(A) Illustration of salt bridges that are proposed to stabilize the active conformation. The structural representation was done with the SwissPdbViewer, using PDB entry 4MNE. The bottom panel shows the salt bridge between Glu611 and Arg575 in the active conformation and the proposed participation of Lys601 when mutated to Glu. (B) Western blot analysis for wild-type and mutant BRAF expressed for 24 hr in normal medium. (C) Western blot analysis for wild-type and mutant BRAF expressed for 24 hr in minimal medium (no serum) with or without 5 min of EGF stimulation (at 50 ng/ml) before harvesting and lysis.
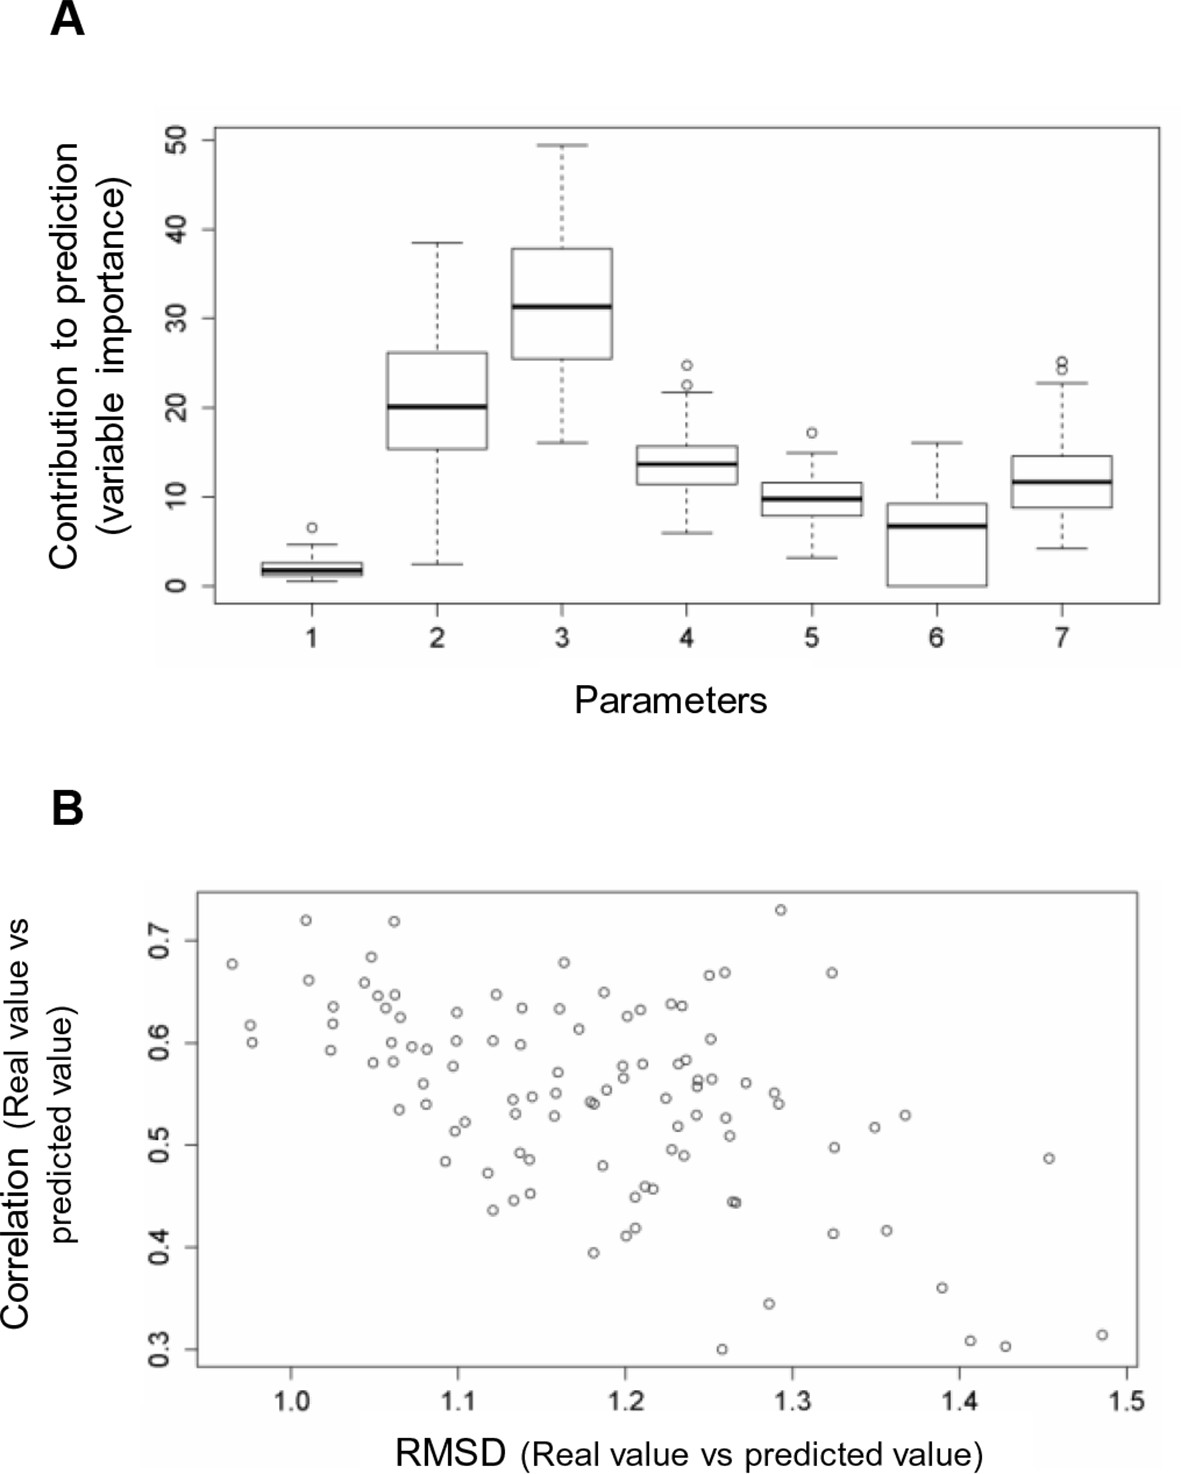
Figure 5 with 1 supplement
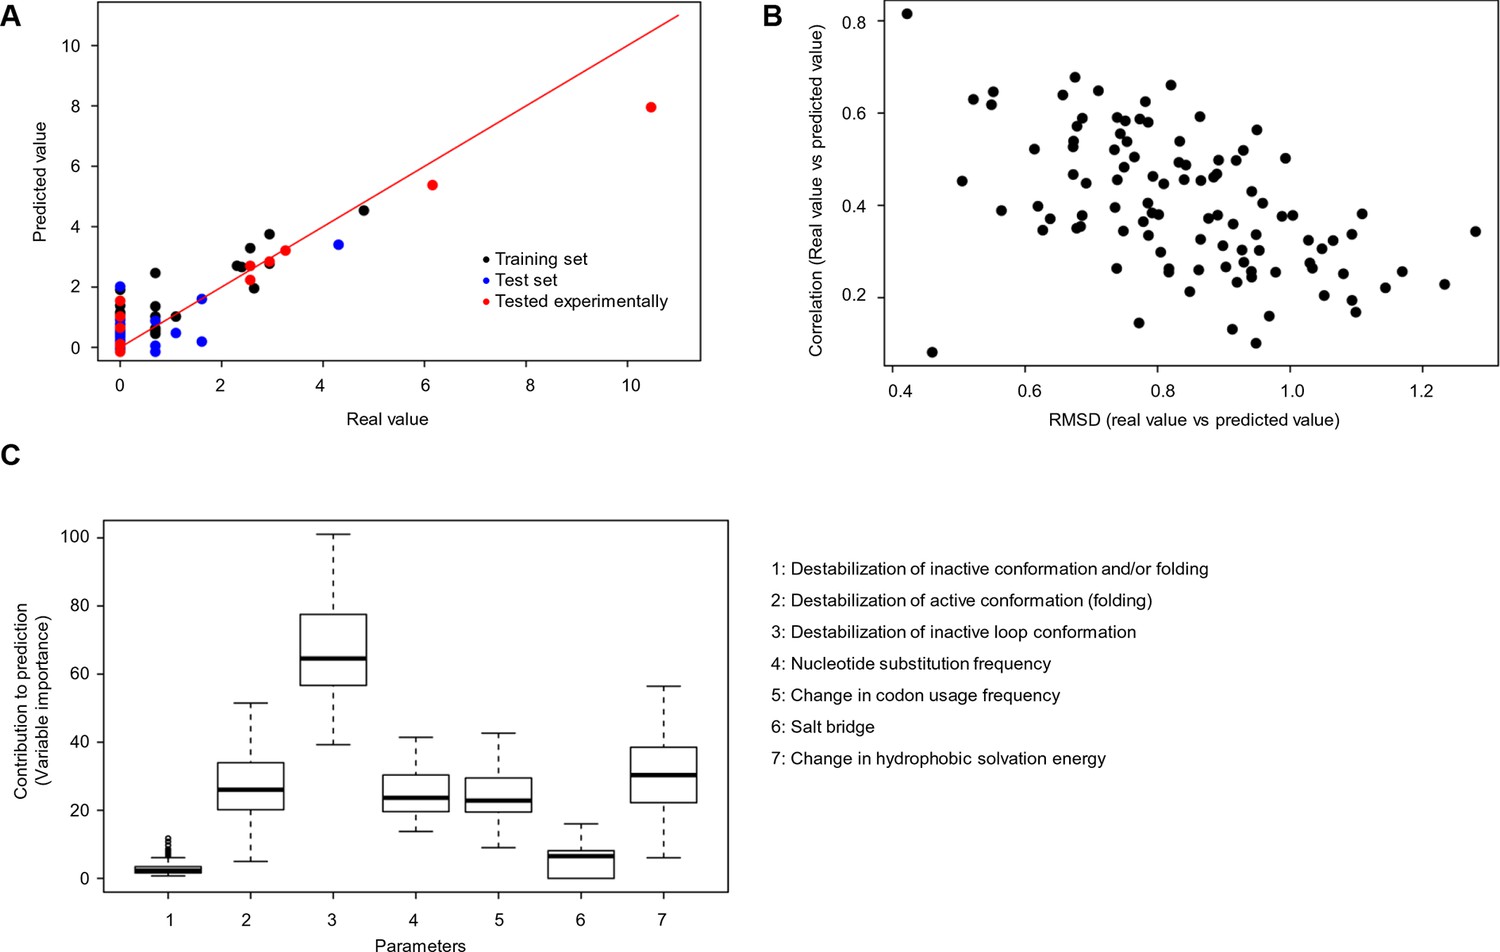
Quantitative contribution of individual factors to the prediction of cancer frequencies.
(A) Comparison of real and predicted cancer frequencies (labelled ‘real value’ and ‘predicted value’) for one exemplary random forest prediction (run 16). Black dots represent mutations that were in the training set, blue dots the ones in the test set, and red are the mutations that were tested experimentally in this work (some of them were included in the training set, some of them in the test set). (B) Plot of RMSD against correlation for all individual random forest runs with V600E in the training set. The correlation is the correlation between the predicted value by the random forest (’predicted value’) and the experimental value (‘real value’), and the RMSD calculates the deviation of the predicted values from the real ones. (C) Results from random forest analyses with V600E in the training set. Abbreviation for parameters: 1) destabilization of inactive conformation and/or folding; 2) destabilization of active conformation (folding); 3) destabilization of inactive loop conformation; 4) nucleotide substitution frequency; 5) change in codon usage frequency; 6) salt bridge; and 7) change in hydrophobic solvation energy.
Figure 5—figure supplement 1
Random forest analyses without V600E in the training set.
(A) Results from the random forest analyses without V600E in the training set. Abbreviation for parameters: 1, destabilization of inactive conformation/folding; 2, destabilization of active conformation (folding); 3, destabilization of inactive loop-conformation; 4, nucleotide substitution frequency; 5, change in codon usage frequency; 6, salt bridge; 7, change in hydrophobic solvation energy. (B) Plot of the RMSD against correlation for all random forest runs without V600E in the training set. The correlation is the correlation between the predicted value by the random forest (’predicted value’) and the experimental value (‘real value’), and the RMSD calculates the deviation of the predicted values from the real ones.
Figure 6

Schematic diagram depicting the relationship between structural flexibility, destabilization of the hydrophobic pocket, and cancer frequencies.
The effect of a mutation on folding depends on the structural flexibility of the respective hydrophobic pocket where the mutated amino acid is located. In a region with higher structural flexibility destabilization in the hydrophobic pocket will cause activation of the kinase and still allows proper folding. Thus, the disease-causing propensity (cancer mutation frequency) will increase with increasing destabilization of the hydrophobic pocket. In contrast, mutations in structurally rigid areas of the hydrophobic pocket will only slightly increase the catalytic activity with increasing destabilization, and will then cause unfolding.
Additional files
-
Supplementary file 1
Summary of structure-energy and statistical properties of mutations in the hydrophobic pocket of BRAF and parameters used for random forest analyses.
This table summarizes on sheet 1 for all mutations in the hydrophobic pocket the mutation frequencies in cancer, the average energies predicted using FoldX using active or inactive BRAF template structures, the respective B-factors, the presence of amino acid residues in solved BRAF X-ray structures, the nucleotide substitution frequency, the hydrophobic solvation energy, the change in codon usage, and the energetic contribution of a salt bridge predicted to stabilize the active conformation. Sheet 2 summarizes for all mutations in the hydrophobic pocket the values used to for the seven parameters evaluated in the random forest analyses.
- https://doi.org/10.7554/eLife.12814.023
Download links
A two-part list of links to download the article, or parts of the article, in various formats.
Downloads (link to download the article as PDF)
Open citations (links to open the citations from this article in various online reference manager services)
Cite this article (links to download the citations from this article in formats compatible with various reference manager tools)
The yin–yang of kinase activation and unfolding explains the peculiarity of Val600 in the activation segment of BRAF
eLife 5:e12814.
https://doi.org/10.7554/eLife.12814


