Conditioned respiratory threat in the subdivisions of the human periaqueductal gray
- University of Oxford, United Kingdom
Figures
Figure 1
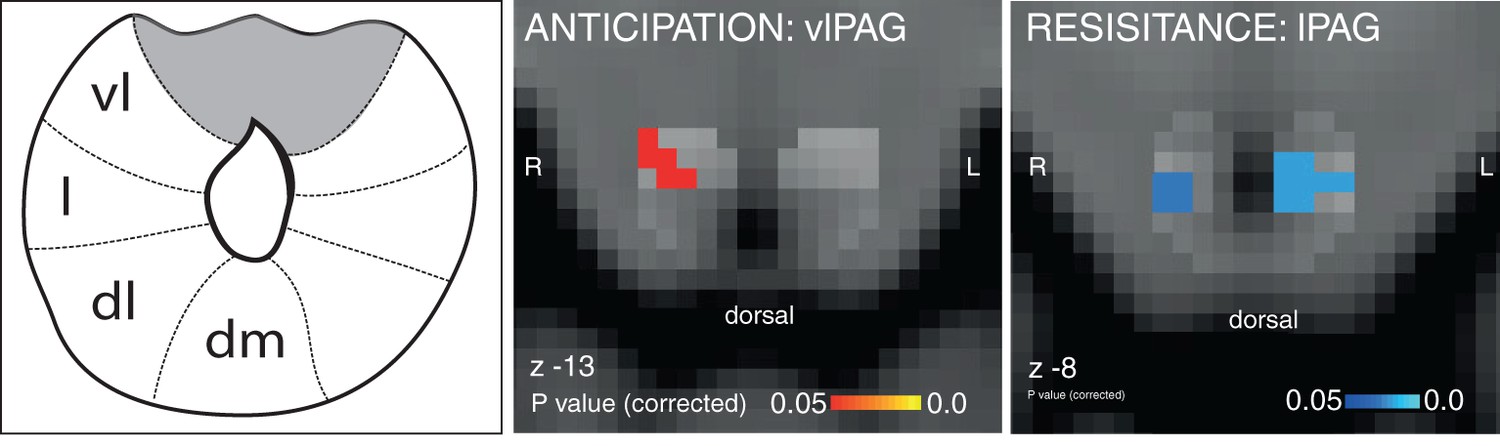
Targeted PAG columnar analysis.
Left: Schematic representation of the columns of the midbrain periaqueductal gray (PAG), which almost surrounds the aqueduct. Middle: Ventrolateral PAG (vlPAG) activation during anticipation of resistance contrasted with anticipation of no resistance. Right: Lateral PAG (lPAG) deactivation during inspiratory resistance. Statistics are small-volume-corrected for multiple comparisons using highlighted PAG column masks, adapted from Ezra et al. (2015), and the images consist of a colour-rendered statistical map superimposed on a standard (MNI 1 mm3) brain. Line drawing originally published in Ezra et al., 2015.
Figure 2
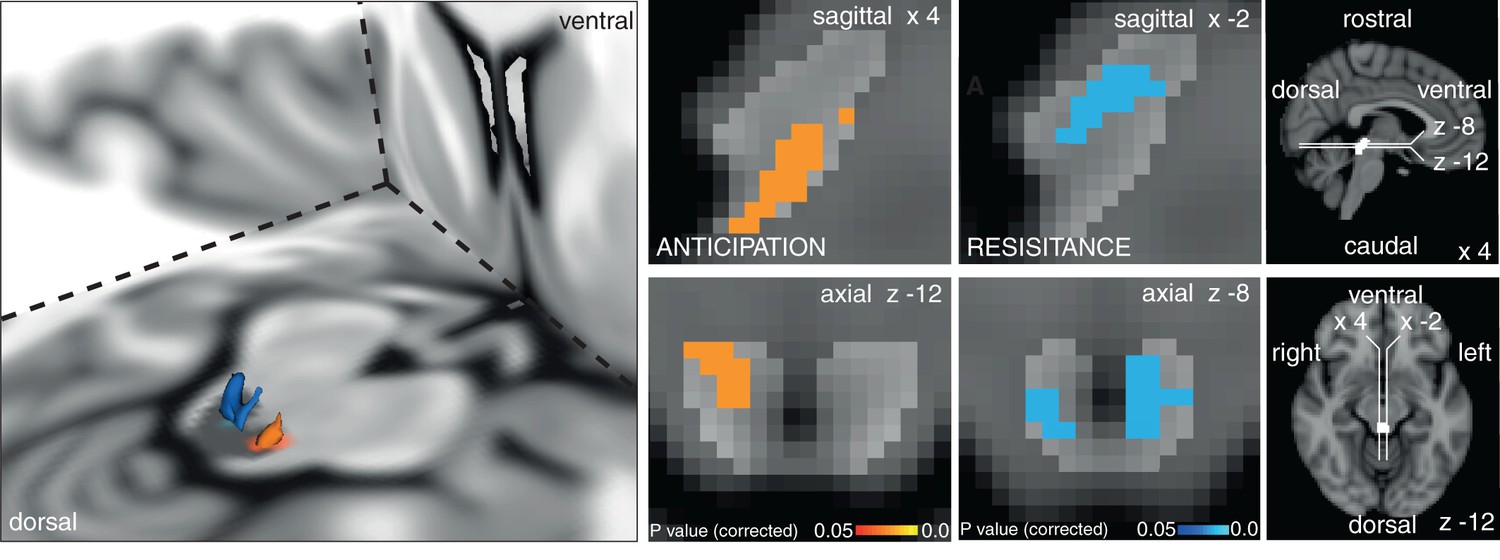
Periaqueductal gray (PAG) analysis.
Left: 3D representation of the PAG activations on the right. Top row sagittal view, bottom row axial view of activation in the vlPAG during anticipation of certain resistance (against baseline: p=0.021) and deactivation during inspiratory resistance in bilateral lPAG (p=0.007). The key on the right shows location of PAG mask and orientation of displayed slices. Statistics are small-volume-corrected for multiple comparisons using highlighted PAG mask, and the images consist of a colour-rendered statistical map superimposed on a standard (MNI 1 mm3) brain.
Figure 3
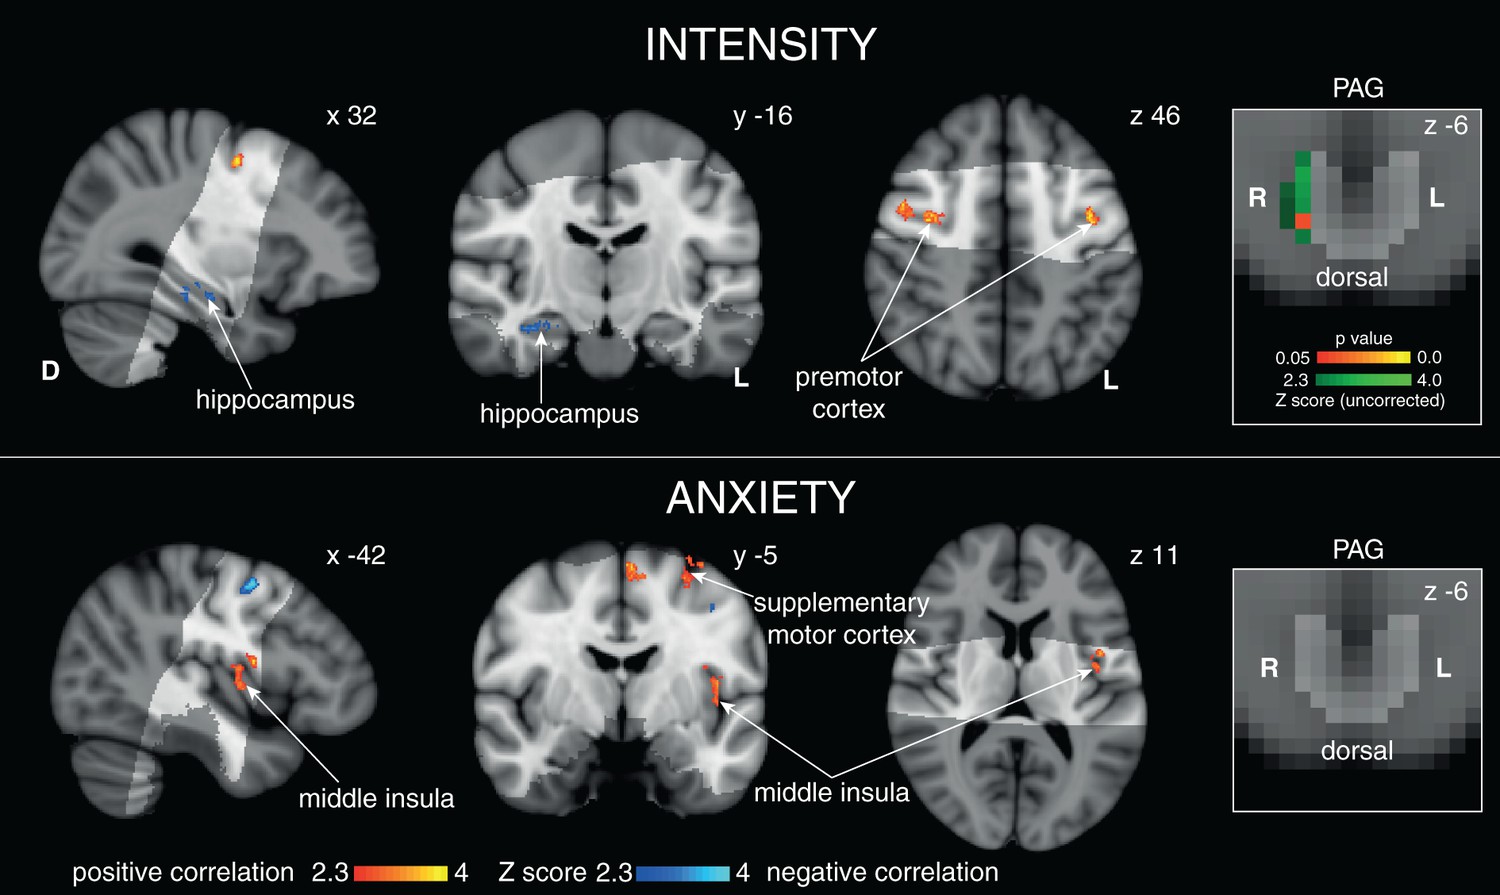
Scaled BOLD activity during 100% certain anticipation with intensity and anxiety.
Right: Positive correlation in the lPAG with intensity ratings (green uncorrected Z score, red/yellow TFCE-corrected for lPAG activity, PAG displayed in light grey) but not anxiety. Top: Cortical correlations with average intensity score. Bottom: Cortical correlations with anxiety score for certain anticipation. Images consist of a colour-rendered statistical map superimposed on a standard (MNI 1 mm3) brain.
Figure 4
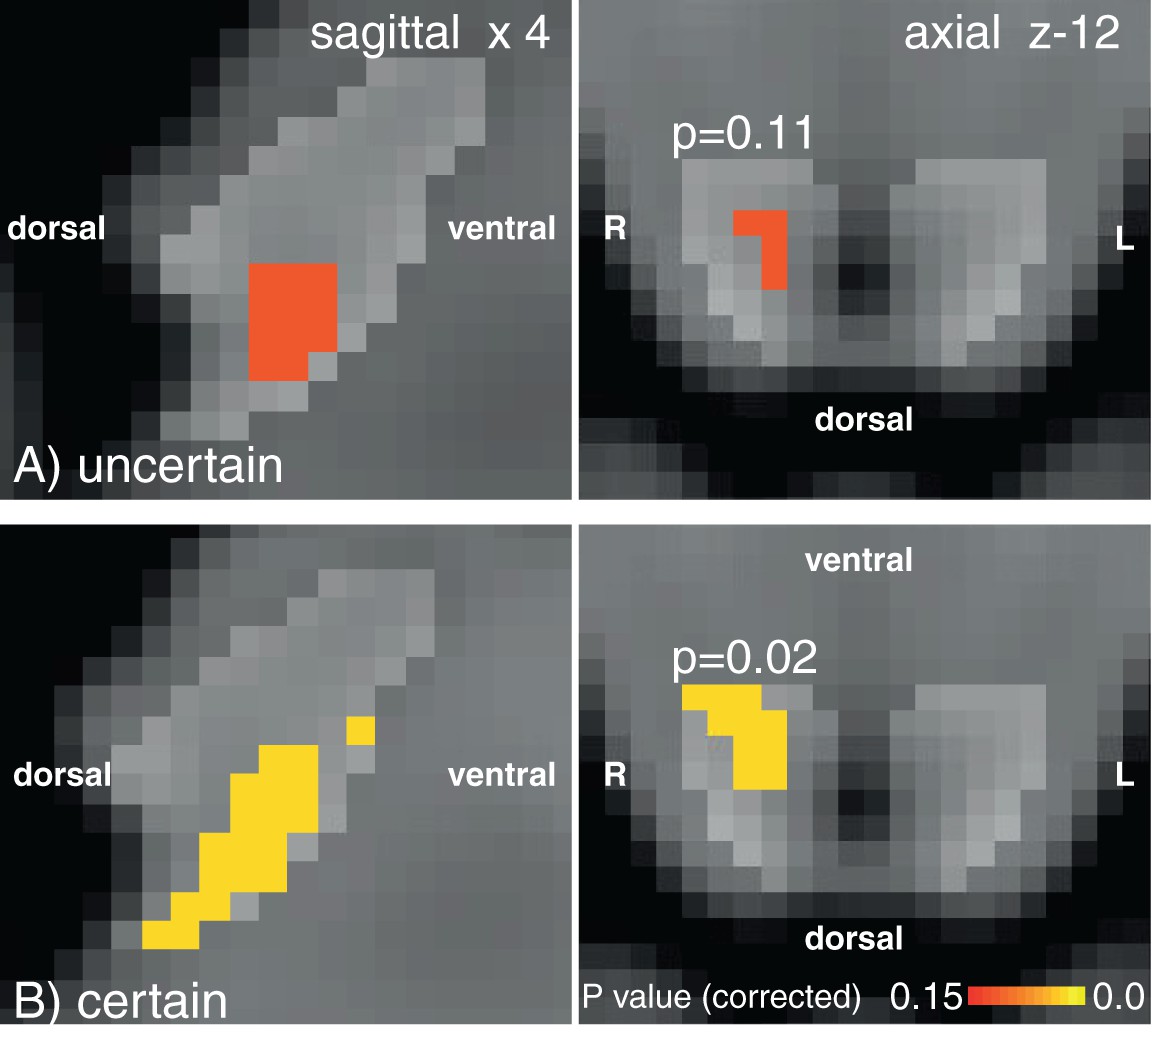
vlPAG activation with 100% certainty of resistance.
vlPAG activations during uncertain (A) and certain (B) anticipation of impending breathlessness. Uncertain anticipation produces subthreshold vlPAG activation in a consistent area to the certain condition. PAG mask displayed by light grey region. Images consist of a colour-rendered statistical map superimposed on a standard (MNI 1 mm3) brain. Orientations marked on the image.
Figure 5
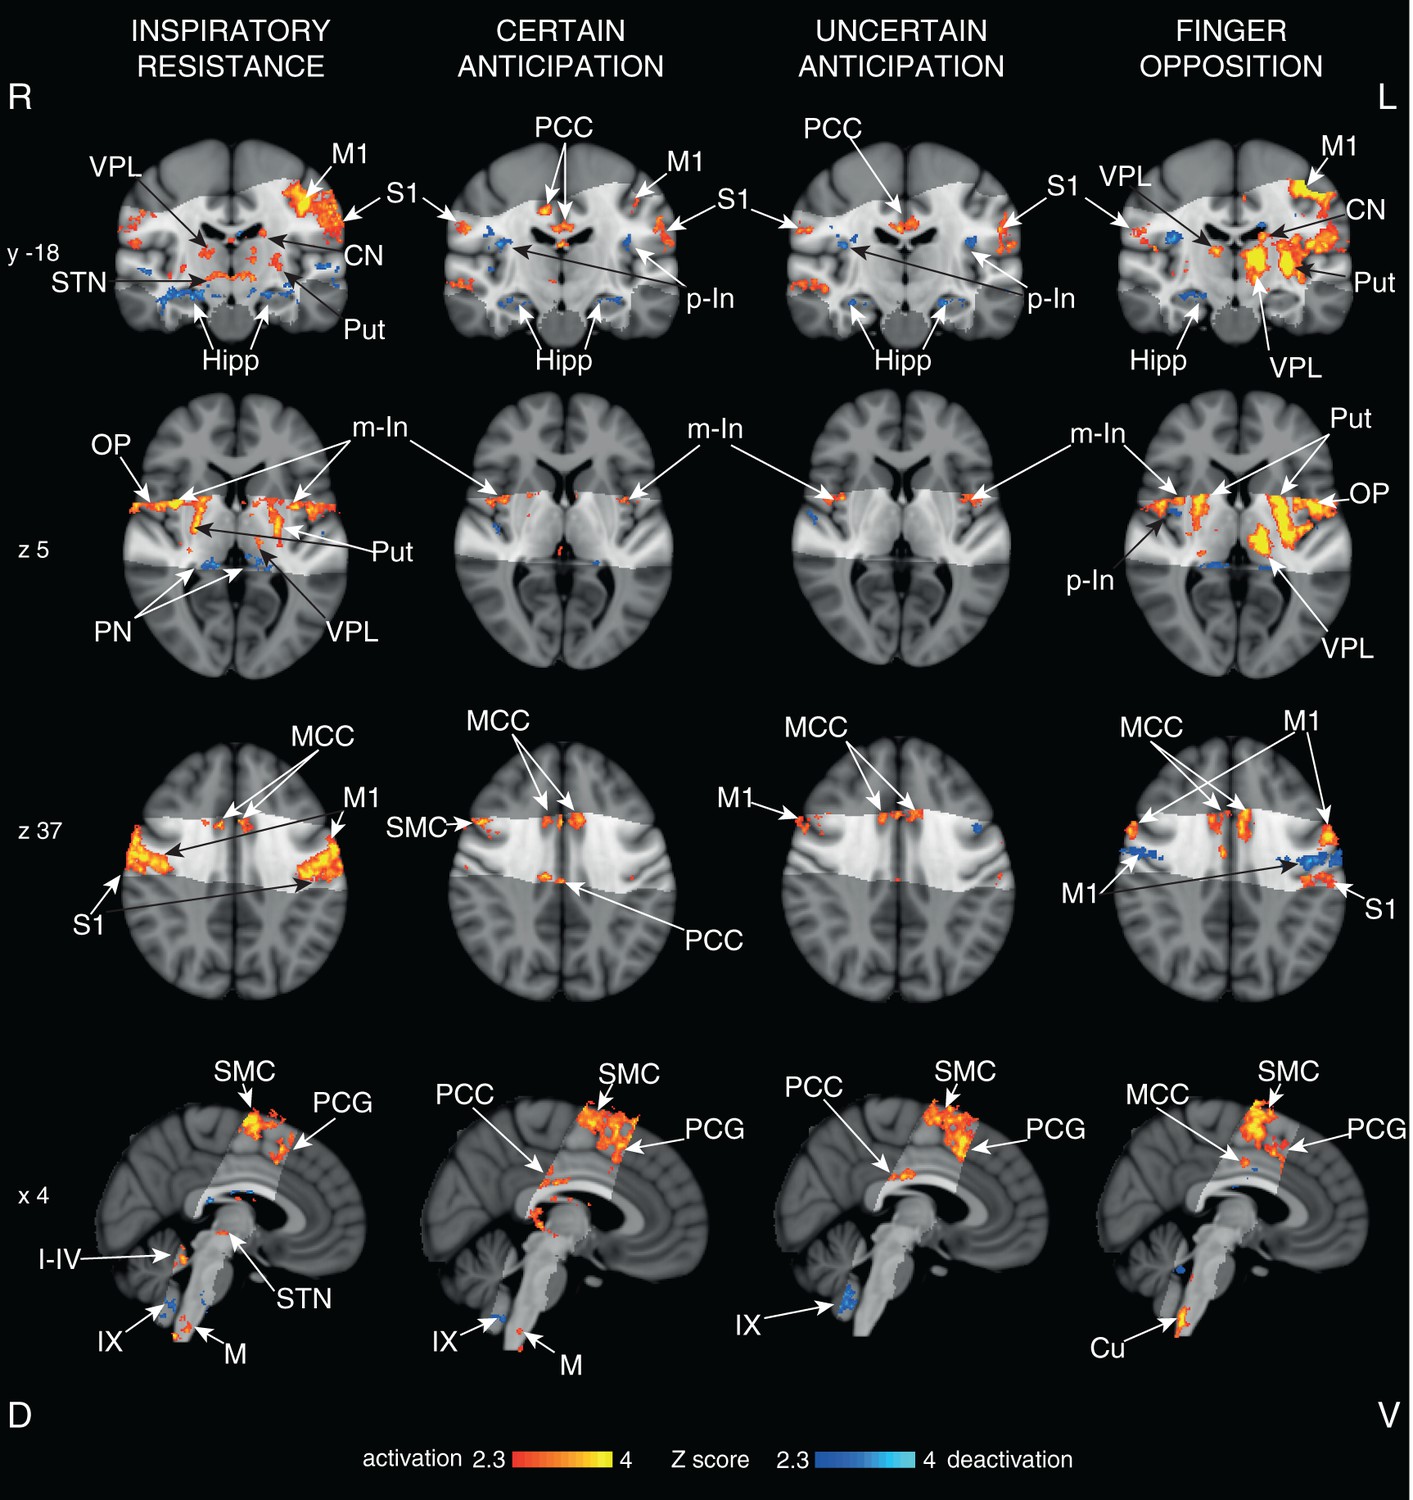
Cortical activity with functional tasks.
Mean cortical activations and deactivations identified during inspiratory resistance, 100% certain anticipation, 50% uncertain anticipation and finger opposition. The images consist of a colour-rendered statistical map superimposed on a standard (MNI 1 mm3) brain. The bright grey region represents the coverage of the coronal-oblique functional scan. Significant regions are displayed with a threshold Z>2.3, with a cluster probability threshold of p<0.05 (corrected for multiple comparisons). Abbreviations: VPL, ventral posterior lateral nucleus (thalamus); M1, primary motor cortex; S1, primary sensory cortex; CN, caudate nucleus; Put, putamen; Hipp, hippocampus; STN, subthalamic nucleus; PCC, posterior cingulate cortex; MCC, middle cingulate cortex; p-In, posterior insular; m-In, middle insular; OP, operculum; SMC, supplementary motor cortex; PCG, paracingulate gyrus; PN, posterior nuclei of the thalamus; PAG, periaqueductal gray; M, solitary nucleus of the medulla; Cu, cuneate nucleus (medulla); I-IV, I-IV cerebellar lobe; IX, IX cerebellar lobe. Source files providing peak voxel locations are provided (Figure 5—source data 1–3).
-
Figure 5—source data 1
Co-ordinates of local maxima of significant increases (activations) and decreases (deactivations) in the BOLD response to inspiratory loading.
Values derived from cluster-based analysis. The most significant maximum is listed for each anatomical location. Co-ordinates are in mm in standard space of MNI (1 mm3). x, distance right (+) or left (-) of the mid saggital line; y, distance anterior (+) or posterior (-) from a vertical plane through the anterior commissure; z, distance above (+) or below (-) the intercommisurial plane. Abbreviations: VPL, ventroposterolateral nucleus of the thalamus.
- https://doi.org/10.7554/eLife.12047.010
-
Figure 5—source data 2
Co-ordinates of local maxima of significant increases (activations) and decreases (deactivations) in the BOLD response during certain and uncertain anticipation of inspiratory loading.
Values derived from cluster-based analysis. The most significant maximum is listed for each anatomical location. Co-ordinates are in mm in standard space of MNI (1 mm3). x, distance right (+) or left (-) of the mid saggital line; y, distance anterior (+) or posterior (-) from a vertical plane through the anterior commissure; z, distance above (+) or below(-) the intercommisurial plane.
- https://doi.org/10.7554/eLife.12047.011
-
Figure 5—source data 3
Co-ordinates of local maxima of significant increases (activations) and decreases (deactivations) in the BOLD response to a finger opposition task.
Values derived from cluster-based analysis. The most significant maximum is listed for each anatomical location. Co-ordinates are in mm in standard space of MNI (1 mm3). x, distance right (+) or left (-) of the mid saggital line; y, distance anterior (+) or posterior (-) from a vertical plane through the anterior commissure; z, distance above (+) or below (-) the intercommisurial plane. Abbreviations: VPL, ventroposterolateral nucleus of the thalamus.
- https://doi.org/10.7554/eLife.12047.012
Figure 6
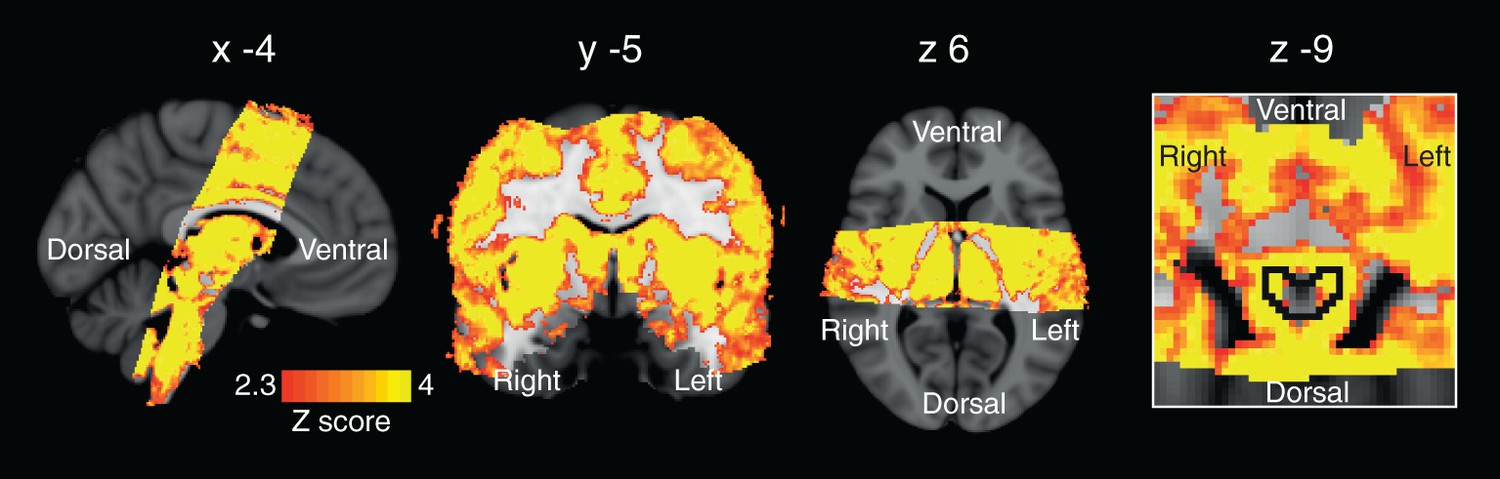
Regression of end tidal carbon dioxide effects.
Global BOLD signal change correlating with changes in end tidal carbon dioxide (PETCO2). The image on the right is a zoom to show signal changes within the PAG (outlined in black). Small hypercapnic challenges were administered during rest periods to dissociate hypercapnic effects from respiratory stimuli, and a carbon dioxide (CO2) trace was created by extrapolating between end-tidal CO2 peaks. The images consist of a colour-rendered statistical map superimposed on a standard (MNI 1 mm3) brain. Significant regions are displayed with a threshold Z>2.3, with a cluster probability threshold of p<0.05 (corrected for multiple comparisons).
Figure 7
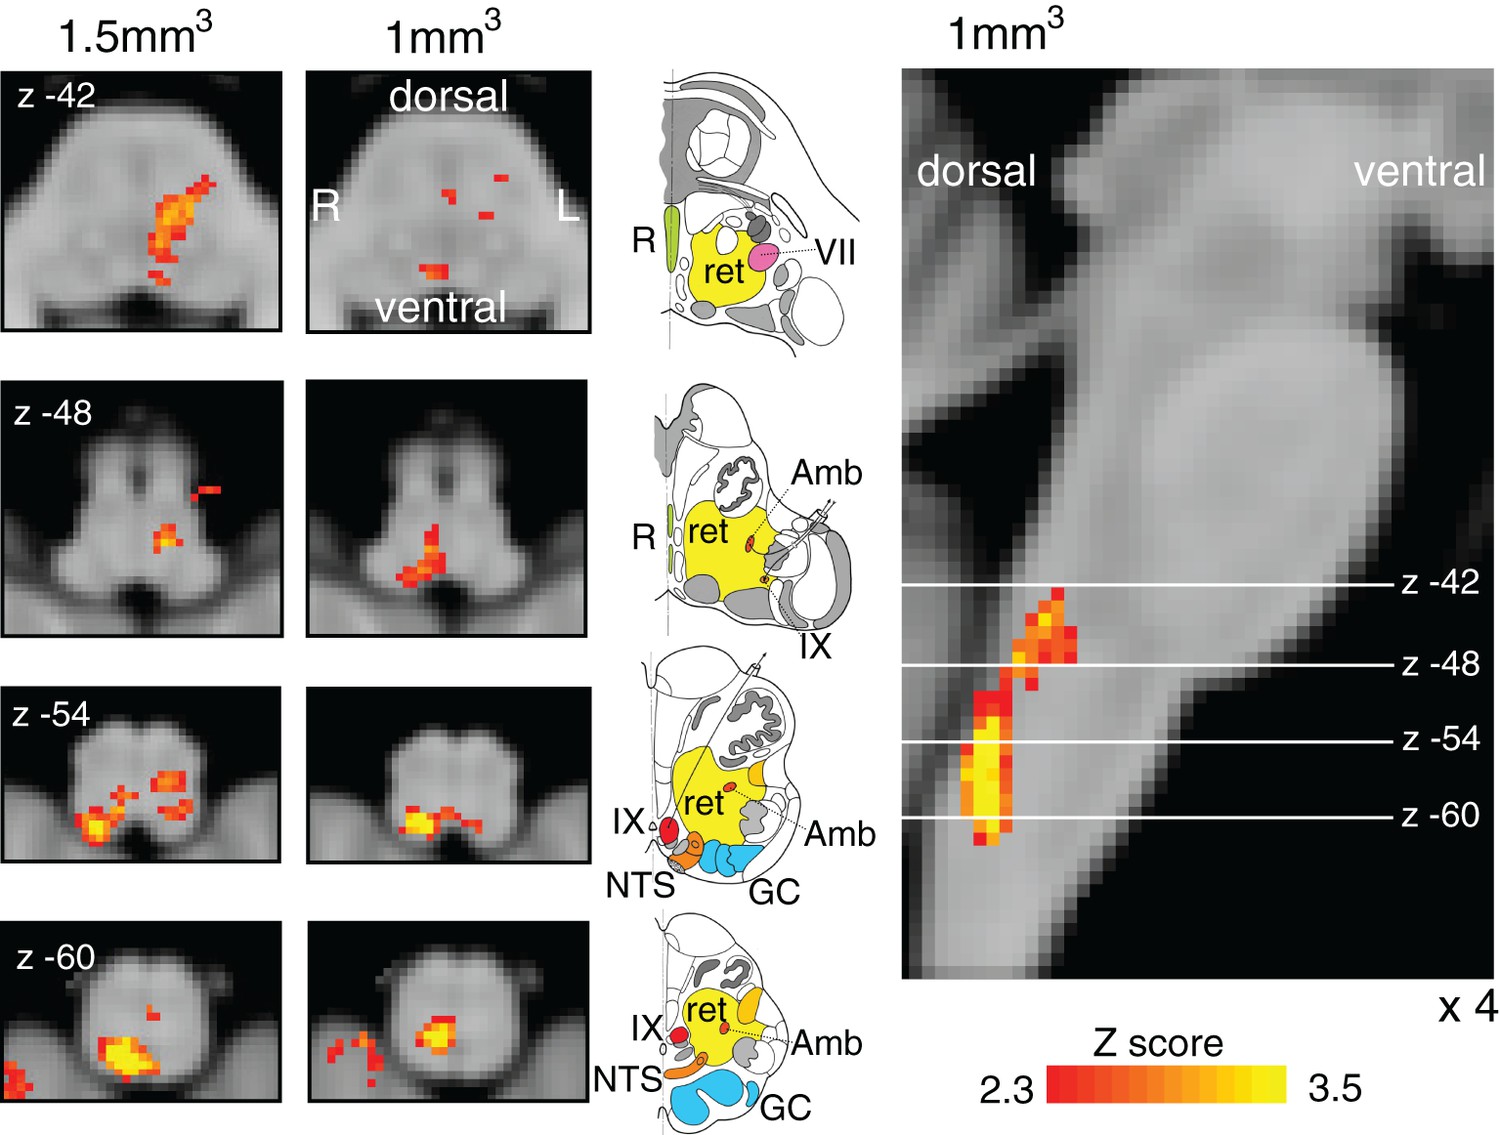
Finger opposition functional localiser.
Demonstration of the use of finger opposition as a functional localiser in brainstem FMRI in the current study compared to previous results, displaying hypothesised activation in the ipsilateral cuneate nucleus of the medulla (z -54). The 7 T 1 mm3 voxel data is derived from previously-published results (Faull et al., 2015) (14 repeats of 15 sec finger opposition, 1 mm3 voxels and TR=5 s), while the 1.5 mm3 voxel data is from the current study (10 repeats of 15 sec finger opposition, 1.5 mm3 voxels and TR=3.11 s). This technique provides confidence in the analysis model and registration accuracy of the current 7 T study. The images consist of a colour-rendered statistical map superimposed on a standard (MNI 1 mm3) brain. Significant regions are displayed with a threshold Z>2.3, with a cluster probability threshold of p<0.05 (corrected for multiple comparisons). The sagittal image on the right displays the position of slices, for clarity only displayed from the 7 T 1 mm3 acquisition. Abbreviations: R, raphe nuclei; ret, nuclei reticularis; VII, facial nucleus; Amb, nucleus ambiguous; IX, glossopharyngeal nucleus; NTS, nucleus tractus solitaries; GC, gracile (medial) and cuneate (lateral) nuclei (in blue). R (right) and L (left) indicate image orientation. Original line drawings adapted from Duvernoy, 1995.
Figure 8
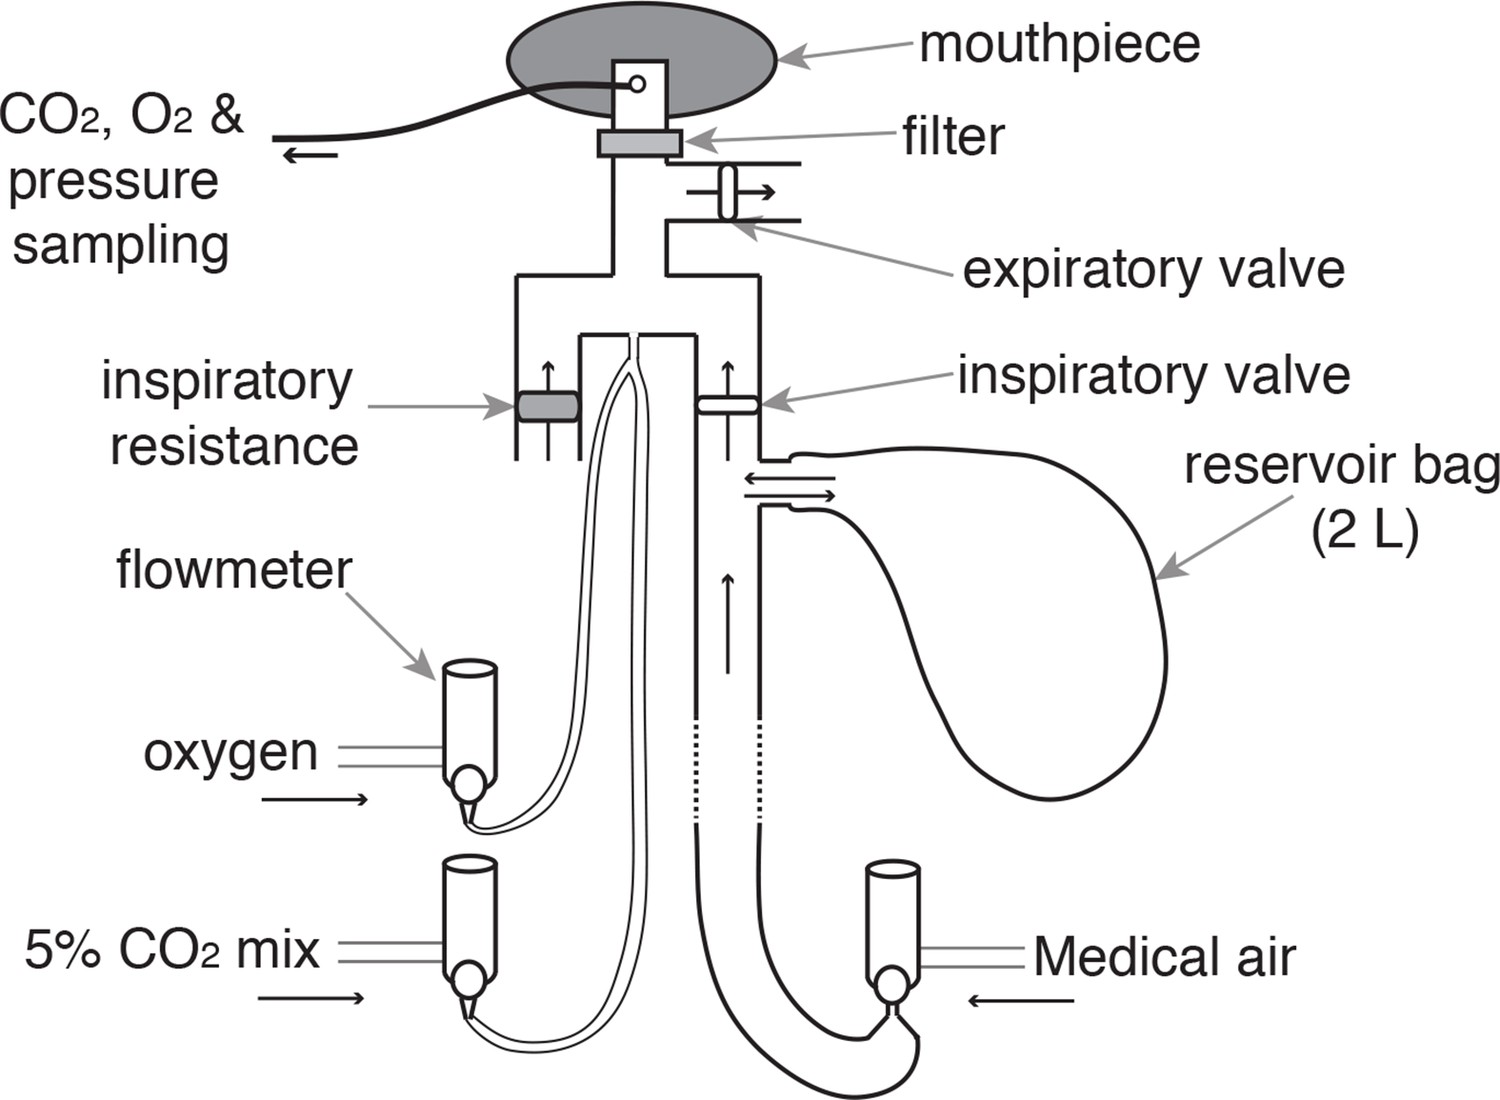
Breathing system.
Schematic diagram of breathing system that allows remote administrations of inspiratory resistance. Medical air is supplied to the subject, with a reservoir of 2 L. Excess flow and expiration escapes through the one-way expiratory valve, close to the mouth to minimise rebreathing (inspiratory and expiratory valves: Hans Rudolf, Kansas City, MO, USA). Resistive loading is induced by discontinuing the delivery of medical air, forcing the subject to draw air through the resistor (porous glass disc). A diving mouthpiece (Scubapro UK Ltd, Mitcham, UK) connects to a bacterial and viral filter (GVS, Lancashire, UK), sampling lines (Vygon SA, Ecouen, France), connect to a pressure transducer (MP 45, ± 50 cmH2O, Validyne Corp., Northridge, CA, USA) and amplifier (Pressure transducer indicator, PK Morgan Ltd, Kent, UK) for inspiratory pressure readings, and to a gas analyser (Gas Analyser; ADInstruments Ltd, Oxford, United Kingdom) for respiratory gases. A mildly hyperoxic state was achieved through a constant administration of oxygen at a rate of 0.5 L/min. Periodically throughout scanning carbon dioxide challenges were administered to raise PETCO2 to match the PETCO2 rise during inspiratory loading periods.
Figure 9
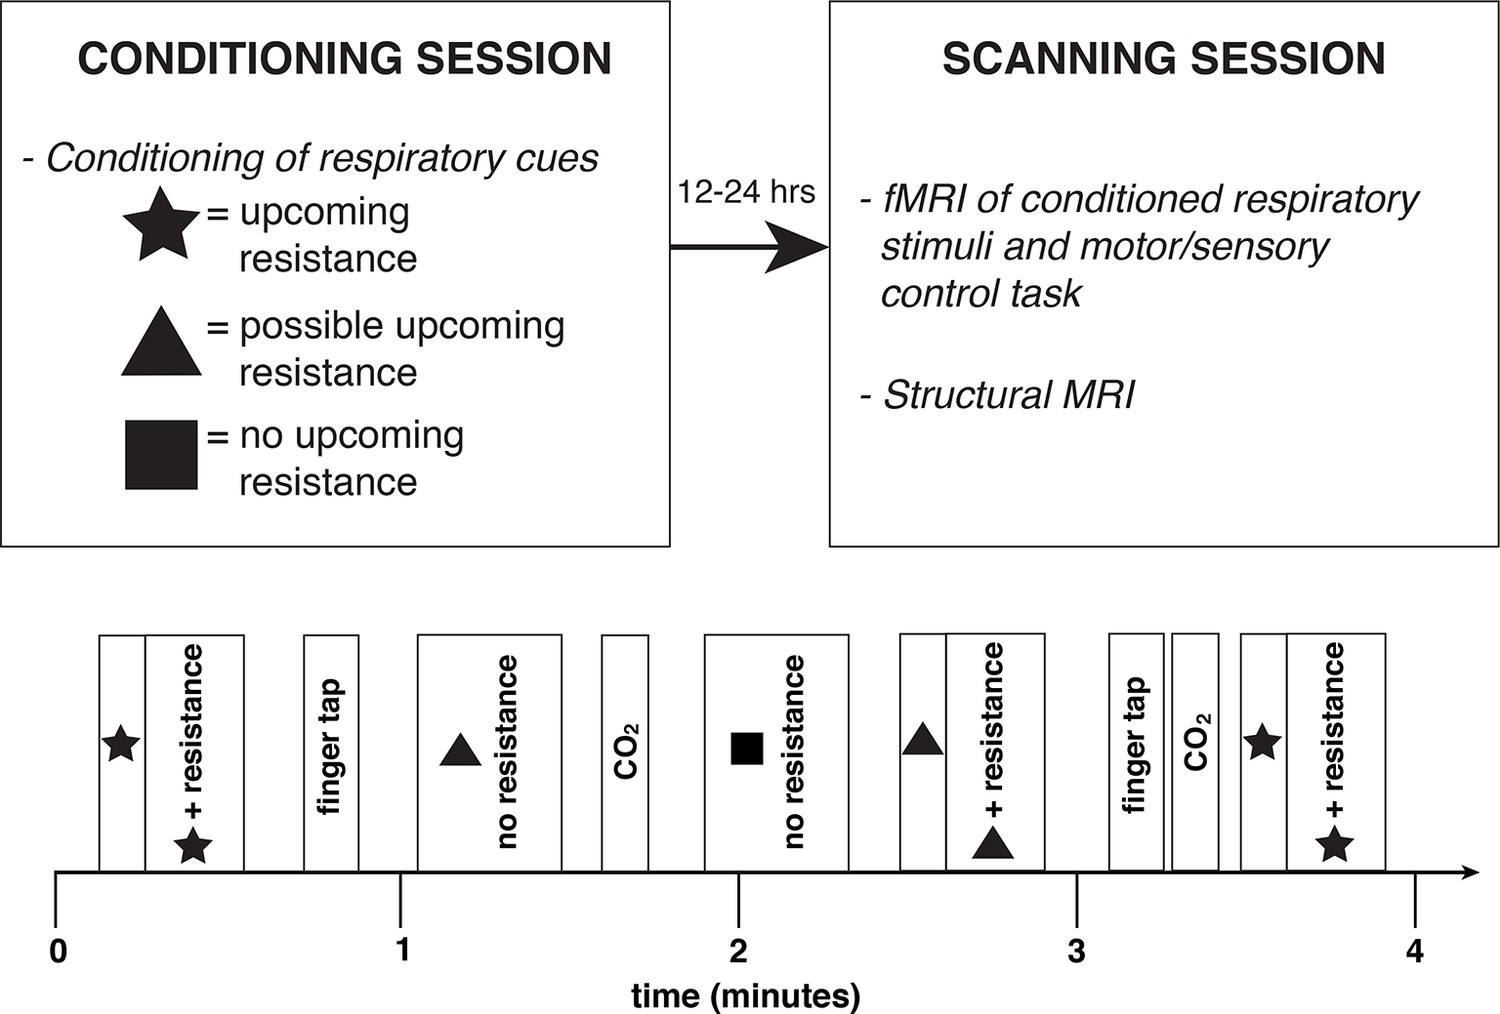
Experimental protocol.
Study overview (top) and example four minutes of the experimental protocol (bottom), repeated throughout the conditioning and fMRI scanning sessions. Anticipation periods were 5–15 s duration, and resistance periods 15–25 s, and there were 10 repeats of each stimulus.
Tables
Table 1
Mean ( ± SD) anxiety and intensity ratings to the conditioned respiratory tasks.
| No impending resistance | Uncertain impending resistance | Certain impending resistance | |
|---|---|---|---|
| Anxiety (%) | 4.3 (5.1) | 36.7 (22.3)* | 48 (26.7)** |
| Intensity (%) | 4.7 (3.1) | 55.5 (20.9)* | 62.9 (21.5)** |
-
*Significantly (p<0.05) different from ‘no impending resistance’ condition;
-
**Significantly (p<0.05) different from ‘no impending resistance’ and ‘uncertain impending resistance’.
Table 2
Mean ( ± SD) physiological variables across conditioned respiratory tasks.
| Anticipation | Resistance | ||||
|---|---|---|---|---|---|
| No impending resistance | Uncertain impending resistance | Certain impending resistance | Average | Peak | |
| Pressure (cmH2O) | -0.14 (0.11) | -0.17 (0.12) | -0.18 (0.24) | -5.80 (3.64)* | -14.67 (8.28)* |
| PETCO2 (%) | 4.41 (0.71) | 4.41 (0.67) | 4.32 (0.68)* | 4.46 (0.67) | 4.62 (0.66)* |
| PETO2 (%) | 18.1 (1.0) | 18.1 (1.0) | 18.3 (1.1)* | 18.5 (1.0)* | 18.9 (1.0)* |
| Respiratory rate (min-1) | 12.8 (3.7) | 12.5 (3.8) | 12.4 (3.6) | 11.2 (4.6) | 13.8 (5.9) |
| RVT increase (%) | -4.4 (7.4) | 7.8 (19.6)* | 11.0 (23.0)* | -16.1 (21.6)* | 16.6 (28.5)* |
-
*Significantly (p<0.05) different from ‘no impending resistance’ condition.
-
Abbreviations: Pressure, average mouth pressure across all ventilatory cycles; PETCO2, pressure of end-tidal carbon dioxide; PETO2, pressure of end-tidal oxygen; RVT, respiratory volume per unit time.
Download links
A two-part list of links to download the article, or parts of the article, in various formats.
Downloads (link to download the article as PDF)
Open citations (links to open the citations from this article in various online reference manager services)
Cite this article (links to download the citations from this article in formats compatible with various reference manager tools)
Conditioned respiratory threat in the subdivisions of the human periaqueductal gray
eLife 5:e12047.
https://doi.org/10.7554/eLife.12047


