Kindlin-2 cooperates with talin to activate integrins and induces cell spreading by directly binding paxillin
- Max Planck Institute of Biochemistry, Germany
- Eidgenössische Technische Hochschule Zürich, Switzerland
- Vanderbilt University, United States
- Veterans Affairs Medical Center, United States
Figures
Figure 1 with 4 supplements
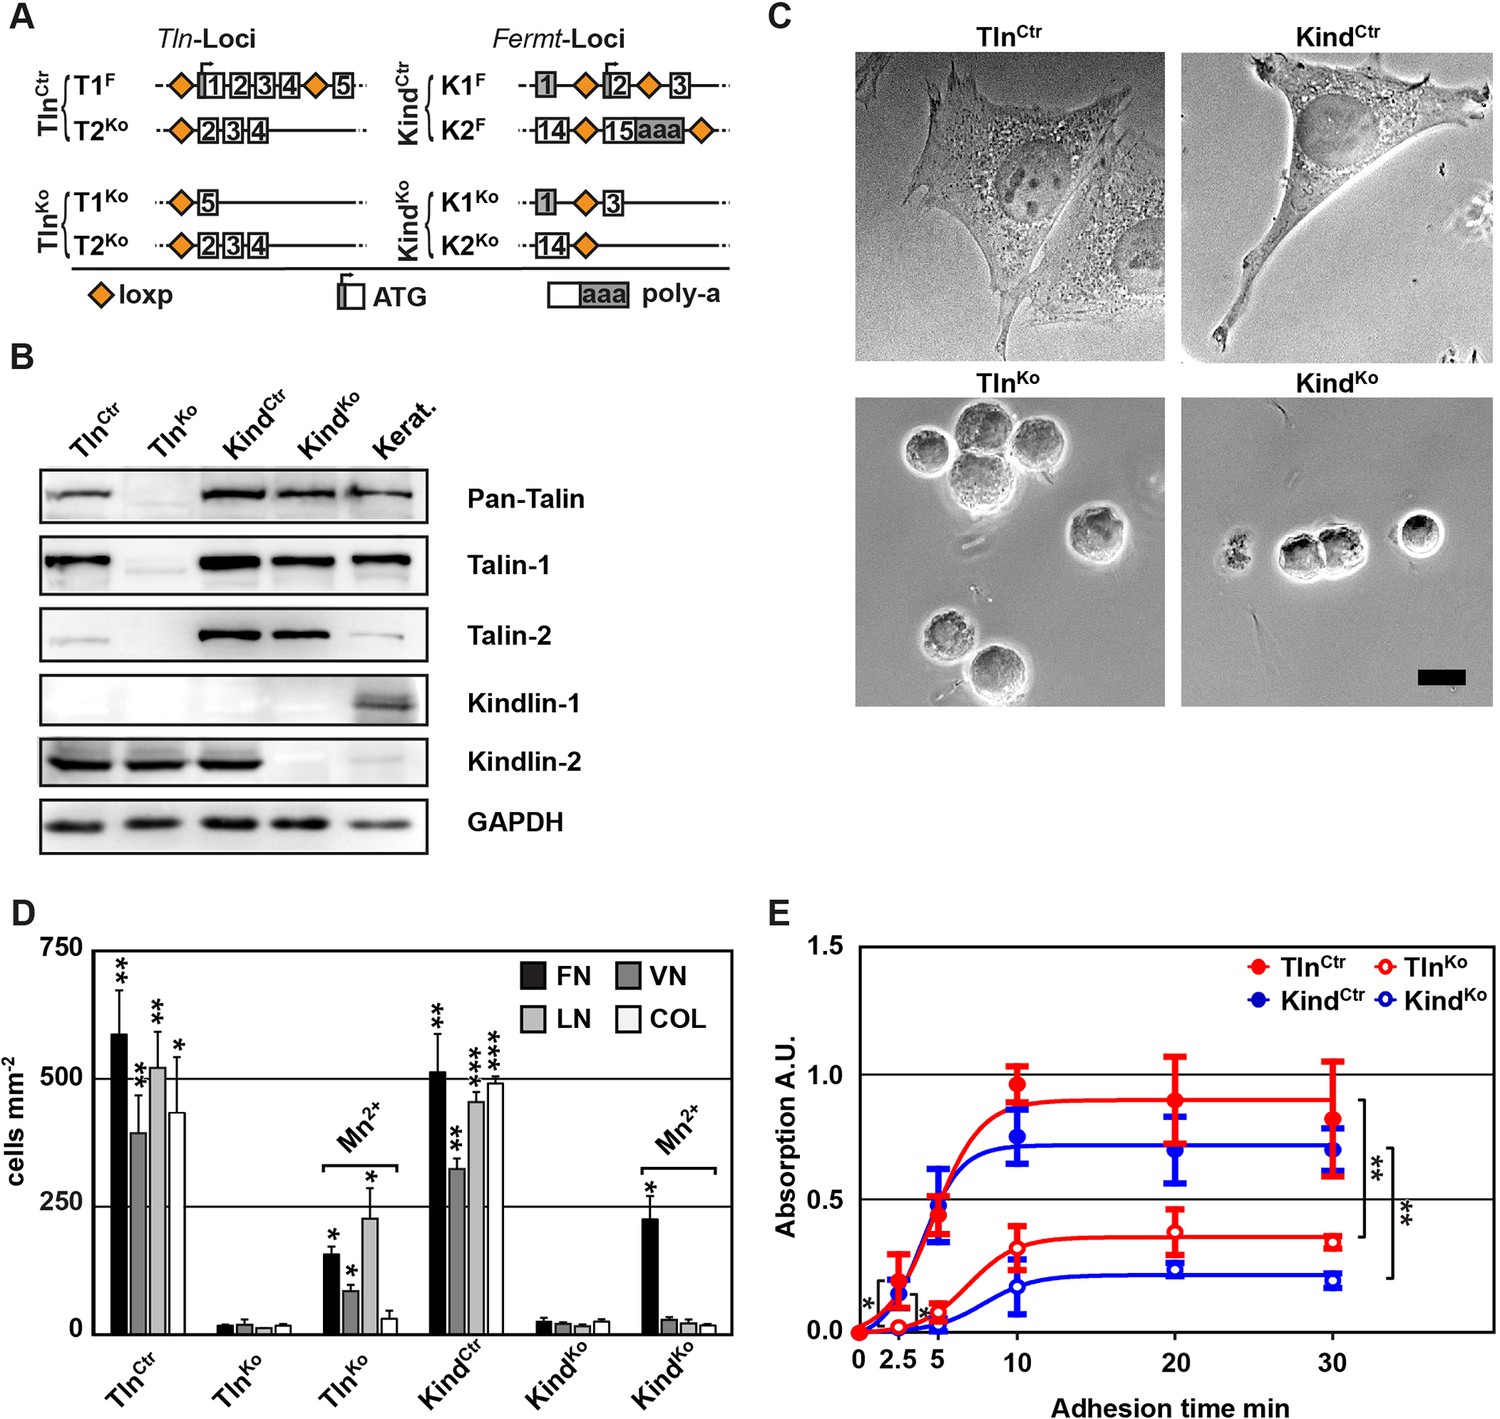
Kindlin and talin are required for integrin-mediated cell adhesion.
(A) Scheme showing gene loci before and after ablation of the Tln1, -2 and Fermt1, -2 genes. Orange diamonds indicate loxP sites and rectangles exons; untranslated regions are marked grey. (B) Western blot of TlnKo and KindKo cells. Keratinocyte lysates (Kerat.) served to control kindlin-1 expression. (C) Bright field images of TlnCtr, KindCtr, TlnKo and KindKo cells. (D) Quantification of cell adhesion on indicated substrates 30 min after seeding by counting DAPI stained cells; n=3 independent experiments, error bars indicate standard error of the mean; t-test significances are calculated between untreated TlnKo or KindKo cells and the corresponding TlnCtr and KindCtr or Mn2+-treated TlnKo or KindKo cell lines on same substrates; only significant differences are shown. (E) Quantification of Mn2+-stimulated cell adhesion for indicated times on FN; cells were quantified by absorbance measurement of crystal violet staining; n=3 independent experiments; lines represent sigmoidal curve fit; error bars indicate standard deviation; significances for indicated pairs after 2.5 min were calculated by two-tailed t-test and significances for indicated pairs of the overall kinetics were calculated by two-way RM ANOVA. Bar, 10 µm. COL, collagen; DAPI, 4',6-diamidino-2-phenylindole; FN, fibronectin; GAPDH, glyceraldehyde-3-phosphate dehydrogenase; LN, laminin-111; RM ANOVA, repeated measures analysis of variance; VN, vitronectin.
Figure 1—figure supplement 1
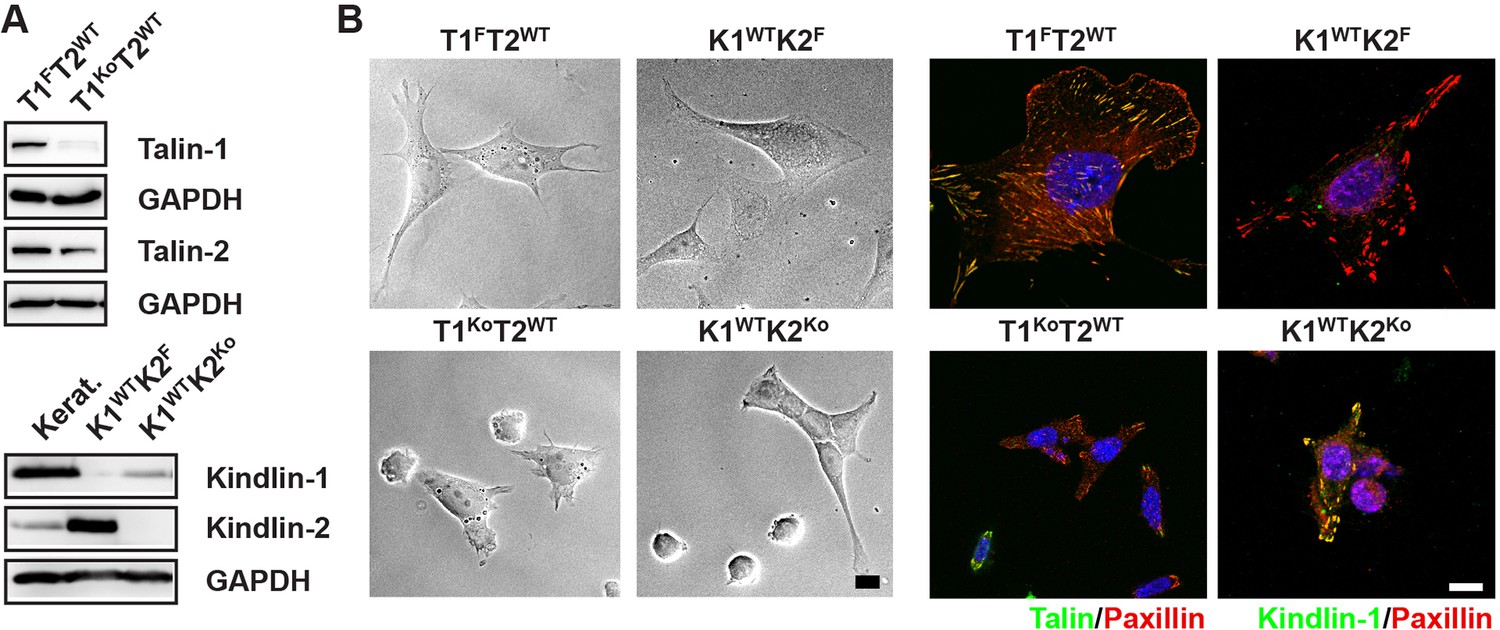
Talin-1- and kindlin-2-deficient fibroblasts.
(A) Western blots showing talin-2 expression in floxed talin-1 (T1F) and T1Ko fibroblasts and de novo expression of the Fermt1 gene in kindlin-2-null (K2Ko) fibroblasts. Keratinocytes (Kerat.) expressing high levels of kindlin-1 served as control for the anti-kindlin-1 antibody. GAPDH served as loading control. (B) Talin-1- and kindlin-2-deficient fibroblasts partially spread (bright field imaging, left panels) and form paxillin-positive adhesion sites (immunostaining, right panels). Bars, 10 µm. GAPDH, glyceraldehyde-3-phosphate dehydrogenase.
Figure 1—figure supplement 2
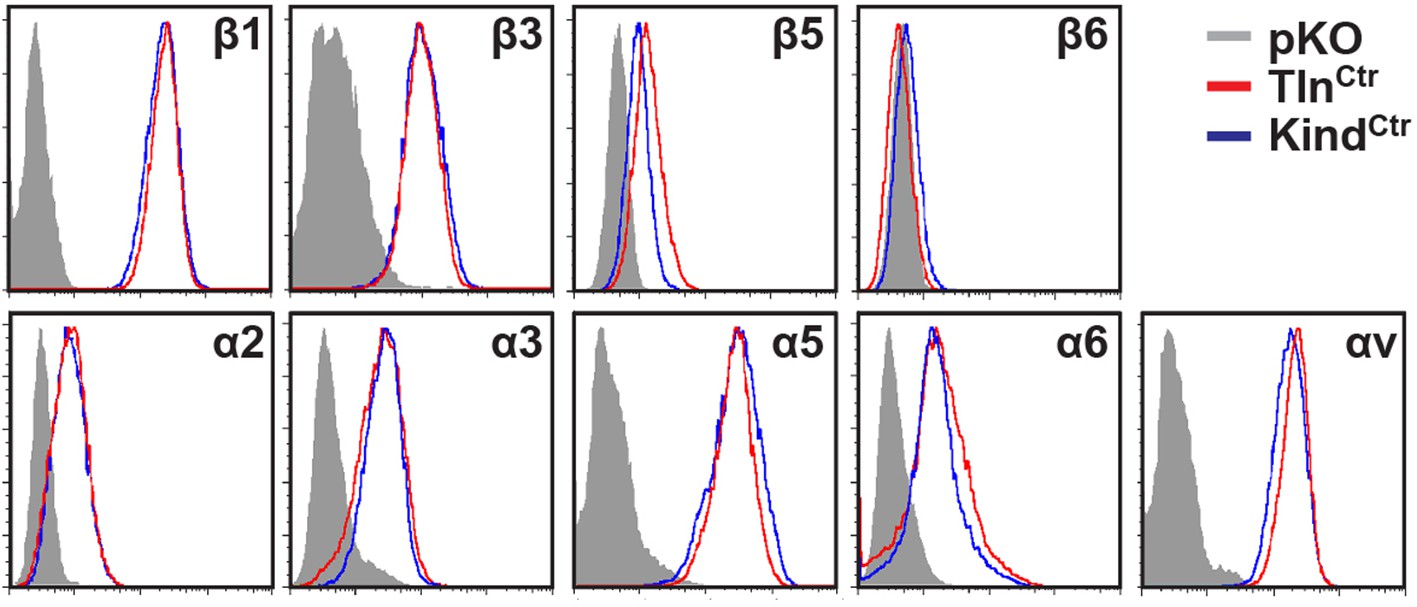
Integrin expression profiles of TlnCtr and KindCtr cells.
Cell surface expression of different integrin subunits on TlnCtr and KindCtr cells was measured by flow cytometry and presented as histograms. Fluorescence-activated cell sorting histograms of cells lacking expression of all integrins (pKO) served as negative control and are shown in grey.
Figure 1—figure supplement 3
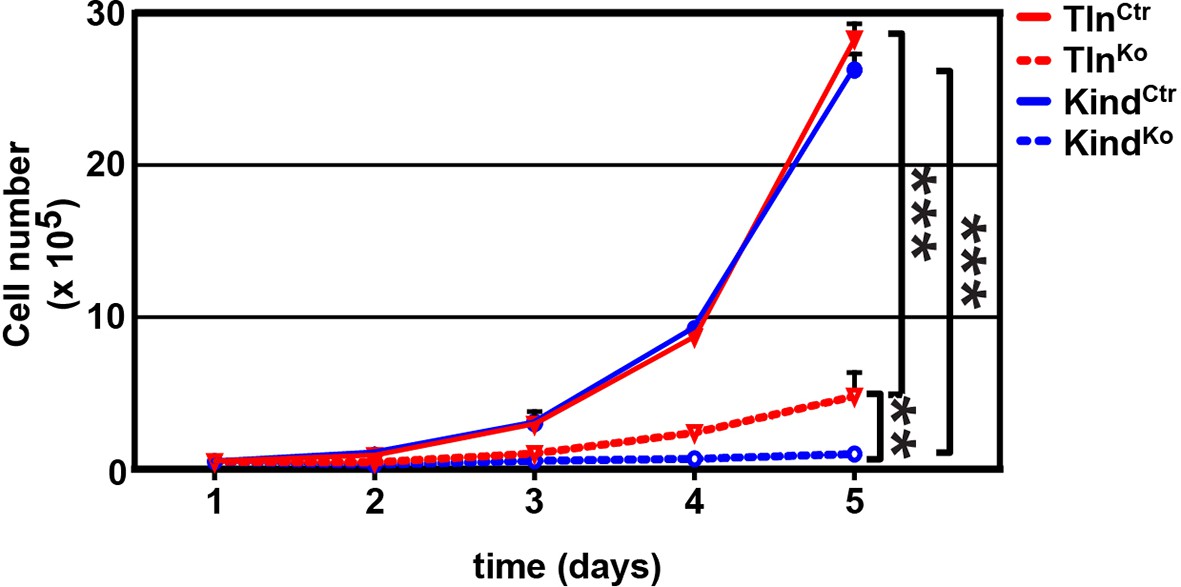
Cell proliferation of TlnKo and KindKo cells.
TlnKo and KindKo cells show a significantly reduced increase in cell numbers, which were determined by cell counting at indicated time points (error bars indicate standard deviation; significances are given for indicated pairs and were calculated by two-way ANOVA). ANOVA, analysis of variance.
Figure 1—figure supplement 4
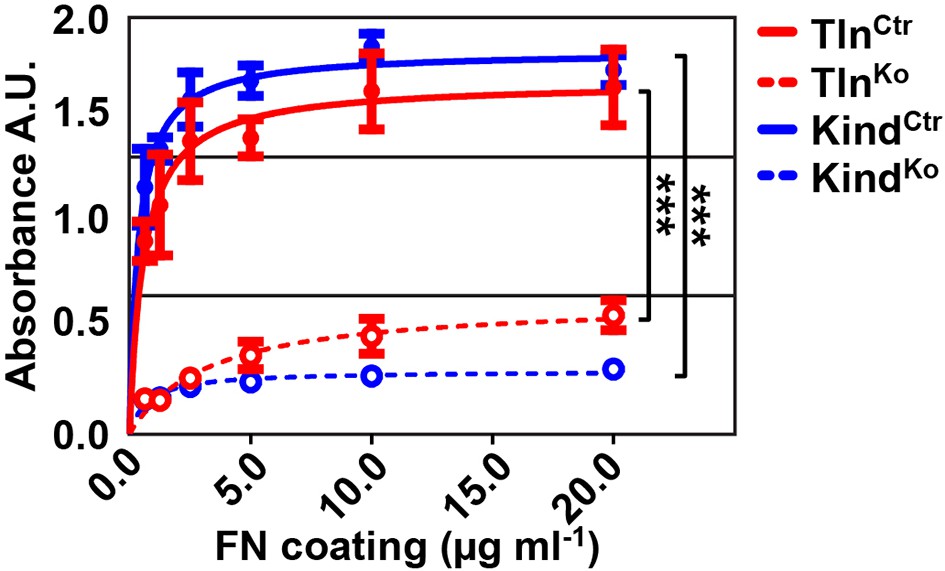
Cell adhesion of TlnKo and KindKo cells on different FN concentrations.
Cell adhesion was measured 20 min after seeding the indicated cell lines on plastic surfaces coated with the indicated FN concentrations. Cells were PFA fixed and quantified by absorbance measurement of crystal violet staining (n=3 independent experiments; lines represent hyperbolic curve fits; error bars indicate standard deviation; significances for indicated pairs of the overall kinetics were calculated by two-way RM ANOVA). FN, fibronectin, PFA, paraformaldehyde; RM ANOVA, repeated measures analysis of variance.
Figure 2 with 4 supplements
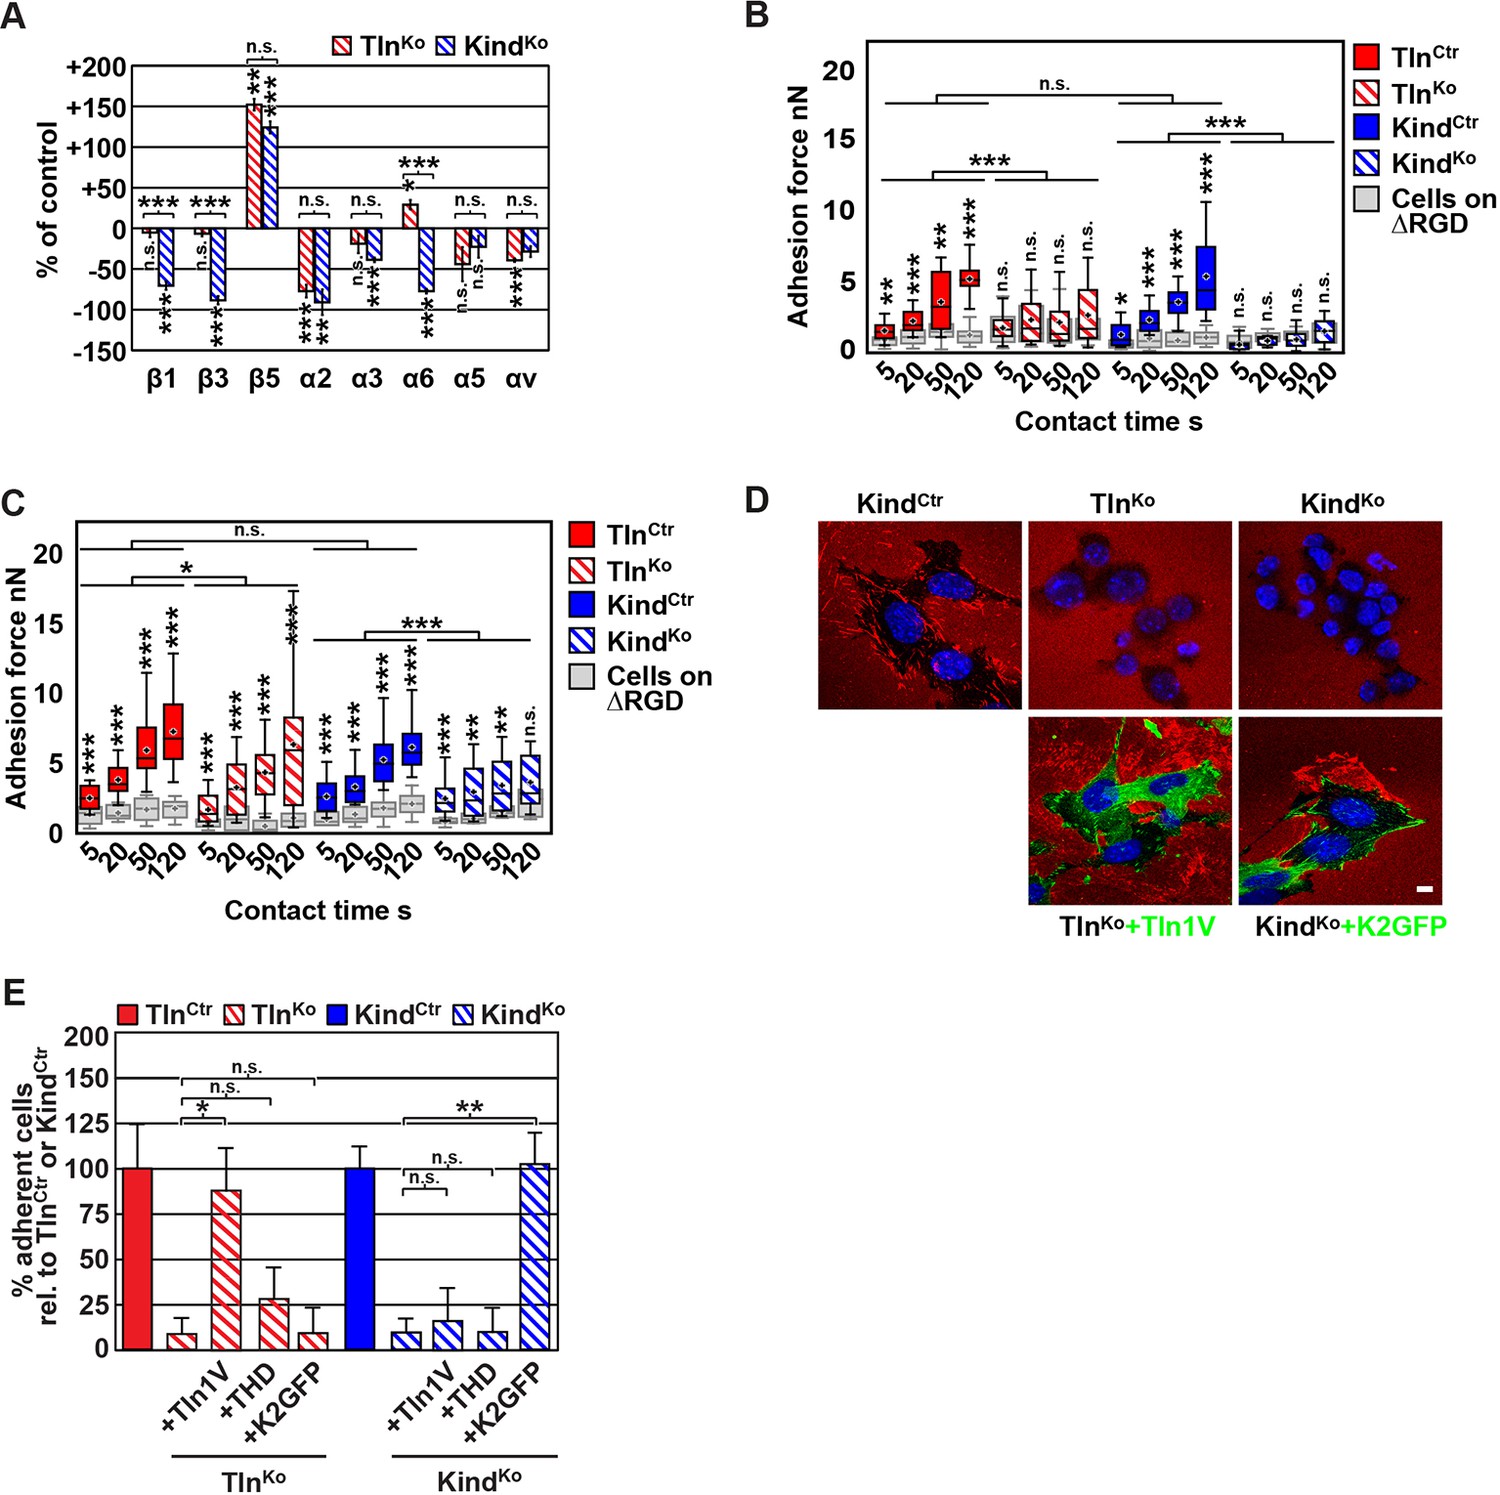
FN binding by TlnKo and KindKo cells.
(A) Quantification of integrin surface expression levels relative to the TlnCtr and KindCtr cell lines; independent experiments: n=10 for β1; n=4 for β3, α5, αv; n=3 for remaining integrin subunits; error bars indicate standard error of the mean; significances are calculated between TlnKo and KindKo cells indicated by brackets, or between TlnKo or KindKo cells and corresponding control cells indicated by the significances above or below bars. (B, C) Box plot representation of adhesion forces generated by cells interacting with surface immobilized FN fragments. Cells were immobilized on ConA-coated AFM cantilevers and pressed onto surfaces coated with the FN-RGD or integrin-binding deficient FN-ΔRGD fragments for varying contact times, either in the absence (B) or presence of Mn2+ (C). Coloured and grey boxplots represent adhesion forces from at least 10–15 independent experiments with single cells; + signs represent mean; the significance between adhesion on FN-RGD versus FN-ΔRGD is given on top of each boxplot and was calculated with a Mann–Whitney U test; brackets indicate two-way RM ANOVA comparisons of the whole adhesion kinetics. (D) FN staining after plating cells on a FN-coated dish for 24 hr. (E) Quantification of cell adhesion on FN 30 min after seeding; values are normalized to TlnCtr and KindCtr; n=3 independent experiments; error bars indicate standard error of the mean. Bar, 10 µm. AFM, atomic force microscopy; ConA, Concanavalin A; FN, fibronectin; K2GFP, green fluorescent protein-tagged kindlin-2; RGD, Arg-Gly-Asp; RM ANOVA, repeated measures analysis of variance; THD, talin-1 head domain; Tln1V, Venus-tagged full length talin-1.
Figure 2—figure supplement 1
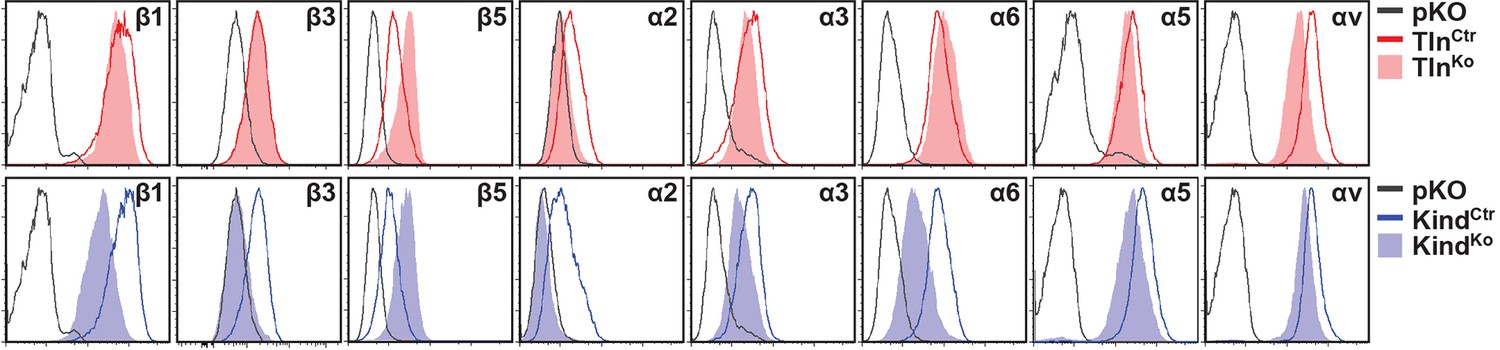
Integrin expression profiles of TlnCtr, TlnKo, KindCtr and KindKo cells.
Representative FACS histograms of different integrin subunits expressed on TlnCtr, TlnKo, KindCtr and KindKo cells are shown. FACS histograms of cells lacking expression of all integrins (pKO) served as negative control and are shown in grey. FACS, fluorescence-activated cell sorting.
Figure 2—figure supplement 2
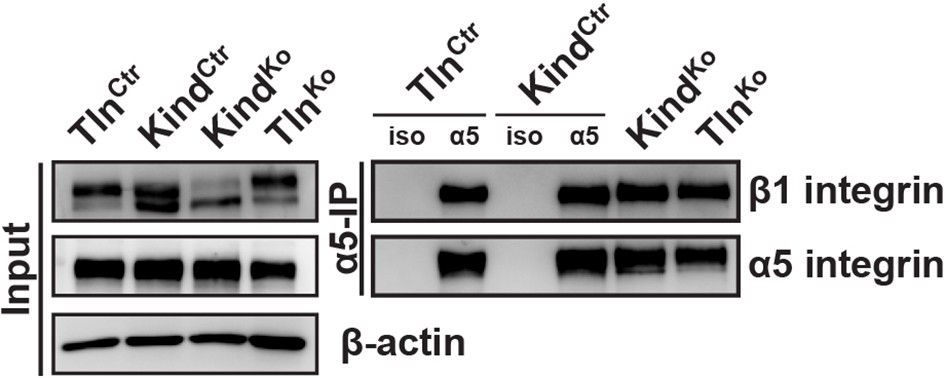
TlnKo and KindKo cells display comparable α5β1 integrin cell surface levels.
Live TlnCtr, KindCtr, TlnKo and KindKo cells were incubated with antibodies against α5 integrin (α5) or with an unrelated isotype control (iso) on ice to immunoprecipitate α5 integrin from their cell surface. Following immunoprecipitation, the proteins were analyzed by western blotting to determine the levels of β1 and α5 integrin.
Figure 2—figure supplement 3
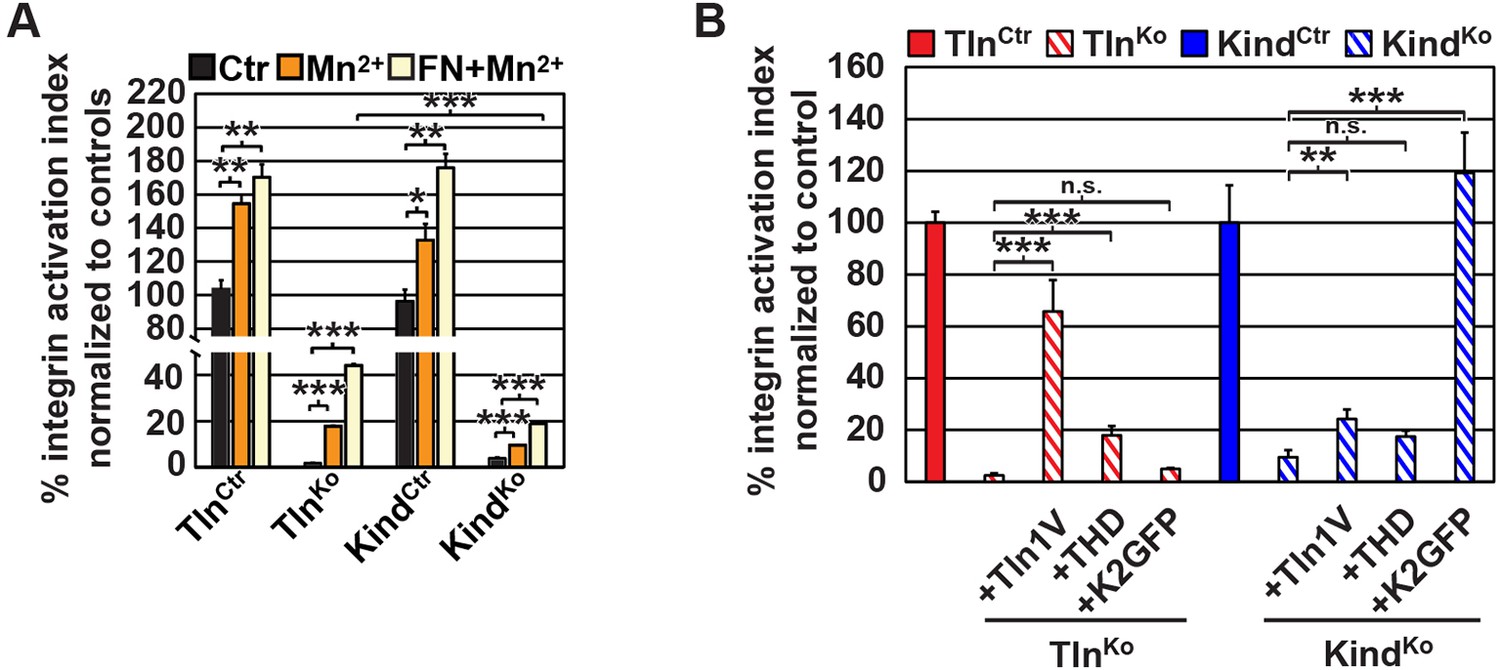
β1 integrin activation in TlnCtr, TlnKo, KindCtr, KindKo cells.
(A) FACS quantification of 9EG7 antibody binding to the indicated cell lines in the presence of 0.3 µM FN (FN) or 5 mM MnCl2 and 0.3 µM FN (FN+Mn2+) (n=3 independent experiments; 9EG7 binding was normalized to total-β1 surface levels and 100% represents the average of TlnCtr and KindCtr under control buffer condition; error bars indicate standard error of the mean; significances are calculated between Ctr and indicated condition). (B) FACS quantification of total β1-antibody and 9EG7-antibody binding to TlnCtr and KindCtr cells and cells reconstituted with Tln1V, K2GFP or THD. 9EG7 binding was normalized to total β1 surface levels and control cell lines were set to 100% (n>3 independent experiments; significances are given for indicated pairs; error bars indicate standard error of the mean). FACS, fluorescence-activated cell sorting; FN, fibronectin; K2GFP, green fluorescent protein-tagged kindlin-2; THD, talin-1 head domain; Tln1V, Venus-tagged full length talin-1.
Figure 2—figure supplement 4
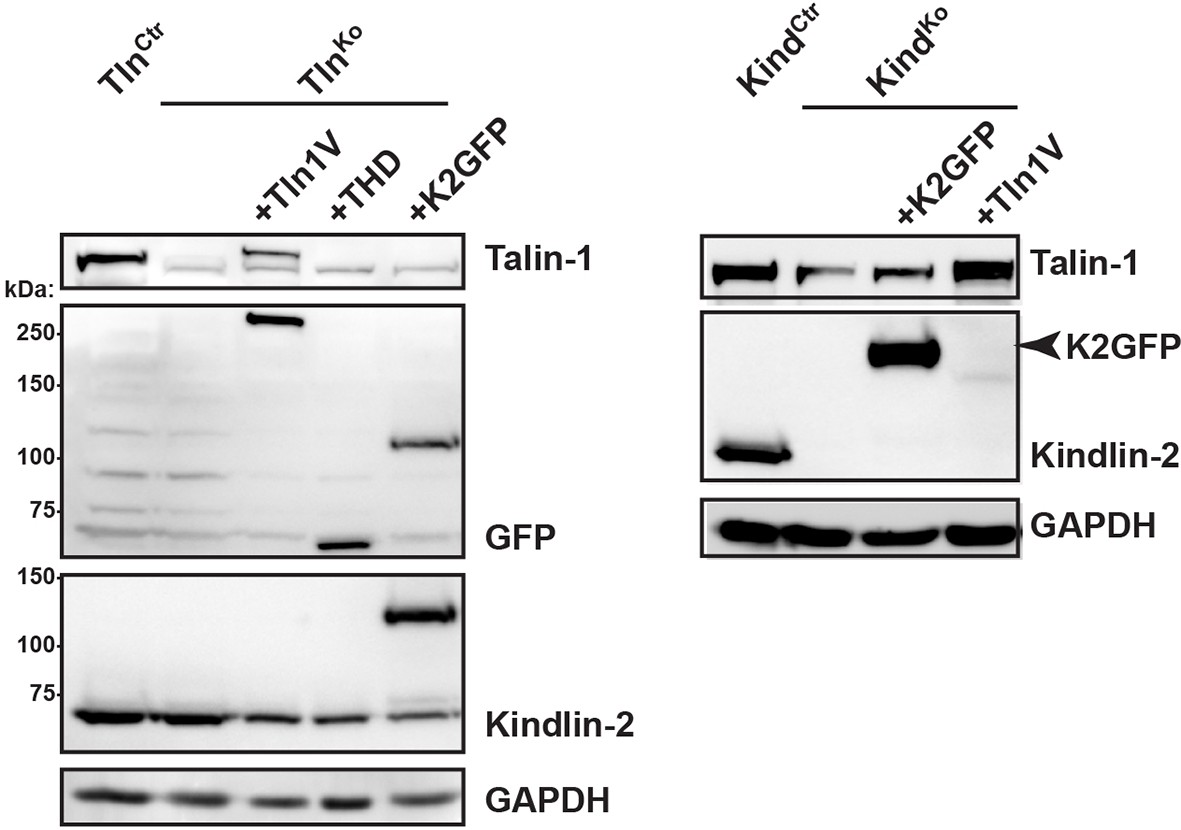
Re-expression of talin-1 or kindlin-2 in TlnKo and KindKo cells.
Western blot analysis of cell lysates from TlnKo and KindKo cells reconstituted with Tln1V, THD or K2GFP expression plasmids. GAPDH, glyceraldehyde-3-phosphate dehydrogenase; K2GFP, green fluorescent protein-tagged kindlin-2; THD, talin-1 head domain; Tln1V, Venus-tagged full length talin-1.
Figure 3 with 3 supplements
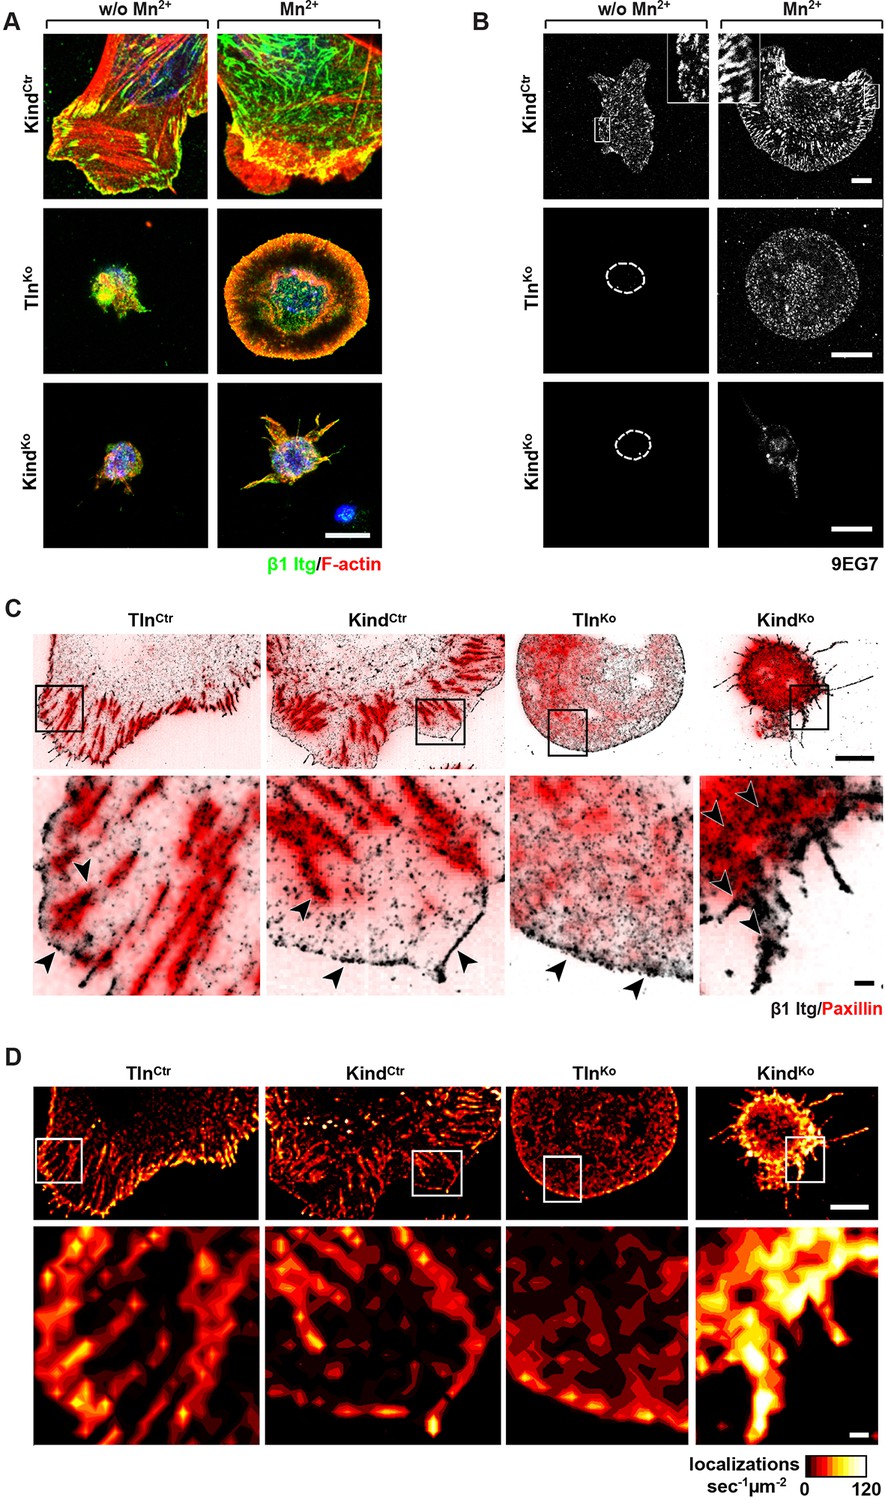
Integrin distribution in TlnKo and KindKo cells.
(A) Confocal images of the ventral side of adherent cells stained for β1 integrin and F-actin in the absence or presence of Mn2+ stimulation. Notice the increase in the spreading area (w/o Mn2+: 1696 ± 360 µm2, Mn2+: 2676 ± 466 µm2) and in the average size (w/o Mn2+: 0.64 ± 0.1 µm2, Mn2+: 0.89 ± 0.1 µm2) and number (w/o Mn2+: 105 ± 38, Mn2+: 246 ± 8) of focal adhesions in KindCtr cells after Mn2+ stimulation and the increase of spreading area in the TlnKo (w/o Mn2+: 77 ± 1 µm2, Mn2+: 572 ± 37 µm2) and KindKo cells (w/o Mn2+: 76 ± 27 µm2, Mn2+: 152 ± 8 µm2) (n=3, mean ± standard deviation). (B) Confocal images from the ventral side of adherent cells stained for the 9EG7 epitope in the absence or presence of Mn2+ stimulation. (C) TIRF-dSTORM images of β1 integrin (grey scale image) obtained from immunostaining of non-permeabilized cells overlaid with anti-paxillin staining following permeabilization (red, normal resolution). Boxed areas are displayed in a five-fold magnification. (D) Images show heat map representations of dSTORM localizations per µm2 and sec, indicative for integrin clustering defined by local integrin densities. The colour range indicates localizations s–1 µm–2 with low values shown in dark red colours and high densities from yellow to white colours. Bars, 10 µm (A,B); 5 µm (C,D); 500 nm (for the magnification in C,D). TIRF, total internal reflection fluourescence; dSTORM, direct stochastic optical reconstruction microscopy.
Figure 3—figure supplement 1
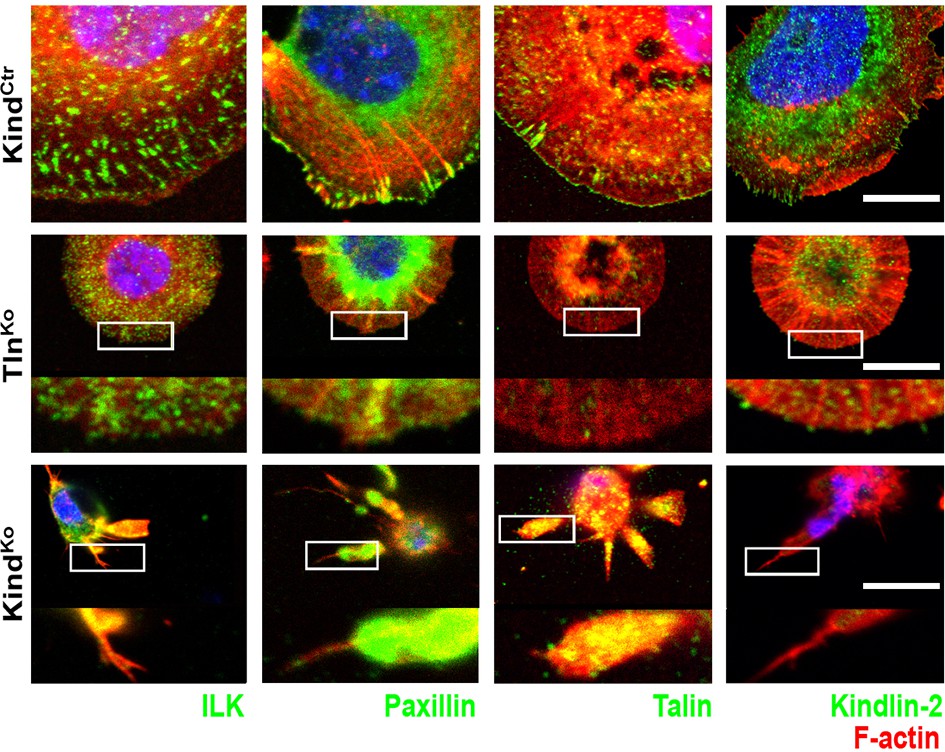
Localization of FAs proteins in Mn2+-treated KindCtr, TlnKo and KindKo cells.
Confocal images of the ventral plasma membrane of adherent, Mn2+-treated KindCtr, TlnKo and KindKo cells stained for ILK, paxillin, talin, and kindlin-2 (green), always together with phalloidin to visualize F-actin (red). For TlnKo and KindKo, three-fold magnifications of indicated areas are shown. For kindlin-2 staining, acetone-methanol fixation was used. Bar, 10 µm. FAs, focal adhesions; ILK, integrin-linked kinase.
Figure 3—figure supplement 2
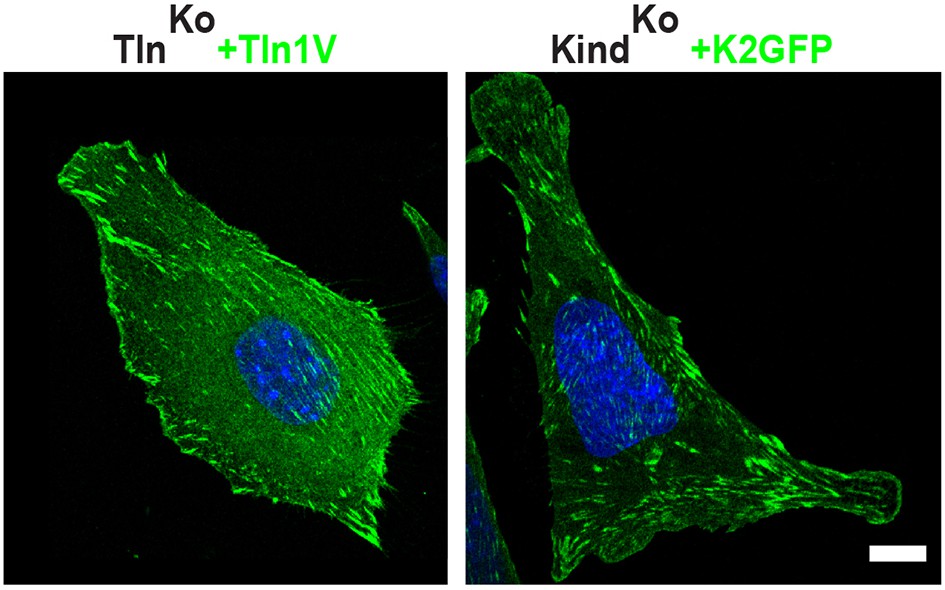
Rescue of FA formation and spreading after expression of Tln1V in TlnKo cells or K2GFP in KindKo cells.
Confocal images of KindKo and TlnKo cells reconstituted with K2GFP or Tln1V expression plasmids, respectively. Bar, 10 µm. FA, focal adhesion; K2GFP, green fluorescent protein-tagged kindlin-2; Tln1V, Venus-tagged full length talin-1.
Figure 3—figure supplement 3
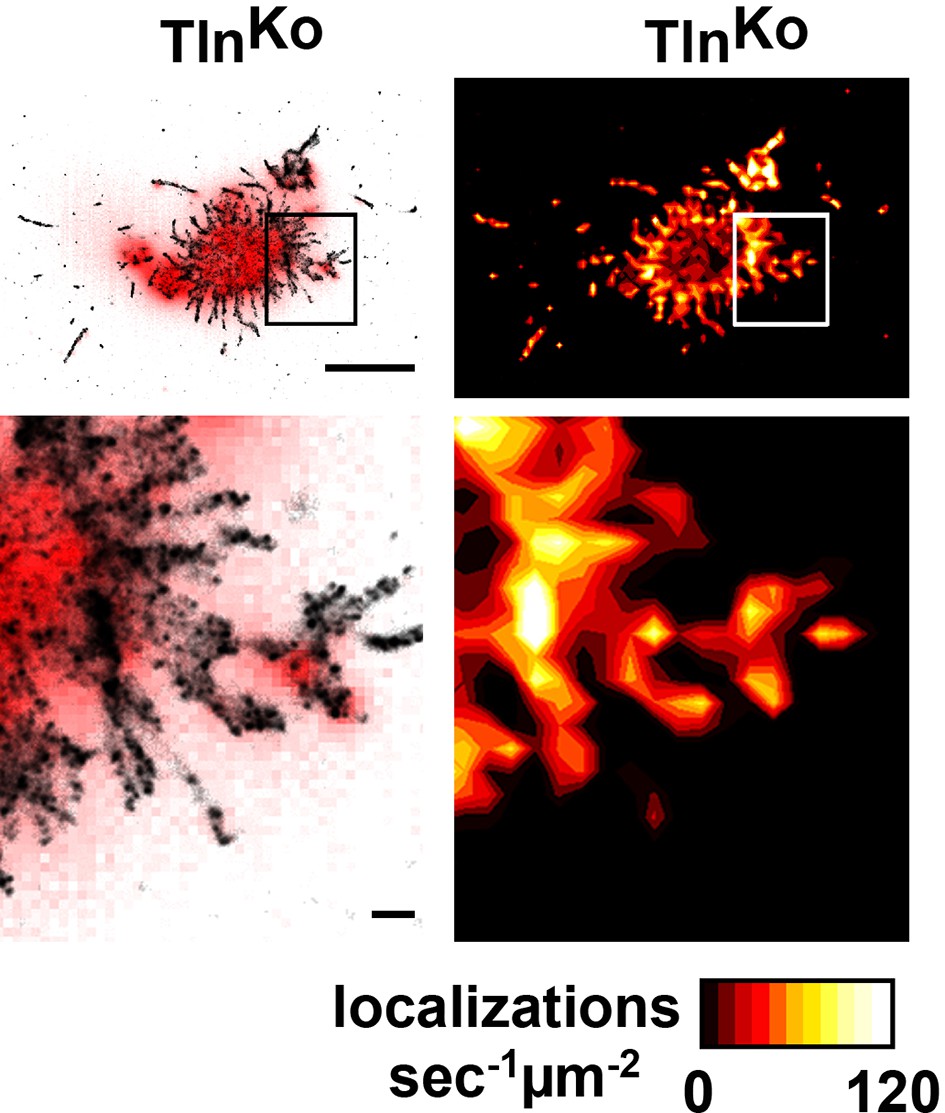
Distribution of β1 integrins in spheroid-shaped TlnKo cells.
dSTORM image and density map of β1 integrins in non-spread, spheroid-shaped TlnKo cells shows aggregation of integrin in the cell body and finger-like protrusions. Bars, 5 µm and 500 nm (for high magnification). dSTORM, direct stochastic optical reconstruction microscopy.
Figure 4 with 4 supplements
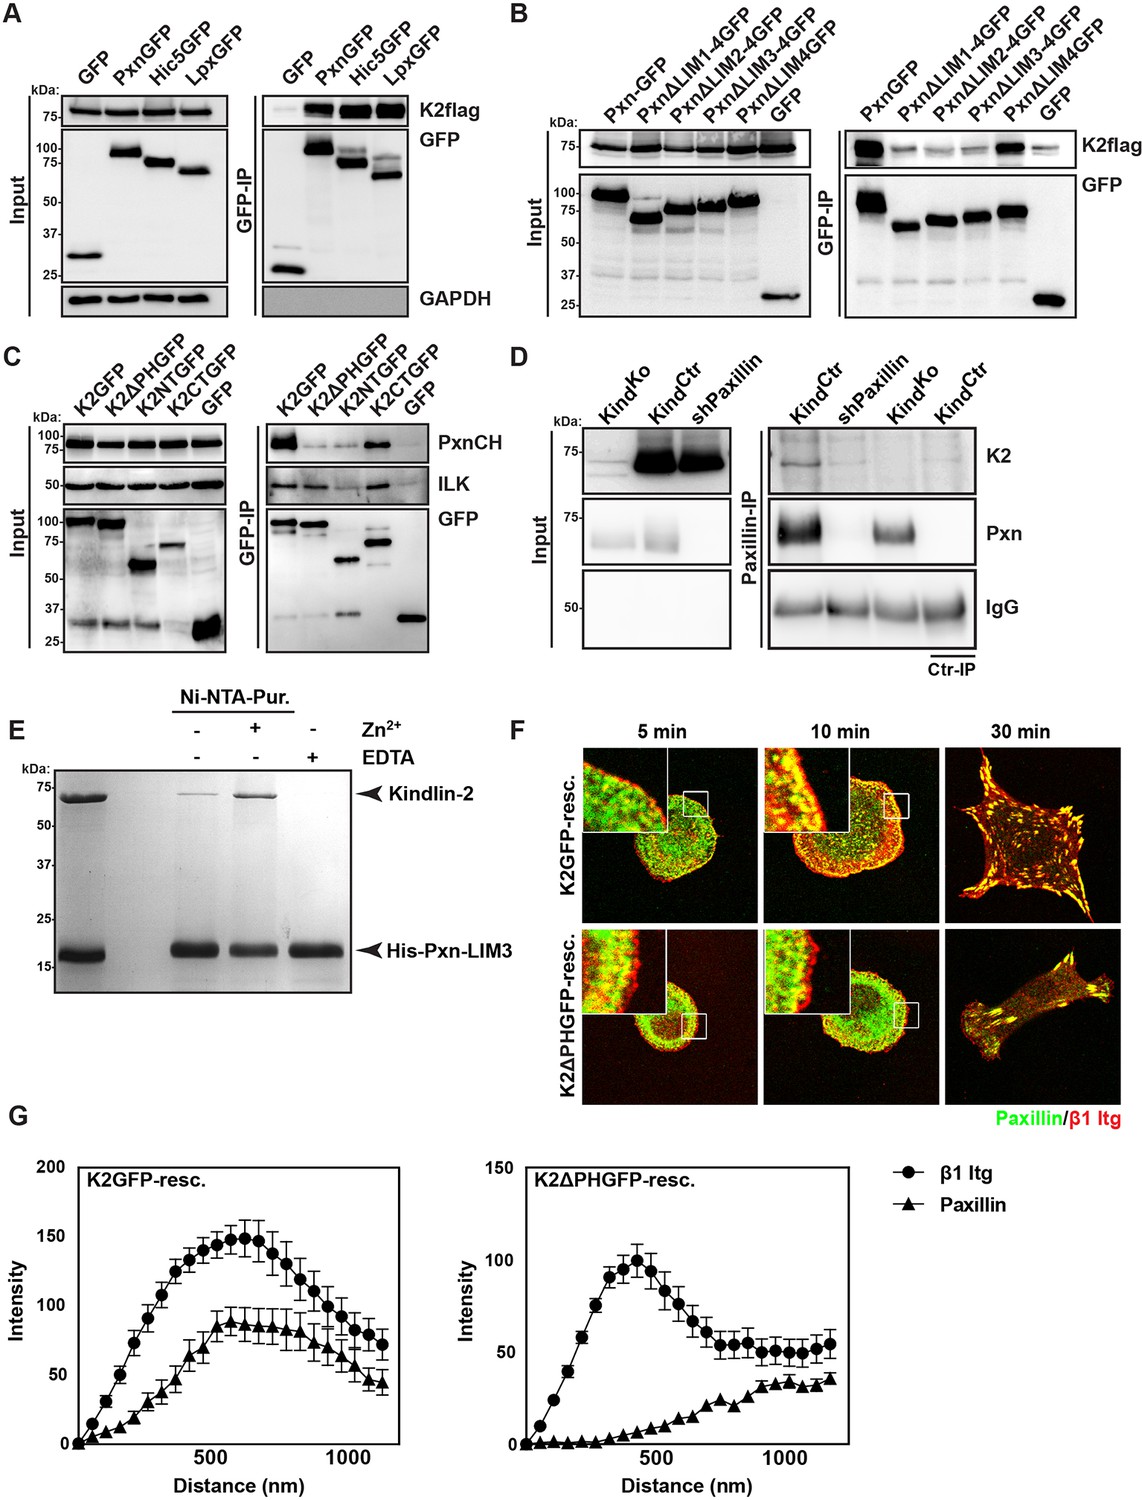
Kindlin binds and recruits paxillin to NAs.
(A) GFP-IP of lysates from HEK 293T cells overexpressing GFP-tagged paxillin, Hic5 and leupaxin constructs (Pxn, paxillin; Hic5; Lpx, leupaxin) and K2flag reveal interaction of kindlin-2 with all three paxillin family members. (B) GFP-IP of lysates from HEK 293T cells overexpressing GFP-tagged paxillin truncation mutants and K2flag identifies the paxillin LIM3 domain as kindlin-2-binding domain. (C) GFP-IP of lysates from HEK 293T cells overexpressing GFP-tagged kindlin-2 truncation/deletion mutants and Cherry-tagged paxillin (PxnCH) identifies the kindlin-2 PH domain as paxillin binding domain. (D) Co-IP of endogenous paxillin and kindlin-2 from KindCtr cells. (E) Purified His-tagged paxillin-LIM3 domain pulls down recombinant kindlin-2 in a Zn2+-dependent manner. (F) K2GFP and K2ΔPHGFP expressing KindKo cells seeded on FN for the indicated times and stained for paxillin and β1 integrin. (G) Fluorescence intensity line scans from K2GFP- (n=11 cells) and K2ΔPHGFP- (n=17 cells) expressing KindKo cells cultured on FN for 10 min and stained for paxillin and β1 integrin; error bars indicate standard error of the mean. Bar, 10 µm. EDTA, ethylenediaminetetraacetic acid; FN, fibronection; GAPDH, glyceraldehyde-3-phosphate dehydrogenase; GFP, green fluorescent protein; ILK, integrin-linked kinase; IP, immunoprecipitation; K2GFP, green fluorescent protein-tagged kindlin-2; LIM, Lin-11, Isl-1 and Mec-3; NAs, nascent adhesions; PH, pleckstrin homology.
Figure 4—figure supplement 1
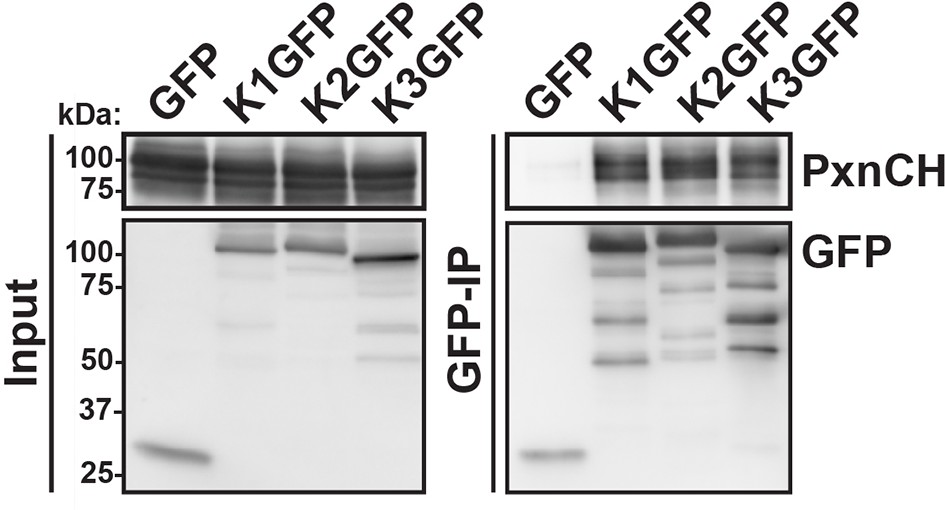
Kindlin-1, -2 and -3 interact with paxillin.
GFP-IP of lysates from HEK293T cells expressing GFP, K1GFP, K2GFP and K3GFP followed by western blotting for Cherry-tagged paxillin (PxnCH) and GFP. GFP, green fluorescent protein; IP, immunoprecipitation; K1GFP, green fluorescent protein-tagged kindlin-1; K2GFP, green fluorescent protein-tagged kindlin-2; K3GFP, green fluorescent protein-tagged kindlin-3.
Figure 4—figure supplement 2
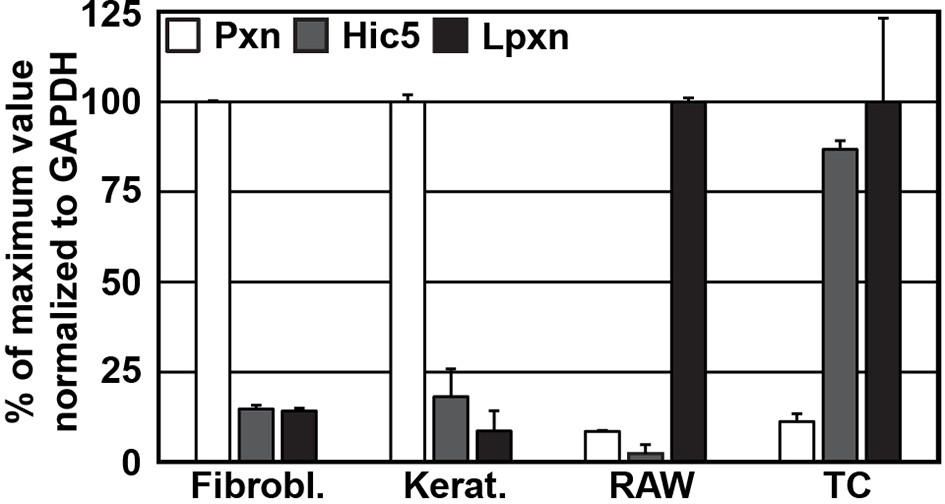
Expression of paxillin family members in different cell lines.
qPCR of paxillin (Pxn), Hic5, and leupaxin (Lpxn) from cDNAs generated from wild type fibroblasts (Fibrobl.), keratinocytes (Kerat.), RAW 264.7 macrophages (RAW) and T cells (TC). Results are normalized to the isoform with highest expression in the respective cell types (n=3 independent repeats; error bars show standard error of the mean). cDNA, complementary DNA; GAPDH, glyceraldehyde-3-phosphate dehydrogenase; qPCR, quantitative polychromase chain reaction.
Figure 4—figure supplement 3

Direct interaction between paxillin and kindlin-2.
(A) Domain organization of kindlin-2 (F0,1,3: FERM domains 0,1,3; F2a,F2b: N-terminal (F2a) and C-terminal (F2b) halves of FERM domain 2 connected by a PH domain and small linkers on each side of the PH domain), and paxillin (L1-4: LIM domains 1-4; grey stripes represent LD-rich motifs). The ILK interaction site in kindlin-2 (N-terminal linker region located before the PH domain) and the FA-targeting region of paxillin (LIM3 domain) are indicated in red; the black lines show the length of the truncation mutants. (B) Full-length paxillin pulls down recombinant kindlin-2 in a Zn2+-dependent manner. FERM, Four-point-one, ezrin, radixin, moesin; ILK, integrin-linked kinase; LD, leucine-aspartate repeat; LIM, Lin-11, Isl-1 and Mec-3; PH, pleckstrin homology.
Figure 4—figure supplement 4
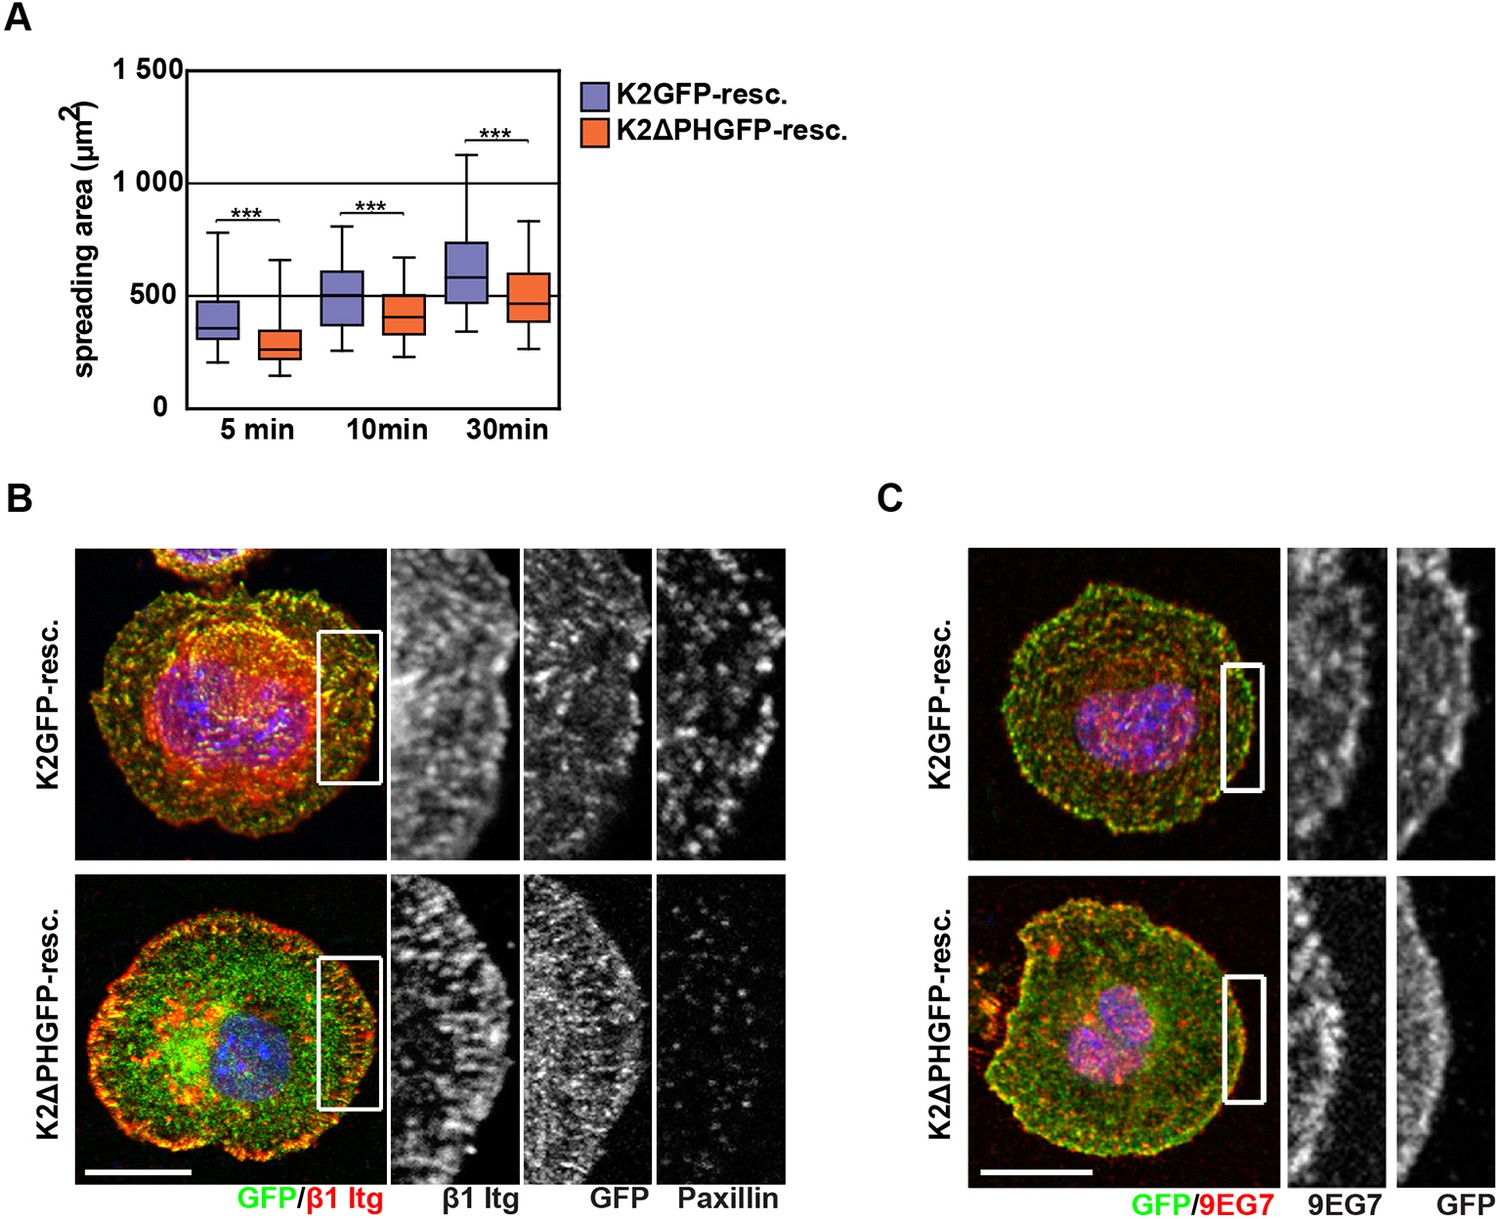
K2ΔPHGFP fails to recruit paxillin to β1 integrin-positive adhesions in KindKo cells.
(A) Boxplots show the distribution of spreading areas for K2GFP and K2ΔPHGFP seeded on FN for the indicated times (n> 65 cells per time point). Significances for indicated pairs were calculated by a Mann–Whitney U test. (B) Confocal images of K2GFP- and K2ΔPHGFP-expressing KindKo cells seeded on FN for 10 min and stained for total β1 integrin and paxillin. (C) Confocal images of K2GFP- and K2ΔPHGFP-expressing KindKo cells seeded on FN for 10 min and stained for 9EG7. Bars, 10 µm. GFP, green fluorescent protein; FN, fibronectin; K2GFP, green fluorescent protein-tagged kindlin-2.
Figure 5 with 4 supplements
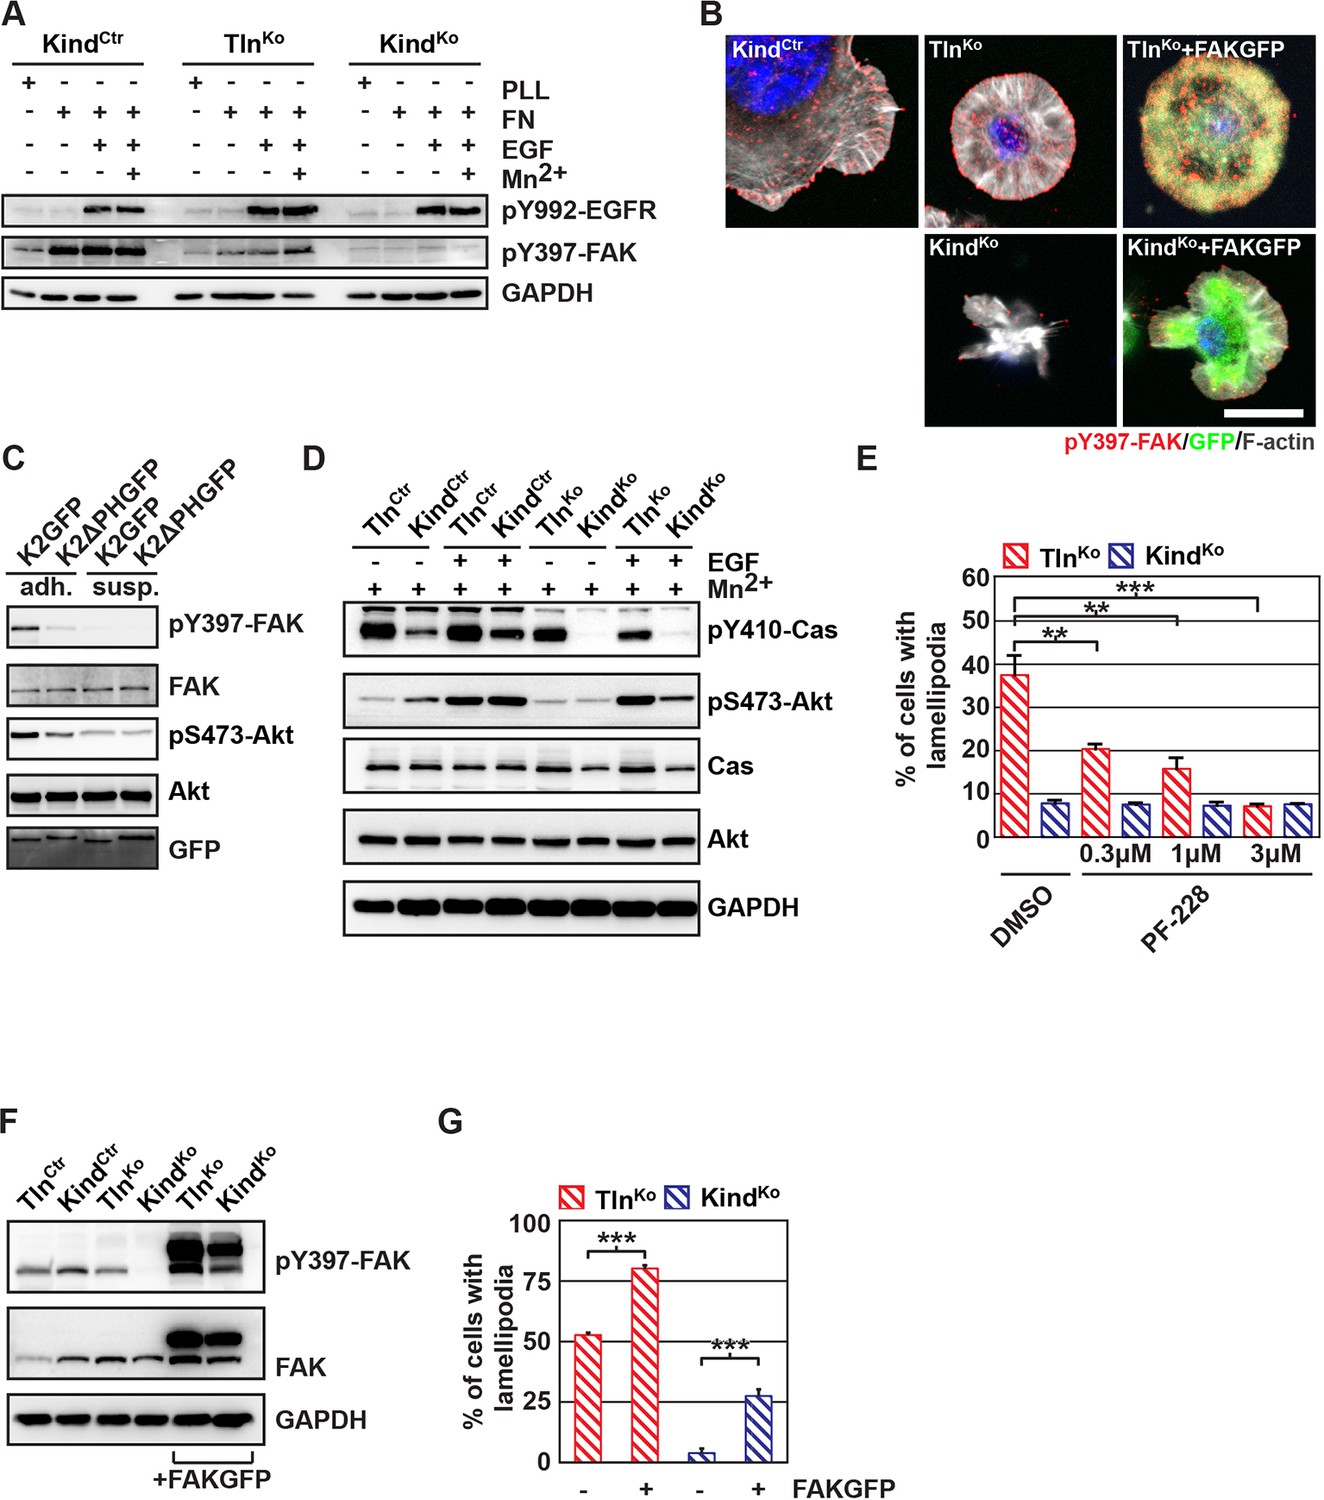
The kindlin/paxillin complex induces FAK signaling and cell spreading.
(A) FAK and EGFR activation after seeding serum-starved KindCtr, TlnKo and KindKo cells on PLL or FN and treating them with or without EGF and Mn2+. (B) Immunofluorescence staining of activated (Tyr-397 phosphorylated) FAK and F-actin in cells seeded on FN and treated with Mn2+ for 30 min (FAKGFP indicates exogenous expression of FAKGFP fusion protein). (C) FAK and Akt activation in KindKo cells stably transduced with K2GFP or K2ΔPHGFP either seeded on FN or kept in suspension. GFP indicates similar expression of transduced GFP-tagged constructs. GAPDH levels served to control loading. (D) Levels of phosphorylated signaling mediators downstream of FAK in Mn2+-treated, serum-starved or EGF-treated KindCtr, TlnKo and KindKo cells. GAPDH levels served to control loading. (E) Quantification of lamellipodia formation of FN-seeded TlnKo and KindKo cells treated with Mn2+ and either DMSO or the FAK inhibitor PF-228 (n=3 independent repeats; >100 cells/condition; error bars indicate standard error of the mean; significances are given in comparison to the DMSO control). (F) FAK activity in TlnKo and KindKo cells stably transduced with FAKGFP (n=3 independent experiments). (G) Quantification of lamellipodia formation in TlnKo and KindKo cells stably transduced with FAKGFP (n=3 independent experiments; significances are given in comparison to untreated control; error bars indicate standard error of the mean). Bar, 10 µm. DMSO, dimethyl sulfoxide; EGF, epidermal growth factor; EGFR, epidermal growth factor receptor; FAK, focal adhesion kinase; FAKGFP, green fluorescent protein-tagged FAK; FN, fibronectin; GAPDH, glyceraldehyde-3-phosphate dehydrogenase; GFP, green fluorescent protein; PLL, poly-L-lysine.
Figure 5—figure supplement 1
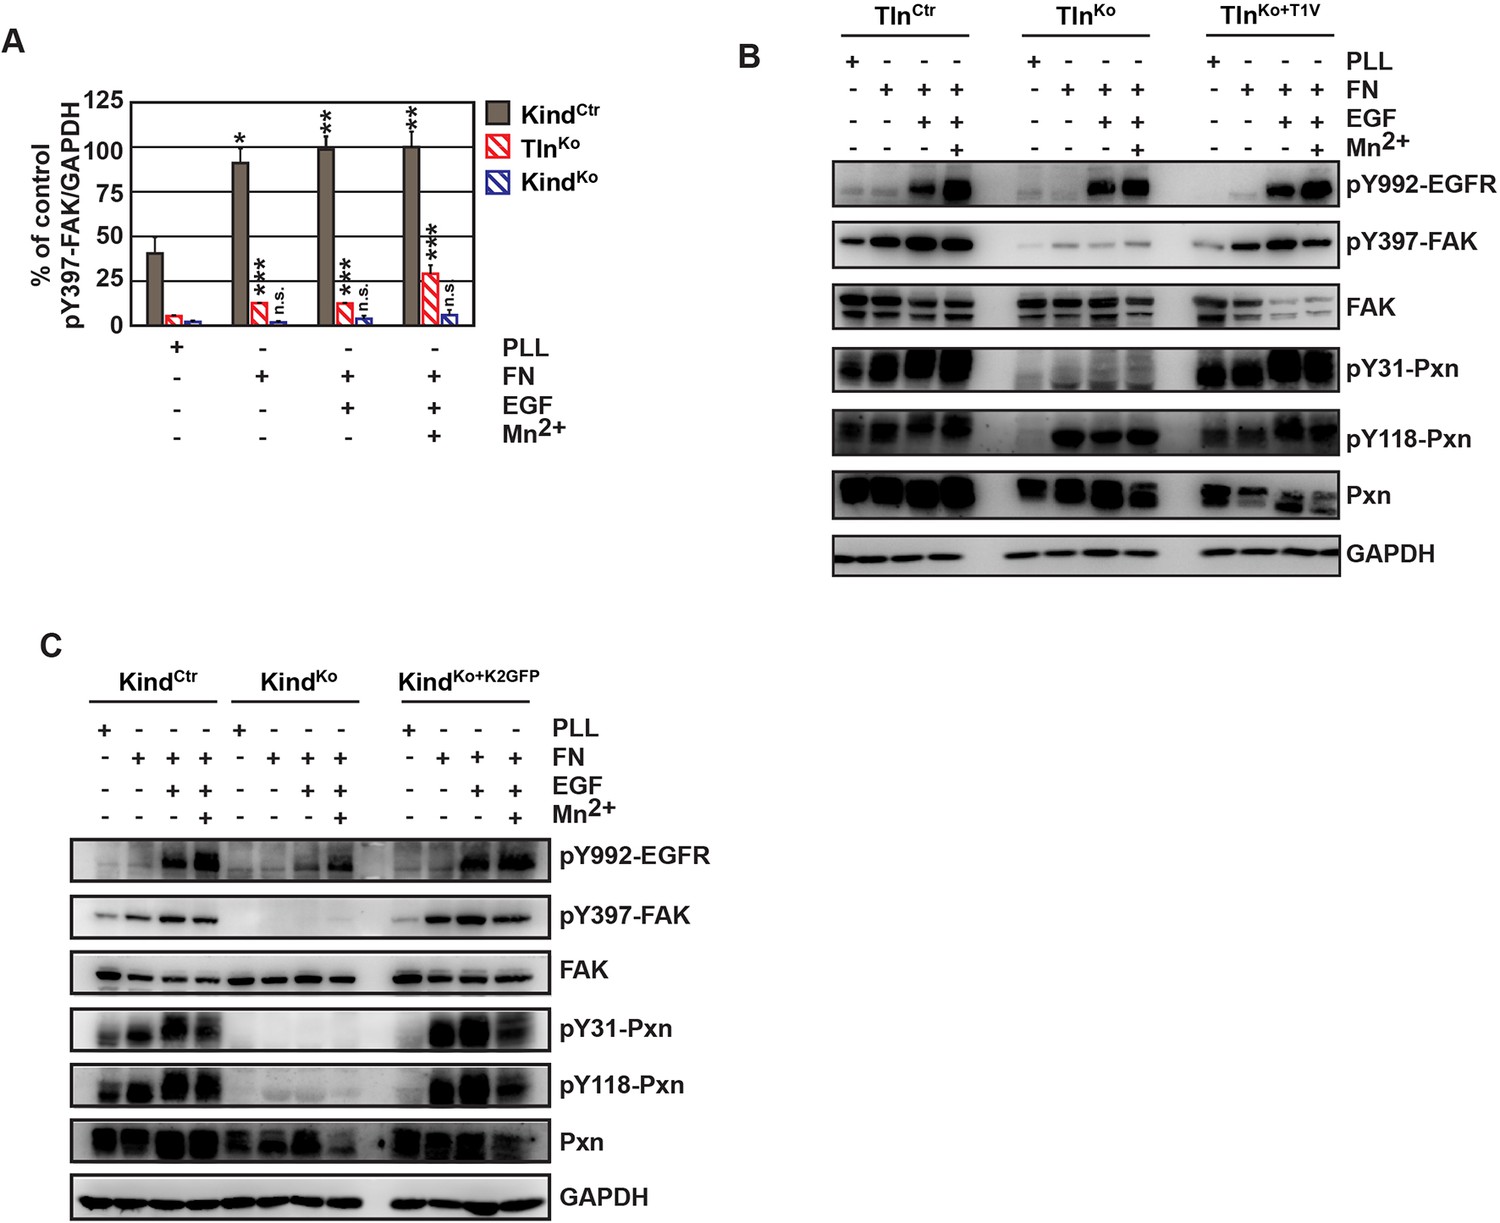
FAK phosphorylation in TlnCtr, TlnKo, TlnKo+T1V, KindCtr, KindKo and KindKo+K2GFP cells.
(A) Densitometric quantification of western blot signals of lysates from untreated, EGF- and Mn2+-treated KindCtr, TlnKo and KindKo cells seeded either on FN or PLL and probed with anti-Tyr-397 phosphorylated FAK (pY397-FAK) antibodies (n=3 independent repeats; significances are calculated with respect to PLL adherent cells; error bars indicate standard error of the mean). (B,C) Western blotting of indicated signaling proteins in untreated, EGF- and Mn2+-treated TlnCtr, TlnKo and TlnKo cells re-expressing Venus-tagged talin-1 (TlnKo+T1V) (B), and KindCtr, KindKo and KindKo cells re-expressing GFP-tagged kindlin-2 (KindKo+K2GFP) (C) seeded either on FN or PLL. EGF, epidermal growth factor; FAK, focal adhesion kinase; K2GFP, green fluorescent protein-tagged kindlin-2; FN, fibronectin; GFP, green fluorescent protein; PLL, poly-L-lysine; T1V, Venus-tagged full length talin-1.
Figure 5—figure supplement 2
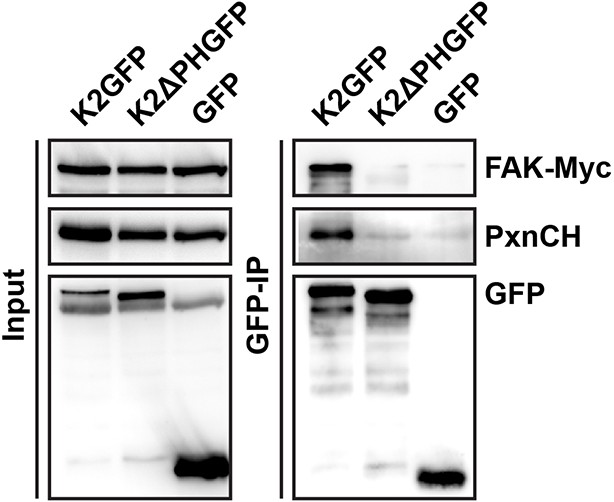
Kindlin-2 forms a ternary complex with paxillin and FAK.
GFP-IP in lysates of K2GFP-, K2ΔPHGFP- or GFP-reconstituted KindKo cells overexpressing Myc-tagged FAK (FAK-Myc) and Cherry-tagged paxillin (PxnCH). K2GFP but not K2ΔPHGFP forms a ternary complex with paxillin and FAK. FAK, focal adhesion kinase; GFP, green fluorescent protein; IP, immunoprecipitation; K2GFP, green fluorescent protein-tagged kindlin-2.
Figure 5—figure supplement 3
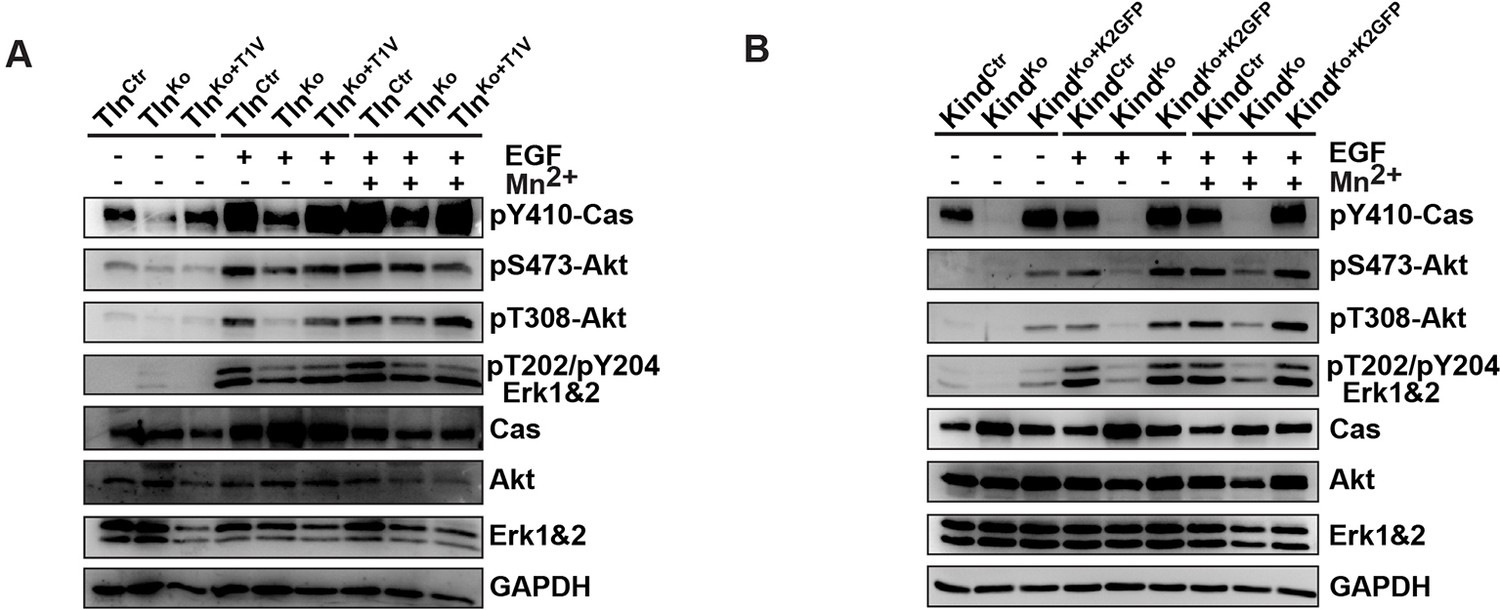
Activity of signaling mediators downstream of FAK in TlnCtr, TlnKo, TlnKo+T1V, KindCtr, KindKo and KindKo+K2GFP cells.
(A,B) Western blotting of indicated signaling proteins in untreated (first three lanes), EGF- and Mn2+-treated TlnCtr, TlnKo and TlnKo cells re-expressing Venus-tagged talin-1 (TlnKo+T1V) (A), and KindCtr, KindKo and KindKo cells re-expressing GFP-tagged kindlin-2 (KindKo+K2GFP) (B) seeded on FN. EGF, epidermal growth factor; FN, fibronectin; GAPDH, glyceraldehyde-3-phosphate dehydrogenase; GFP, green fluorescent protein; K2GFP, green fluorescent protein-tagged kindlin-2; T1V, Venus-tagged full length talin-1.
Figure 5—figure supplement 4
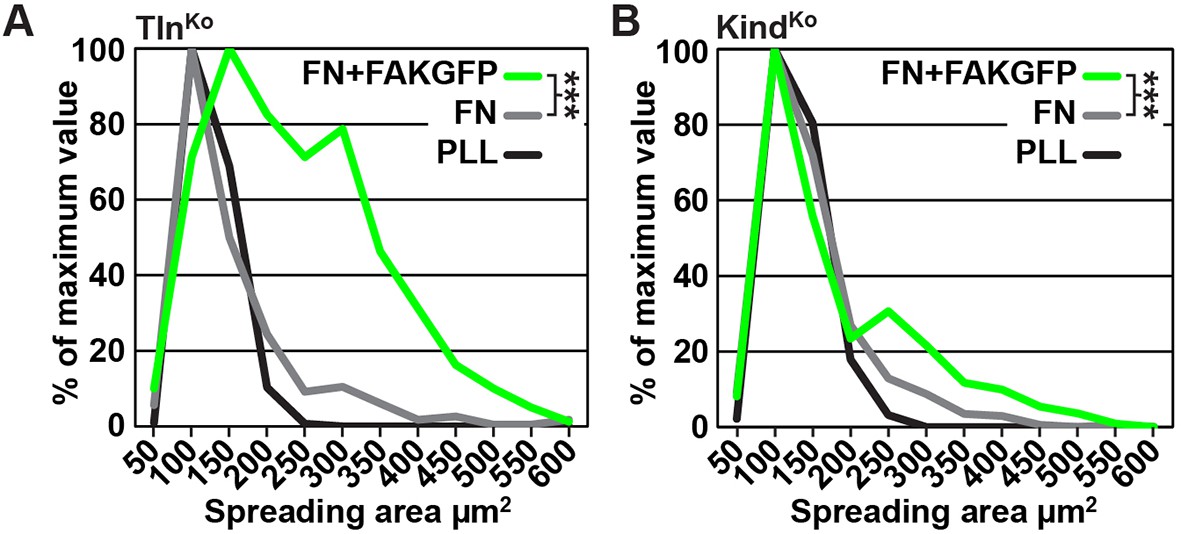
Cell spreading of FAK overexpressing TlnKo and KindKo cells.
(A,B) Cell spreading area of TlnKo (A) and KindKo cells (B) seeded on PLL, FN or on FN after FAKGFP overexpression measured by image quantification (n=3; independent repeats are pooled; >100 cells/condition and repeat; resulting areas are shown as binning histograms; significances are calculated between non-transfected cells and FAKGFP expressing cells plated on FN). FAK, focal adhesion kinase; FAKGFP, green fluorescent protein-tagged FAK; FN, fibronectin; GFP, green fluorescent protein; PLL, poly-L-lysine.
Figure 6
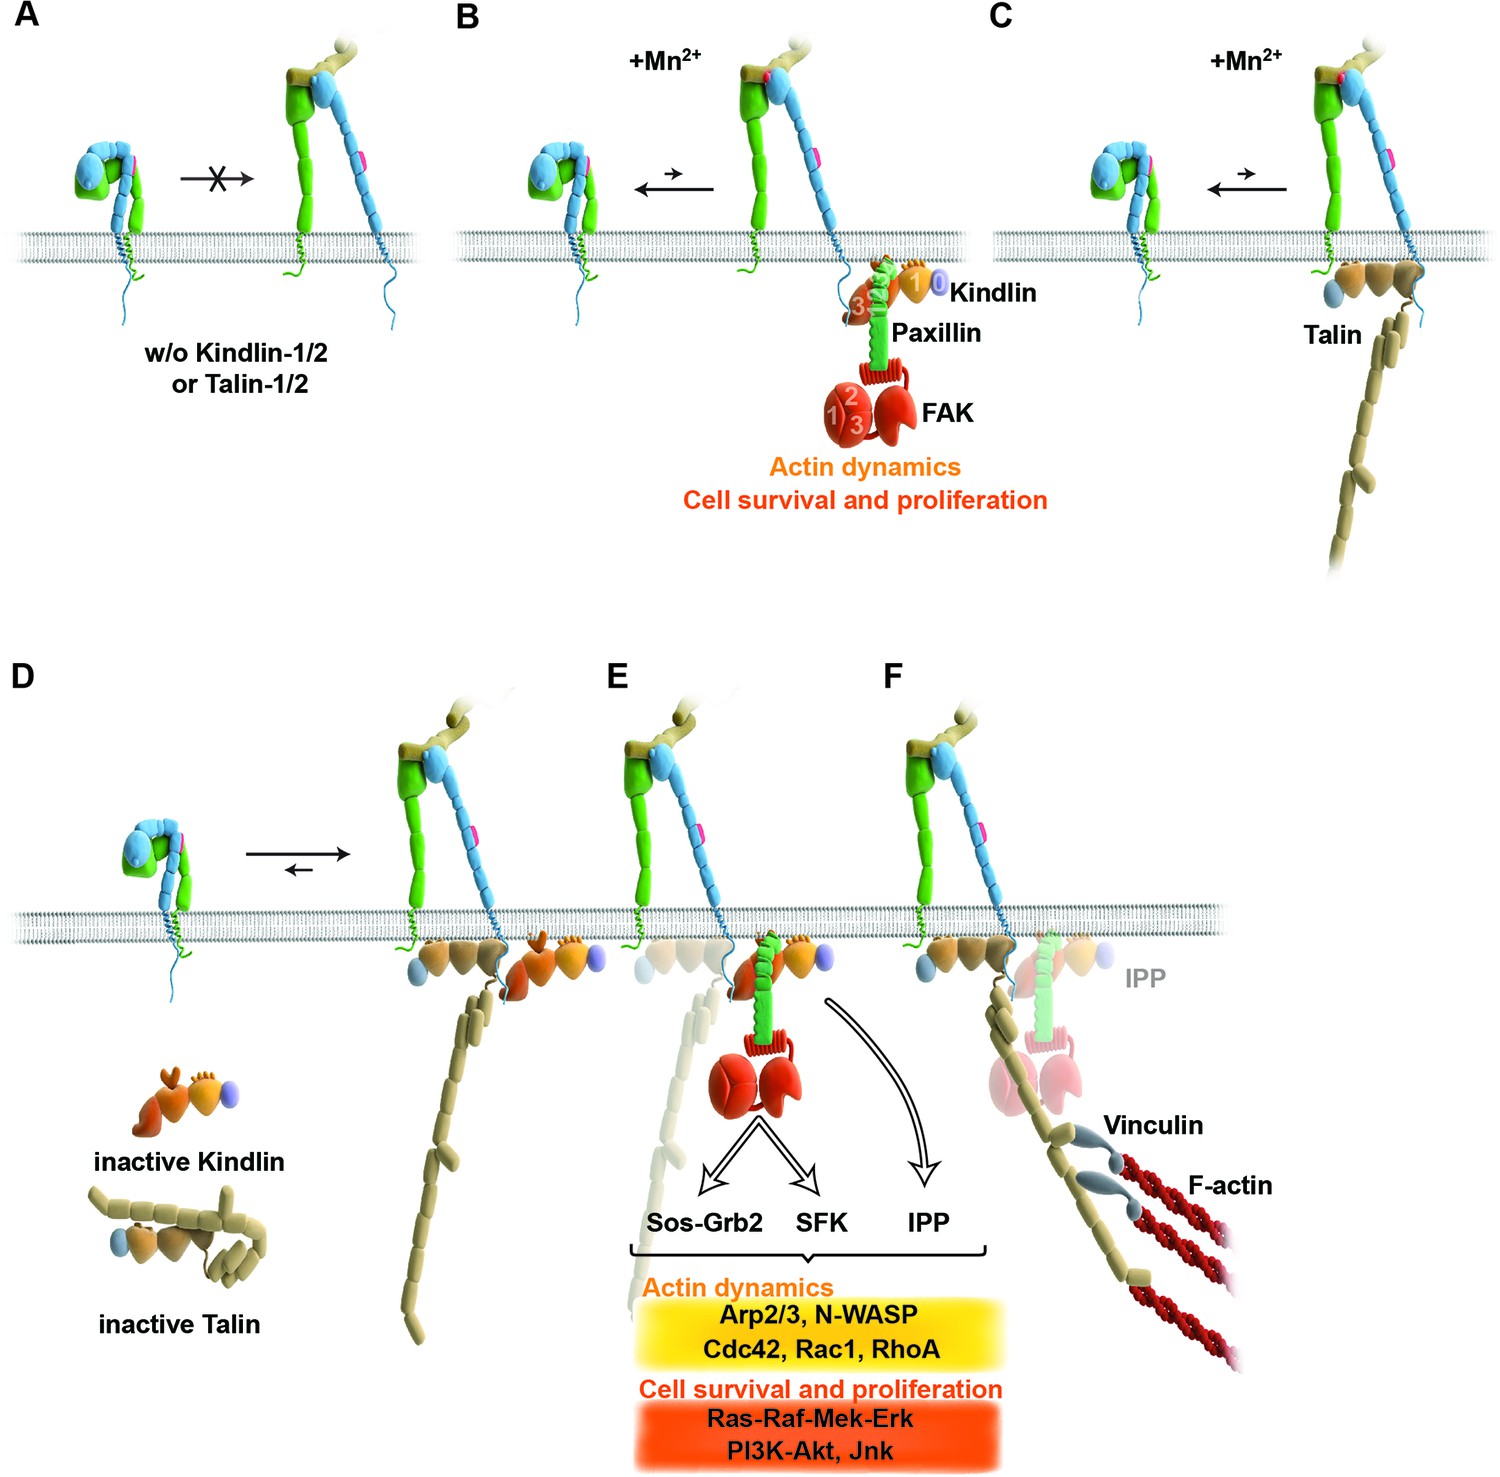
Model for the roles of talin and kindlin during inside-out and outside-in signaling of α5β1 integrin.
Integrin subunits are modelled according to Zhu et al. (2008), with the α5 subunit in green and the β1 subunit in blue showing the bent and clasped low affinity and the extended and unclasped high affinity conformations; the 9EG7 epitope is marked as red dot at the β1 leg and the FN ligand as beige dimers. (A) α5β1 integrin fails to shift from a bent to an extended/unclasped, high affinity state in the absence of talin-1/2 or kindlin-1/2; the bent/clasped conformation brings the EGF-2 domain of the β subunit in close contact with the calf domain of the α5 subunit and prevents exposure of the 9EG7 epitope. (B) In the absence of talin (TlnKo) and presence of Mn2+, kindlin-2 allows adhesion by stabilizing the high affinity conformation of a low number of integrins and the direct binding of paxillin, leading to nucleation of integrins, recruitment of FAK, FAK-dependent signaling and lamellipodia formation. (C) In the absence of kindlins (KindKo), talin stabilizes the high affinity conformation of a low number of integrins but does not enable paxillin recruitment and lamellipodia formation. (D) In normal fibroblasts, binding of kindlin and talin to the β1 tail is associated with the stabilisation of the unclasped α5β1 heterodimer and 9EG7 epitope exposure. (E) Kindlin recruits paxillin and FAK through the kindlin-PH domain and ILK/Pinch/Parvin (IPP; not shown) in a talin-independent manner and induces cell spreading, proliferation and survival. (F) The high affinity conformation of α5β1 integrin is stabilized by linkage of the β1 tail to the actin cytoskeleton through talin (and potentially the IPP complex; not shown). The arrow length indicates integrin conformations existing at equilibrium. EGF, epidermal growth factor; FAK, focal adhesion kinase; FN, fibronectin; ILK, integrin-linked kinase; IPP, integrin-linked kinase-Pinch-Parvin; SFK, src family kinases.
Author response image 1
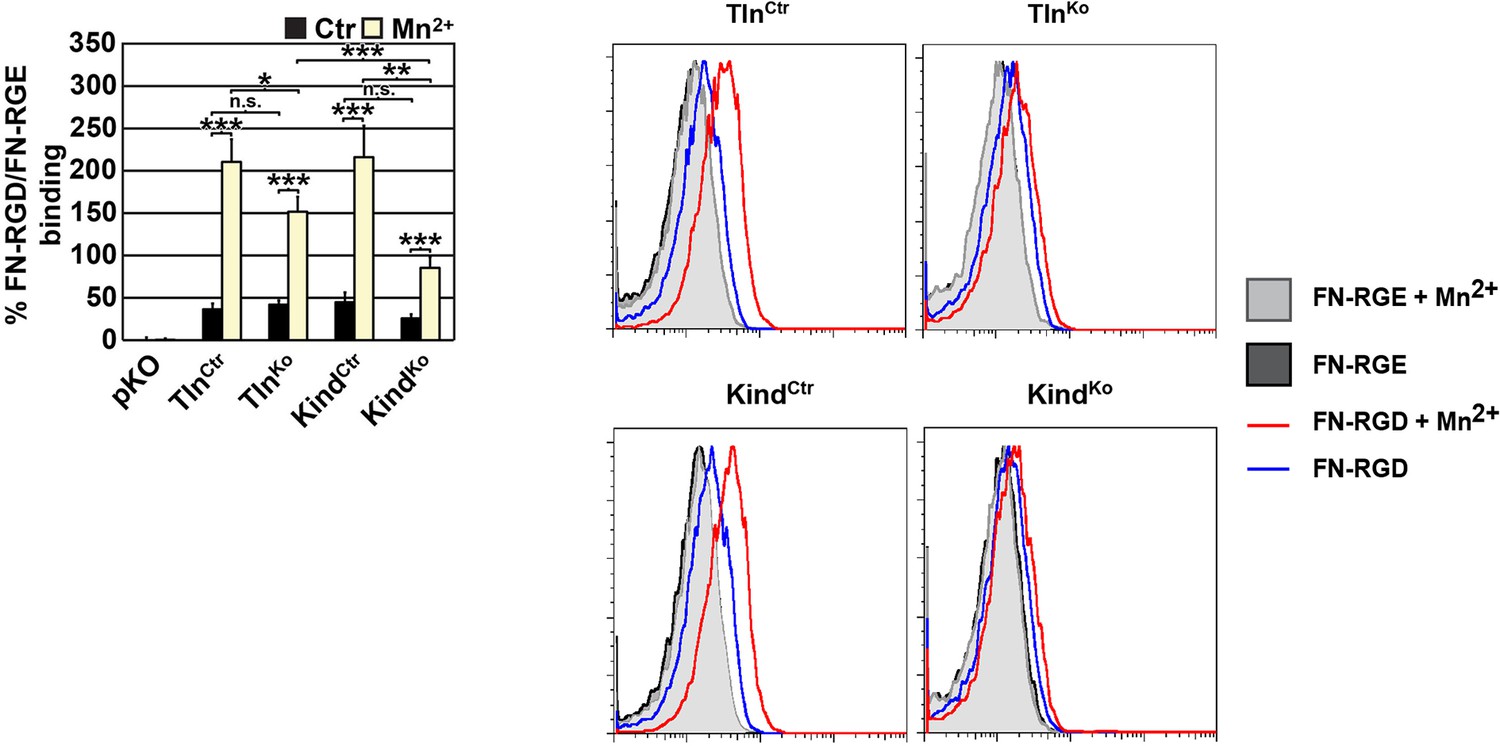
FN binding by TlnKo and KindKo cells.
Left: Quantification of binding of soluble, fluorescently labelled FN-RGD relative to the FN-RGE peptides; the FN-RGD/FN-RGE ratio of pKO cells under control conditions was set to 1 and subtracted from all other results. Binding was measured in the presence of 1 mM MgCl2 (Ctr) or 5 mM MnCl2 (Mn2+) (independent experiments: n=10 for Kind and Tln cell lines, n=3 for pKO; error bars indicate SEM; significances from ratio paired two tailed t-test are given for pairs connected with brackets). Right: Individual FACS histograms of the indicated cell lines used for quantification of fluorescently labelled FN-RGD binding.
Author response image 2
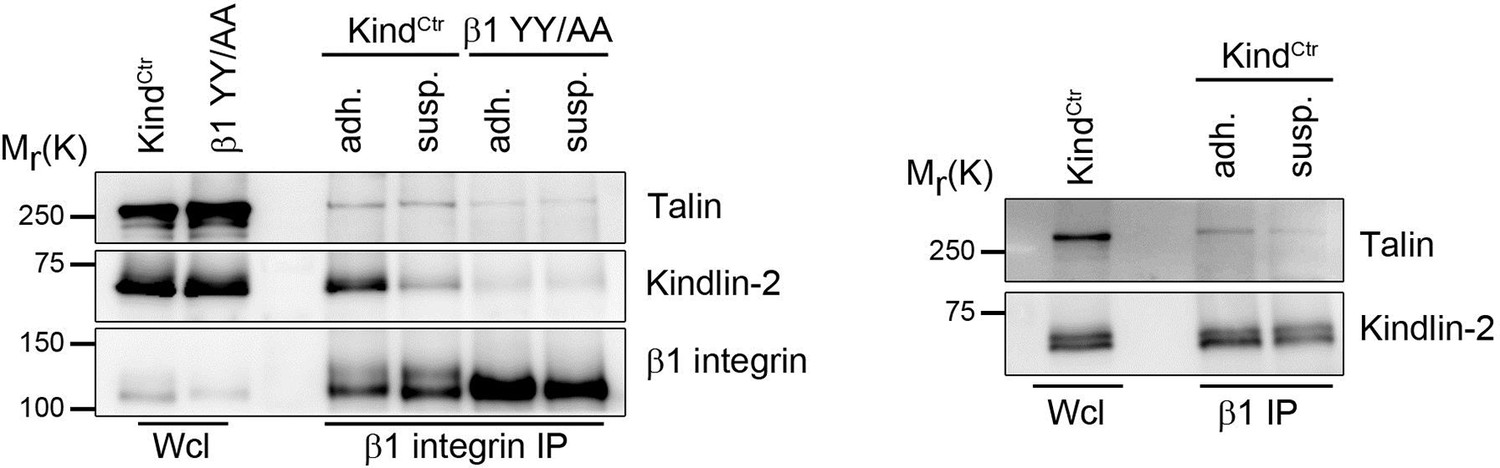
Talin and kindlin binding to the β1 integrin cytoplasmic domain.
KindCtr or cells expressing a talin and kindlin-binding deficient β1 integrin (β1 YY/AA) were either kept in suspension (susp.) for 3h or seeded on FN-coated dishes (adh.) before incubation for 15 min with 0.5 mM DSP crosslinker at RT. β1 integrin complexes were immunoprecipitated and analyzed by western blotting for presence of talin and kindlin-2.
Author response image 3
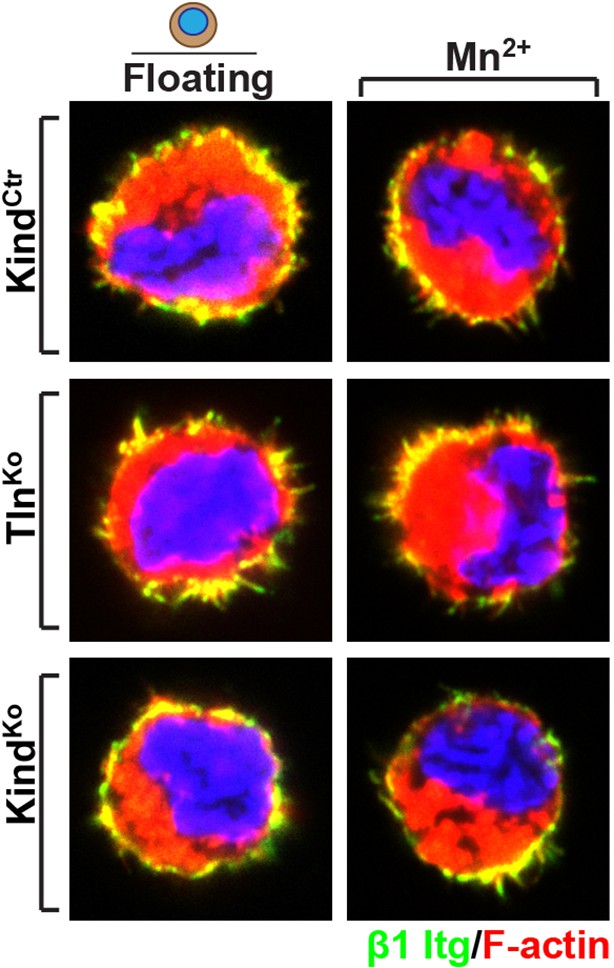
Distribution of β1 integrin in the suspended cells.
Immunofluorescence staining for β1 integrin in the presence and absences of Mn2+ of suspended TlnCtr and KindCtr cells. Cells were co-stained with phalloidin to visualize F-actin.
Videos
Video 1
Spreading KindCtr, TlnKo and KindKo cells on FN.
Assembled time lapse movies of KindCtr, TlnKo and KindKo cells. Cell spreading was recorded 5 min after seeding on FN. KindCtr cells were already well spread and only a minor size increase was observed over the following minutes. The TlnKo cells formed a circumferential lamellipodium that rapidly collapsed and subsequently the cells formed finger-like protrusions of varying size and failed to reestablish a fully formed circular lamellipodium. The KindKo cells failed to form a lamellipodium and formed finger-like protrusions that were not always adherent. Bar, 10 µm. FN, fibronectin.
Download links
A two-part list of links to download the article, or parts of the article, in various formats.
Downloads (link to download the article as PDF)
Open citations (links to open the citations from this article in various online reference manager services)
Cite this article (links to download the citations from this article in formats compatible with various reference manager tools)
Kindlin-2 cooperates with talin to activate integrins and induces cell spreading by directly binding paxillin
eLife 5:e10130.
https://doi.org/10.7554/eLife.10130


