A pH-driven transition of the cytoplasm from a fluid- to a solid-like state promotes entry into dormancy
- Max Planck Institute of Molecular Cell Biology and Genetics, Germany
- Max Planck Institute for the Physics of Complex Systems, Germany
- Technische Universität Dresden, Germany
Figures
Figure 1 with 3 supplements
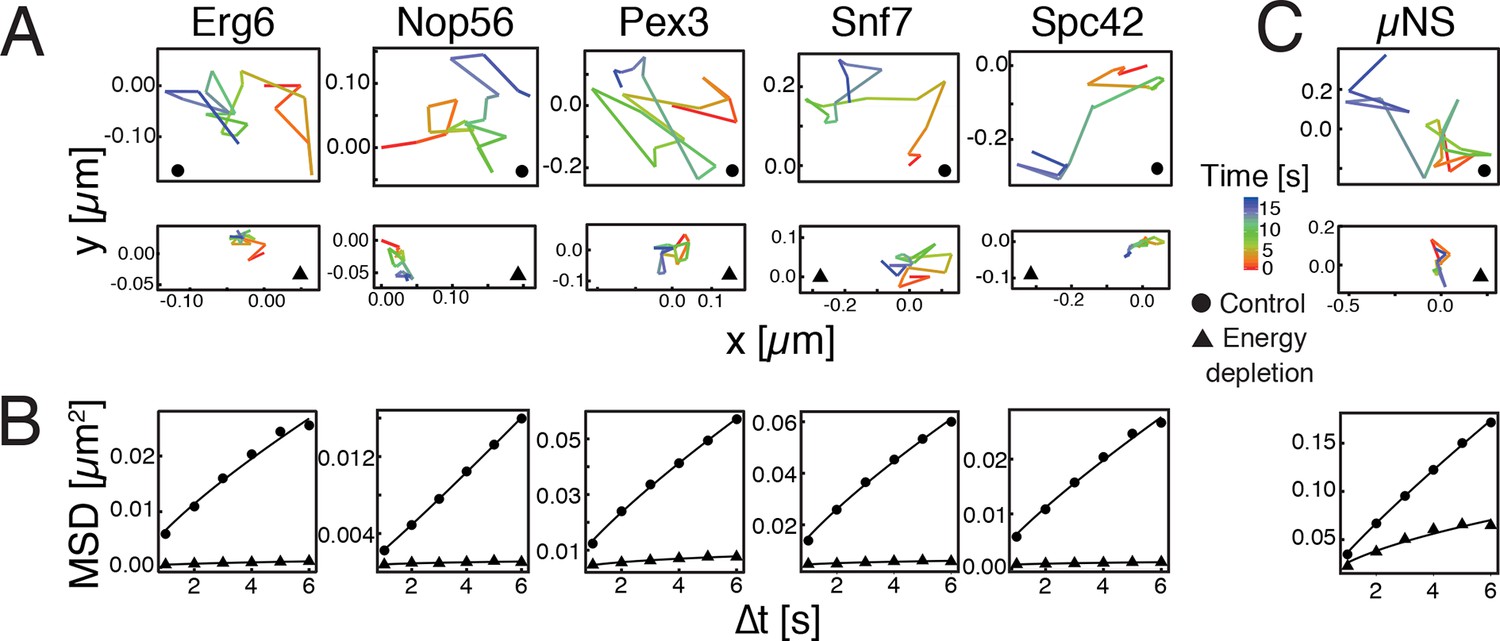
Reduced mobility of organelles and foreign tracer particles under energy depletion conditions.
(A) Representative trajectories of a range of different organelle markers tracked under control conditions (●, cells in log-phase, upper panel) and upon energy depletion (▲, lower panel). Organelle markers are GFP fusion proteins expressed under control of their endogenous promoters (Huh et al., 2003). (B) Corresponding time- and ensemble-averaged MSD plots for both control (●) and energy depletion (▲) conditions. (C) Representative trajectories (upper panel) and corresponding MSD plots (lower panel) of the foreign tracer particle GFP-µNS (see Figure 1—figure supplement 1–3 for details).
Figure 1—figure supplement 1

GFP-µNS particles form discrete particles in the yeast cytoplasm (left).
These particles explore the cytoplasm over time (middle and right).
Figure 1—figure supplement 2
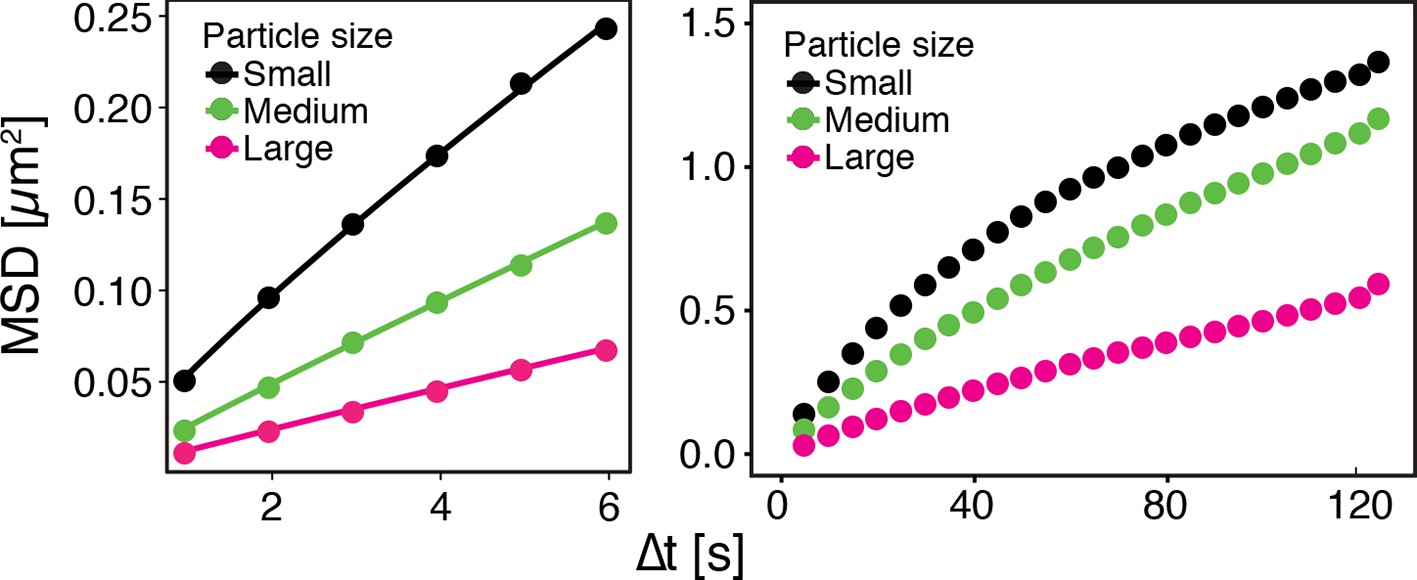
GFP-µNS particles show size-dependent MSD over short (left) and long (right) observation times.
The fluorescence intensity of particles was used as a proxy for particle size.
Figure 1—figure supplement 3
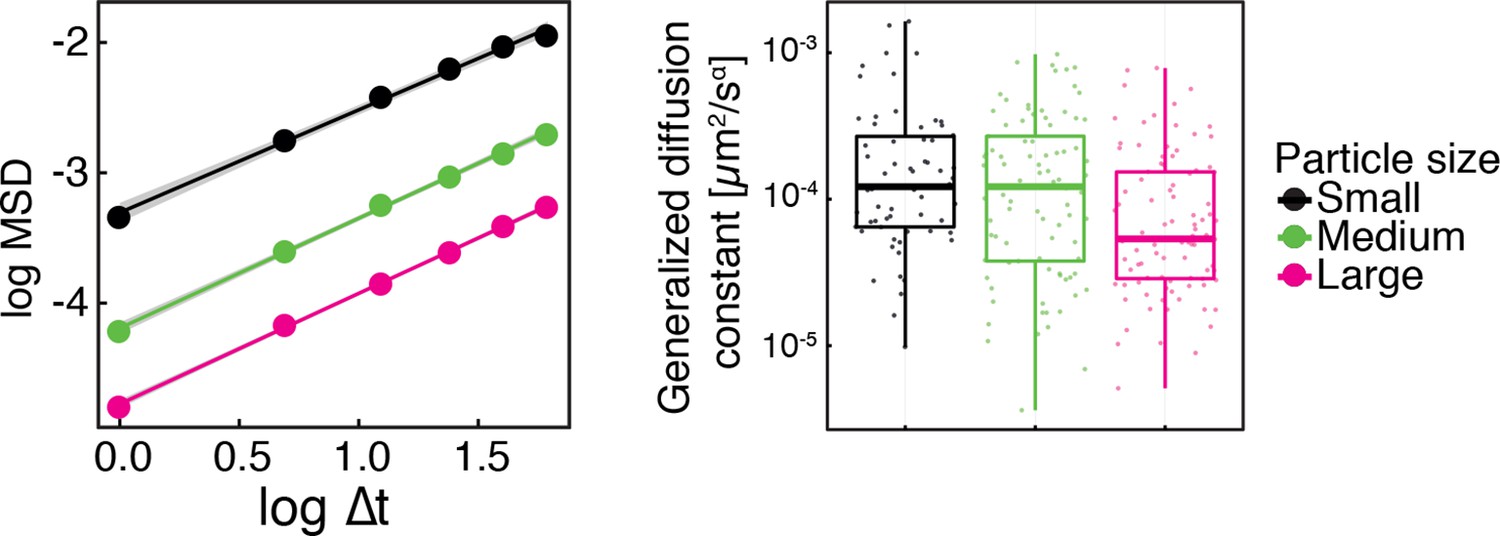
Same data as in Figure 1—figure supplement 2, shown as log-log plots (left).
The generalized diffusion constant (right) was obtained from the time-averaged MSD of individual trajectories at the lag time of =2 s divided by , where =0.88 is the power-law exponent of the time and ensemble averaged MSD for all particles. The fluorescence intensity of particles (AU) was used as a proxy for particle size.
Figure 2 with 1 supplement
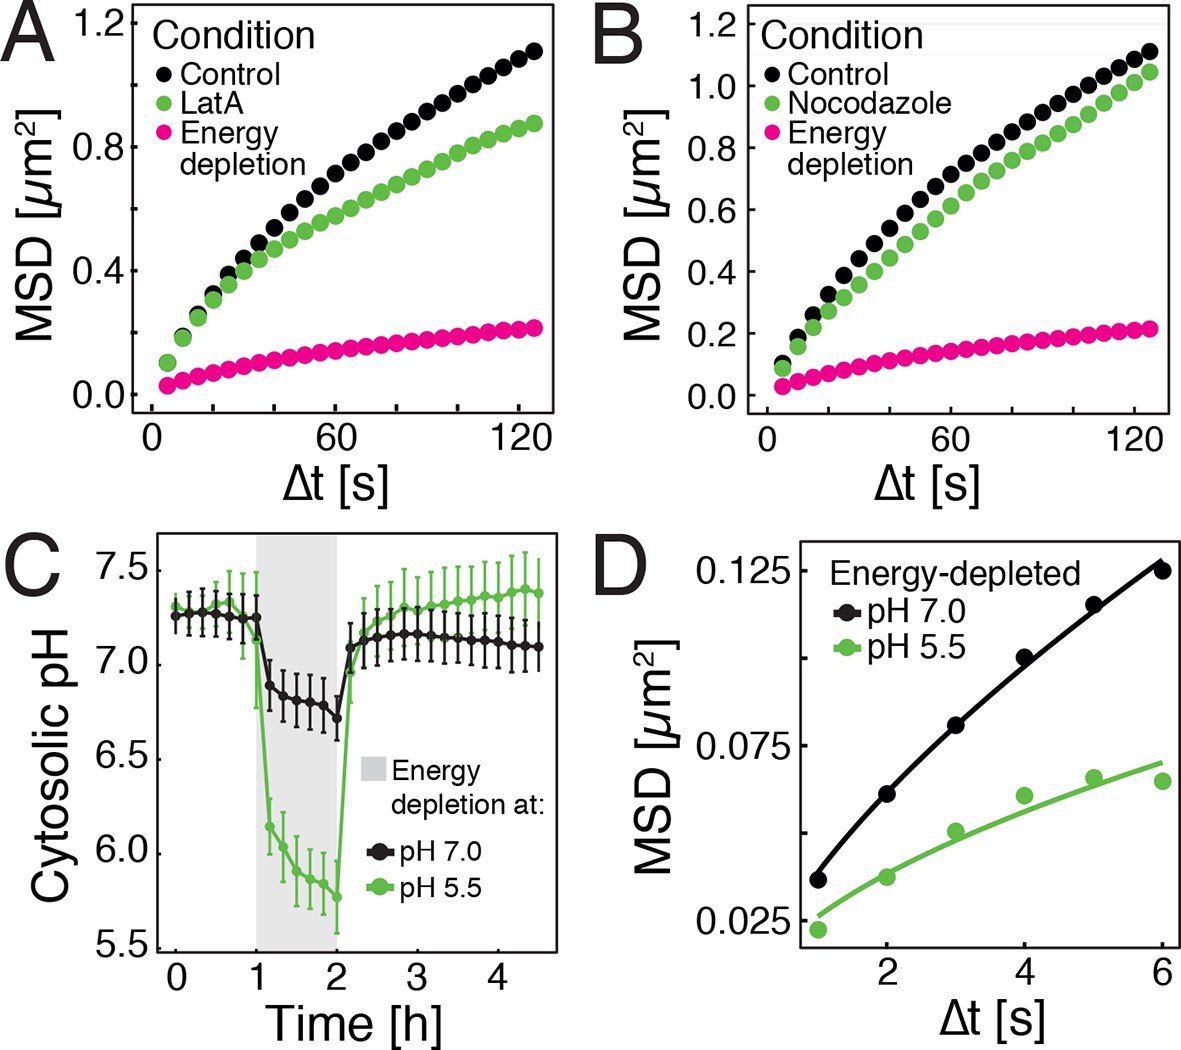
Energy depletion causes a drop in cytosolic pH, which may explain reduced particle mobility.
(A) MSD of GFP-µNS particles in untreated cells (control), cells treated with 100 μM latrunculin A (LatA) and energy-depleted cells. (B) MSD of GFP-µNS particles in untreated cells (control), cells treated with 15 μg/ml nocodazol and energy-depleted cells (C) The cytosolic pH of yeast cells was measured in response to energy depletion in growth media with two different pHs. (D) MSD of GFP-μNS particles tracked under the conditions shown in C. Cells were energy-depleted in growth medium without glucose containing 20 mM 2-deoxyglucose and 10 µM antimycin A. In panel A and B particles were tracked over a longer time and with lower time resolution (5 s) than in panel D. All MSD plots represent time- and-ensemble averaged MSDs and particles of all sizes were considered.
Figure 2—figure supplement 1
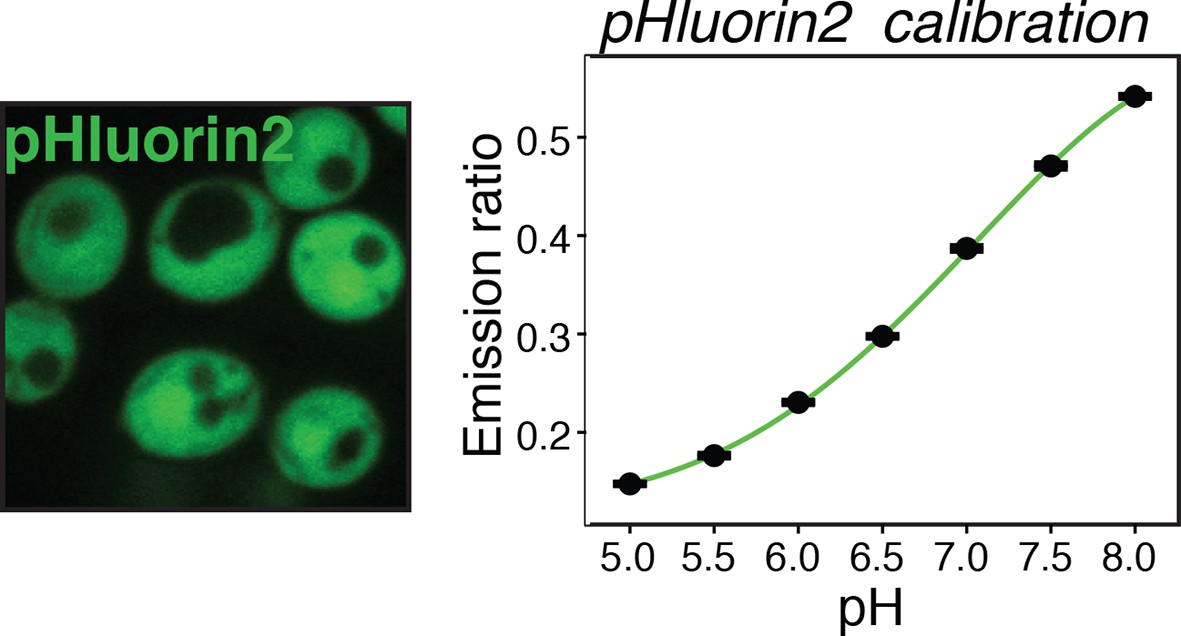
Yeast cells expressing the pH sensor pHluorin2 in the cytoplasm (left panel) were used to generate a pH calibration curve (right panel), as described in materials and methods and reported previously (Brett et al., 2005).
https://doi.org/10.7554/eLife.09347.009
Figure 3
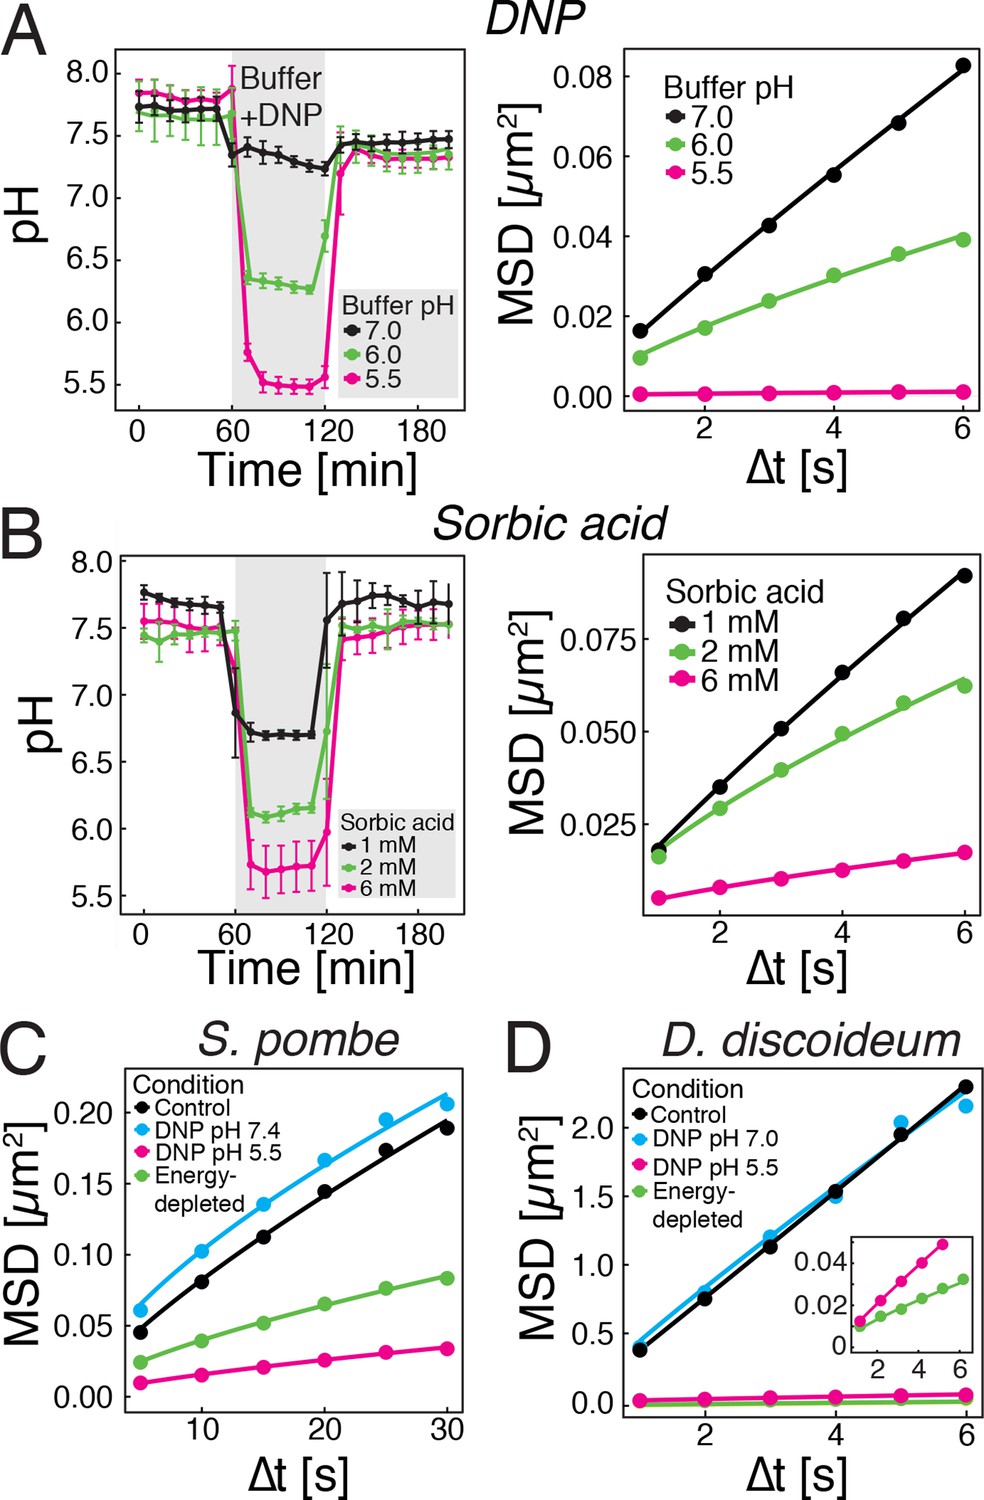
Acidification of the cytosol reduces particle mobility.
(A) The cytosolic pH of yeast cells exposed to phosphate buffers of different pH containing 2 mM 2,4-dinitrophenol (DNP) and 2% glucose was measured over time in a microfluidic flow chamber (left). The MSD of GFP-µNS particles tracked under the same conditions is shown on the right. (B) The cytosolic pH of yeast cells exposed to synthetic complete medium (pH ~5.5) containing increasing concentrations of sorbic acid was measured in a microfluidic flow chamber (left). The MSD of GFP-µNS particles tracked under the same conditions is shown on the right. (C) MSD of GFP-µNS particles in S. pombe cells. Particles were tracked in untreated cells (control), energy-depleted cells and cells treated with phosphate buffers of different pH containing 2 mM DNP. (D) MSD of GFP-µNS particles in D. discoideum cells. Particles were tracked in untreated cells (control), energy-depleted cells and cells treated with Lo-Flo buffer of different pH containing 0.2 mM DNP. Cells were energy-depleted in growth media or buffer, respectively, without glucose containing 2-deoxyglucose and antimycin A. All MSD plots represent time-and-ensemble averaged MSDs and particles of all sizes were considered.
Figure 4 with 6 supplements
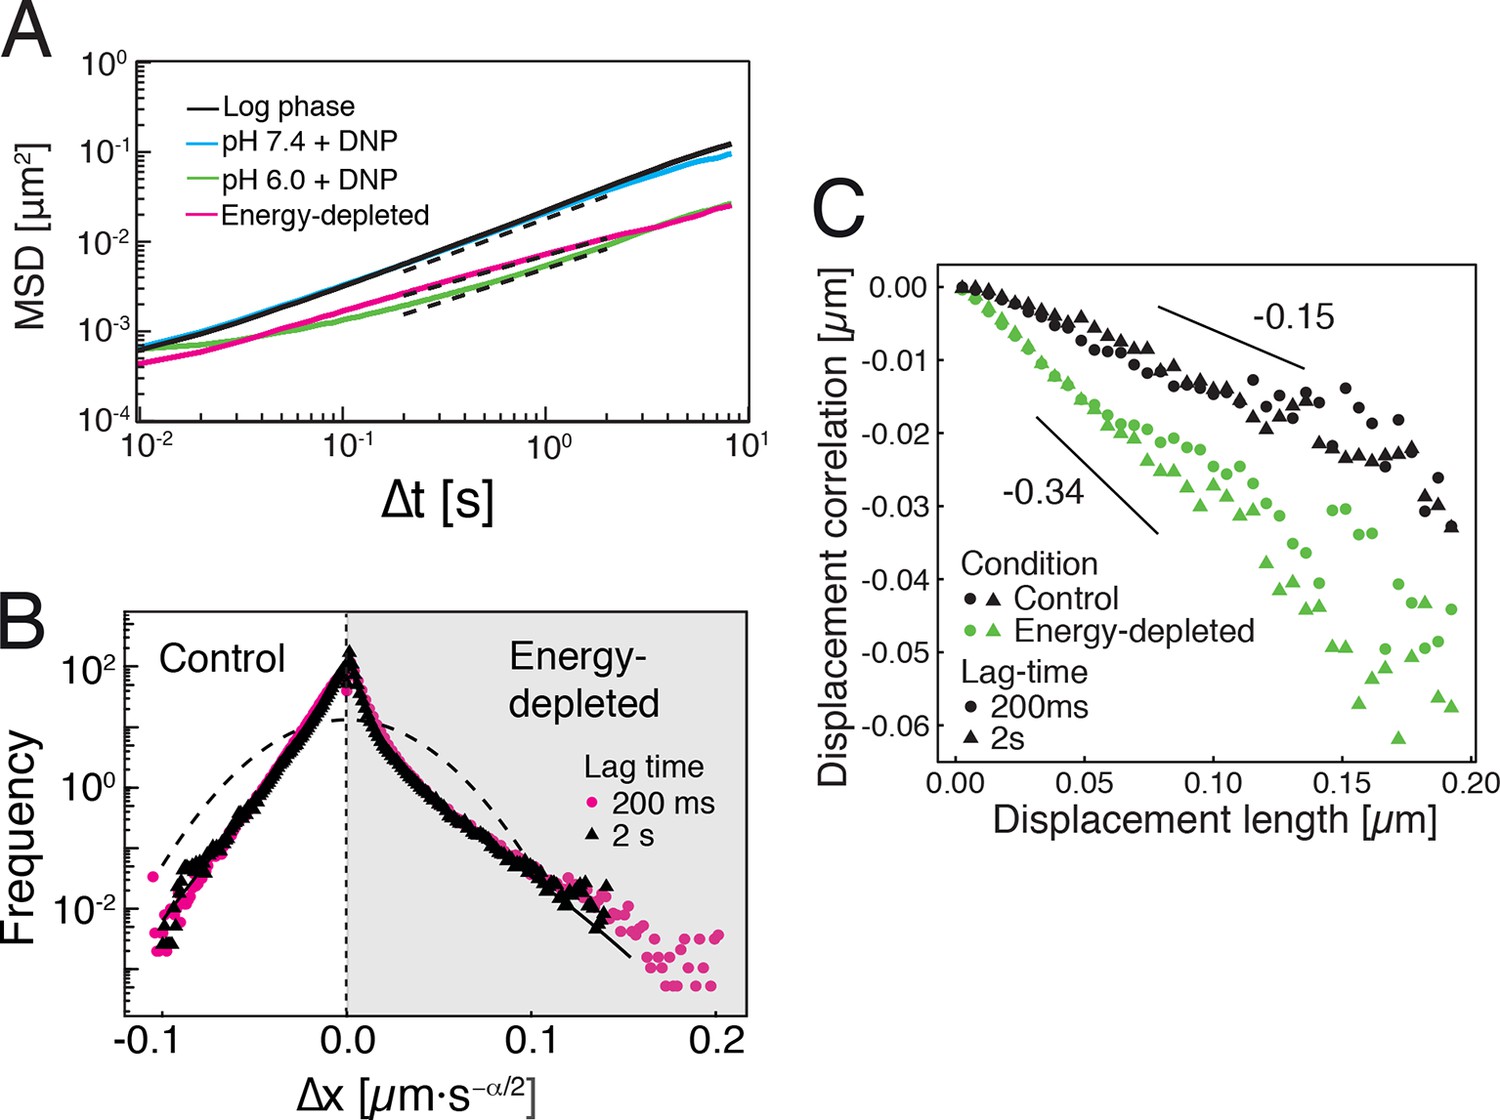
Characterization of the acidified and energy-depleted cytoplasm from a particle perspective.
(A) The time- and ensemble-averaged MSD are shown as a function of lag-time, together with the fitted power-law scalings as dashed lines. We obtained the following power-law exponents (DNP treated cells with external pH 6.0), (DNP treated cells with external pH 7.4), (energy depleted cells) and (log phase cells). (B) The master curve for the probability density function of particle displacements as a function of rescaled displacement (full lines) for log-phase cells (left side) and energy-depleted cells (right side). Symbols and colors indicate the probability density function extracted from the data at different lag-times after rescaling the displacements. This plot is symmetric for each condition. Plots were split at the dotted line to allow comparison of both datasets. The dashed line corresponds to a Gaussian distribution. (C) Correlation of subsequent displacements (defined as , where and are the displacement vectors at two consecutive time intervals) were calculated from trajectories recorded in control cells and energy-depleted cells for two different lag-times (time used to calculate the displacement) of 200 ms and 2 s. Correlations are plotted as a function of the initial displacement length . By assuming a linear dependence , the slope b quantifies the negative correlations of subsequent particle displacements and its magnitude increases from to upon energy depletion. The cytosolic pH was adjusted by treating cells with phosphate buffers of pH 5.5, pH 6.0 and pH 7.4, respectively, containing 2 mM DNP and 2% glucose. The cells were energy-depleted in SD-complete medium without glucose containing 20 mM 2-deoxyglucose and 10 µM antimycin A.
Figure 4—figure supplement 1
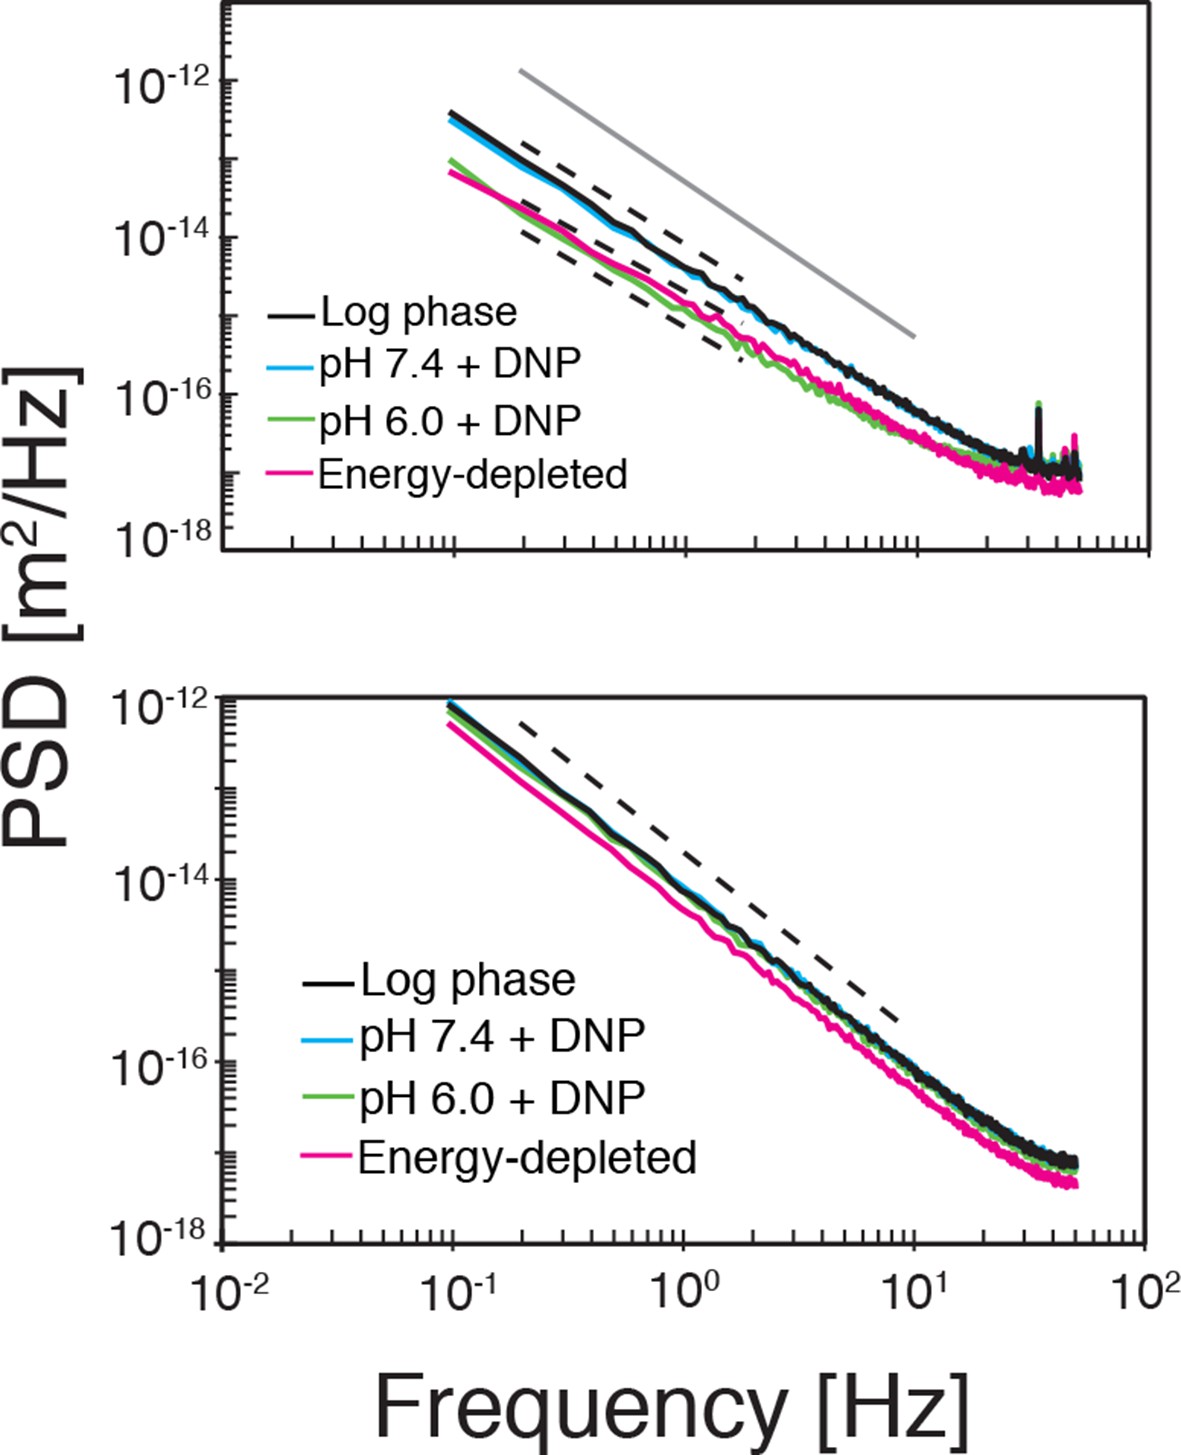
Top: The power spectral density (PSD) of particle displacements is shown as a function of frequency .
The dashed lines correspond to a power law scaling of the PSD as with where is the exponent in the power-law scaling of the corresponding MSD (see Figure 4A). Bottom: The PSD after randomly reshuffling the trajectories. The dashed line corresponds to the scaling of Brownian motion (.
Figure 4—figure supplement 2
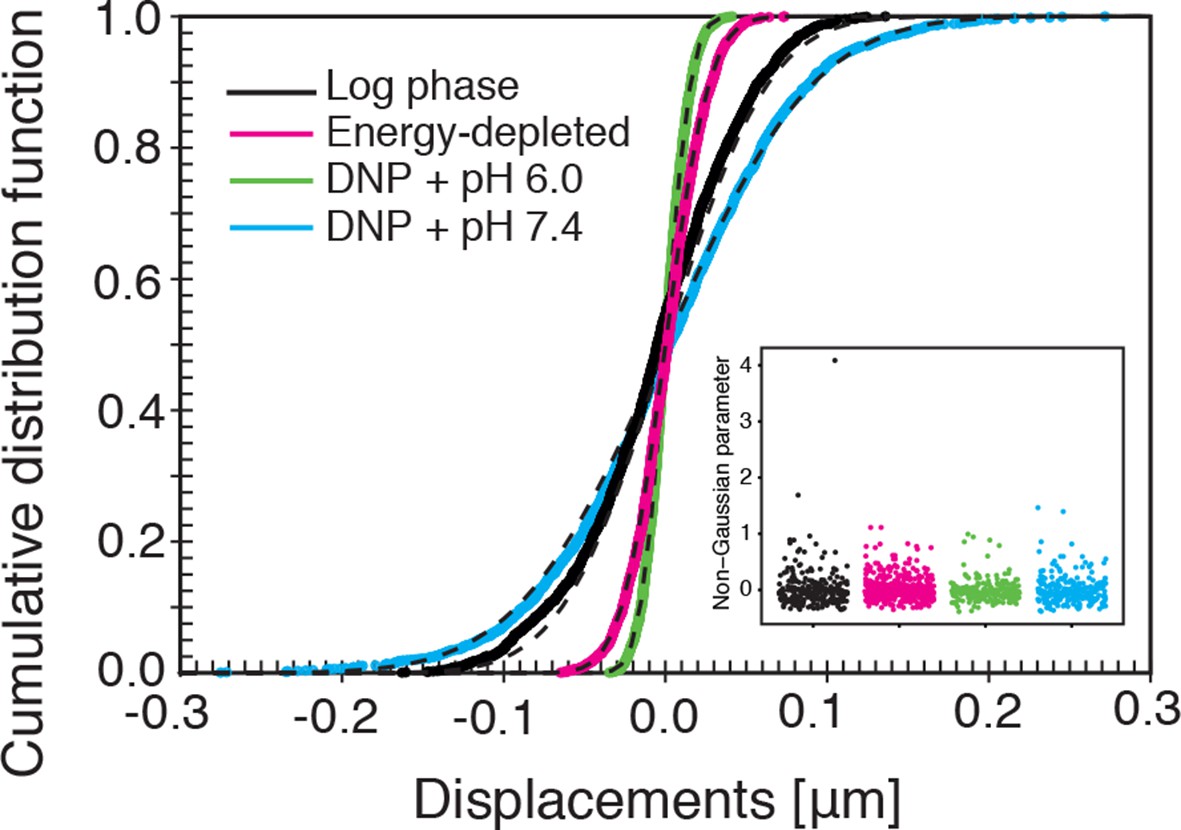
The cumulative distribution functions (CDFs) of particle displacements for some representative trajectories in all considered conditions (log-phase, energy-depleted, and pH-adjusted to pH 6.0 and pH 7.4).
The dashed lines are fits to CDFs of Gaussian distributions. The inset shows the values of the non-Gaussian parameter (defined in the Materials and methods section) for each individual trajectory in the corresponding experimental conditions. For all conditions its value is close to zero, in agreement with Gaussian statistics of particle displacements.
Figure 4—figure supplement 3
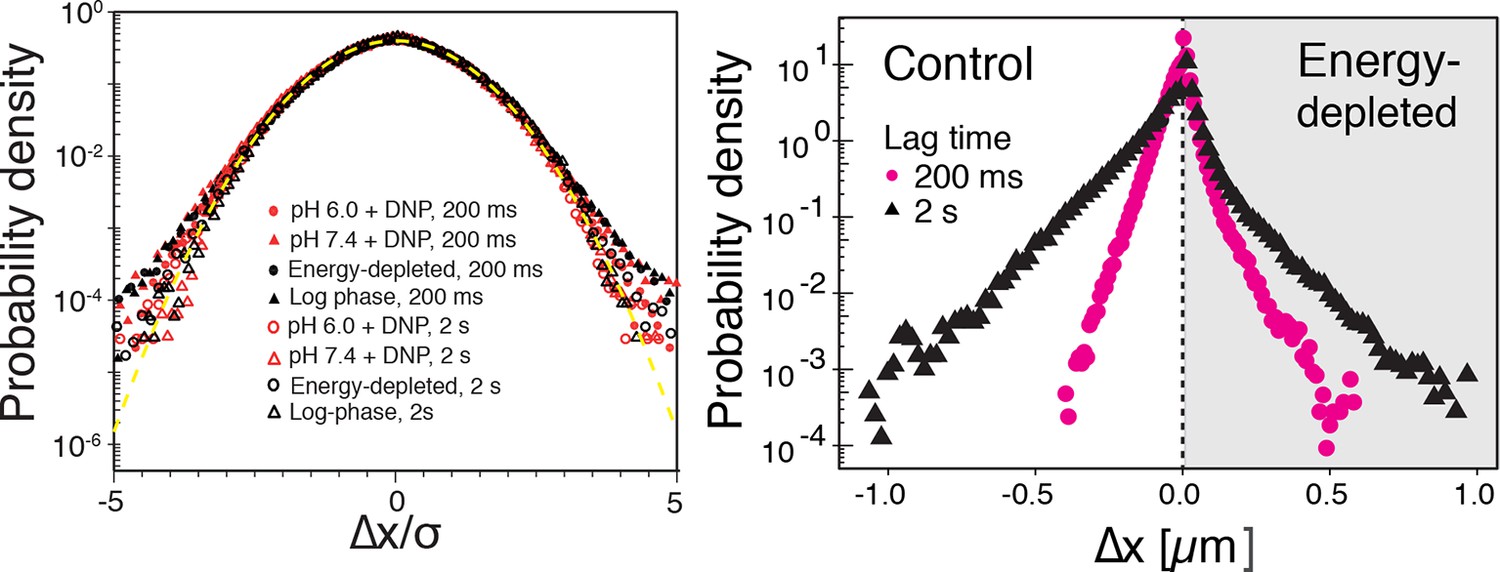
Left: The probability density functions (PDFs) of particle displacements for all conditions (log-phase, energy-depleted, and pH-adjusted to pH 6.0 and pH 7.4) and at two different lag times after rescaling the displacements both by and the generalized diffusion constant .
The dashed line is the PDF of the Gaussian distribution with the unit variance. Right: The unscaled PDFs of particles’ displacements for log phase and energy depleted cells for two lag times of 0.2 and 2 s.
Figure 4—figure supplement 4
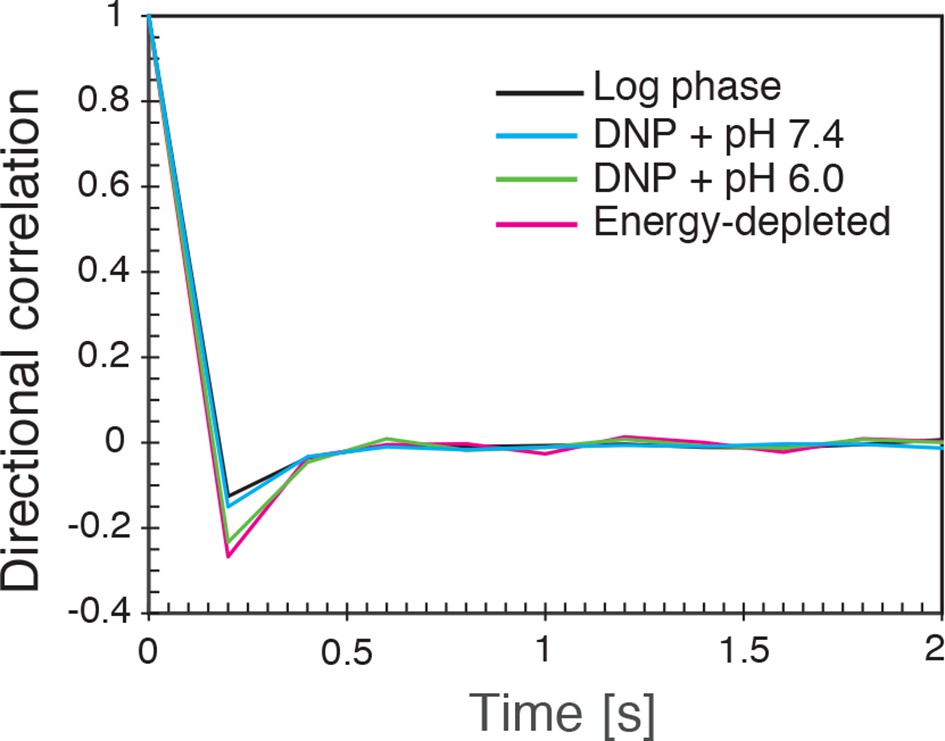
The directional correlation function, defined as , where is the lag-time, is an integer, is the change in particle position between time and and denotes the length of the vector , for all conditions (log-phase, energy depleted, and pH adjusted to pH 6.0 and pH 7.4) as a function of for lag-time ms.
https://doi.org/10.7554/eLife.09347.017
Figure 4—figure supplement 5
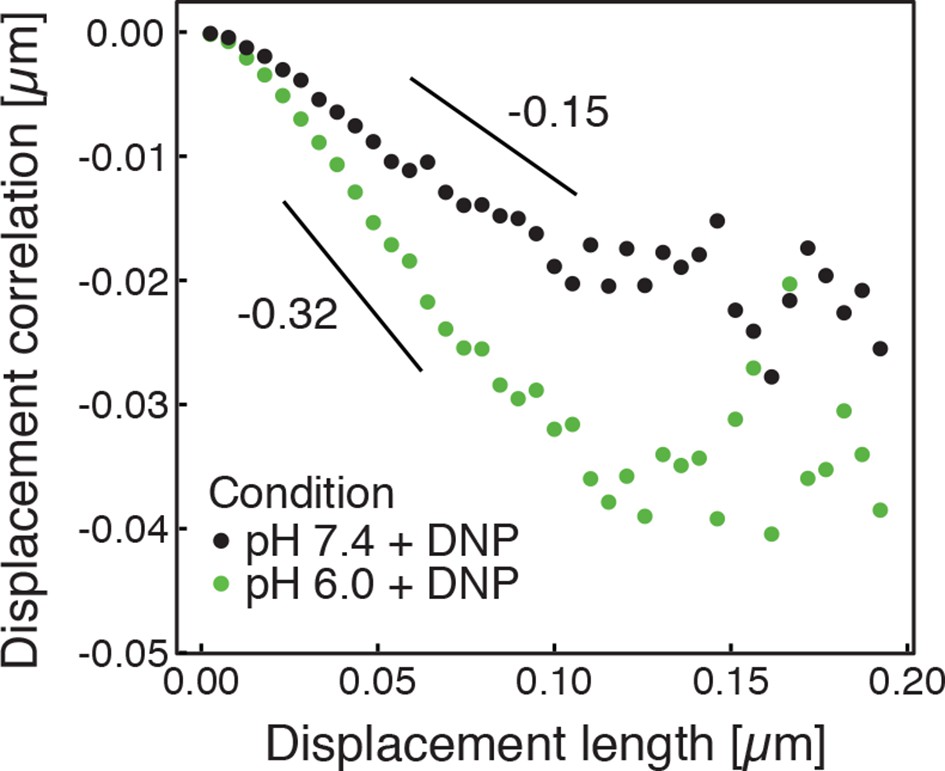
Correlations of subsequent displacements (defined as , where and are the displacement vectors at two consecutive time intervals) were calculated from trajectories recorded in cells adjusted to pH 7.4 and pH 6.0, respectively, and plotted as a function of the initial displacement length .
The lag-time (time used to calculate the displacement) is 200 ms. The linear slope b quantifies the negative correlations of subsequent particle displacements and its magnitude increases from to upon acidification. The cytosolic pH was adjusted by treating cells with phosphate buffers of pH 6.0 and pH 7.4, respectively, containing 2 mM DNP and 2% glucose.
Figure 4—figure supplement 6

Time-averaged (solid lines) and ensemble-averaged (symbols) MSDs of particles in control and energy-depleted cells, respectively (left panel) Time-averaged (solid lines) and ensemble-averaged (symbols) MSDs of particles in cells adjusted to pH 6.0 and pH 7.4 with DNP, respectively (right panel).
Grey areas indicate +/- SEM of the time-averaged MSD.
Figure 5 with 9 supplements
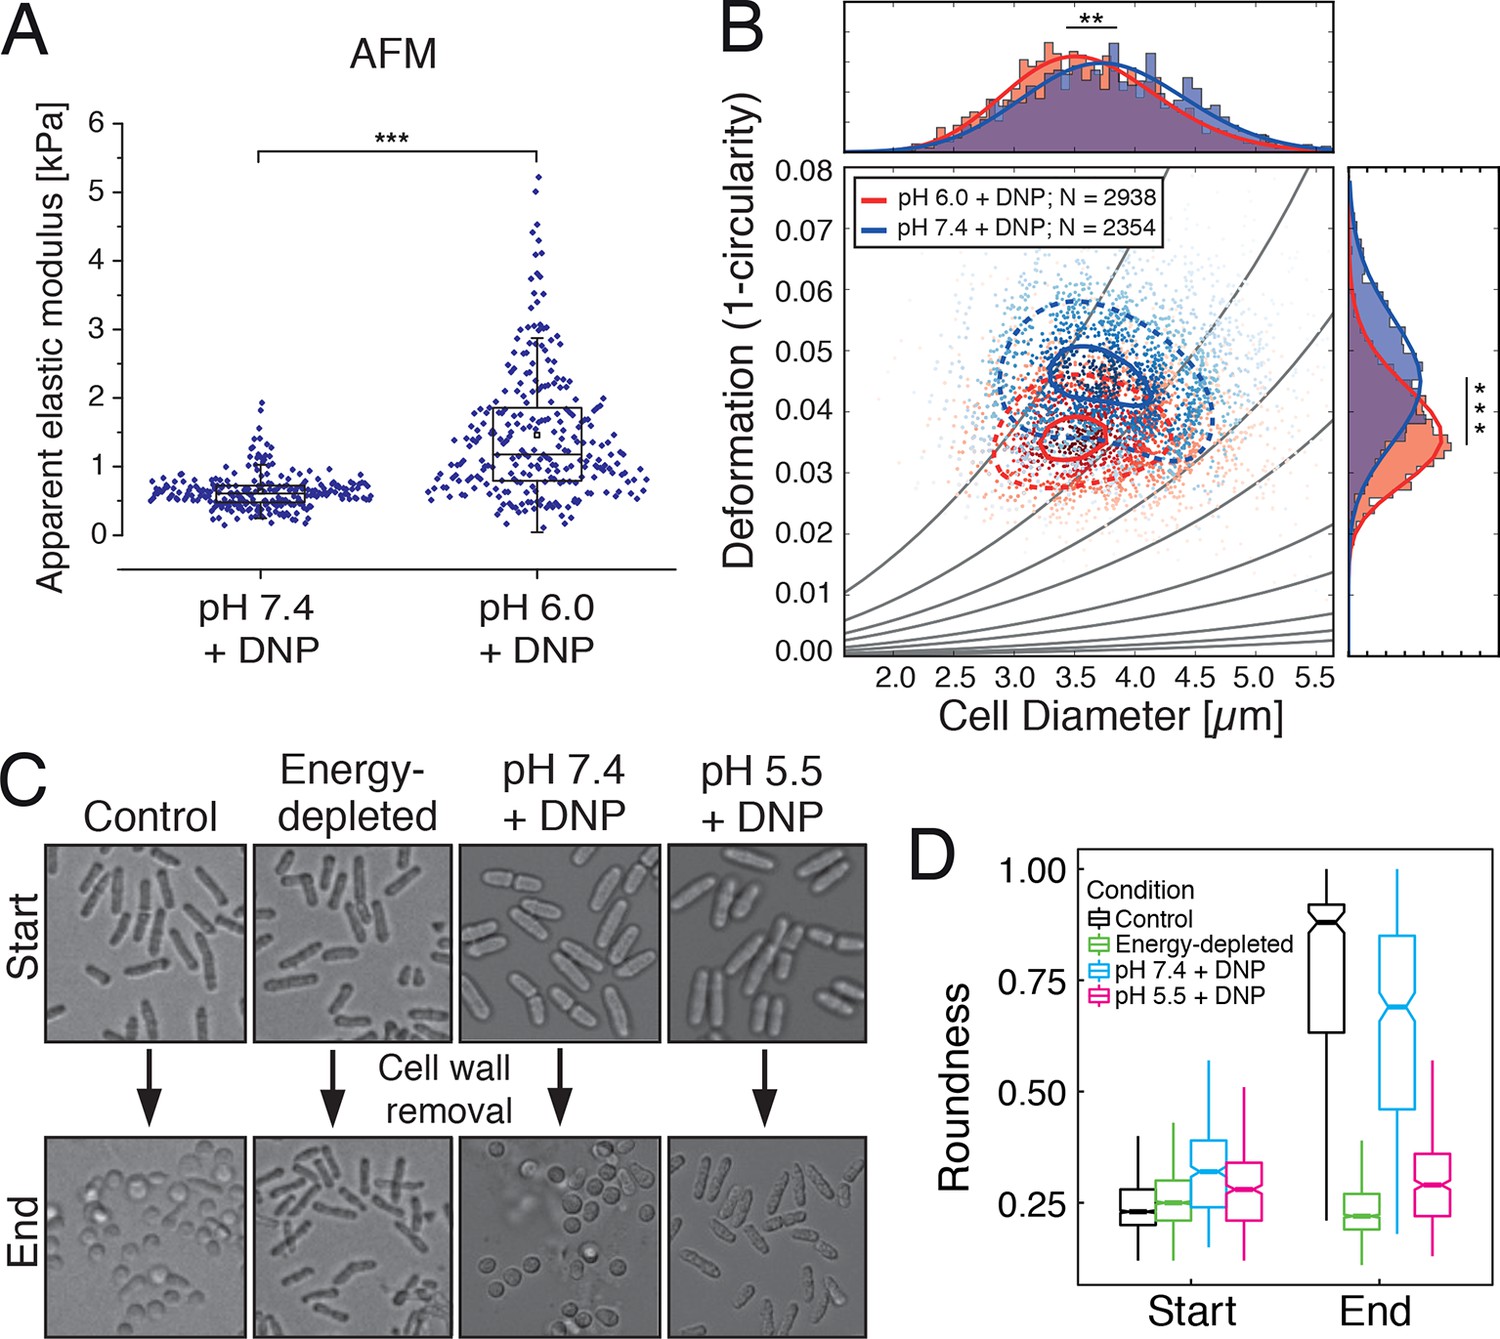
Mechanical characterization of acidified and energy-depleted cells.
(A) The apparent elastic modulus of S. cerevisiae spheroplasts (without rigid cell walls) at pH 7.4 (E = 636 ± 16 Pa (mean ± SEM); N = 249) and pH 6.0 (E = 1459 ± 59 Pa; N = 257) was measured by AFM-based indentation. The cytosolic pH of spheroplasts was adjusted with phosphate buffers of pH 6.0 and pH 7.4, respectively, containing 2 mM DNP, 1% glucose and 1 M sorbitol. (B) The same cells as in (A) characterized with real-time deformability cytometry (RT-DC). Each measured cell results in a dot in this deformation-cell diameter plot. Also shown are 90% (solid) and 50% (dashed) density lines, and the histograms of size and deformation including Gaussian fits. (C) The cell wall of rod-shaped S. pombe cells was removed under control, energy depletion, and pH-adjusted conditions. The cytosolic pH of cells was adjusted during spheroplasting with phosphate buffers of pH 5.5 and pH 7.4, respectively, containing 2 mM DNP, 2% glucose, 1 M sorbitol and cell wall-digesting enzymes. Cells were energy-depleted in growth medium without glucose containing 20 mM 2-deoxyglucose and 10 µM antimycin A for 2 hr prior to spheroplasting. Energy depletion was continued during spheroplasting by including 20 mM 2-deoxyglucose and 10 µM antimycin A in the spheroplasting buffer. (D) The roundness of more than 160 cells per condition at the start of the experiment and after 3 hr of incubation in the presence of cell wall digesting enzymes (end) was quantified. ∗∗p<0.01; ∗∗∗p<0.001.
Figure 5—figure supplement 1

(Left) The apparent elastic moduli of S. cerevisiae spheroplasts, incubated in phosphate buffers of different pH in the presence and absence of DNP, were determined by AFM-based indentation.
Independent measurements were repeated at least four times, with a total of N = 242–409 cells, for each condition. Cells were significantly stiffer at pH 6.0 (E = 1459 ± 59 Pa; mean ± SEM) than at pH 7.4 (E = 636 ± 16 Pa) and in the presence of DNP. Without DNP there was no statistically significant difference in stiffness between extracellular pH 6.0 and pH 7.4 (975 ± 39 Pa and 947 ± 27 Pa, respectively). Boxes show the 25th, 50th (the median), and 75th percentiles, whiskers the spread of the data (excluding outliers), and a square the mean score for a group. Mann-Whitney-tests were used to statistically compare two groups. Asterisks *** indicate significance level p<0.001. (Middle) The apparent elastic modulus of S. cerevisiae cells with and without cell wall was determined by AFM-based indentation. It is E = 1.3 ± 0.2 MPa (mean ± SEM; N = 69) for cells with cell wall and E = 975 ± 39 Pa (mean ± SEM; N = 409) for cells without cell wall (same data as for pH 7.4 w/o DNP in the left panel). (Right) Typical force-distance curves are shown for both pH values in the presence of DNP. The cytosolic pH of spheroplasts was adjusted with phosphate buffers of pH 6.0 and pH 7.4, respectively, containing 2 mM DNP, 1% glucose and 1 M sorbitol.
Figure 5—figure supplement 2
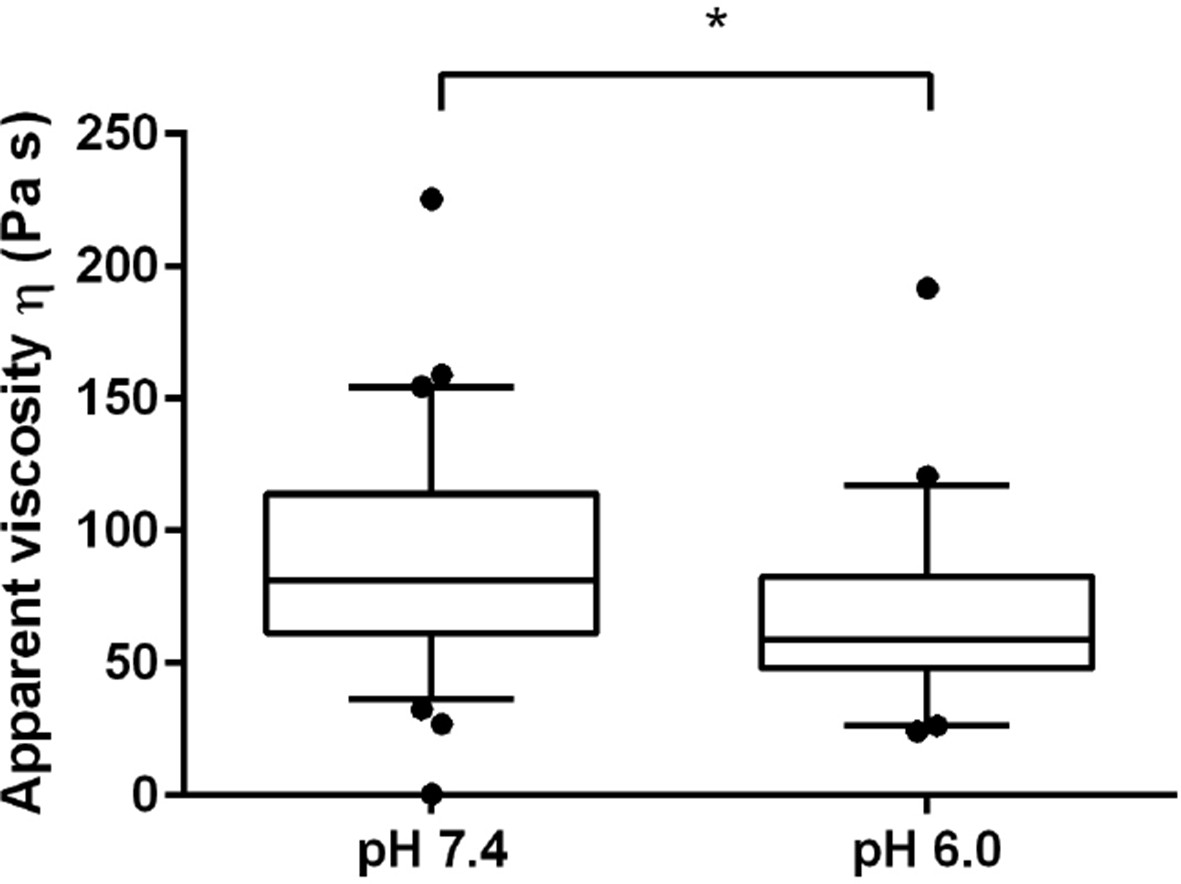
The viscosity of the spheroplasted cells, extracted from the AFM-based indentation-retraction curves, decreased from η = 90 ± 16 Pa s (mean ± SEM; N = 31) at pH 7.4 to η = 70 ± 14 Pa s (N = 23) at pH 6.0.
Boxes show the 25th, 50th (the median), and 75th percentiles, whiskers the spread of the data (and a few outliers). Asterisk * indicates significance level p<0.05 (Mann-Whitney-test).
Figure 5—figure supplement 3
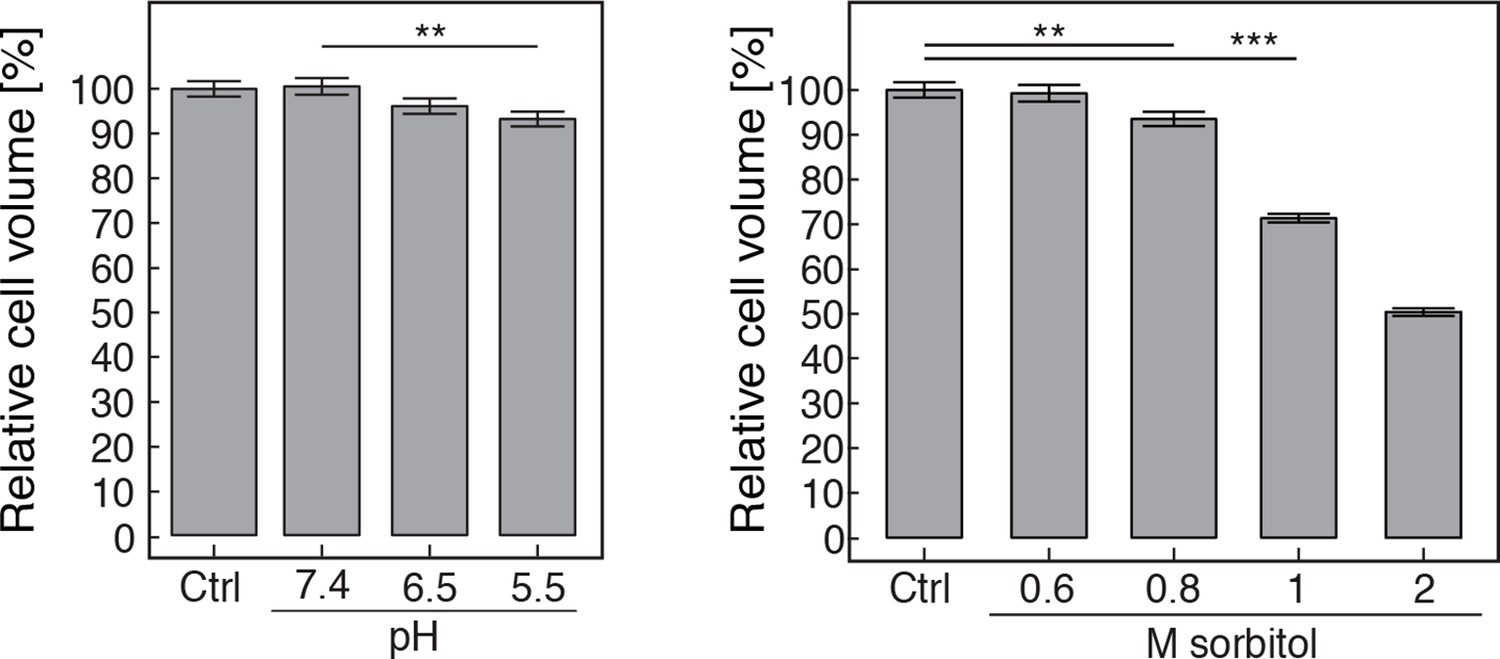
The volume of pH-adjusted (left panel) and sorbitol-treated (right panel) yeast cells was measured with an imaging-based method (see materials and methods).
The cytosolic pH was adjusted by treating cells with phosphate buffers of indicated pH containing 2 mM DNP and 2% glucose. Sorbitol treatment was done in synthetic complete medium. The term 'relative cell volume' is used to indicate that the volume of control cells (Ctrl, cells in synthetic complete medium) was normalized to 100%. More than n=160 cells were measured for each condition. Values are given as mean +/- SEM. ** Indicates a p-value < 0.01, *** a p-value < 0.001.
Figure 5—figure supplement 4
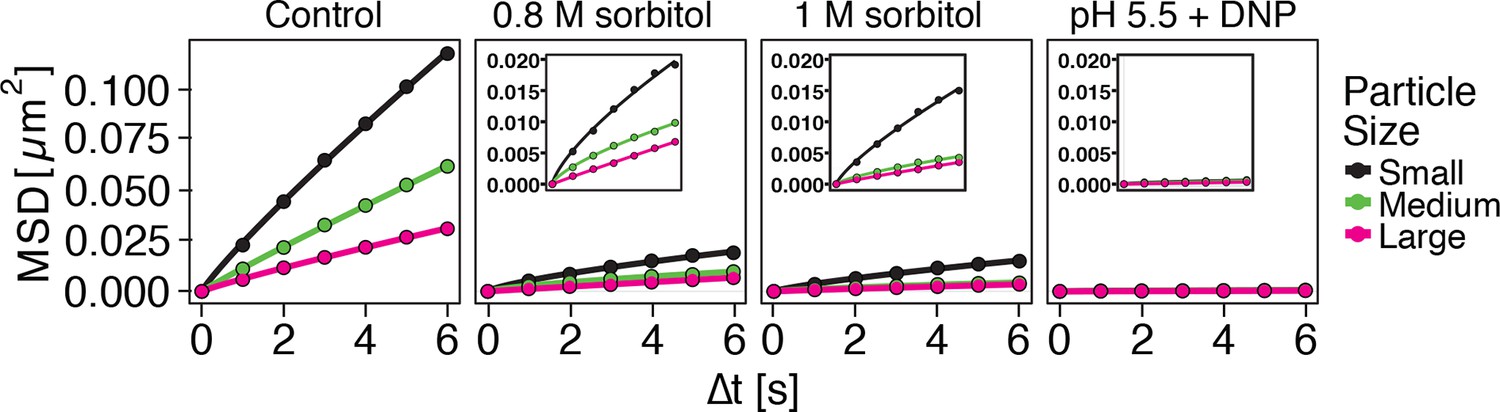
Both low pH and sorbitol treatment cause a reduction in particle mobility.
MSD of GFP-µNS particles in cells exposed to increasing concentrations of sorbitol and in cells adjusted to low pH. The cytosolic pH was adjusted by treating cells with phosphate buffers of pH 5.5 containing 2 mM DNP and 2% glucose. Sorbitol treatment was done in synthetic complete medium containing the indicated amount of sorbitol.
Figure 5—figure supplement 5
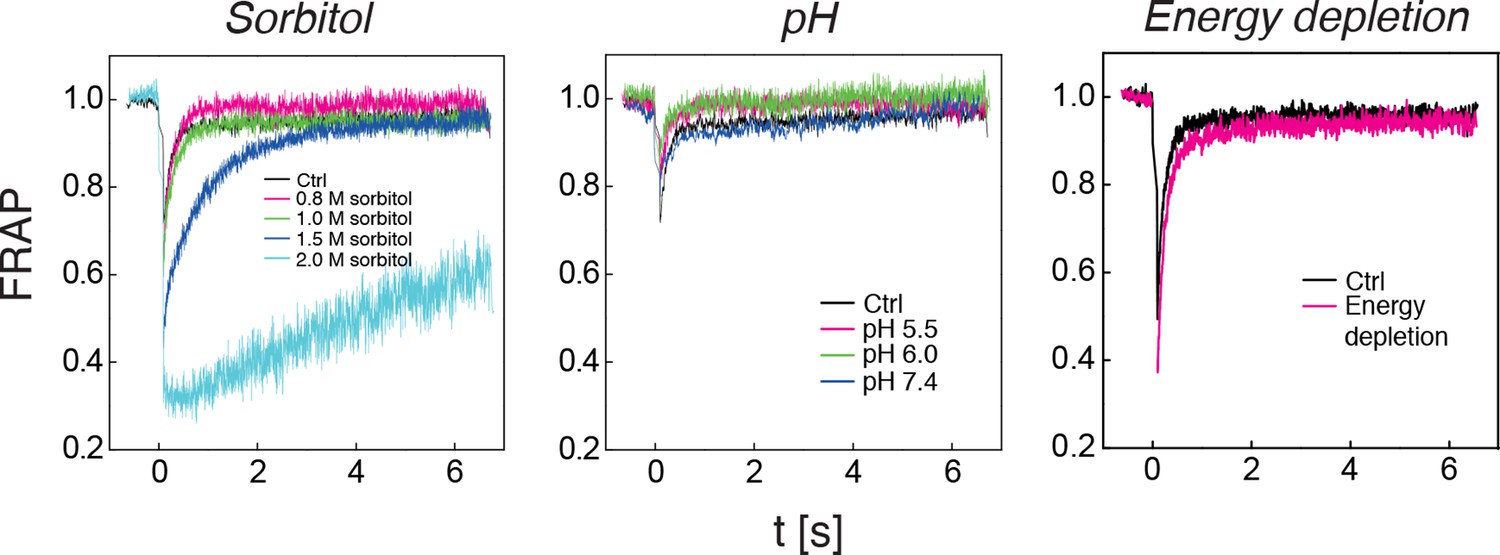
The diffusivity of a mCherry-GFP fusion protein was measured with fluorescence recovery after photobleaching (FRAP) in cells exposed to different concentrations of sorbitol (left panel), cells adjusted to different cytosolic pH (middle panel), and in energy-depleted cells (right panel).
Sorbitol treatment was done in synthetic complete medium containing the indicated amount of sorbitol. The cytosolic pH was adjusted by treating cells with phosphate buffers of pH 5.5, pH 6.0 and pH 7.4, respectively, containing 2 mM DNP and 2% glucose. Cells were energy-depleted in synthetic complete medium (standard pH of 5.5) without glucose containing 20 mM 2-DG and 10 μM antimycin A. Each curve represents the average of more than 5 measurements in different cells.
Figure 5—figure supplement 6
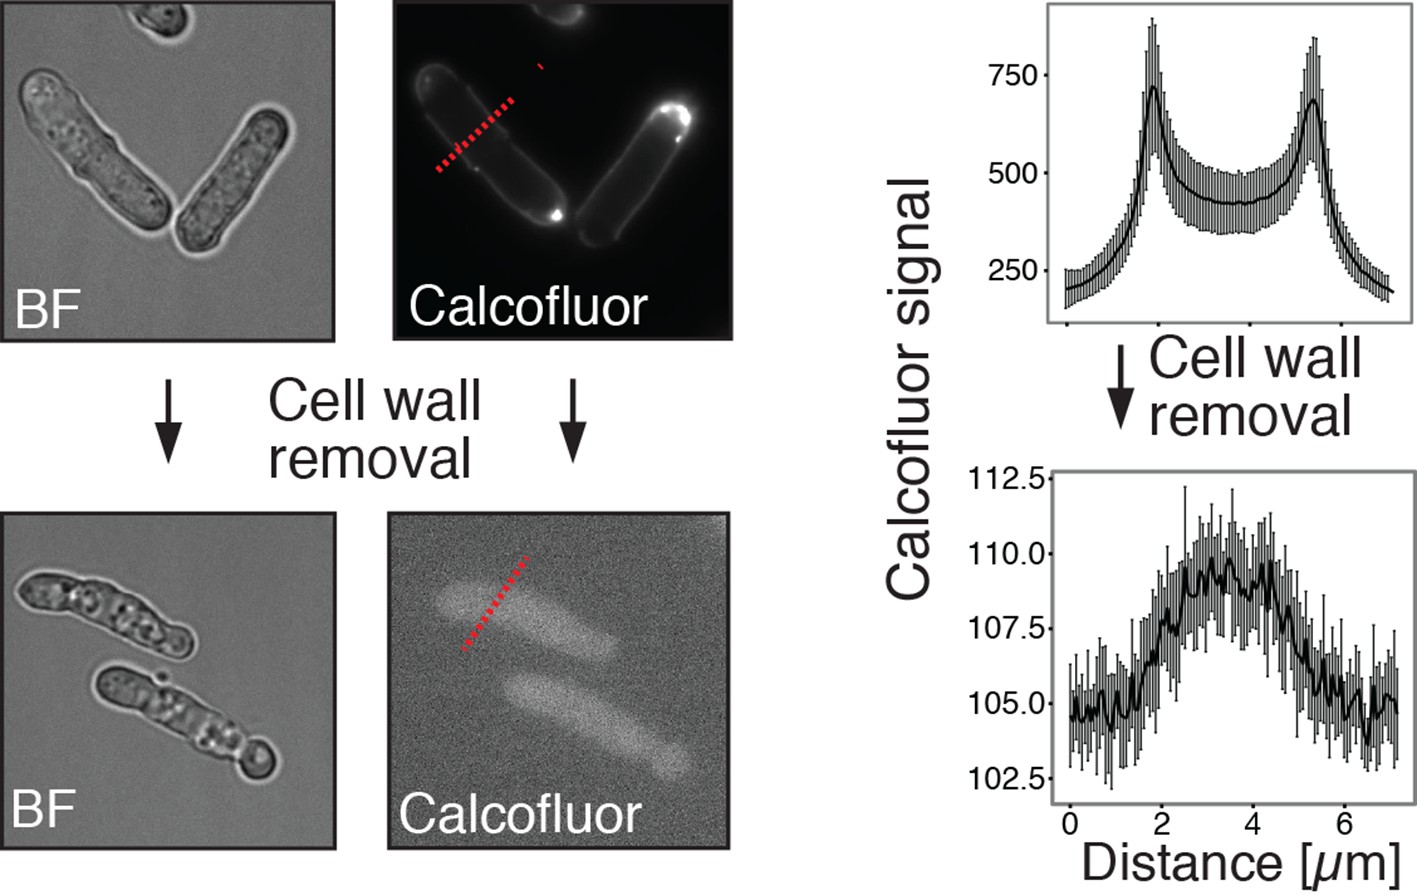
Energy-depleted S. pombe cells retain a rod-like shape in the absence of a cell wall.
Left: Energy-depleted S. pombe cells before (top) and after (bottom) cell wall removal. BF: Bright field image. Calcofluor white staining confirms the presence of a cell wall before and absence of a cell wall after enzymatic removal. Right panel: Averaged line profiles through cells (red lines indicated on the left show examples of line scans in representative cells). Measurements were carried out for 10 individual cells before and after cell wall removal, respectively. Note the different axis scales indicating strong differences in calcofluor staining intensity. Measurements were carried out for 10 individual cells before and after cell wall removal, respectively.
Figure 5—figure supplement 7
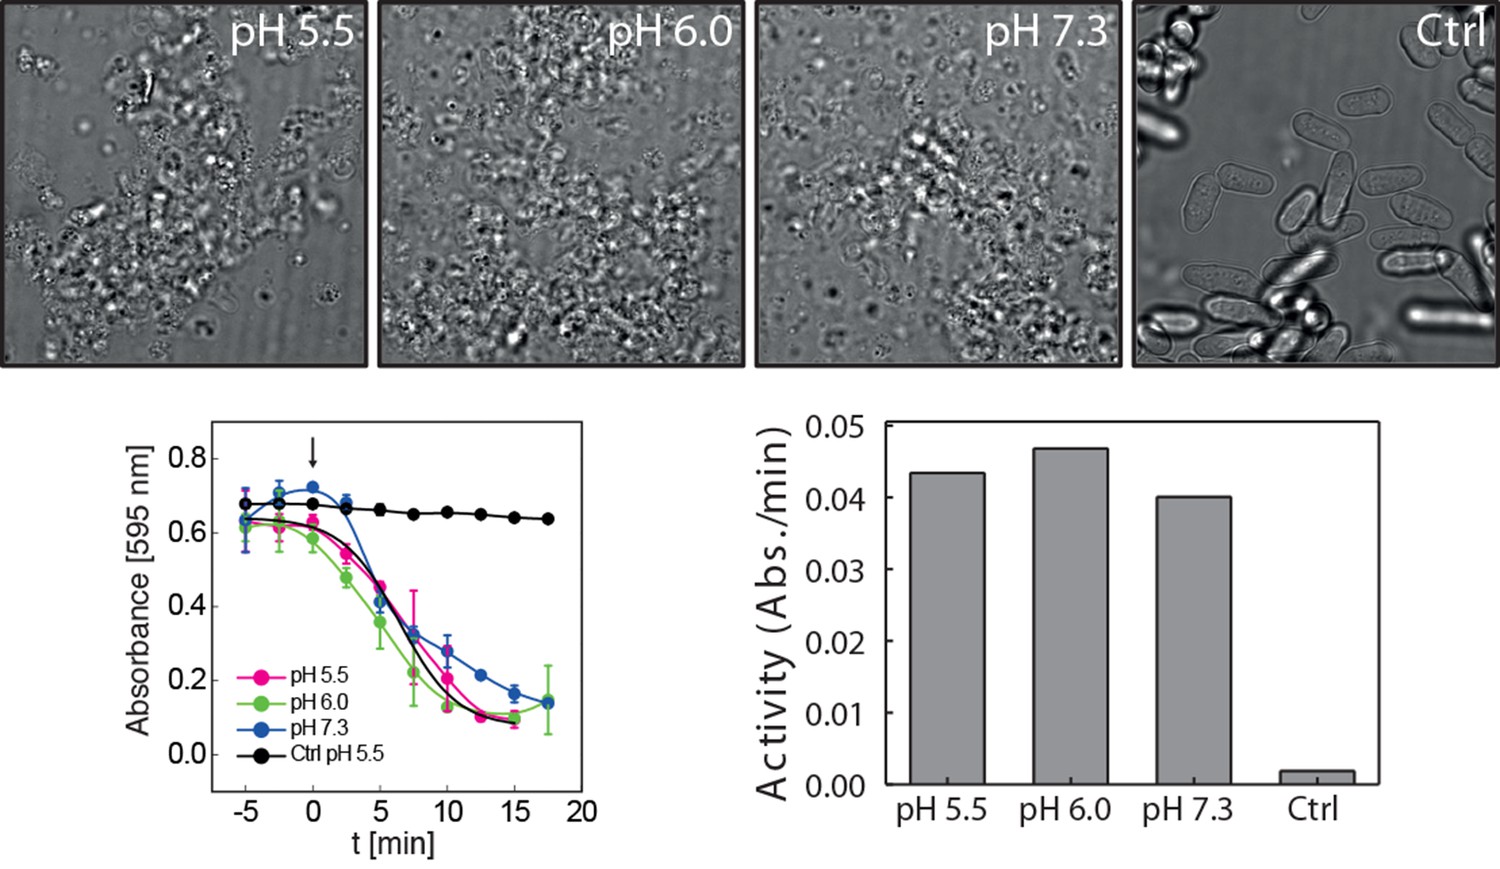
Cell wall digesting enzymes work equally well in buffers of different pH.
Top: Still images of cells incubated with and without (Ctrl) cell wall removing enzyme mix in buffers of indicated pH. No sorbitol was added in order to allow for cell lysis upon cell wall removal. Bottom left: Quantification of the lysing activity (absorbance at 595 nm) as a function of time. Absorbance only decreases after addition of the enzyme mix (arrow, time 0). Bottom right: The activity of the enzyme mix at different pH was derived from the plot shown on the bottom left by linear regression. Enzyme activity is given as the change of absorbance per minute (Abs./min).
Figure 5—figure supplement 8
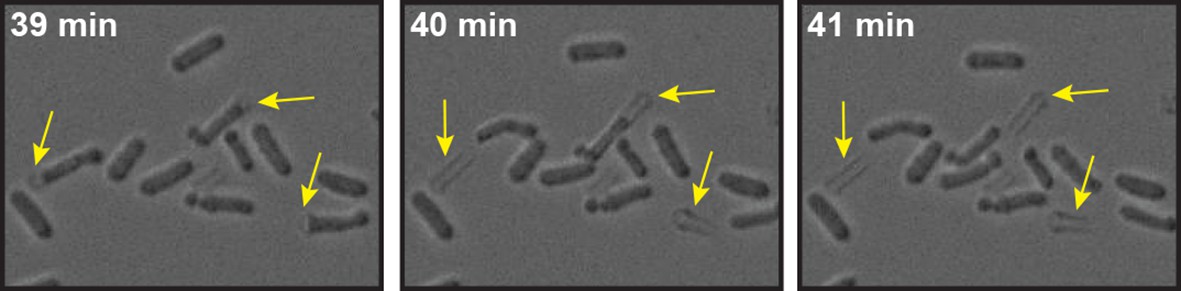
Energy-depleted S. pombe cells were imaged by time-lapse bright field microscopy after addition of the cell wall removing enzyme mix.
Still images show multiple events (yellow arrows) in which the cell body separates from the cell wall sheath and maintains its rod-like shape. Also see corresponding Video 6.
Figure 5—figure supplement 9
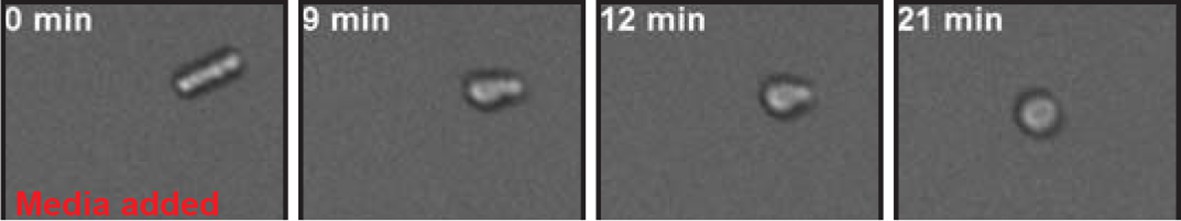
Low pH adjusted, rod-shaped S. pombe spheroplasts round up when exposed to glucose-containing medium.
Prior to imaging the spheroplast was kept in phosphate buffer of pH 6.0 containing 1 M sorbitol and 2 mM DNP and did not round up for several hours. At time point 0 min the buffer was replaced with EMM5 medium containing glucose and 1 M sorbitol. Sorbitol was added to osmotically stabilize the cells. Also see corresponding Video 7.
Figure 6 with 2 supplements
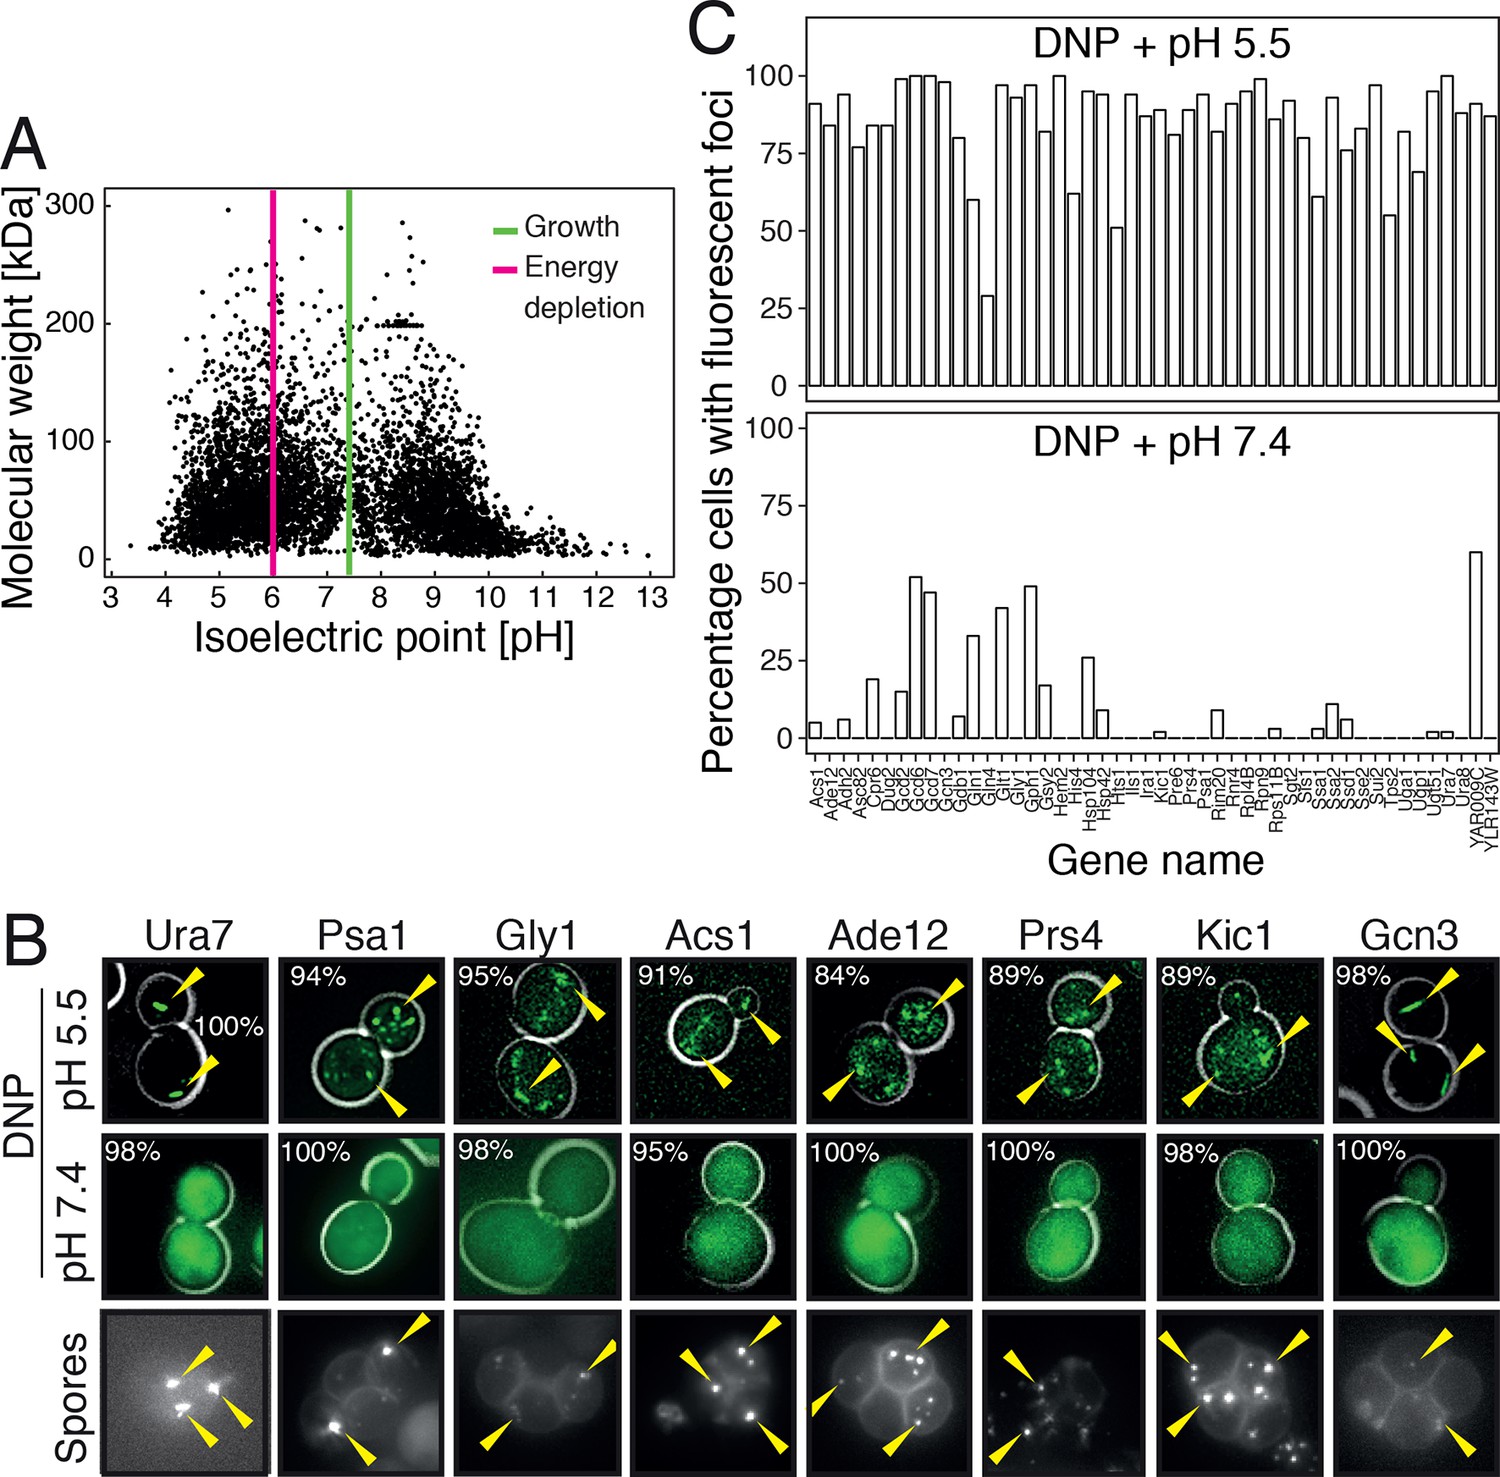
Acidification of the cytosol causes widespread assembly of cytoplasmic proteins.
(A) The isoelectric points and the molecular weight of all yeast proteins were computed from their primary amino acid sequence and plotted as a virtual 2D gel. The green line indicates optimal growth pH, the red line indicates pH reported for dormant yeast cells. (B) We systematically tested the response of 68 cytoplasmic proteins to a drop in cytosolic pH. Shown are representative images of proteins that responded with assembly formation to low pH. The same proteins also form assemblies in yeast spores. (C) The percentage of cells showing protein assemblies at high versus low pH was quantified. The cytosolic pH was adjusted by treating cells with phosphate buffers of pH 5.5 and pH 7.4, respectively, containing 2 mM DNP and 2% glucose.
Figure 6—figure supplement 1
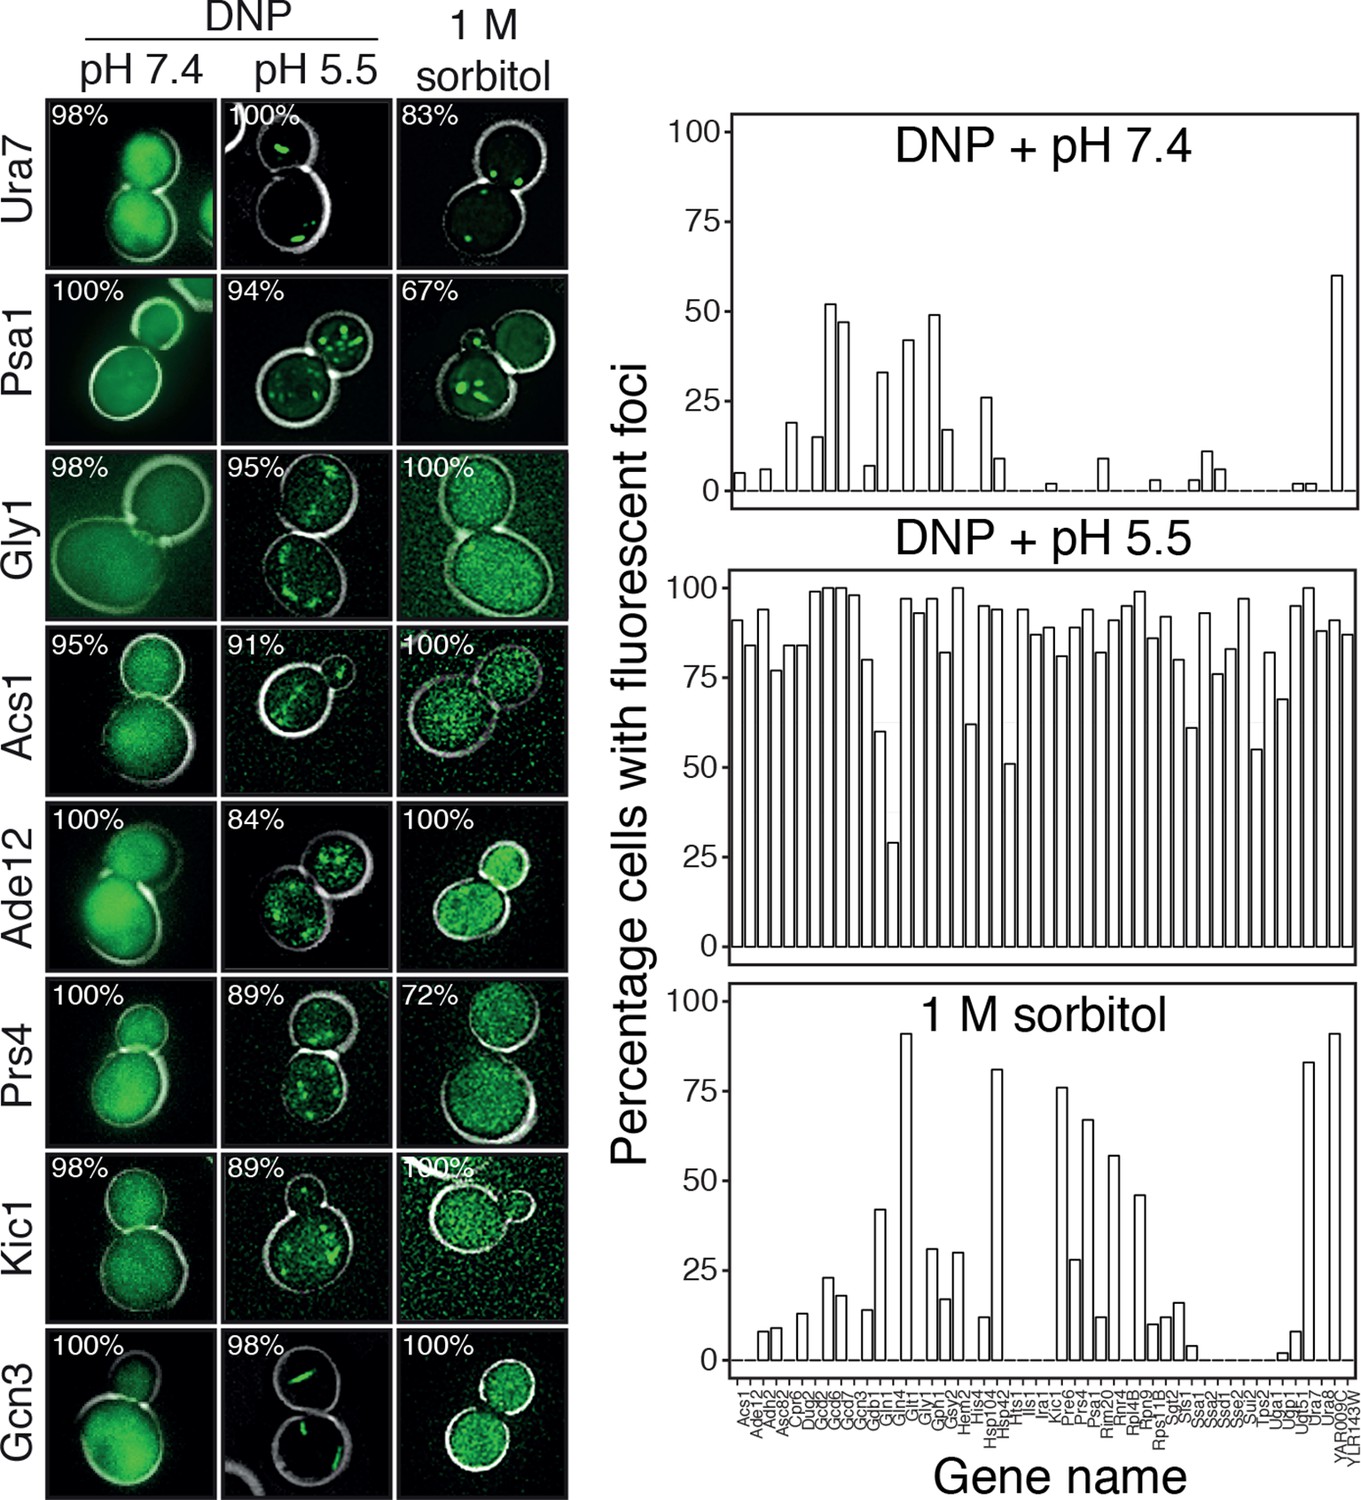
Response of 68 cytoplasmic proteins to a drop in cytosolic pH and to treatment with 1 M sorbitol.
Representative images of proteins that respond with assembly formation to low pH were also tested for their response to 1 M sorbitol (left). The percentage of cells showing protein assemblies at high versus low pH as well as in sorbitol-treated cells was quantified. pH data is the same as in Figure 6 and is shown for comparison. The cytosolic pH was adjusted as described in the legend of Figure 6. Sorbitol treatment was performed in synthetic complete medium containing 1 M sorbitol.
Figure 6—figure supplement 2
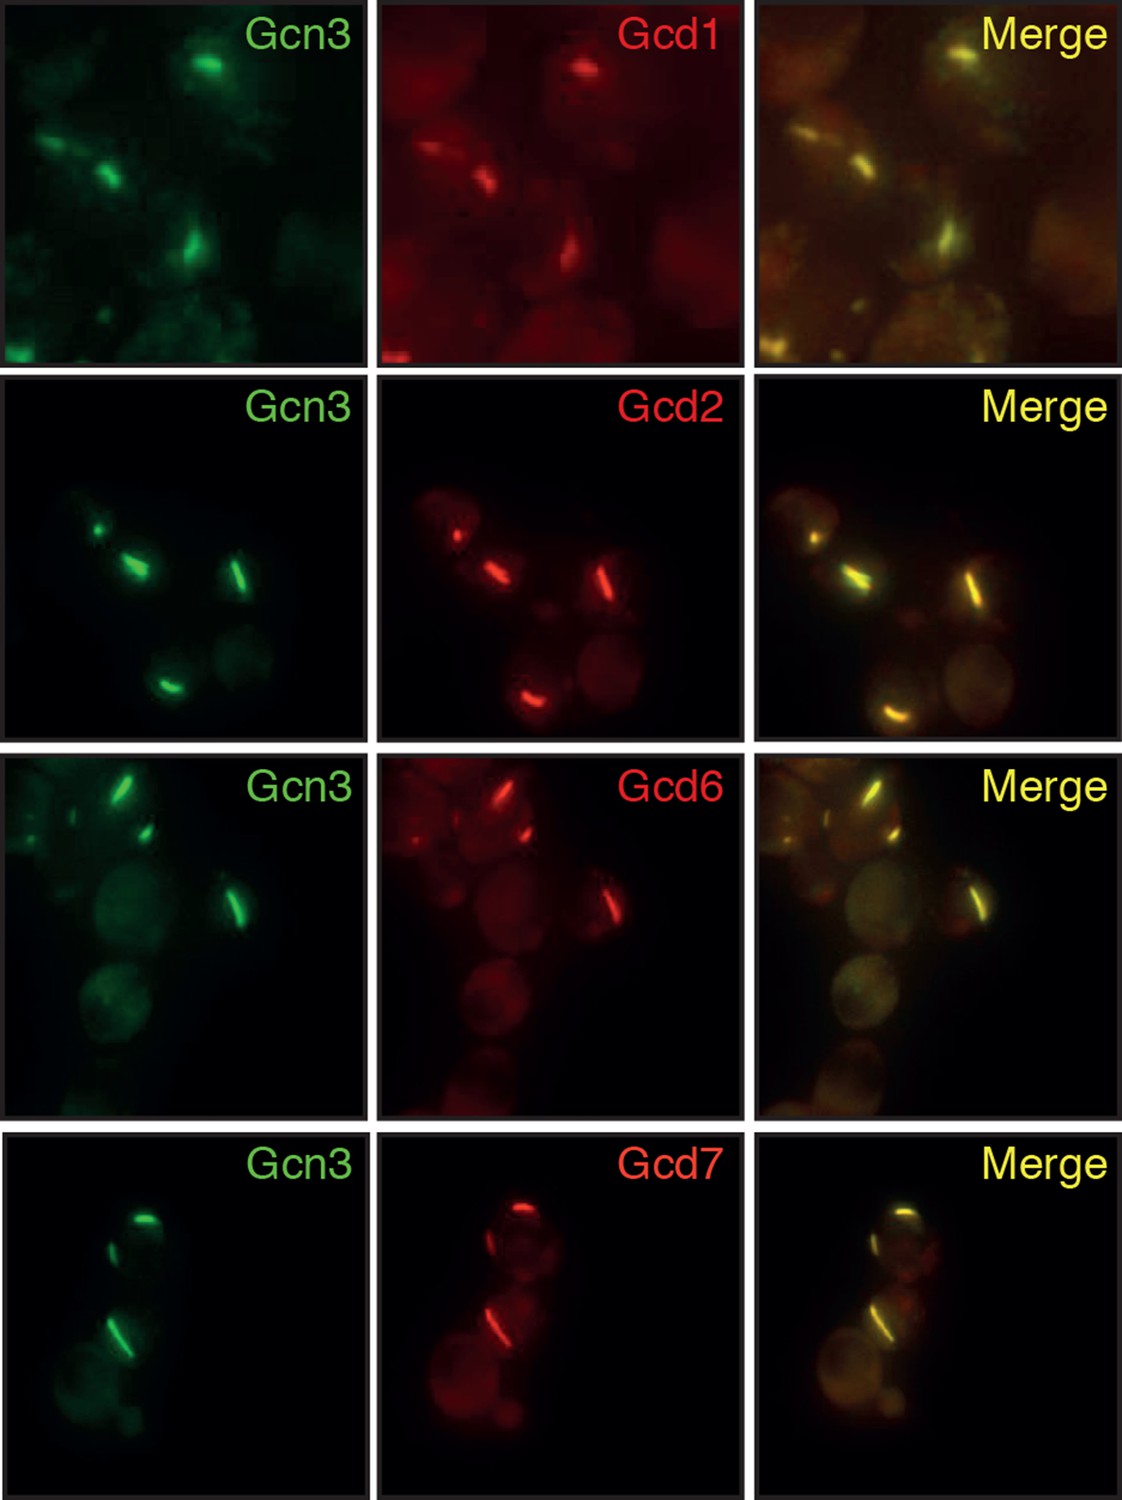
Different subunits of the hetero-pentameric eIF2B complex colocalize in the same filamentous structures, suggesting that these protein retain their native-like structure when they form higher-order assemblies.
Cells were energy-depleted in phosphate buffer of pH 6.0 for 3 hours prior to imaging.
Figure 7
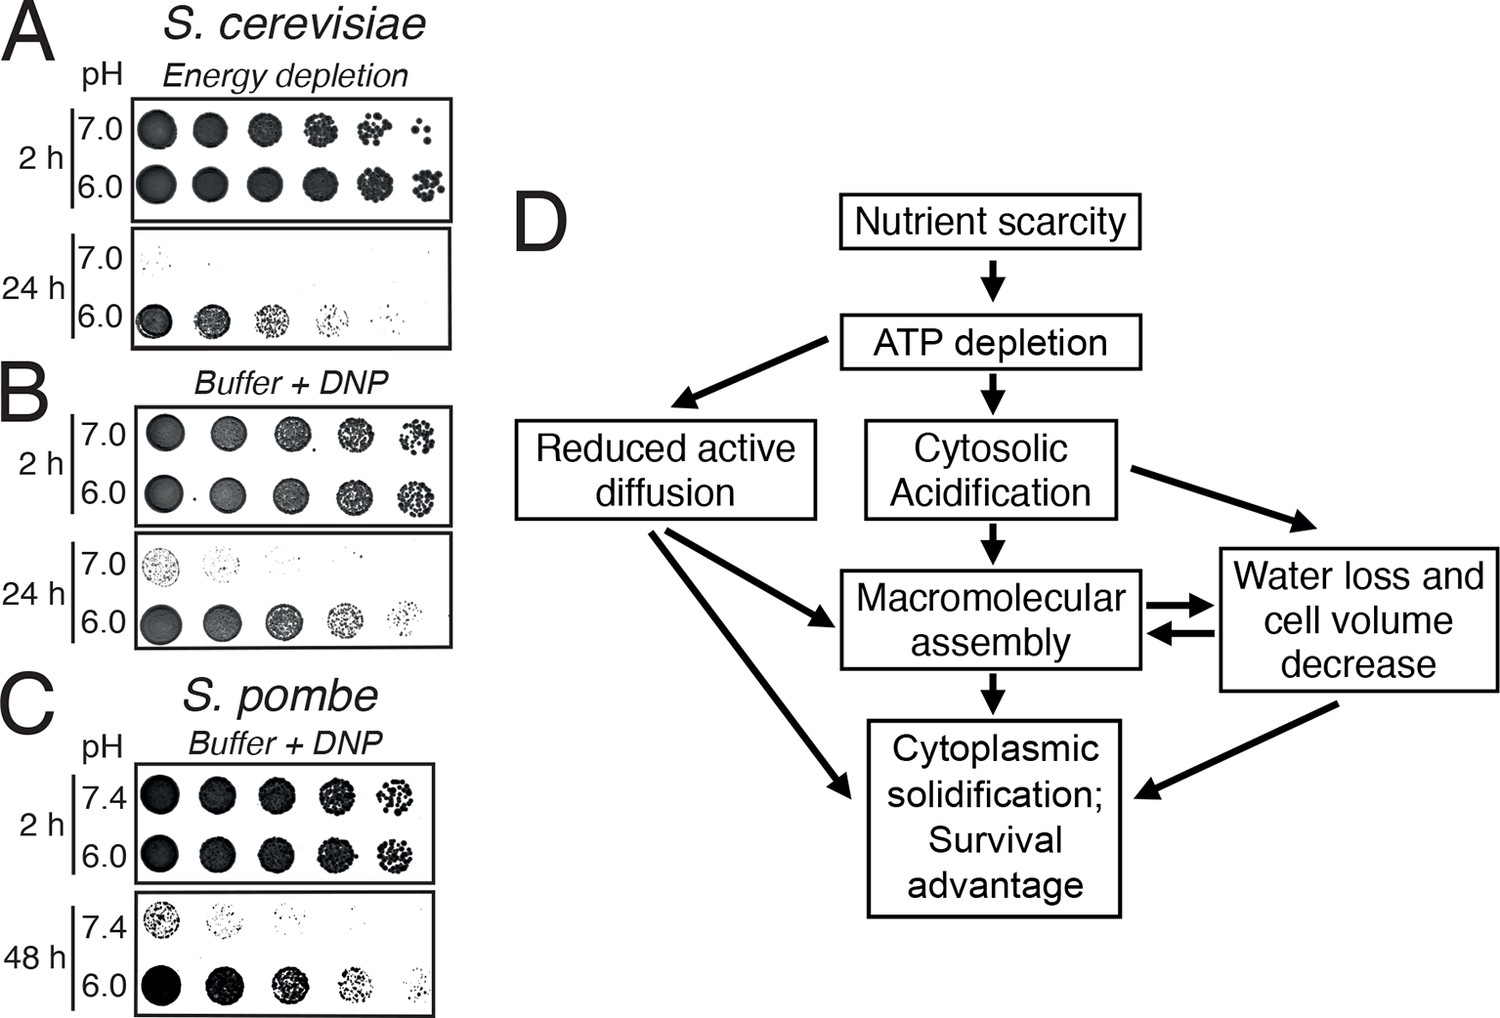
Acidification of the cytosol promotes survival under energy depletion conditions.
(A) Growth assay of S. cerevisiae cells that were energy-depleted with 20 mM 2-DG and 10 µM antimycin A in growth medium adjusted to pH 7.0 and 6.0, respectively. (B) Similar to A, but cells were incubated in buffers of pH 7.0 or pH 6.0, respectively, containing 2 mM DNP. (C) Similar to A, but the experiment was performed with fission yeast. (D) A flow chart showing the hypothetical sequence of events promoting entry into a dormant state.
Author response image 1
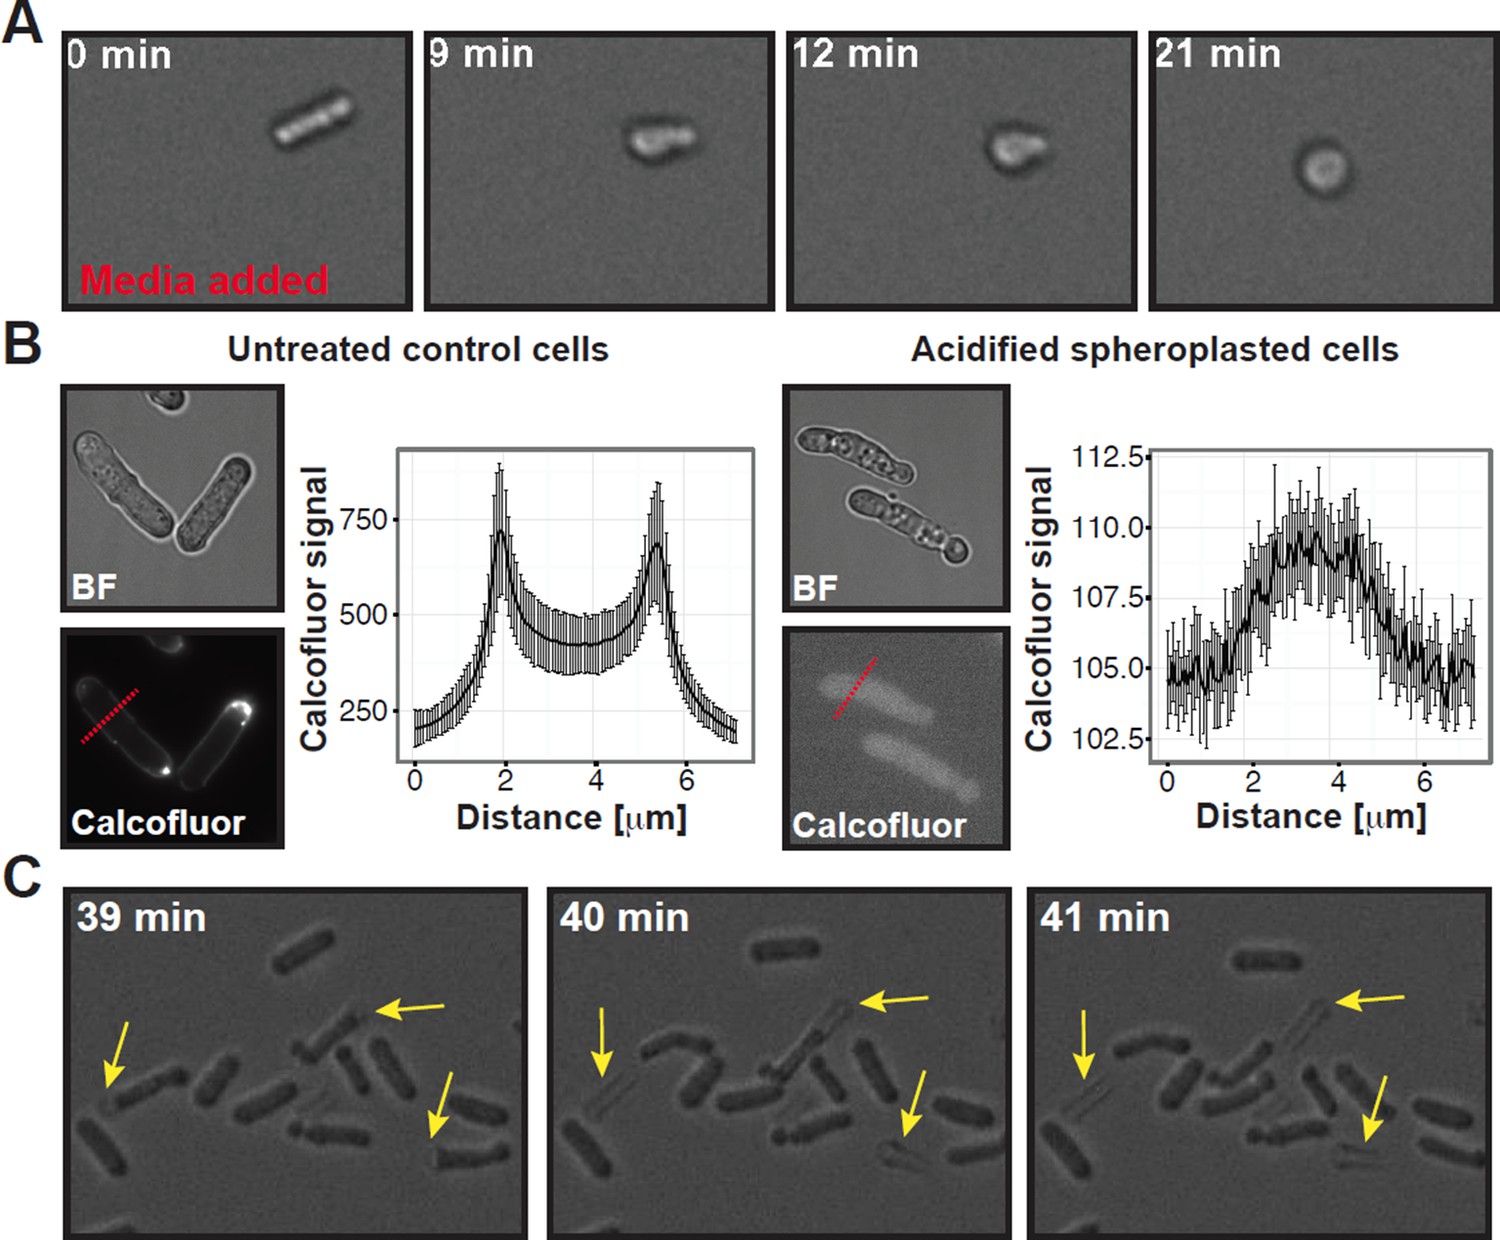
Summary of experiments showing that the cell wall was completely removed in our spheroplasting procedure.
(A) A rod-shaped spheroplasted fission yeast cell rounds up when media is added. (B) Acidified control and spheroplasted cells were treated with calcofluor white to stain the cell wall. Note the difference in signal intensity. The graphs on the right show the average calcofluor intensity of ten cells measured through a line scan. The location of the line scan is indicated for two representative cells with a red dashed line. (C) Stills of a time-lapse experiment where acidified rodshaped cells can be seen loosing their cell wall (yellow arrows). Also see corresponding Movie R1
Author response image 2

Comparison of the power spectral density of displacements for trajectories of different length (control conditions).
The black line corresponds to the data set presented in the paper and the blue line is the new data for 227 trajectories that are 10 min long and acquired with 5 s resolution. As we see from this plot the slope of the PSD for large times (small frequencies) is properly captured by shorter trajectories.
Author response image 3

AFM based indentation measurements of the apparent elastic modulus of cells with and without cell wall.
In both cases, the cells were indented up to a maximum force of 2 nN and the resulting force-distance curves were analyzed with the Hertz model as described in the material and Methods section. Note the logarithmic scale of the y-axis.
Author response image 4
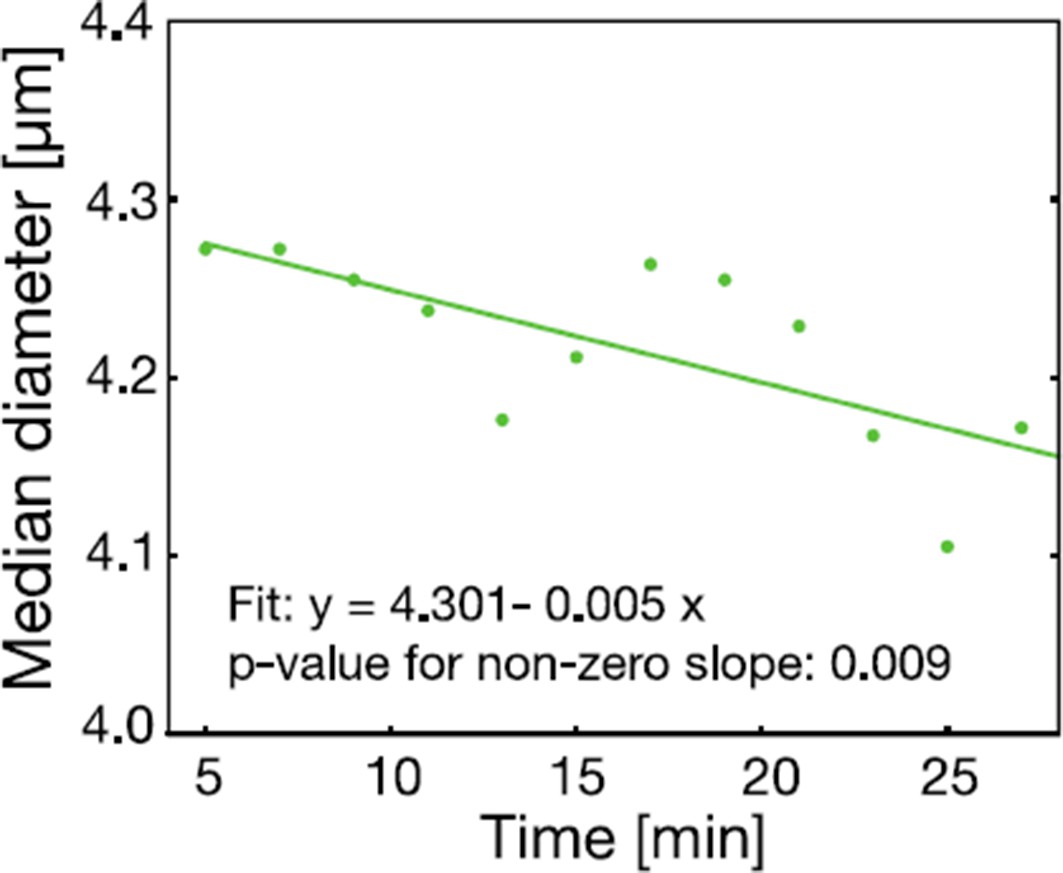
The cell size of S. cerevisiae cells in response to low pH adjustment was measured over time with an RT-DC setup.
Cells were loaded into the microfluidic chip of the RT-DC device immediately after exposure to phosphate buffer of pH 6 containing 2 mM DNP and 2% glucose. The median diameter of more than 530 cells was measured for each time-point. We observed a small but significant decrease in cell size over a time span of 30 min. A two sided t-test shows that the slope differs significantly from zero.
Author response image 5
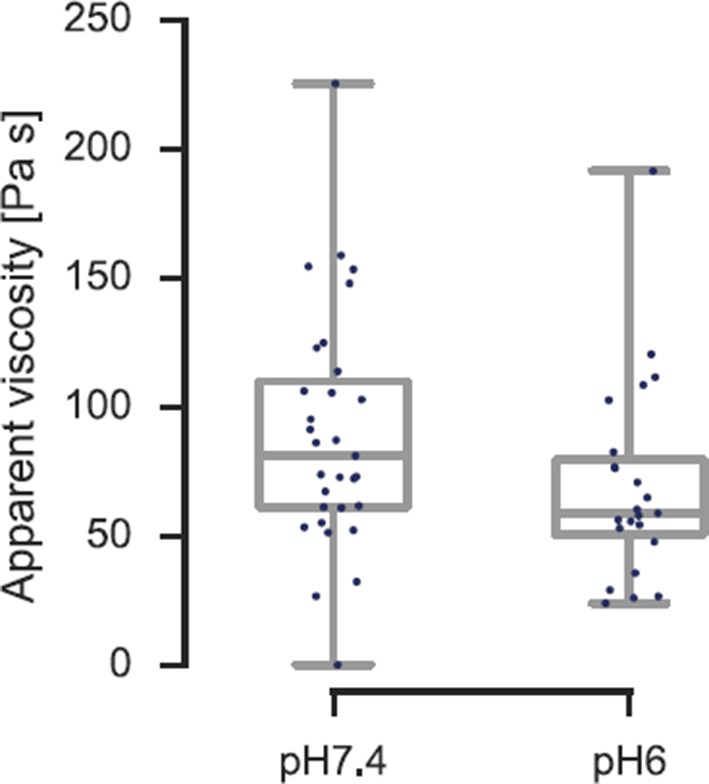
Viscosity of S. cerevisiae spheroplasts at pH 7.4 and pH 6.0 measured by AFM nano-indentation experiments and analyzed according to Rebelo et al.
The viscosity reduces from η= 90 ± 16 Pa s (mean ± SEM; N = 31; median is 81 Pa s) at pH 7.4 to η = 70 ± 14 Pa s (N = 23; median is 59 Pa s) at pH 6.0.
Author response image 6
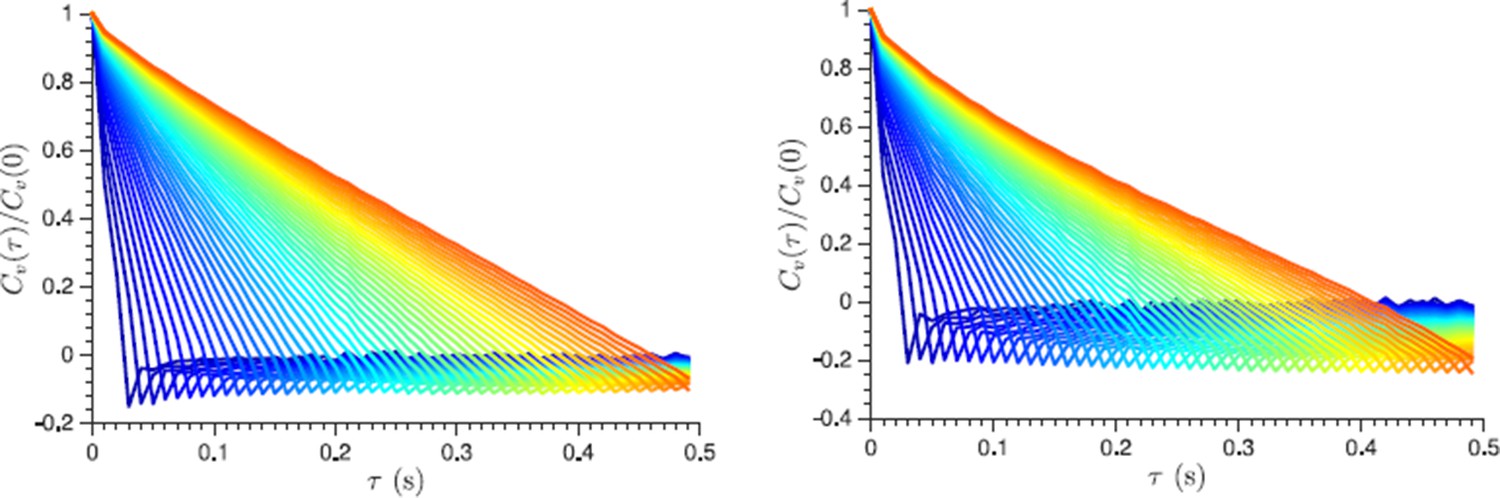
Normalized velocity autocorrelation function plotted for different lag times τ from 30 ms to 500 ms, which are used to define the velocity from the displacement data (the lag time change is color-coded from blue to red in steps of 10 ms).
Non-vanishing negative correlations indicate that they are not caused by a localization error. Left and right panels show log phase and energy depleted cells data respectively.
Videos
Video 1
Time-lapse microscopy of GFP-µNS particles moving in the S. cerevisiae cytoplasm.
To illustrate how particles explore the yeast cytoplasm over time, the fluorescence channel and the reference bright field channel were merged.
Video 2
Brightfield time-lapse microscopy of S. cerevisiae cells growing in a microfluidic flow chamber.
Cells were exposed to buffers of different pH containing 2 mM DNP as indicated.
Video 3
Fluorescence time-lapse microscopy of GFP-µNS expressing S. cerevisiae cells growing in a microfluidic flow chamber.
Cells were repeatedly exposed to buffers of different pH containing 2 mM DNP as indicated.
Video 4
Brightfield time-lapse microscopy of S. pombe cells during cell wall removal.
Cells were imaged in EMM5 medium containing glucose (control, left panel) or in EMM5 medium without glucose containing 20 mM 2-desoxyglucose (2DG) and 10 µM antimycin A (right panel). Cell wall removing enzyme mix was added immediately before the recording was started. Medium contained 1 M sorbitol to osmotically stabilize the cells.
Video 5
Brightfield time-lapse microscopy of S. pombe cells during cell wall removal.
Cells were imaged in phosphate buffer of pH 5.5 (right panel) and pH 7.4 (left) containing 2 mM DNP and 2% glucose. Cell wall removing enzyme mix was added after 30 min of imaging. Buffers contained 1 M sorbitol to osmotically stabilize the cells.
Video 6
Brightfield time-lapse microscopy of energy-depleted S. pombe cells during enzymatic cell wall removal.
Cells were energy-depleted in EMM5 medium (pH 6.0) without glucose supplemented with 20 mM 2-deoxyglucose and 10 μM antimycin A for 2 hr before imaging. Imaging was then done in cell wall removal buffer (phosphate buffer pH 6.0 containing 20 mM 2-deoxyglucose and 10 μM antimycin A as well as cell wall removal enzymes). Rod-like cells are slipping out of what seems to be a sheath of cell wall material without changing their shape.
Video 7
Brightfield time-lapse microscopy of a S. pombe spheroplast.
The spheroplast was generated prior to imaging in phosphate buffer of pH 6.0 containing 1 M sorbitol, 2 mM DNP and cell wall digesting enzyme mix and kept in this cell wall removal buffer for 4.5 hr. Directly before the start of the recording, the spheroplast was washed with EMM5 medium containing 1% glucose and 1 M sorbitol. Buffer and medium contained 1 M sorbitol to osmotically stabilize the spheroplast.
Video 8
Fluorescence time-lapse microscopy of Gcn3-GFP (left side) and GFP-µNS (right side) expressing yeast cells growing in a microfluidic flow chamber.
Cells were exposed to a phosphate buffer of pH 5.5 containing 2 mM DNP and 2% glucose as indicated.
Additional files
-
Supplementary file 1
List of strains used in this study.
- https://doi.org/10.7554/eLife.09347.039
-
Supplementary file 2
List of plasmids used in this study.
- https://doi.org/10.7554/eLife.09347.040
-
Supplementary file 3
Table with osmolality values of media and buffers.
- https://doi.org/10.7554/eLife.09347.041
Download links
A two-part list of links to download the article, or parts of the article, in various formats.
Downloads (link to download the article as PDF)
Open citations (links to open the citations from this article in various online reference manager services)
Cite this article (links to download the citations from this article in formats compatible with various reference manager tools)
A pH-driven transition of the cytoplasm from a fluid- to a solid-like state promotes entry into dormancy
eLife 5:e09347.
https://doi.org/10.7554/eLife.09347


