Oligomerization of p62 allows for selection of ubiquitinated cargo and isolation membrane during selective autophagy
- Max F. Perutz Laboratories, University of Vienna, Vienna Biocenter, Austria
Figures
Figure 1
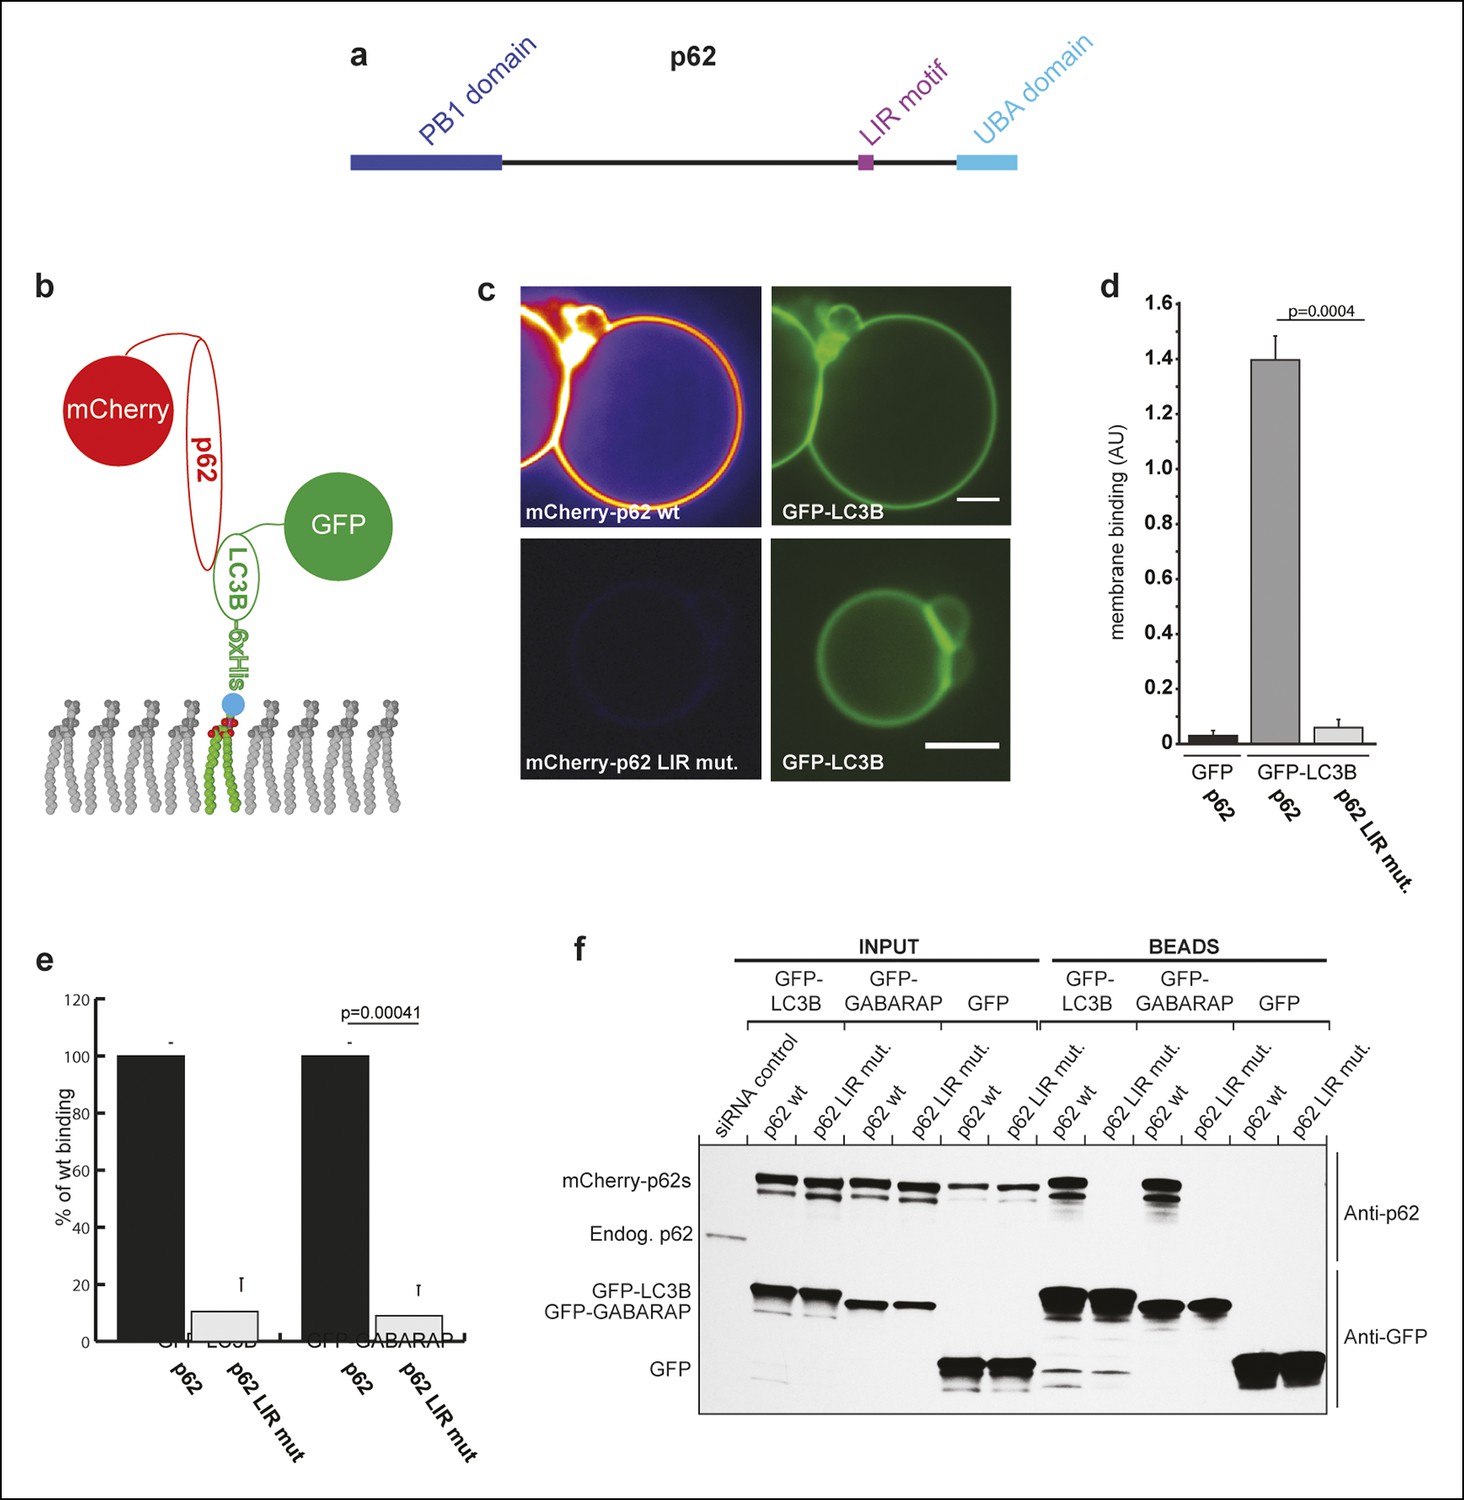
p62 has only one detectable LC3B/GABARAP-interaction motif.
(A) Schematic representation of the p62 domain architecture. (B) Scheme showing the experimental set-up of the assay. GFP-LC3B-6xHis or GFP-6xHis were tethered to giant unilamellar vesicles (GUVs) via nickel-lipids incorporated into the membranes. Recombinant wild-type or LIR mutant mCherry-p62 were added and their membrane recruitment was determined. (C) Representative images of GUVs incubated with GFP-LC3B-6xHis and mCherry-p62 wild-type or LIR mutant. The mCherry signal is shown in false color (ImageJ: fire). Scale bars, 5 µm. (D) Quantification of mCherry-p62 wild-type or LIR mutant membrane recruitment. Averages and SD from three independent experiments are shown. The p-value was determined using a two-tailed unpaired Student’s t-test. (E) Quantification of mCherry-p62 wild-type (black bars) or LIR mutant (gray bars) recruitment to GFP-LC3B-6xHis or GFP-GABARAP-6xHis coated GUVs. Data are normalized to the wild-type p62 binding intensity. The error bars are derived from three independent experiments. The p-value was determined using a two-tailed unpaired Student’s t-test. (F) Anti-GFP and anti-p62 western blots of input (8%) and bead (50%) fractions of a GFP-TRAP pull-down of HeLa cell lysates co-expressing GFP-LC3B, GFP-GABARAP, or GFP (control) and wild-type or LIR mutant mCherry-p62. The endogenous p62 was silenced by siRNA. The experiment was conducted twice. (D) Total GUVs counted per condition: GFP-LC3B-6xHis + mCherry-p62 wild-type = 163; GFP-LC3B-6xHis + mCherry-p62 LIR mutant = 152; GFP-6xHis + mCherry-p62 wild type = 254. (E) Total GUVs counted per condition: GFP-LC3B-6xHis + mCherry-p62 wild type = 636; GFP-LC3B-6xHis + mCherry-p62 LIR mutant = 642; GFP-GABARAP-6xHis + mCherry-p62 wild type = 336; GFP-GABARAP-6xHis + mCherry-p62 LIR mutant = 300.
Figure 2 with 3 supplements
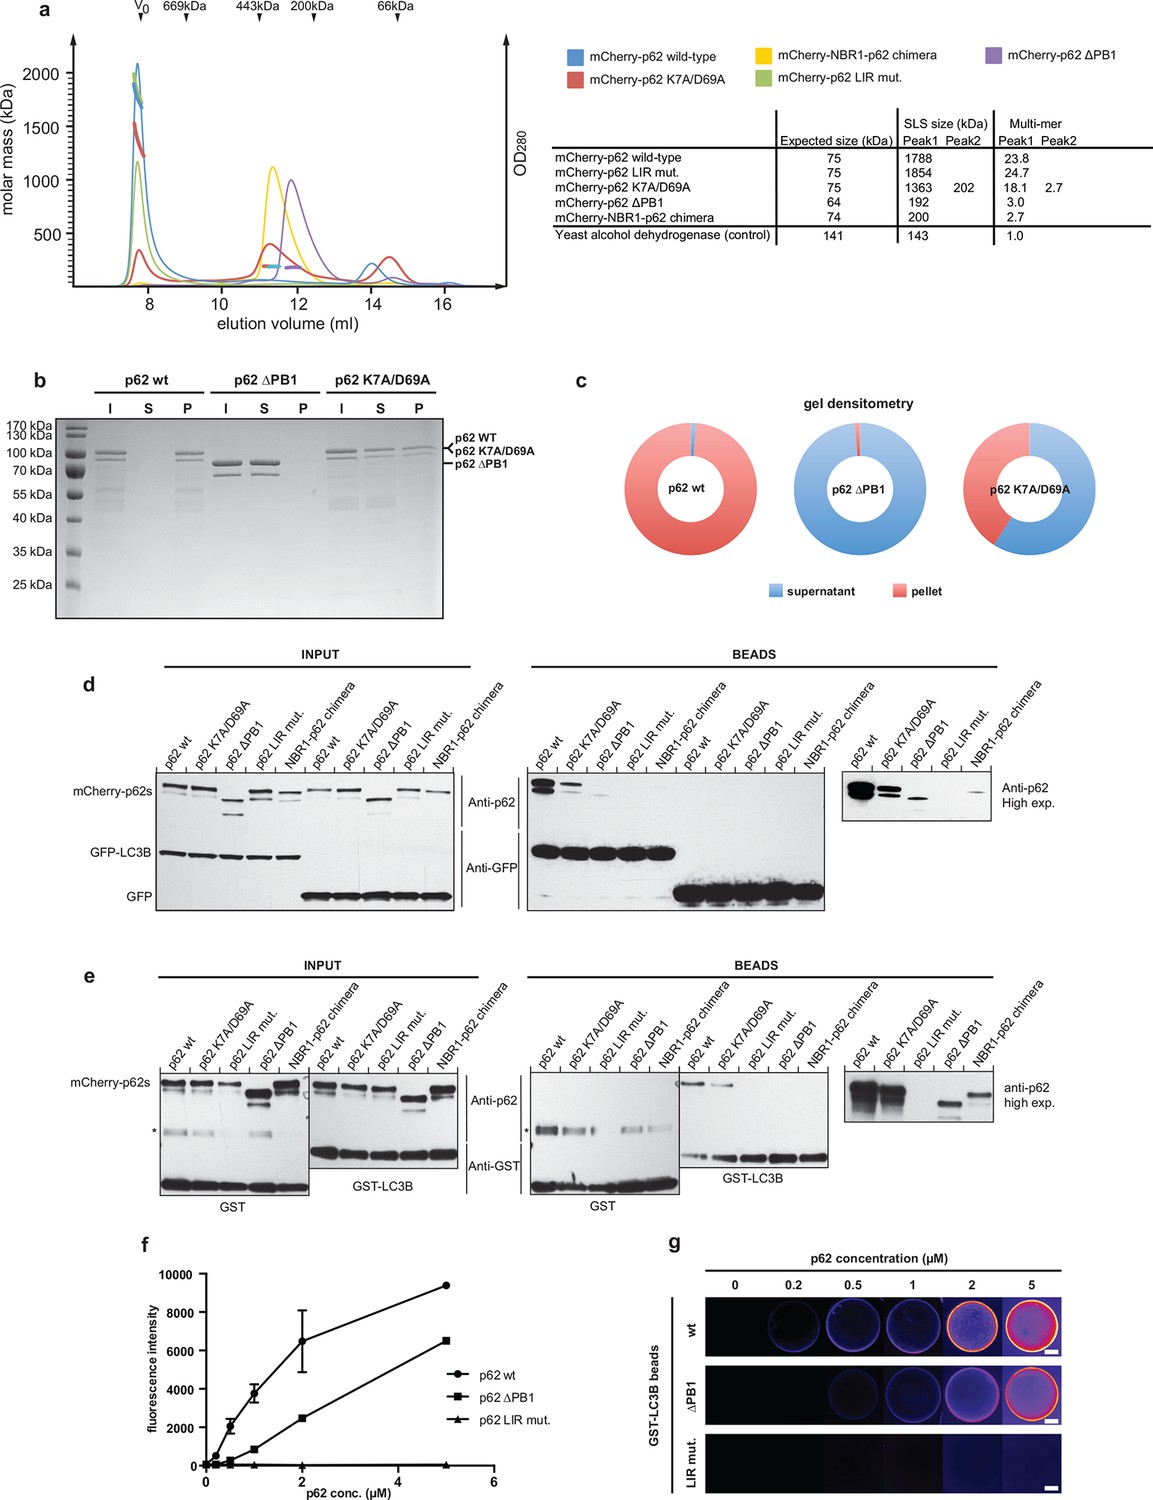
Oligomerization of p62 stabilizes binding to LC3B-coated surfaces.
(A) Size exclusion chromatography (SEC) and static light scattering (SLS) analysis of recombinant wild-type mCherry-p62, the LIR mutant and the oligomerization mutants (K7A/D69A, delta PB1, and NBR1-p62 chimera). The left Y-axis indicates the molecular weight of the protein as determined by SLS. The average sizes of the indicated peak areas obtained by SLS are shown in the table. See Figure 2 for gel. (B) Coomassie-stained gel showing a p62 sedimentation assay of recombinant mCherry-p62 wild-type, delta PB1, and K7A/D69A mutants. For each p62 variant input, supernatant and pellet fractions were loaded. (C) Quantification of the p62 sedimentation assay shown in (B). Amounts of p62 in the supernatant (blue) and pellet (red) are represented as fractions of the input. (D) Anti-GFP and anti-p62 western blot of input (8%) and bead (50%) fractions of a GFP-TRAP affinity purification of HeLa cell lysates co-expressing GFP-LC3B or GFP (control) and the mCherry-p62 variants. The endogenous p62 was silenced by siRNA treatment (Figure 2—figure supplement 2). A representative blot of four independent replicates is shown. (E) Anti-GST and anti-p62 western blot analysis of input (8%) and bead (16%) fractions of a pull-down experiment using GST-LC3B or GST (control) as bait and purified mCherry-p62 variants as prey. A representative blot of three independent replicates is shown. Asterisks denote dimeric GST. (F) Quantification of steady-state binding intensities of increasing concentration of wild-type, delta PB1, or the LIR mutant mCherry-p62 on GST-LC3B-coated beads. The average fluorescence intensity on the beads is plotted against the p62 concentration. Averages and SD of three independent experiments are shown. (G) Representative images of the experiment shown in (FSchematic represen). The mCherry signal is shown in false color (ImageJ: fire). (F) Total beads quantified: wild-type 0.2 µM = 187 - 0.5 µM = 198 - 1 µM = 180 - 2 µM = 175 - 5 µM = 73; p62 delta PB1 0.2 µM = 133 - 0.5 µM = 163 - 1 µM = 179 - 2 µM = 176 - 5 µM = 58; p62 LIR mutant 0.2 µM = 74 – 0.5 µM = 84 – 1 µM = 75 – 2 µM = 85 – 5 µM = 75.
Figure 2—figure supplement 1

(A) Coomassie-stained gel showing the peak fractions of wild-type mCherry-p62 and the K7A/D69A mutant after the size exclusion chromatography (SEC)/static light scattering (SLS) runs.
Corresponding peaks in Figure 2A are indicated. (B) Analytical SEC profiles of indicated mCherry-p62 variants run on a Superose 6 10/300 (GE Healthcare) column. Arrowheads indicate the elution volume of standard globular protein of indicated molar masses used for calibration. V0 was calibrated with 2MDa blue dextran.
Figure 2—figure supplement 2
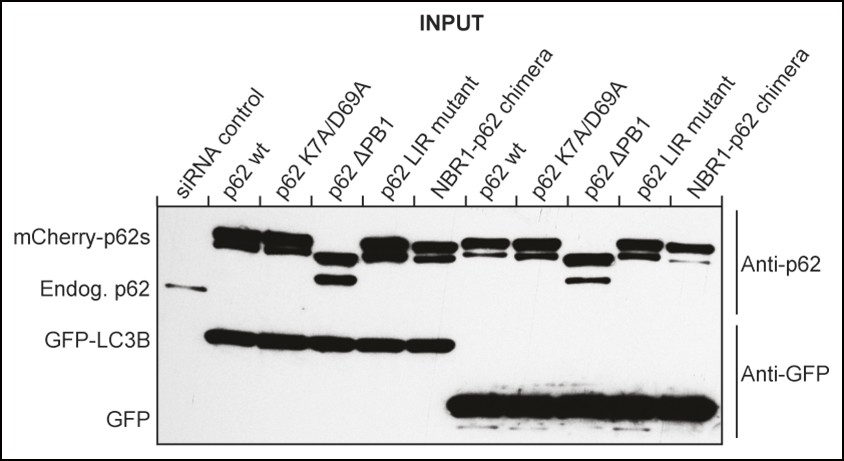
Western blot of samples shown in Figure 2D showing efficient siRNA-mediated silencing of endogenous p62 in mCherry-p62 co-transfected cells.
https://doi.org/10.7554/eLife.08941.006
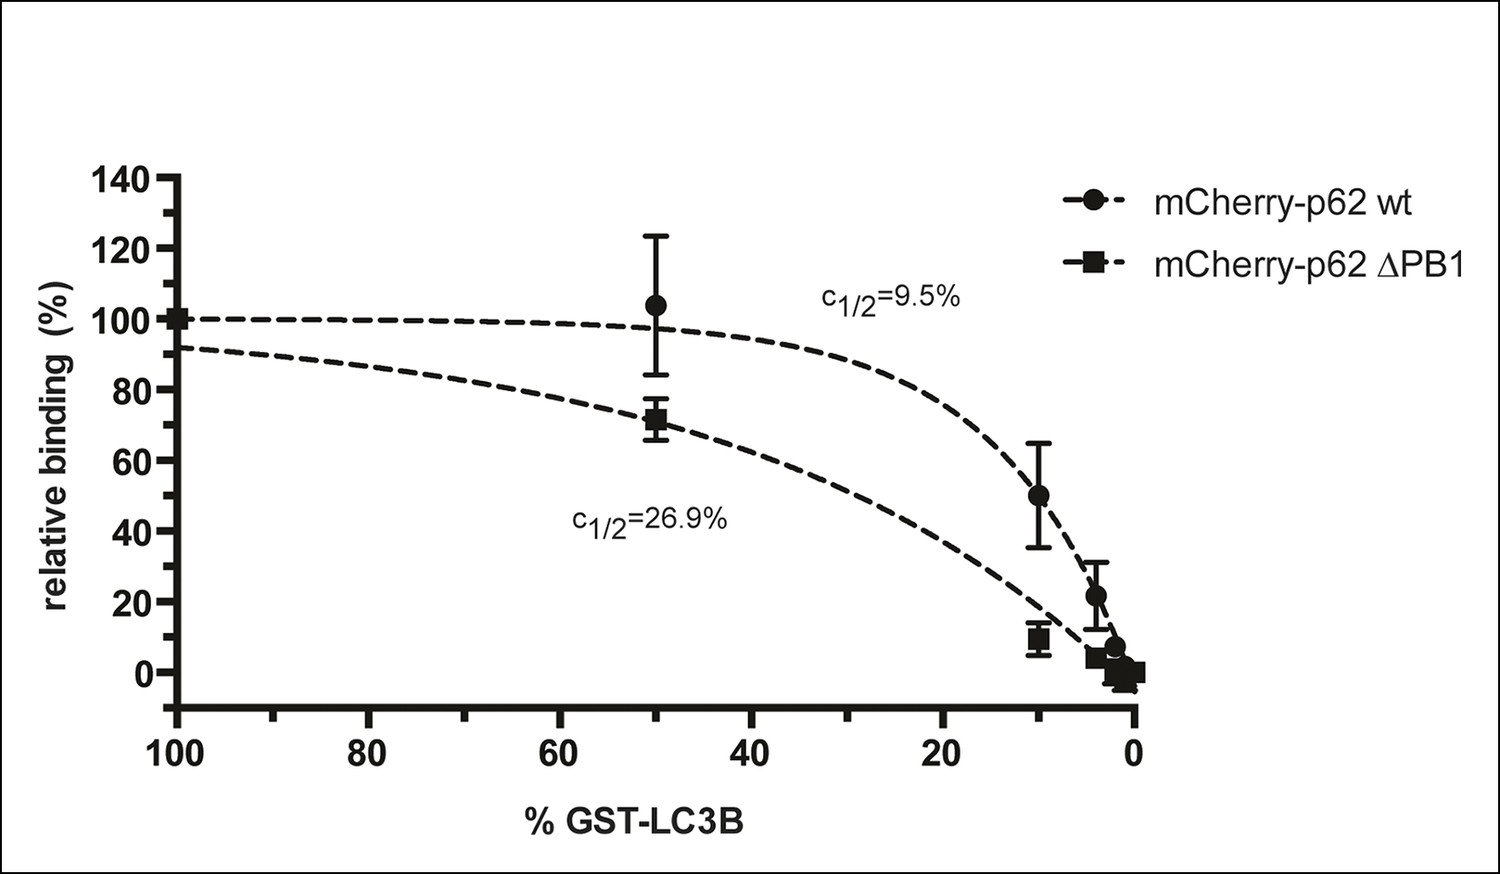
Figure 2—figure supplement 3
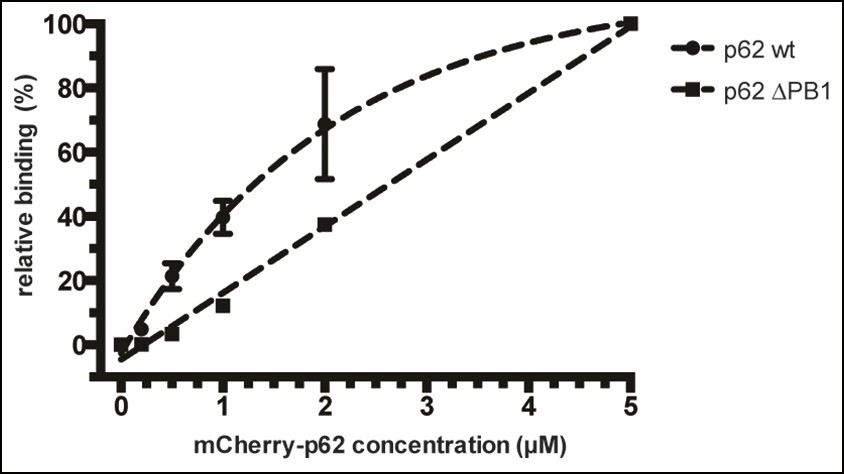
Relative fluorescence intensity plot of data shown in Figure 2F.
The data were normalized by setting the absolute binding of p62 at 5 µM to 100% in each sample. Absolute intensities of negative controls (beads coated with GST only) were set to 0% in each sample. Data points of wild-type mCherry-p62 and delta PB1 were fitted to a mono-exponential curve (R2 = 0.9976) and a line (R2 = 0.9942), respectively.
Figure 3 with 4 supplements
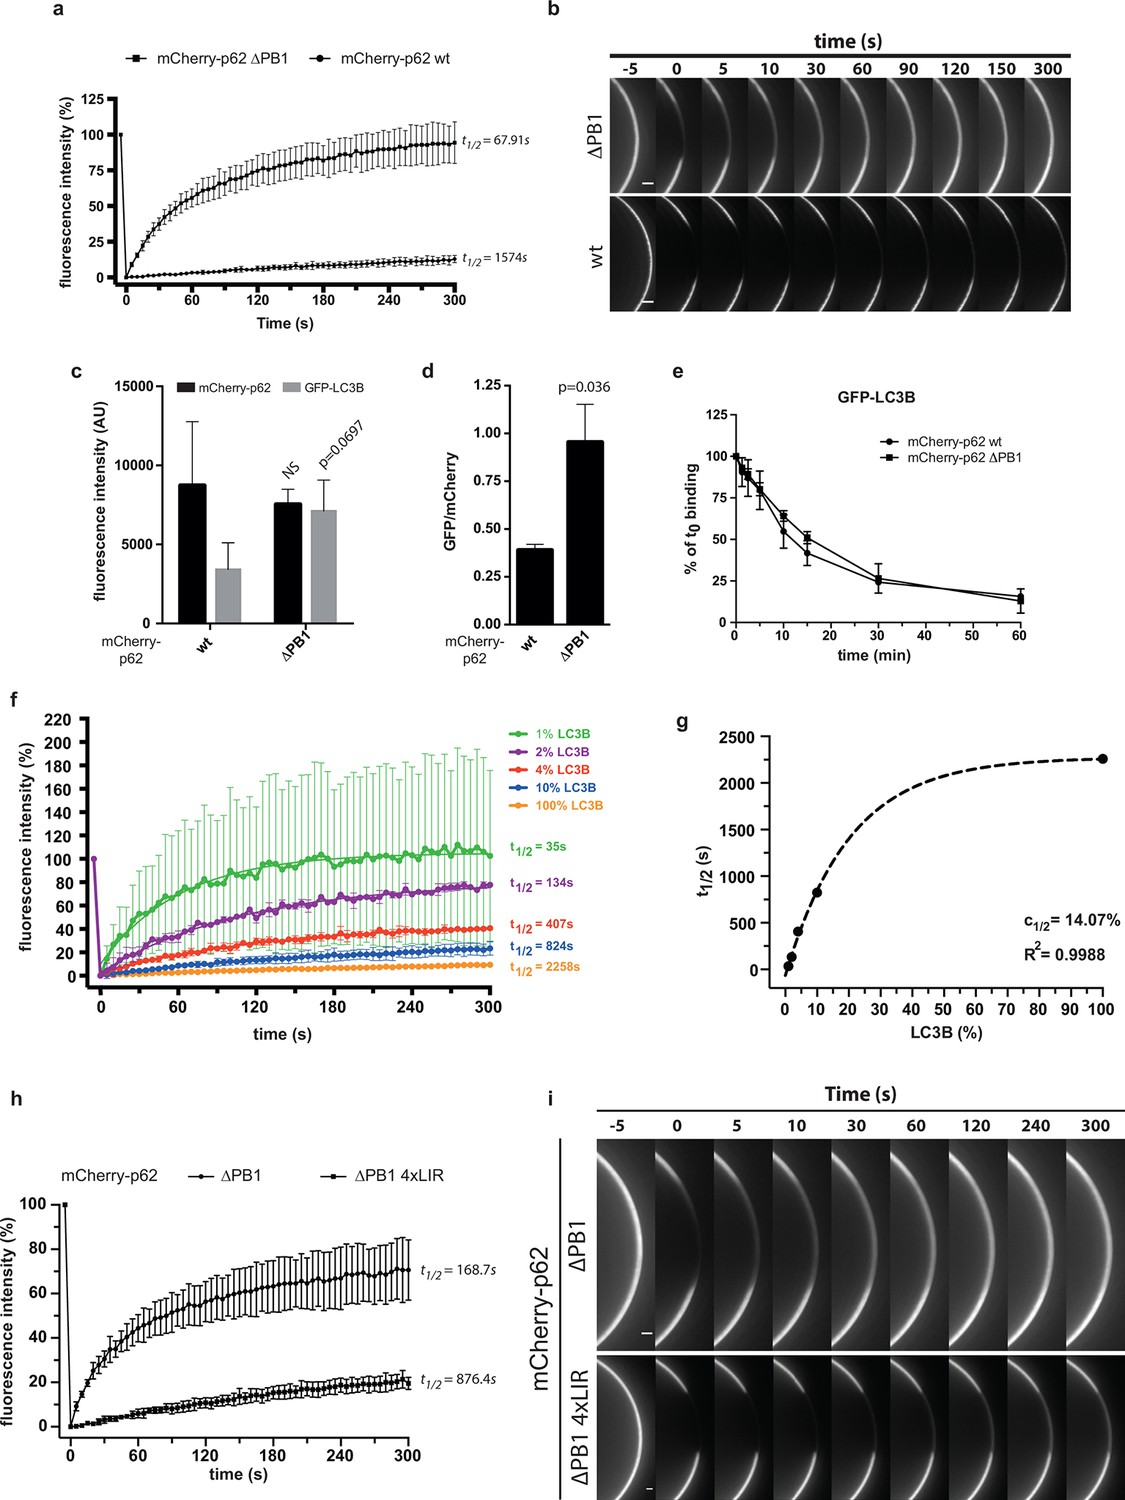
Oligomerization of p62 renders binding to concentrated LC3B irreversible.
(A) Fluorescence recovery after photo-bleaching (FRAP) curve of the indicated mCherry-p62 variants on GST-LC3B-coated beads. Averages and SD of at least three independent curves are shown. (B) Representative pictures for the data shown in (A). Scale bar 5 µm (C,D). Quantification of steady-state binding of indicated mCherry-p62 variants to RFP-TRAP beads and of subsequent GFP-LC3B recruitment to these beads. Absolute fluorescence intensities are shown in (C). A plot of GFP/mCherry ratio is shown in (D). Averages and SD of three independent replicates are shown. Indicated p-values were calculated with a two-tailed unpaired Student’s t-test. (E) Quantification of decay of GFP-LC3B fluorescence from RFP-TRAP beads coated with indicated mCherry-p62 variants. Averages and SD of two independent replicates are shown. (F) Fluorescence recovery (FRAP) curves of wild-type mCherry-p62 recruited to glutathione beads coated with decreasing amounts of GST-LC3B. Averages and SD of four independent curves per sample are shown. (G) Plot of extrapolated recovery half-times (t1/2) from (F) against the respective LC3B concentration on the beads. Data points were fitted to a mono-exponential equation. Robustness of the fit (R2) and the extrapolated half-maximal LC3B concentration (c1/2) are indicated. (H) FRAP curves of the indicated p62 variants on GST-LC3B coated beads. Averages and SD of four independent curves are shown. (I) Representative pictures for the graph shown in (H). Scale bar 20 µm. (C, D) Total beads quantified: wild type = 101, delta PB1 = 162. (E) Total beads quantified: wild type = 78, delta PB1 = 71. (Figure supplement 1) Total beads quantified: wild type = 98, delta PB1 = 133. (Figure supplement 2) Total beads quantified: wild type = 45, delta PB1 = 49. (Figure supplement 4) Total beads quantified per condition. Wild type: 0% LC3B = 150; 1% LC3B = 141; 2% LC3B = 130; 4% LC3B = 92; 10% LC3B = 119; 50% LC3B = 92; 100% LC3B = 132. delta PB1: 0% LC3B = 82; 1% LC3B = 123; 2% LC3B = 69; 4% LC3B = 66; 10% LC3B = 100; 50% LC3B = 93; 100% LC3B = 93.
Figure 3—figure supplement 1
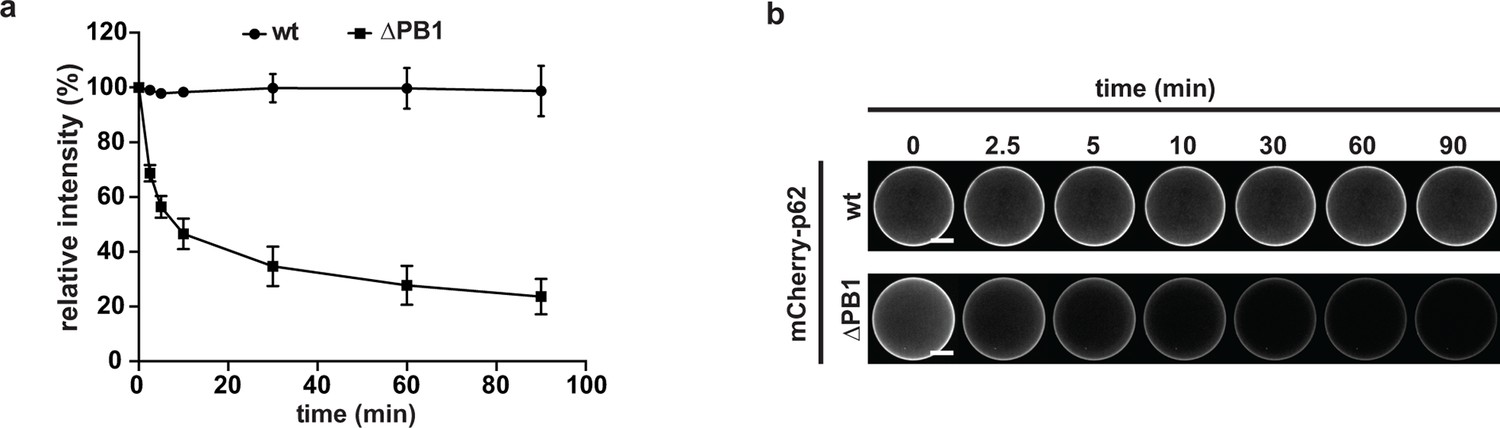
(A) Quantification of the decay of the indicated mCherry-p62 variants from GST-LC3B-coated beads.
Fluorescence intensities at T = 0 are set to 100%. Averages and SD of three independent replicates are shown. (B) Representative pictures for the data shown in (A). For better comparison, the brightness was adjusted so that intensities of beads at time 0 are identical. Scale bars, 25 μm.
Figure 3—figure supplement 2
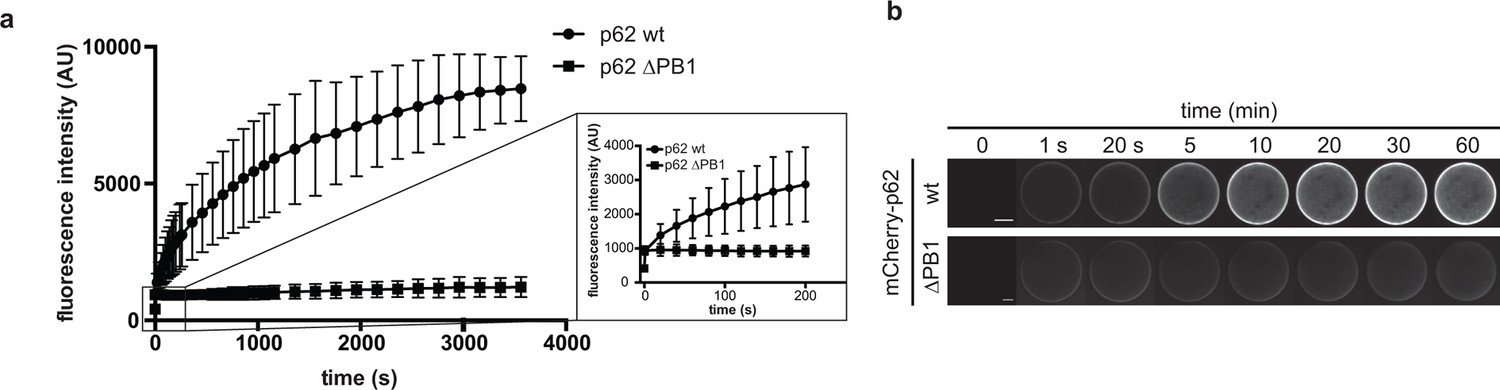
p62 association to GST-LC3B-coated beads.
(A) Quantification of wild-type mCherry-p62 or delta PB1 recruitment to GST-LC3B-coated beads over time. LC3B-coated beads were added to a 1 µM mCherry-p62 solution and the sample was immediately imaged by spinning disk microscopy. Samples were imaged every 20 s for 1 hr. The increase of mCherry-p62 fluorescence intensity on the beads is plotted against time. The inset on the right shows the increase in fluorescence intensity over the first 5 min for mCherry-p62 wild-type and delta PB1. (B) Representative images of the experiment in (A). The fluorescence intensity on a single bead over time for each p62 variant is shown. The brightness was adjusted so that the fluorescence intensities of the beads at 1 s time are identical.
Figure 3—figure supplement 3
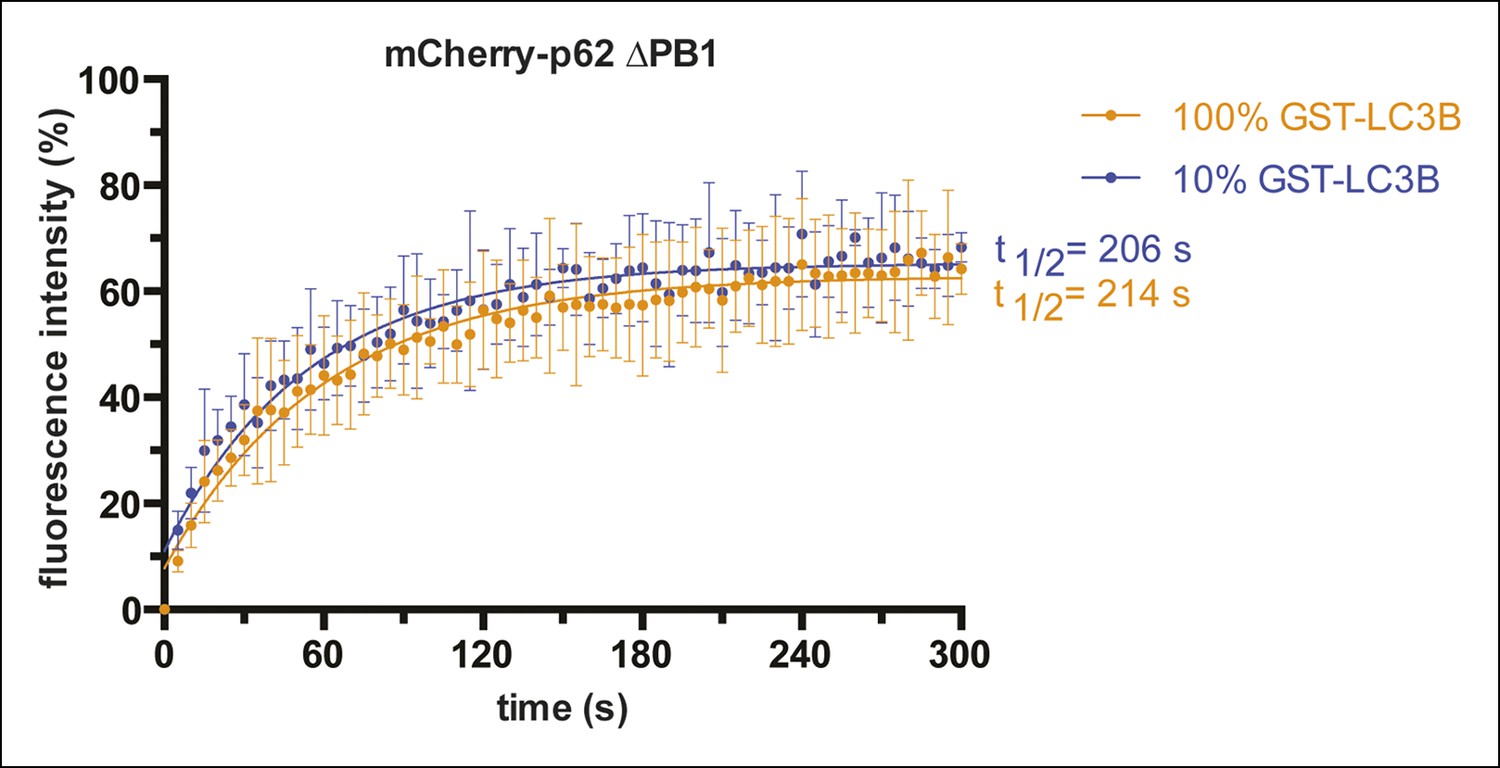
Fluorescence recovery after photo-bleaching (FRAP) curves of mCherry-p62 delta PB1 recruited to beads coated with the indicated GST-LC3B concentrations.
Averages and SD of two independent curves per sample are shown.
Figure 3—figure supplement 4
Steady-state binding of the indicated mCherry-p62 variants to beads coated with indicated GST-LC3B amounts.
mCherry-p62 variants were incubated at a concentration of 2 µM, 100% GST-LC3B is equivalent to 1.5 µg GST-LC3B per µL of beads as described in the Methods. GST only was used as negative control (0% GST-LC3B). Data are normalized to 100% GST-LC3B for each sample. Data points were fitted to single exponential curves with the plateau set to 100%. Concentrations of LC3B giving half-maximal binding (c1/2) are indicated.
Figure 4 with 1 supplement

Oligomerization of p62 promotes ubiquitin binding.
(A) GFP-TRAP experiment using HeLa cell lysates co-expressing GFP (control) or GFP-ubiquitin and the indicated mCherry-p62 variants. The endogenous p62 was silenced by siRNA treatment. Eight percent input and 100% of the bead fractions were analyzed by western blotting using anti-GFP and anti-p62 antibodies. (B) Scheme of the set-up of the experiment shown in (C) and (D) Recombinant GFP-ubiquitin was cross-linked to 2 µm latex beads and incubated with purified mCherry-p62 variants at 50 nM final concentration. Beads were observed using a spinning disk microscope under steady-state conditions. (C) Representative images of the recruitment of mCherry-p62 variants on GFP-ubiquitin-coated beads. Pictures were taken using the same microscopy settings and shown in false color for the mCherry-p62 signal (ImageJ: fire). Scale bar 1 μm. (D) Quantification of mCherry-p62 recruitment to beads coated with GFP-ubiquitin or GFP. Averages and SD of three independent replicates are shown. Indicated p-values were calculated with a two-tailed unpaired Student’s t-test. (E) Quantification of steady-state binding of the indicated p62 variants to the indicated ubiquitin chains cross-linked to 2 µm latex beads. Averages and SD of three independent replicates are shown. All data are normalized to wild-type mCherry-p62 binding to linear tetra-ubiquitin. p-Values were calculated using a two-tailed unpaired Student’s t-test.(F) Coomassie-stained gels showing p62 sedimentation assays conducted with recombinant wild-type mCherry-p62 in the presence of the indicated tetra-ubiquitin chains. GST was used as a negative control. For each sample, the input, supernatant, and pellet fractions are shown. Quantifications are shown below the gel. The protein amount in the pellets and supernatants are expressed as fractions of the input. (G) Quantification of steady-state binding of the indicated p62 variants to beads coated with GST-mono-, di- or –tetra-ubiquitin. GST was used as negative control. Averages and SD of at least three independent experiments are shown. Data are normalized to wild-type mCherry-p62 binding to GST-tetra-ubiquitin. Data points were fitted to mono-exponential curves (dashed lines). (H) p62 co-sedimentation assay with increasing concentrations of linear tetra-ubiquitin. Wild-type mCherry-p62 was incubated with linear tetra-ubiquitin chains at the indicated molar ratios before ultracentrifugation. Inputs, supernatants and pellets were analyzed by SDS-PAGE followed by Coomassie staining. Quantification was performed as described for (F). (I) Fluorescence recovery after photo-bleaching (FRAP) curves of wild-type mCherry-p62 recruited to mono-ubiquitin or tetra-ubiquitin-coated beads. Averages and SD of six independent FRAP recordings are shown. (J) FRAP curves of wild-type mCherry-p62 recruited to beads coated with decreasing concentrations of mono-ubiquitin. For each sample, the averages and SD from six independent FRAP recordings are shown. (K) Quantification of wild-type and delta PB1 mCherry-p62 decay from GST-di-ubiquitin-coated beads. Averages and SD of three independent replicates are shown. (L) Representative images of data shown in (K). For better comparison, brightness was adjusted so that intensities of beads at time 0 is identical. Scale bars, 25 μm. (D) Total beads counted per condition: GFP-ub coated beads + mCherry-p62 wild-type = 565; GFP-ub coated beads + mCherry-p62 K7A/D69A = 383; GFP-ub coated beads + mCherry-p62 delta PB1 = 378; GFP-ub coated beads + mCherry-NBR1-p62 chimera = 476; GFP-ub coated beads + mCherry-p62 LIR mutant = 393; GFP-ub coated beads + mCherry-p62 ∆UBA = 347; GFP coated beads + mCherry-p62 wild-type = 187.(E) Total beads quantified per condition: mCherry-p62 WT: M1 4xUB = 427; K48 4xUB = 332; K63 4xUB = 305; mock = 95. mCherry-p62 delta PB1: M1 4xUB = 266; K48 4xUB = 239; K63 4xUB = 226; mock = 75.(G) Total beads quantified per condition: mCherry-p62 wild-type: GST = 107; GST-mono-ubiquitin = 182; GST-di-ubiquitin = 149; GST-tetra-ubiquitin = 236. mCherry-p62 delta PB1) GST = 113; GST-mono-ubiquitin = 165; GST-di-ubiquitin = 134; GST-tetra-ubiquitin = 241. (K) Total beads quantified: wild-type = 83, delta PB1 = 65.
Figure 4—figure supplement 1
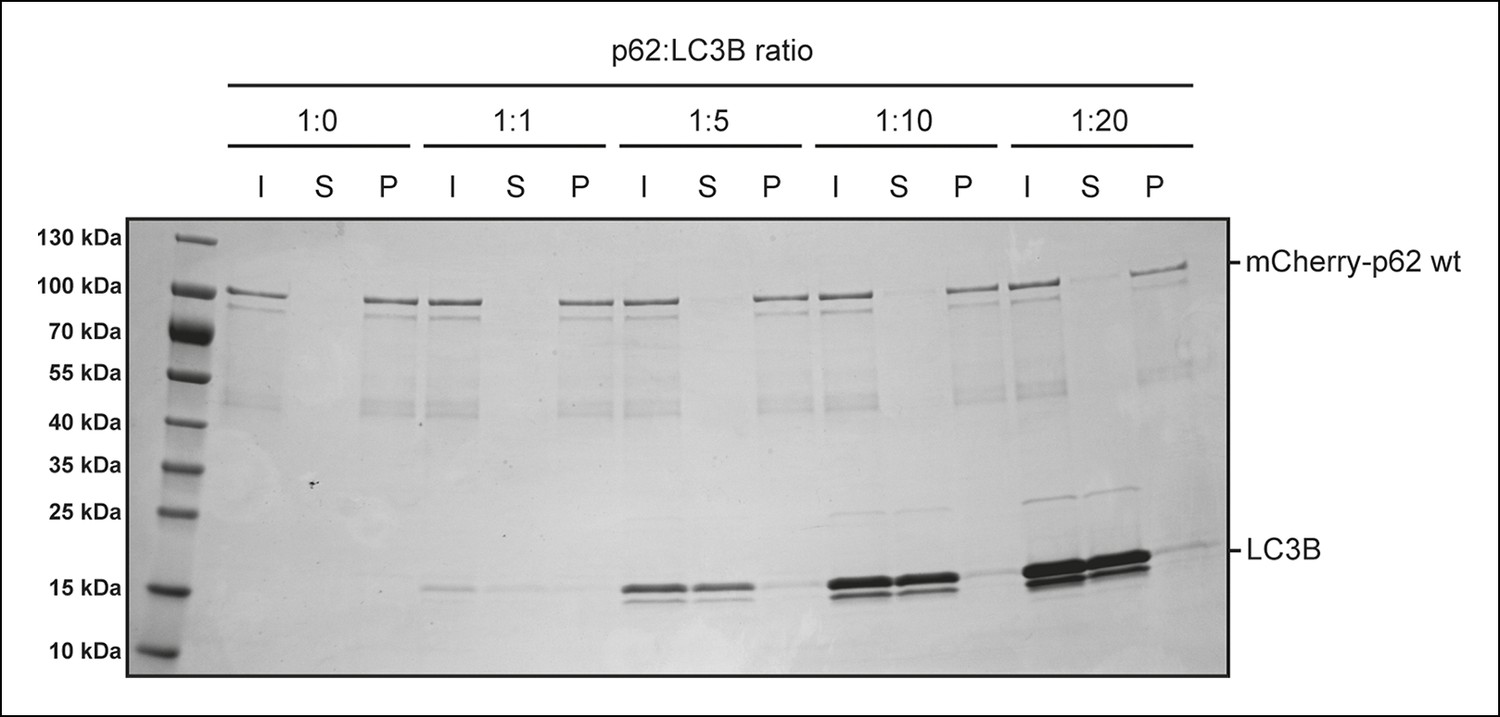
p62-LC3B co-sedimentation assay.
Wild-type mCherry-p62 was incubated with LC3B at the indicated p62:LC3B ratios for 1 hr. After ultracentrifugation, input, supernatant and pellet fractions were analyzed by SDS-PAGE followed by Coomassie staining.
Figure 5 with 1 supplement
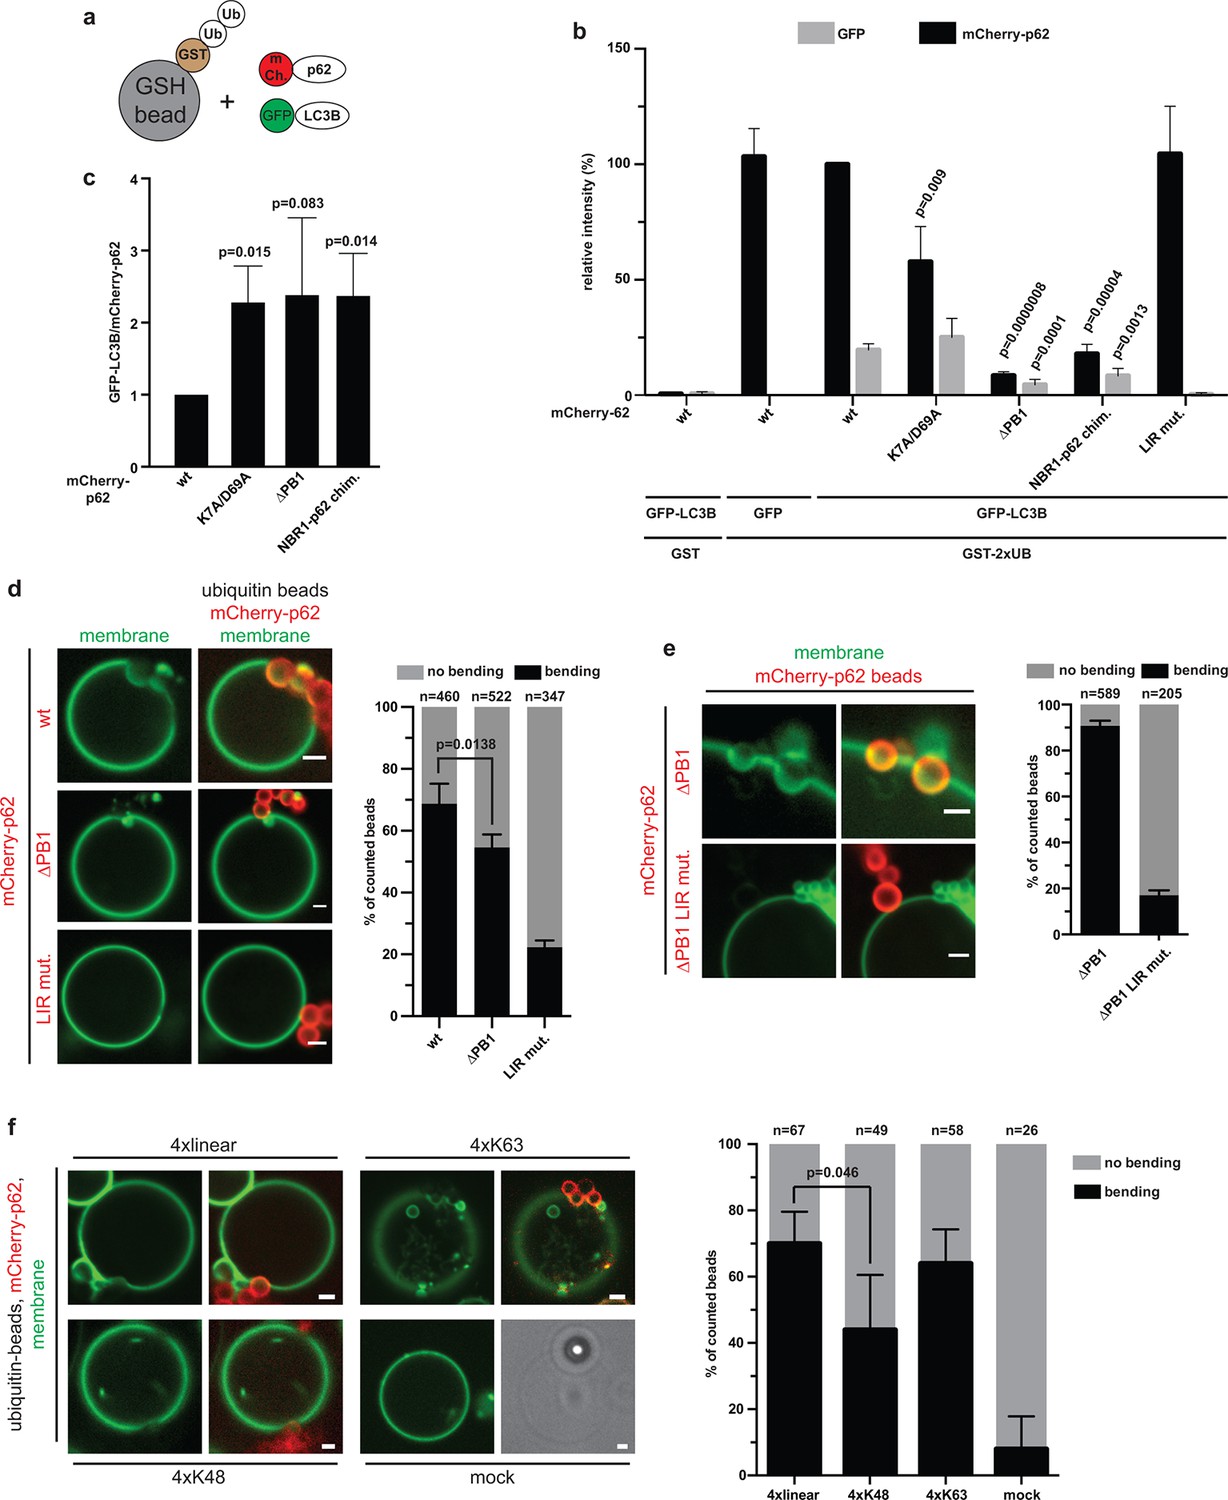
Reconstitution of p62–mediated membrane bending.
(A–C) Indirect recruitment of GFP-LC3B to GST-di-ubiquitin coated beads via mCherry-p62. (A) Scheme of the experiment. GST-di-ubiquitin was pre-recruited to glutathione agarose beads. Beads were co-incubated with mCherry-p62 variants and GFP or GFP-LC3B. Imaging was performed at equilibrium. (B) Quantification of mCherry and GFP intensities on the beads (see Figure 5—figure supplement 1 for representative pictures). All values are plotted as percentages of the wild-type mCherry-p62 intensity. Averages and SD of four independent replicates are shown. Indicated p-values were calculated with a two-tailed unpaired Student’s t-test. p-Values above black bars refer to the mCherry-p62 wild-type bar; p-values above gray bars refer to the GFP-LC3B intensity in the wild-type mCherry-p62 sample. (C) Plot of GFP/mCherry ratio of data shown in (B). The ratio for wild-type mCherry-p62 was normalized to 1. All p-values were calculated with a two-tailed unpaired Student’s t-test. (D) Quantification and representative pictures of LC3B-positive giant unilamellar vesicle (GUV) membranes bending around 2 µm glutathione beads coated with GST-tetra-ubiquitin and incubated with the indicated mCherry-p62 variants. Averages and SD of four independent experiments are shown. The indicated p-value was calculated with a two-tailed unpaired Student’s t-test. n numbers indicate the total number of beads quantified per sample. Scale bars, 2 µm. (E) Quantification and representative pictures of LC3B-positive GUV membranes bending around 2 µm latex beads cross-linked with the indicated mCherry-p62 variants. Averages and SD of three independent experiments are shown. n numbers indicate the total number of beads quantified per sample. Scale bars, 2 µm. (F) Quantification and representative pictures of LC3B-positive GUV membranes bending around 2 µm latex beads cross-linked with the indicated ubiquitin chains and incubated with wild-type mCherry-p62. Averages and SD of four independent experiments are shown. The indicated p-value was calculated with a two-tailed unpaired Student’s t-test. n numbers indicate the total amount of beads counted per sample. Scale bars, 2 µm. (B) Total beads counted per condition: GST + mCherry-p62 wild type + GFP-LC3B = 101, GST-2xUB + mCherry-p62 wild type + GFP = 125, GST-2xUB + mCherry-p62 wild type + GFP-LC3B = 174, GST-2xUB + mCherry-p62 DM + GFP-LC3B = 172, GST-2xUB + mCherry-p62 delta PB1 + GFP-LC3B = 154, GST-2xUB + mCherry-NBR1-p62 chimera + GFP-LC3B = 153, GST-2xUB + mCherry-p62 LIR mut + GFP-LC3B = 129.
Figure 5—figure supplement 1
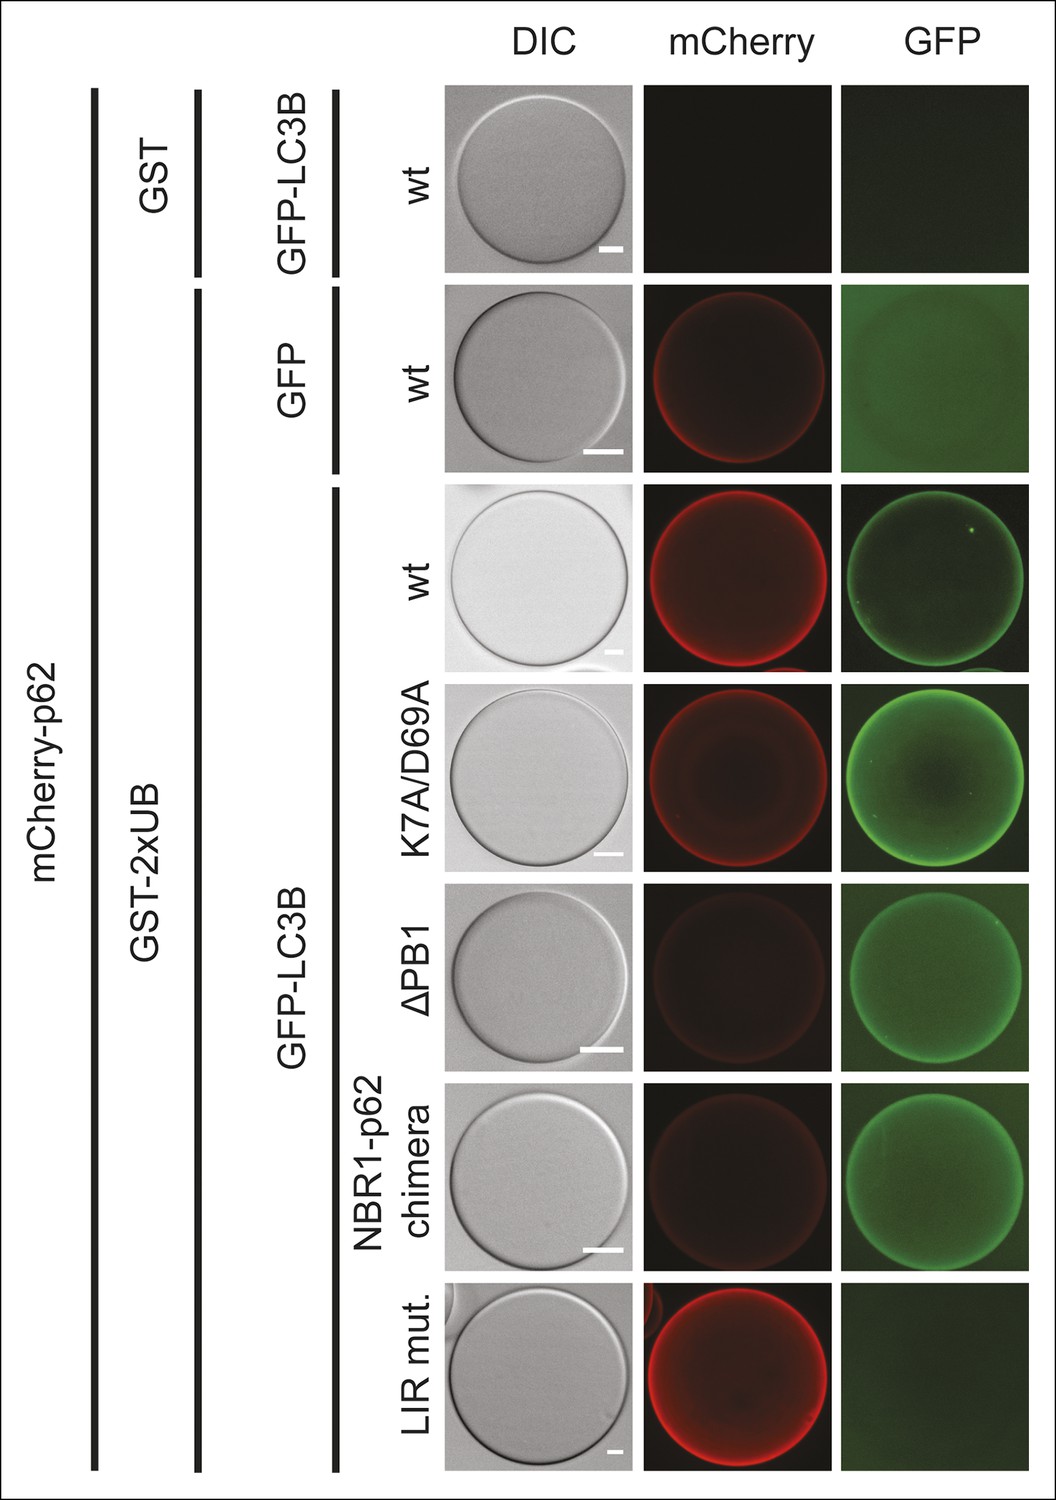
Representative pictures of the data shown in Figure 5B.
Scale bars, 20 µm.
Figure 6 with 1 supplement

Oligomerization of p62 promotes recruitment of p62 and LC3B to ubiquitin-coated beads in HeLa cells.
(A) Anti-LC3B immunofluorescence analysis of HeLa cells transiently transfected with mCherry-p62 variants. Nuclei were stained with DAPI. Insets show magnifications of the indicated squares. Scale bars, 5 µm. (B–G) Quantification of mCherry-p62 and GFP-LC3B recruitment around artificial cargo particles in HeLa cells. (B) Schematic outline of the experiment. (C) Western blot analysis of HeLa cell lysates overexpressing wild–type mCherry-p62 with or without silent mutations in the siRNA targeting region. (D) HeLa cell co-expressing siRNA resistant wild-type mCherry-p62 and GFP-LC3B. Endogenous p62 was silenced by siRNA (see Figure 6—figure supplement 1). The arrows indicate co-localization of mCherry-p62 and GFP-LC3B at a BFP-ubiquitin-coated 2 µm bead. Scale bar: 5 µm. (E) Quantification of mCherry-p62 variants localizing to BFP-ubiquitin-coated beads in mCherry-p62 and GFP-LC3B co-expressing cells. (F) Quantification of co-localization of mCherry-p62 variants and GFP-LC3B at BFP-ubiquitin-coated beads. (G) Quantification of GFP-LC3B localization to BFP-ubiquitin-coated beads. For all data in (D–G), averages and SD of three independent replicates are shown. Indicated p-values were calculated by a two-tailed equal-variance Student’s t-test. All graphs show the averages and SD. (E–G) Total beads quantified per condition: wild-type = 113 beads, K7A/D69A = 145 beads, delta PB1 = 117 beads, NBR1-p62 chimera = 120 beads, mCherry = 144 beads.
Figure 6—figure supplement 1
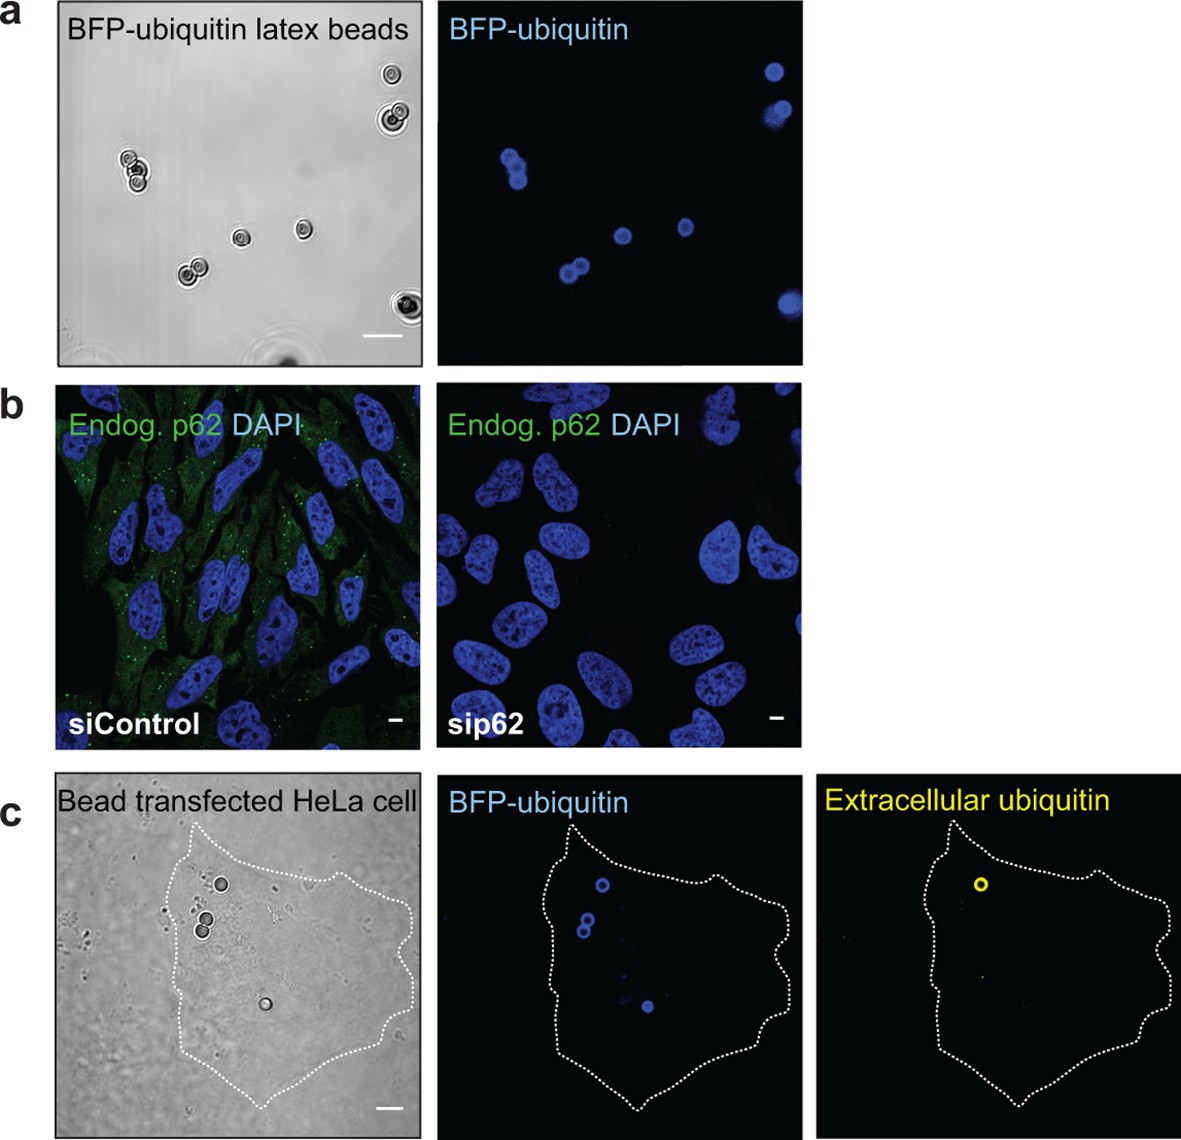
(A) Representative picture of 2 µm latex beads cross-linked with BFP-ubiquitin.
Left: differential interference contrast; right: BFP fluorescence. (B) Immunofluorescence of HeLa cells transfected with a scramble siRNA (left) or a siRNA against p62 (right). Cells were stained with an antibody against endogenous p62. Nuclei were counterstained with DAPI. (C) Immunofluorescence of HeLa cells incubated with BFP-ubiquitin-coated beads. Non-permeabilized cells were stained with an antibody against ubiquitin, so that only non-internalized beads are labeled. The dashed lines indicate the cell’s contour. All scale bars, 5 µm.
Figure 7 with 2 supplements
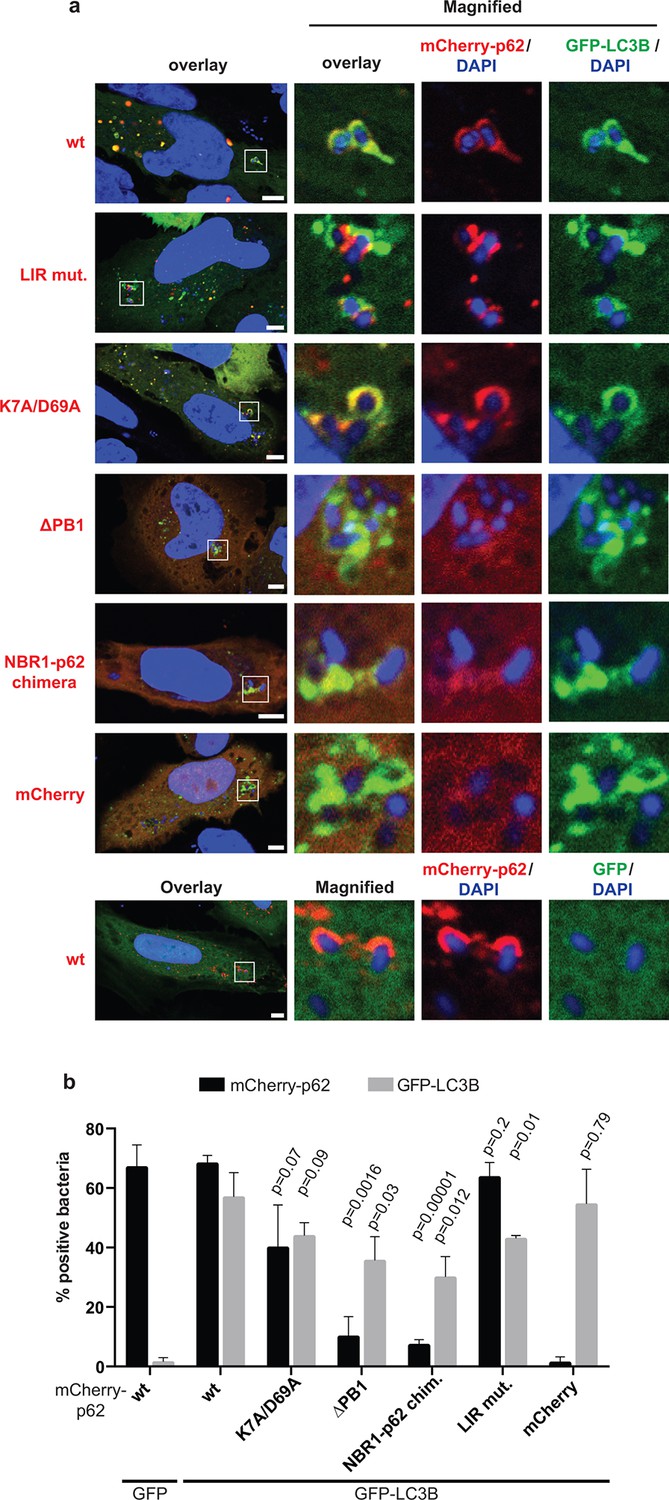
Oligomerization of p62 is required for efficient recruitment of p62 to Salmonella typhimurium in HeLa cells.
(A) Representative pictures of HeLa cells co-expressing GFP-LC3B and mCherry-p62 infected with S. typhimurium. The endogenous p62 was silenced by siRNA. Magnifications of the insets are shown on the right. Pictures of whole cells are shown in Figure 7—figure supplement 1. Scale bars, 5 µm. (B) Quantification of mCherry-p62- and/or GFP-LC3B-positive bacteria. Averages and SD of three independent replicates are shown. Indicated p-values were calculated with a two-tailed unpaired Student’s t-test. Values above the black bars refer to the wild-type mCherry-p62 value in the wild-type mCherry-p62 + GFP-LC3B sample; values above the gray bars refer to the GFP-LC3B value in the same sample. (B) Total bacteria counted per condition: mCherry-p62 wild-type + GFP-LC3B = 245, mCherry-p62 K7A/D69A + GFP-LC3B = 337, mCherry-p62 LIR + GFP-LC3B = 287, mCherry-p62 delta PB1 + GFP-LC3B = 296, mCherry-NBR1-p62 chimera + GFP-LC3B = 292, mCherry + GFP-LC3B = 318, mCherry-p62 wild-type + GFP = 325
Figure 7—figure supplement 1
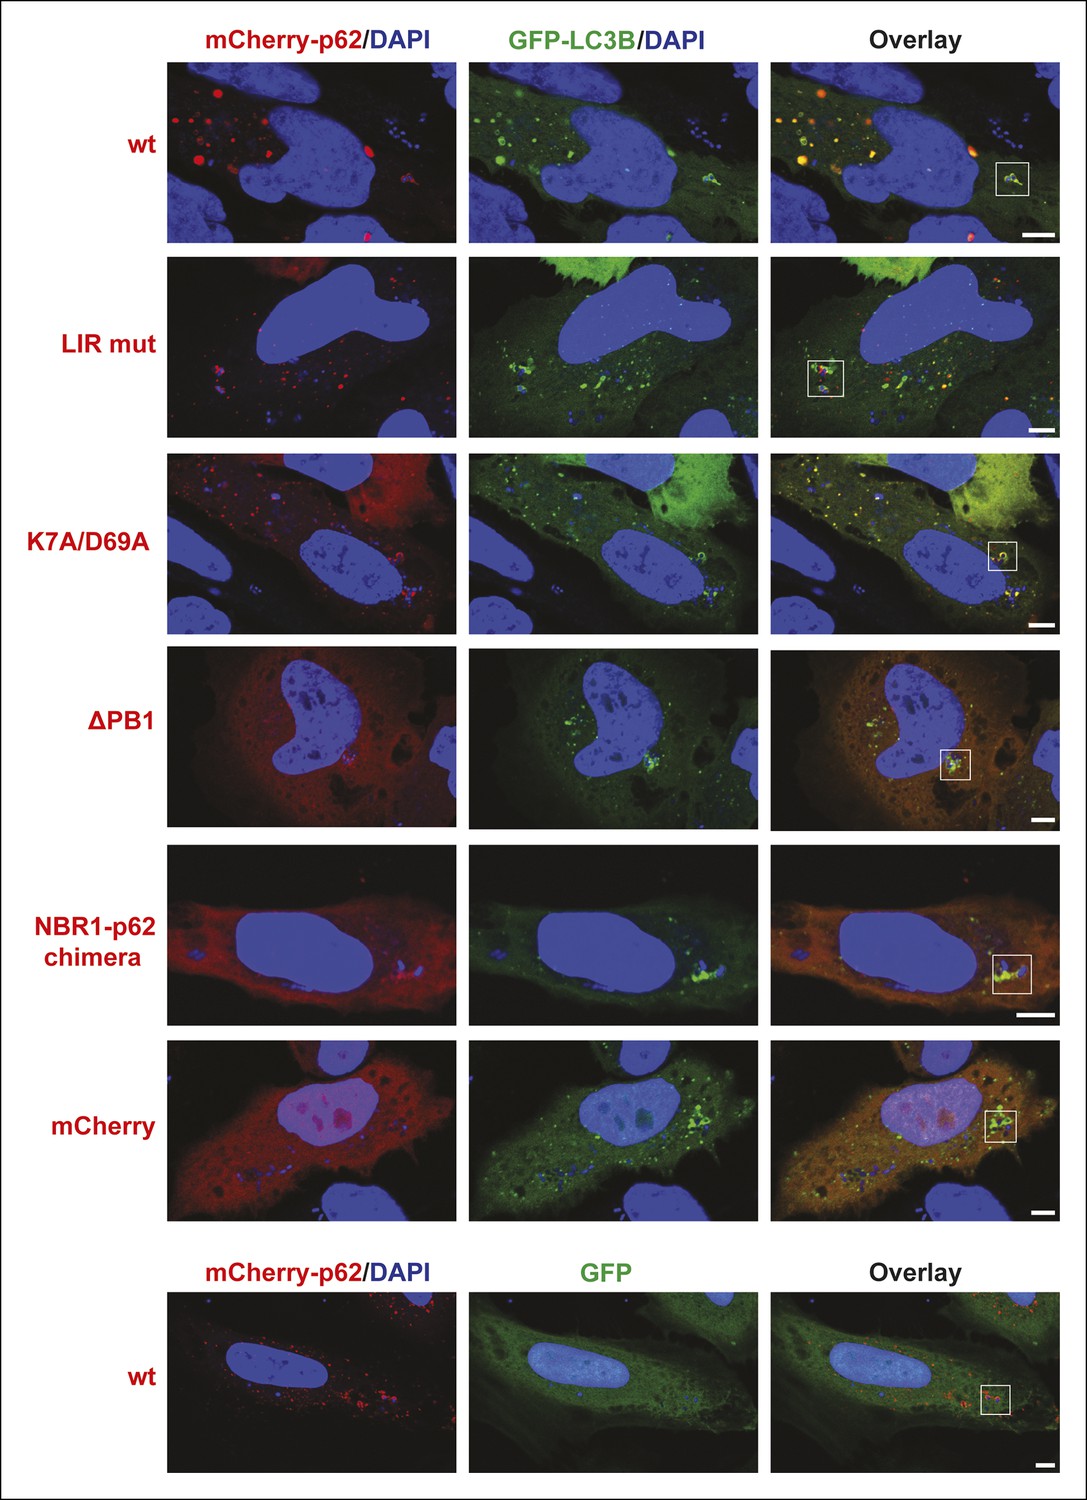
Full-size pictures of the data shown in Figure 7A.
White squares indicate cropped regions shown in the main figure. Scale bars, 5 µm.
Figure 7—figure supplement 2
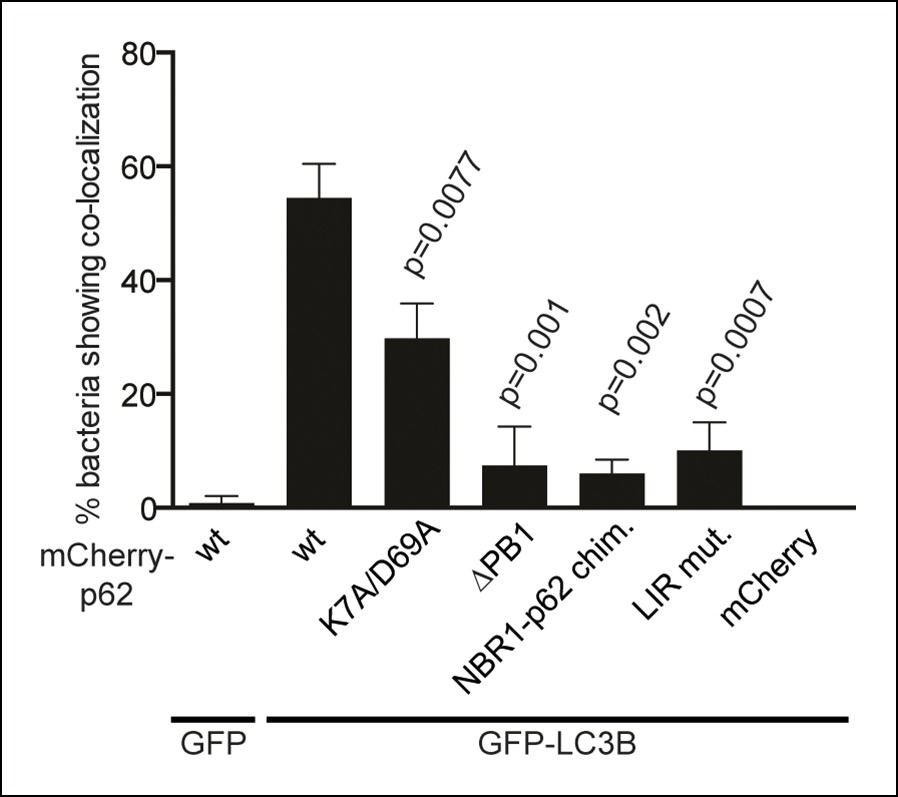
Quantification of co-localization of the indicated mCherry-p62 variants and GFP-LC3B at bacteria.
p-Values refer to mCherry-p62 wild-type + GFP-LC3B sample.
Figure 8
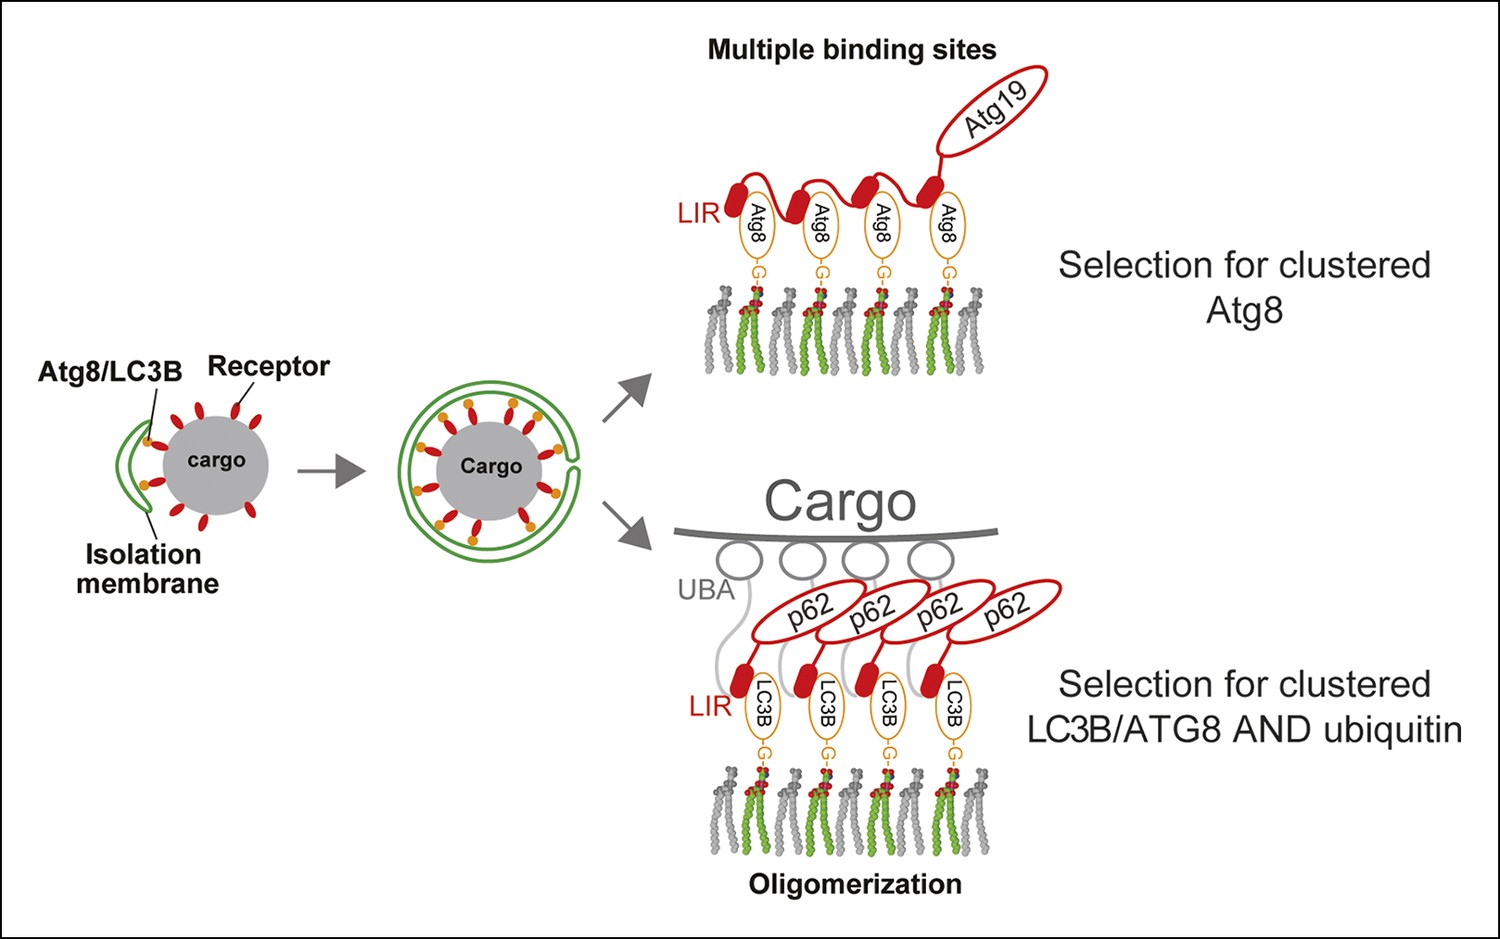
A model for selective autophagy in yeast and mammalian cells.
Multiple binding sites in the yeast cargo receptor Atg19 promote selective and exclusive engulfment of cargo material by Atg8-covered membranes (Sawa-Makarska et al., 2014). Oligomerization of p62 allows it to simultaneously select for clustered ubiquitin and ATG8-family proteins.
Download links
A two-part list of links to download the article, or parts of the article, in various formats.
Downloads (link to download the article as PDF)
Open citations (links to open the citations from this article in various online reference manager services)
Cite this article (links to download the citations from this article in formats compatible with various reference manager tools)
Oligomerization of p62 allows for selection of ubiquitinated cargo and isolation membrane during selective autophagy
eLife 4:e08941.
https://doi.org/10.7554/eLife.08941


