Amotl2a interacts with the Hippo effector Yap1 and the Wnt/β-catenin effector Lef1 to control tissue size in zebrafish
- Albert Ludwigs University of Freiburg, Germany
Figures
Figure 1 with 1 supplement
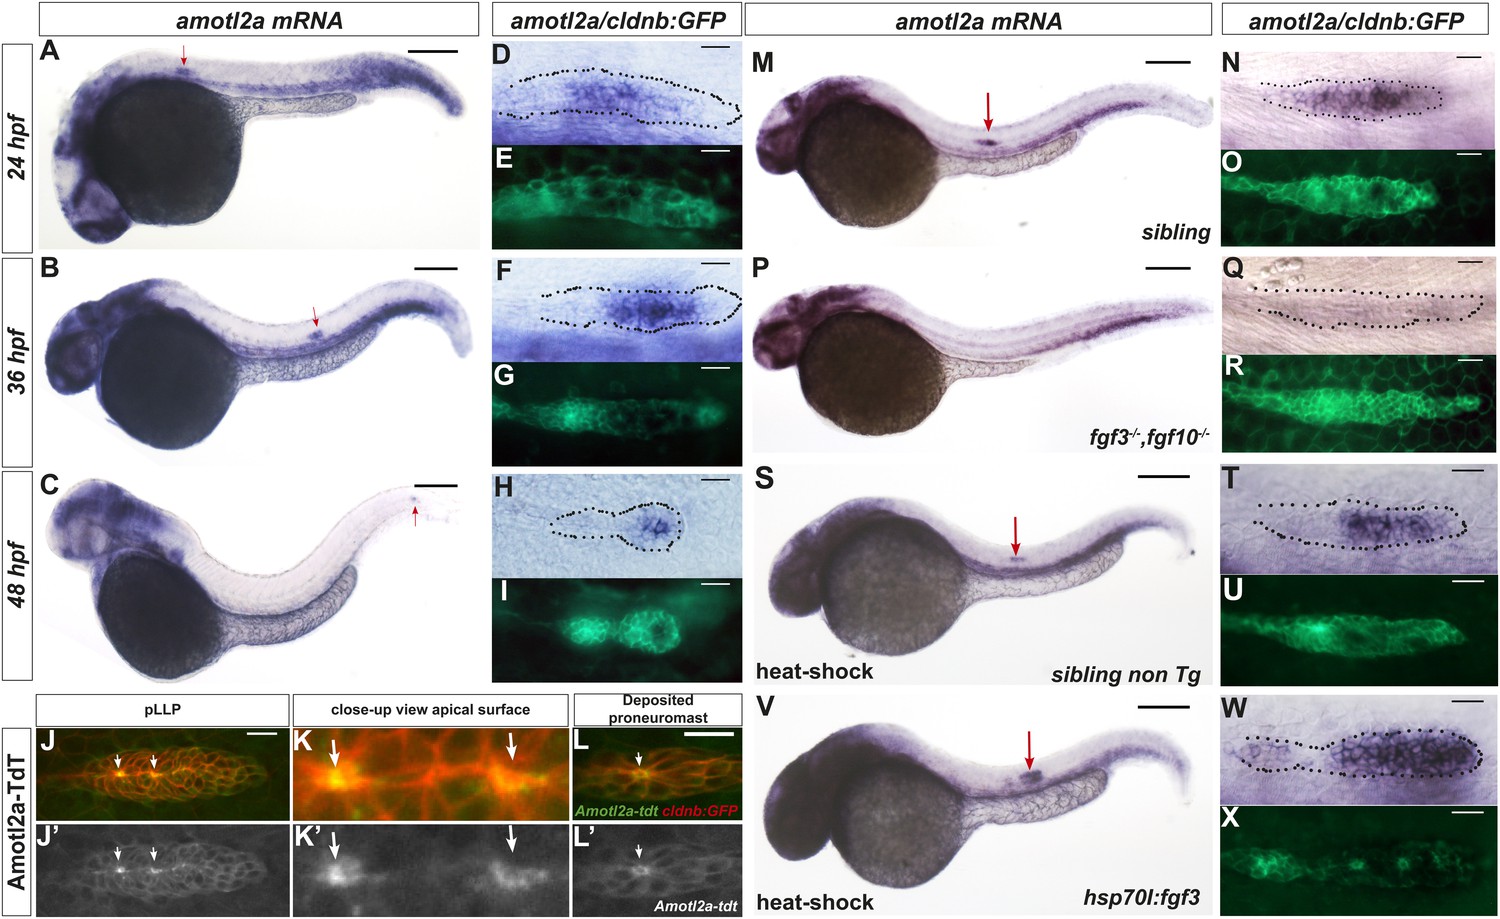
amotl2a is expressed in the pLLP and localizes at the cell apical side.
(A–I) cldnb:gfp embryos stained with an amotl2a antisense RNA probe and an anti-GFP antibody (E, G, I) at the indicated stages. Red arrows indicate the posterior lateral line primordium (pLLP). (D–I) Close-up views of the pLLP. (J–L′) Maximum intensity projection (MIP) of Z-stacks of the pLLP (J–J′) and a recently deposited neuromast (L–L′) in cldnb:gfp embryos injected with amotl2a-TdT mRNA. (K–K′) Close-up views of (J–J′). White arrows indicate rosette centers. Colors have been inverted. (M–X) 30 hpf cldnb:gfp embryos stained with an amotl2a in situ hybridization (ISH) probe and an anti-GFP antibody (O, R, U, X) in the indicated genetic background. The right column shows the primordium at higher magnification. In all figures, scale bars correspond to 200 μm for whole-embryo images and 20 μm in close up views of the pLLP. In all figures, n is the total number of embryos/primordia analysed and N is the number of biological replicates (Figure 1—figure supplement 1, Figure 1—source data 1).
-
Figure 1—source data 1
Relative length of the amotl2a-free (Excel sheet 1 related to panel J) and amotl2a-expressing domain (Excel sheet related to panel K).
- https://doi.org/10.7554/eLife.08201.004
Figure 1—figure supplement 1
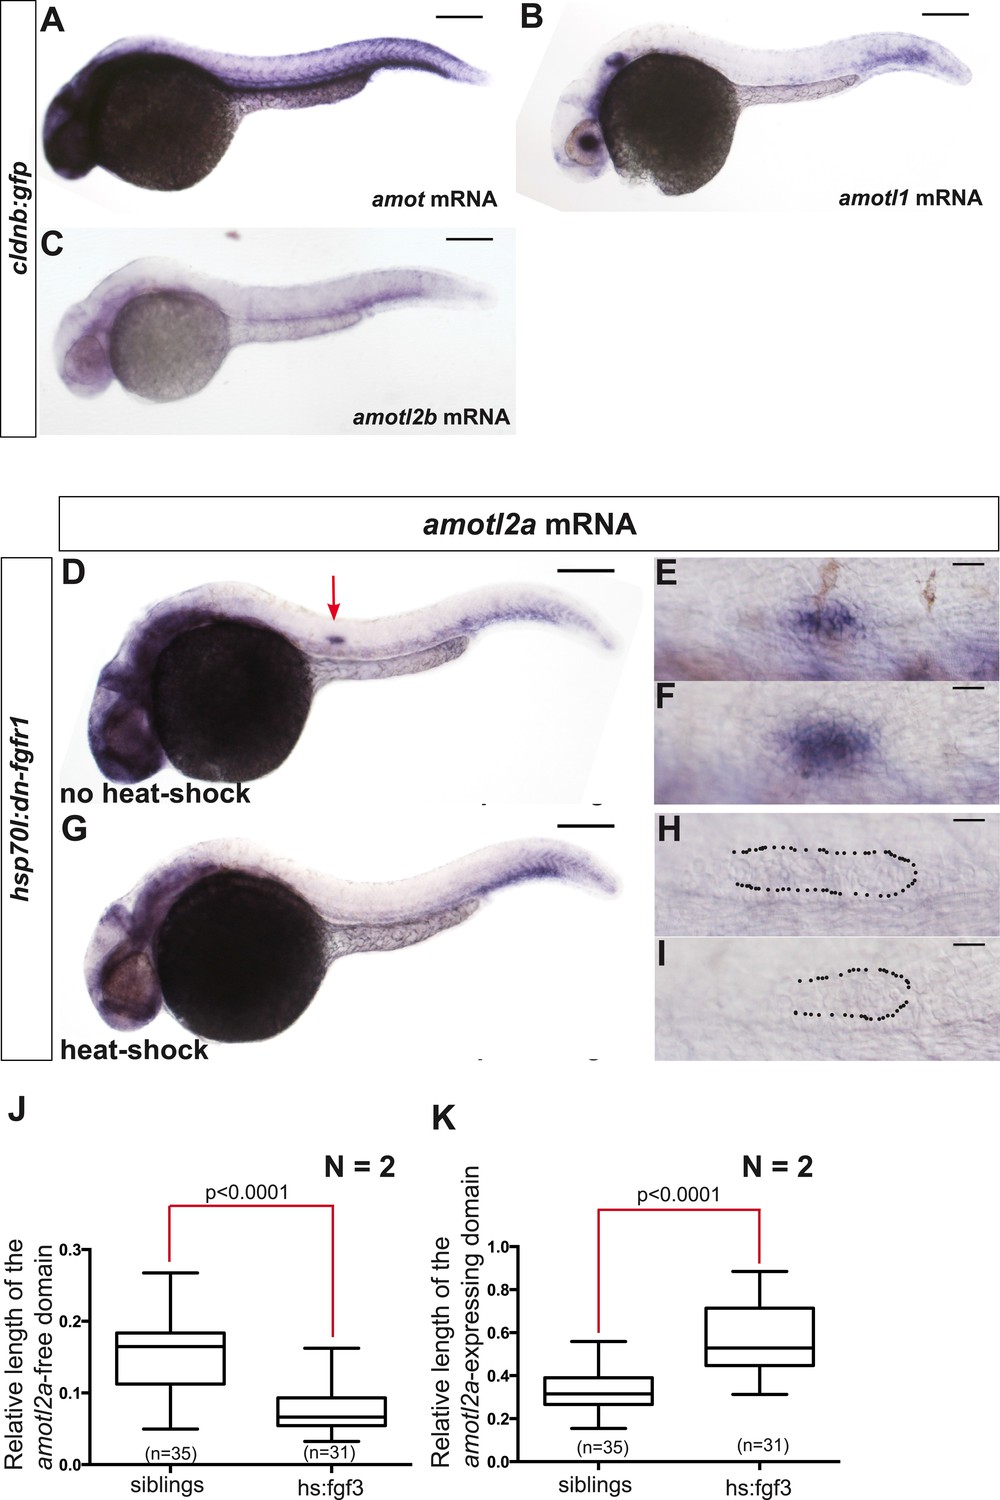
Only amotl2a is expressed in the pLLP and its expression is controlled by FGF signaling.
(A–C) ISH staining with probes against amot (A), amotl1 (B), and amotl2b (C) in cldnb:gfp embryos. (D–I) ISH staining with an amotl2a probe in Tg(hsp70l:dnfgfr1EGFP)pdl embryos non-heat-shocked (D–F) or heat-shocked (G–I). The red arrow points to the pLLP. The dotted lines indicate the pLLP contour. (J, K) Boxplots showing the comparison of the relative length of the amotl2a-free domain (J) and of the amotl2a-expressing domain (K) between the indicated groups (Figure 1—source data 1).
Figure 2 with 2 supplements

Amotl2a is not essential for proneuromast assembly but for proper migration.
(A–F) MIP of Z-stacks of pLLP stained with ZO-1 (blue) and GFP (green) antibodies and phalloidin (red) in control (A, C, E) and amotl2a morphant (B, D, F) cldnb:gfp embryos at 30 hpf. (G, H) MIP of overview images of control (G) and amotl2a morphant (H) embryos after completion of migration. (I, J) Snapshots of time-lapse movies at the indicated timepoints showing a delay in migration in amotl2a morphants (J) as compared to controls (I). (K, L) Corresponding kymographs used to measure the migration speed. (M) Boxplot comparing the migration speeds (Figure 2—source data 1, Figure 2—figure supplements 1, 2).
-
Figure 2—source data 1
Migration speed in amotl2a morphants.
- https://doi.org/10.7554/eLife.08201.007
Figure 2—figure supplement 1
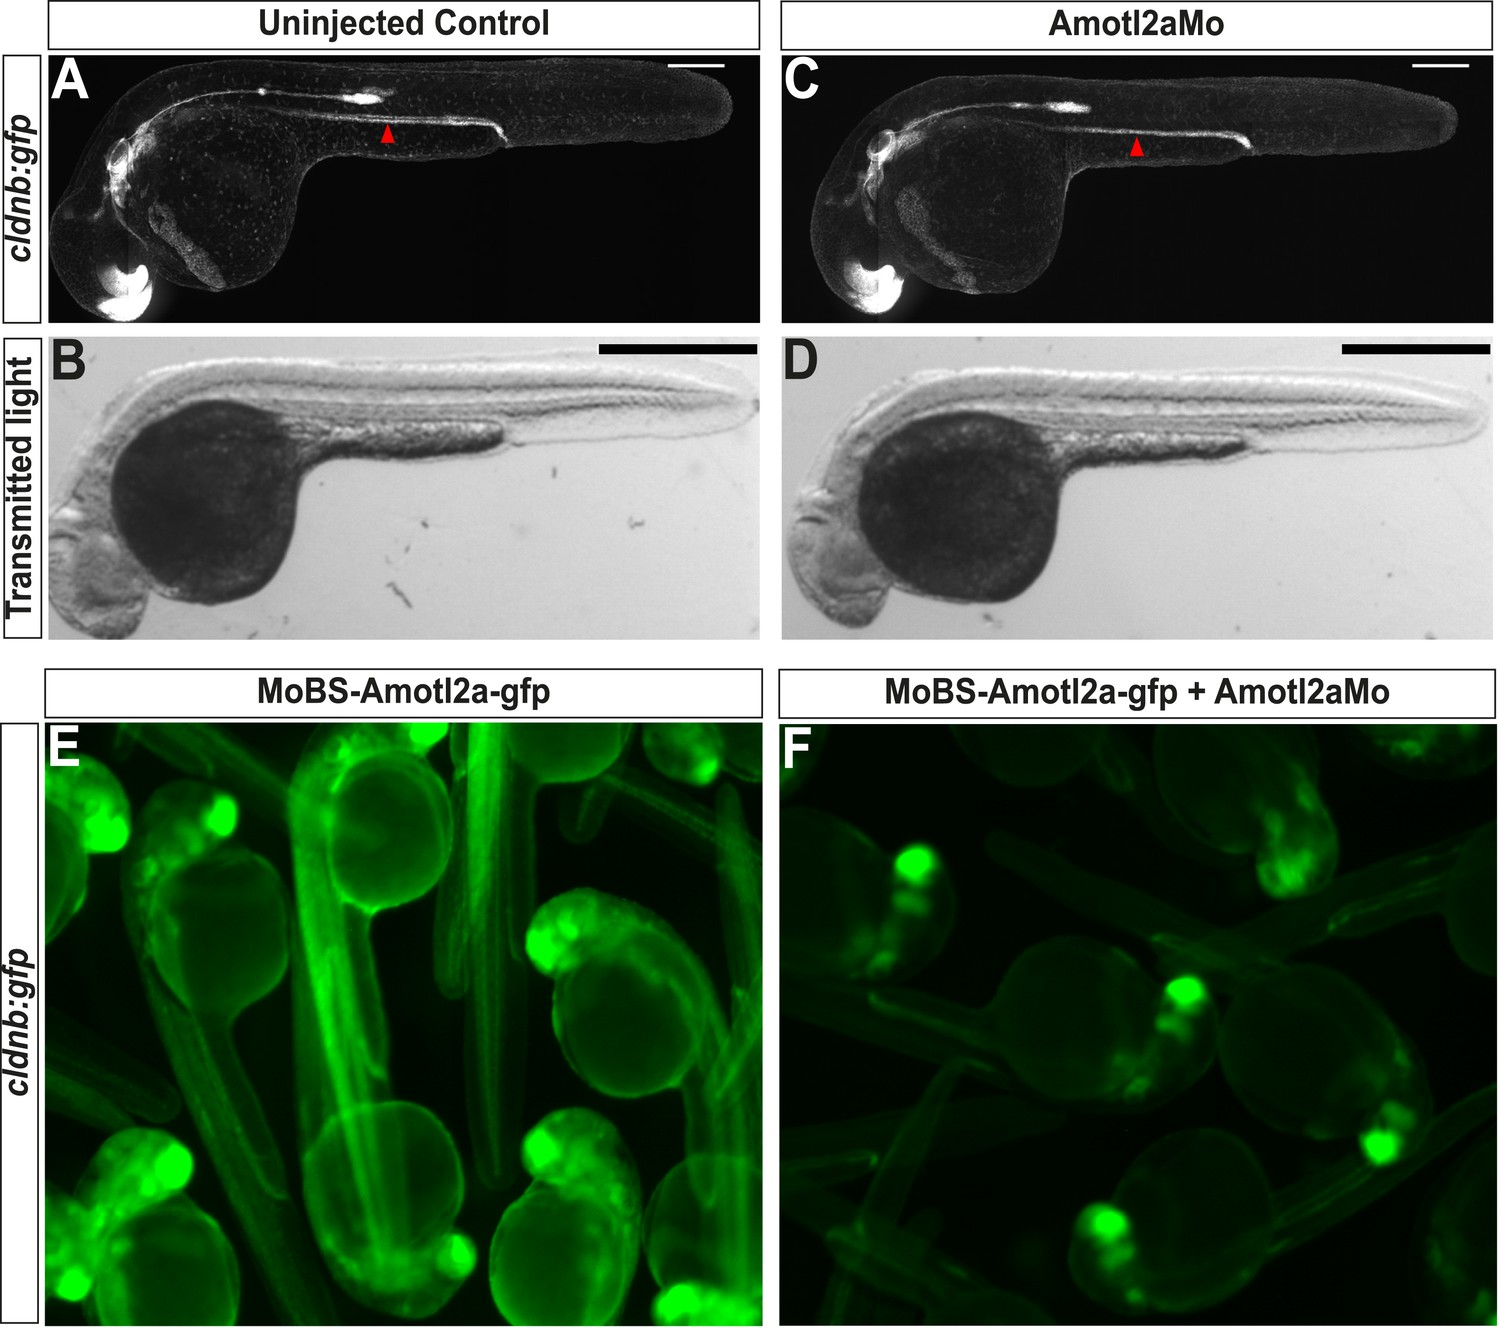
Amotl2aMo efficiency.
(A–D) Overview pictures of 30 hpf cldnb:gfp embryos uninjected (A, B) or injected with Amotl2aMo (C, D), imaged either with fluorescent (A–C) or transmitted light (B–D). (E, F) cldnb:gfp embryos injected with RNA encoding the Mo-binding region of Amotl2a fused to GFP (MoBS-amotl2a-gfp) either alone (E) or with Amotl2aMo (F). The bright green fluorescence in F comes from the expression of the cldnb:gfp transgene in the brain and eyes. The red arrowheads in A and C indicate the level of migration at which embryos were fixed for cell counting quantification (see ‘Materials and methods’).
Figure 2—figure supplement 2
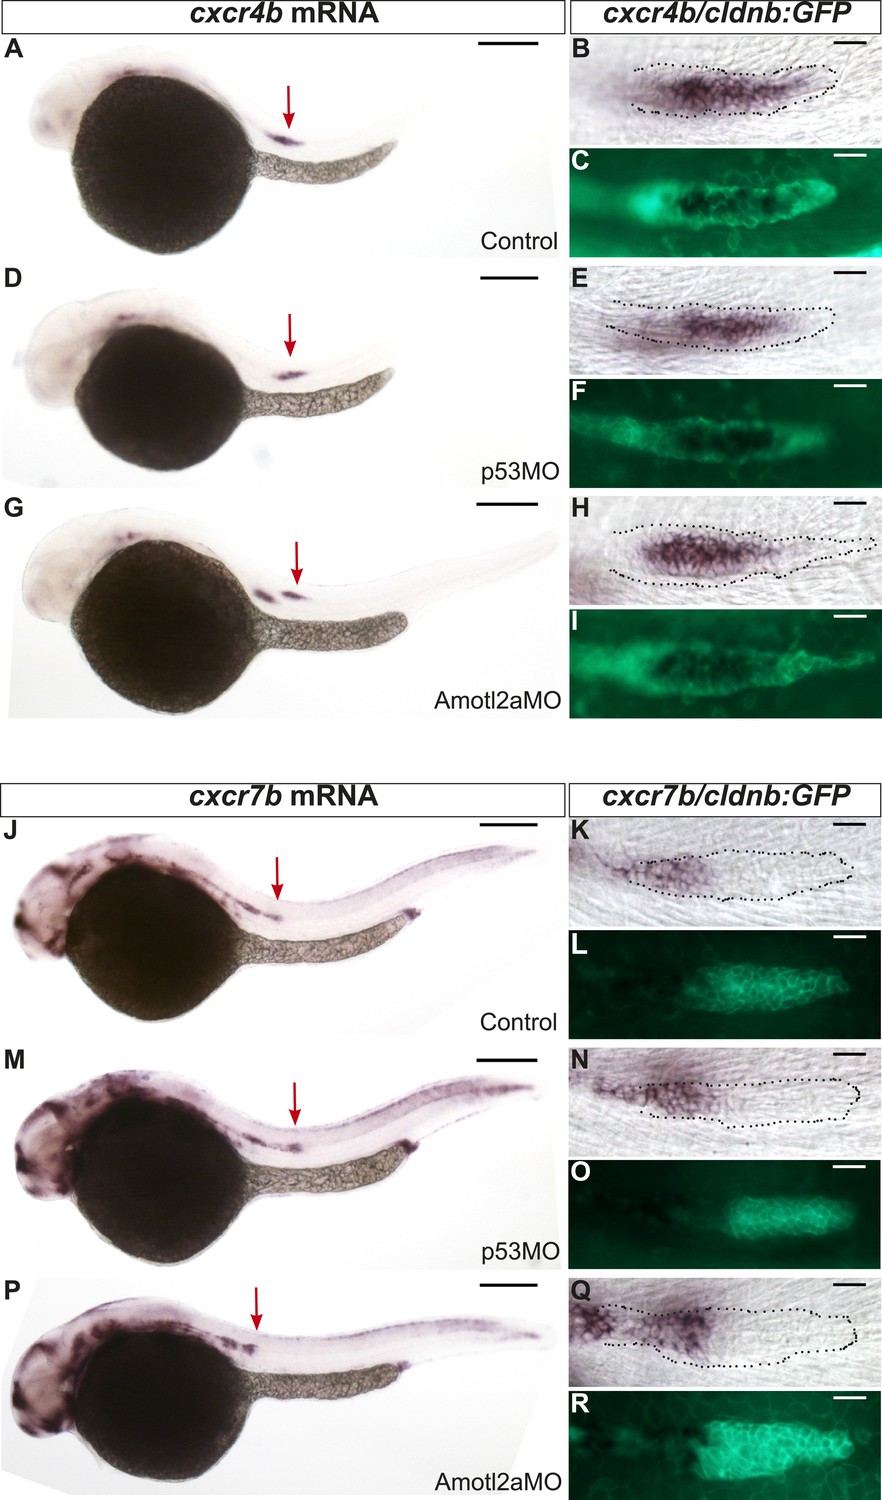
cxcr4b and cxcr7b expression are not affected in amotl2a morphants.
Uninjected (A–C and J–L), p53Mo-injected (D–F and M–O), or Amotl2aMo-injected (G–I and P–R) cldnb:gfp embryos stained with a cxcr4b (A–I) or a cxcr7b (J–R) ISH probe and an anti-GFP antibody (C, F, I, L, O, R). Red arrows point to the pLLP.
Figure 3 with 2 supplements
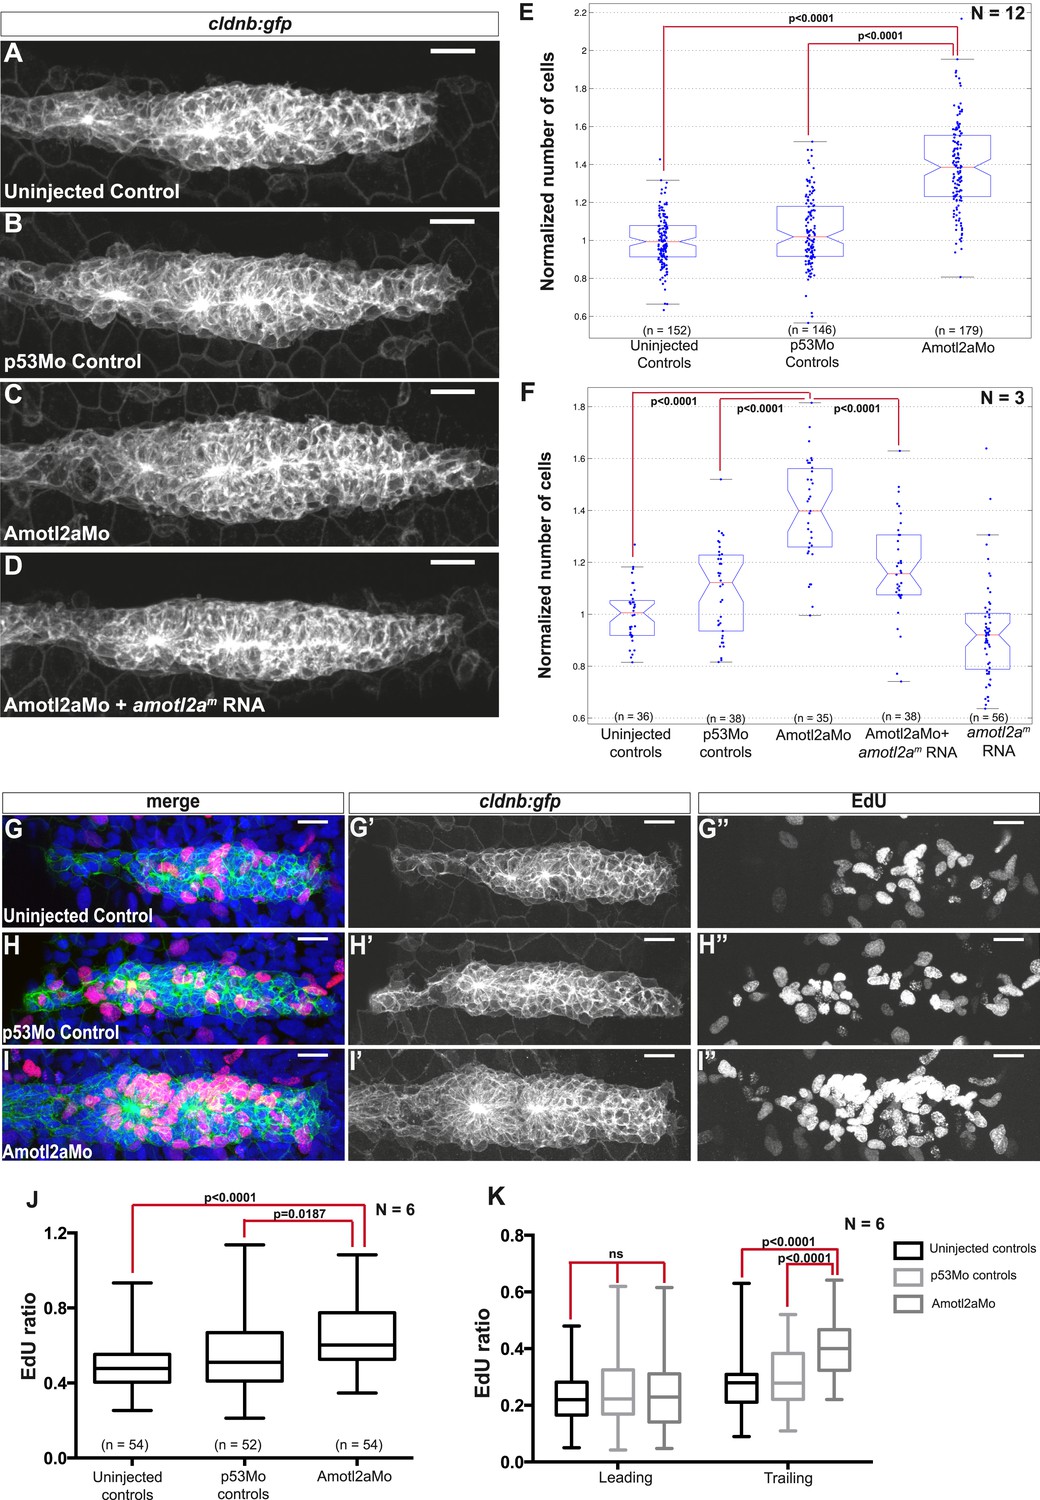
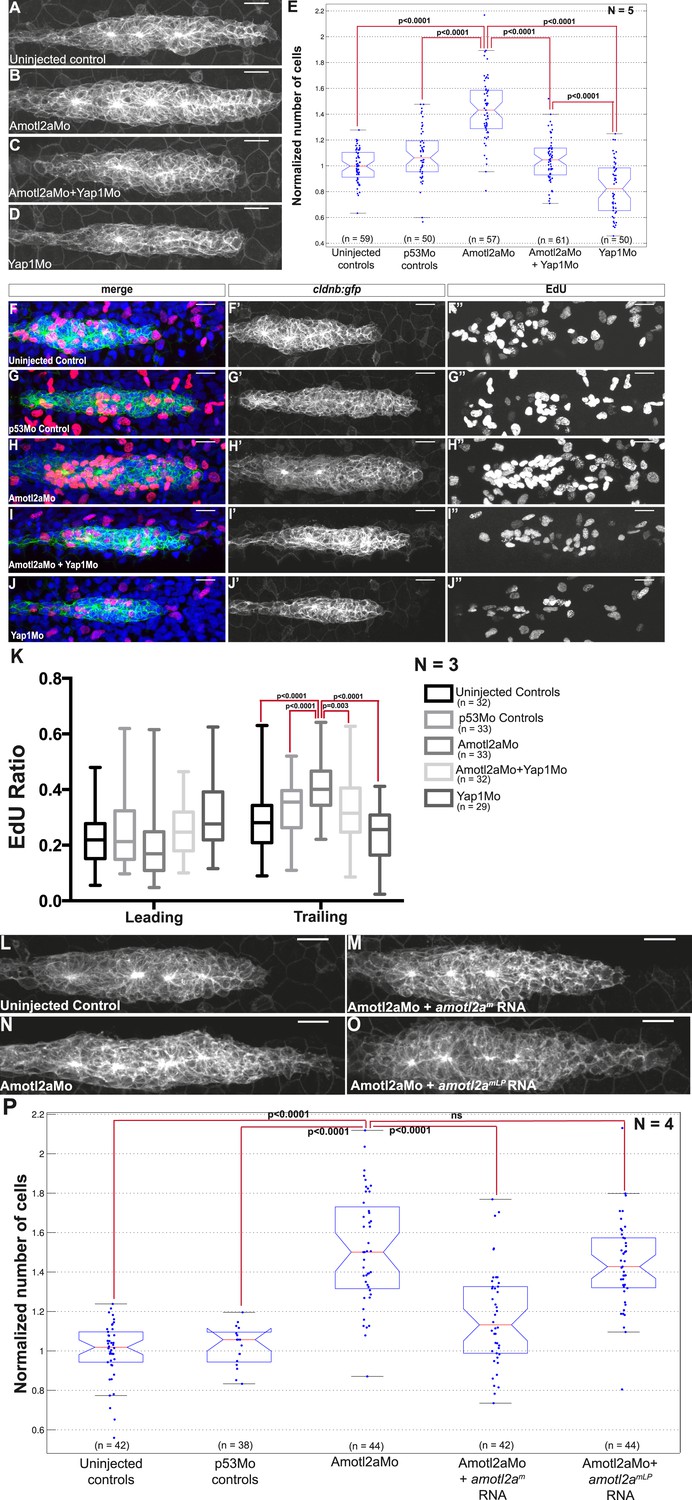
Amotl2a is required to limit proliferation in the pLLP.
(A–D) MIP of Z-stacks of pLLP in cldnb:gfp embryos injected as indicated. (E, F) Boxplots showing the number of cells in the primordia of indicated groups, normalized to the control group. (G–I′′) MIP of Z-stacks of pLLP in cldnb:gfp embryos stained with EdU and DAPI showing the green (membranes, middle), red (EdU, right), and merge (left) channels. (J, K) Boxplot showing the comparison of the EdU index in the indicated experimental conditions in whole primordia (J) or separately in the leading and trailing region (K) (Figure 3—source data 1–3, Figure 3—figure supplements 1, 2, Figure 3—source data 4).
-
Figure 3—source data 1
Cell counts in amotl2a morphants.
- https://doi.org/10.7554/eLife.08201.011
-
Figure 3—source data 2
Cell counts in rescue experiment of amotl2a morphants.
- https://doi.org/10.7554/eLife.08201.012
-
Figure 3—source data 3
EdU ratio in the entire pLLP (Excel sheet 1 related to panel J), leading region and trailing region (Excel sheet 2 related to panel K) of amotl2a morphants.
- https://doi.org/10.7554/eLife.08201.013
-
Figure 3—source data 4
Cell counts in amotl2a-overexpressing embryos.
- https://doi.org/10.7554/eLife.08201.014
Figure 3—figure supplement 1
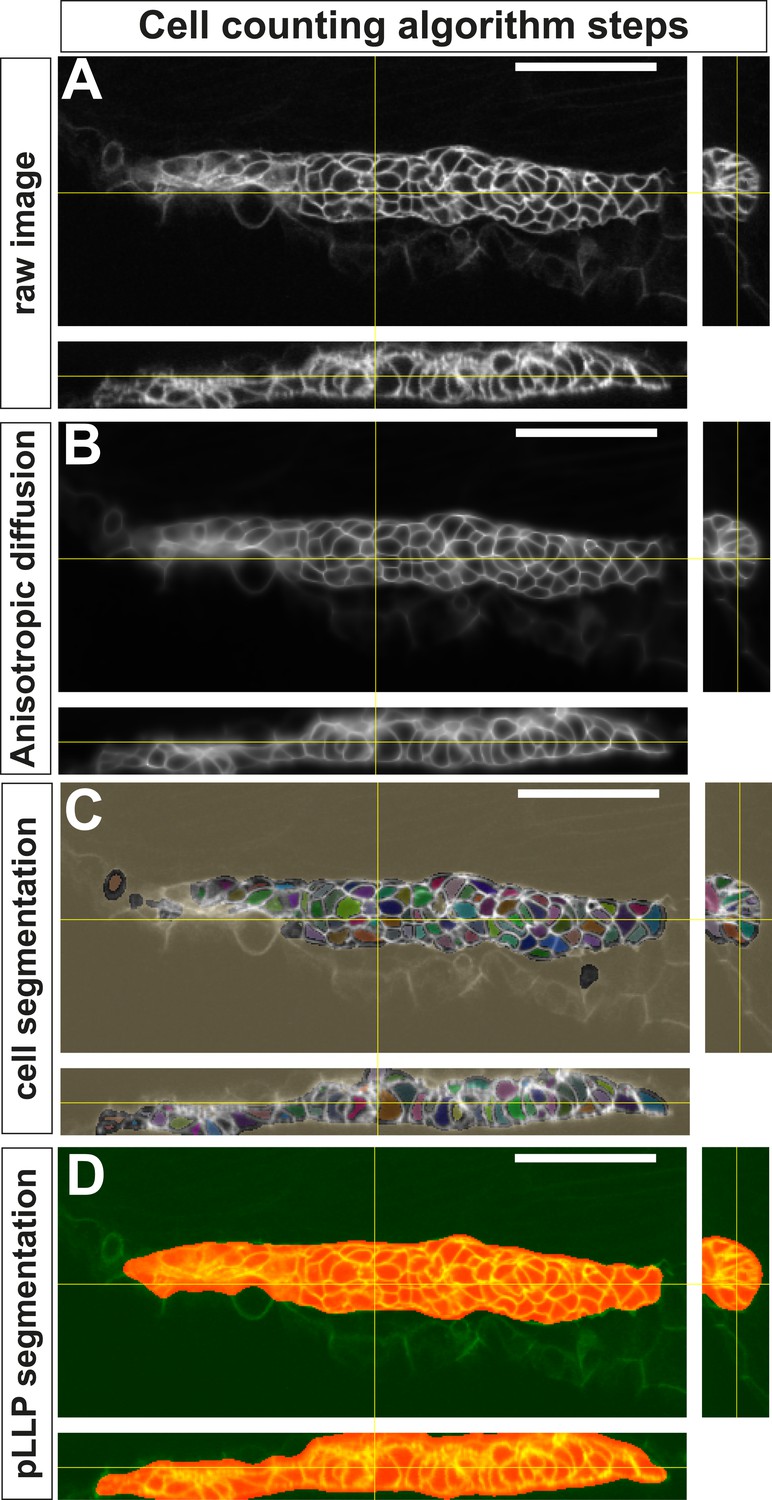
Successive steps of the automated ‘cell-counting’ algorithm.
(A) Raw image of pLLP in a cldnb:gfp embryo. (B) Enhanced, filtered image using anisotropic diffusion. (C) Segmentation of individual cells. (D) Segmentation mask of the pLLP.
Figure 3—figure supplement 2
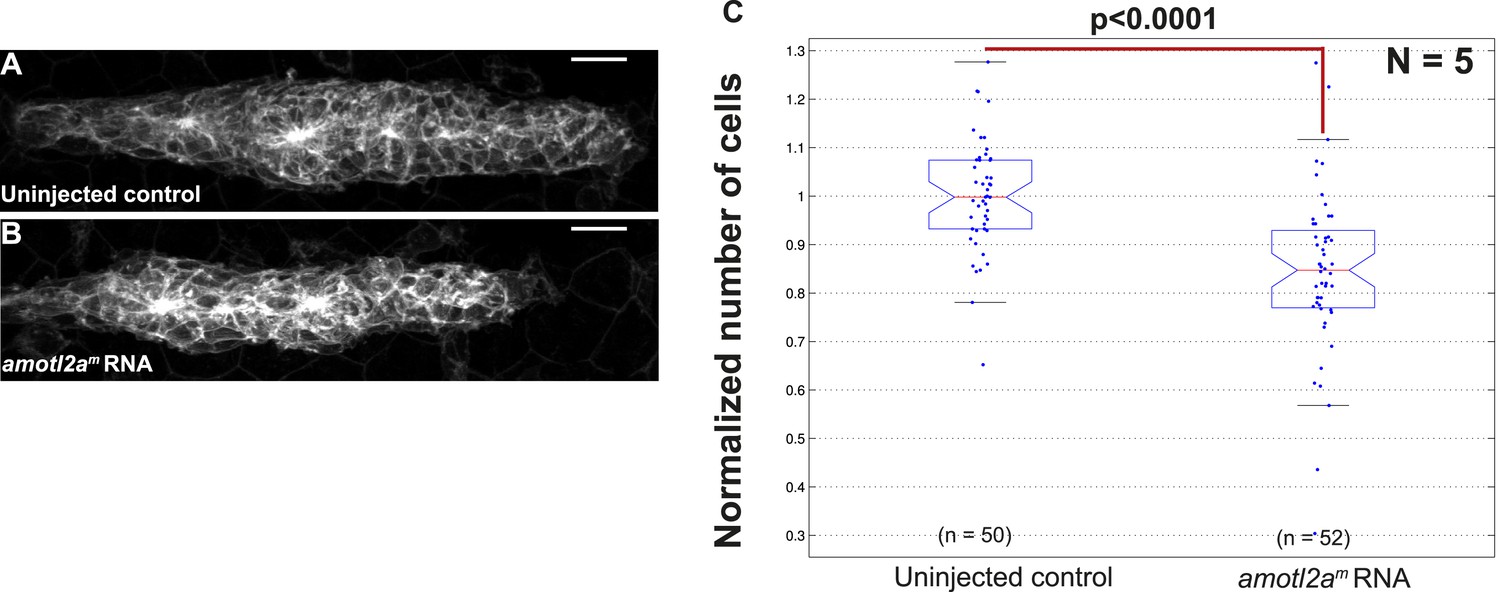
Overexpression of amotl2a leads to reduced cell number in the pLLP.
(A, B) MIP of Z-stacks of pLLP in cldnb:gfp embryos injected as indicated. (C) Corresponding boxplot comparing the number of cells in the indicated experimental conditions. (Figure 3—source data 4).
Figure 4 with 2 supplements
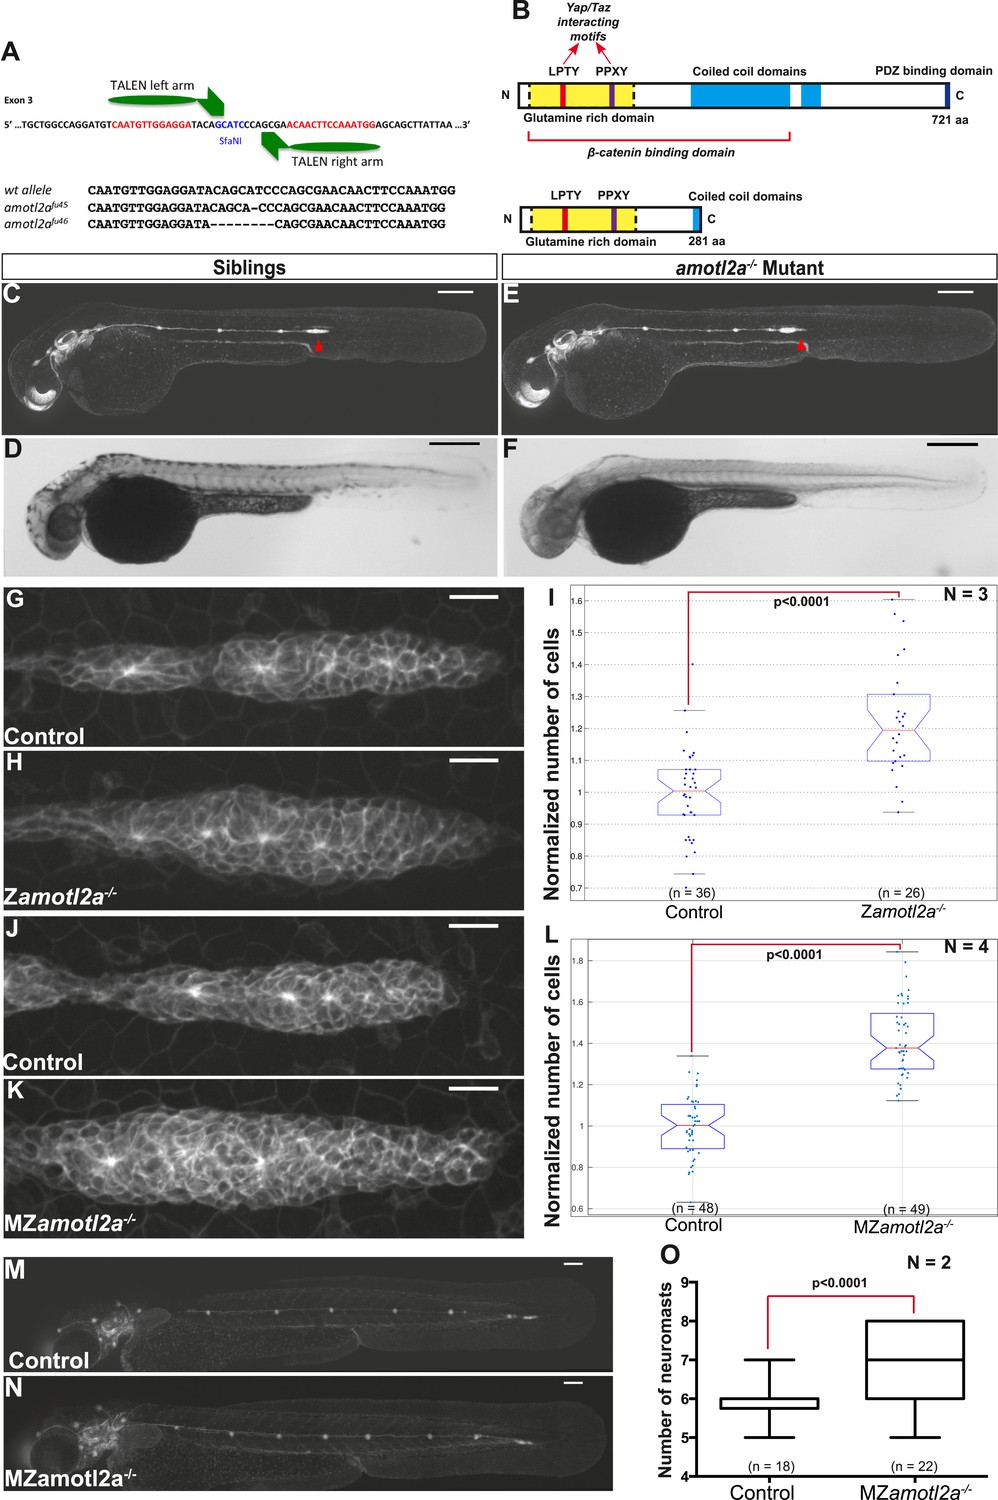
amotl2a mutants phenocopy the morphant phenotype.
(A) Scheme showing the transcription activator-like effector nuclease (TALEN) target site in the amotl2a locus with the left and right TALEN-binding sites in red separated by the spacer including the restriction site used for screening (blue) (top). Alignment of the two conserved amotl2a mutant alleles with the corresponding wild-type sequence showing the deleted nucleotides (bottom). (B) Scheme comparing the functional domains present in the wild-type Amotl2a protein (721aa long) and the putative truncated proteins (272aa +17 or +9 missense aa for allele fu45 and fu46, respectively). (C–F) 36 hpf cldnb:gfp wild-type sibling (C, D) or amotl2a−/− mutant embryo (E, F) imaged with fluorescent (C, E) or transmitted light (D, F). (G, H, J, K) MIP of Z-stacks of pLLP in cldnb:gfp embryos with the indicated genetic background. (I, L) Boxplots comparing the cell numbers between the indicated genetic backgrounds. (M, N) MZamotl2a−/− mutant embryo (N) showing an extra deposited neuromast as compared to a wild-type sibling embryo (M). (O) Boxplot showing the corresponding quantification (Figure 4—source data 1, 2; Figure 4—figure supplements 1, 2, Figure 4—source data 3, 4).
-
Figure 4—source data 1
Cell counts in zygotic amotl2a mutants.
- https://doi.org/10.7554/eLife.08201.018
-
Figure 4—source data 2
Number of deposited neuromasts in MZamotl2a mutants.
- https://doi.org/10.7554/eLife.08201.019
-
Figure 4—source data 3
Migration speed in MZamotl2a mutants.
- https://doi.org/10.7554/eLife.08201.020
-
Figure 4—source data 4
Cell counts in neuromasts of morphants (Excel sheet 1 related to panel A) and MZamotl2a mutants (Excel sheet 2 related to panel B).
- https://doi.org/10.7554/eLife.08201.021
Figure 4—figure supplement 1
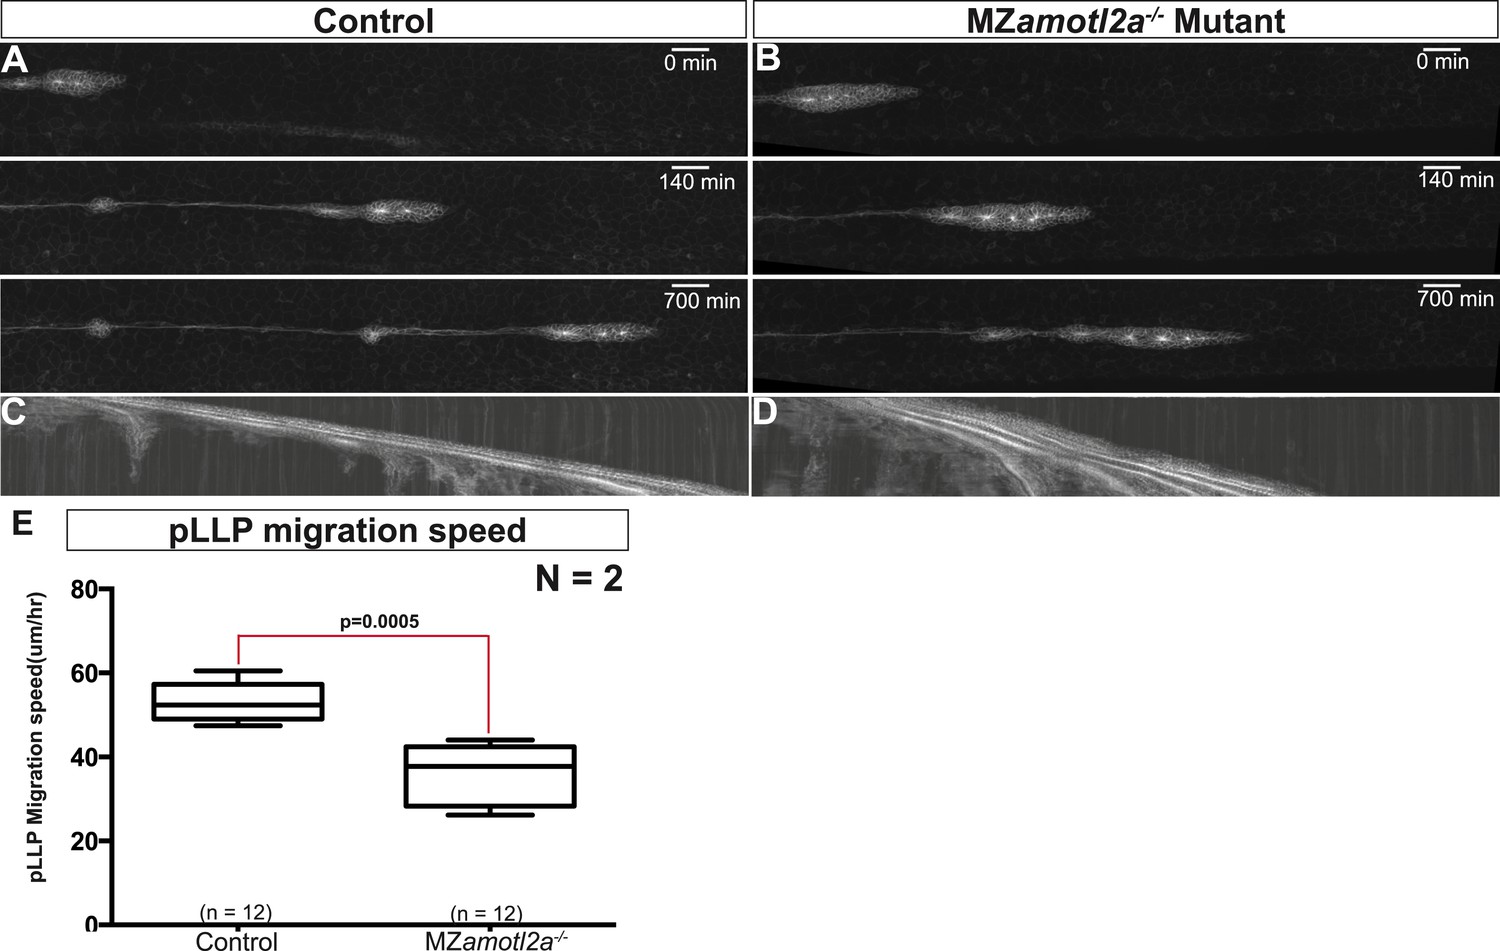
MZamotl2a−/− mutants exhibit reduced pLLP migration speed.
(A, B) Snapshots of time-lapse movies at the indicated timepoint showing a delay in migration speed in MZamotl2a−/− mutants (B) as compared to siblings (A). (C, D) Corresponding kymographs. (E) Boxplot comparing the migration speeds in control vs MZamotl2a−/− mutant pLLP (Figure 4—source data 3).
Figure 4—figure supplement 2
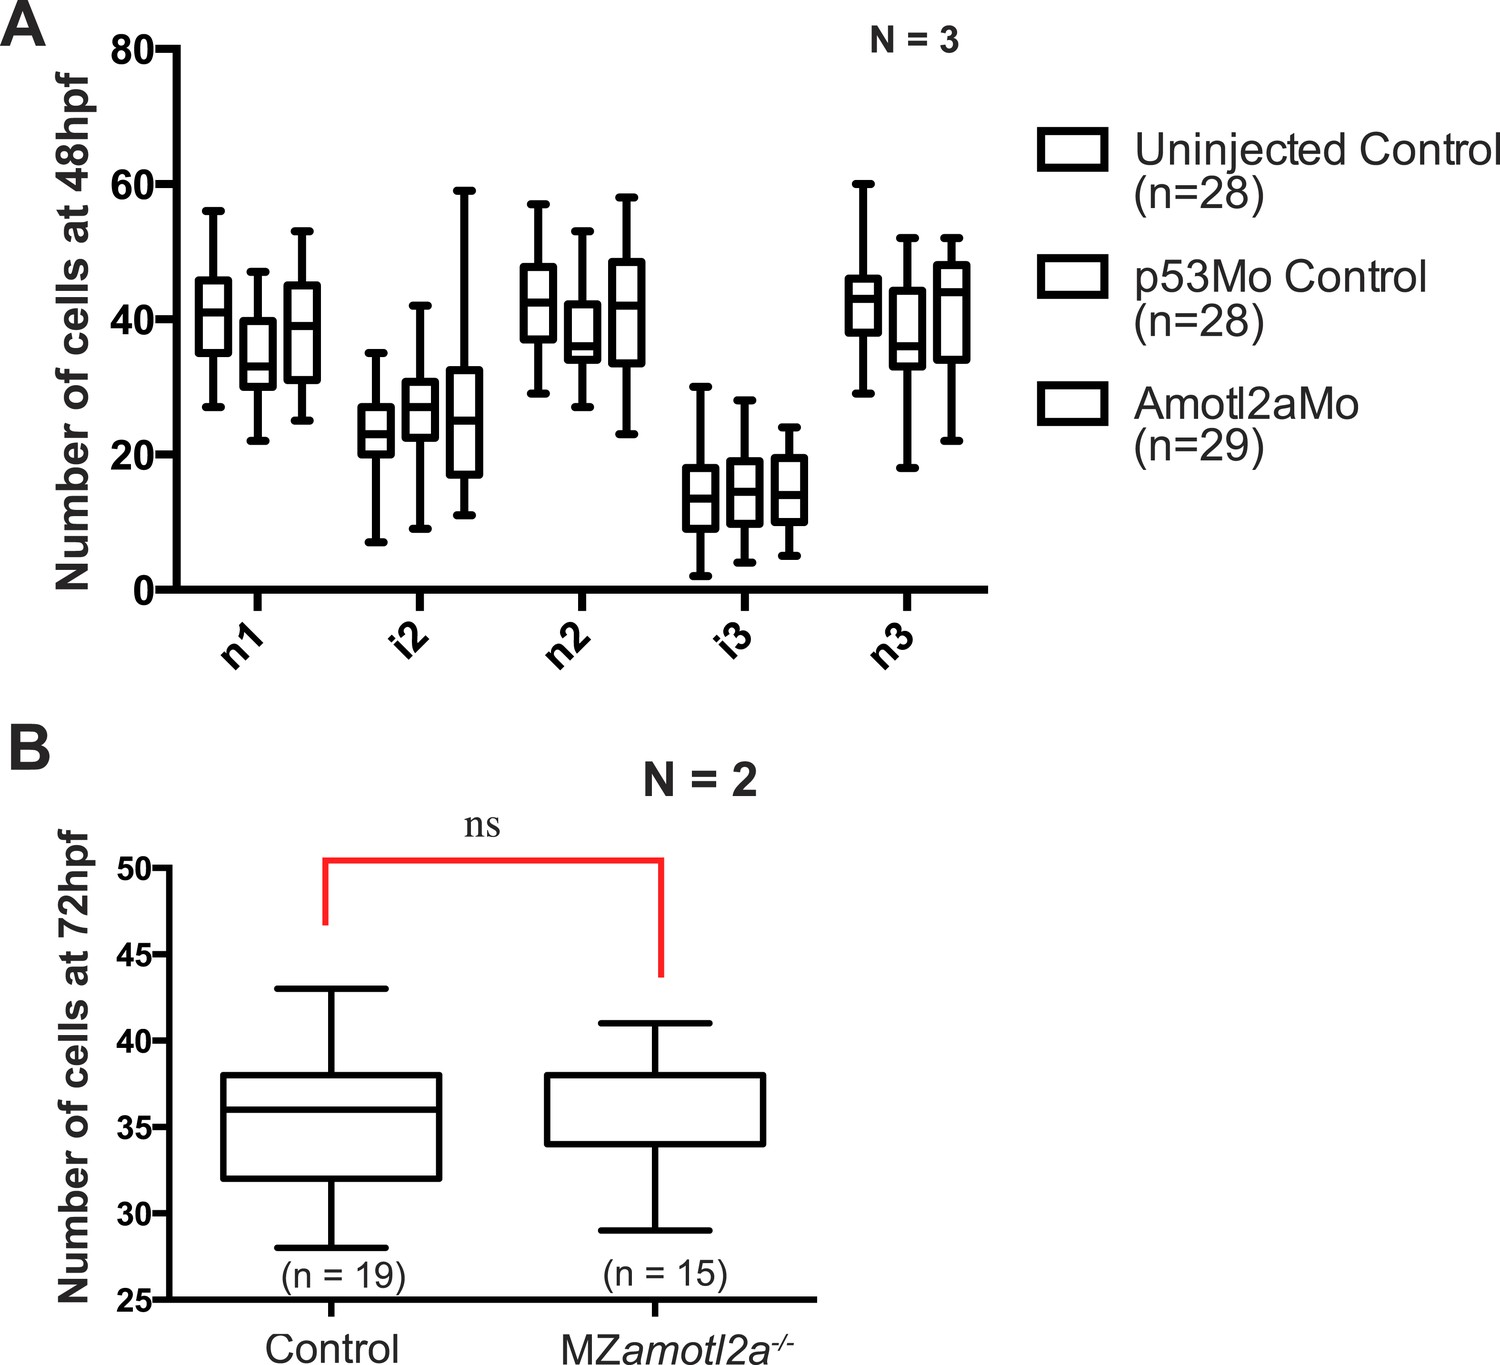
Deposited neuromasts or interneuromast chains do not contain more cells in amotl2a morphants or mutants.
(A) Boxplots showing cell number quantifications in the first 3 neuromasts (n1 to n3) and interneuromast regions (i1 and i2) at 48 hpf in the indicated experimental conditions. (B) Boxplot showing cell number quantification in one neuromast close to the end of yolk extension (n3 or n4) at 72 hpf in the indicated experimental conditions (Figure 4—source data 4).
Figure 5 with 1 supplement
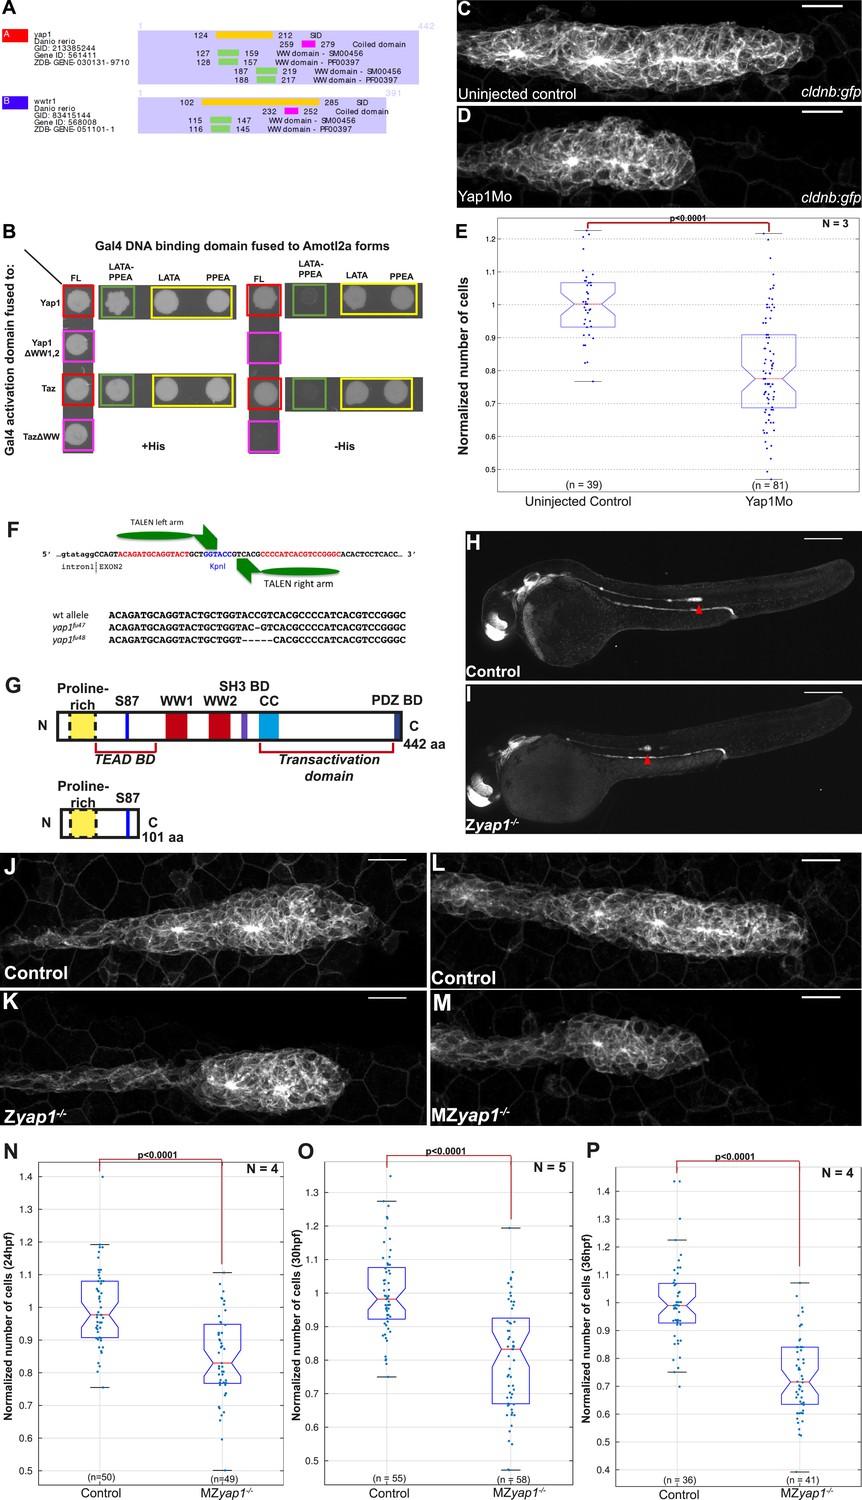
Yap1 physically interacts with Amotl2a and is required for the pLLP to have the correct number of cells.
(A) Part of the yeast two-hybrid (Y2H) screen results showing the Selected Interaction Domain (SID) of Yap1 and Taz (encoded by the gene wwtr1) and known functional and structural domain on these proteins. The SID is the amino acid sequence shared by all prey fragments matching the same reference protein, here Yap1 and Taz. (B) Y2H assay with Histidine (left panel, growth control) and without Histidine (right panel, protein interaction assay) showing the interactions between zebrafish Amotl2a and Yap1 or Taz (red), but not with the corresponding proteins mutated in the known interaction motifs: LPTY/PPEY for Amotl2a (green) and WW domain for Yap1 and Taz (pink). (C, D) MIP of Z-stacks of pLLP in cldnb:gfp embryos injected as indicated. (E) Boxplot comparing the number of cells in the pLLP in Yap1Mo-injected embryos and controls. (F) Scheme showing the TALEN target site in the yap1 locus with the left and right TALEN-binding sites in red separated by the spacer including the restriction site used for screening (blue) (top). Alignment of the two yap1 mutant alleles with the corresponding wild-type sequence showing the deleted nucleotides (bottom). (G) Scheme comparing the functional domains present in the wild-type Yap1 (442aa long) and the putative truncated proteins (76aa +25 or +45 missense aa before for allele fu47 and fu48, respectively). (H, I) Overview pictures of 36 hpf cldnb:gfp control and Zyap1−/− embryos. (J–M) MIP of Z-stacks of pLLP in cldnb:gfp embryos with the indicated genotype. (N–P) Boxplot showing cell counts in the pLLP in embryos of the corresponding genotypes (Figure 5—source data 1, 2; Figure 5—figure supplement 1; Figure 5—source data 3, 4).
-
Figure 5—source data 1
Cell counts in yap1 morphants.
- https://doi.org/10.7554/eLife.08201.025
-
Figure 5—source data 2
Cell counts in MZyap1 mutants at 24 hpf (Excel sheet 1 related to panel N), 30 hpf (Excel sheet 2 related to panel O) and 36 hpf (excel sheet 3 related to panel P).
- https://doi.org/10.7554/eLife.08201.026
-
Figure 5—source data 3
Cell counts in Zyap1 mutants.
- https://doi.org/10.7554/eLife.08201.027
-
Figure 5—source data 4
Number of deposited neuromasts (Excel sheet 1 related to panel D), number of cells (Excel sheet 2 related to panel E), and number of hair cells (Excel sheet 3 related to panel H) per neuromasts in MZyap1 mutants.
- https://doi.org/10.7554/eLife.08201.028
Figure 5—figure supplement 1
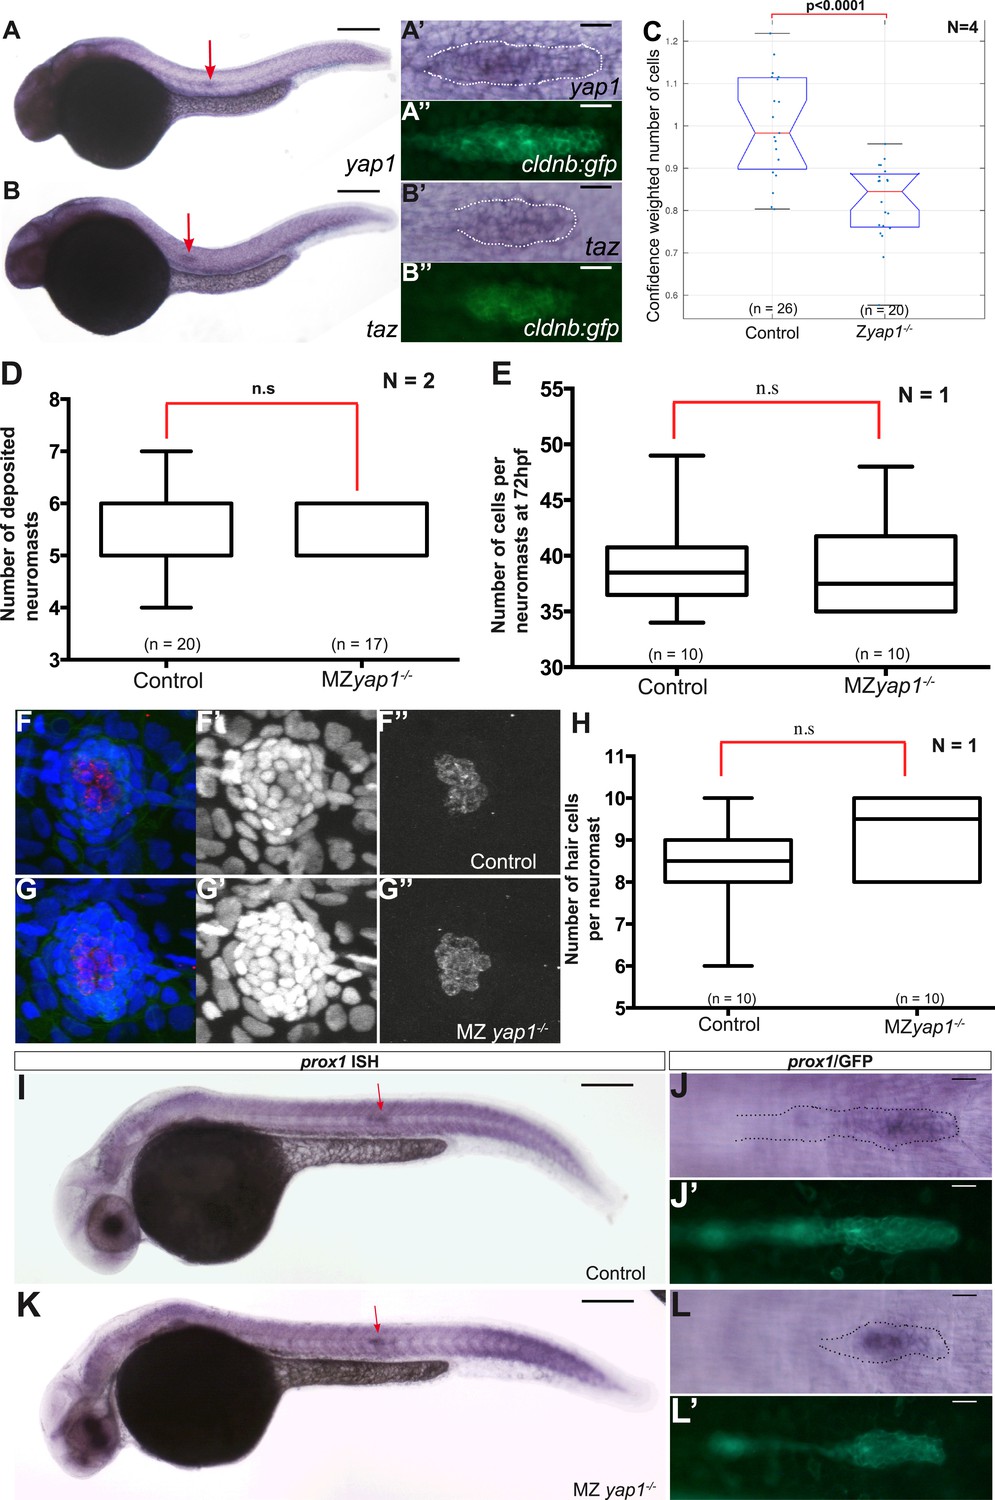
yap1 and taz are ubiquitously expressed at 30 hpf.
Zyap1−/− mutant embryos have fewer cells compared to sibling controls. (A–B′′) 30 hpf cldnb:gfp embryos stained with a yap1 (A–A′′) or a taz (B–B′′) ISH probe and an anti-GFP antibody (A′′, B′′). (C–E, H) Boxplot showing pLLP cell counts (C), number of deposited neuromasts (D), cell counts (E), and number of hair cells (H) per neuromast in the indicated experimental conditions. Cell counts were performed in the neuromast closest to the end of yolk extension (n3 or n4) at 72 hpf in (E–H). (F–G′′) MIP of Z-stacks of a deposited neuromast (n3 or n4) stained with an anti-HCS1 antibody (hair cells, red) and DAPI (cell nuclei, blue). (I–L′) ISH with a prox1 probe and an anti-GFP antibody staining (J′, L′) on embryos with the indicated genetic background. Red arrows point to the pLLP (A, B, I and K) (Figure 5—source data 3, 4).
Figure 6 with 1 supplement
Loss of Yap1 suppresses the increased cell proliferation in amotl2a morphant.
(A–D, L–O) MIP of Z-stacks of pLLP in cldnb:gfp embryos injected as indicated. (E, P) Corresponding boxplots comparing pLLP cell counts. (F–J′′) MIP of Z-stacks of pLLP in cldnb:gfp embryos stained with EdU and DAPI showing the EdU (right panels), cell membranes (middle panels), and merged channels (left panels). (K) Corresponding boxplot showing the EdU index in the leading and trailing regions of the pLLP in the indicated experimental conditions (Figure 6—source data 1–3; Figure 6—figure supplement 1, Figure 6—source data 4).
-
Figure 6—source data 1
Cell counts in amotl2a;yap1 double morphants.
- https://doi.org/10.7554/eLife.08201.031
-
Figure 6—source data 2
EdU ratio in the leading region and trailing region of amotl2a;yap1 double morphants.
- https://doi.org/10.7554/eLife.08201.032
-
Figure 6—source data 3
Cell counts in embryos co-injected with Amotl2aMo and amotl2am or with Amotl2aMo and amotl2amLP.
- https://doi.org/10.7554/eLife.08201.033
-
Figure 6—source data 4
Cell counts in MZamotl2a;MZyap1 double mutants.
- https://doi.org/10.7554/eLife.08201.034
Figure 6—figure supplement 1
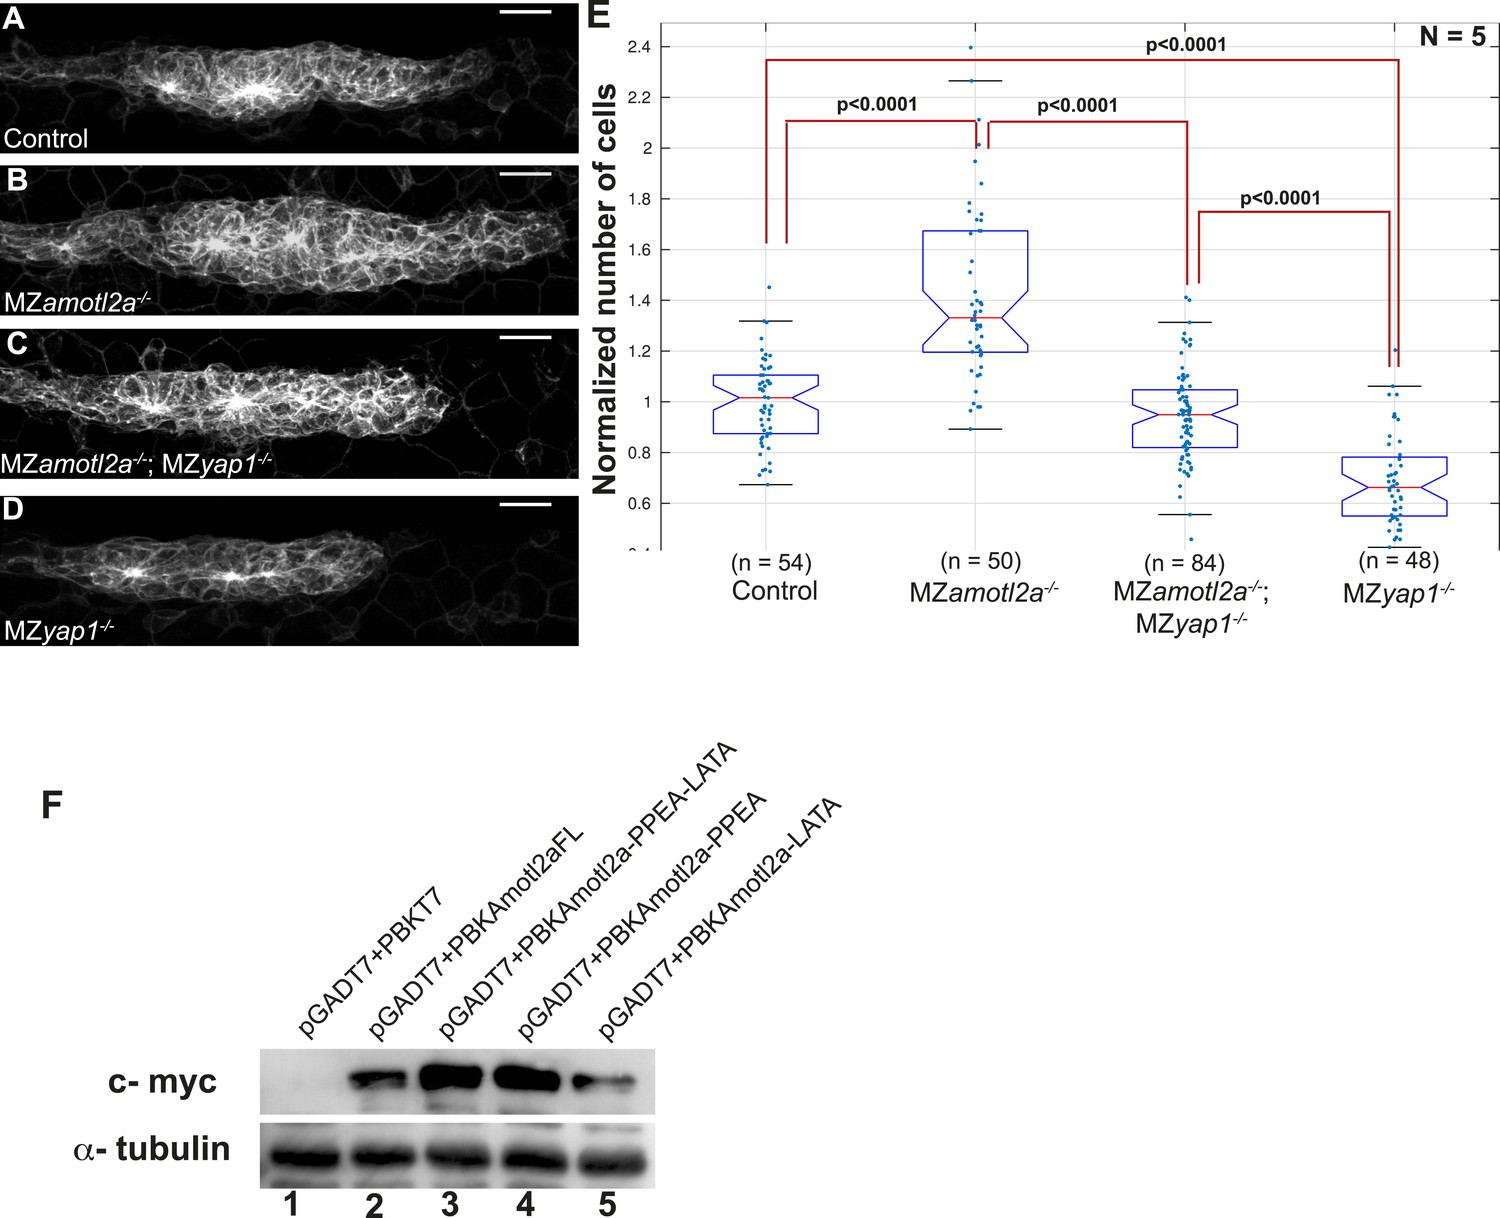
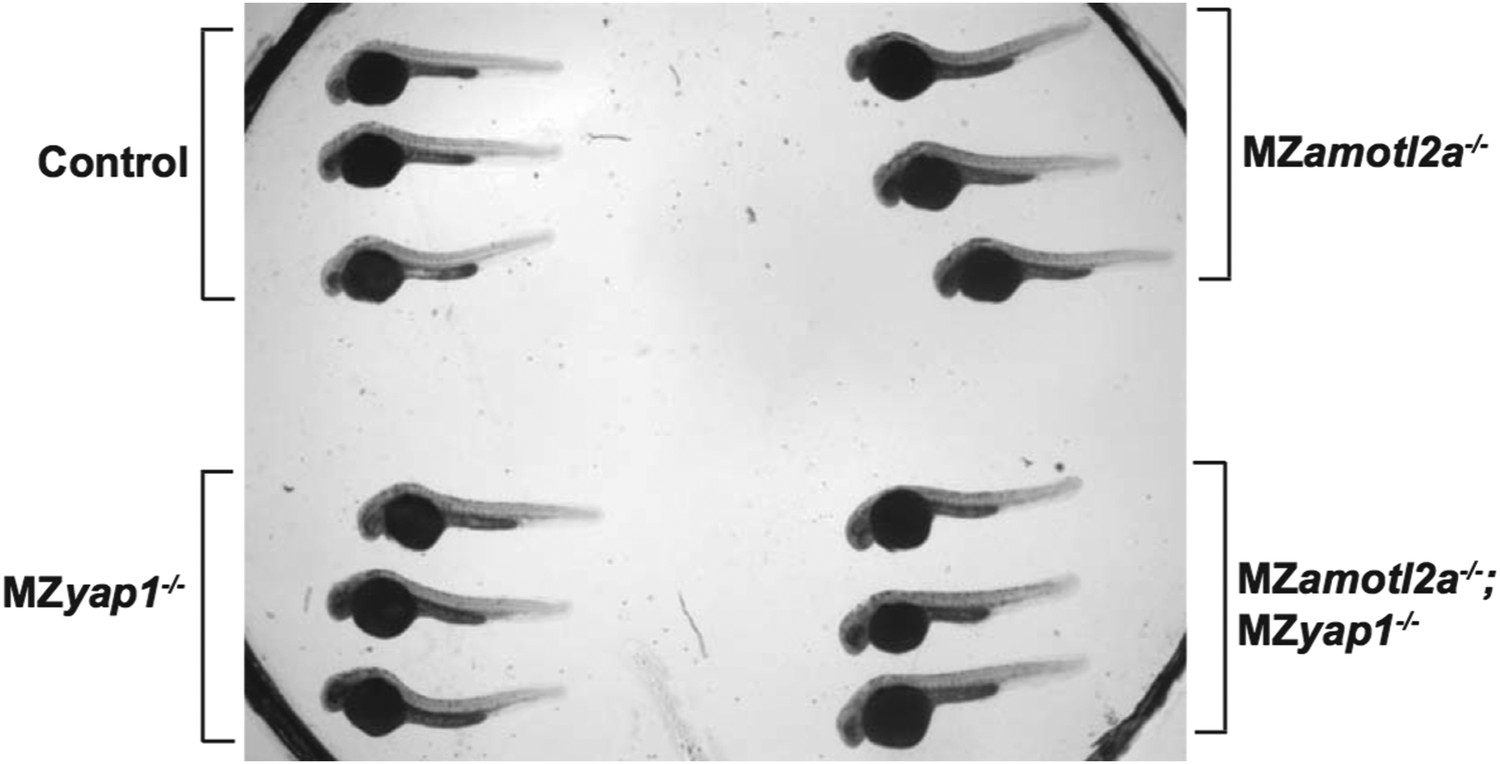
Loss of Yap1 in MZamotl2a−/−;MZyap1−/− embryos supresses increased pLLP cell number resulting from loss of Amotl2a in MZamotl2a-−/− embryos.
The mutation of Yap1-binding domains in Amotl2a does not render it unstable. MIP of Z-stacks of pLLP in cldnb:gfp embryos with the indicated genotype (A–D). (E) Corresponding boxplot comparing pLLP cell counts. (F) Western blot showing the stability of wild-type Amotl2a, Amotl2aFL (lane2) and Amotl2a forms carrying both PPEA-LATA (lane3) and single PPEA and LATA (lanes 4 and 5), respectively. α-tubulin staining shows equal protein loading (Figure 6—source data 4).
Figure 7 with 1 supplement
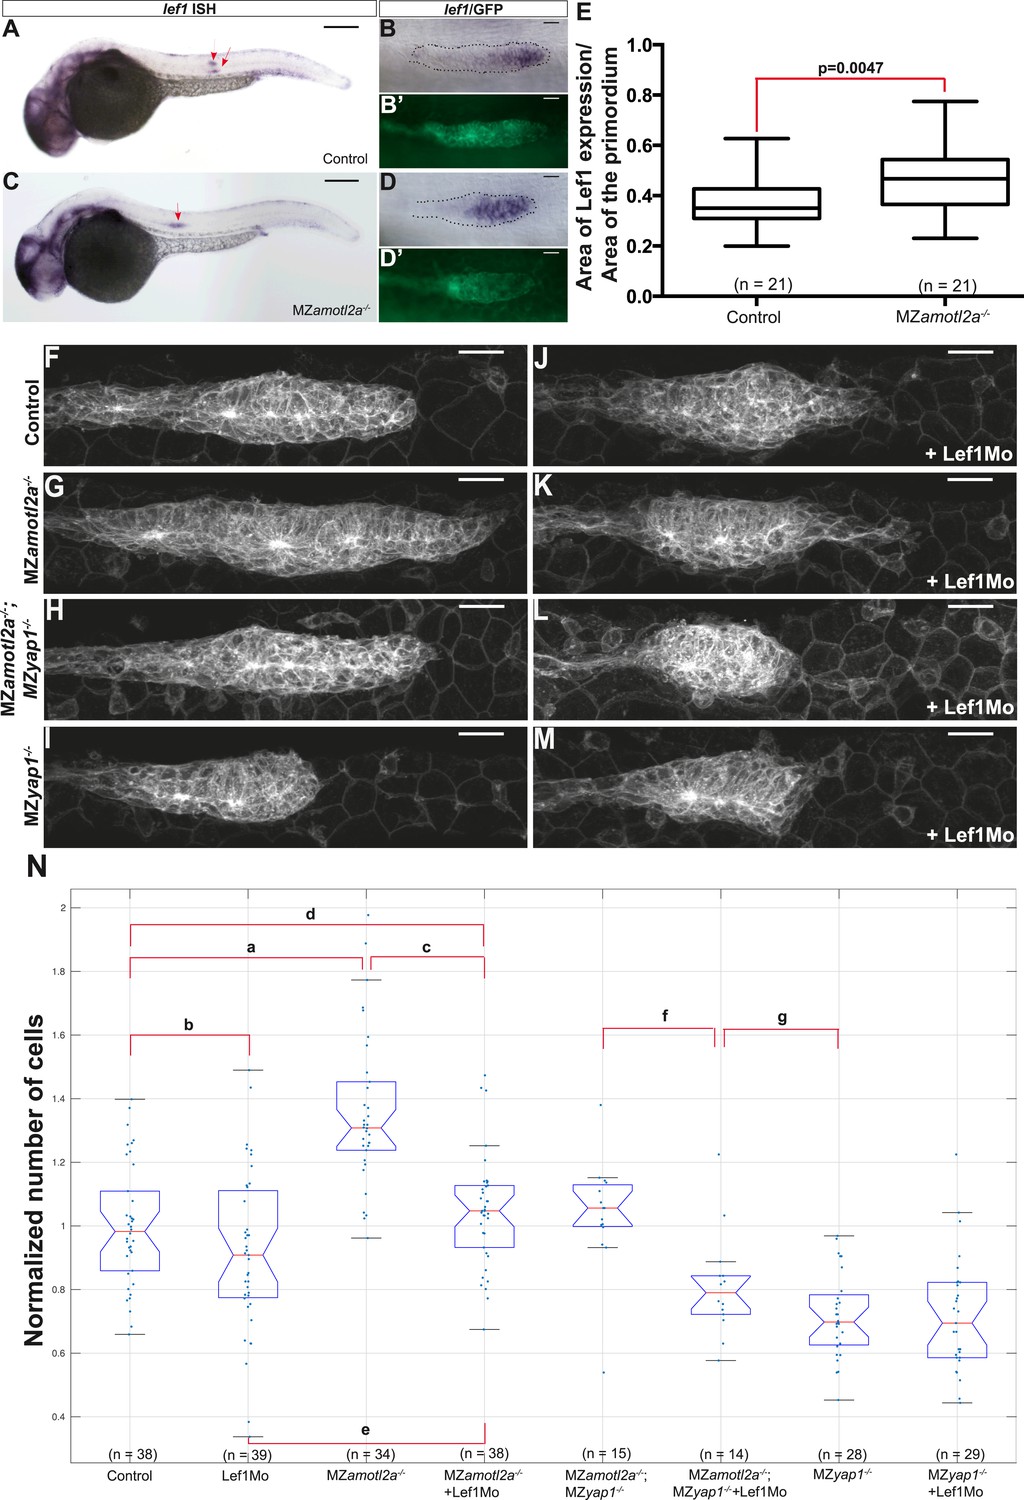
Loss of Lef1 suppresses the increased cell proliferation in amotl2a mutants.
(A–D′) 30 hpf cldnb:gfp embryos with the indicated genetic background stained with a lef1 ISH probe and an anti-GFP antibody (B′, D′). (E) Boxplot showing the expansion of lef1 expression domain in MZamotl2a−/− embryos. (F–M) MIP of Z-stacks of pLLP in cldnb:gfp embryos with the indicated genotype, either uninjected (F–I) or injected with a Lef1Mo (J–M). (N) Corresponding boxplot comparing pLLP cell counts (Figure 7—source data 1, 2; Figure 7—figure supplement 1, Figure 7—source data 3).
-
Figure 7—source data 1
Relative lef1 expression domain area in MZamotl2a mutants.
- https://doi.org/10.7554/eLife.08201.037
-
Figure 7—source data 2
Cell counts in Lef1Mo-injected MZamotl2a;MZyap1 double mutants.
- https://doi.org/10.7554/eLife.08201.038
-
Figure 7—source data 3
Relative lef1 expression domain area in amotl2a morphants.
- https://doi.org/10.7554/eLife.08201.039
Figure 7—figure supplement 1
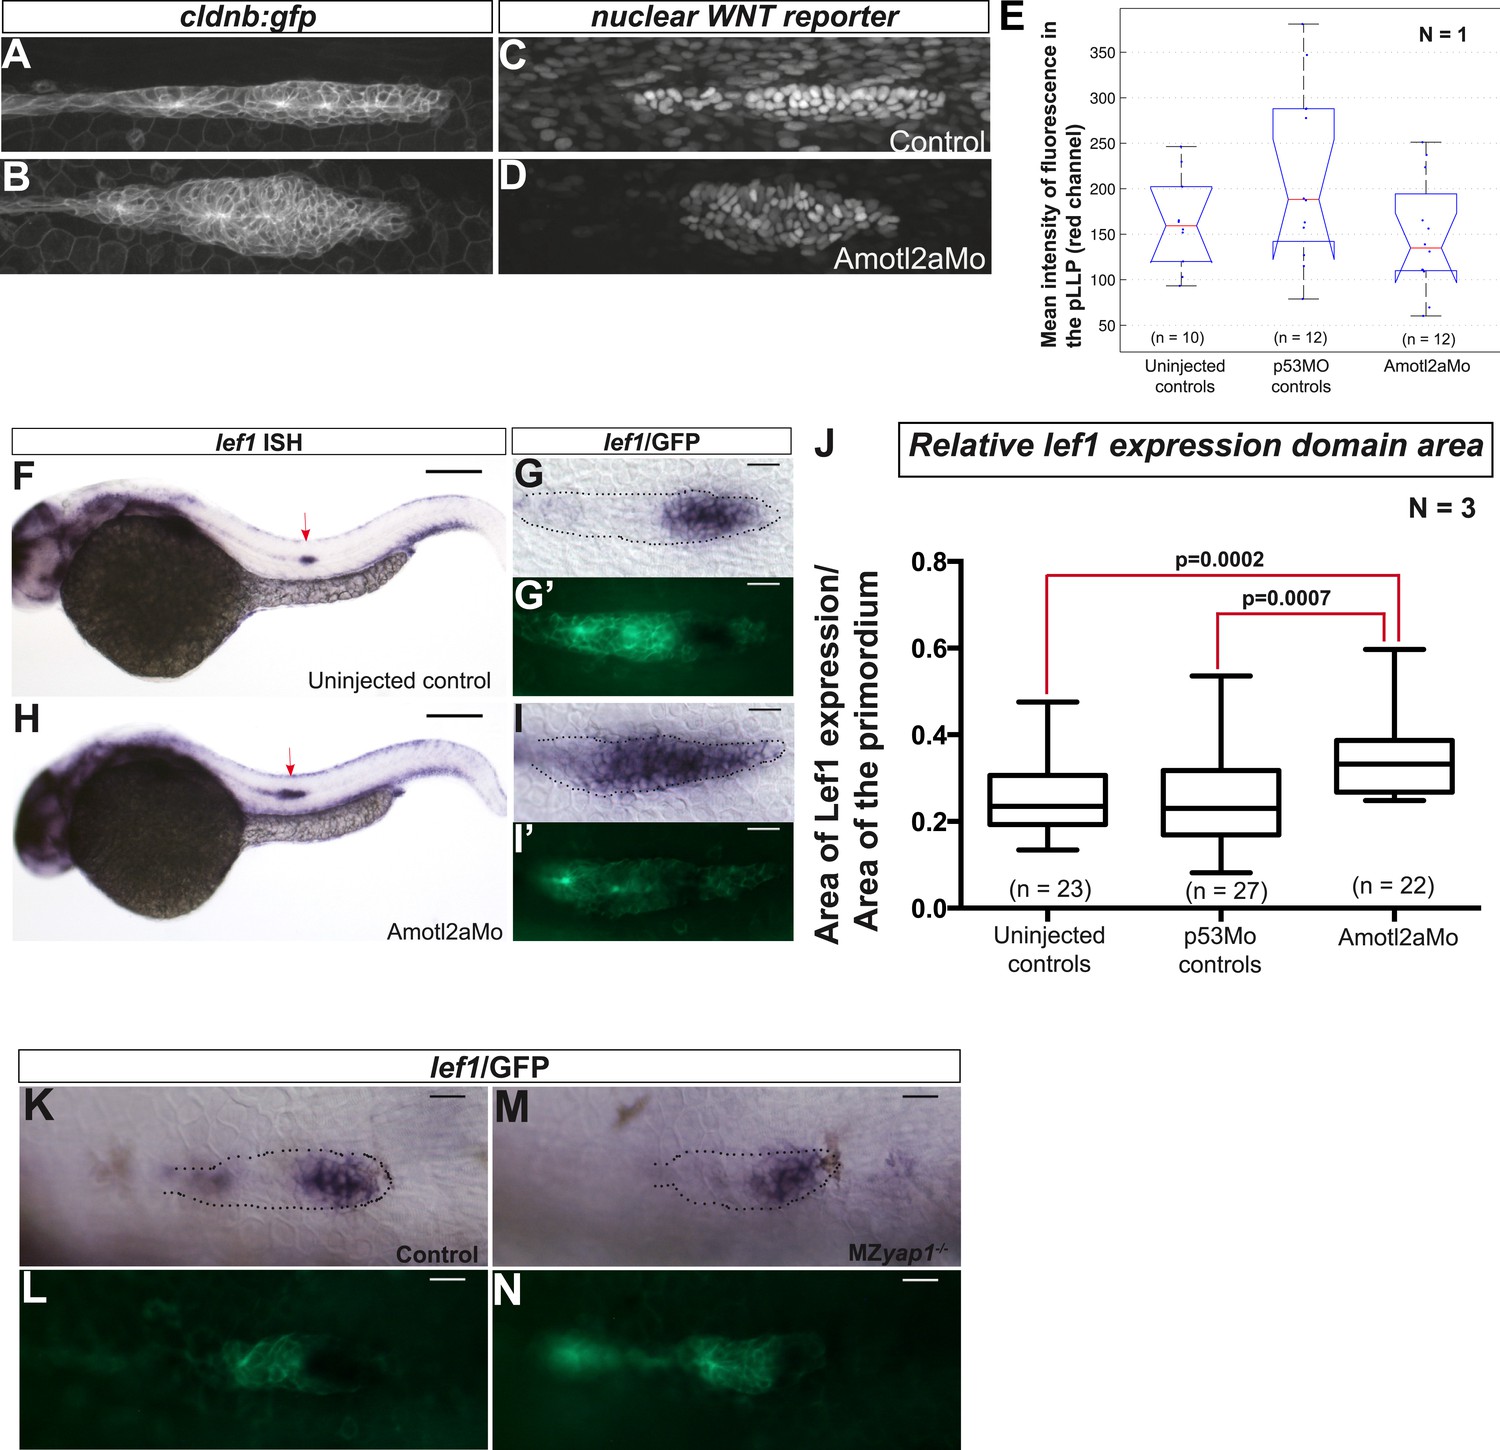
Loss of Amotl2a leads to an expansion of lef1 expression.
(A–D) MIP of confocal stacks of the pLLP in Tg(7xTCF-Xla.Sia:NLS-mCherry) embryos injected (B, D) or not injected (A, C) with the amotl2aMo and showing the green (membranes, left) and red (nuclear WNT reporter) channels. (E) Boxplot comparing the relative mean intensity of fluorescence in the red channel in the corresponding pLLP. (F–I′) Overview pictures (F, H) and close-up on the pLLP of 30 hpf cldb:gfp embryos injected (H, I, I′) or not injected (F, G, G′) with the Amotl2aMo and stained with a lef1 ISH probe and an anti-GFP antibody (G′, I′). Red arrows point to the pLLP (F, H). (J) Boxplot showing the expansion of lef1 expression domain in amotl2a morphants. (K–N) Close-up on the pLLP of 30 hpf control or MZyap1−/− cldb:gfp embryos stained with a lef1 ISH probe and an anti-GFP antibody (L, N). The relative lef1 expression domain is not different in MZyap1−/− embryos (Figure 7—source data 3).
Figure 8
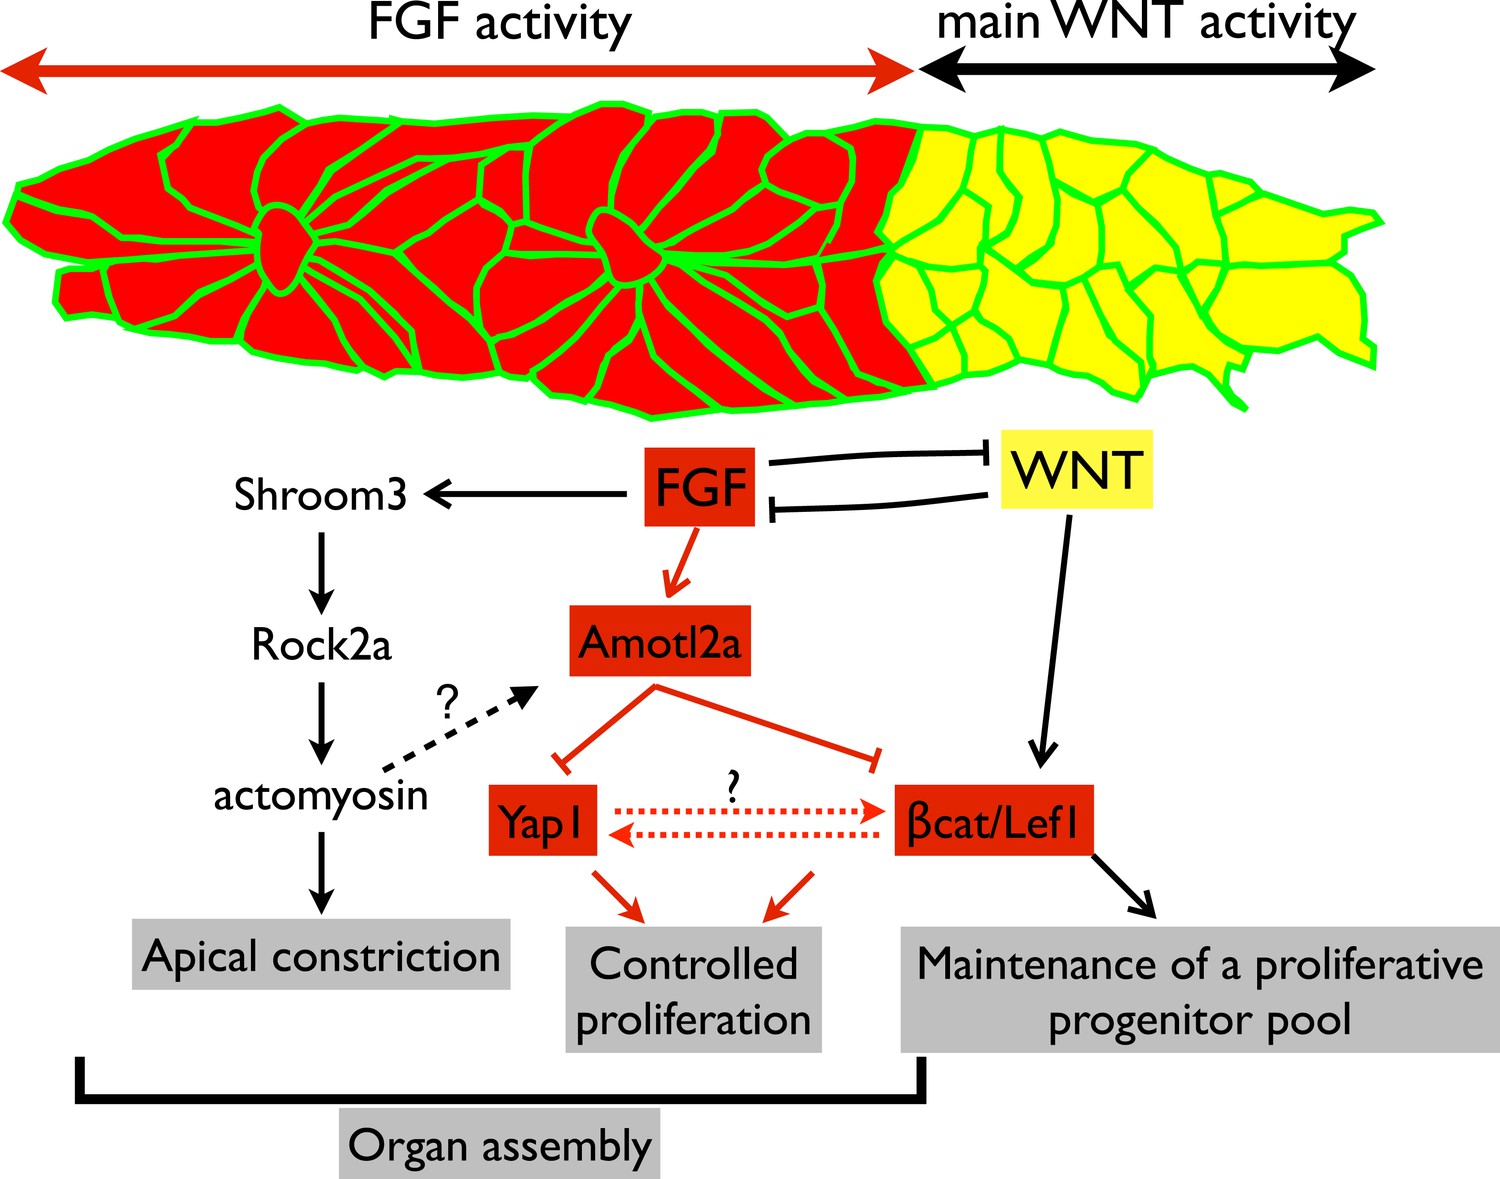
Working model.
Scheme summarizing the main regulatory pathways involved in proliferation control and organ formation in the pLLP. The red part corresponds to new findings from the present study. Dotted lines indicate hypothetical links.
Author response image 1
Additional files
-
Supplementary file 1
Supplementary tables A, B, C, D related to the ‘Materials and methods’ section.
- https://doi.org/10.7554/eLife.08201.042
Download links
A two-part list of links to download the article, or parts of the article, in various formats.
Downloads (link to download the article as PDF)
Open citations (links to open the citations from this article in various online reference manager services)
Cite this article (links to download the citations from this article in formats compatible with various reference manager tools)
Amotl2a interacts with the Hippo effector Yap1 and the Wnt/β-catenin effector Lef1 to control tissue size in zebrafish
eLife 4:e08201.
https://doi.org/10.7554/eLife.08201


