A K+-selective CNG channel orchestrates Ca2+ signalling in zebrafish sperm
- Center of Advanced European Studies and Research, Germany
- Ruhr-Universität Bochum, Germany
- Forschungszentrum Jülich, Germany
- University of Massachusetts Boston, United States
- Helmholtz-Zentrum München, Germany
Figures
Figure 1 with 3 supplements

Identification of DrCNGK channel homologues and of a K+ channel in D. rerio sperm.
(A) Phylogenetic tree (Page, 1996) of various ion channel families. The CNGK channel family exists in protozoa (dark blue), marine invertebrates and fish (medium blue), and freshwater fish (light blue). The HCN, CNG, and KCNH channel families are highlighted in green; voltage-gated Nav and Cav channels are highlighted in yellow; and voltage-gated Kv channels are highlighted in red. The following ion channel sequences were used: CNGK channels from zebrafish (DrCNGK), rainbow trout (OmCNGK), spotted gar (LoCNGK), West Indian Ocean coelacanth (LcCNGK), sea urchin (ApCNGK), acorn worm (SkCNGK), amphioxus (BfCNGK), starlet sea anemone (NvCNGK), vasa tunicate (CiCNGK), sponge (AqCNGK), choanoflagellate (SrCNGK); murine HCN channel subunits 1 (mHCN1), 2 (mHCN2), 3 (mHCN3), 4 (mHCN4), and the HCN channel from sea urchin (SpHCN1); rat CNGA subunits A1 (rCNGA1), A2 (rCNGA2), A3 (rCNGA3), and A4 (rCNGA4); the KCNH channels from fruit fly (DmEAG) and human (hERG); murine voltage-gated Nav (mNav 1.1 and mNav 1.6) and Cav channels (mCav1.1, mCav2.3 and mCav3.1) and voltage-gated Kv channels from fruit fly (DmShaker) and mouse (mKv3.1). Full-length Latin names and accession numbers are given in experimental procedures. Scale bar represents 0.1 substitutions per site. (B) Pseudo-tetrameric structure of CNGK channels. Numbers 1 to 4, homologous repeats; S1 to S6, transmembrane segments; yellow cylinders, cyclic nucleotide-binding domain CNBD; asterisks, epitopes recognized by antibodies anti-repeat1 of DrCNGK (polyclonal) and anti-repeat3 of DrCNGK (YENT1E2, monoclonal). (C) Whole-cell recordings from zebrafish sperm at low (left upper panel) and high (middle panel) extracellular K+ concentrations. Left lower panel: Voltage step protocol. Right panel: corresponding IV relations. (D) Whole-cell recordings from an isolated sperm head. Description see part C. (E) Whole-cell recording from zebrafish sperm (upper panel) and an isolated head (lower panel). (F) IV relation of recordings from part E. (G) Pooled IV relations ( ± sd) of currents from zebrafish sperm (filled circle, n = 23) and sperm heads (open squares, n = 6).
Figure 1—figure supplement 1
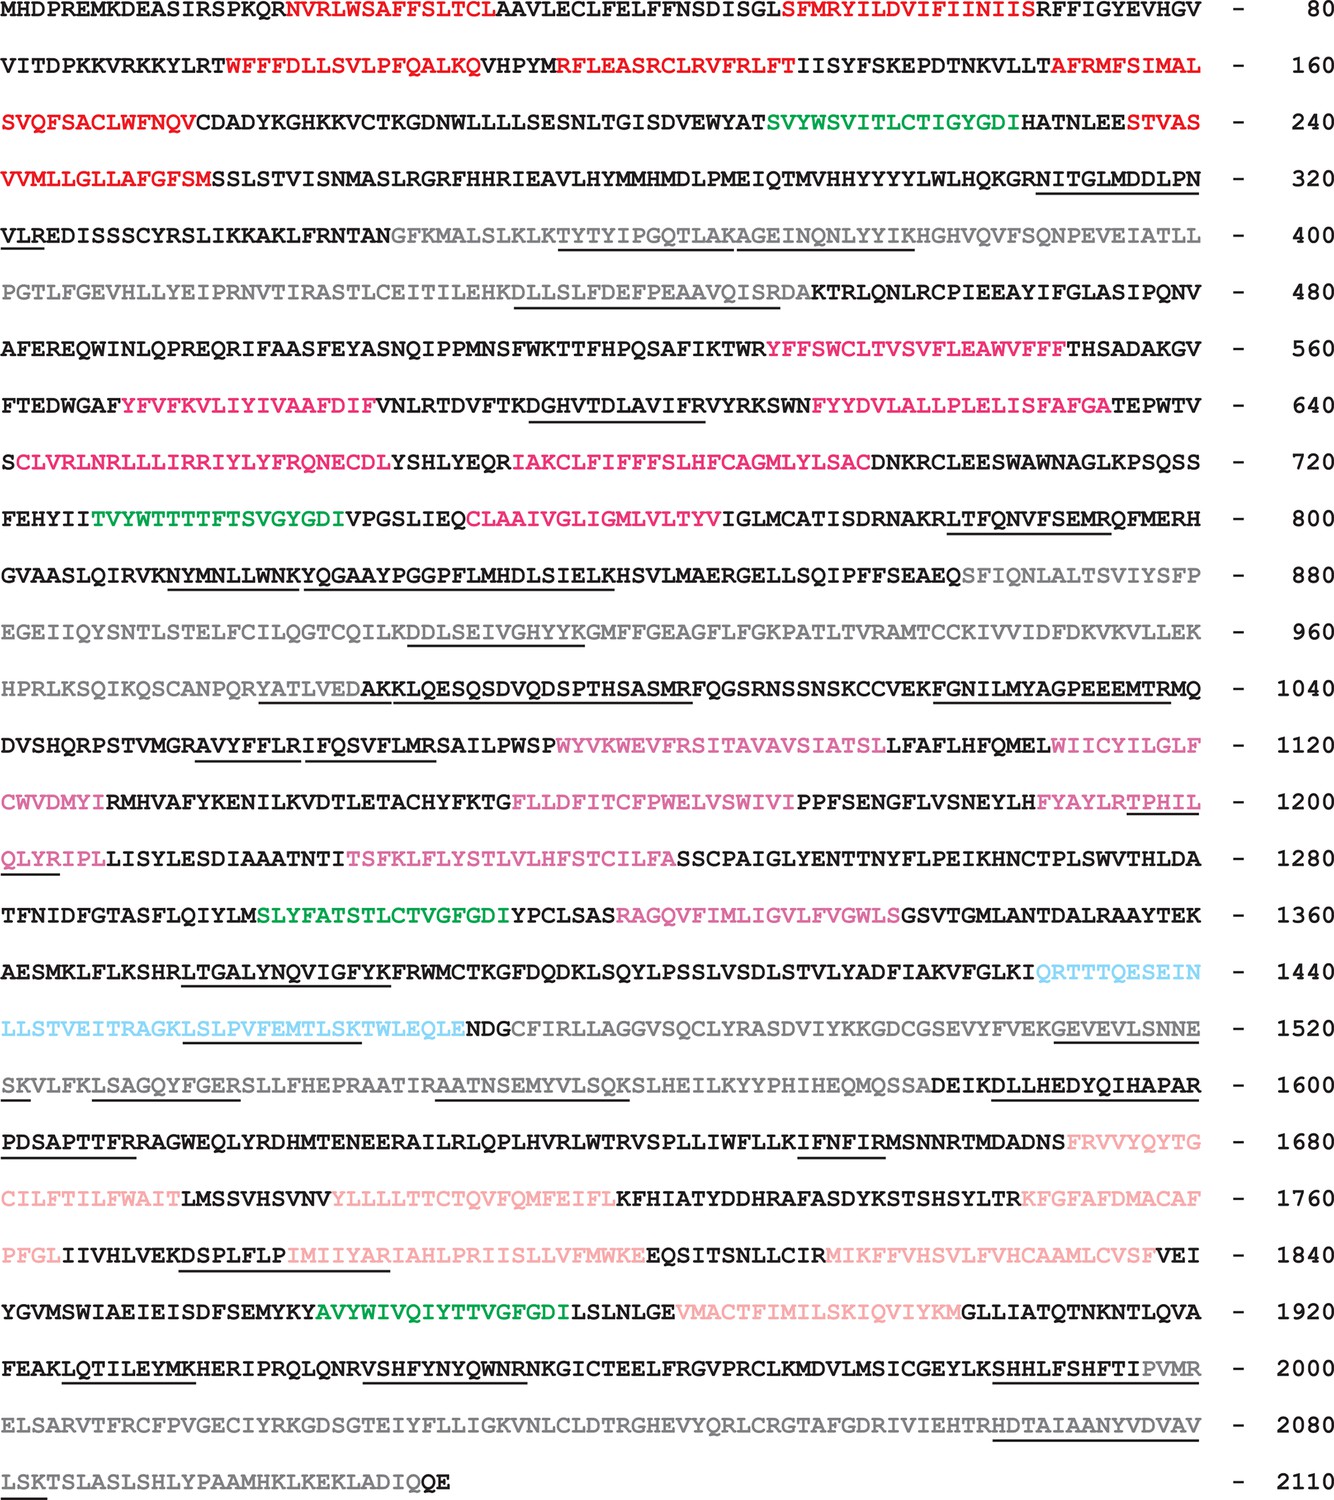
Amino-acid sequence of the DrCNGK channel.
Different colors indicate the transmembrane segments (red shades, repeats 1–4), the four pore regions (green), the four CNBDs (gray), and the unusual insert in the C-linker of the third repeat (blue). Lines below the sequence indicate peptides that were identified by mass spectrometry in testis and sperm preparations. The position of the last amino-acid residue in a row is given on the right.
Figure 1—figure supplement 2
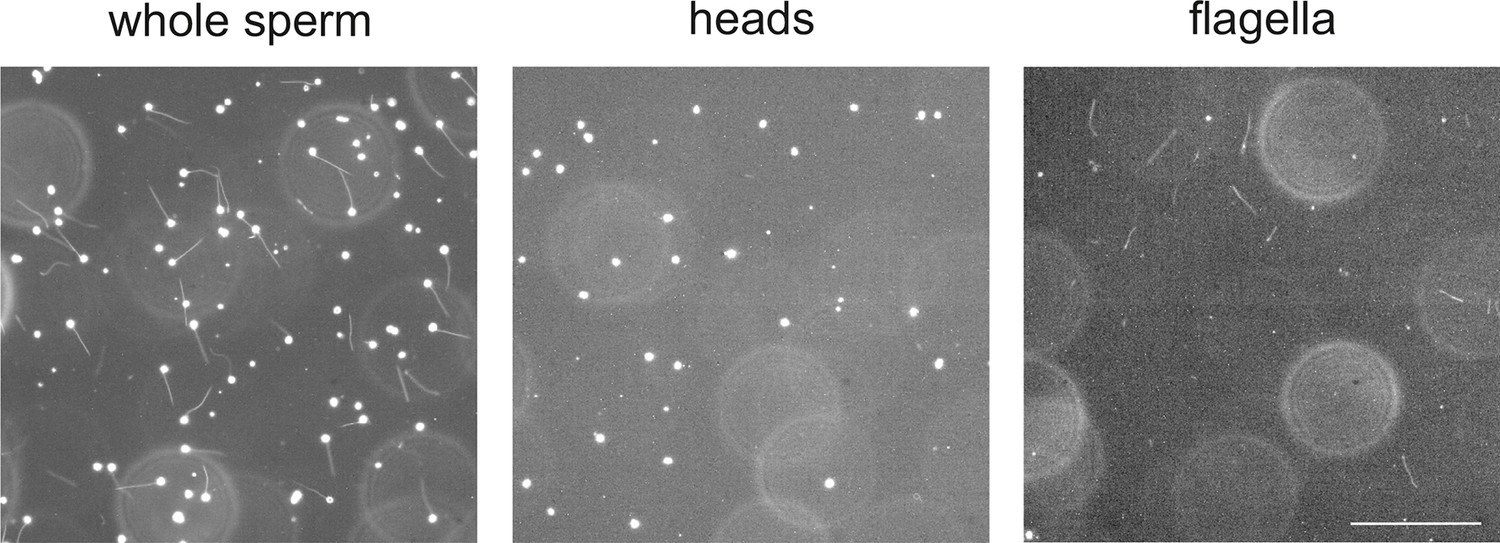
Separation of heads and flagella from whole sperm.
Dark-field micrographs of whole sperm (left), purified heads (middle), and purified flagella (right). Bar represents 100 µm.
Figure 1—figure supplement 3
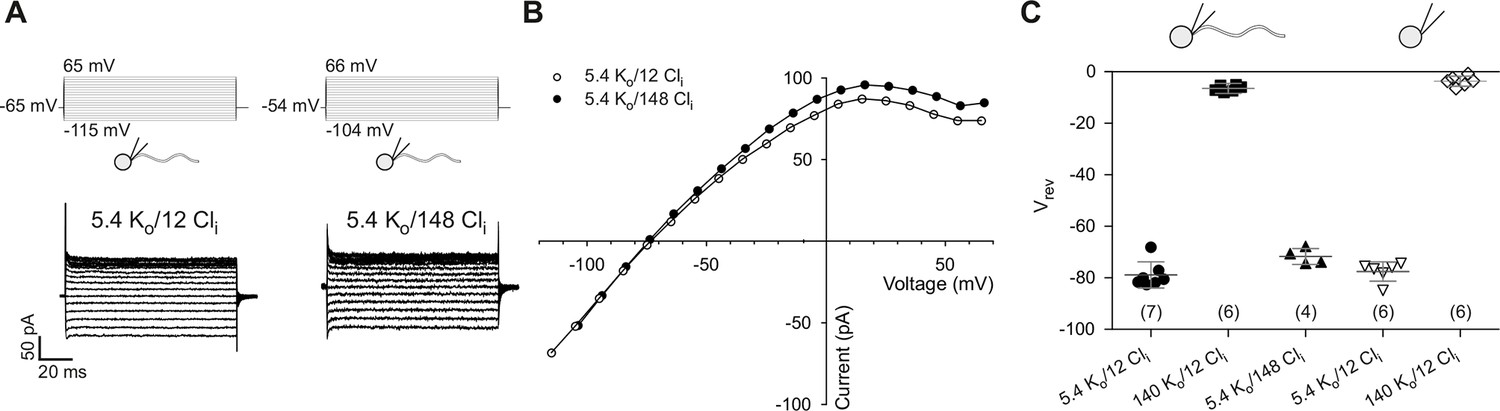
Electrophysiological characterization of currents recorded from zebrafish sperm.
(A) Whole-cell recordings at different intracellular Cl- concentrations (Cli).
(B) IV relations from part A.
(C) Reversal potentials (Vrev) from whole-cell recordings at different extracellular K+ (Ko) and intracellular Cl- concentrations (Cli) in whole sperm and isolated heads. Individual data (symbols) and mean ± sd (gray bars), number of experiments in parentheses.
Figure 2
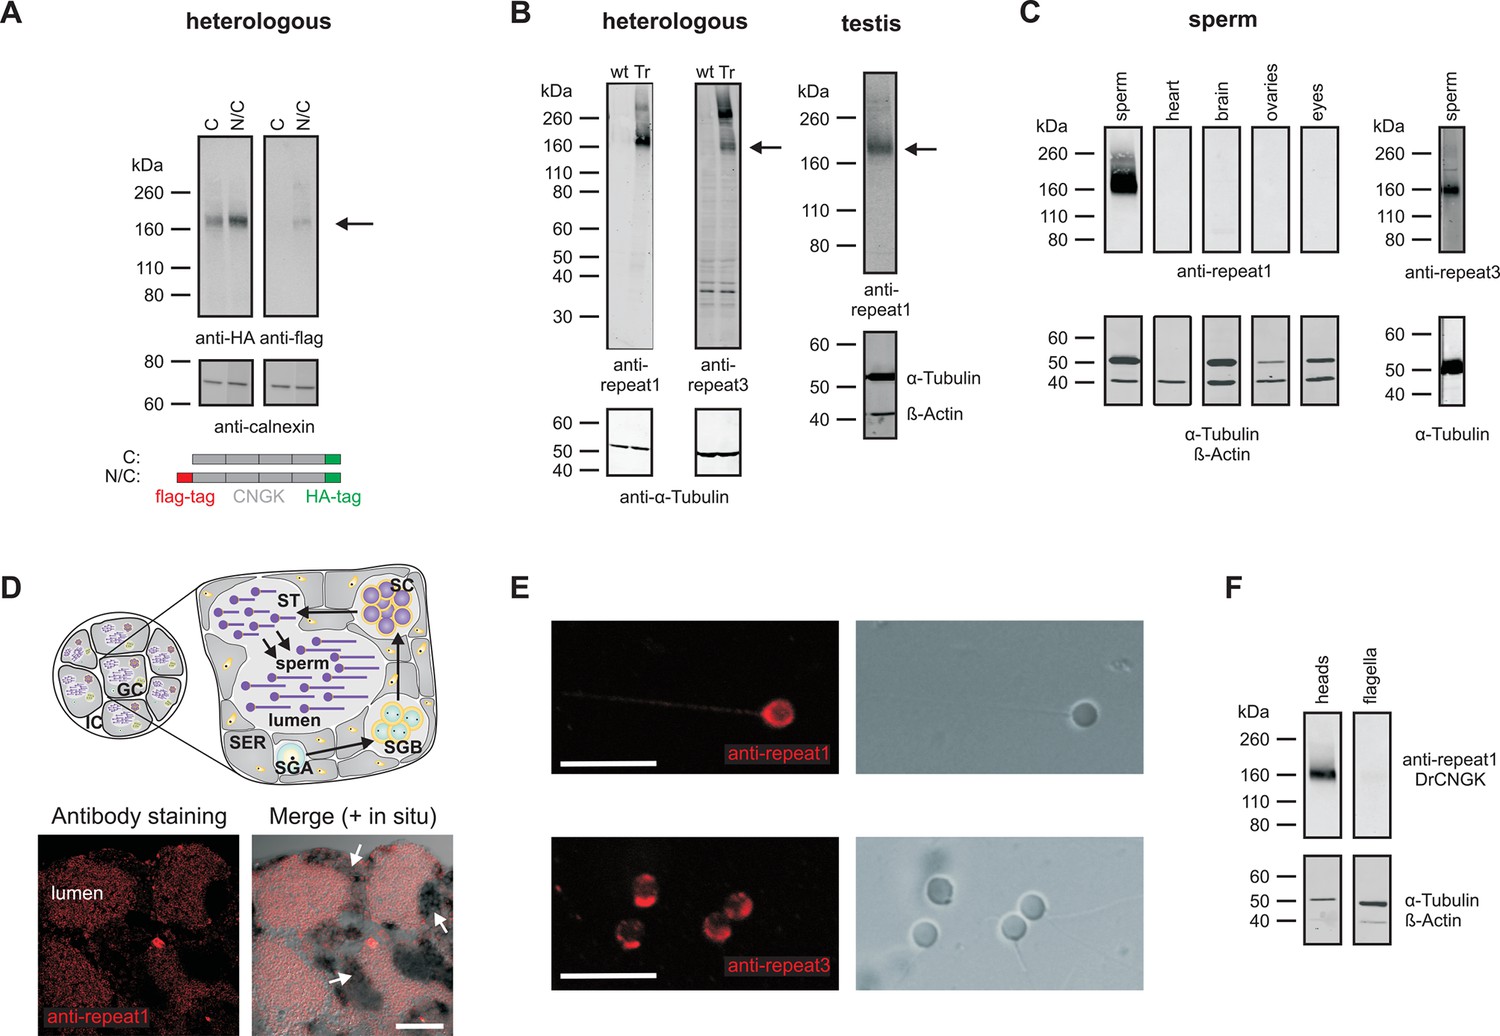
Localization of the DrCNGK channel.
(A) Western blot of membrane proteins (15 µg) from CHOK1 cells transfected with cDNA encoding either DrCNGK with a C-terminal HA-tag alone (lane C) or with both, a C-terminal HA-tag and an N-terminal flag-tag (N/C). Apparent molecular weight Mw is indicated on the left. (B) Characterization of anti-DrCNGK antibodies. Left: Western blot of membrane proteins (10 µg) from HEK293 cells transfected with cDNA encoding DrCNGK (Tr) and wild-type cells (wt). Right: Western blot of membrane proteins (15 µg) from zebrafish testis. (C) Western blot of membrane proteins (15 µg) from different zebrafish tissues. (D) Upper panel: Scheme of a testis cross-section. GC, germinal compartment; IC, intertubular compartment; SER, Sertoli cells; SGA, primary spermatogonia; SGB, secondary spermatogonia; SC, spermatocytes; ST, spermatids; scheme according to (Nobrega et al., 2009). Lower panel: Staining with anti-repeat1 antibody (red, left) and superposition (right) of the immunohistochemical image with a bright-field image of an in situ hybridization using an anti-DrCNGK-specific RNA probe (arrows). Bar represents 50 µm. (E) Staining of zebrafish sperm with anti-repeat1 (upper left panel) and anti-repeat3 antibody (lower left panel). Bars represent 10 µm. The respective bright-field images are shown (upper and lower right panels). (F) Western blot of equal amounts of total membrane proteins (15 µg) from purified heads and purified flagella.
-
Figure 2—source data 1
Indicators of merit for the mass spectrometric results of a testis preparation.
a m indicates oxidized methionine, b△M [ppm] relative mass error, c XCorr, △Score, and △Cn indicate results based on searches with the sequest algorithm in Proteome Discoverer; d PEP (Posterior Error Probability) describes the probability that the observed hit is a chance event.
- https://doi.org/10.7554/eLife.07624.008
-
Figure 2—source data 2
Indicators of merit for the mass spectrometric results of different sperm preparations: whole sperm, head and flagella.
a m indicates oxidized methionine, b△M [ppm] for all peptides is below ± 2.5, c XCorr indicates results based on searches with the sequest algorithm; Amanda indicates results based on searches with the MS Amanda algorithm, d PEP (Posterior Error Probability) describes the probability that the observed hit is a chance event; △Score and △Cn are not indicated separately since the scores for all peptides are 1 and 0, respectively.
- https://doi.org/10.7554/eLife.07624.009
Figure 3 with 5 supplements
Cyclic nucleotides do not activate K+ channels in sperm.
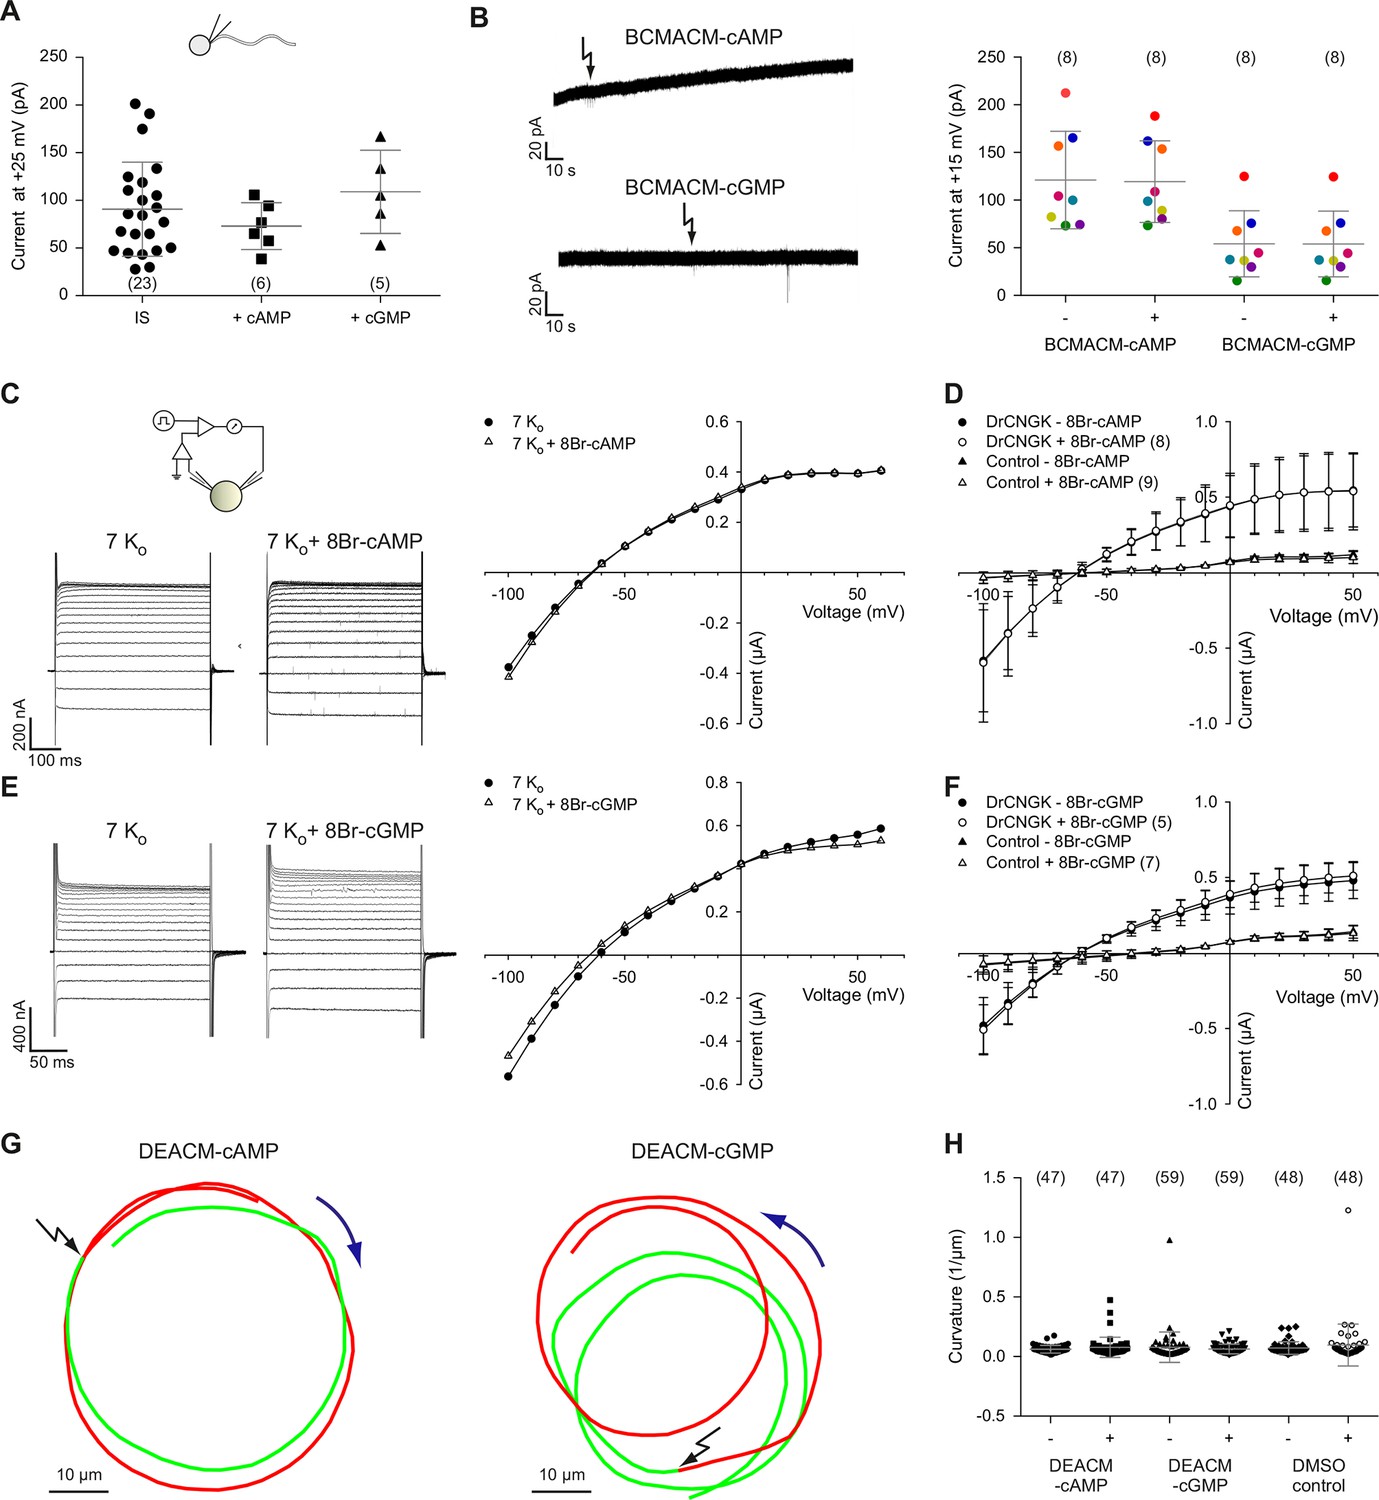
(A) Current amplitude of whole-cell recordings from zebrafish sperm at +25 mV in the absence or presence of 100 µM cAMP or cGMP in the pipette (control: 91 ± 49 pA (n = 23); cAMP: 73 ± 25 pA (n = 6); cGMP: 109 ± 44 pA (n = 5)). Individual data (symbols) and mean ± sd (gray bars), number of experiments in parentheses. (B) Photo-release of cyclic nucleotides from caged precursors inside sperm. Left panel: Whole-cell recordings at +15 mV from sperm loaded with 100 µM BCMACM-caged cAMP (upper panel) or BCMACM-caged cGMP (lower panel). Arrows indicate the delivery of the UV flash to release cyclic nucleotides by photolysis. Right panel: Mean current 3 s before (-) and 3 s after (+) the release of cAMP or cGMP. Statistics as in part A. Data points from individual sperm are indicated by identical colours. (C-F) Currents of heterologously expressed DrCNGK channels in the absence or presence of 8Br- analogs of cyclic nucleotides. (C) Left: Two-Electrode Voltage-Clamp recordings from DrCNGK-injected Xenopus oocytes. Currents shown are in the absence (left traces) and presence (right traces) of 10 mM 8Br-cAMP. Voltage steps as shown in Figure 3—figure supplement 1A. Right: IV relations of current recordings from the left panel. (D) Pooled IV curves from DrCNGK injected and control oocytes; recordings in the absence and presence of 10 mM 8Br-cAMP. (E) Left: Two-Electrode Voltage-Clamp recordings from DrCNGK injected Xenopus oocytes. Currents shown are in the absence (left traces) and presence (right traces) of 10 mM 8Br-cGMP. Right: IV relations of current recordings from the left panel. (F) Pooled IV curves from DrCNGK-injected and control oocytes; recordings in the absence and presence of 10 mM 8Br-cGMP. (G) Swimming path before (green line) and after (red line) photo-release (black flash) of cAMP (left panel) or cGMP (right panel). The blue arrow indicates the swimming direction. Photo-release of cyclic nucleotides was verified by monitoring the increase of fluorescence of the caging group (Figure 3—figure supplement 5) (Hagen et al., 2003). (H) Path curvature before (-) and after (+) release of cAMP or cGMP. Sperm were loaded with 30 µM DEACM-caged cAMP or DEACM-caged cGMP. Statistics as in part A.
Figure 3—figure supplement 1
K+ dependence of heterologously expressed DrCNGK channels in oocytes and channel block by tetraethylammonium (TEA).
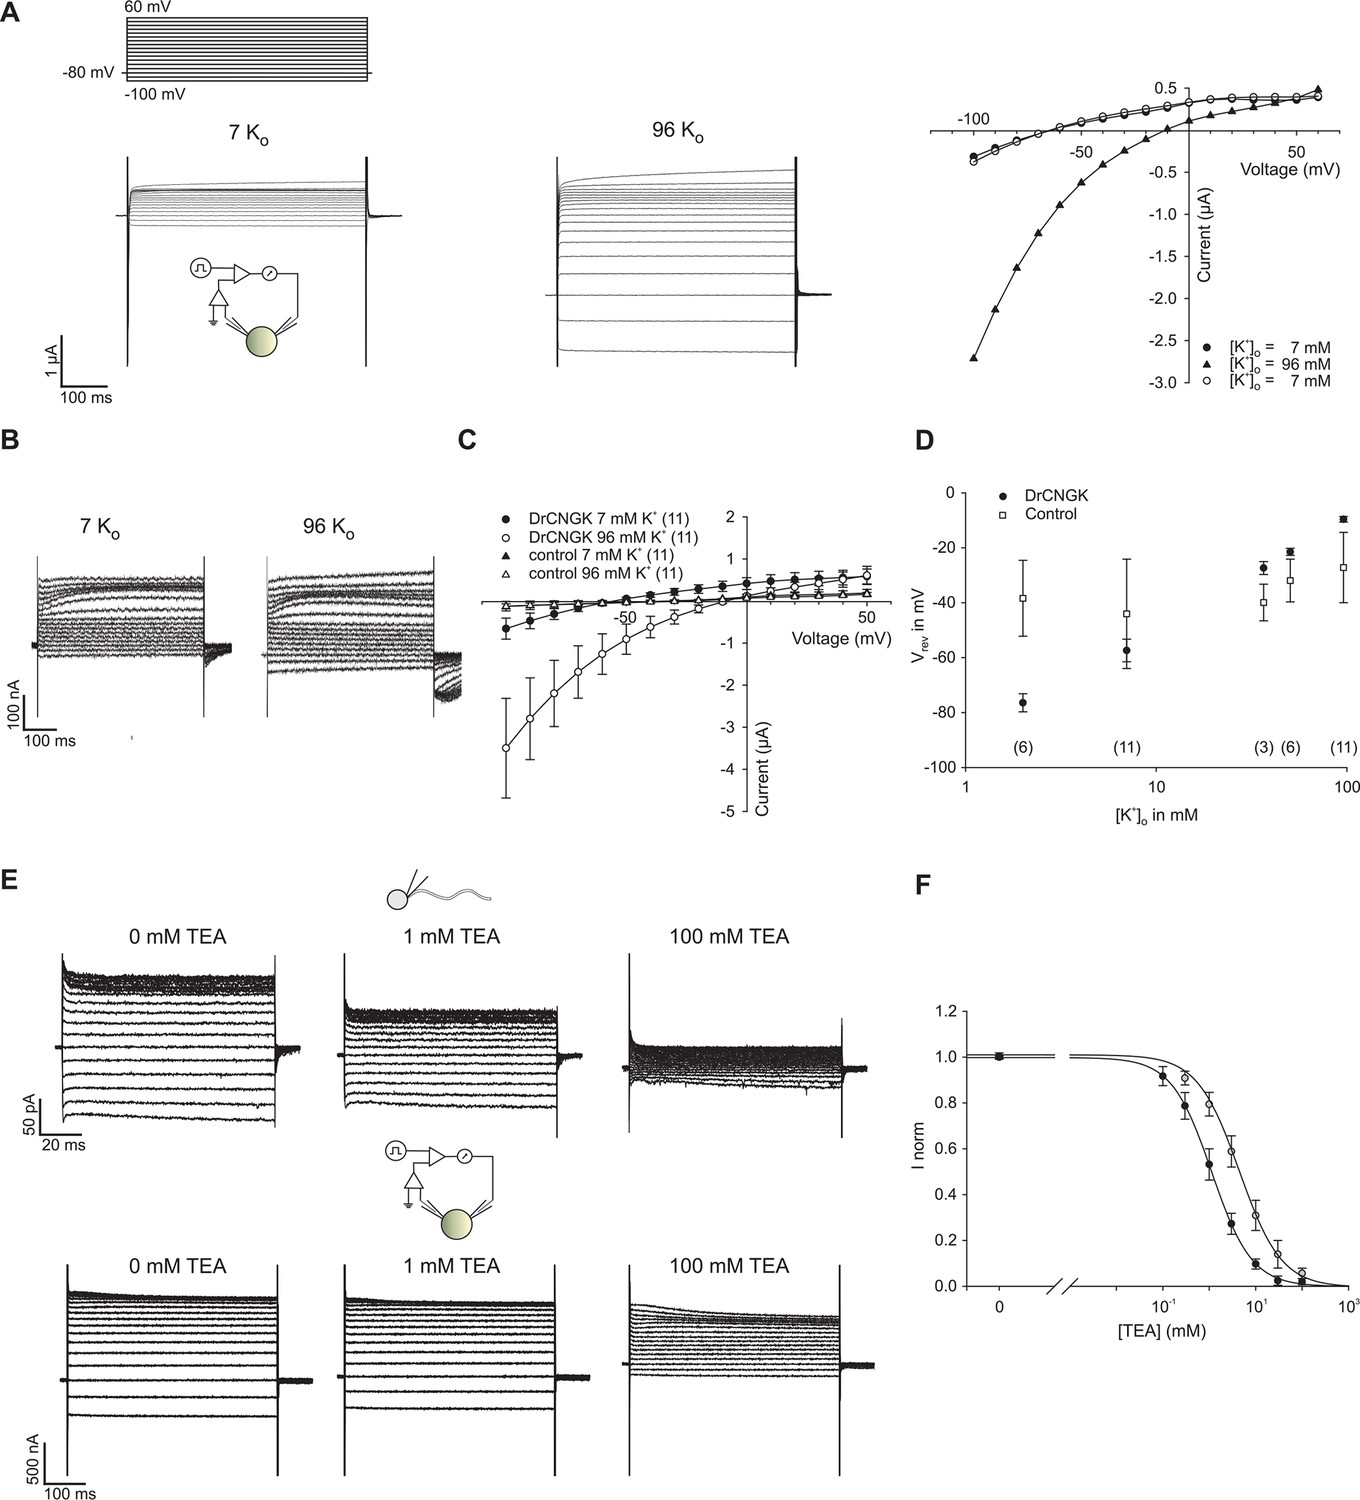
(A) Two-Electrode Voltage-Clamp recordings of heterologously expressed DrCNGK channels in the presence of different K+ concentrations (left panel: 7 mM, middle panel: 96 mM) and corresponding IV relation (right panel). (B) Two-Electrode Voltage-Clamp recordings of uninjected oocytes (control) in the presence of different K+ concentrations (left panel: 7 mM, middle panel: 96 mM). (C) Pooled IV curves of Two-Electrode Voltage-Clamp recordings of DrCNGK-injected and uninjected oocytes (control) in the presence of different K+ concentrations (left panel: 7 mM, middle panel: 96 mM). Number of experiments is given in parentheses. (D) Reversal potentials (Vrev) of DrCNGK-injected and control oocytes in the presence of different K+ concentrations. Number of experiments is given in parentheses. (E) Whole-cell recordings from zebrafish sperm and Two-Electrode Voltage-Clamp recordings from heterologously expressed DrCNGK channels in the absence and presence of different TEA concentrations (0, 1, and 100 mM TEA). (F) Normalized ((I-IminFit)/ImaxFit) dose dependence of TEA block. Mean current ± sd. Individual dose response curves were fitted with the Hill equation. Mean ( ± sd) Ki value and Hill coefficient for sperm K+ current were 4.5 ± 1.1 mM and 1.0 ± 0.2 (n = 5) and for DrCNGK in oocytes 1.6 ± 0.3 mM and 1.0 ± 0.1 (n = 11), respectively. The solid lines were calculated with the Hill equation using mean values for Ki and the Hill coefficient.
Figure 3—figure supplement 2
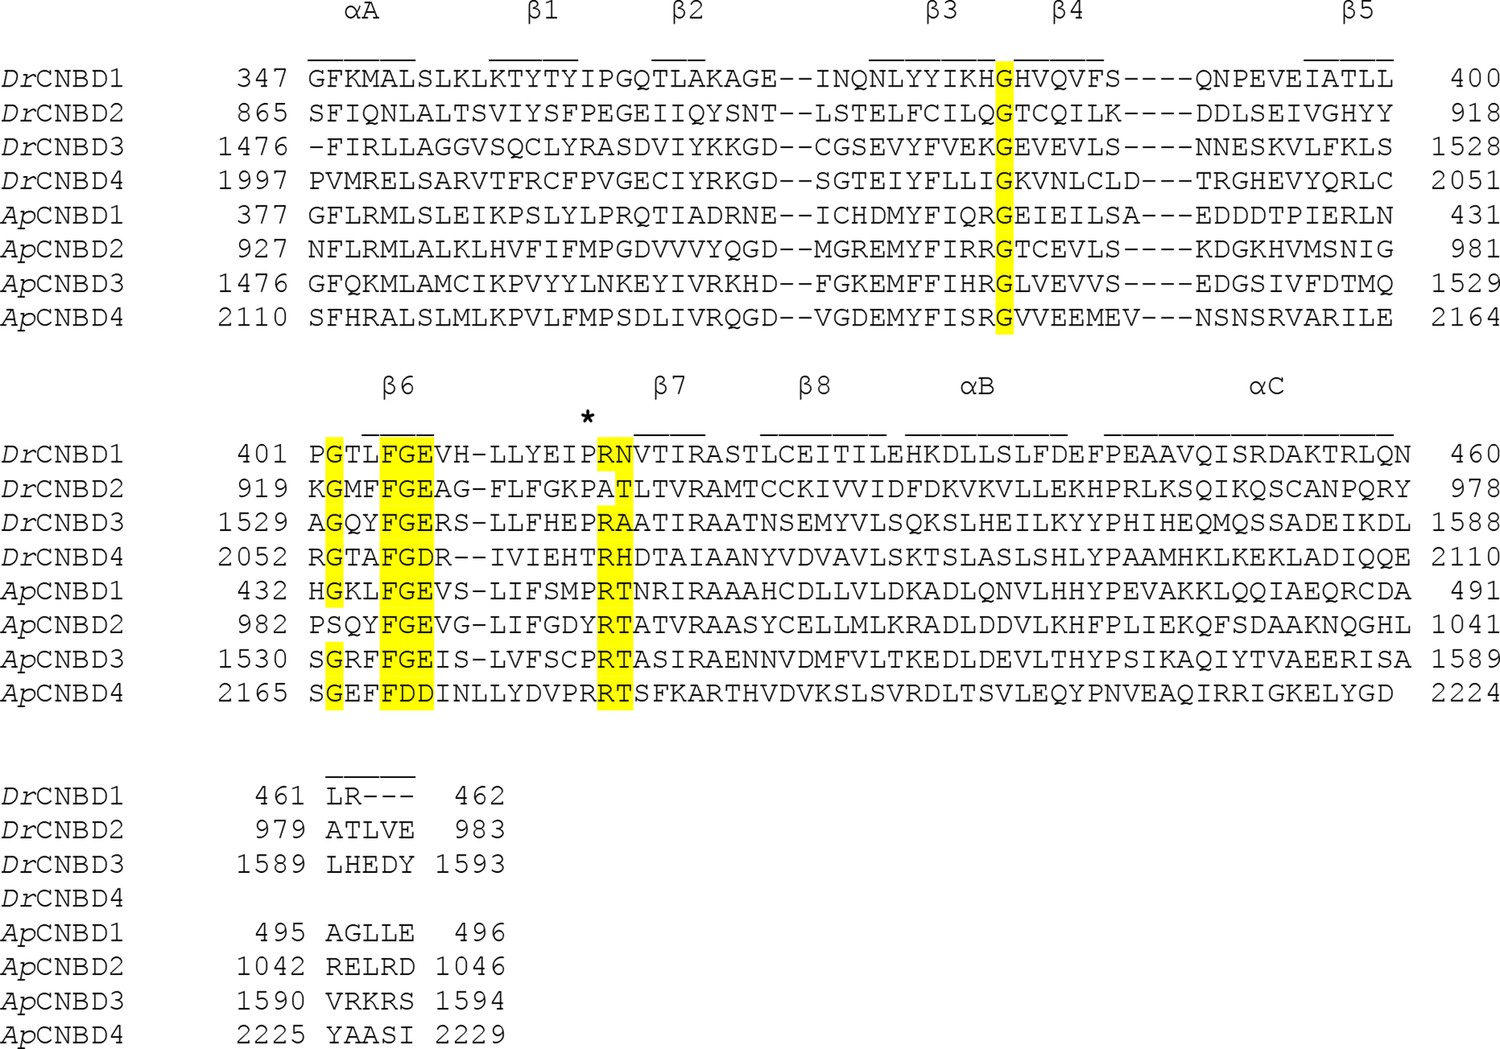
Sequence alignment of the individual CNBDs from the DrCNGK and ApCNGK channels.
The secondary structure elements of CNBDs are indicated above the sequences. A key Arg residue between β6 and β7 is indicated by an asterisk. An FGE motif important for interaction with cyclic nucleotides and highly conserved Gly residues that are important for the CNBD fold are highlighted in yellow.
Figure 3—figure supplement 3
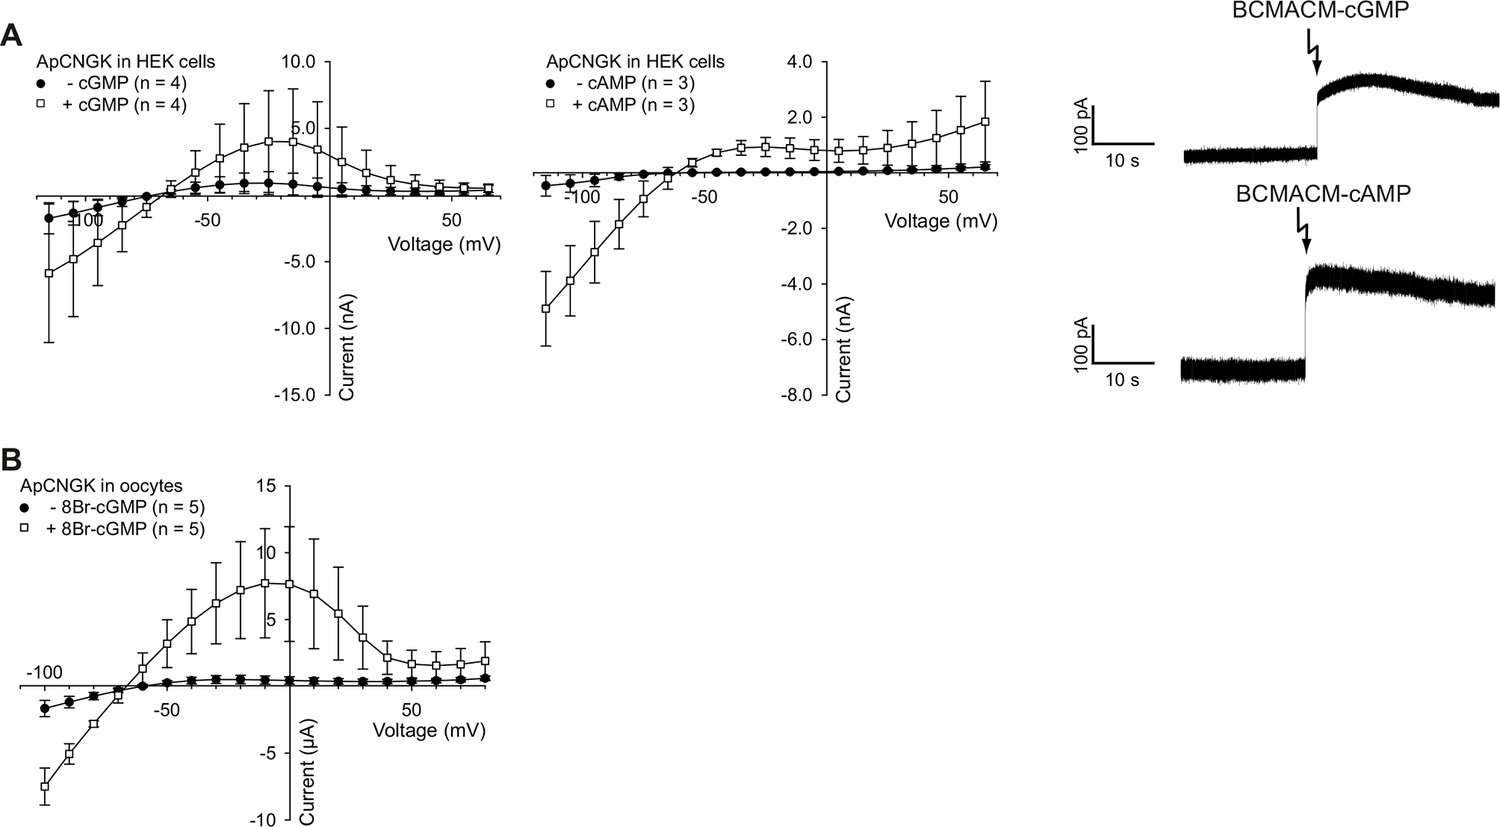
Photo-release of cyclic nucleotides in HEK cells expressing ApCNGK channels and use of 8Br-analogs in ApCNGK-injected oocytes.
(A) Left and middle panel: Pooled IV curves of ApCNGK channels heterologously expressed in HEK cells before (-cGMP or -cAMP) and after the release of cGMP or cAMP. Cells were loaded with 100 µM BCMACM-GMP or BCMACM-cAMP. Right panel: Whole-cell recordings at +15 mV from HEK cells heterologously expressing ApCNGK channels loaded with 100 µM BCMACM-caged cGMP (upper panel) or BCMACM-caged cAMP (lower panel). Arrows indicate the delivery of the UV flash to release cyclic nucleotides by photolysis. (B) Pooled IV curves of Two-Electrode Voltage-Clamp recordings of ApCNGK-injected oocytes in the presence and absence of 3 mM 8Br-cGMP.
Figure 3—figure supplement 4
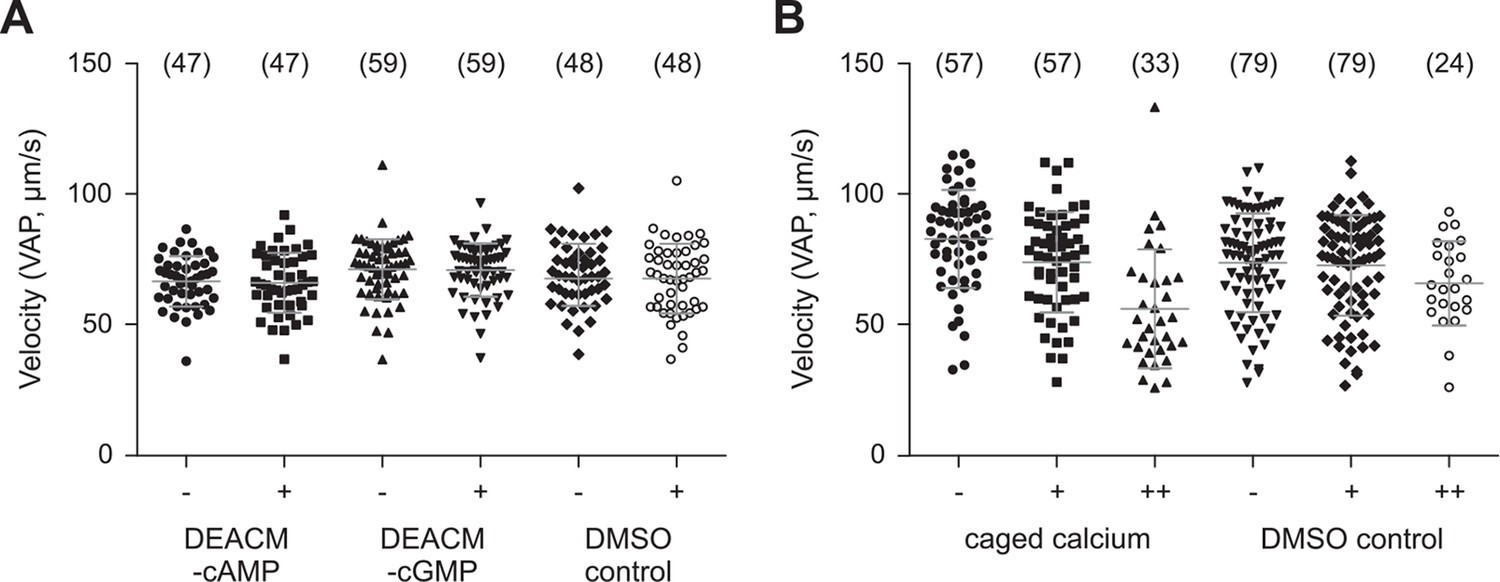
Photo-release of cyclic nucleotides (A) or Ca2+ (B) in sperm.
(A) Mean velocity (averaged-path velocity, VAP) before (-) and after (+) release of cAMP or cGMP. Sperm were loaded with 30 µM DEACM-caged cAMP or DEACM-caged cGMP. Individual data (symbols) and mean ± sd (gray bars), number of experiments in parentheses. (B) Mean velocity (VAP) before and after the 1st (+) and 2nd (++) UV flash. Statistics as in part A.
Figure 3—figure supplement 5
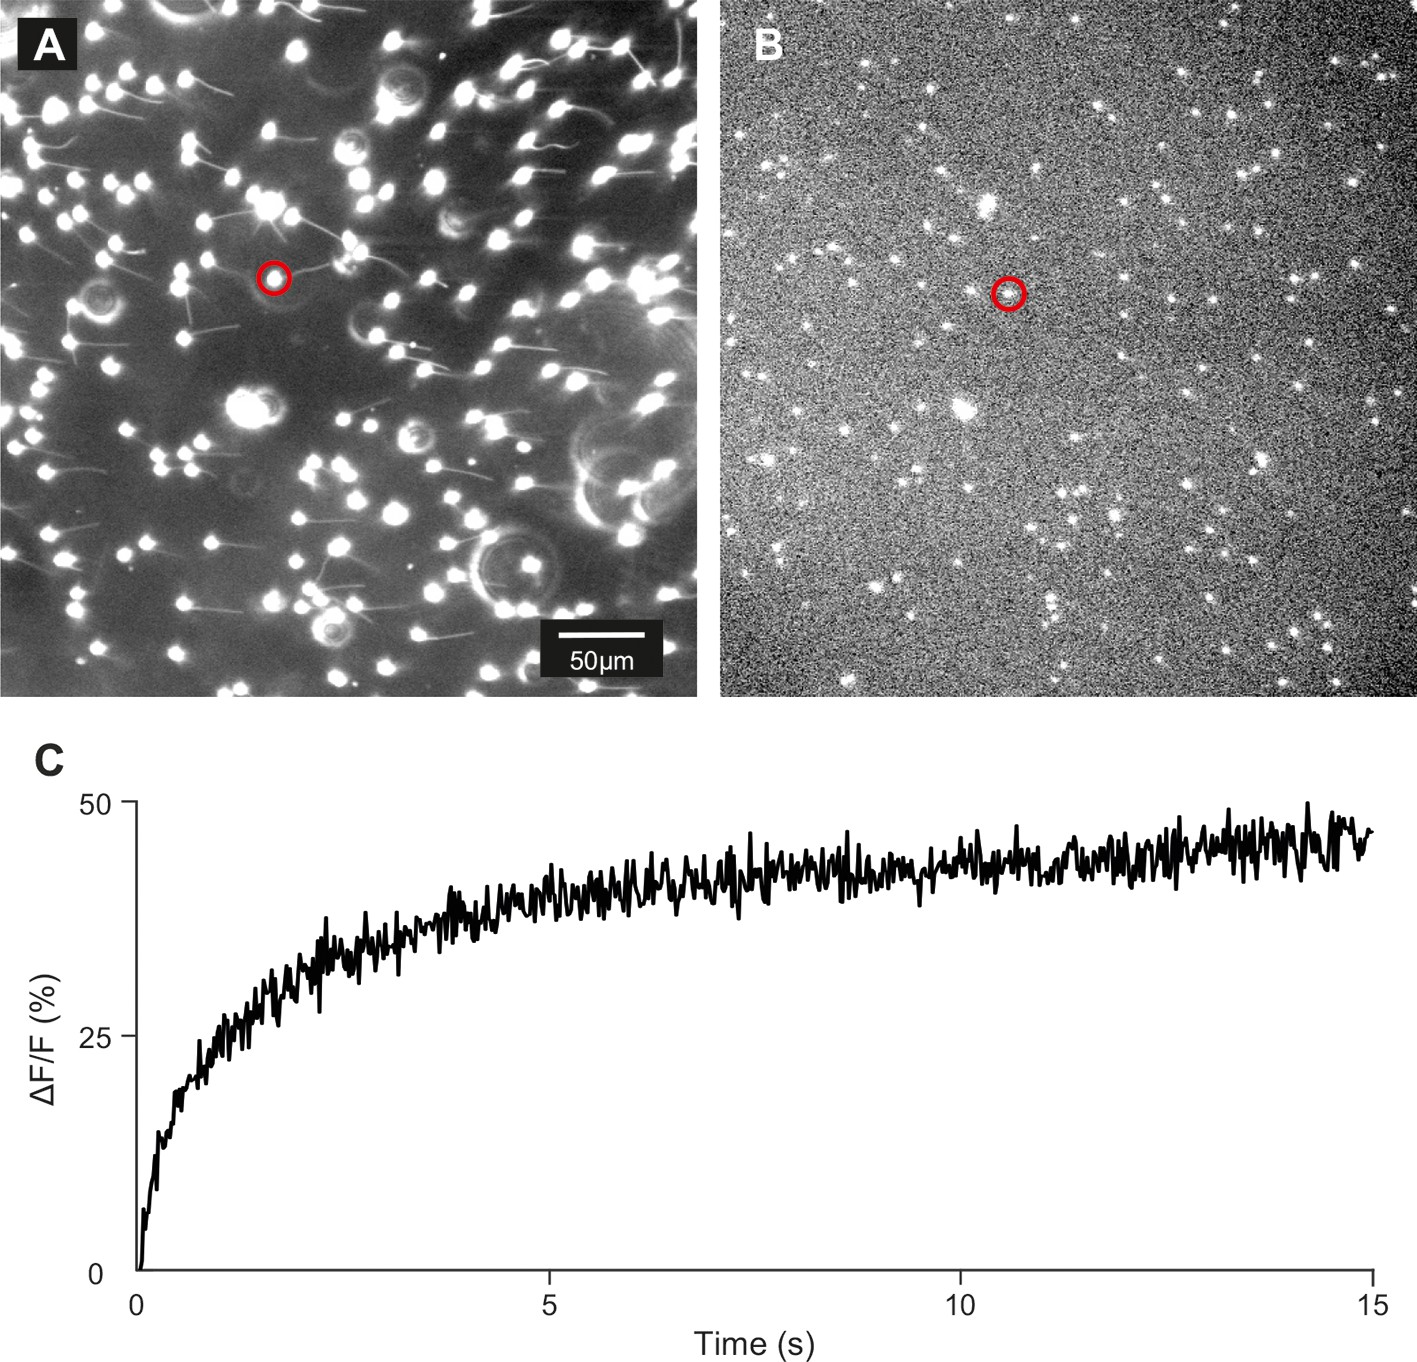
Control of loading and release of DEACM-cAMP in zebrafish sperm.
(A) Dark-field micrograph (using red light) of sperm loaded with DEACM-caged cAMP (30 µM). (B) Fluorescence image after 15 s of continuous illumination with 365 nm UV light (1.75 mW power). (C) Time course of the release for the cell marked with a red circle.
Figure 4
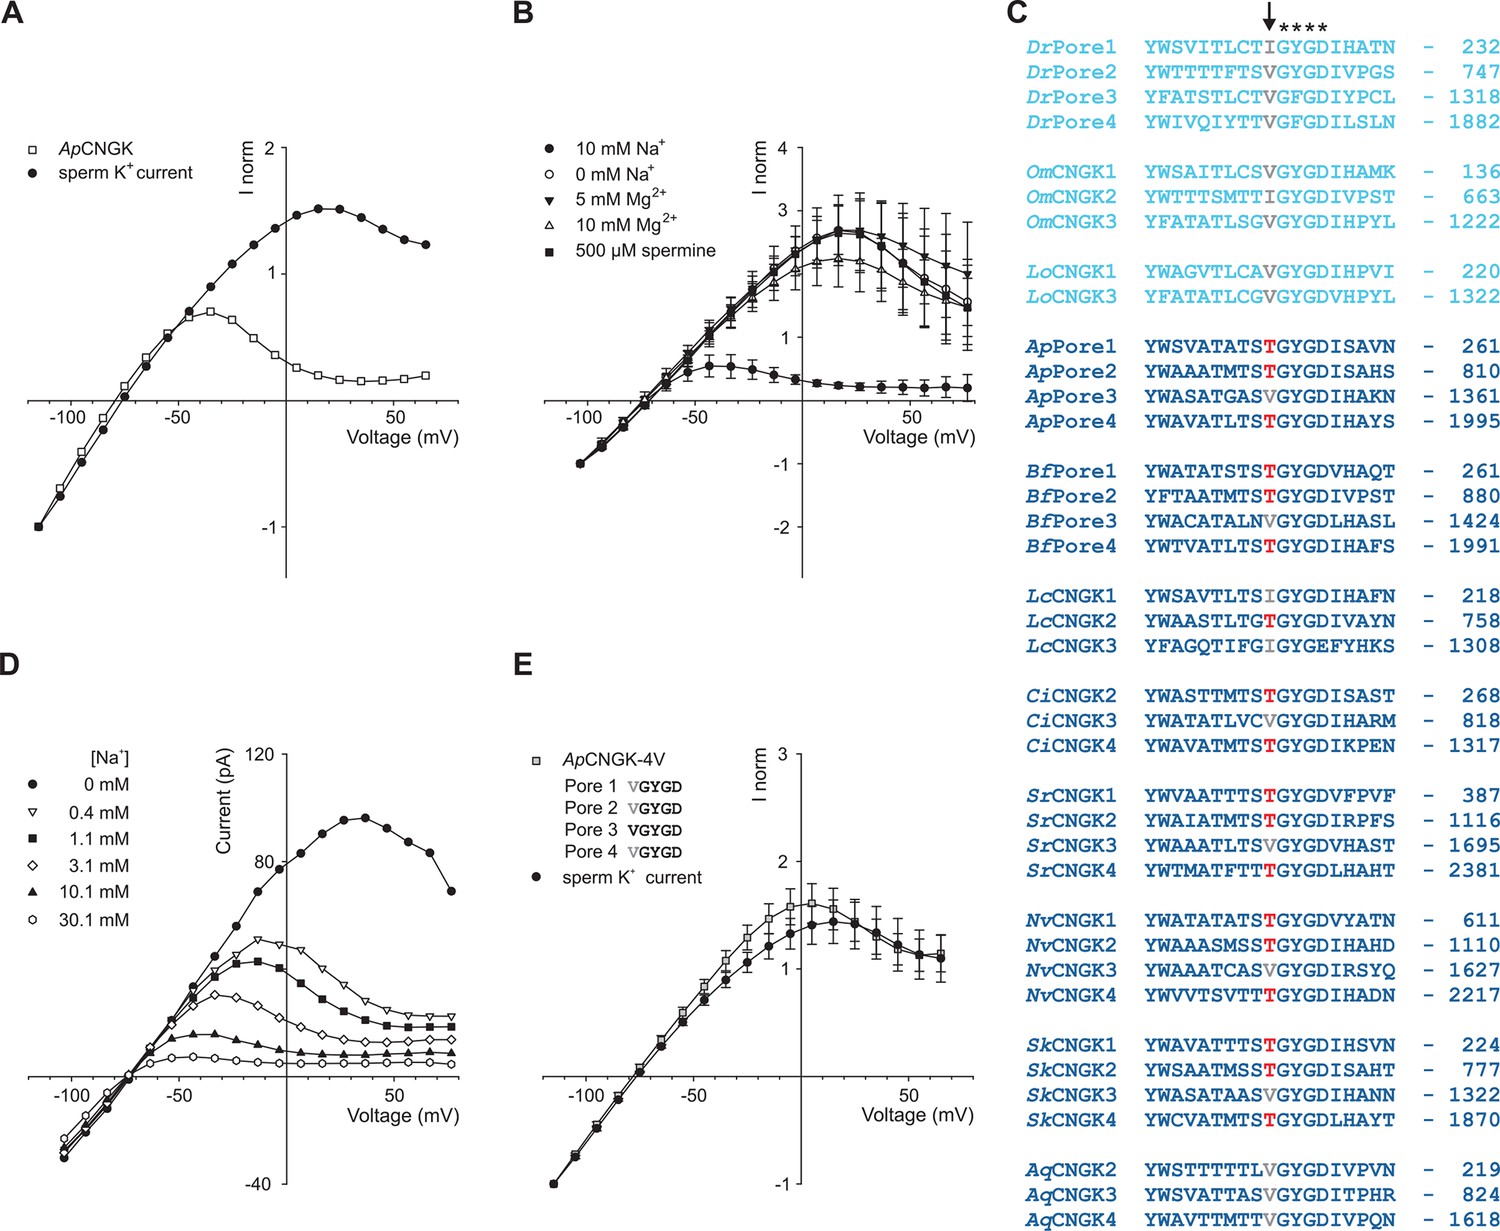
Comparison of sperm K+ current with current from heterologously expressed ApCNGK channels.
(A) Normalized IV relations of whole-cell recordings from zebrafish sperm and ApCNGK channels expressed in HEK293 cells. Pipette solution: standard IS. Bath solution: standard ES. Currents were normalized to -1 at -115 mV. (B) Normalized IV relations (mean current ± sd, n = 6) of inside-out recordings from ApCNGK channels expressed in HEK293 cells. Pipette solution: standard ES, bath solution: NMDG-based IS with the indicated concentrations of Na+, Mg2+, and spermine. Currents were normalized to -1 at -103 mV. (C) Alignment of pore regions from different CNGK channels. Freshwater fishes are highlighted in light blue and seawater species in dark blue. The position of the last amino-acid residue is given on the right. Asterisks indicate the G(Y/F)GD selectivity motif. A key threonine residue that is conserved in three repeats of the ApCNGK channel and other seawater species is highlighted in red (arrow). Hydrophobic amino acids at this position are indicated in gray. (D) IV relations of inside-out recordings of ApCNGK channels expressed in HEK293 cells. Pipette solution: ES; bath solution: NMDG-based IS. Different Na+ concentrations were added to the bath solution. (E) Normalized IV relations (mean current ± sd) of whole-cell recordings from zebrafish sperm (n = 18) and from ApCNGK-4V channels (n = 7) expressed in HEK293 cells. Currents were normalized to -1 at -115 mV. Inset: amino-acid sequence of the pore region of the mutant ApCNGK-4V. ApCNGK channels were activated with 100 µM cGMP.
Figure 5 with 3 supplements
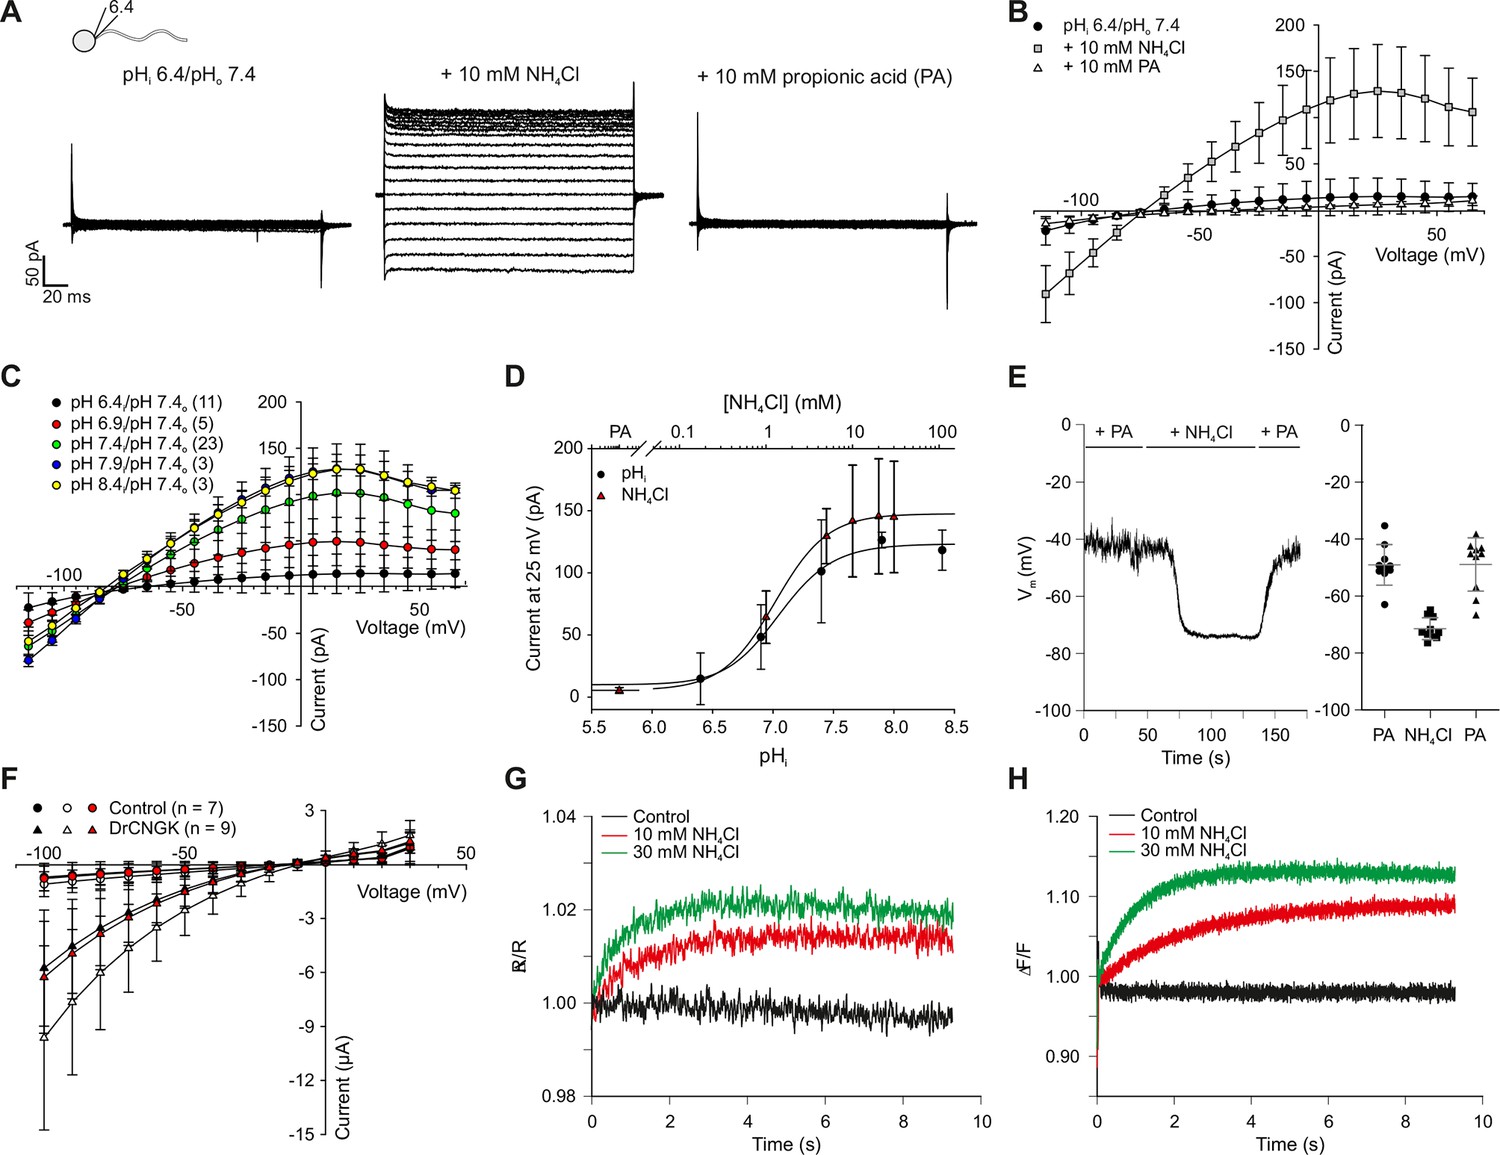
pH regulation of the DrCNGK channel.
(A) Whole-cell recordings from zebrafish sperm after perfusion with NH4Cl or propionic acid. Voltage steps as shown in Figure 1C. Recordings at extracellular pH 7.4 and pipette pH 6.4 (left). NH4Cl (10 mM, middle) or propionic acid (10 mM, right) was added to the bath. (B) Pooled IV curves for recordings from zebrafish sperm at a pipette pHi of 6.4 and in the presence of 10 mM NH4Cl or 10 mM propionic acid (PA). (C) Pooled IV curves from recordings of zebrafish sperm at different intracellular pHi. (D) Dependence of mean current ( ± sd) on intracellular pHi (circles, bottom axis) or in the presence of either 10 mM propionic acid (PA) or different NH4Cl concentrations (triangles, top axis). (E) Recording of the voltage signal of zebrafish sperm in the current-clamp configuration. Pipette solution with an intracellular pHi of 6.4; recording in the presence of 10 mM NH4Cl or 10 mM propionic acid (PA). Left panel: single recording. Right panel: individual data (symbols) and mean ± sd (gray bars), n = 10. (F) Pooled IV curves of Two-Electrode Voltage-Clamp recordings from heterologously expressed DrCNGK channels and uninjected wild-type oocytes in 96 mM K+ bicarbonate solution (black and red symbols) or 96 mM K+ gluconate, including 1 mM NH4Cl (white symbols, see Figure 5—figure supplement 1 for recordings). (G) Changes in fluorescence of a zebrafish sperm population incubated with the pH indicator BCECF, recorded as the ratio of fluorescence at 549/15 nm and 494/20 nm (excited at 452/28 nm), before (black) and after the addition of 10 mM (red) or 30 mM (green) NH4Cl. (H) Stimulation of sperm with NH4Cl as in panel G using the Ca2+ indicator Cal-520. Fluorescence was excited at 494/20 nm and recorded at 536/40 nm. Fluorescence F was normalized to the control value F0 before stimulation.
Figure 5—figure supplement 1
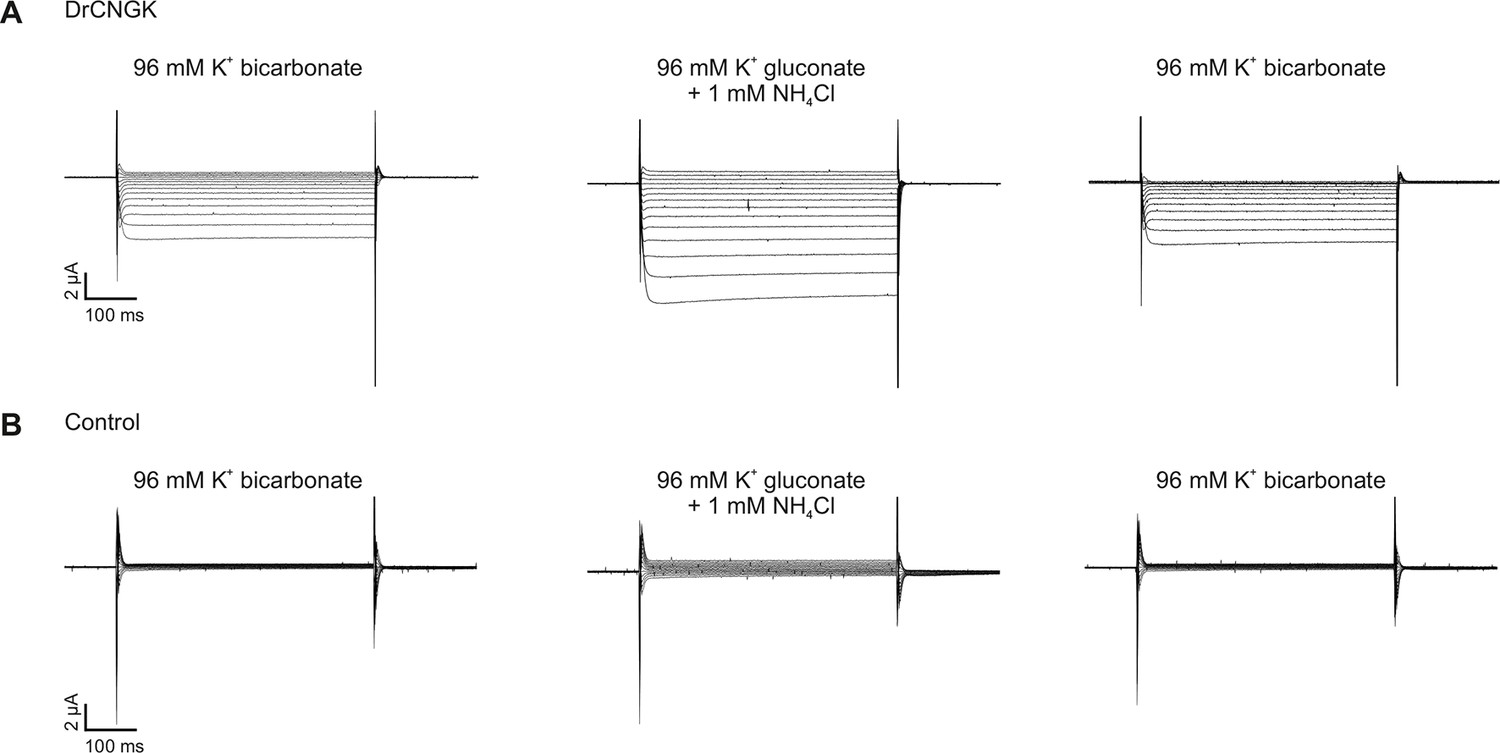
pH dependence of heterologously expressed DrCNGK channels in oocytes.
Two-Electrode Voltage-Clamp recordings of DrCNGK-injected (A) and uninjected (B) oocytes. Cells were reversibly perfused with 96 mM K+ bicarbonate followed by 1 mM NH4Cl added to K+ gluconate (10 min each). Voltage steps from -100 mV to + 30 mV from a holding potential of -60 mV.
Figure 5—figure supplement 2
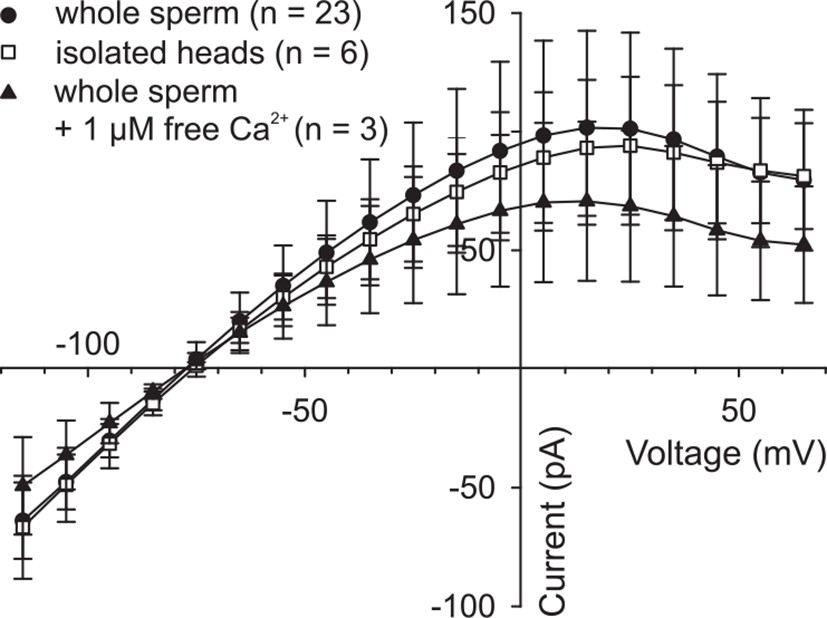
High intracellular Ca2+ does not suppress DrCNGK currents.
Pooled IV relations of whole-cell recordings from whole sperm and isolated heads under standard conditions (ES/IS, pH 7.4) (Figure 1G) and from whole sperm, when [Ca2+]i in the pipette solution was adjusted to 1 µM.
Figure 5—figure supplement 3
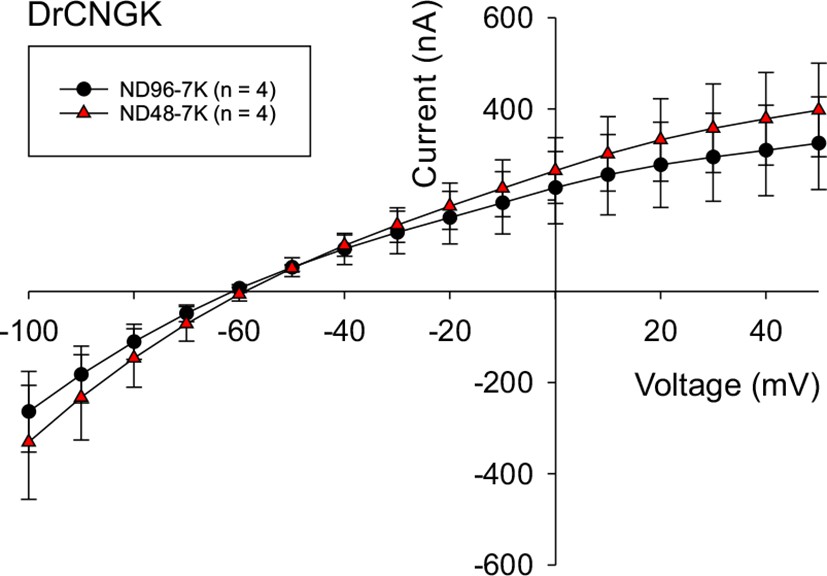
Hypoosmotic conditions do not stimulate or diminish DrCNGK currents in Xenopus oocytes.
DrCNGK-injected oocytes were recorded in the TEVC mode in ND96-7K and ND48-7K olutions (n = 4). No significant differences were observed.
Figure 6

Sperm swimming behaviour upon Ca2+ release.
(A), (B), and (C) representative swimming paths of three different DMSO loaded sperm before and after application of UV light. (D), (E), and (F) representative averaged swimming paths of three different sperm before (green) and after Ca2+ release by one (red) or two (cyan) consecutive UV flashes (black arrows). Curved blue arrows indicate the swimming direction of sperm. (G) Same swimming path shown in (F) including a temporal axis to facilitate the visualization of the changes in swimming path after consecutive flashes. Upon release (black arrows), the curvature of the swimming path progressively increases and the cell finally spins around the same position. (H) Representative flagellar shapes before (-), after Ca2+ release by one (+) or two consecutive flashes (++), and during cell spinning against the wall (bottom right). Consecutive frames every 100 ms are shown in different colours. Sequence order: red, green, blue, and yellow. (I) Mean curvature before (-) and after one (+) or two (++) UV flashes. Individual data (symbols) and mean ± sd (gray bars), number of experiments in parentheses.
Figure 7
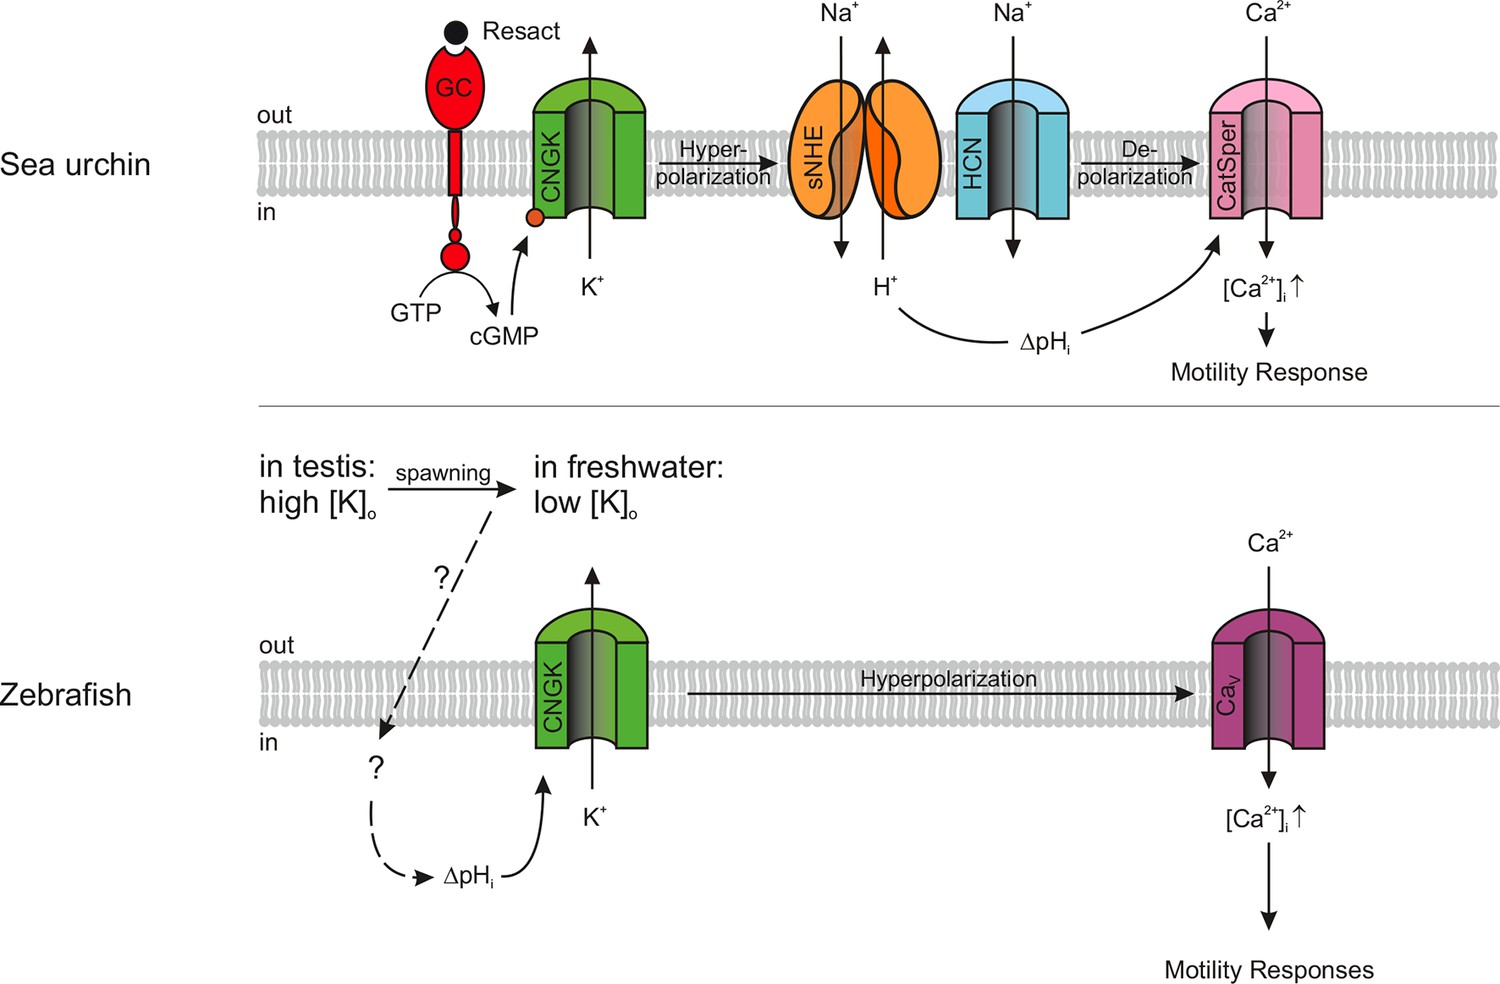
Models of signalling pathways in sea urchin and zebrafish sperm.
Sea urchin (upper panel): Binding of the chemoattractant resact to a receptor guanylyl cyclase (GC) activates cGMP synthesis. Cyclic GMP opens K+-selective CNG channels (CNGK), thereby, causing a hyperpolarization, which in turn activates a sperm-specific Na+/H+ exchanger (sNHE) that alkalizes the cell. Alkalization and subsequent depolarization by hyperpolarization-activated and cyclic nucleotide-gated (HCN) channels lead to the opening of sperm-specific CatSper channels. Zebrafish (lower panel): Upon spawning, K+ efflux through CNGK hyperpolarizes sperm. An unknown mechanism of alkalization (dashed lines) modulates the open probability of CNGK channels; the ensuing hyperpolarization opens voltage-gated Ca2+ channels (Cav).
Videos
Video 1
Behavioural response of zebrafish sperm to successive Ca2+ release.
Representative recording of zebrafish sperm loaded with NP-EGTA (40 µM). Upon release of Ca2+, the swimming path curvature increases and, eventually, sperm spin against the wall of the recording chamber with their flagellum pointing away from the wall. Video recorded using dark-field microscopy at 30 frames per second using a 20x magnification objective. The field of view corresponds to 410 µm. The Video is shown in real time.
Download links
A two-part list of links to download the article, or parts of the article, in various formats.
Downloads (link to download the article as PDF)
Open citations (links to open the citations from this article in various online reference manager services)
Cite this article (links to download the citations from this article in formats compatible with various reference manager tools)
A K+-selective CNG channel orchestrates Ca2+ signalling in zebrafish sperm
eLife 4:e07624.
https://doi.org/10.7554/eLife.07624


