Pharmacological dimerization and activation of the exchange factor eIF2B antagonizes the integrated stress response
- University of California, San Francisco, United States
- Howard Hughes Medical Institution, University of California, San Francisco, United States
- University of California, Davis, United States
- Gladstone Institutes, United States
Figures
Figure 1
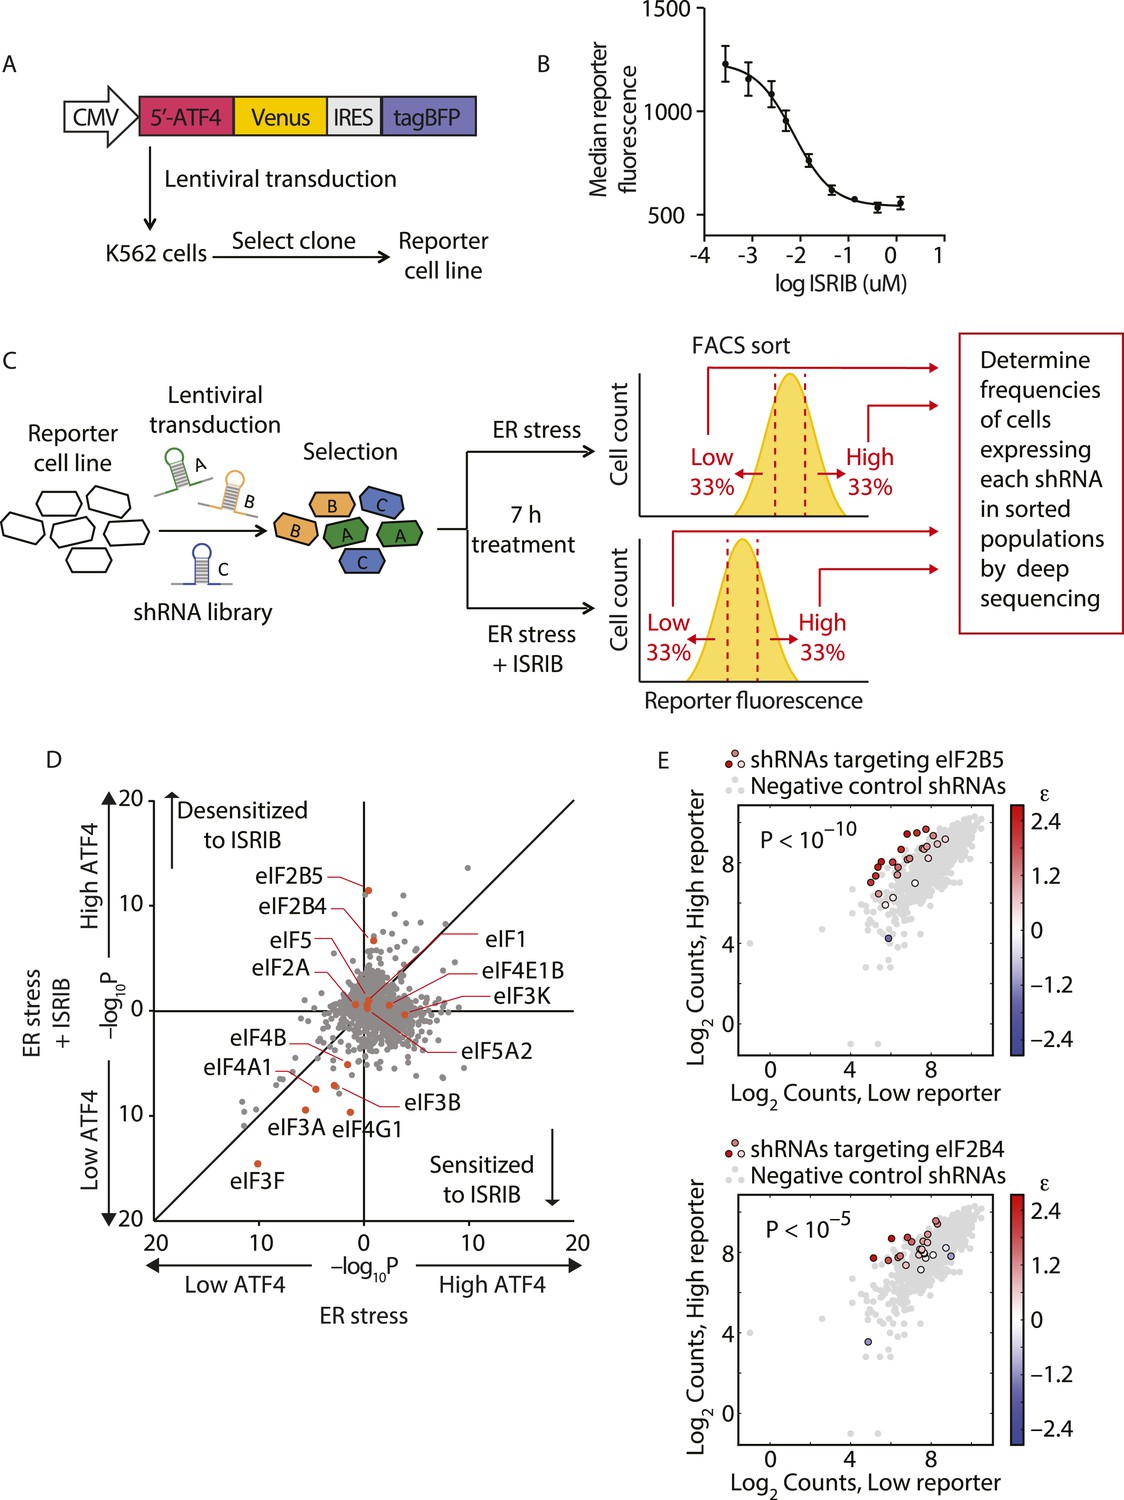
Knockdown of eIF2B subunits renders cells more resistant to ISRIB.
(A) Schematic representation of the ATF4-venus reporter used for the screen. The 5′ end of the human ATF4 mRNA up to the start codon of the ATF4-encoding ORF was fused to venus, followed by the EMCV internal ribosomal entry site (IRES) and BFP and inserted into a lentiviral system. (B) ISRIB reduces activation of the ATF4-venus reporter. K562 cells were incubated with Tg (300 nM) for 6 hr in the presence of different concentrations of ISRIB. Reporter fluorescence was measured by flow cytometry and median values were plotted (N = 3, ± SD). (C) Schematic of the shRNA screen aimed to identify the target ISRIB. K562 cells expressing the screening reporter were transduced with a pooled shRNA library and transduced cells were selected. The population was then divided into two and either treated with Tg (ER stress) or Tg + ISRIB (ER stress + ISRIB) for 7 hr. Cells were sorted based on their fluorescence (venus) intensity into three bins and the third of the population with the Low and High-reporter levels were collected. Note that the ER stress + ISRIB population had a lower overall fluorescence intensity (median) as ISRIB partially blocks induction of the reporter when added at a concentration corresponding to its EC50 in these cells (15 nM). DNA was extracted from the sorted subpopulations for each treatment and shRNA-encoding cassettes were PCR-amplified and subjected to deep sequencing to determine their frequency. (D) Effect of knockdown of individual genes in the proteostasis library on reporter expression upon ISR induction in the presence and absence of ISRIB. Gene p values for enrichment and depletion were compared between the ER stress (x-axis) vs the ER stress + ISRIB (y-axis) experiments. For each gene, a p value was calculated by comparing the distribution of log2 enrichment values for the 25 shRNAs targeting the gene to the negative control shRNAs. (E) The log2 counts for eIF2B5 (top panel) or eIF2B4 (bottom panel) targeting shRNAs in the High-reporter population (x-axis) vs the Low-reporter population (y-axis) was plotted and color coded based on the log2 enrichment as depicted in the side bar. Red colors indicate a shift towards higher reporter levels, blue colors shifts towards lower reporter levels. Negative control shRNAs in the library are colored grey.
-
Figure 1—source data 1
Sequence of the reporter utilized in the shRNA screen.
- https://doi.org/10.7554/eLife.07314.004
-
Figure 1—source data 2
Gene p values for the High and Low reporter populations.
- https://doi.org/10.7554/eLife.07314.005
Figure 2 with 1 supplement
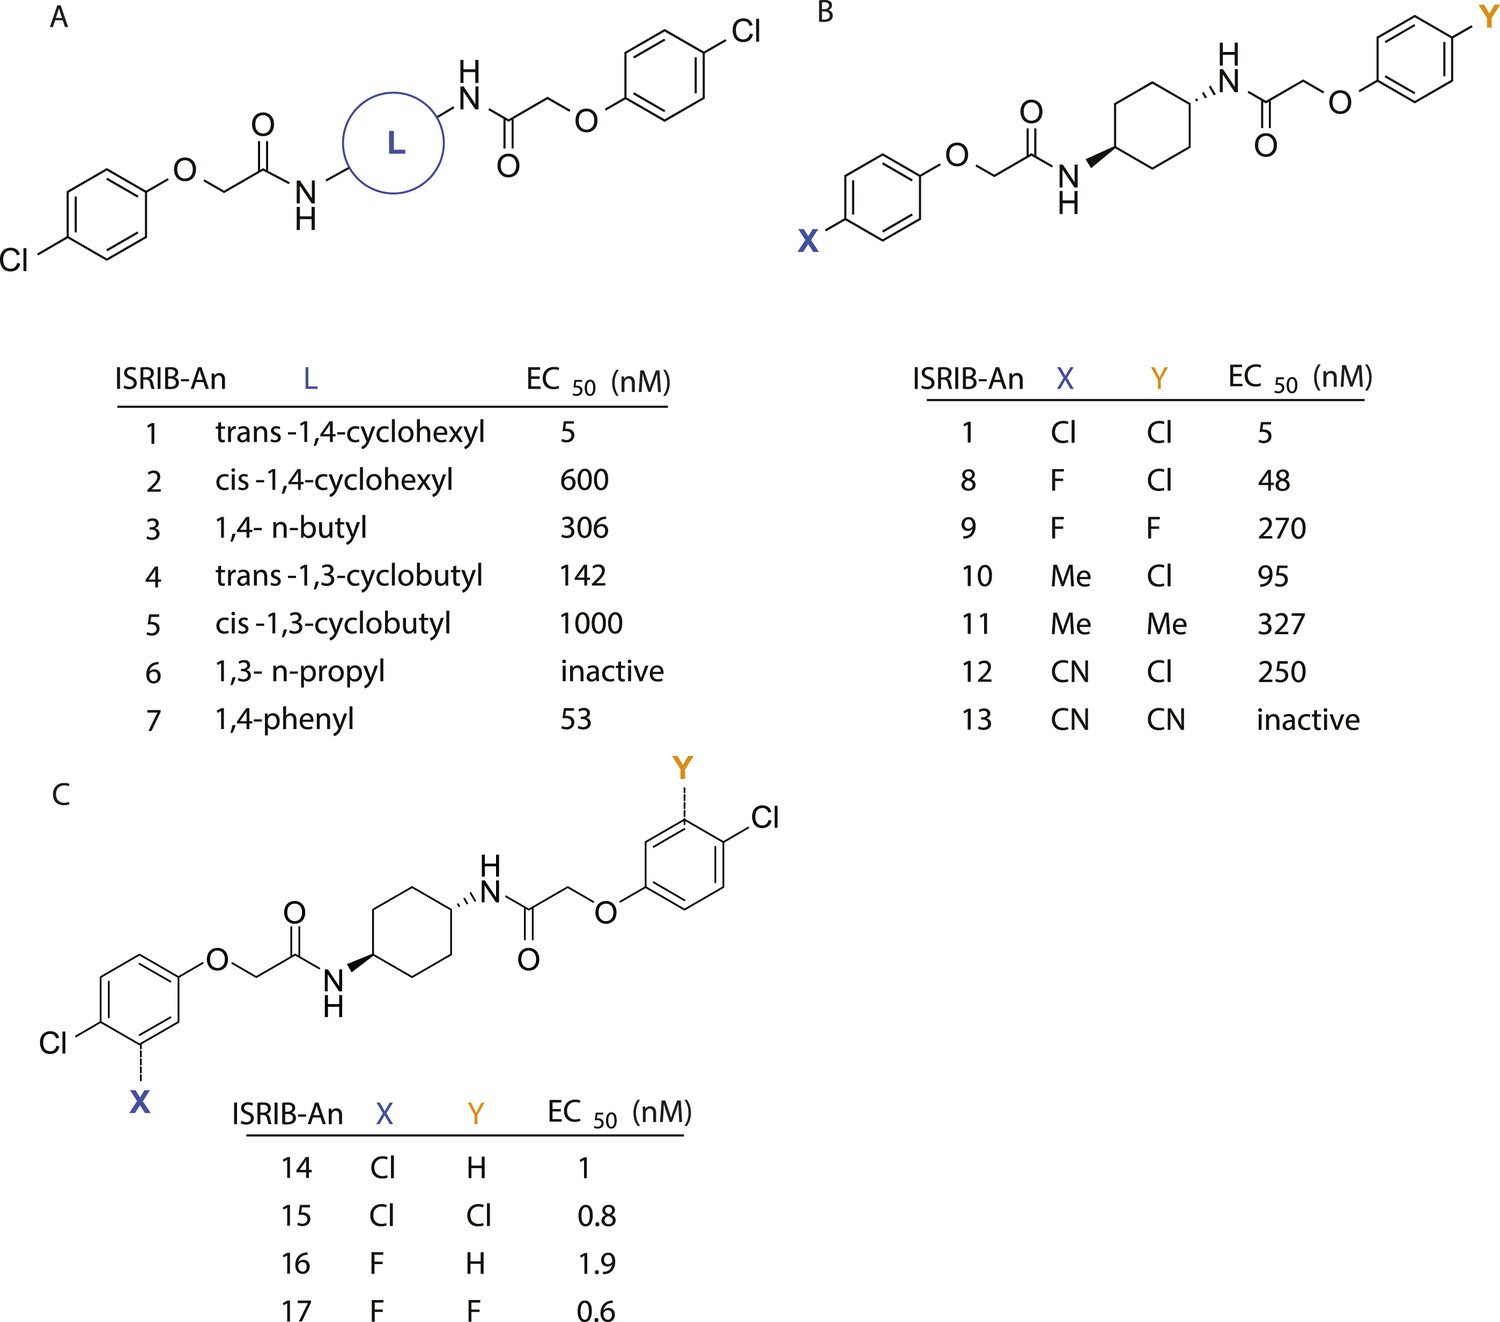
SAR analyses suggest ISRIB interacts with a twofold symmetric target.
(A) ISRIB analogs bearing various likers (L) between the pendant side chains and their corresponding EC50 values. (B) Sequential replacement of the para-chloro substituent (X and Y) with F, Me, or CN on the distal aromatic rings has unfavorable and additive effects on potency. (C) Sequential addition of a meta-substituent (X and Y) on the distal aromatic rings had favorable and additive effects on potency. Dose response curves of the different ISRIB analogs are shown in Figure 2—figure supplement 1.
Figure 2—figure supplement 1
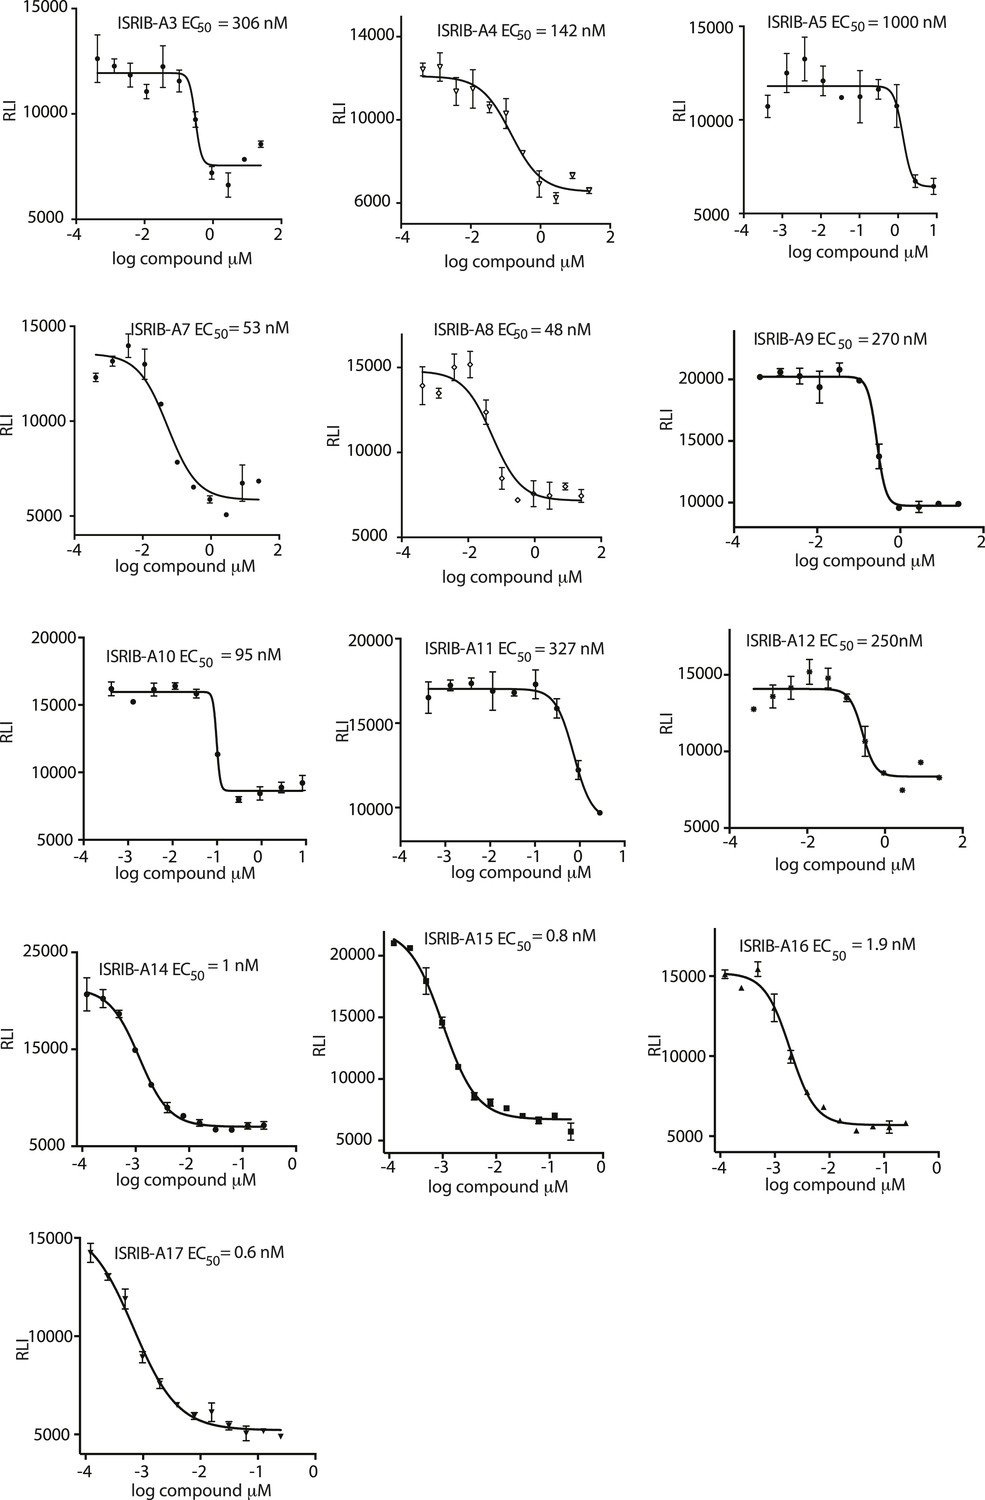
Activation of the ATF4 luciferase reporter in HEK293T cells was measured.
Cells were treated with 1 μg/ml of tunicamycin to induce ER stress and different concentrations of the analogs for 7 hr. Relative luminescence intensity (RLI) was plotted as a function of the concentration of the indicated ISRIB analog (N = 2, mean ± SD).
Figure 3 with 2 supplements

ISRIB induces dimerization of eIF2B in cells.
(A) HEK293T cells were treated with or without 200 nM ISRIB and clarified lysates were loaded on a 5–20% sucrose gradient and subjected to centrifugation. 13 equal-size fractions were collected, protein was precipitated and run on a SDS-PAGE gel and immunoblotted with the indicated antibodies. The red asterisk indicates a background band that cross-reacts with the eIF2B4 antibody. Sedimentation was from left to right. Gradients were calibrated (in Svedberg units, ‘S’) with ovalbumin (S = 3.5; Mr = 44 kD); aldolase (S = 7.3; Mr = 158 kD) and thyroglobulin (S = 19; Mr = 669 kD). Shown is a representative blot (N = 3). (B) HEK293T cells and lysates were treated with 200 nM ISRIB or 200 nM ISRIBinact (ISRIB-A18; Figure 3—figure supplement 1) and clarified lysates were loaded on a 5–20% sucrose gradient and subjected to centrifugation. 13 equal sized fractions were collected and fractions 6–9 were precipitated, trypsinized and subjected to mass spectrometric analysis. The sum of the normalized peptide intensity of each eIF2B subunit as well as two control proteins, eIF3a and PSMD1 in each fraction was plotted. Two biological replicates were analyzed per condition (N = 2, ±SEM). The number of peptides and peptide intensity in fractions 6–9 for all proteins identified are listed in Figure 3—source data 1. (C) Correlation coefficient (R) of the sum of the normalized peptide intensity profile through fractions 6–9 for each protein identified in the analysis with respect to eIF2B4 was plotted. The Correlation coefficient (R) of the sum of the normalized peptide intensity profile with respect to eIF2B4 of each protein identified are listed in Figure 3—source data 2.
-
Figure 3—source data 1
Number of peptides and peptide intensity in fractions 6–9 for all proteins identified.
- https://doi.org/10.7554/eLife.07314.009
-
Figure 3—source data 2
Correlation coefficient (R) of the sum of the normalized peptide intensity profile through fractions 6–9 with respect to eIF2B4 for each protein identified.
- https://doi.org/10.7554/eLife.07314.010
Figure 3—figure supplement 1
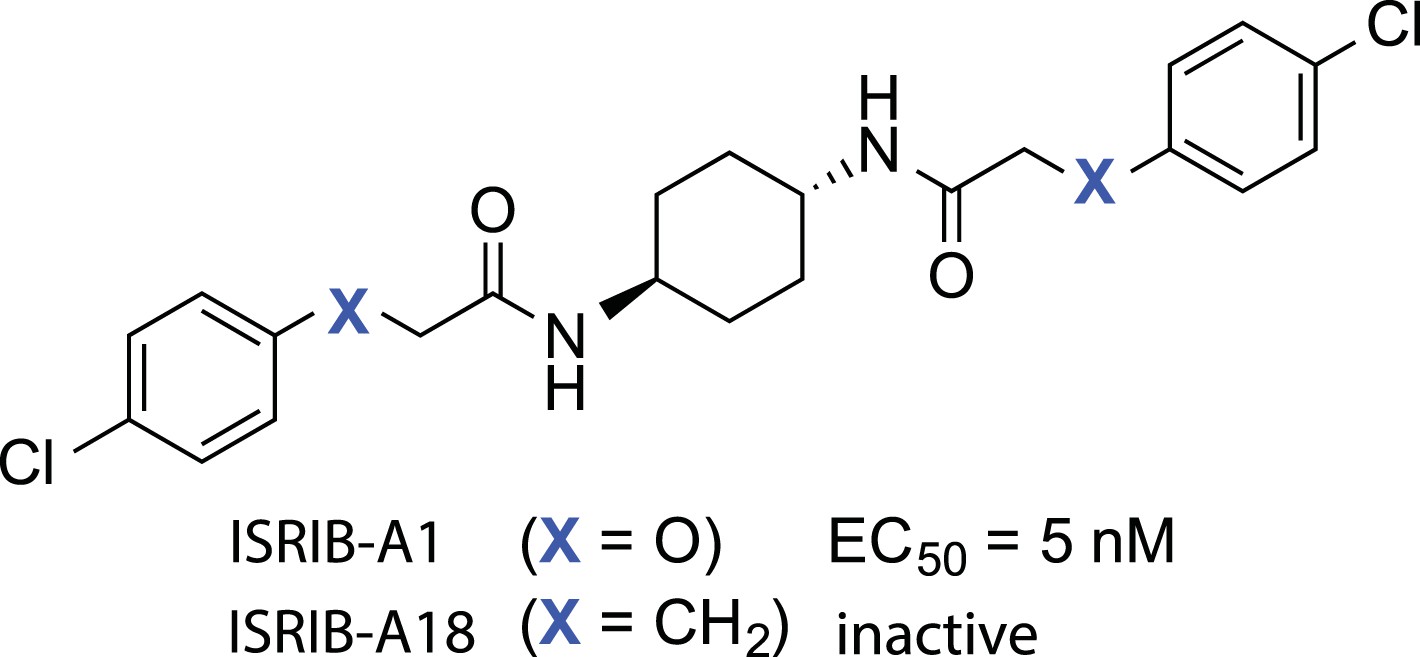
Structures of ISRIB (ISRIB-A1) and ISRIBinact (ISRIB-A18).
https://doi.org/10.7554/eLife.07314.011
Figure 3—figure supplement 2
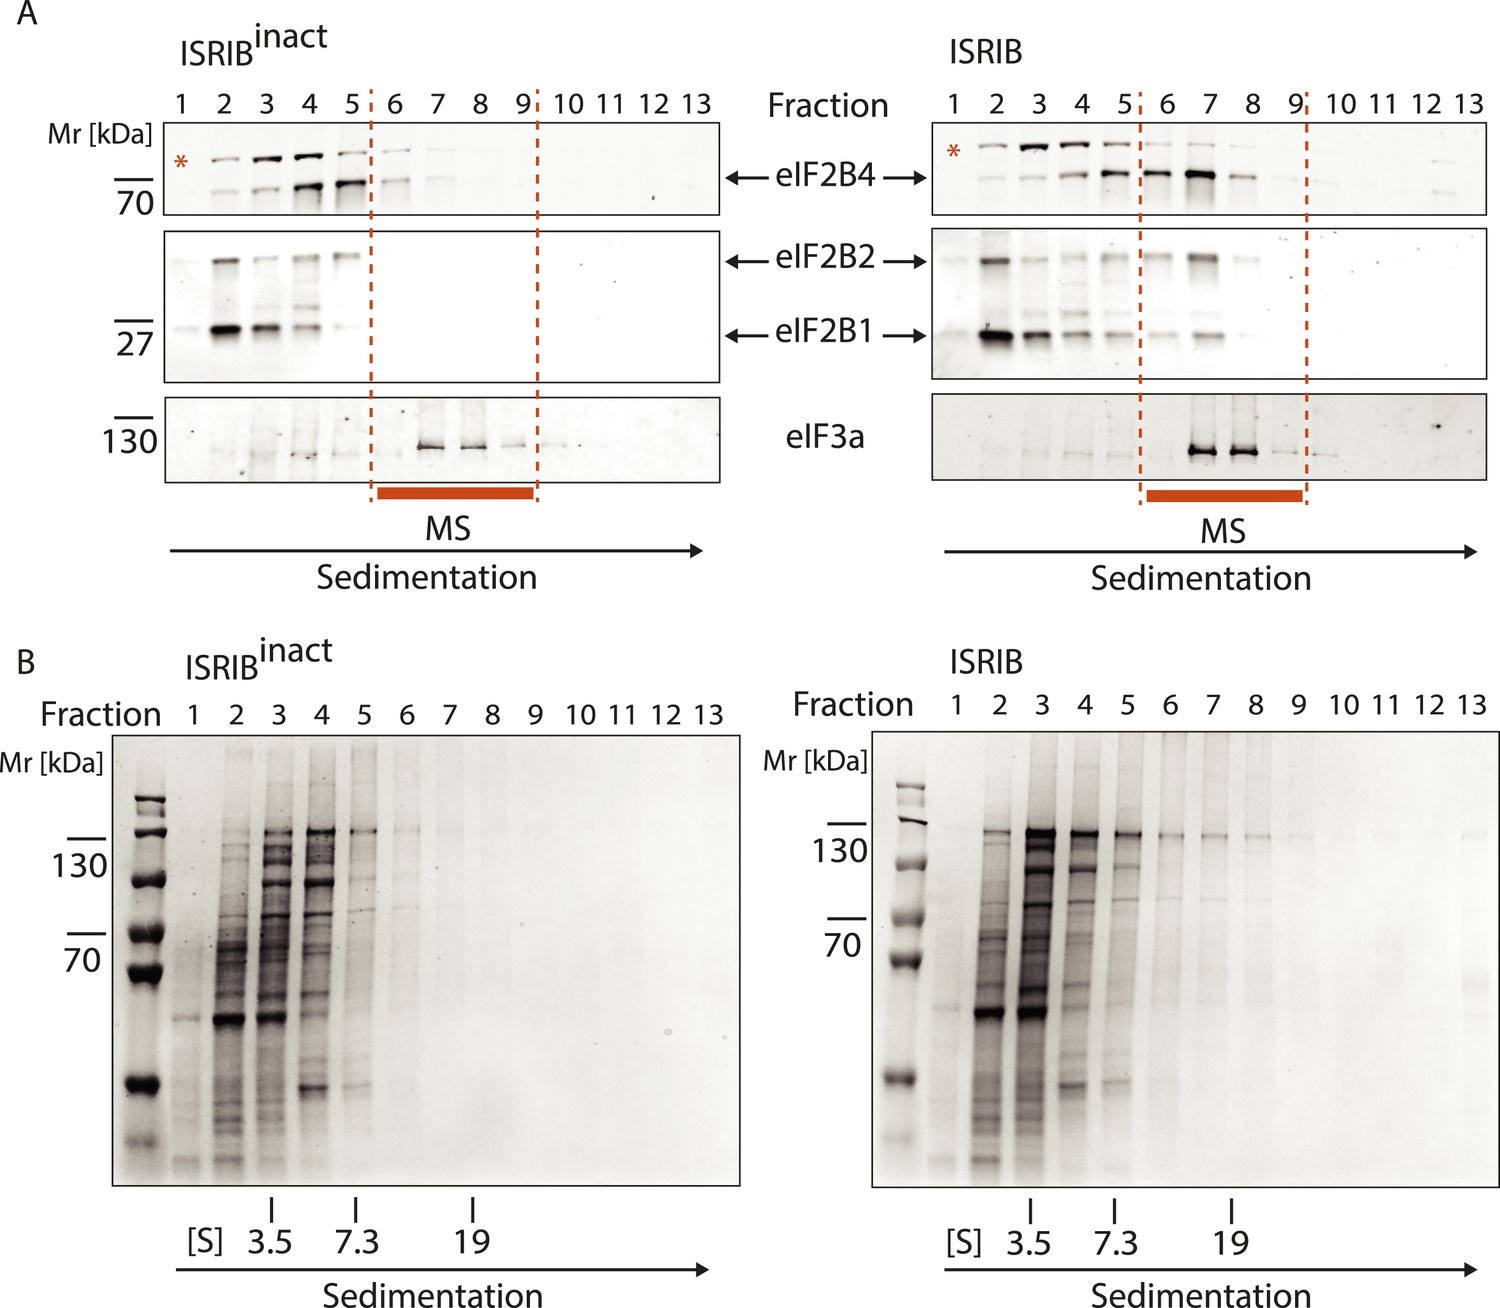
Analysis of the gradients subjected to mass spectrometric analysis in Figure 3B.
(A) Western blot analysis as in Figure 3A. The protein composition of fractions 6–9 was analyzed by mass spectrometry (Figure 3B). (B) Total protein across the sucrose gradient visualized by Coomassie blue staining.
Figure 4
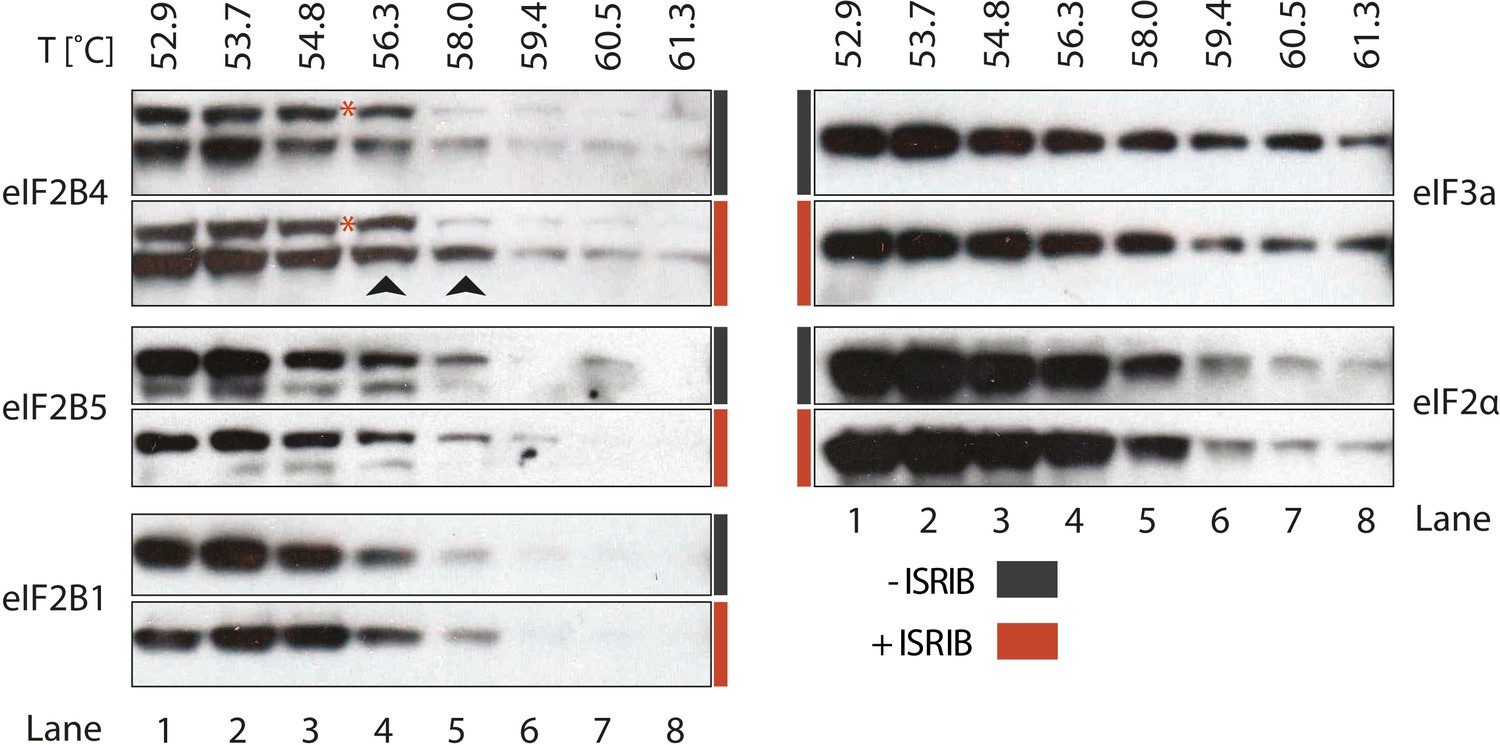
ISRIB enhances the thermo-stability of the regulatory subunit of eIF2B.
Clarified HEK293 cell lysates were treated with DMSO (-ISRIB) or with 200 nM ISRIB (+ISRIB) for 20 min. Treated and untreated lysates were partitioned into smaller aliquots and heated to different temperatures for 3 min and then centrifuged to remove precipitated proteins. The supernatant fraction was loaded onto a SDS-PAGE gel and immunoblotted with the indicated antibodies. The red asterisk indicates a background band that cross-reacts with the eIF2B4 antibody. Shown is a representative blot (N = 3).
Figure 5 with 1 supplement

ISRIB enhances the GEF activity of eIF2B in vitro.
eIF2 was preloaded with [3H]-GDP and the fraction of binary complex remaining was measured by filter binding. Partially purified eIF2B or buffer was added at t = 0 min. An aliquot of the reaction was stopped at the indicated times, filtered through a nitrocellulose membrane and radioactivity was measured. (A) Purified eIF2 was incubated with buffer (± 100 nM ISRIB, dashed lines) or partially purified eIF2B (± 100 nM ISRIB, solid lines) for the indicated times and the remaining fraction of [3H]-GDP-eIF2 was measured (N = 3, ± SD). (B) Purified and phosphorylated eIF2 (eIF2-P) was preloaded with [3H]-GDP and incubated with buffer (± 100 nM ISRIB, dashed lines) or partially purified eIF2B (± 100 nM ISRIB, solid lines) for the indicated times and the remaining fraction of [3H]-GDP-eIF2 was measured (N = 2, ± SD). (C) eIF2 was preloaded with [3H]-GDP and mixed with eIF2-P at a ratio of 3:1 and then incubated with eIF2B with or without 100 nM ISRIB for the indicated times and the remaining fraction of [3H]-GDP-eIF2 was measured (N = 2, ± SD). (D) eIF2 was preloaded with [3H]-GDP and mixed with eIF2-P at a ratio of 1:1 and then incubated with eIF2B with or without 100 nM ISRIB for the indicated times and the remaining fraction of [3H]-GDP-eIF2 was measured (N = 2, ± SD). Purified human eIF2 and partially purified rabbit reticulocyte eIF2B are shown in Figure 5—figure supplement 1.
Figure 5—figure supplement 1
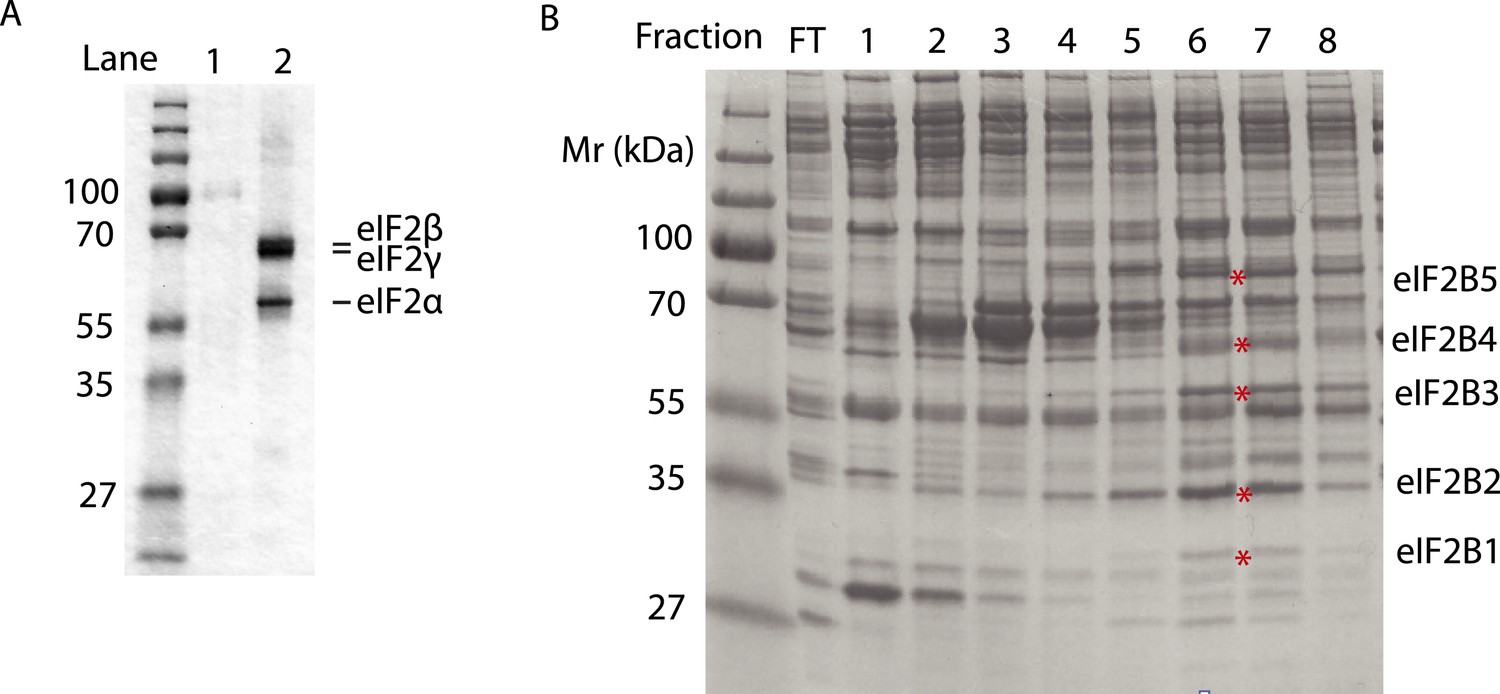
Purified human eIF2 (panel A, lane 2), recombinant GST-PERK (panel A, lane 1) and partially purified rabbit reticulocyte eIF2B (panel B) were analyzed by SDS-PAGE and stained with Coomassie blue dye.
Red asterisks indicate the migration of the five subunits of eIF2B. We utilized fractions 6 and 7 of the Mono-Q column for the guanine nucleotide exchange assays in Figure 5. We estimate that the eIF2B complex represents ∼10% of the total protein in these fractions.
Download links
A two-part list of links to download the article, or parts of the article, in various formats.
Downloads (link to download the article as PDF)
Open citations (links to open the citations from this article in various online reference manager services)
Cite this article (links to download the citations from this article in formats compatible with various reference manager tools)
Pharmacological dimerization and activation of the exchange factor eIF2B antagonizes the integrated stress response
eLife 4:e07314.
https://doi.org/10.7554/eLife.07314


