The acinar differentiation determinant PTF1A inhibits initiation of pancreatic ductal adenocarcinoma
- University of Utah, United States
- University of Texas Southwestern Medical Center, United States
- Vanderbilt University Medical Center, United States
Figures
Figure 1 with 1 supplement
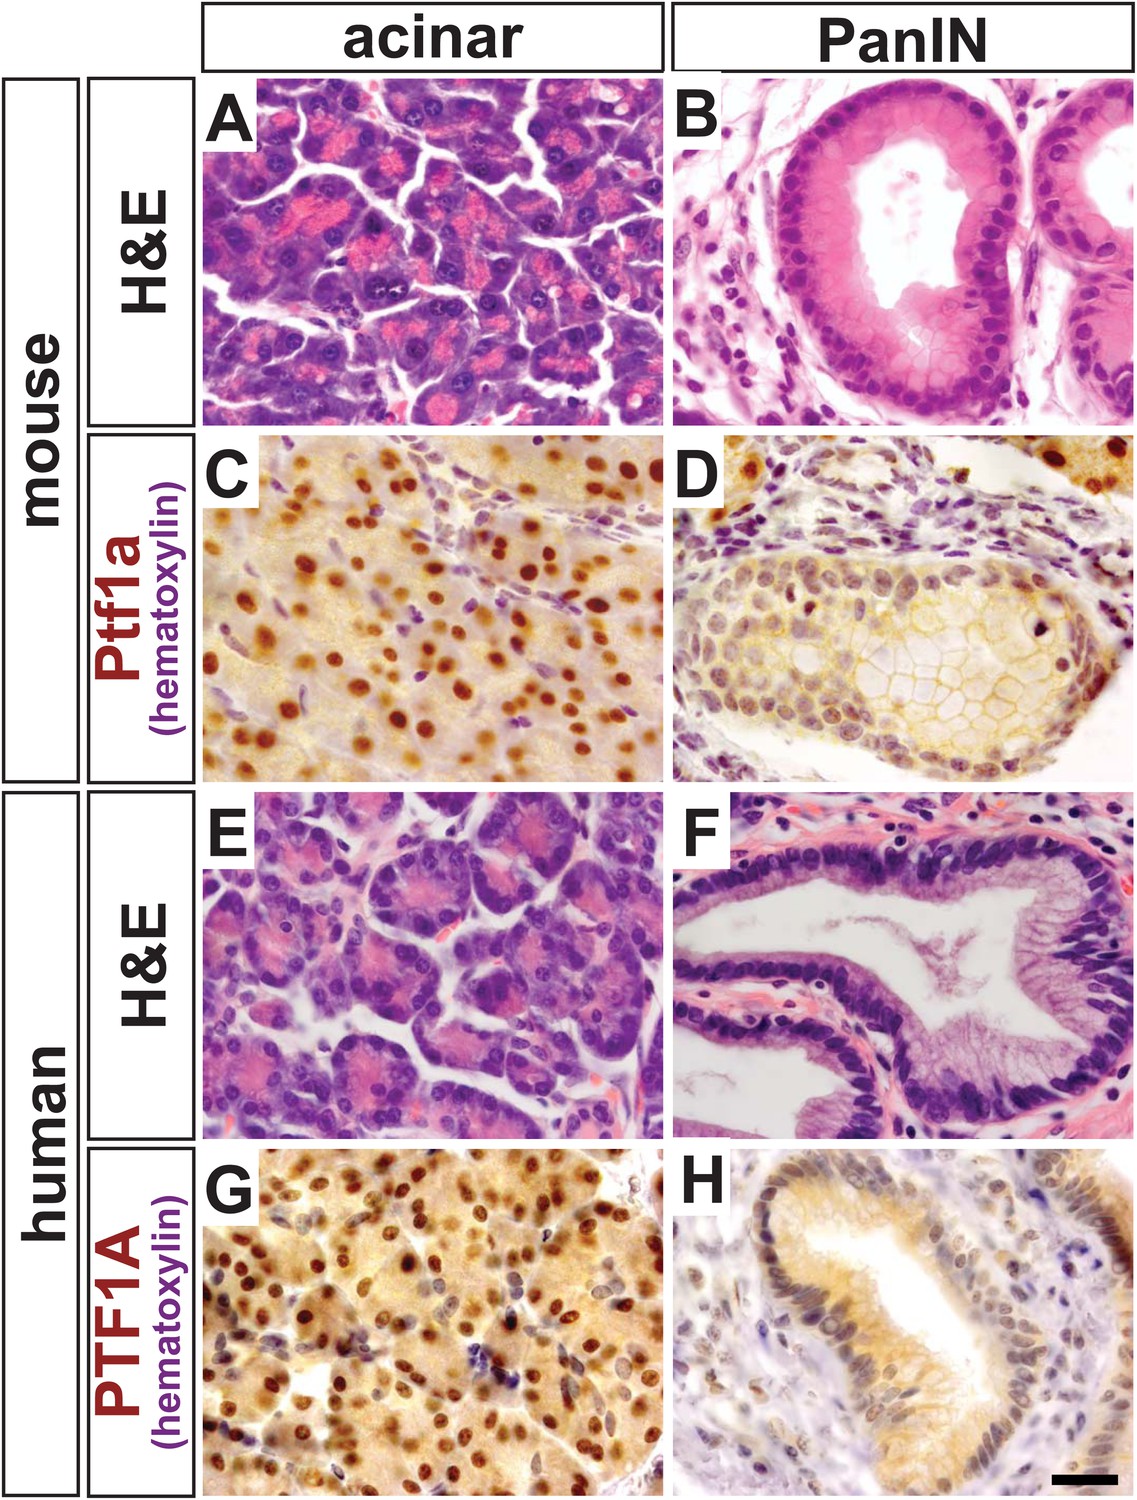
PTF1A is downregulated in PanINs from mice and humans.
(A, B) H&E staining of normal acinar and pancreatic intraepithelial neoplasia (PanIN) tissue of Ptf1aCreERT; KrasLSL-G12D pancreata. (C, D) PTF1A immunohistochemistry (IHC) of mouse acinar and PanIN tissue. (E, F) H&E staining of human acinar and PanIN tissue. (G, H) PTF1A immunostaining of normal acinar and PanIN tissue of human. Scale bar: 25 µm.
Figure 1—figure supplement 1
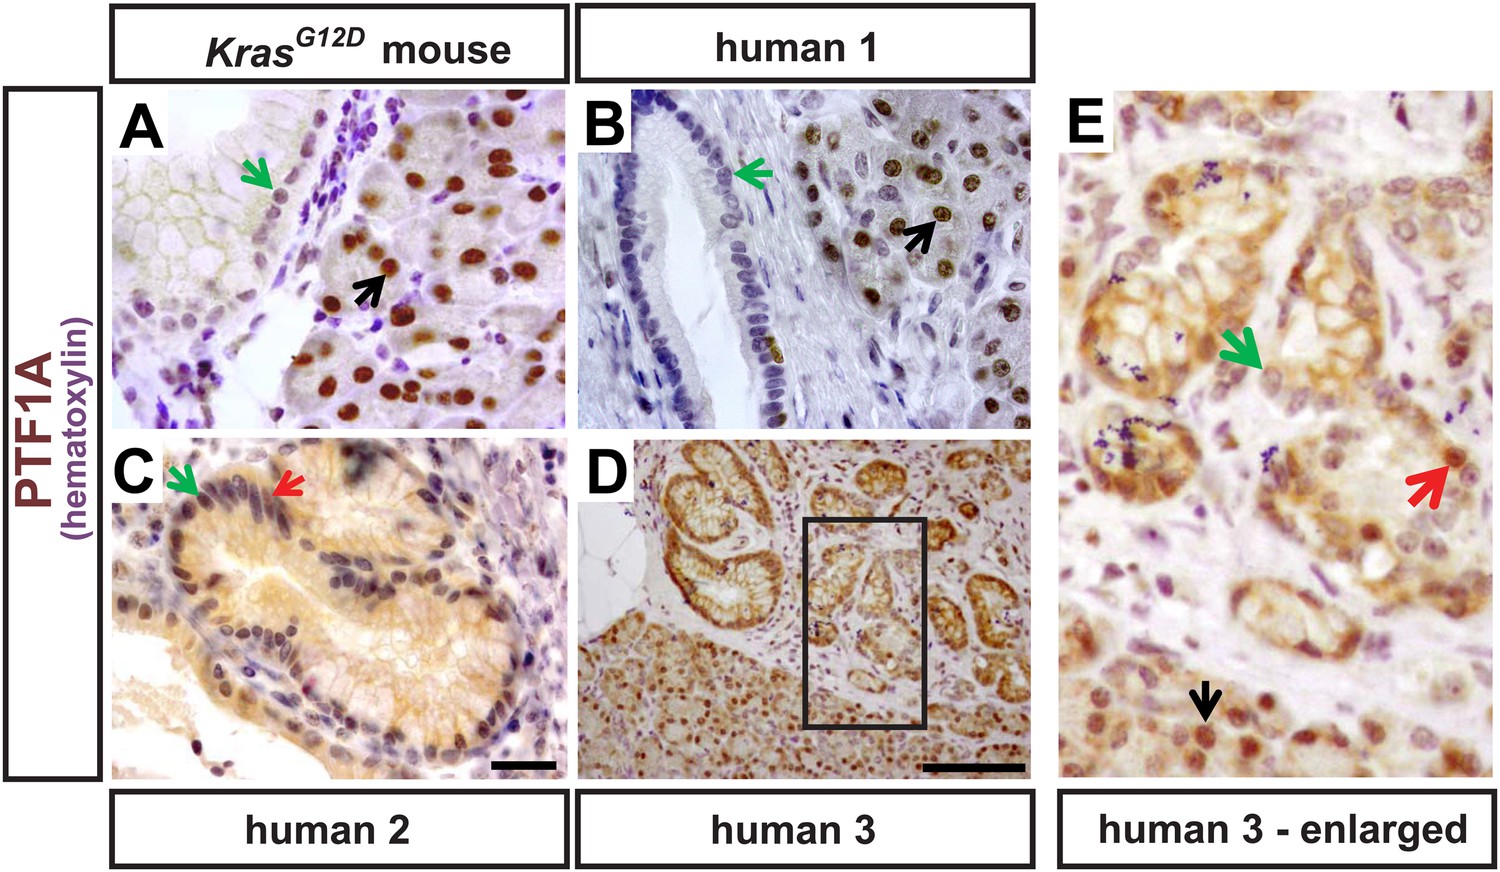
PTF1A expression in rare epithelial cells of human PanINs.
(A) IHC for PTF1A from a KrasG12D mouse pancreas 9 months after TM administration (0.17 mg/g). (B–E) IHC for PTF1A on human pathology samples. Black arrows indicate normal acinar cells expressing PTF1A; green arrows highlight PanIN epithelial cells that do not express PTF1A; red arrows indicate rare PanIN epithelial cells that retain trace PTF1A expression. Scale bars: (A–C) 25 μm; (D) 100 μm.
Figure 2 with 2 supplements
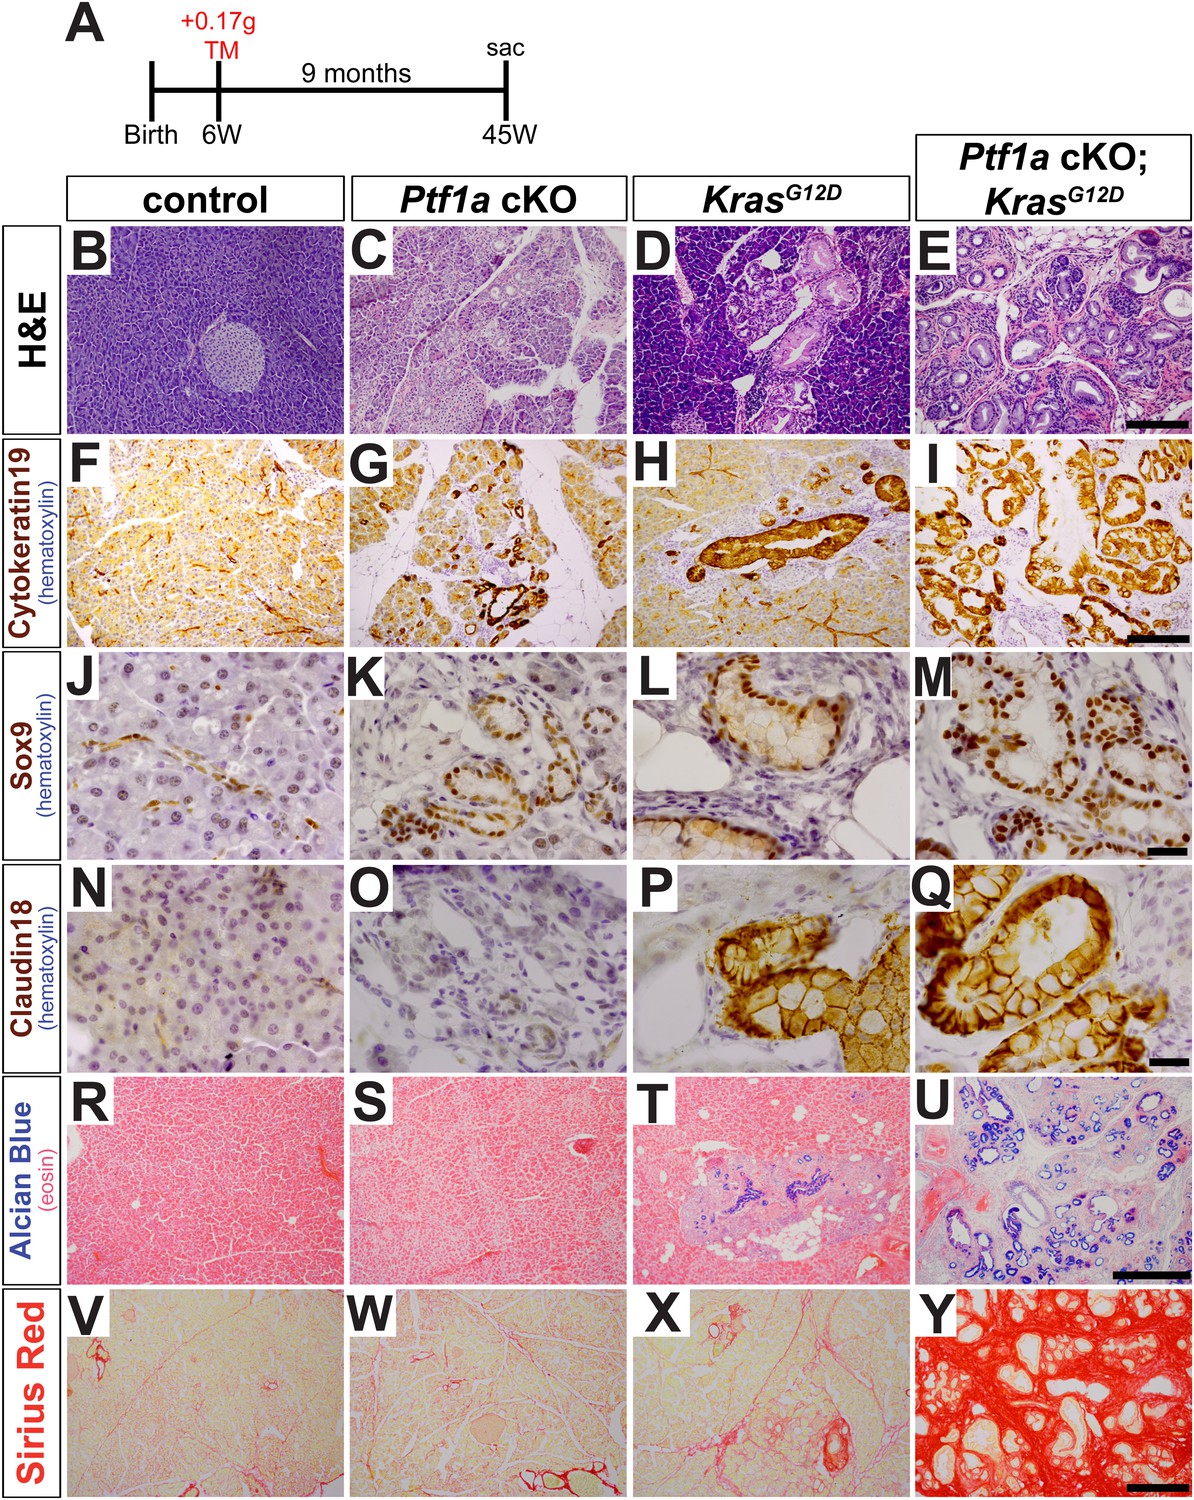
Loss of Ptf1a promotes acinar-to-ductal metaplasia and sensitizes acinar cells to KRAS-mediated transformation.
(A) Mice of indicated genotypes were administered TM (0.17 mg/g) to induce recombination, and sacrificed 9 months later. (B–E) H&E staining of pancreata from mice of indicated genotypes. (F–M) IHC for the duct markers CK19 and SOX9, indicating upregulation in both acinar-to-ductal metaplasia (ADM) and PanINs. (N–Q) IHC for the PanIN marker, CLDN18, highlighting intermittent PanIN formation in KrasG12D mice and widespread lesion development in Ptf1a conditional knock-out (cKO); KrasG12D. (R–U) Alcian Blue staining, indicating PanIN lesions in KrasG12D and Ptf1a cKO; KrasG12D pancreata. (V–Y) Sirius Red staining, highlighting local and widespread fibrosis in KrasG12D and Ptf1a cKO; KrasG12D mice, respectively. Scale bars: (B–E) 200 µm; (F–I) 200 µm; (J–Q) 25 µm; (R–U) 500 µm; (V–Y) 200 µm.
Figure 2—figure supplement 1
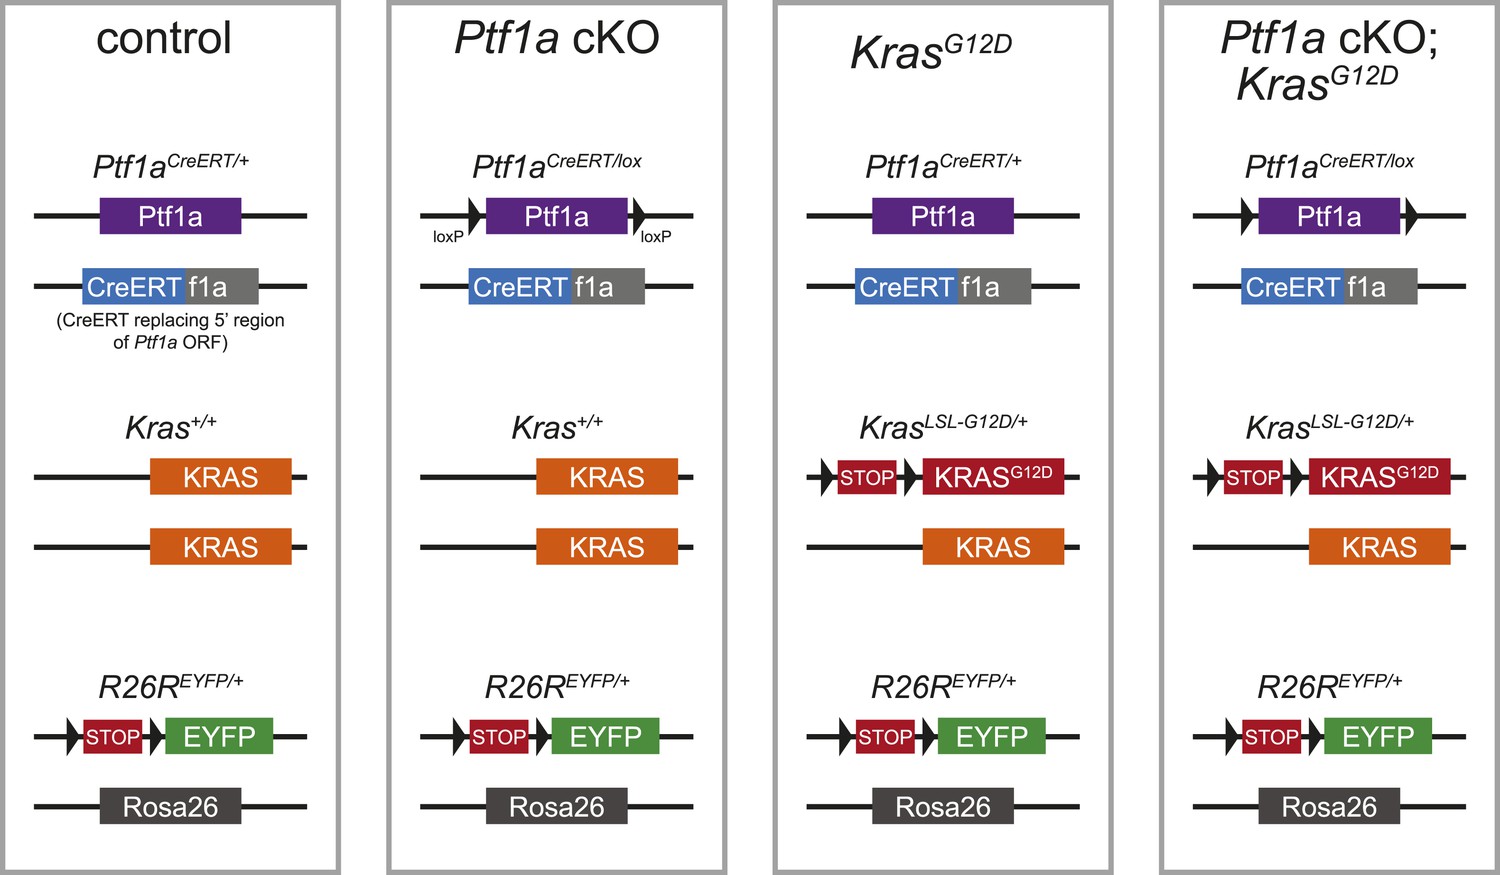
Schematic of mouse alleles used in this study.
Schematic representations of the alleles present in the genotypes referred to, in shorthand, as control, Ptf1a cKO, KrasG12D and Ptf1a cKO; KrasG12D (see Table 1 for additional details).
Figure 2—figure supplement 2
Ptf1aCreERT deletion efficiency following tamoxifen treatment.
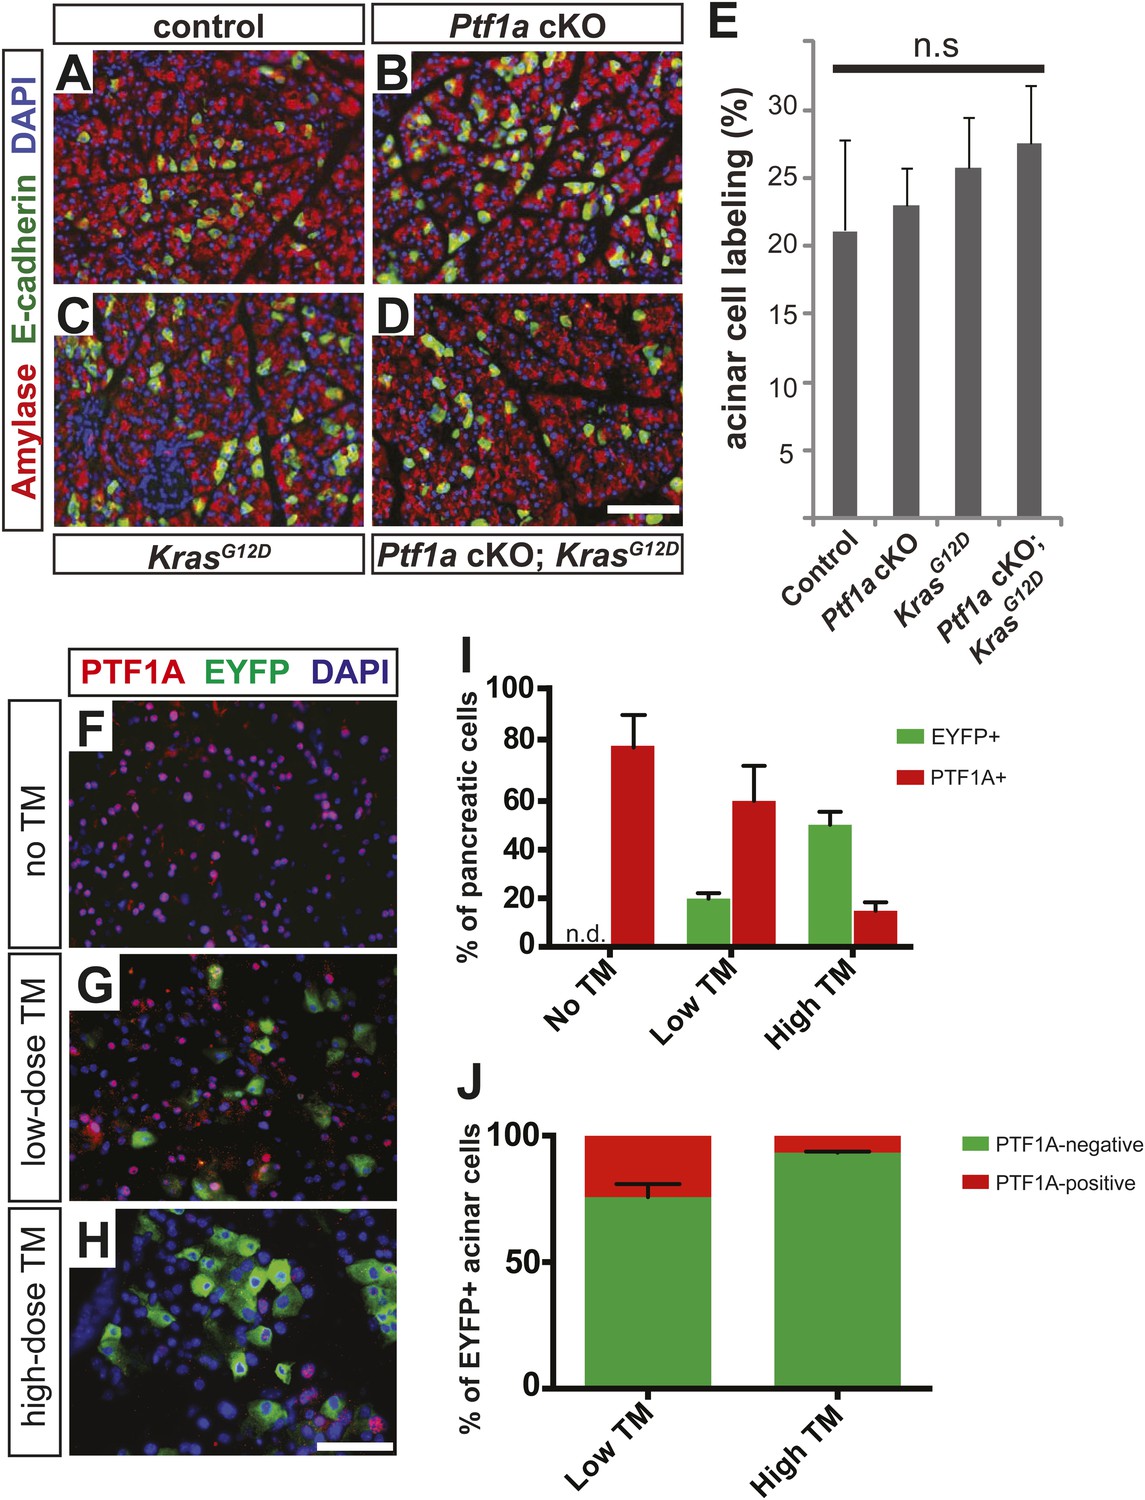
6–8-week-old mice of indicated genotypes were administered according to low- or high-dose regimens (1 × 0.17 mg/g or 0.25 mg/g, respectively), and pancreata were harvested 2 weeks (A–E) or 3 days (F–J) after the last dose. (A–D) Immunofluorescence for amylase (red) and the Cre reporter R26REYFP (green) on pancreata from low-TM treated mice of the indicated genotypes. For Ptf1a cKO; KrasG12D pancreata, efforts were made to find histologically normal areas to provide an accurate quantification of Cre-mediated recombination. (E) The proportion of EYFP expression among amylase+ acinar cells was quantified for all genotypes. No significant difference was noted between any groups (n = 3–6 per genotype). (F–H) Immunofluorescence for PTF1A (red), the Cre reporter EYFP (green), and DAPI (blue) in Ptf1aCreERT/lox; KrasG12D; R26REYFP/+ mice 3 days after no TM administration (A), low dose TM (B), or high dose TM (C). (I) Quantification of the percentage of EYFP+ (green) and Ptf1a+ (red) pancreatic cells in each indicated treatment group 3 days after final TM administration (n = 3 per group). (J) Quantification of total EYFP+ acinar cells that no longer express Ptf1a (green) or retain Ptf1a protein expression (red) 3 days following low and high TM treatment (n = 3 per group). Scale bars: (A–D) 100 μm, (F–H) 50 μm.
Figure 3 with 2 supplements
Loss of Ptf1a is a rate-limiting step in PanIN initiation.
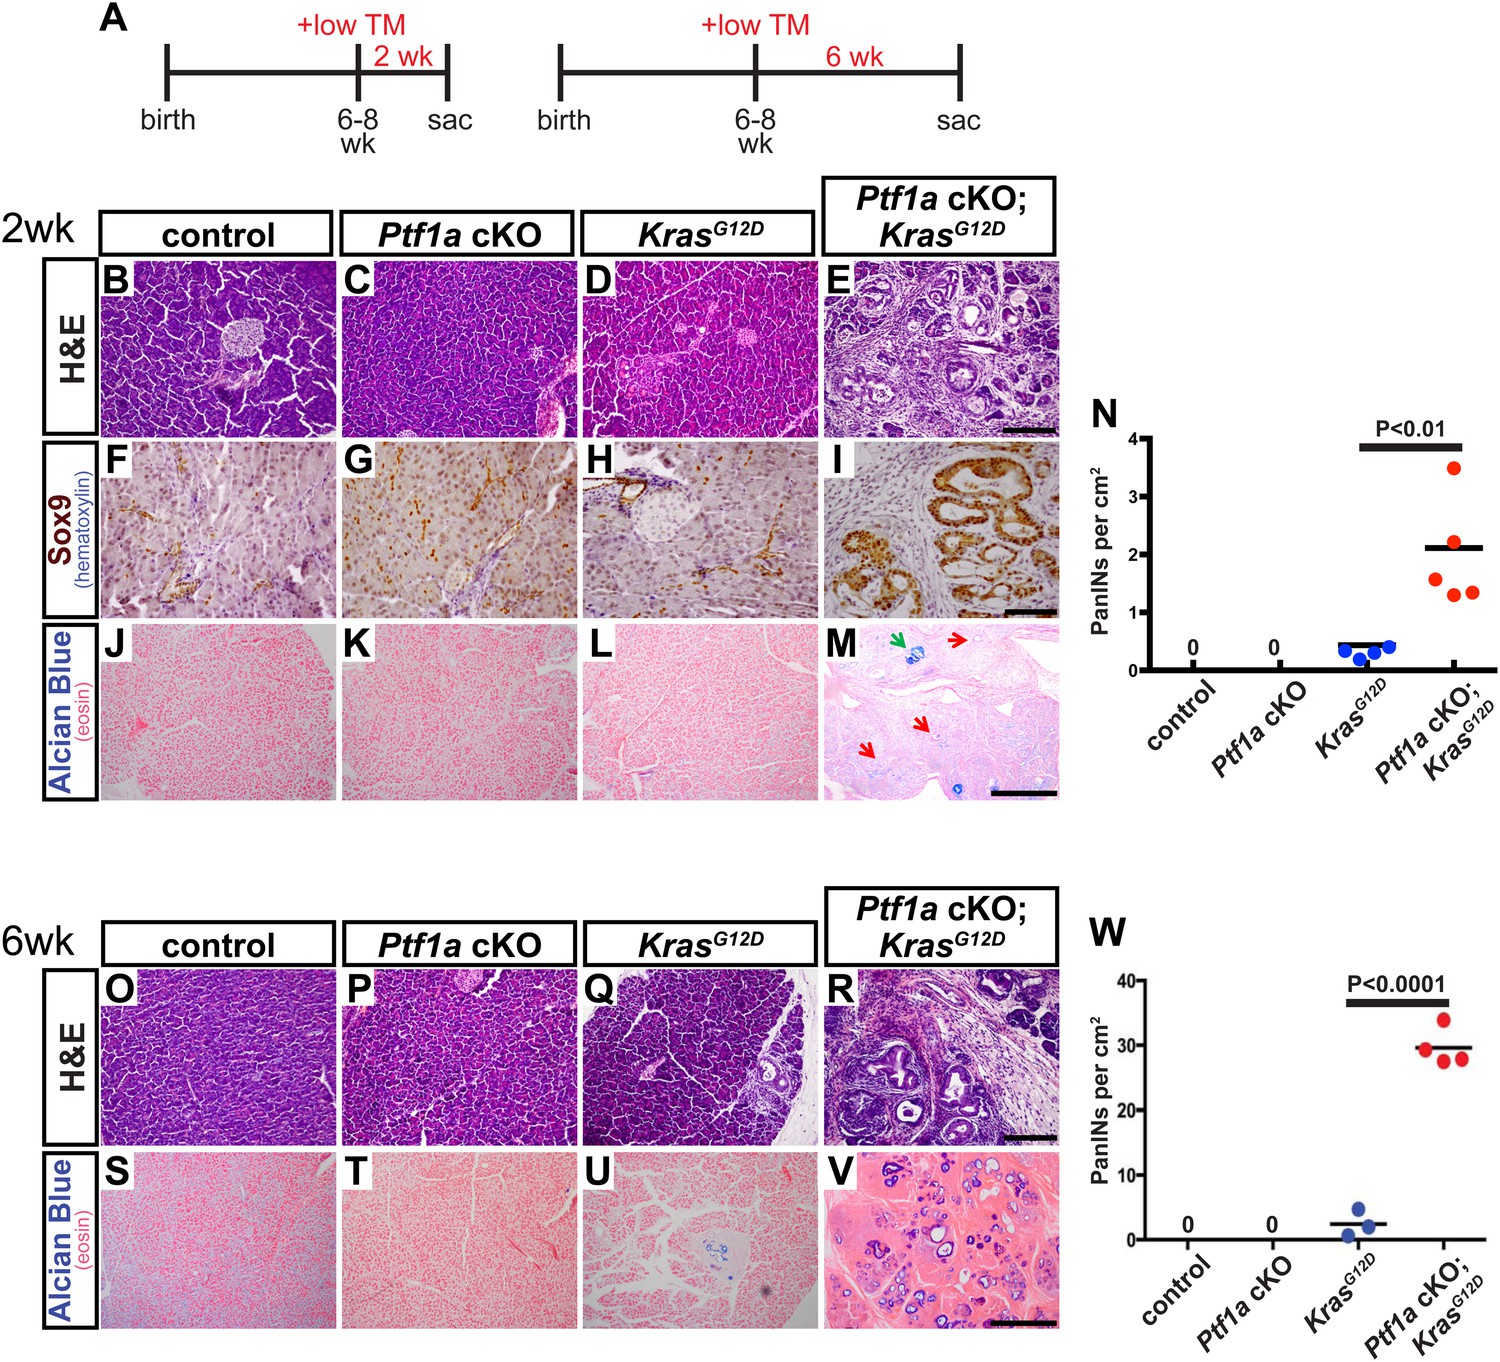
(A) Mice of specified genotypes were administered 0.17 mg/g body weight TM to induce Cre-mediated recombination and were sacrificed either 2 or 6 weeks later. (B–E) H&E staining of pancreata from mice of indicated genotypes 2 weeks after TM administration. (F–I) IHC for the ductal transcription factor SOX9, indicating upregulation in ADM and PanINs of Ptf1a cKO; KrasG12D pancreata. (J–M) Alcian blue staining, indicating PanIN lesions in Ptf1a cKO; KrasG12D pancreata. In panel (M), green arrow indicates an Alcian Blue+ lesion, while red arrows indicate ADM that is Alcian Blue-negative. (N) Quantification of the genotype-dependent PanIN burden; Ptf1a cKO; KrasG12D pancreata possessed significantly more PanINs at 2 weeks post-TM than KrasG12D mice (p < 0.01). (O–R) H&E staining of pancreata from mice of indicated genotypes 6 weeks after TM administration. (S–V) Alcian Blue staining, highlighting PanIN lesions in pancreata from KrasG12D mice and Ptf1a cKO; KrasG12D mice. (W) Quantification of PanINs at 6 weeks post-TM. Ptf1a cKO; KrasG12D pancreata had ∼15-fold more Alcian Blue+ PanINs at this time point than KrasG12D (p < 0.0001). Scale bars: (B–E) 200 µm; (F–I) 100 µm; (J–M) 500 µm; (O–R) 200 µm; (S–V) 500 µm.
Figure 3—figure supplement 1

Microenvironmental remodeling in Ptf1a cKO; KrasG12D pancreata.
Pancreata were harvested 2 weeks following TM administration (0.17 mg/g) to mice of the indicated genotypes. (A–D) Immunofluorescence for the PanIN marker CLDN18 (red), and the leukocyte marker CD45 (green), revealing association of leukocytes with PanINs in Ptf1a cKO; KrasG12D. (E–H) IHC for α-SMA, highlighting the activation of pancreatic stellate cells in Ptf1a cKO; KrasG12D pancreata. (I–L) Sirius Red staining, highlighting widespread fibrosis in Ptf1a cKO; KrasG12D. Scale bars: (A–D) 50 μm, (E–L) 200 μm.
Figure 3—figure supplement 2
Acinar-ductal reprogramming in 3D culture.
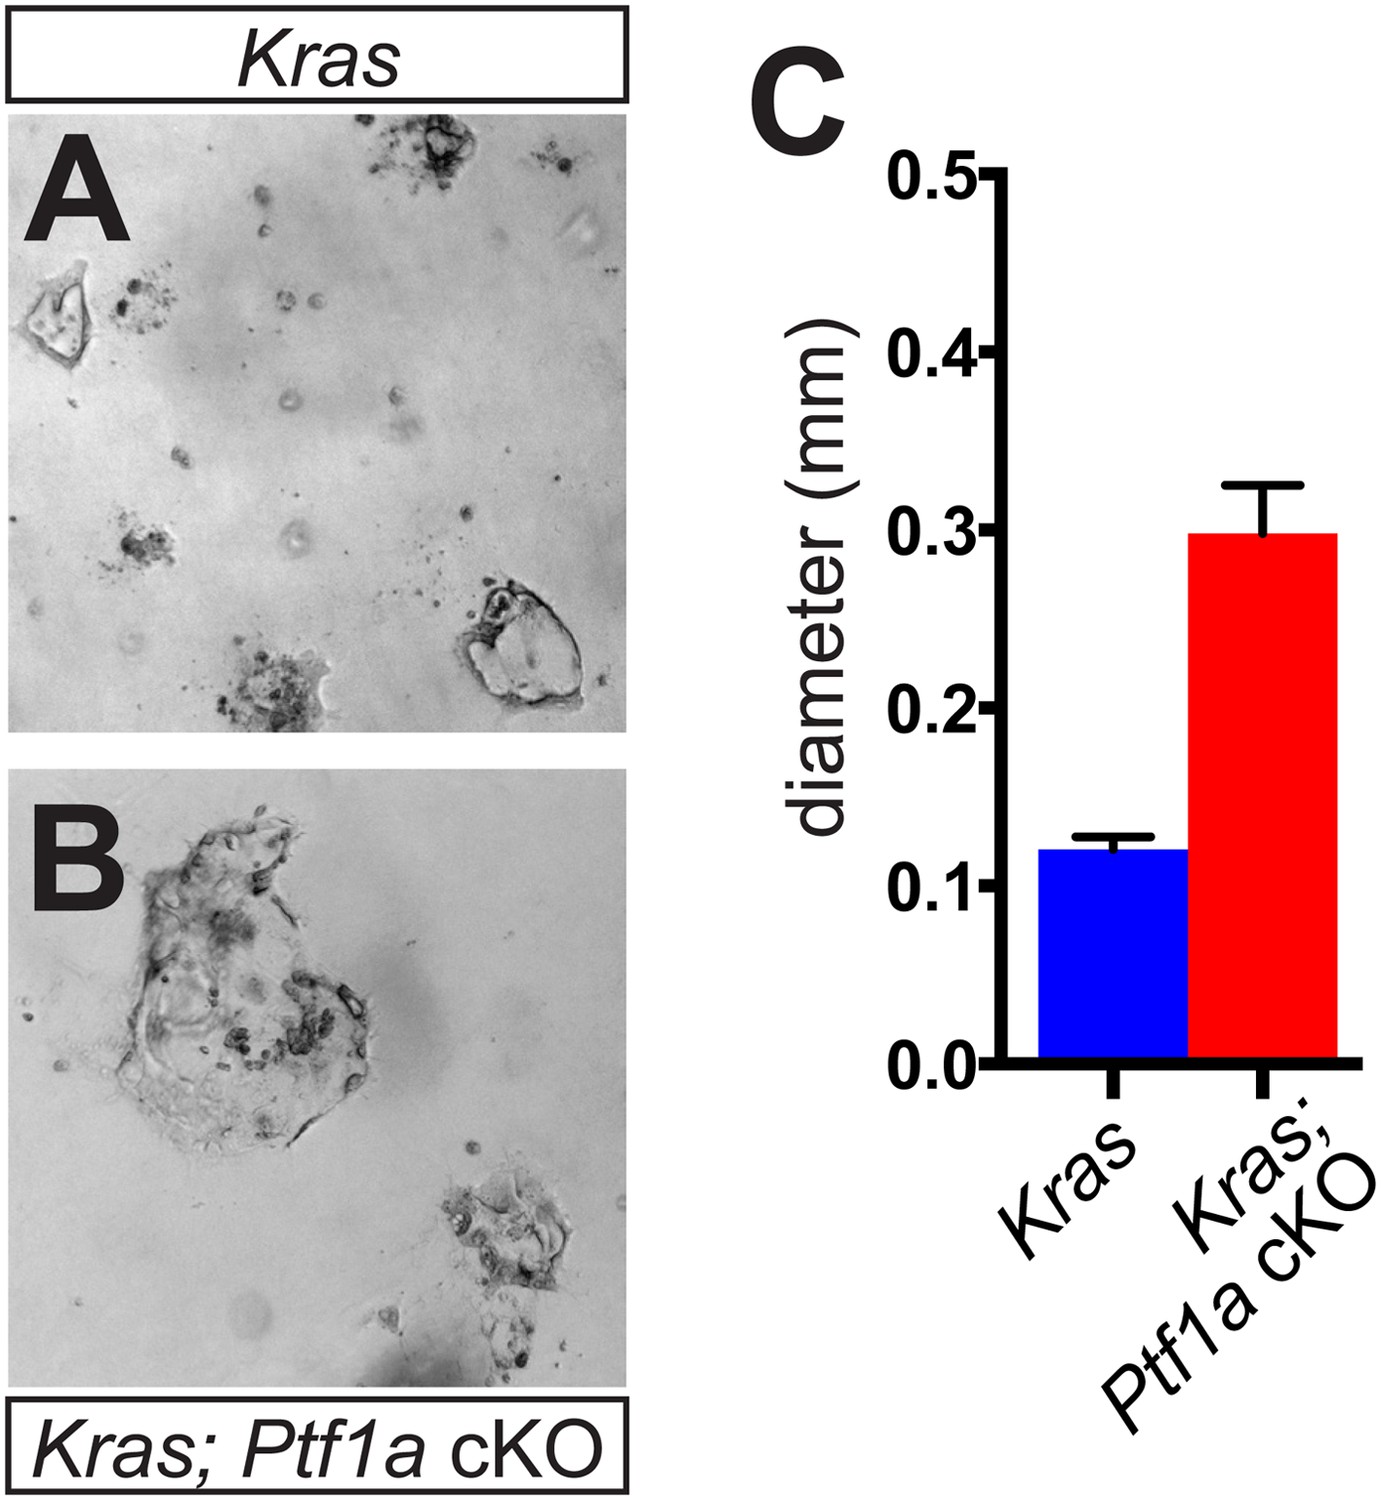
(A, B) Brightfield images of acinarderived ductal cysts from (A) KrasG12D and (B) Ptf1a cKO; KrasG12D mice, after 3 days of culture in collagen gel. (C) Quantification of the maximum diameter of acinar-derived cysts from mice of indicated genotypes (n = 3 mice per genotype). For each mouse, >10 randomly selected fields were photographed, and each cyst within the image was measured at its maximum diameter. Scale bars are 400 μm.
Figure 4 with 3 supplements
Widespread loss of Ptf1a promotes rapid acinar-to-ductal metaplasia.
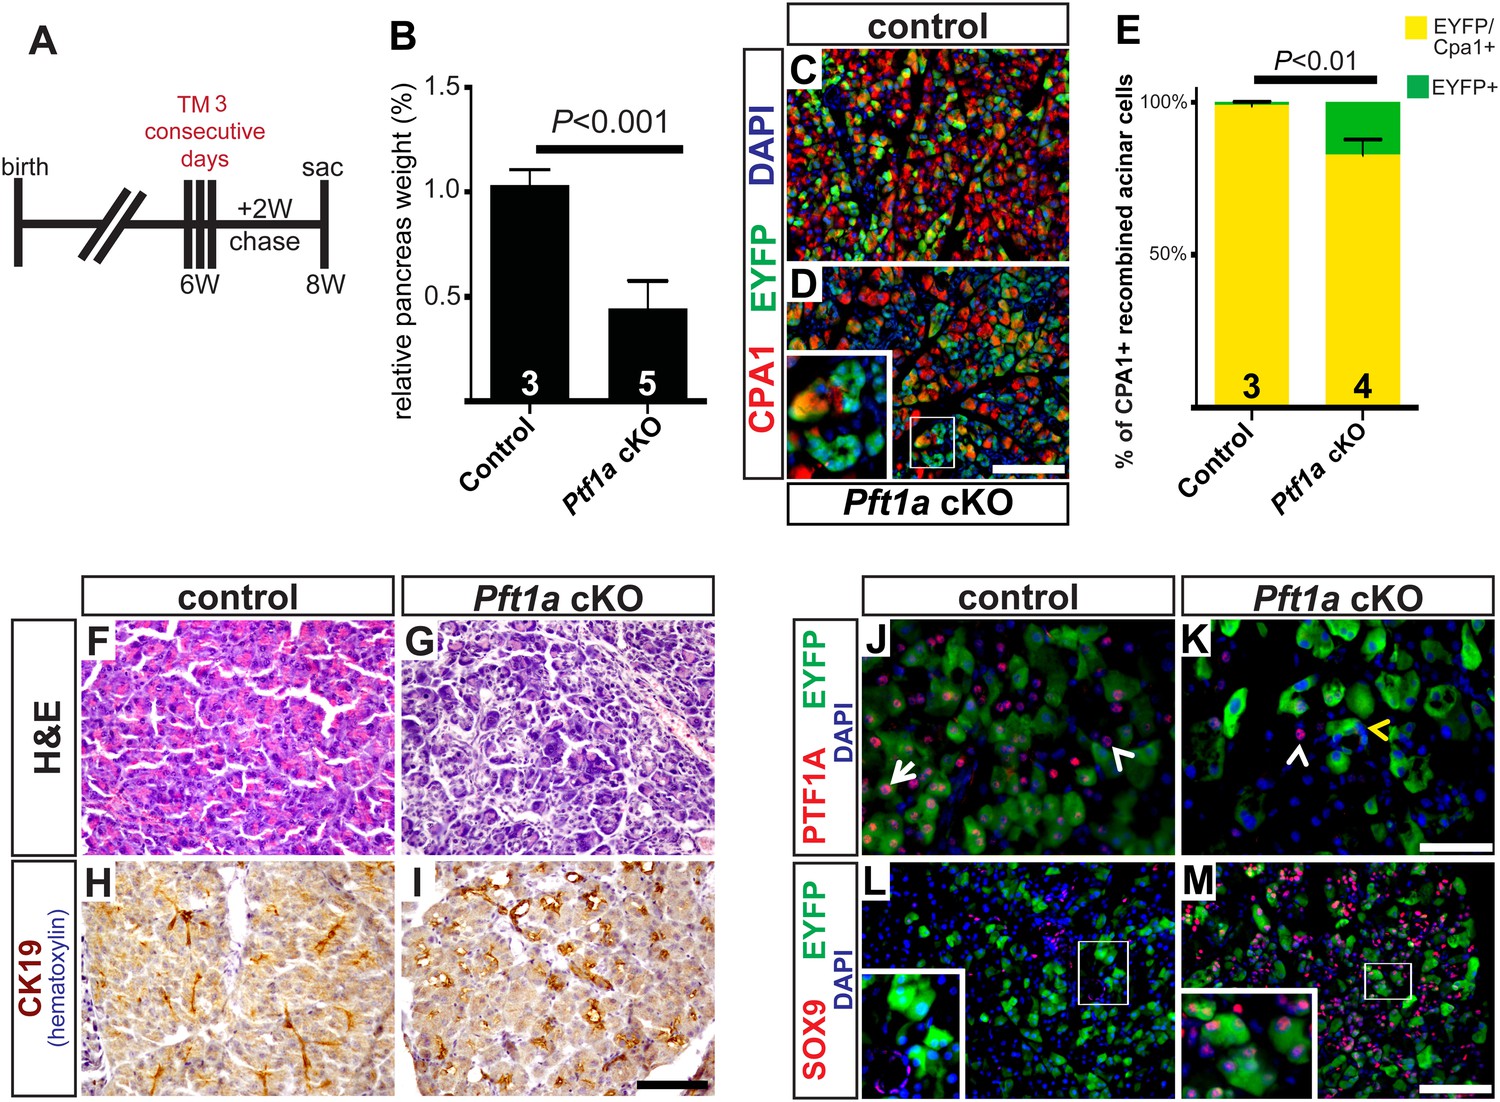
(A) Control and Ptf1a cKO mice were administered TM (0.25 mg/g) on three consecutive days and sacrificed following a 2-week chase period. (B) Pancreas mass, measured as a percent of body weight, was significantly decreased in Ptf1a cKO mice 2 weeks after TM administration. (C, D) Immunofluorescence for the acinar enzyme carboxypeptidase A1 (CPA1) (red) and Cre reporter R26REYFP (green). Nuclei are labeled with DAPI (blue). Inset highlights EYFP+, CPA1-negative acinar cells forming duct-like structures in Ptf1a null pancreata. (E) Quantification of CPA1 expression by EYFP+ (Cre-recombined) cells in control and Ptf1a cKO pancreata (control n = 3, Ptf1a cKO n = 4, p < 0.01). (F, G) H&E staining of control and Ptf1a cKO pancreata 2 weeks after high-dose TM administration. (H, I) IHC for the duct marker CK19 highlighting areas of ADM in Ptf1a cKO pancreata. (J, K) Immunofluorescence for PTF1A (red) and the Cre reporter R26REYFP (green). White arrow indicates an EYFP+ cell expressing PTF1A in control; white arrowheads indicate non-recombined PTF1A+ cells; yellow arrowhead indicates a recombined, PTF1A-negative cell undergoing metaplasia in Ptf1a cKO. (L, M) Immunofluorescence for the duct transcription factor SOX9 (red) and the Cre reporter R26REYFP (green). Insets highlight restricted expression of SOX9 in controls and upregulation of SOX9 within EYFP+ acinar cells of Ptf1a cKO. Scale bars: (C, D) 100 µm, (F–I) 200 µm, (J, K) 50 µm, (L, M) 100 µm.
Figure 4—figure supplement 1
Cre-mediated recombination rates following high-dose tamoxifen treatment.
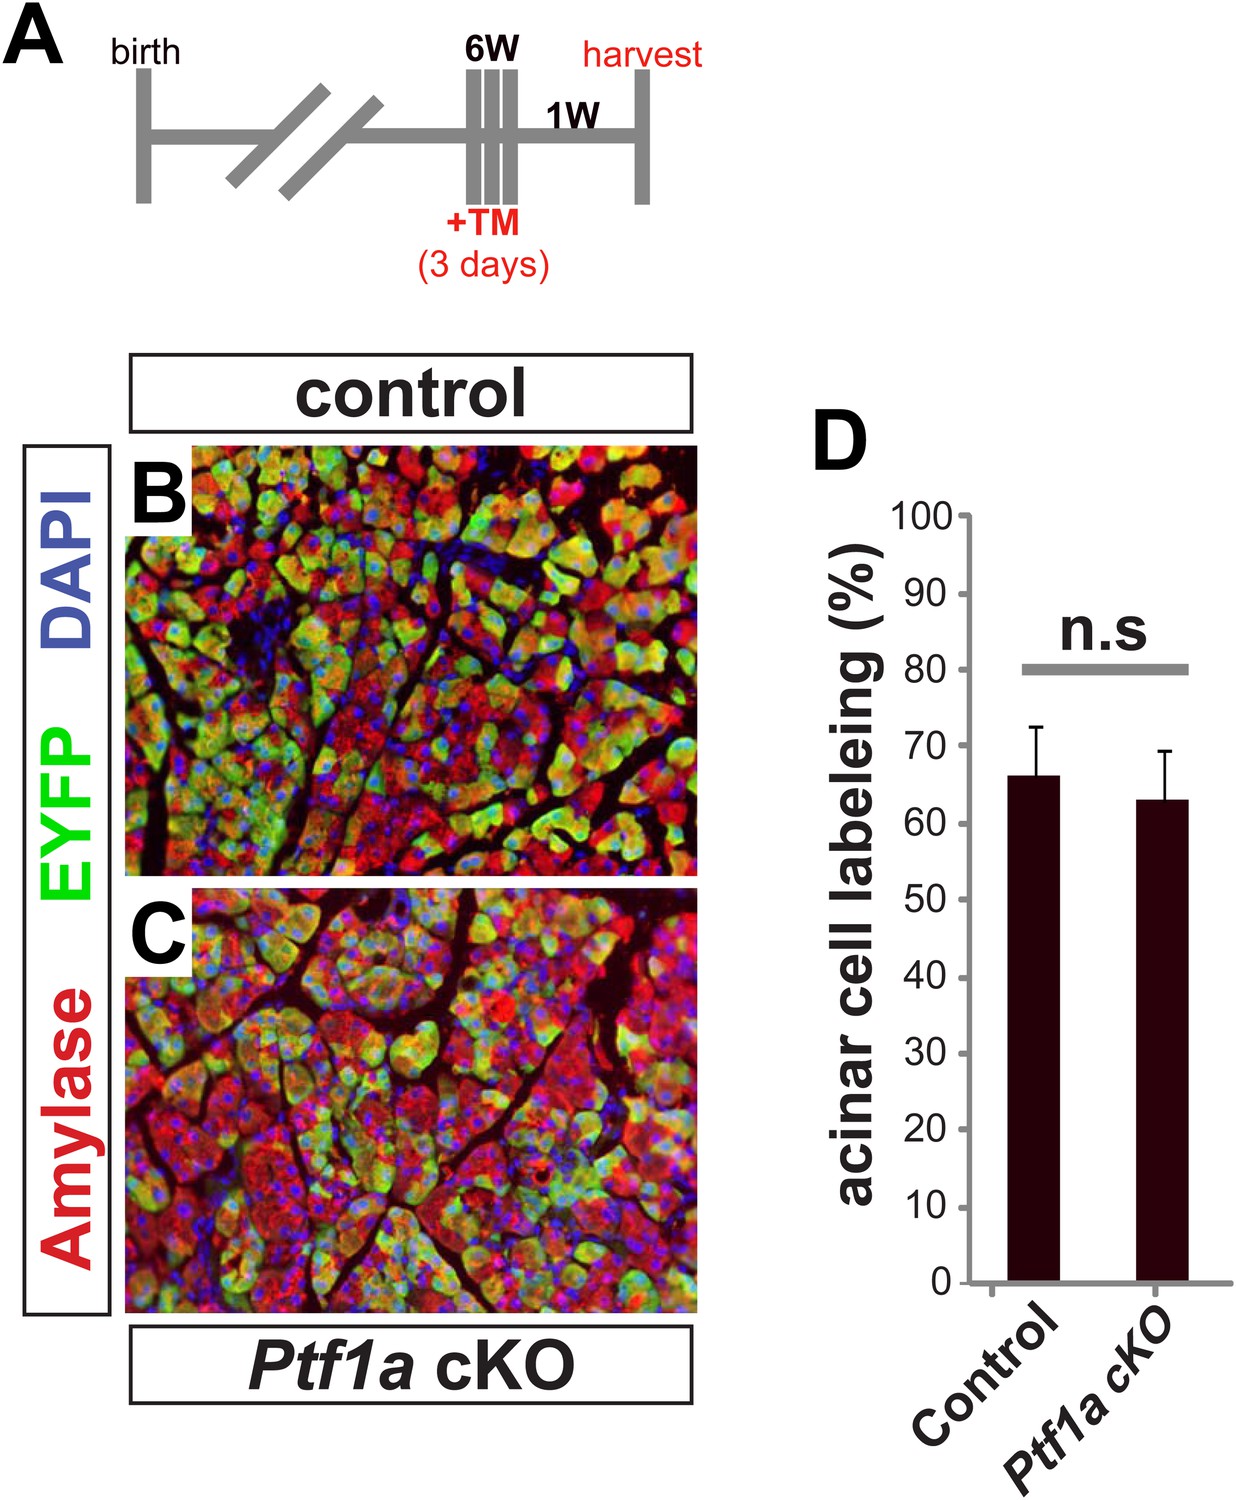
(A) 6–8 week old mice were administered 0.17 mg/g TM on three consecutive days, and pancreata were harvested 1 week later. (B, C) Immunofluorescence for amylase (red) and the Cre reporter R26REYFP (green) in TM-treated pancreata of the indicated genotypes. (D) The proportion of EYFP expression within amylase+ acinar cells was quantified for all genotypes. No significant difference was observed between groups (n = 3–4 per genotype). Scale bar: 100 μm.
Figure 4—figure supplement 2
Loss of Ptf1a promotes pancreatic epithelial transdifferentiation and proliferation.
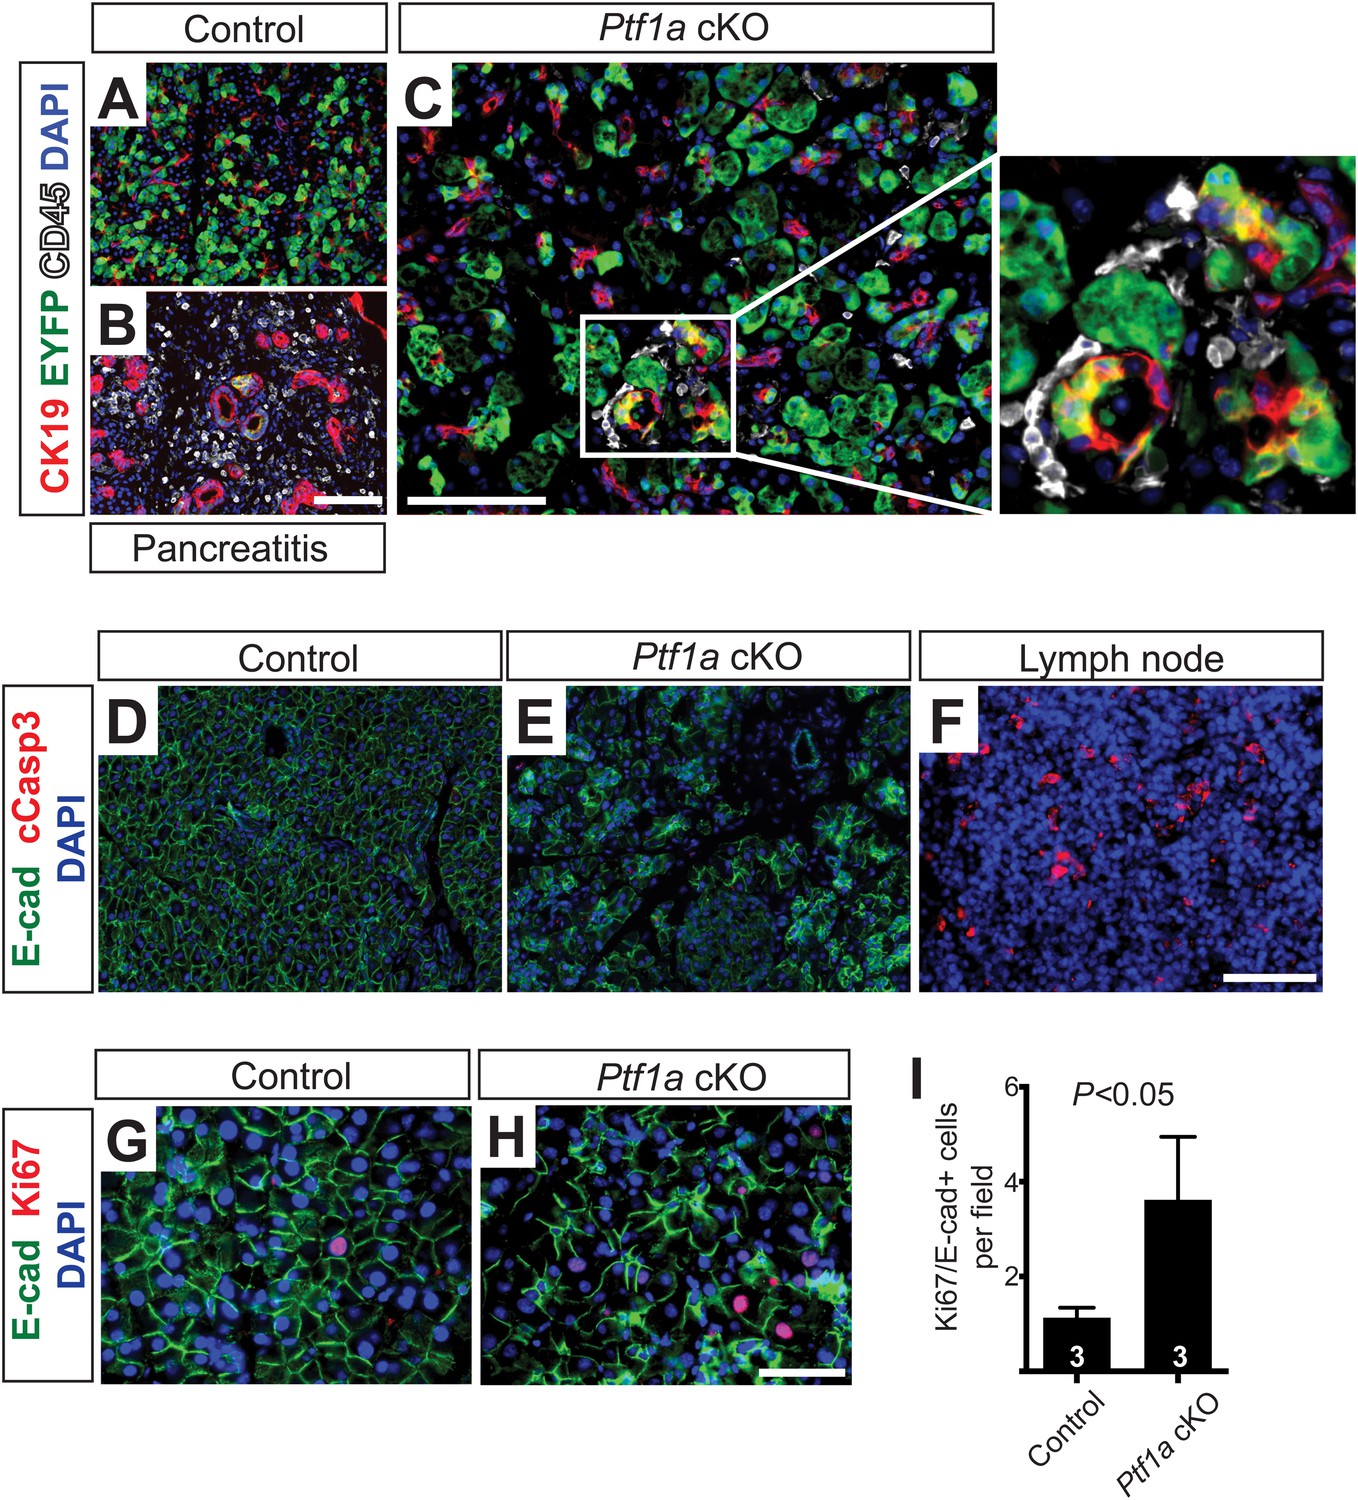
(A–C) Immunofluorescence for CK19 (red), the Cre reporter Rosa26EYFP (green), and CD45 (white) in Ptf1a cKO pancreata, 2 weeks after high-dose TM administration. Caerulein-treated Ptf1a cKO pancreas included as control for pancreatitis (B). Enlarged boxed area highlights EYFP+ acinar cells expressing CK19, surrounded by CD45+ leukocytes. (D, E) Immunofluorescence for E-cadherin (green), cleaved Caspase-3 (red) and DAPI (blue) in control and Ptf1a cKO pancreata. (F) Pancreatic lymph node, positive control for cleaved Caspase-3 staining. (G, H) Immunofluorescence for E-cadherin (green), Ki67 (red) and DAPI (blue). (I) Quantification of Ki67+/E-cadherin+ cells per 40× field (n = 3 per group, p < 0.05). Scale bars: (A–F) 100 μm, (G–H) 50 μm.
Figure 4—figure supplement 3
High-dose tamoxifen administration does not induce pancreatitis.
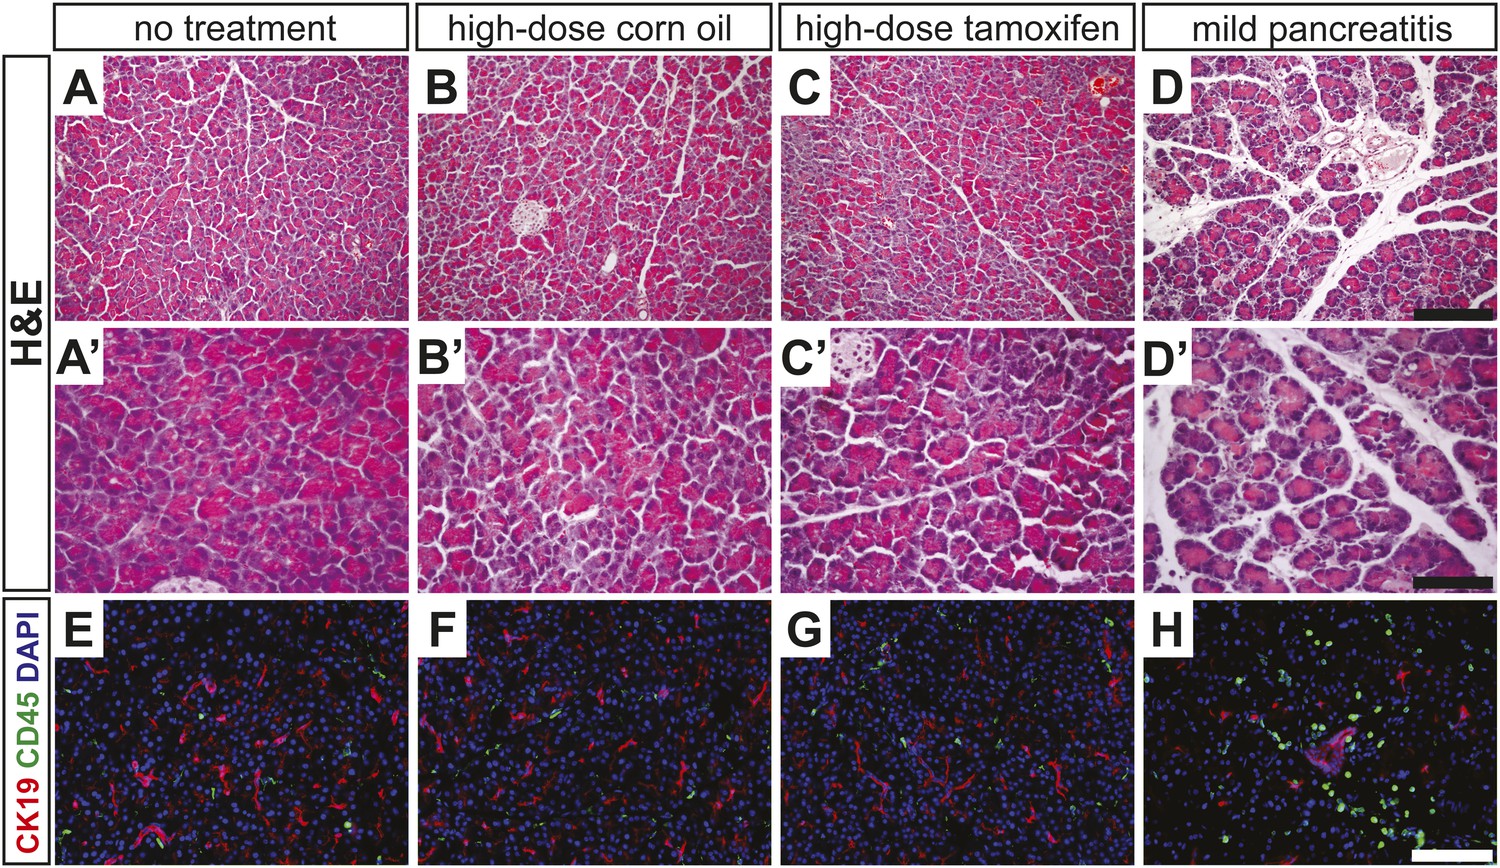
(A–D) Lowand (A′–D′) high-magnification H&E staining of wild-type pancreata, fixed 24 hr after indicated treatment. (E–H) Immunofluorescence for CK19 (red), CD45 (green) and DAPI (blue), highlighting inflammatory cells in the exocrine pancreas. Scale bars: (A–D) 200 μm, (A′–D′) 100 μm, (E–H) 50 μm.
Figure 5
Ptf1a suppresses fibroinflammatory pathways and oncogenic KRAS associated gene signatures.
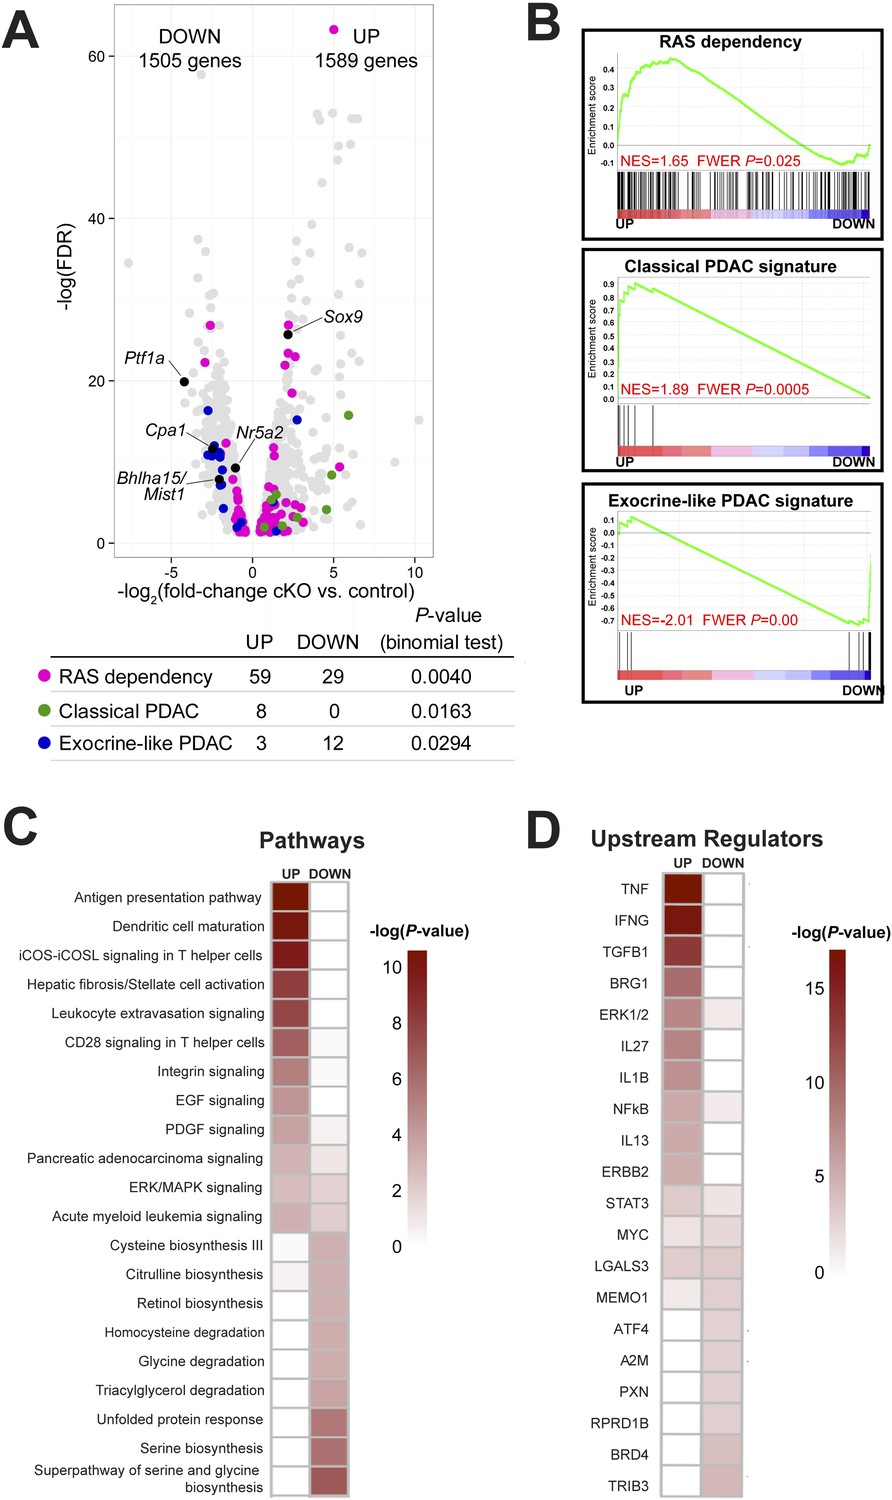
(A) Volcano plot showing differentially expressed genes (false discovery rate [FDR] <0.05; gray) in Ptf1a cKO pancreata, relative to control. Individual genes are labeled and highlighted in black. Genes belonging to signatures characteristic of RAS dependency, classical and exocrine-like pancreatic ductal adenocarcinoma (PDAC) are highlighted in pink, green, and blue, respectively. Table below indicates p-values from binomial test for enrichment of gene signatures within up- or down-regulated genes. (B) Gene Set Enrichment Analysis (GSEA) enrichment plots of differentially expressed genes between Ptf1a cKO and control indicating positive enrichment of RAS dependency and classical PDAC signatures and negative enrichment of exocrine-like PDAC signature genes. (C, D) Ingenuity Pathway Analysis (IPA, Qiagen Redwood City, www.qiagen.com/ingenuity) was used to identify differentially expressed pathways and upstream regulators in Ptf1a cKO pancreata. (C) Heat map of pathways that are significantly increased and decreased upon Ptf1a deletion. (D) Heat map of upstream pathways and regulators predicted to drive the observed changes in gene expression. Color scale is indicative of the -log p-value (significance). All analyses are based on a ±2.0-fold expression threshold. Full details of the data set and analyses can be found in the supplementary data files.
Figure 6 with 1 supplement
Ptf1a is necessary for acinar cell regeneration and suppression of dysplasia following induced pancreatitis.
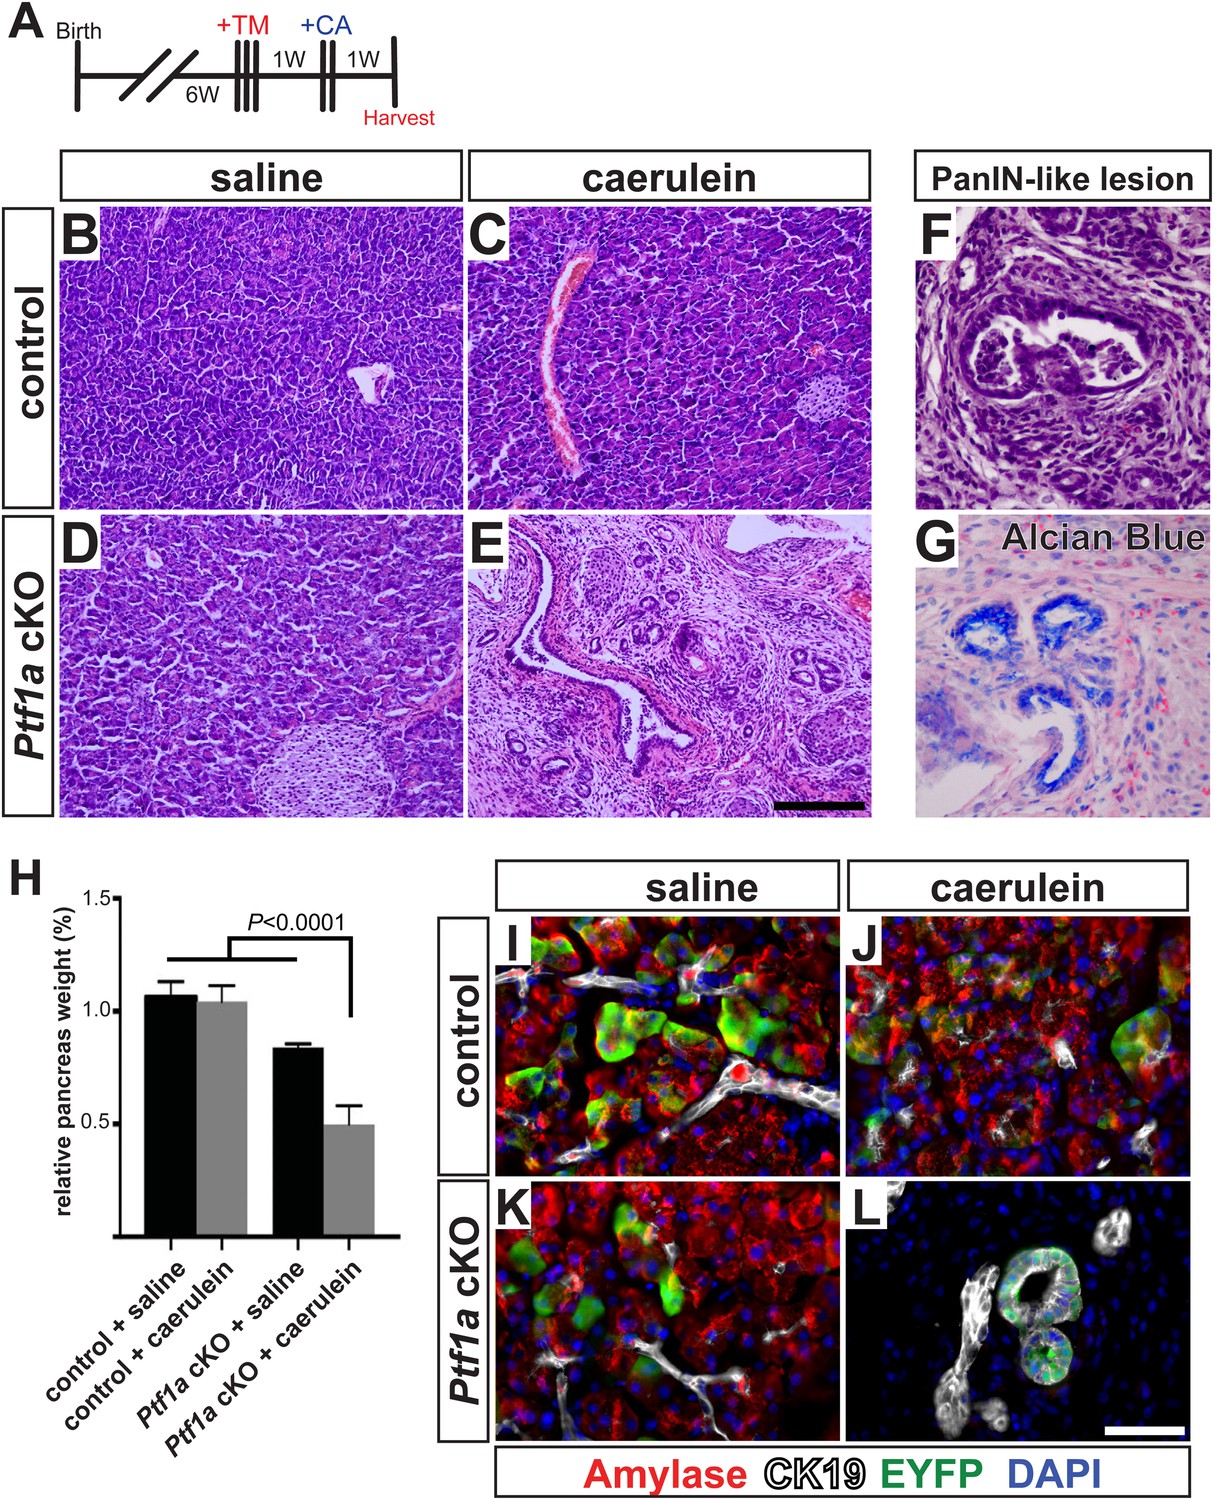
(A) 6- to 8-week-old control and Ptf1a cKO mice were administered three doses of TM (0.17 mg/g) on consecutive days. 1 week later, mice were administered eight hourly injections of caerulein or saline vehicle, on two consecutive days. Mice were sacrificed 1 week following caerulein treatment. (B–E) H&E staining on control and Ptf1a cKO pancreata (n = 4–5 per group) 1 week following caerulein treatment. (F) H&E stain highlighting a PanIN-like lesion in caerulein-treated Ptf1a cKO. (G) Alcian Blue-positive lesions in caerulein-treated Ptf1a cKO. (H) Relative pancreas size, measured as a percent of body weight, among treatment groups (n = 4–5 per group, p < 0.01). (I–L) Immunofluorescence for amylase (red), CK19 (white), and the Cre reporter R26REYFP (green), in pancreata of control and Ptf1a cKO treated with saline or caerulein. EYFP+ cells of caerulein-treated cKO have downregulated amylase and contribute to CK19+ PanIN-like structures. Scale bars: (B–E) 200 µm, (I–L) 50 µm.
Figure 6—figure supplement 1
Mucinous metaplasia associated with hyperactive MEK-ERK signaling in caerulein-treated Ptf1a cKO pancreata.
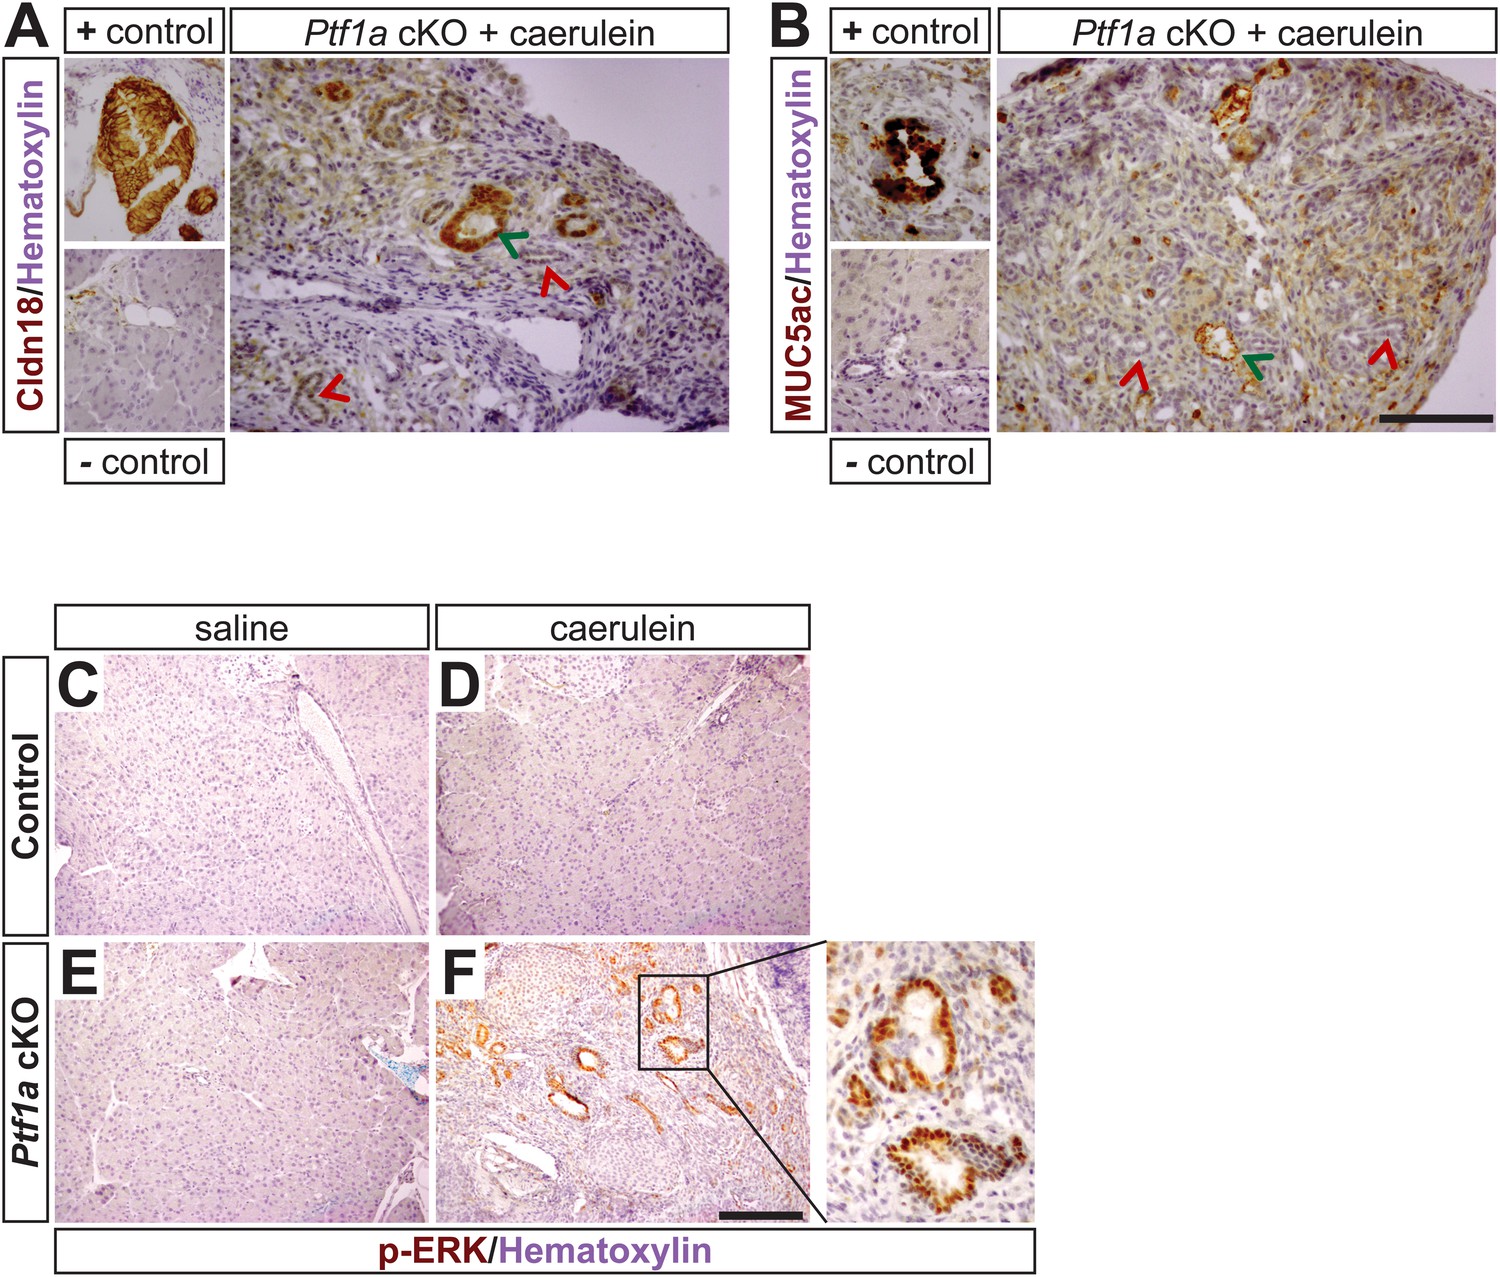
(A, B) IHC for the PanIN markers Claudin-18 (A) and MUC5ac (B) in caerulein-treated Ptf1a cKO with corresponding positive and negative controls. Green arrows indicate weakly Claudin-18 positive or Muc5ac positive lesions and red arrows indicate Claudin-18/Muc5ac negative metaplasia. (C–F) IHC for phosphorylated-ERK (p-ERK) on control and Ptf1a cKO pancreata 1 week following caerulein treatment. Enlarged boxed area highlights mucinous metaplasia-like lesions from caerulein-treated Ptf1a cKO pancreata with strong nuclear p-ERK signal. Scale bars: 200 μm.
Figure 7 with 1 supplement
Ptf1a heterozygosity increases the frequency of PanINs and allows for rapid progression of PDAC.
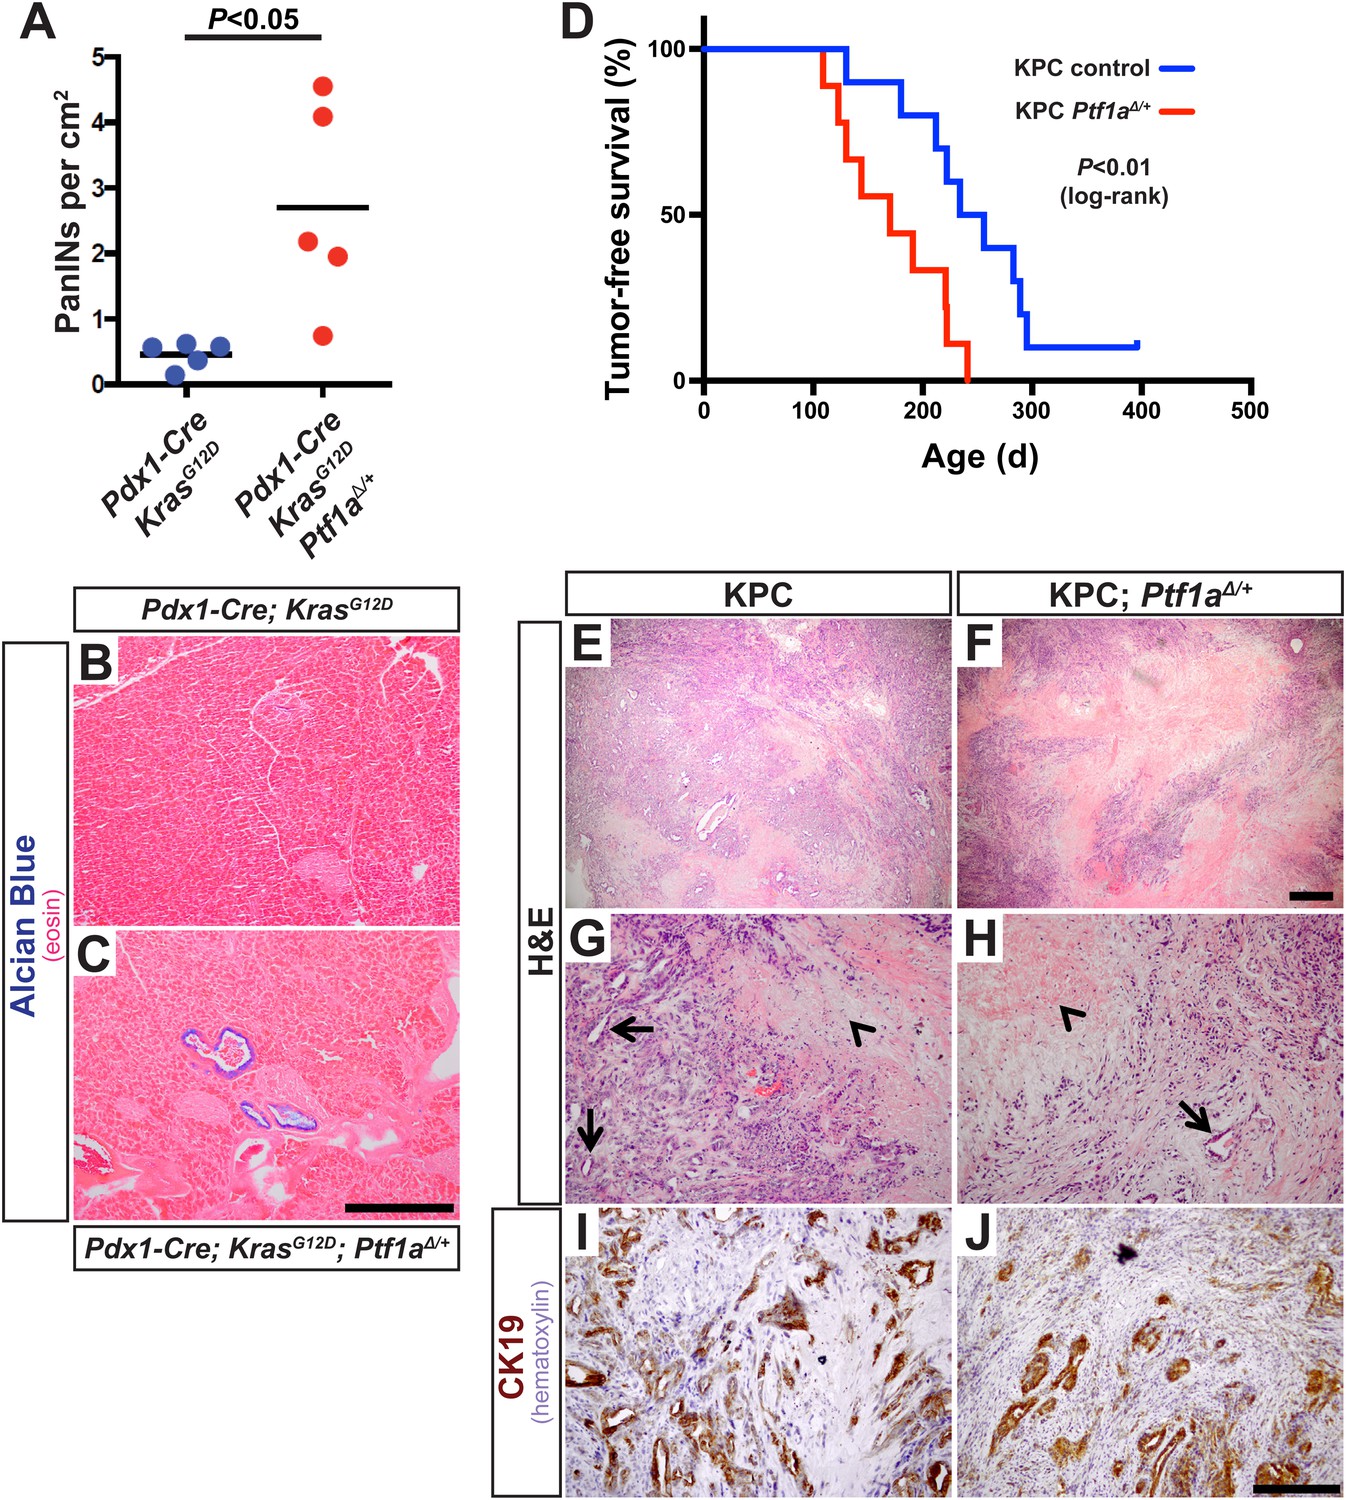
(A) Quantification of PanINs in pancreata from 1-month-old Pdx1-Cre; KrasG12D and Pdx1-Cre; KrasG12D; Ptf1a∆/+ mice (n = 5 per genotype, p < 0.05). (B, C) Representative Alcian Blue and Eosin staining from 1-month-old mice of indicated genotypes. (D) Kaplan–Meier analysis from KPC mice (Pdx1-Cre; KrasG12D; p53lox/+; Ptf1a+/+, blue line) and KPC; Ptf1a∆/+ mice (red line) (Log-Rank test p < 0.01). (E–H) H&E staining on tumors from both KPC and KPC:Ptf1a∆/+ mice at low and high magnification. (G, H) Arrows indicate ductile epithelial cells and arrowheads indicate areas of necrosis. (I, J) IHC for CK19 on tumor specimens from mice of indicated genotypes. Scale Bars: (B, C) 500 µm, (E, F) 500 µm, (G–J) 200 µm.
Figure 7—figure supplement 1
Liver metastases in KPC mice heterozygous for Ptf1a.
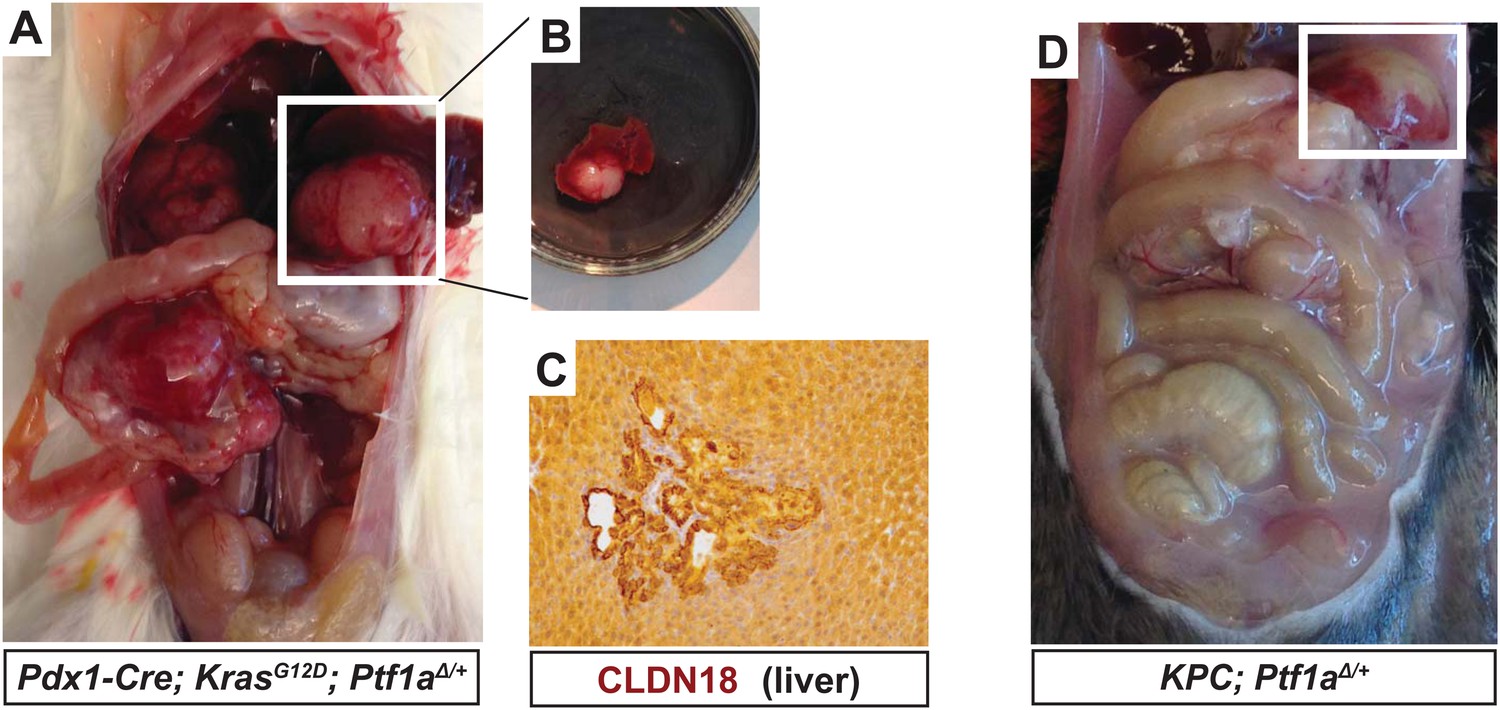
(A) Gross image of a Pdx1-Cre; KrasG12D; Ptf1a+/− mouse harboring metastatic pancreatic cancer. White box highlights large liver metastasis. (B) Dissected lobe of the liver with pancreatic liver metastasis. (C) IHC for CLDN18 confirmed liver metastases in a subset of Pdx1-Cre; KrasG12D; p53+/−; Ptf1a+/− mice. (D) Gross image of Pdx1-Cre; KrasG12D; p53+/−; Ptf1a+/− mouse harboring metastatic PDAC. White box highlights liver metastasis.
Tables
Table 1
Nomenclature of mouse mutants used in this study
| Short-hand notation | Ptf1a alleles | Kras allele | Reporter allele |
|---|---|---|---|
| Control | Ptf1aCreERT/+ | – | R26REYFP/+ |
| Ptf1a cKO | Ptf1aCreERT/lox | – | R26REYFP/+ |
| KrasG12D | Ptf1aCreERT/+ | KrasLSL-G12D/+ | R26REYFP/+ |
| Ptf1a cKO; KrasG12D | Ptf1aCreERT/lox | KrasLSL-G12D/+ | R26REYFP/+ |
-
cKO, conditional knock-out.
Table 2
Primary antibodies used in this study
| Antigen | Species | Source | Catalog # | Dilution |
|---|---|---|---|---|
| Amylase | Sheep | BioGenesis | 0480-0104 | 1:1000 |
| Cleaved-caspase-3 | Rabbit | Abcam | AB2302 | 1:1000 |
| Cd45 | Rat | eBioScience | 14-0451-82 | 1:2000 |
| Claudin-18 | Rabbit | Invitrogen | 700178 | 1:2000 |
| Cpa1 | Goat | R&D Systems | AF2765 | 1:1000 |
| Cytokeratin-19 | Rat | Developmental Studies Hybridoma Bank | – | 1:50 |
| Cytokeratin-19 | Rabbit | Abcam | AB133496 | 1:5000 |
| GFP | Chicken | Aves Labs Inc. | GFP-1010 | 1:5000 |
| Ki67 | Mouse | BD Biosciences | 550609 | 1:500 |
| Muc5ac | Mouse | NeoMarkers | 45M1 | 1:500 |
| Ptf1a | Rabbit | Chris Wright, Vanderbilt University | – | 1:5000 |
| Ptf1a | Goat | Chris Wright, Vanderbilt University | – | 1:5000 |
| Phospho-ERK1/2 (T202/Y204) | Rabbit | Cell Signaling | 9101 | 1:1000 |
| Sox9 | Rabbit | Millipore | AB5535 | 1:1000 |
| α-SMA | Rabbit | Abcam | AB32575 | 1:2000 |
-
SMA, smooth muscle actin.
Additional files
-
Supplementary file 1
R markdown for RNA-seq analysis. HTML annotation of R software package analysis performed to generate the data and analyses presented in Figure 5.
- https://doi.org/10.7554/eLife.07125.022
-
Supplementary file 2
Files used for RNA-seq analysis. Excel spreadsheet containing (as tabs) files used in R analysis of RNA-seq data, including differentially expressed genes (false discovery rate < 0.05), gene signatures of RAS dependency, classical pancreatic ductal adenocarcinoma (PDAC) and exocrine-like PDAC, and ‘palette’ file used for color-coding volcano plot.
- https://doi.org/10.7554/eLife.07125.023
-
Supplementary file 3
Ingenuity Pathway Analysis (IPA) analysis output for genes changed >1.5-fold. Excel spreadsheet output from IPA (www.ingenuity.com), indicating predicted up- and down-regulated pathways and regulators from Ptf1a conditional knock-out (cKO) RNA-seq data, based on a differential expression threshold of 1.5-fold.
- https://doi.org/10.7554/eLife.07125.024
-
Supplementary file 4
IPA analysis output for genes changed >twofold. Excel spreadsheet output from IPA (www.ingenuity.com), indicating predicted up- and down-regulated pathways and regulators from Ptf1a cKO RNA-seq data, based on a differential expression threshold of twofold.
- https://doi.org/10.7554/eLife.07125.025
-
Supplementary file 5
IPA analysis output for genes changed >threefold. Excel spreadsheet output from IPA (www.ingenuity.com), indicating predicted up- and down-regulated pathways and regulators from Ptf1a cKO RNA-seq data, based on a differential expression threshold of threefold.
- https://doi.org/10.7554/eLife.07125.026
Download links
A two-part list of links to download the article, or parts of the article, in various formats.
Downloads (link to download the article as PDF)
Open citations (links to open the citations from this article in various online reference manager services)
Cite this article (links to download the citations from this article in formats compatible with various reference manager tools)
The acinar differentiation determinant PTF1A inhibits initiation of pancreatic ductal adenocarcinoma
eLife 4:e07125.
https://doi.org/10.7554/eLife.07125


