Lys63-linked ubiquitin chain adopts multiple conformational states for specific target recognition
- Wuhan Institute of Physics and Mathematics of the Chinese Academy of Sciences, China
- Zhejiang University School of Medicine, China
Figures
Figure 1 with 8 supplements
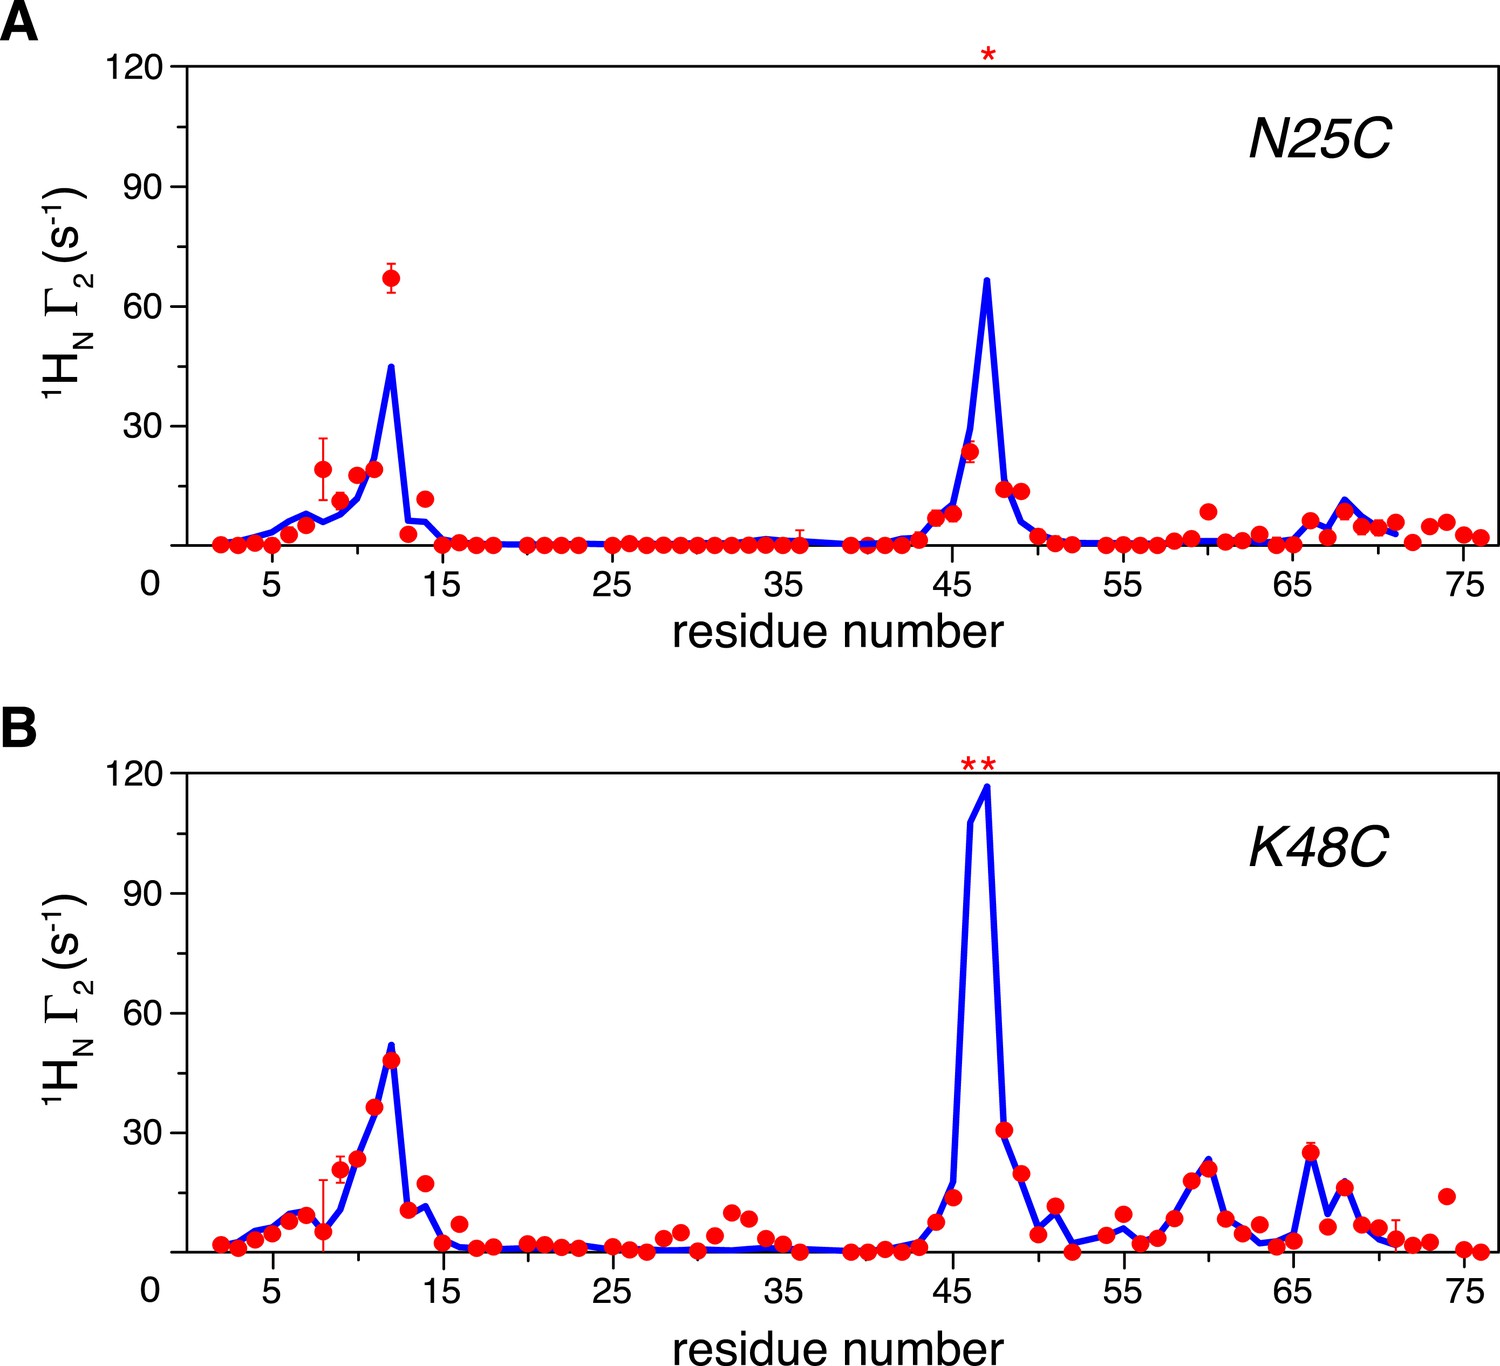
Intra-molecular inter-subunit paramagnetic relaxation enhancements (PREs) measured for ligand-free K63-Ub2.
With the paramagnetic probe conjugated at (A) N25C or (B) K48C in the distal unit, the PRE 1H Γ2 rates were measured for amide protons of the 15N-labeled proximal unit. The red spheres indicate the observed PREs. The error bar indicates 1 SD in the PRE measurement. The blue lines are the back-calculated PRE values for residues 1–71. Residues that are completely broadened out are denoted with asterisks at the top.
Figure 1—figure supplement 1
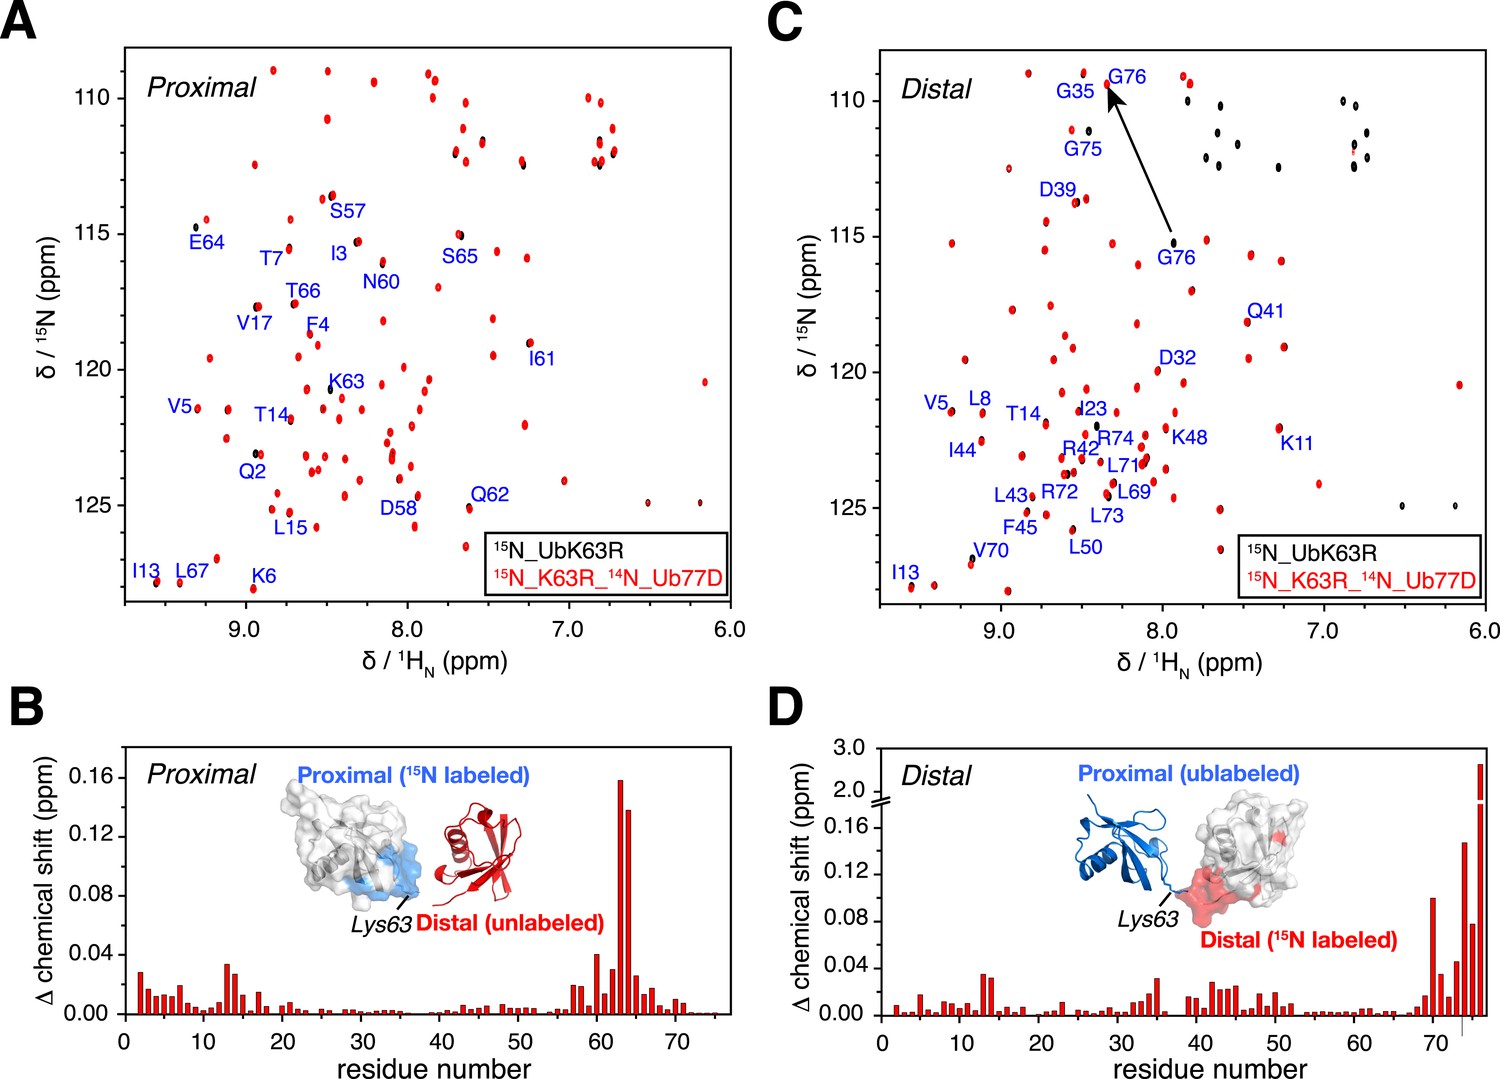
NMR chemical shift differences between ubiquitin monomer and K63-Ub2.
Overlay of 2D 1H-15N correlation spectra for (A) ubiquitin monomer and K63-Ub2 proximal unit, and (B) ubiquitin monomer and K63-Ub2 distal unit. The ubiquitin monomers (also the reactants for preparing K63-Ub2) were modified (either by appending an Asp at the C-terminus or by mutating Lys63 to an Arg) so that only a single product (diubiquitin) was obtained. Residues with relatively large chemical shift differences (>0.01 ppm) were mapped to the surface of (C) the proximal unit and (D) the distal unit, and are colored red. The chemical shift differences in ppm is calculated as (ΔδH2/2 + ΔδN2/5)^0.5.
Figure 1—figure supplement 2
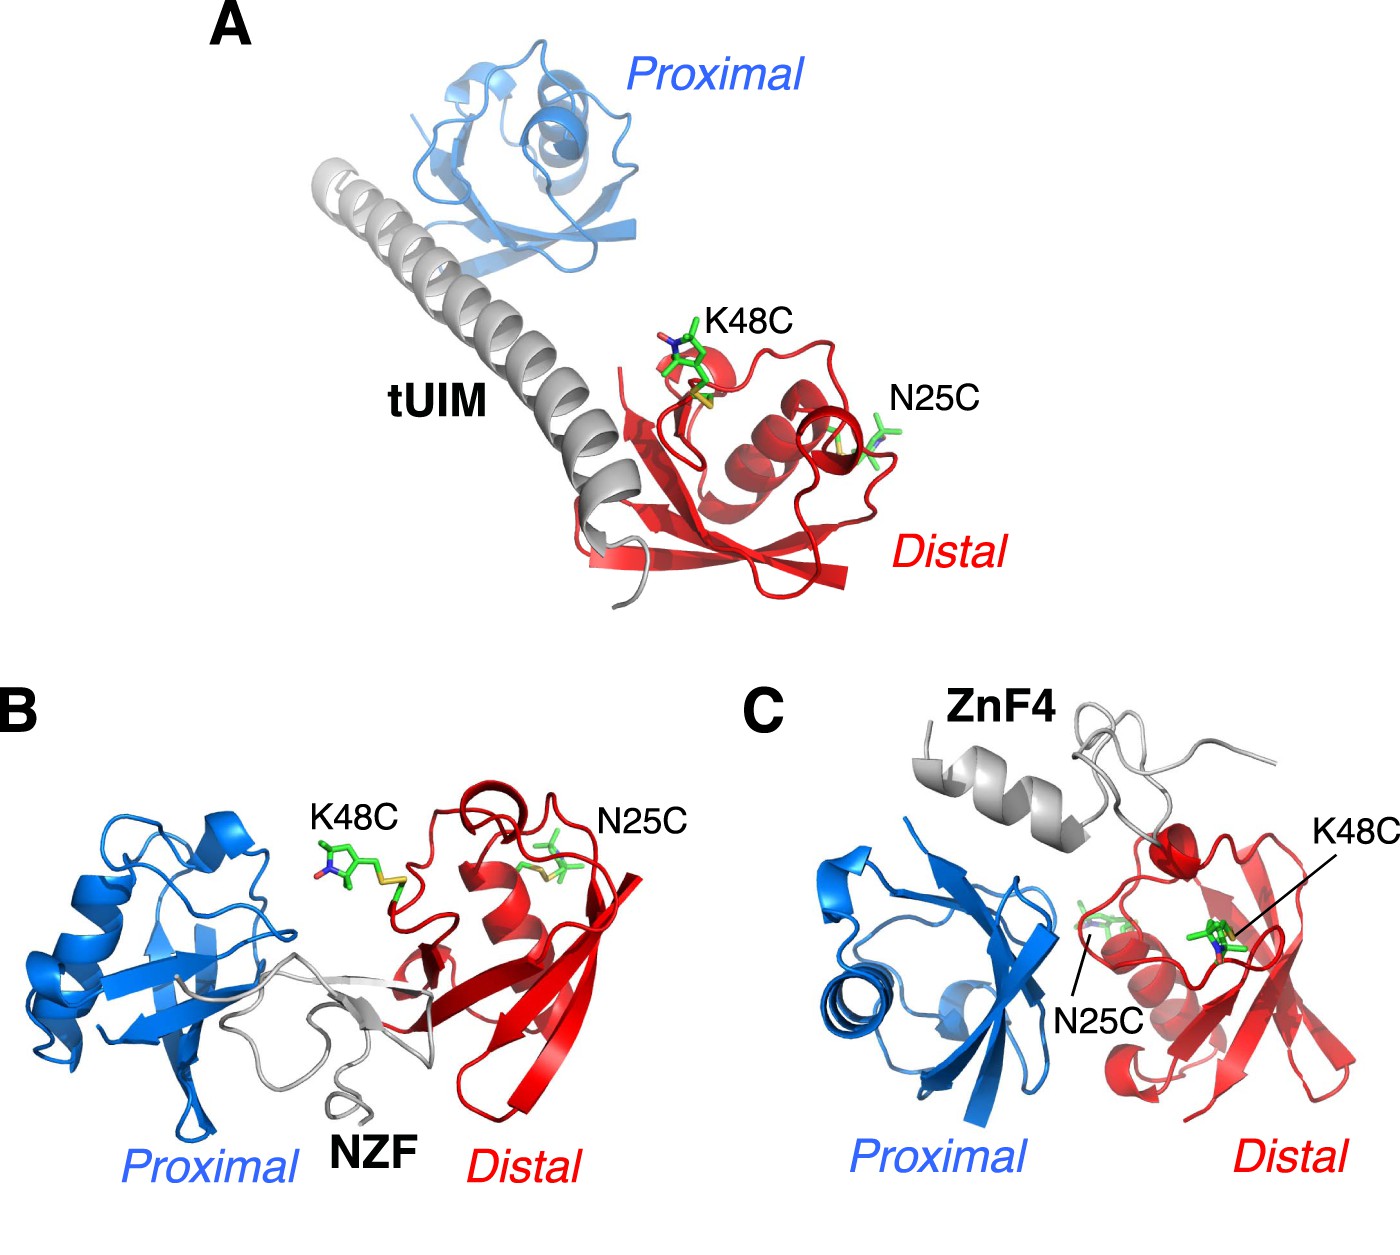
Illustration of cysteine point mutation and conjugation of an MTS paramagnetic probe to K63-Ub2, which is complexed with (A) Rap80 tUIM, (B) TAB2 NZF, or (C) A20 ZnF4.
The corresponding Protein Data Bank (PDB) codes are 2RR9, 2WX0, and 3OJ3, respectively. The modifications are away from the bound ligands in the structures and also from the other subunit.
Figure 1—figure supplement 3
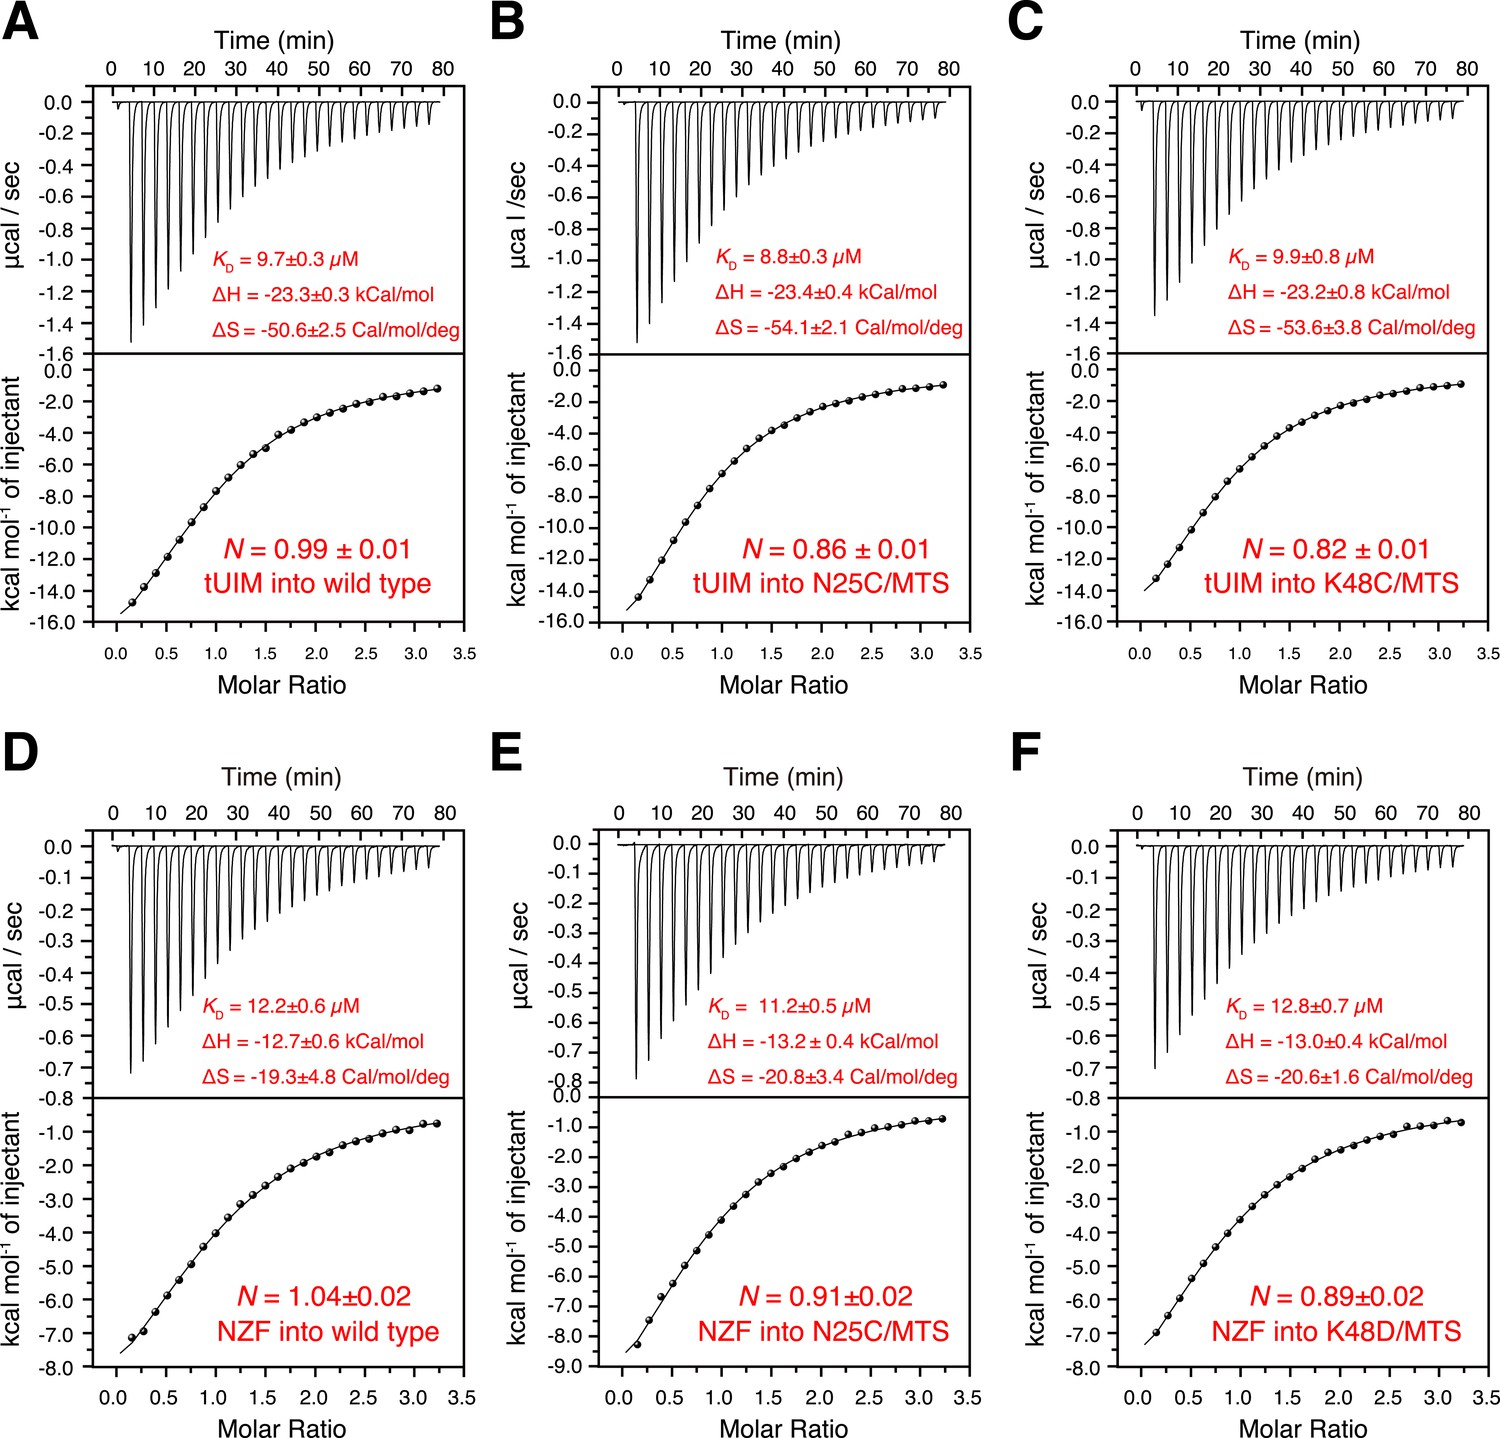
Isothermal calorimetry (ITC) measurements for the binding affinities (A–C) between K63-Ub2 and tUIM, and (D–F) between K63-Ub2 and NZF.
The titrations were performed for (A, D) wild type K63-Ub2, (B, E) N25C mutant conjugated with an MTS paramagnetic probe, and (C, F) K48C mutant conjugated with an MTS paramagnetic probe. The binding affinities KD values were averaged over four independent titrations with SD reported. The averaged enthalpy and entropy changes (±SD) are also labeled.
Figure 1—figure supplement 4
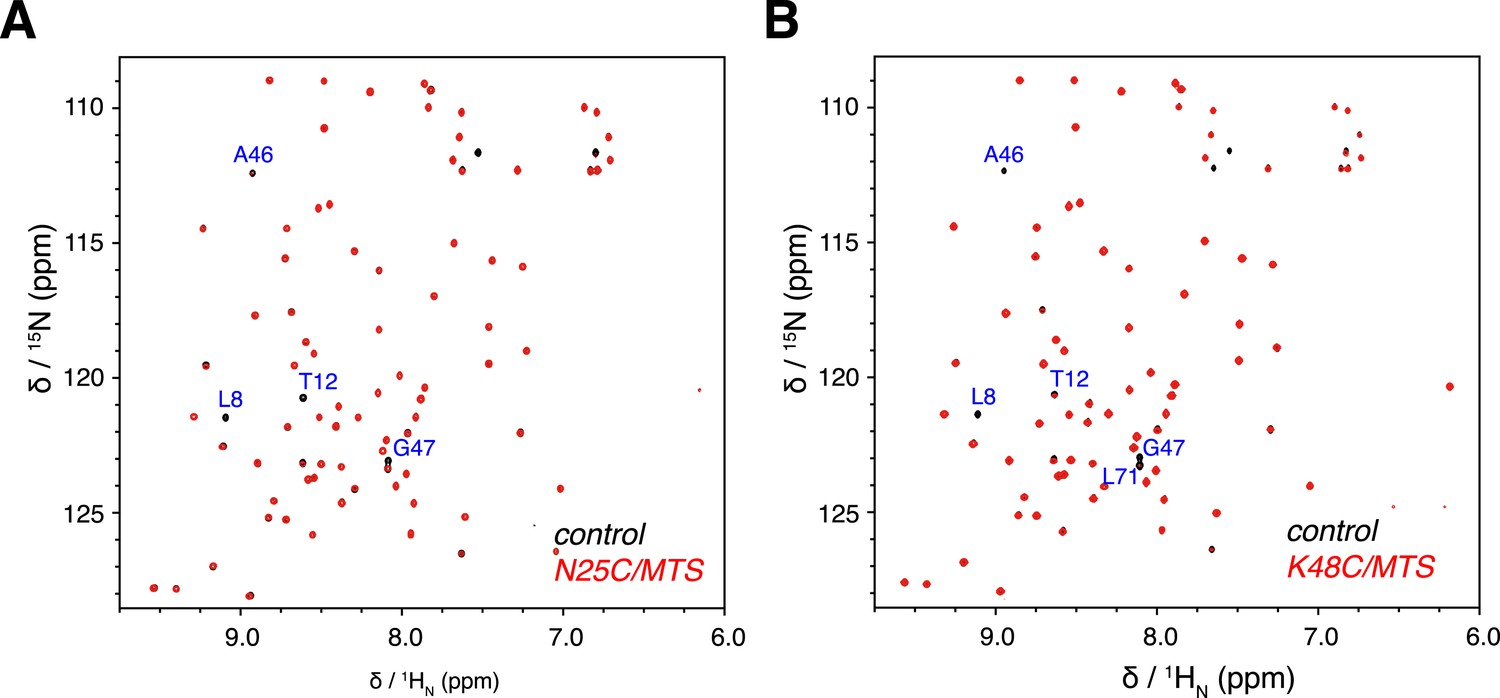
Overlay of 2D NMR spectra for wild type protein and paramagnetically tagged K63-Ub2 proteins at (A) N25C site and (B) K48C site.
Peaks that disappear in the paramagnetic spectra are labeled.
Figure 1—figure supplement 5
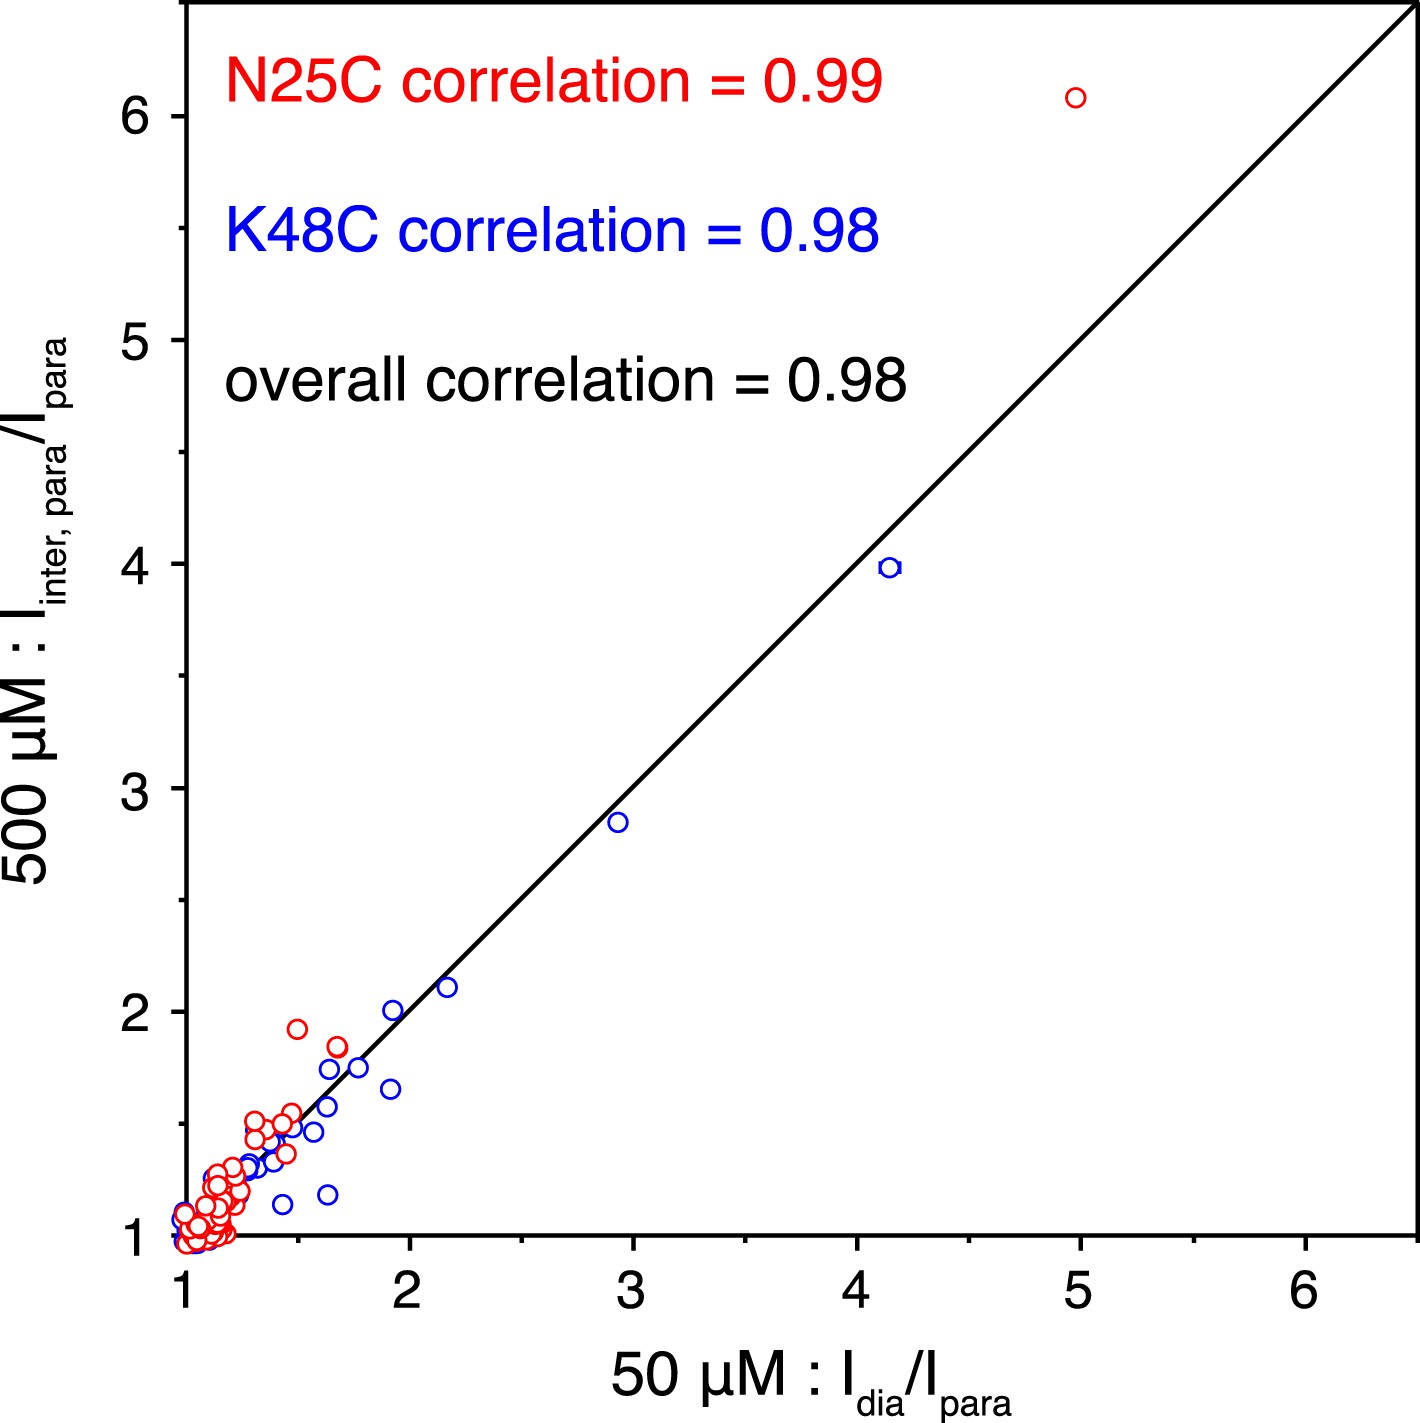
Correlations of the paramagnetic effects measured at two different concentrations.
Peak intensities were compared between the spectra for the wild type diamagnetic protein and for the paramagnetic protein collected at 50 µM concentration (x-axis), or were compared between the spectra for the 1:1 mixture of diamagnetic and paramagnetic proteins and for the paramagnetic protein collected at 500 µM concentration (y-axis).
Figure 1—figure supplement 6
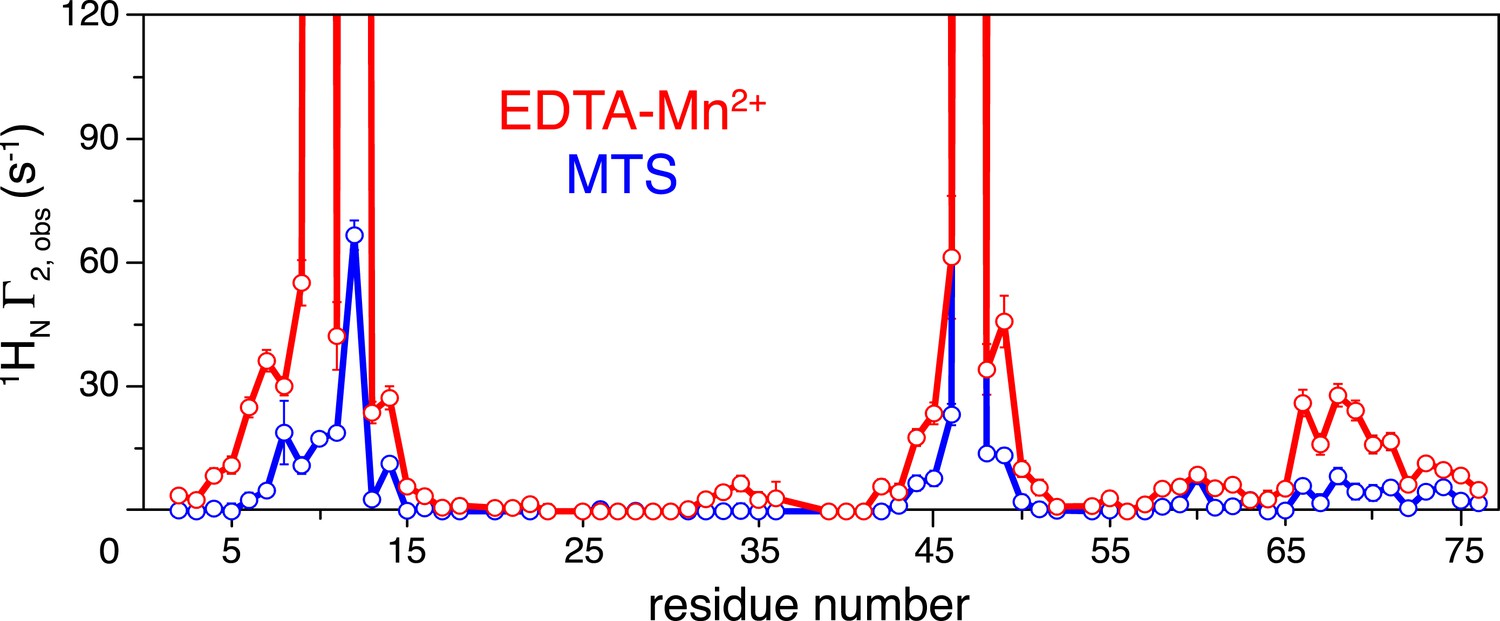
Comparison of the intra-molecular inter-subunit paramagnetic relaxation enhancement (PRE) data with an EDTA-Mn2+ (red circles) or MTS probe (blue circles) conjugated at N25C site.
Lines simply connect the data points. The PREs obtained using EDTA-Mn2+ are larger than those using the MTS probe owing to the larger paramagnetic dipole of the former.
Figure 1—figure supplement 7

Comparison between all known structures of K63-Ub2 in the open state.
With the distal unit superimposed, the positions for the proximal unit are compared. By enforcing negative inter-subunit paramagnetic relaxation enhancement (PRE) restraints, open-state conformations of K63-Ub2 can also be obtained. The atomic probability map plotted at 10% threshold (gray meshes) encompasses the known structures of K63-Ub2 in the open state.
Figure 1—figure supplement 8
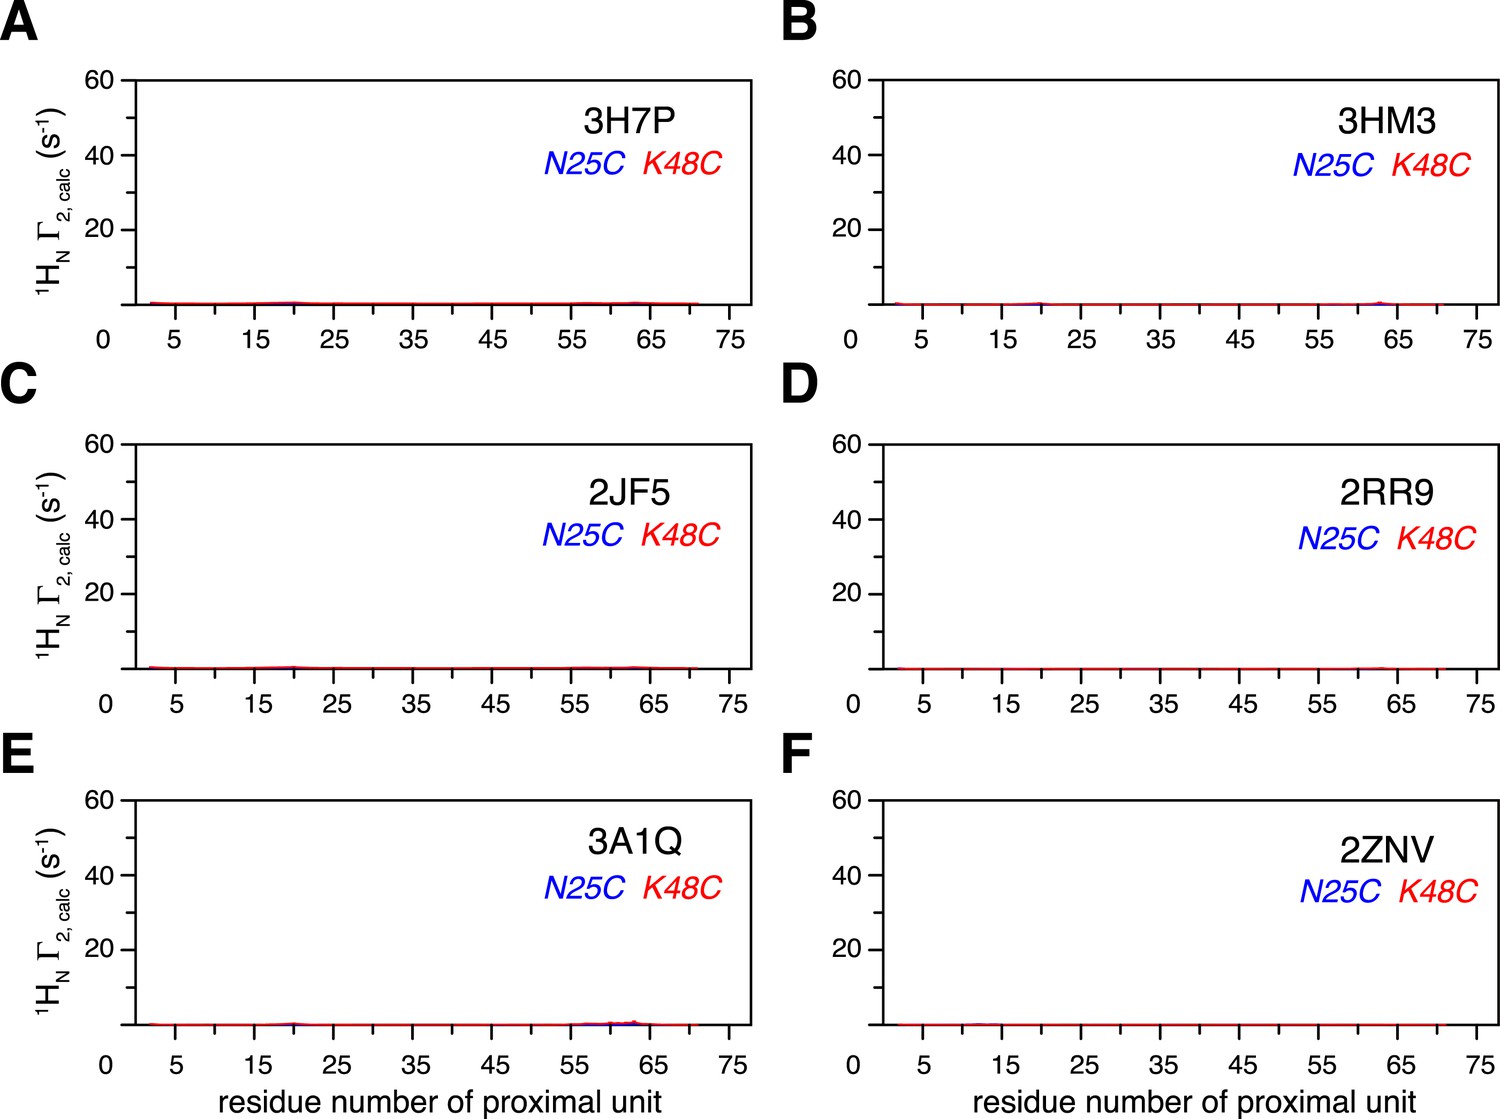
Intra-molecular inter-subunit paramagnetic relaxation enhancements (PREs) arising from K63-Ub2 open state are negligible.
With an MTS probe conjugated at N25C site or K48C site, the PRE values were calculated for the known structures of K63-Ub2 in the open state, which include (A) 3H7P, (B) 3HM3, (C) 2JF5, (D) 2RR9, (E) 3A1Q, and (F) 2NZV.
Figure 2 with 2 supplements

Small angle X-ray scattering (SAXS) analysis of ligand-free K63-Ub2.
(A) Paired-distance distribution curves transformed from the experimental data (black line) or calculated for the known structures of K63-Ub2. Except for the Protein Data Bank (PDB) structures 3H7P, 3HM3, and 2JF5, the bound ligand was removed before calculation. (B) Comparison between experimental (gray dots) and simulated scattering data (transparent cyan line), affording a χ2 value of 1.24. The simulated curve was obtained by linearly combining the theoretical curves calculated for open-state (red line) and closed-state (blue line) solution structures at 30:70 ratio.
Figure 2—figure supplement 1
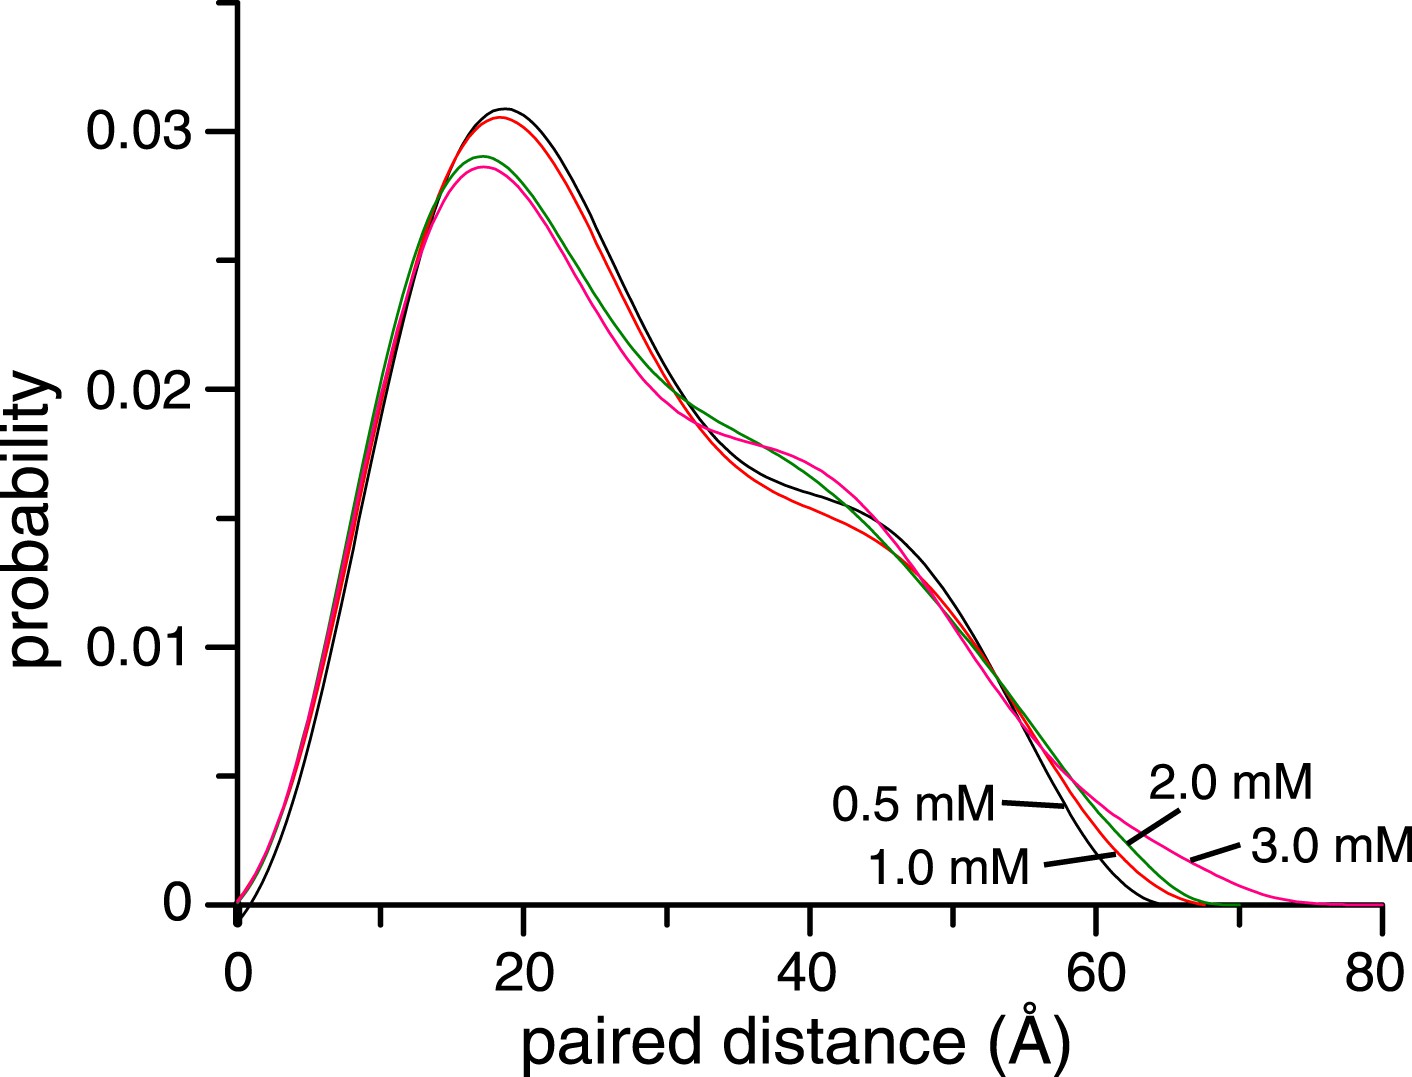
Concentration dependence of small angle X-ray scattering (SAXS) profiles for ligand-free K63-Ub2.
The paired-distance curve displays a narrower distribution at lower protein concentration. The larger particle size at higher protein concentration can be attributed to the non-covalent interactions between two or more K63-Ub2.
Figure 2—figure supplement 2
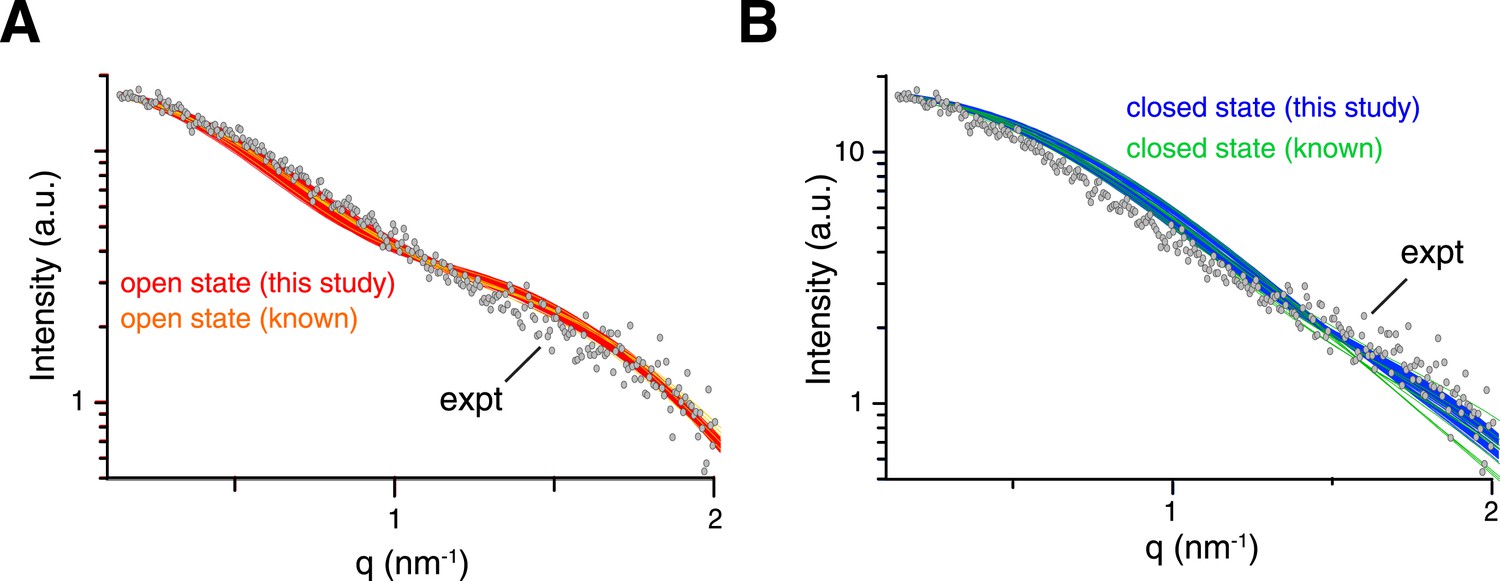
Comparison between experimental and theoretical scattering curves for (A) open-state and (B) closed-state structures.
Each line represents the theoretical curve calculated for one conformer in one of the ensemble structures obtained. For reference, the calculated scattering curves for the known structures of K63-Ub2 in either open or closed states are also shown (with the bound ligand removed if present).
Figure 3 with 1 supplement
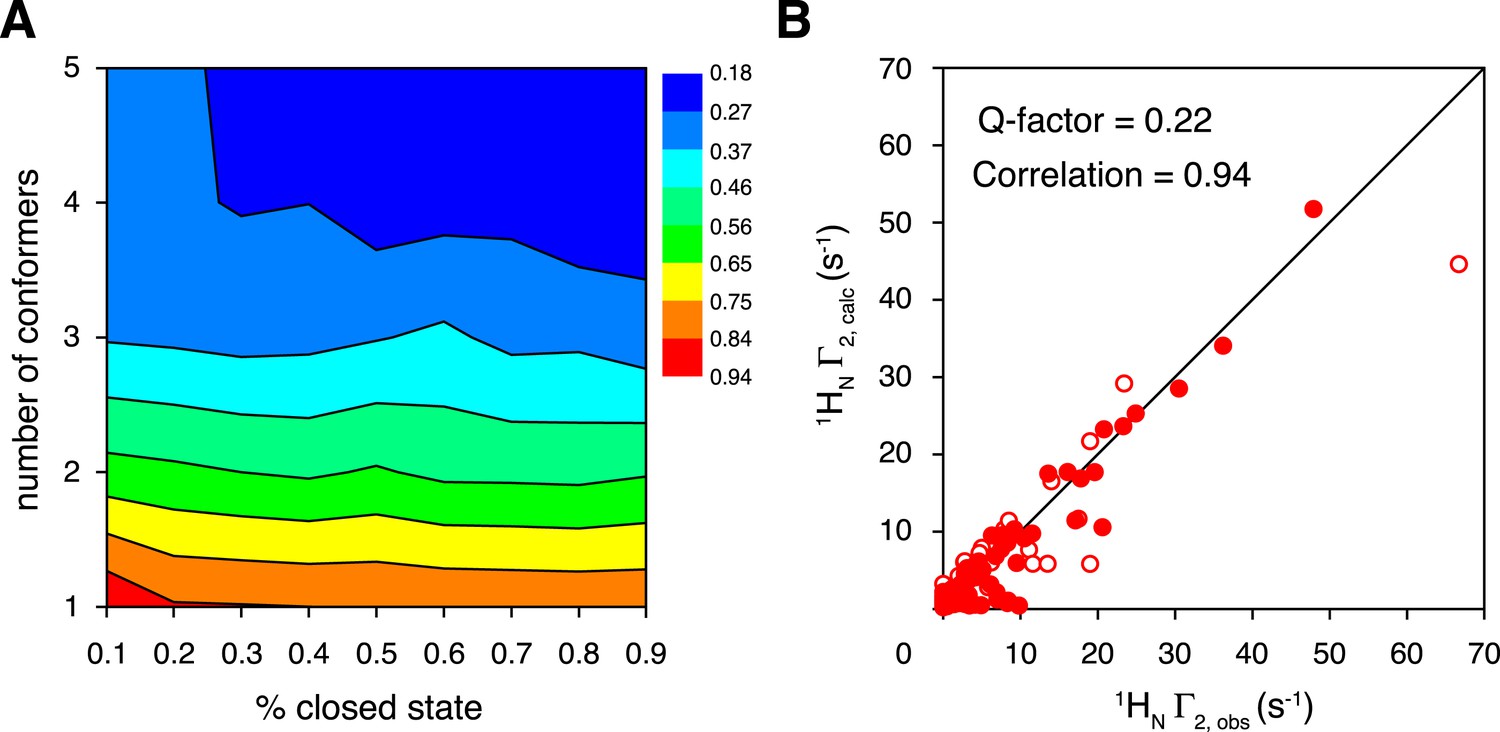
Ensemble refinement of the closed-state structure of K63-Ub2 against intra-molecular inter-subunit paramagnetic relaxation enhancements (PREs).
(A) Heat map of PRE Q-factor upon varying the number of conformers and the population of the closed state. (B) The correlation between observed and calculated PREs, with a four-conformer representation at 70% closed-state population. The PRE ensemble Q-factor is 0.26 and 0.18 for the N25C site (open circles) and K48C site (closed circles), respectively, and 0.22 for both sites. The diagonal indicates a perfect correlation to guide the eyes.
Figure 3—figure supplement 1
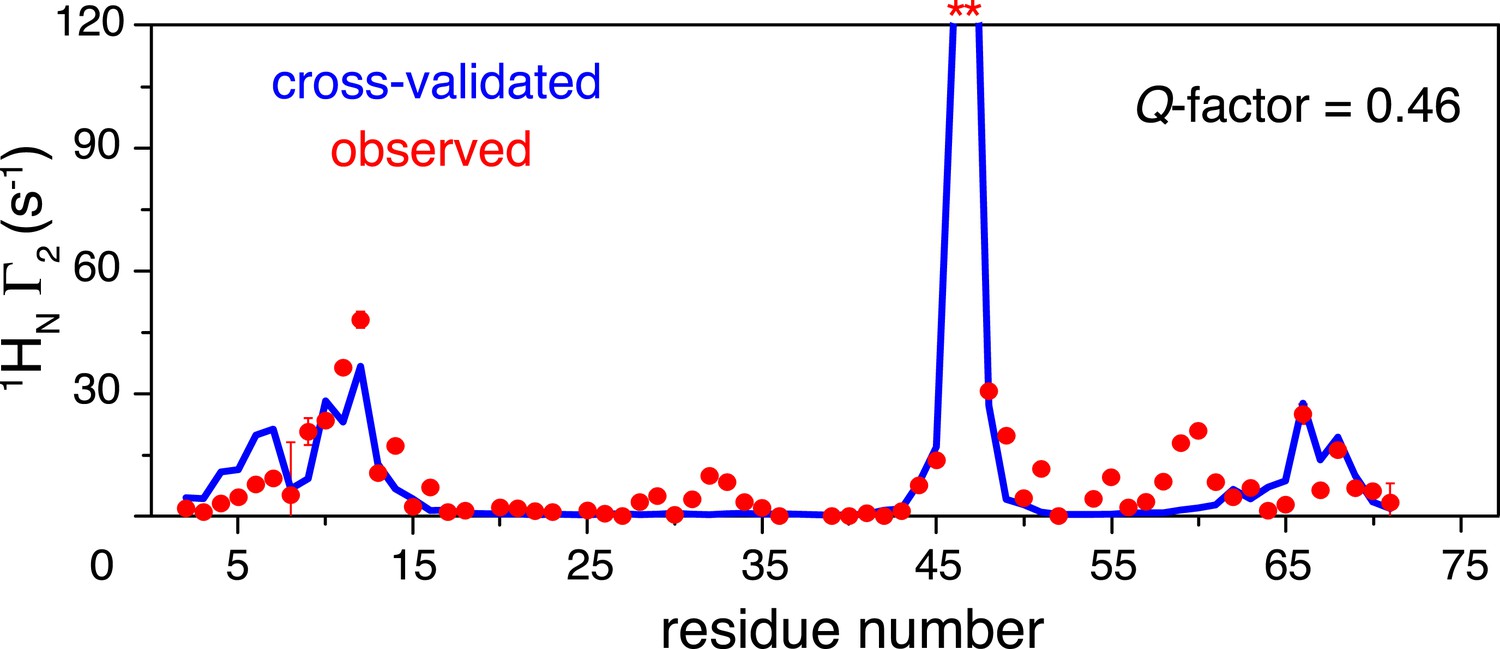
Cross-validation of paramagnetic relaxation enhancement (PRE) data.
The closed-state structure of K63-Ub2 was refined against N25C data only with a four-conformer representation. The PREs for the K48C site were back-calculated (blue line), which agree well with the experimental data (red circles) with a free Q-factor of 0.46. Residues that are completely broadened out are denoted with asterisks at the top.
Figure 4 with 2 supplements
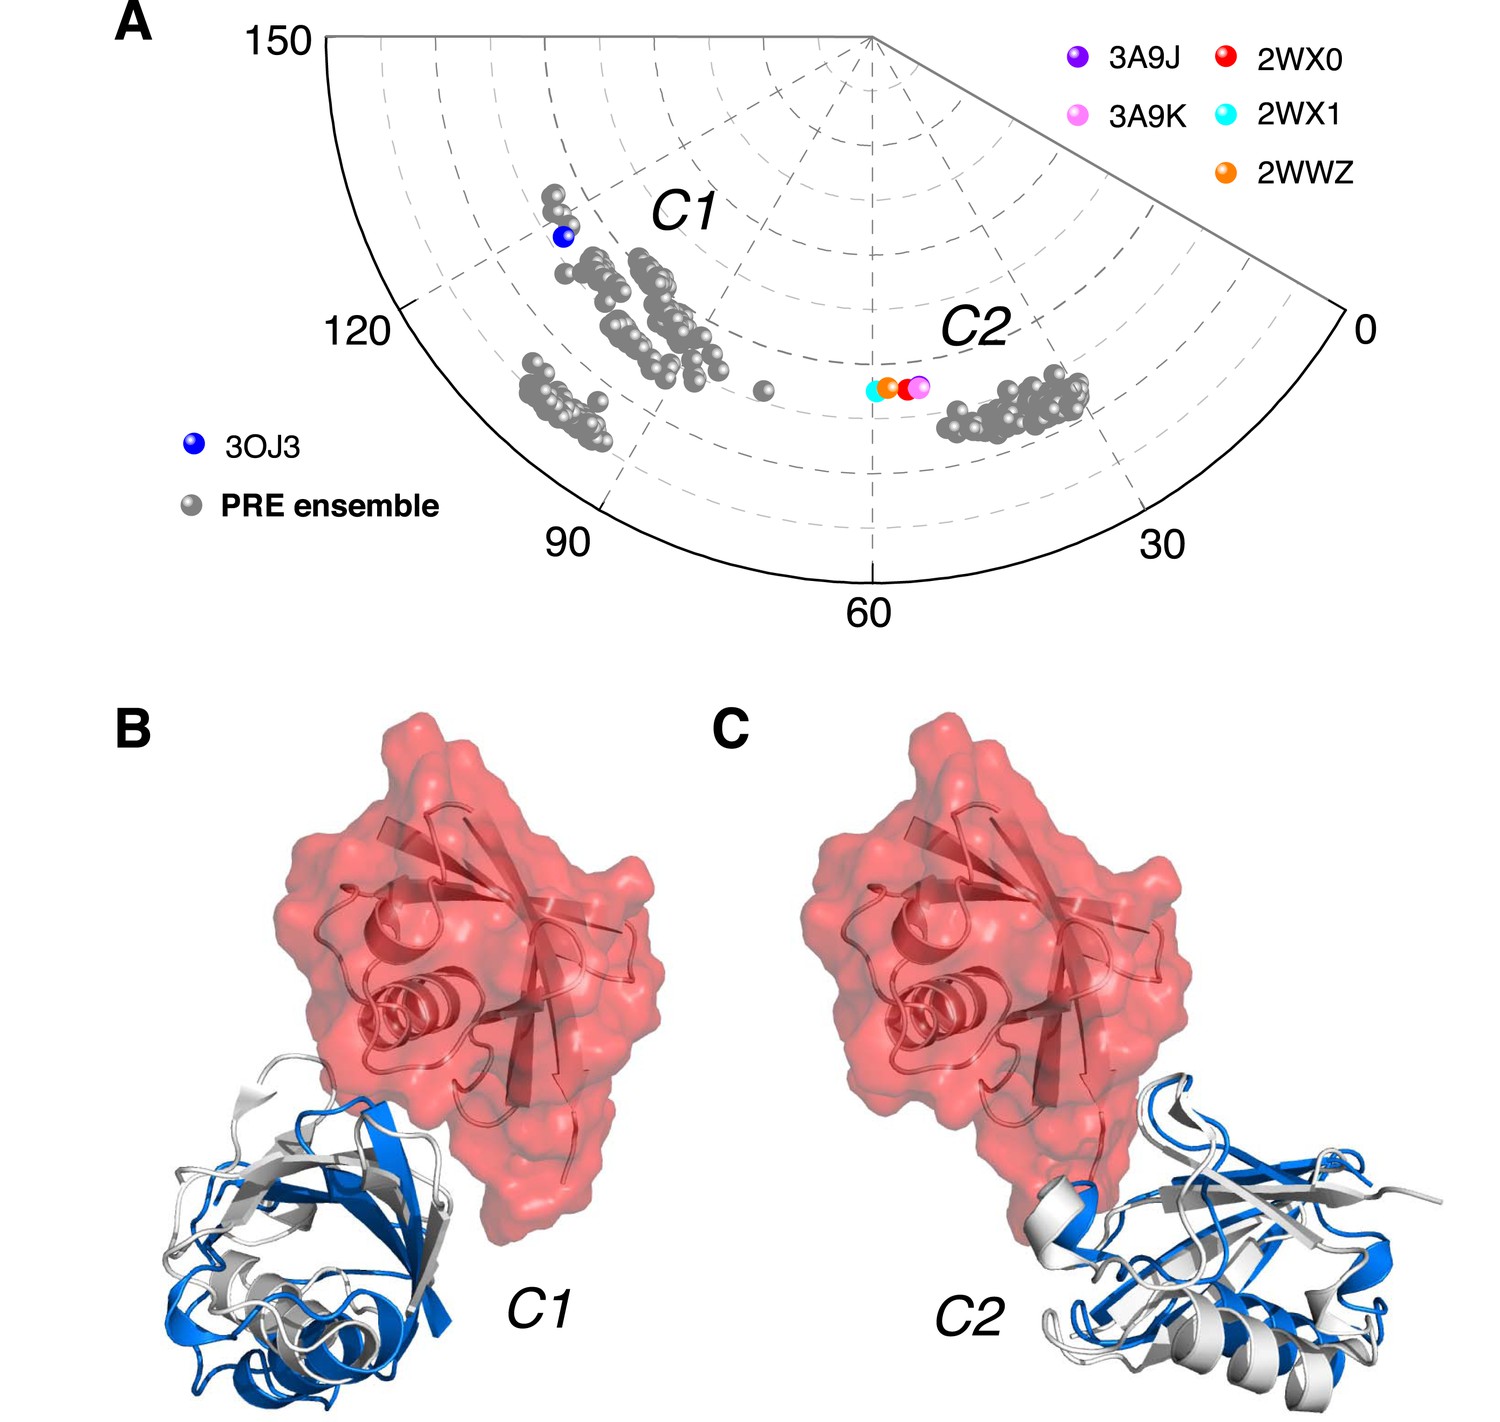
Ensemble structure of K63-Ub2 in closed state.
(A) Projection of the ensemble structures in two dimensions with spherical coordinates. K63-Ub2 crystal structures in closed states are also projected. (B, C) Comparison of the ligand-free K63-Ub2 structure with K63-Ub2 crystal structures in complex with A20 ZnF4 and NZF TAB2, respectively. With the distal unit superimposed, the other ubiquitin subunit in the crystal structure is shown as a gray cartoon, affording root-mean-square (RMS) differences of 3.93 Å and 1.68 Å for C1 and C2 closed states, respectively.
Figure 4—figure supplement 1
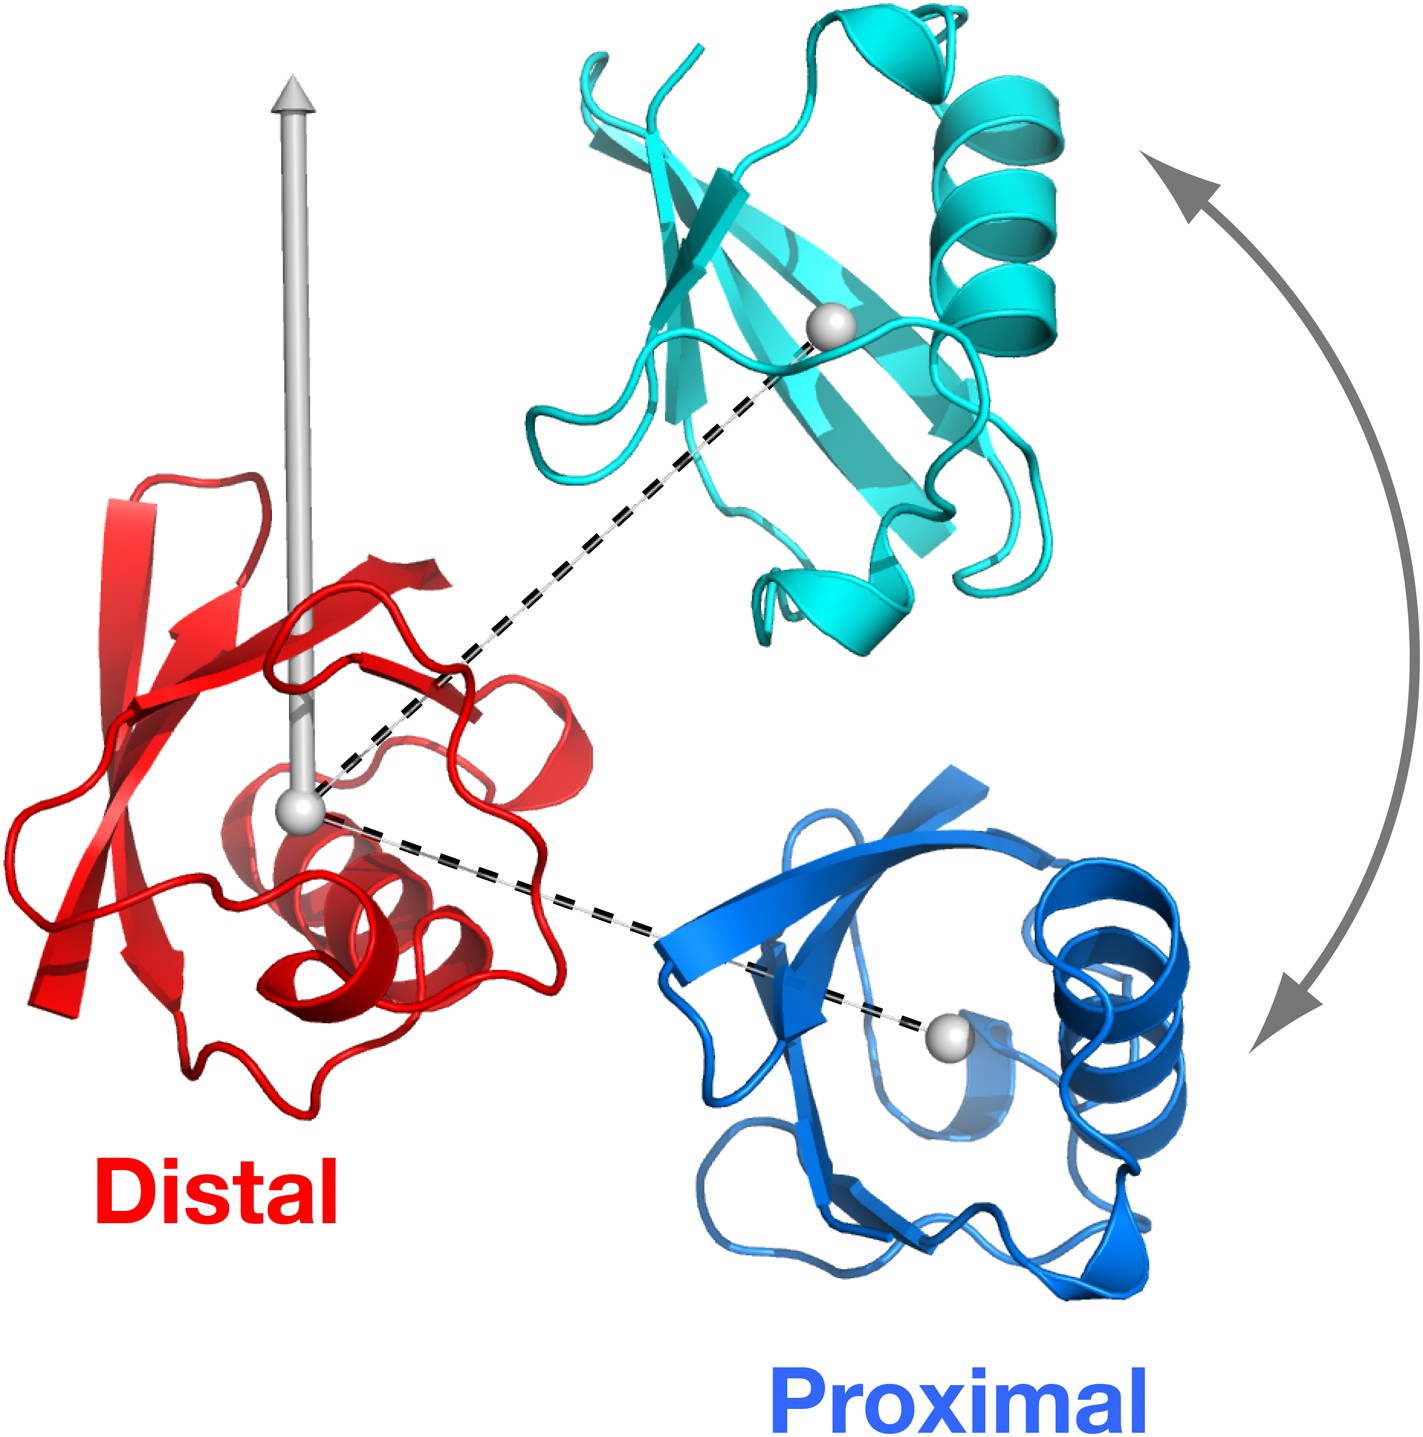
Definition of the spherical coordinate system.
The origin is set at the center-of-mass of the distal unit, with north pole indicated. With the distal unit fixed, the polar angle of the proximal unit defines the relative orientation of the vector connecting the centers-of-mass of the distal and proximal units (dashed lines).
Figure 4—figure supplement 2
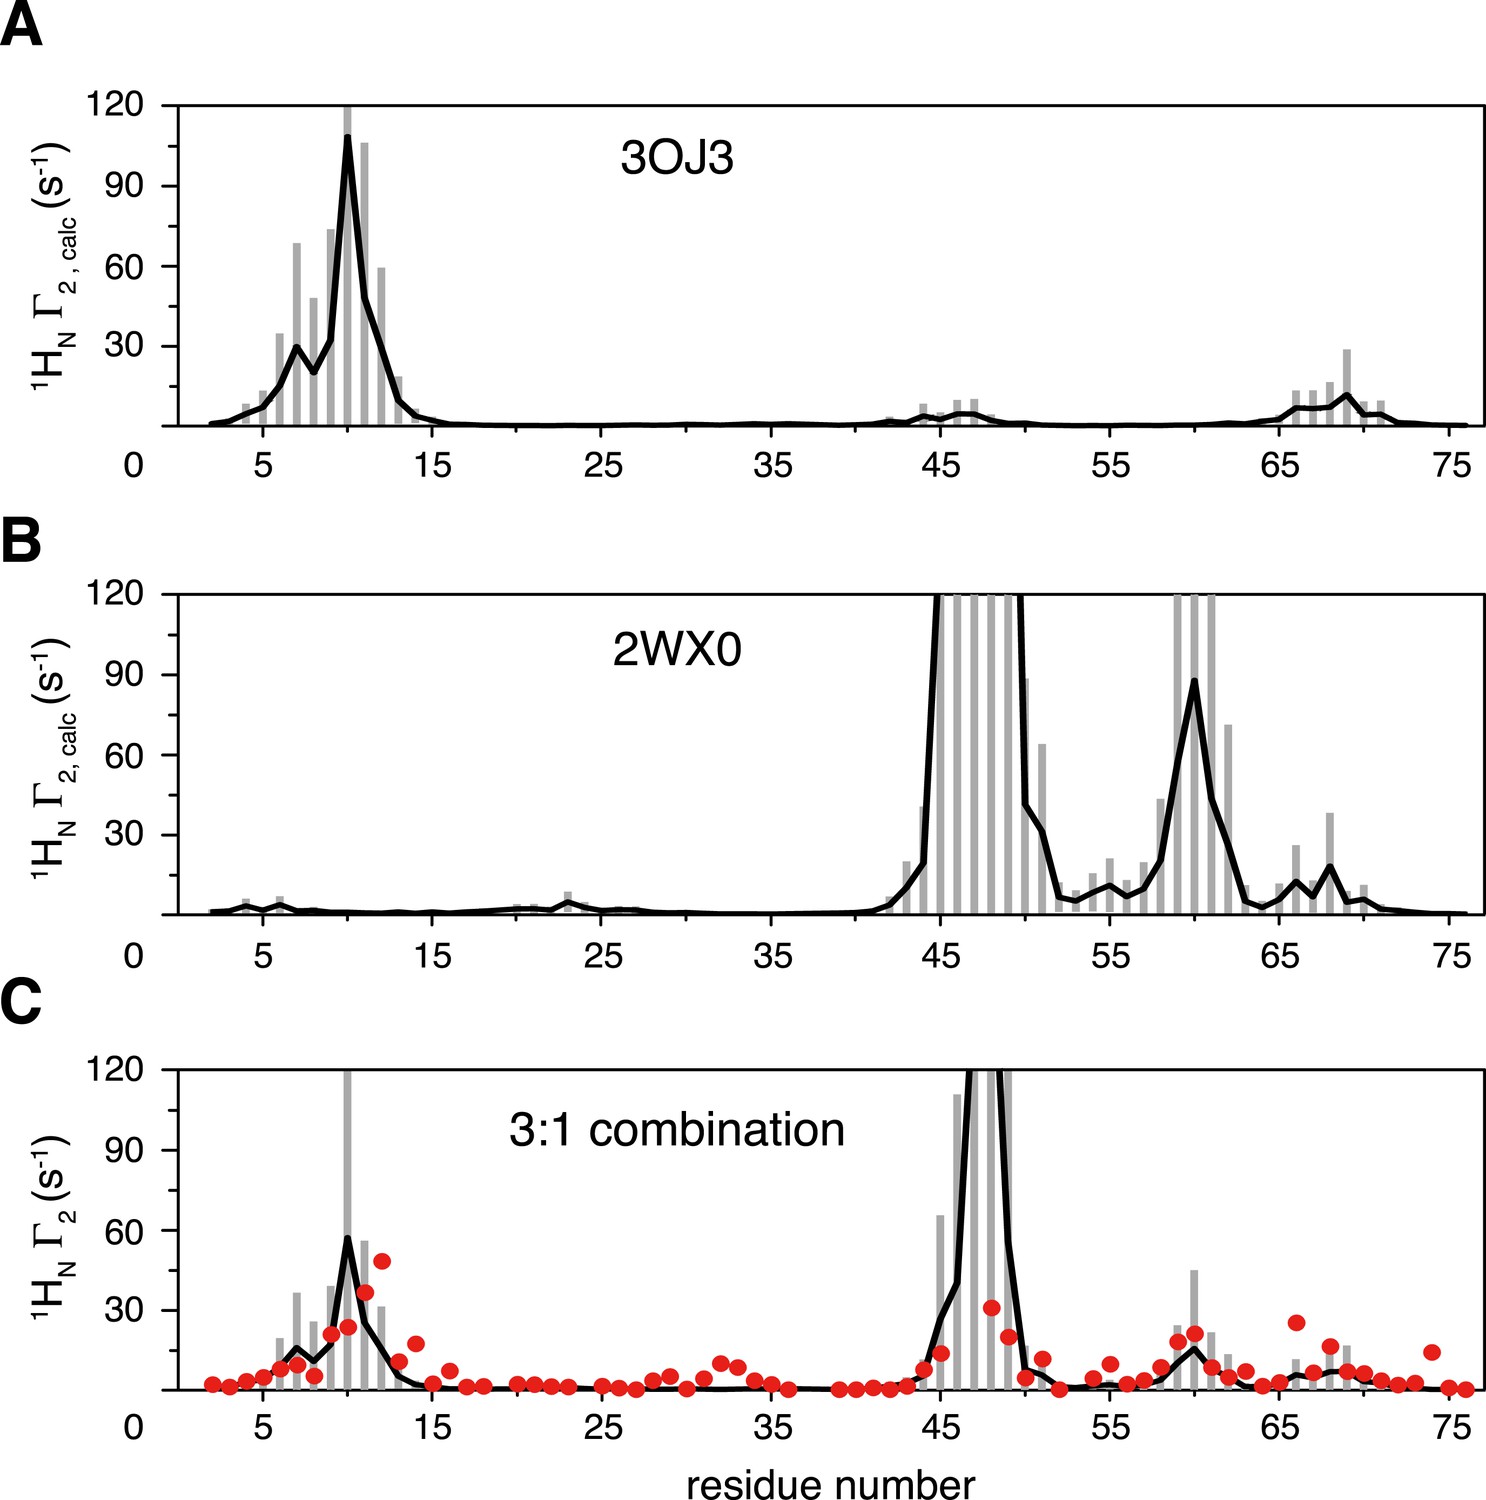
Inter-subunit paramagnetic relaxation enhancements (PREs) predicted from the crystal structures of K63-Ub2 in the closed state.
(A, B) PREs predicted for the proximal unit in the Protein Data Bank (PDB) structures 3OJ3 and 2WX0, with an MTS probe conjugated at K48C site. Averaged PRE values are shown as black lines, with the SDs shown as gray bars. (C) Linear combination of the two sets of predicted PREs at 3:1 ratio with 70% total population (52.5% for 3OJ3 and 17.5% for 2WX0). The experimental PRE data at K48C are shown as red circles.
Figure 5 with 2 supplements
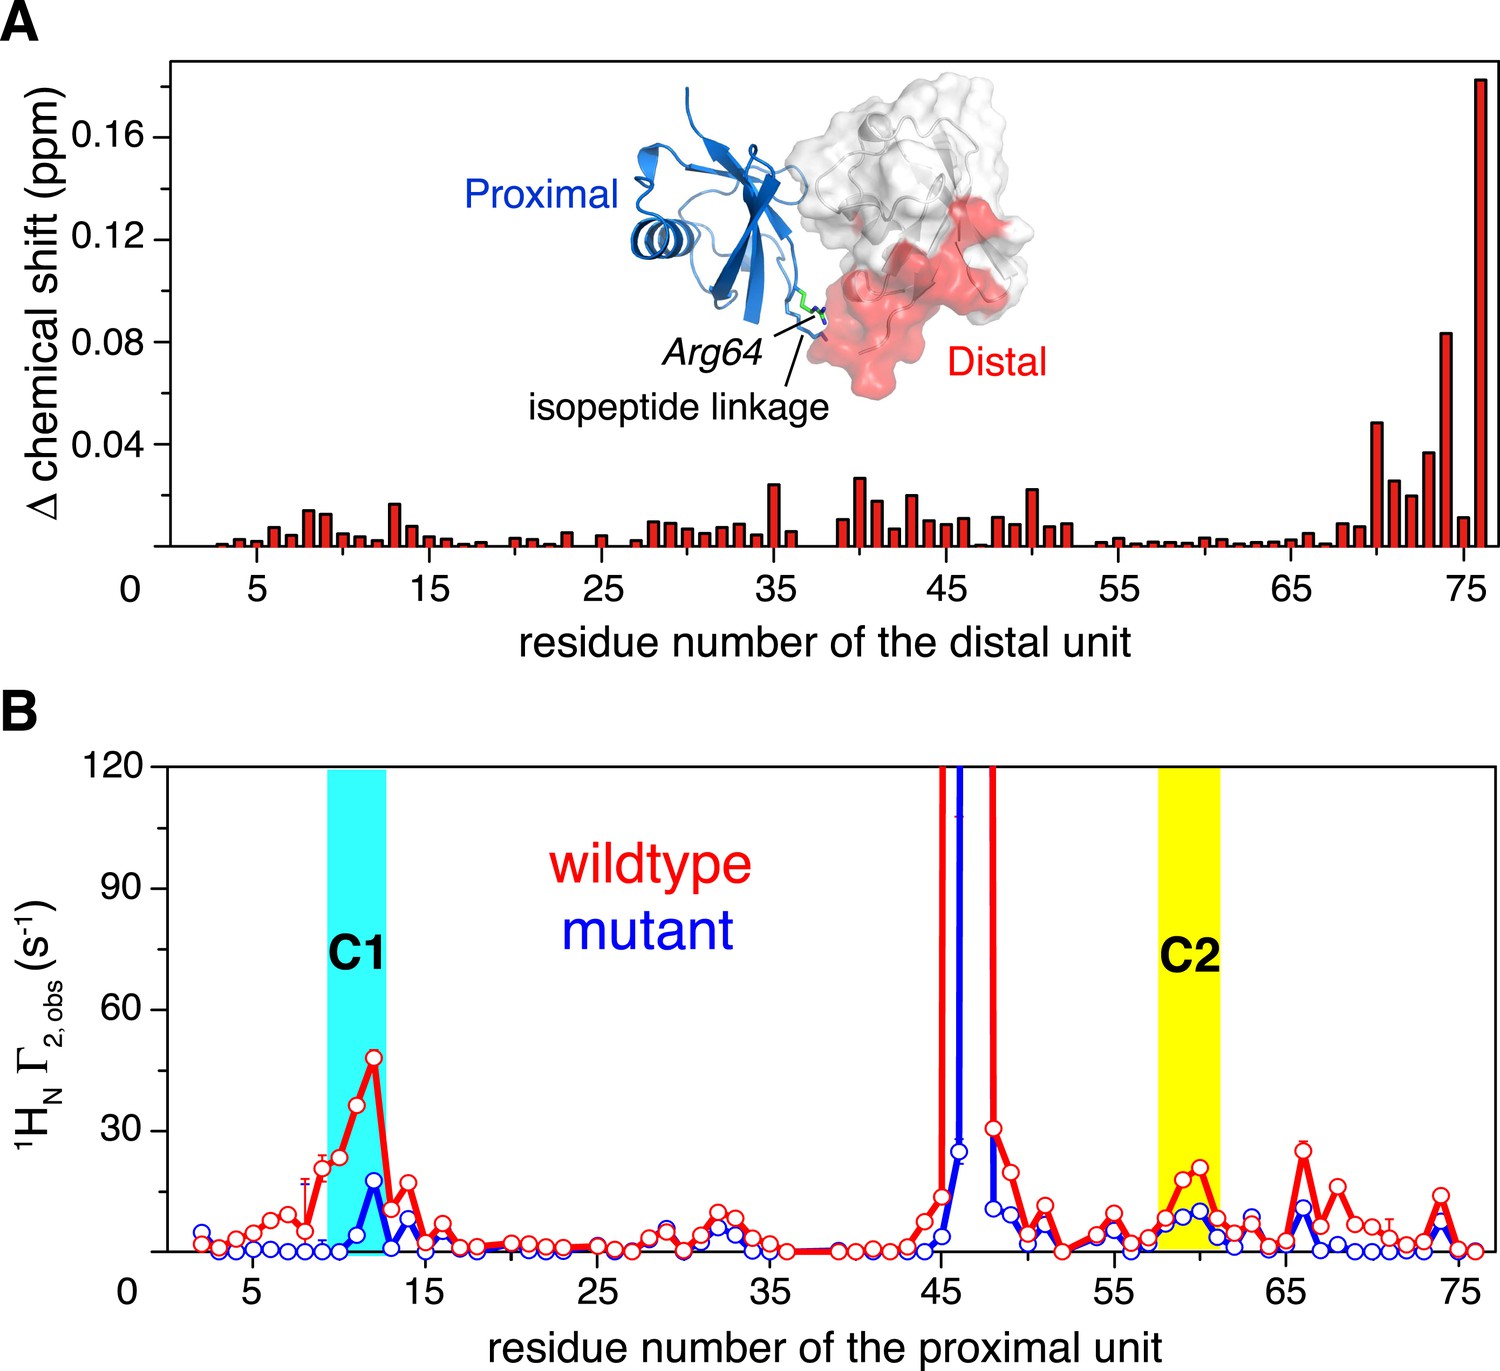
Changes in NMR parameters for K63-Ub2 upon E64RP mutation.
(A) Chemical shift differences of the distal unit upon mutation. Inset, residues with relatively large chemical shift differences (>0.01 ppm) are mapped to the surface of the distal unit (colored red). (B) Decreases in intra-molecular inter-subunit PREs upon mutation with an MTS paramagnetic probe conjugated at K48C site. Lines simply connect the data points. PRE values characteristic of C1 and C2 states are indicated with cyan and yellow strips, respectively. Error bars indicate the SD in PRE measurements.
Figure 5—figure supplement 1
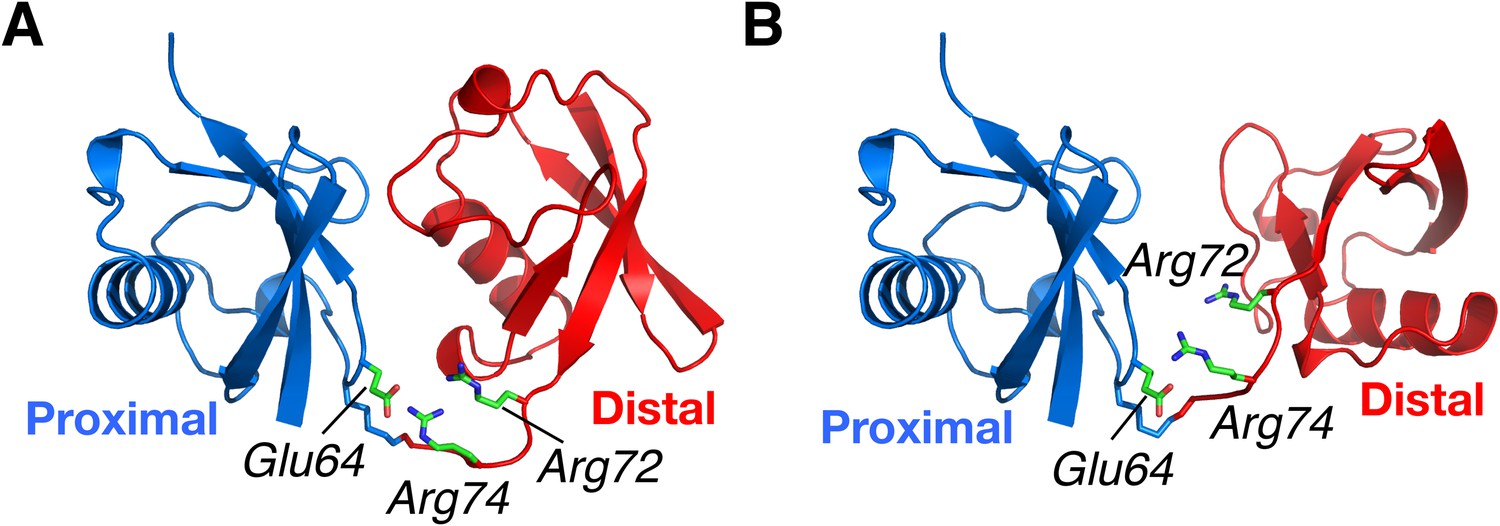
Structural basis for the perturbation of K63-Ub2 conformational space upon E64RP mutation.
Representative (A) C1 and (B) C2 closed-state structures. Glu64 in the proximal unit opposes Arg72 and Arg74 in the distal unit, shown as sticks. Judging from the structures, the charge reversal mutation could have a larger impact on the stability of C1 closed state than on C2 closed state of K63-Ub2.
Figure 5—figure supplement 2

Overlay of 2D NMR spectra for wild type K63-Ub2 and E64RP mutant at 50 µM with distal unit 15N-labeled.
Residues with relatively large chemical shift differences (>0.01 ppm) are labeled.
Figure 6
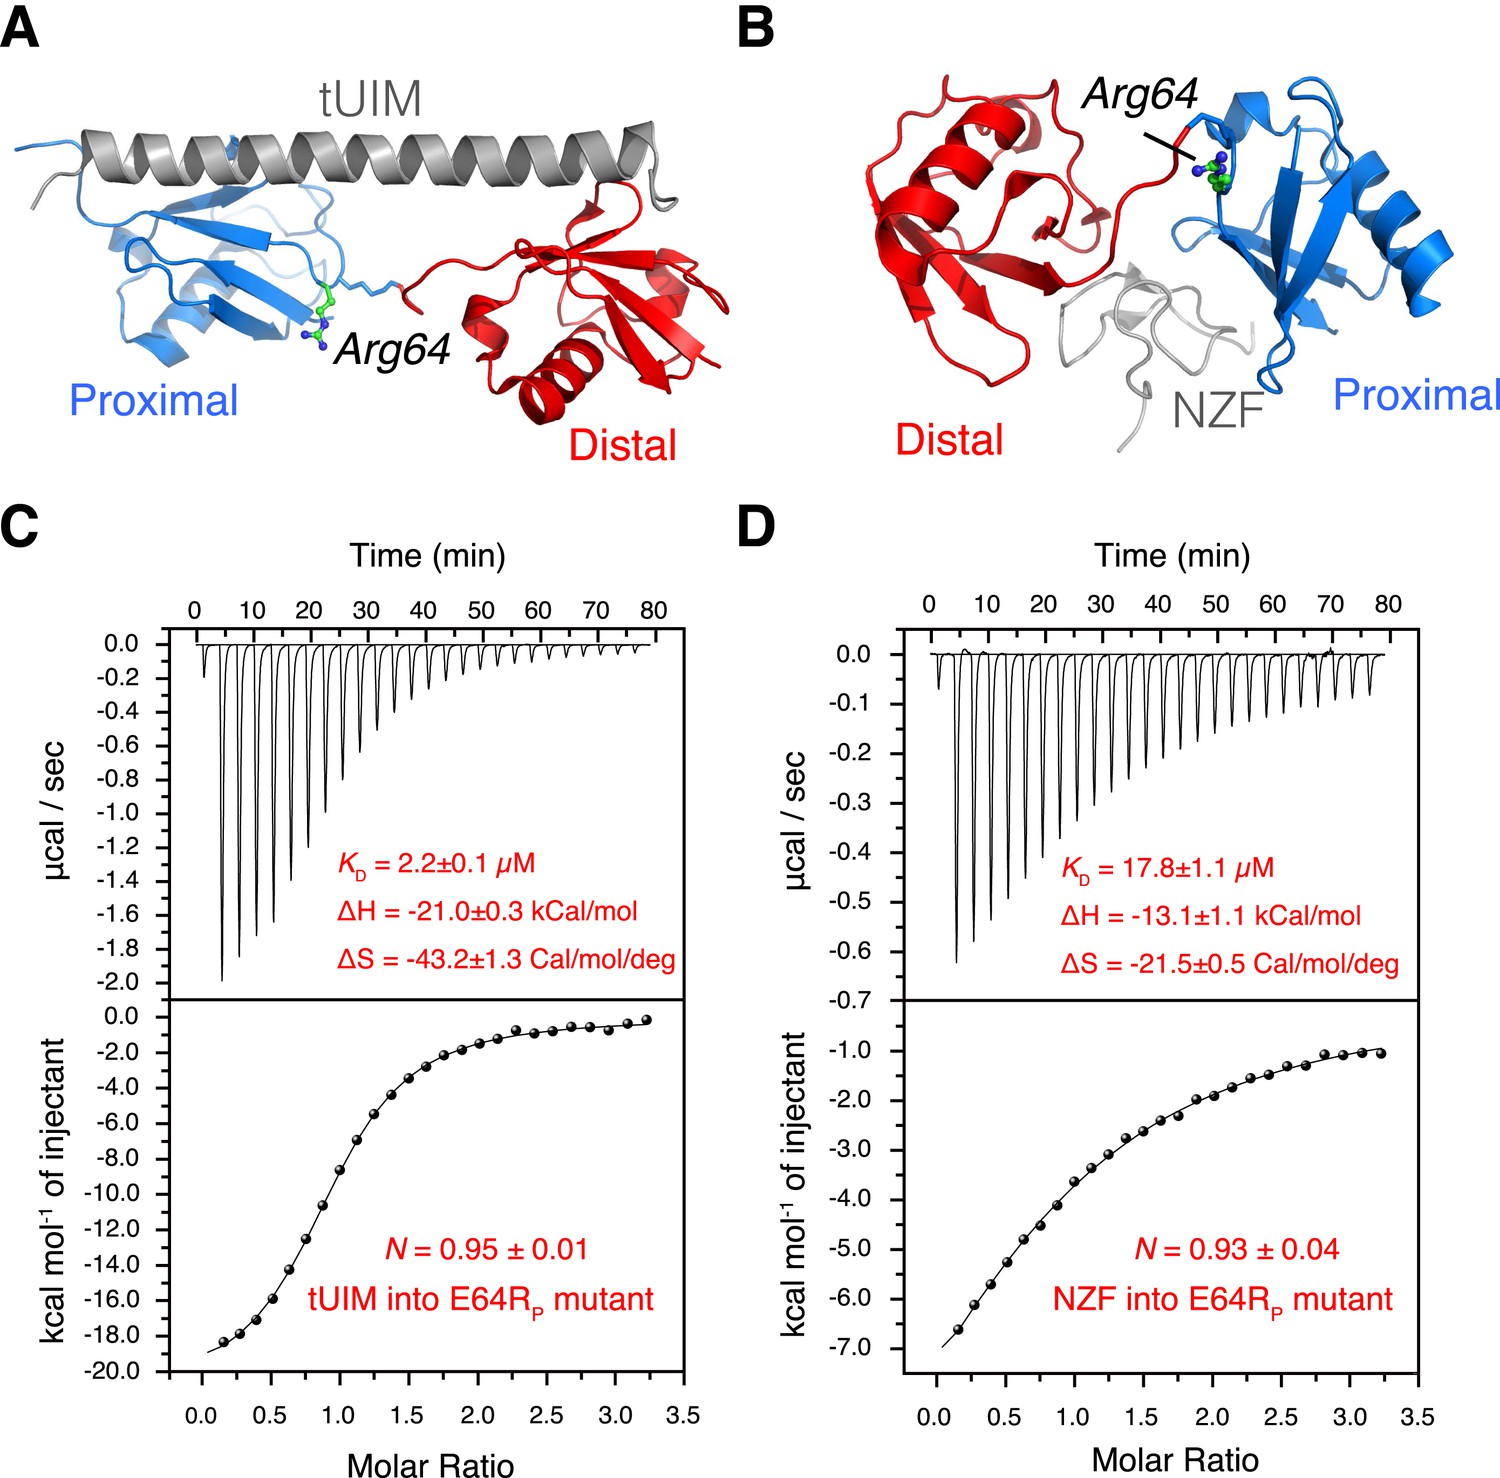
The interactions between K63-Ub2 mutant with tUIM and with NZF.
(A, B) Illustration of the E64RP mutation in the complex structures (Protein Data Bank [PDB] codes 2RR9 and 2WX0). The point mutation is distant from the K63-Ub2 interfaces with tUIM and NZF. (C, D) Isothermal calorimetry (ITC) measurements for the bindings with tUIM and NZF. The raw data (top panels) are converted to heat per injection, and the fitted curves using one-site binding model are shown as solid lines (bottom panels). The binding affinities KD, binding enthalpy changes ΔH, and entropy changes ΔS values are averaged over four independent experiments.
Figure 7 with 2 supplements
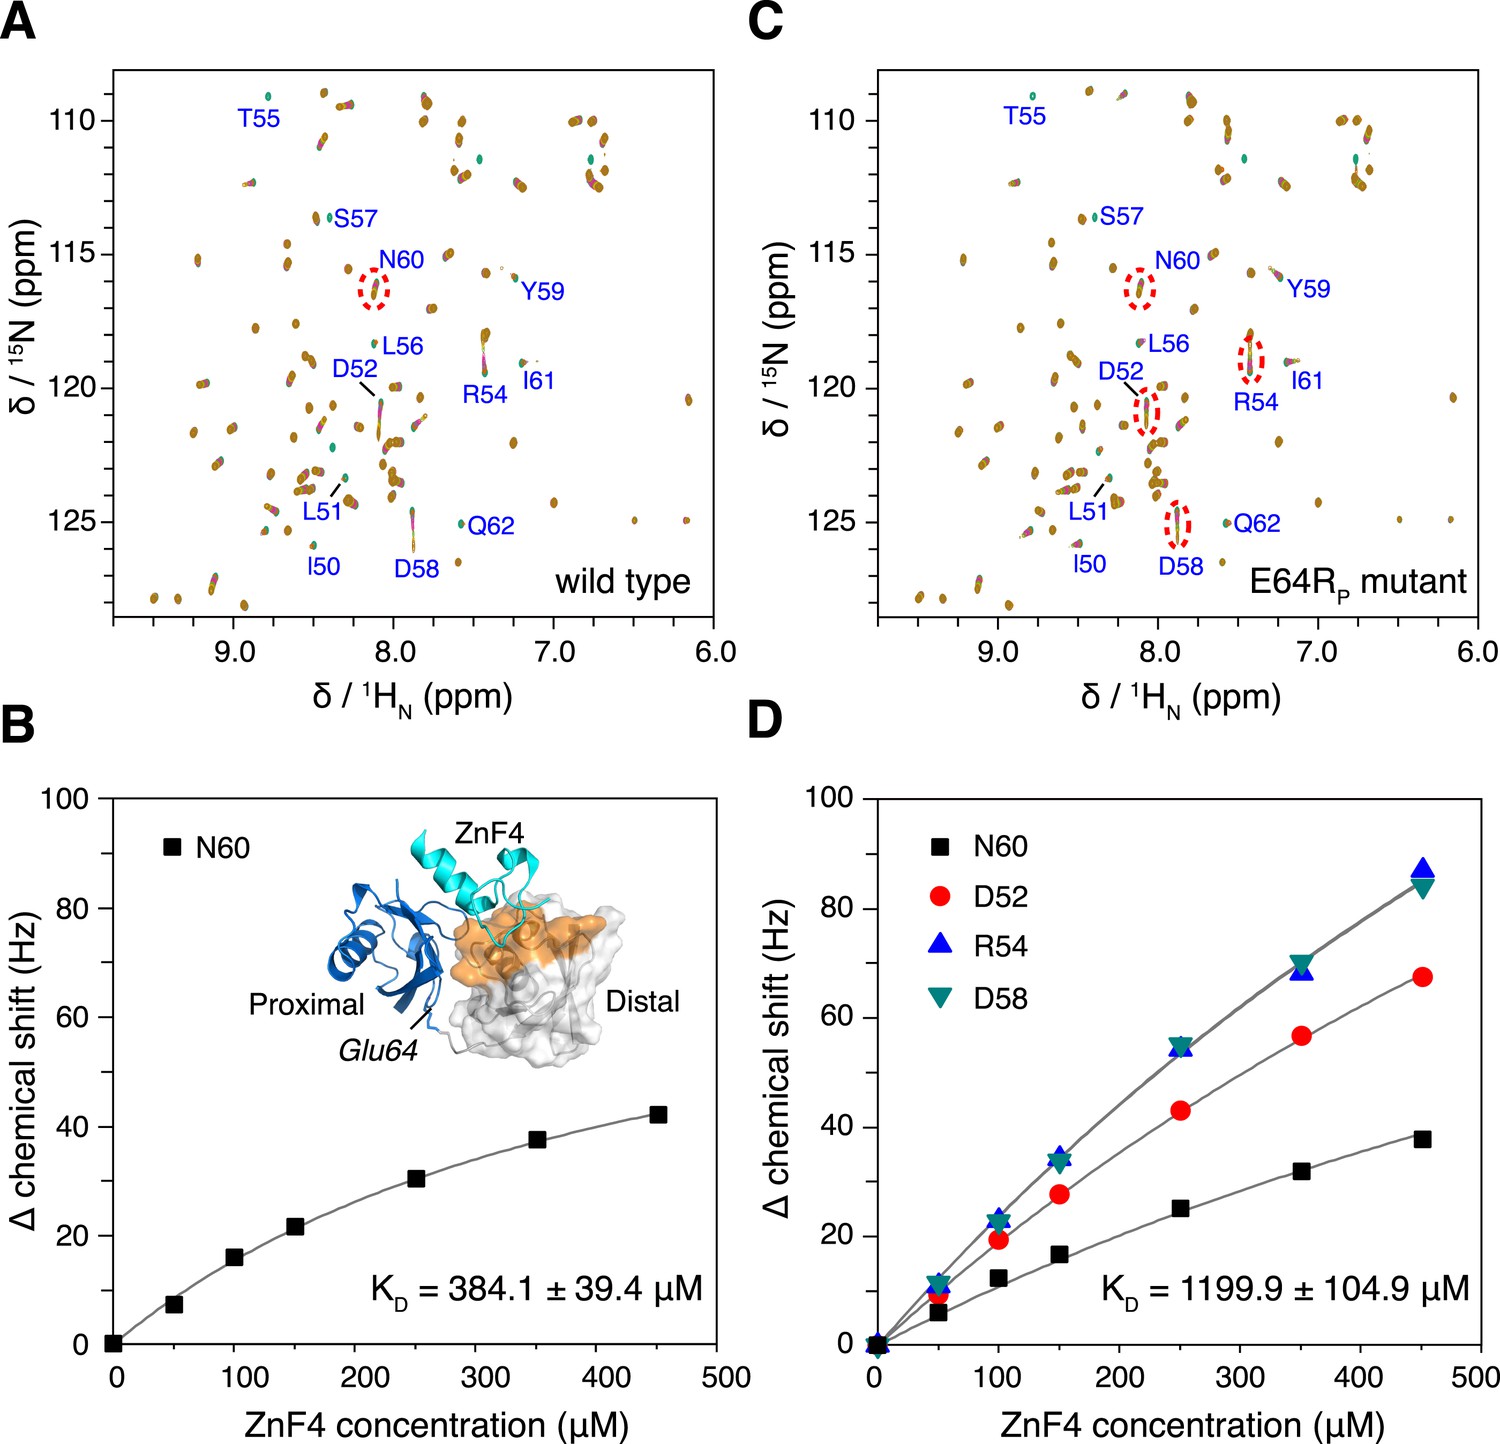
The interaction between K63-Ub2 and A20 ZnF4 at 313 K.
(A, C) NMR titrations of ZnF4 into wild type and mutant K63-Ub2 with 15N-labeling at the distal unit. Residues 50–62 (labeled) experience slow timescale exchange and gradually disappear upon ZnF4 titration. (B, D) Fittings of chemical shift perturbations to binding isotherms. The chemical shift perturbations are calculated as (ΔδH2 + ΔδN2)^0.5 in Hz units. Inset, ZnF4-binding surface on K63-Ub2 distal unit (residues 50–62) is mapped (colored orange).
Figure 7—figure supplement 1
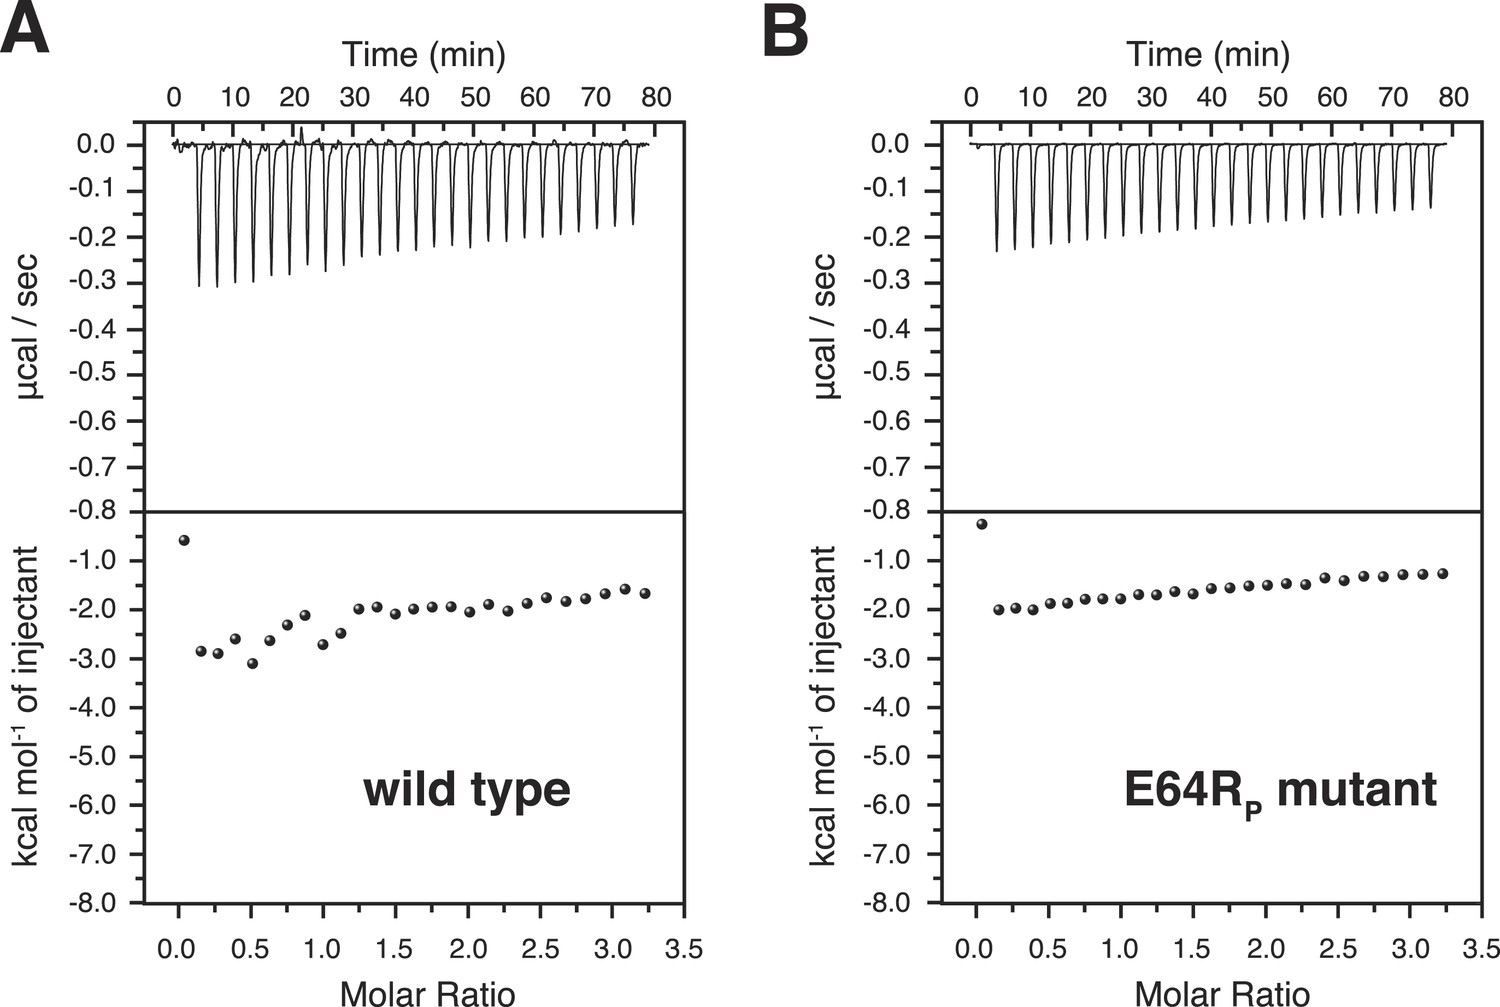
Isothermal calorimetry (ITC) measurements for the bindings between A20 ZnF4 and (A) wild type and (B) E64RP mutant of K63-Ub2 proteins.
The heat exhausted could not be fitted to a binding isotherm.
Figure 7—figure supplement 2
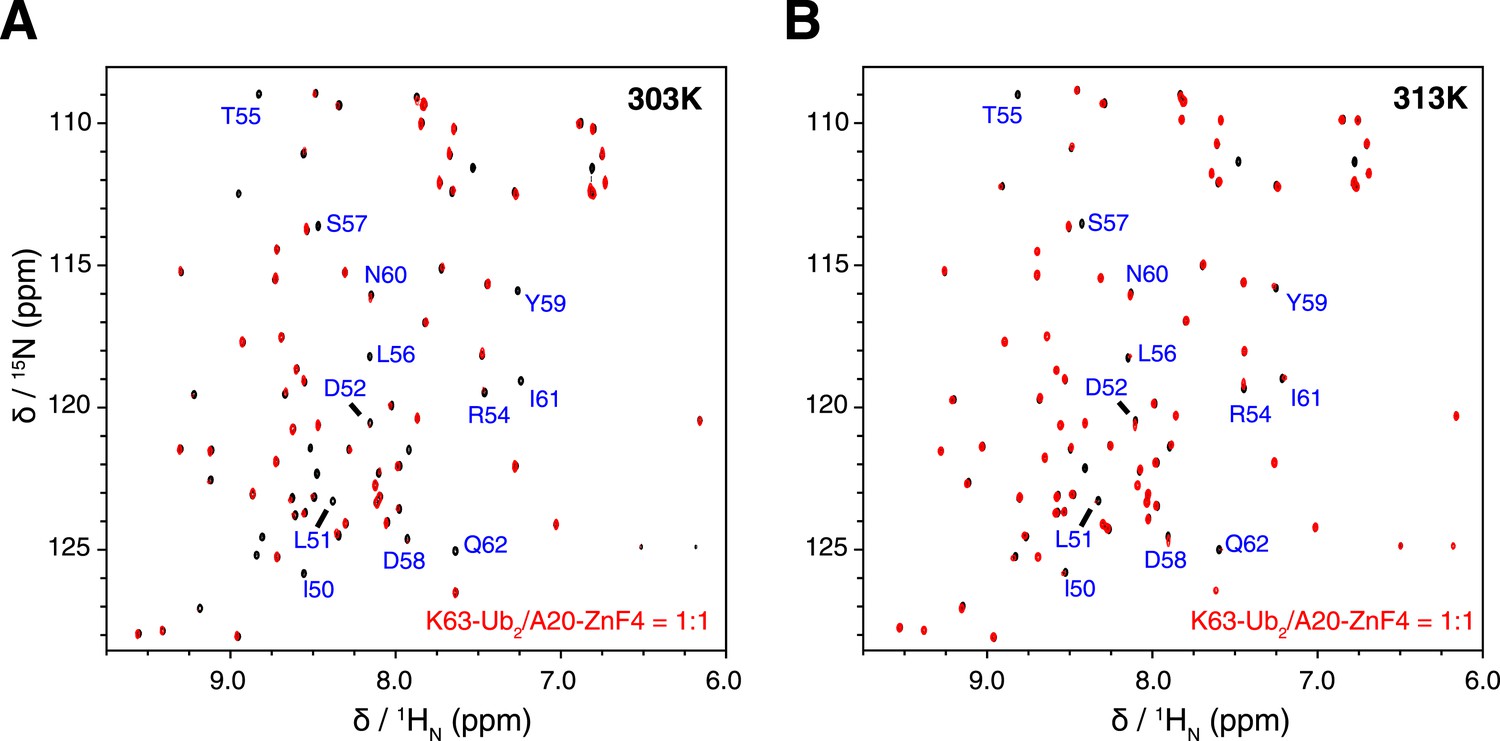
Overlay of NMR spectra for K63-Ub2 and K63-Ub2 mixed with equimolar A20 ZnF4 at (A) 303 K and (B) 313 K.
The protein concentrations are 50 µM. The timescale of the exchange between ZnF4-free and bound species is slow for residues 50–62 of K63-Ub2 distal unit, whose peaks disappear upon ZnF4 titration. At 313 K, the exchange is slightly faster, which allows the fitting of the KD value.
Figure 8

Proposed mechanism for K63-Ub2 signaling.
In the absence of a ligand, K63-Ub2 alternates between an open and two closed states. A specific ligand can be accommodated and bound to one of the three preexisting conformations, eliciting the downstream signal.
Download links
A two-part list of links to download the article, or parts of the article, in various formats.
Downloads (link to download the article as PDF)
Open citations (links to open the citations from this article in various online reference manager services)
Cite this article (links to download the citations from this article in formats compatible with various reference manager tools)
Lys63-linked ubiquitin chain adopts multiple conformational states for specific target recognition
eLife 4:e05767.
https://doi.org/10.7554/eLife.05767


