The rosetteless gene controls development in the choanoflagellate S. rosetta
- Howard Hughes Medical Institute, University of California, Berkeley, United States
Figures
Figure 1
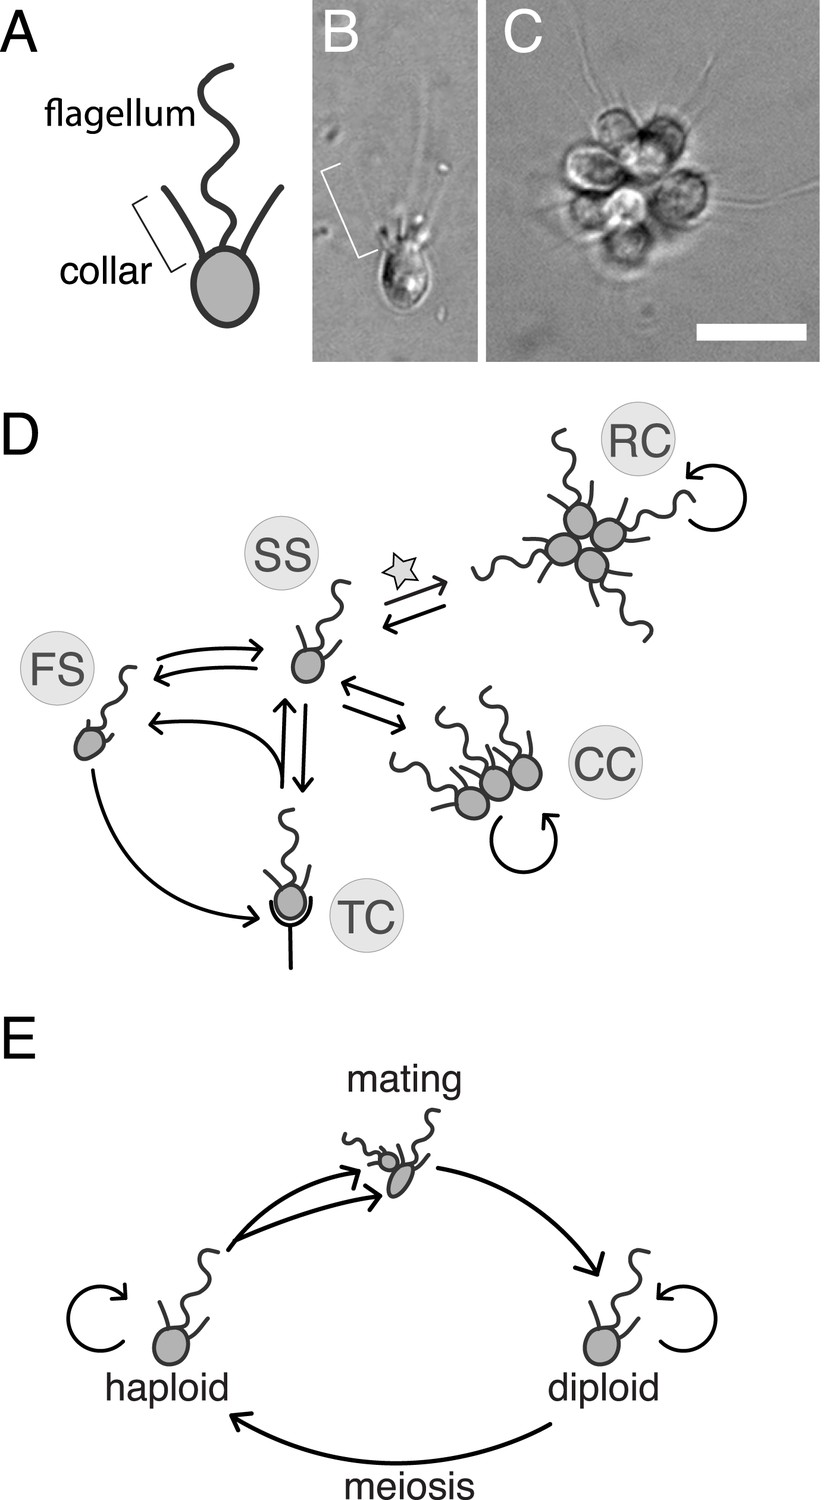
S. rosetta: an emerging model for studying animal origins and multicellularity.
S. rosetta cells are polarized, each having a single apical flagellum encircled by a collar of microvilli (bracket), shown in cross-sectional diagram (A) and through DIC imaging of a live cell (B). In rosette colonies (C), each cell is oriented around a central point, with the flagella facing outward. Bacterial prey (∼1 µm rods) attach transiently to the collars of some cells prior to ingestion by phagocytosis. Scale bar = 10 µm. (D) S. rosetta transitions between several morphologically differentiated cell types during its life history: rosette colonies (RC), chain colonies (CC), slow swimmers (SS), fast swimmers (FS), and thecate cells (TC). The transition from slow swimmers to rosette colonies (star) is induced by lipids from the bacterium Algoriphagus machipongonensis and can be regulated in the laboratory. (E) S. rosetta undergoes a sexual cycle in the laboratory. When starved, haploid cultures produce anisogamous gametes that are capable of mating to produce diploids. Diploids undergo meiosis and thereby produce haploids when grown in nutrient-rich media. Haploids and diploids can also reproduce asexually through mitosis.
Figure 2
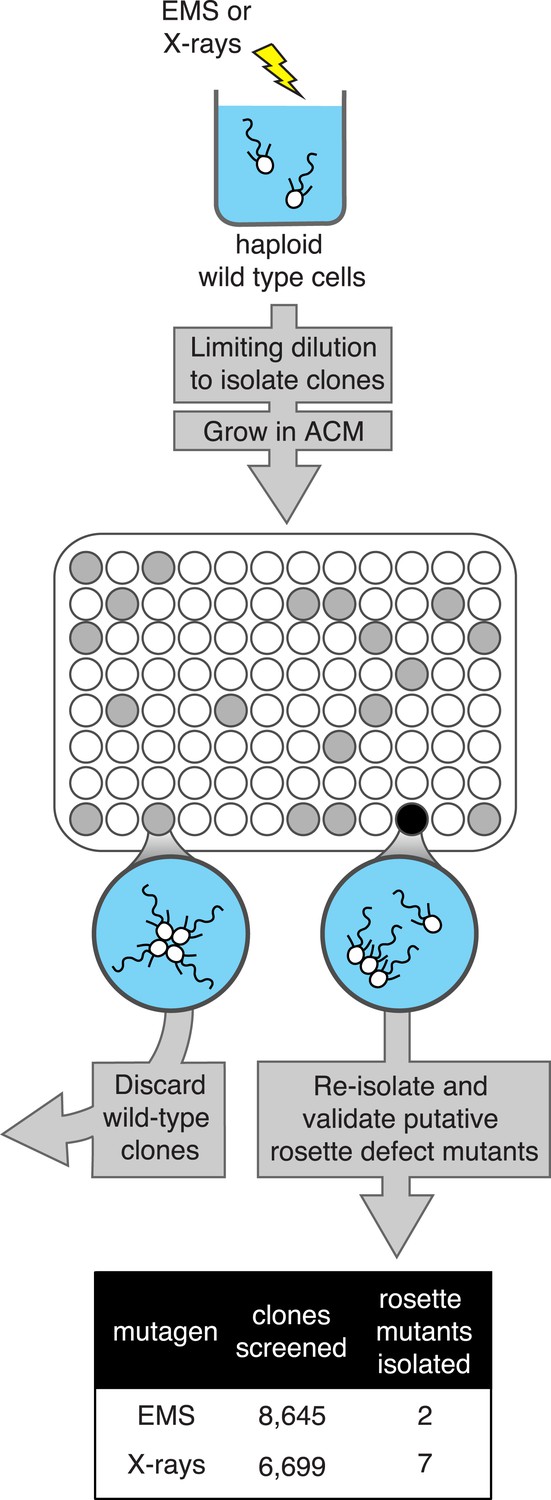
A screen for rosette defect mutants in S. rosetta.
Rosette defect mutants were isolated by exposing S. rosetta haploid cells to either EMS or X-rays and then isolating clones in rosette-inducing Algoriphagus conditioned media (ACM) prior to visual screening. The use of limiting dilution to isolate clones resulted in many wells with no cells (indicated as white circles). Wells seeded with a wild-type cell (gray circles) produced a culture with abundant rosette colonies, while wells seeded with a rosette defect mutant (black circle) produced a culture with chains or single cells, but few to no chain colonies. Candidate rosette defect mutants were validated through repeated rounds of limiting dilution prior to re-screening in ACM.
Figure 3 with 2 supplements
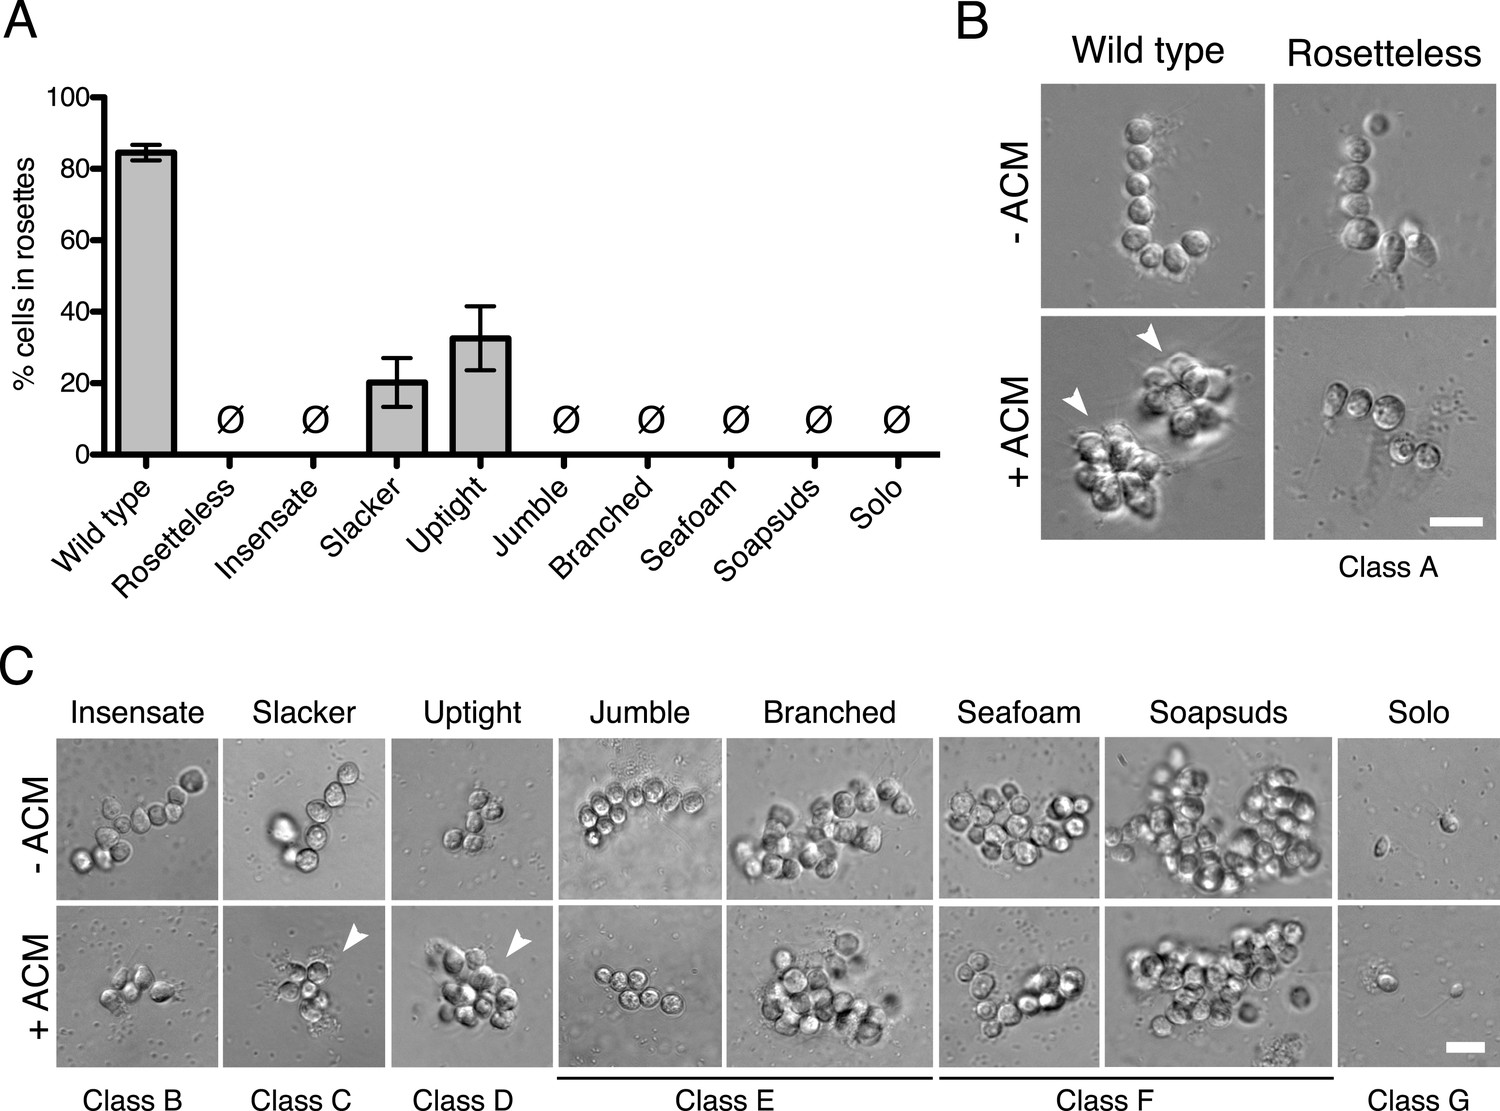
Phenotypes of diverse rosette defect mutants.
(A) Cultures of all nine mutants isolated in this study showed a significantly reduced number of cells in rosettes relative to wild type (one-tailed Mann–Whitney test, p < 0.01). Rosette development was measured as the % of cells in rosettes after 48 hr in 20% ACM, shown as mean ± SEM. Ø indicates mutants in which no rosettes were observed (limit of detection = 0.03%). (B) Wild-type S. rosetta grown without ACM formed flexible, linear chains or single cells (Figure 3—figure supplement 2). When exposed to ACM, wild-type S. rosetta cultures produced spherical rosettes (arrowheads). Rosetteless cultures did not form rosettes in ACM, but otherwise appeared in wild type, forming normal chain colonies and proliferating at rates indistinguishable from wild-type S. rosetta (Figures 3—figure supplement 1B,E and 2). (C) Unlike Rosetteless, the remaining eight rosette defect mutants showed additional phenotypic aberrations. Although a small percentage of Slacker and Uptight cells were found in bona fide rosettes (arrowheads), most remained as single cells or chain colonies that were easily disrupted when exposed to shear (Figure 3—figure supplement 1E). Seafoam and Soapsuds formed large, disorganized clusters of cells that were easily disrupted when exposed to shear (Figure 3—figure supplement 1E and 2) and were thus not rosettes. Scale bars = 10 µm.
Figure 3—figure supplement 1
Mutagenesis and mutant phenotypes.
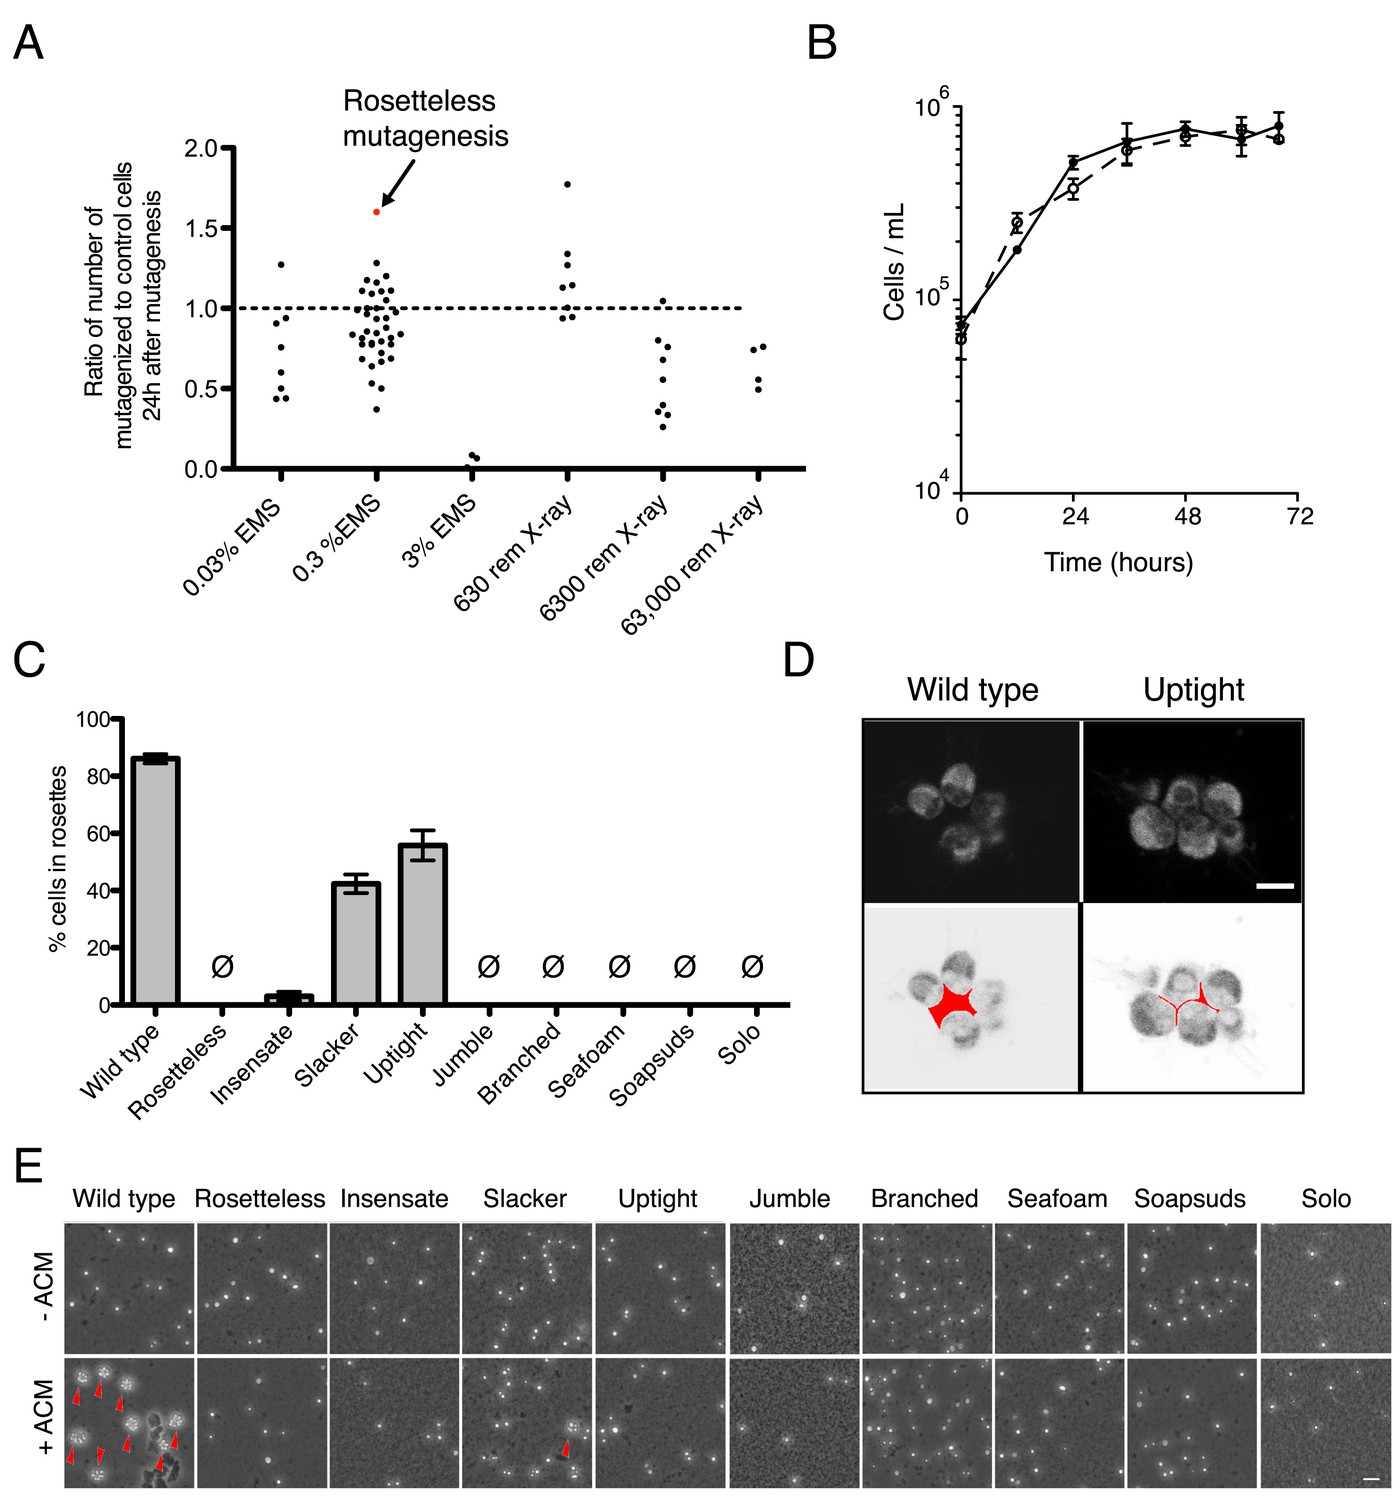
(A) Vertical scatter plot showing the effect of mutagenesis on cell number, shown as the number of mutagenized cells divided by the number of cells in a paired, unmutagenized culture at 24 hr post-mutagenesis. Each dot represents one mutagenesis experiment and the mutagenesis from which the Rosetteless mutant was isolated is highlighted (red). The dotted line at 1.0 represents no effect. The mutagen doses used in the screen were 0.3% EMS (vol/vol) and 6300 rem X-rays, which each resulted, on an average, in a decrease in cell number (p < 0.05, Wilcoxon signed rank test). (B) Growth curve of wild-type (open circles, dotted line) and Rosetteless mutant (filled circles, solid line) cells shows that the Rosetteless phenotype is not due to a growth defect. Error bars show standard deviation. (C) Quantification of rosette induction in the presence of live A. machipongonensis, shown as mean ± SEM. Ø represents cultures in which no rosettes were observed (limit of detection = 0.03%). Compare to Figure 3B to see rosette induction from A. machipongonensis conditioned media (ACM) rather than live bacteria. Notably, the insensate mutant shows a low level of rosette induction when exposed to live bacteria but not when exposed to ACM. (D) Single confocal slices through rosettes stained with FM 1–43X dye showed differences in cell packing within wild-type and uptight mutant rosettes. Bottom: inverted images were false colored to mark the space between cells in the center of the rosette. Scale bar = 5 µm. (E) Phenotypes of rosette defect mutants after vigorous pipetting. Rosettes (red arrowheads) form in the presence of ACM and are robust to pipetting, whereas chain colonies break up into single cells. The uptight mutant occasionally formed rosettes, but none were visible in this field of view. Scale bar = 20 µm.
Figure 3—figure supplement 2
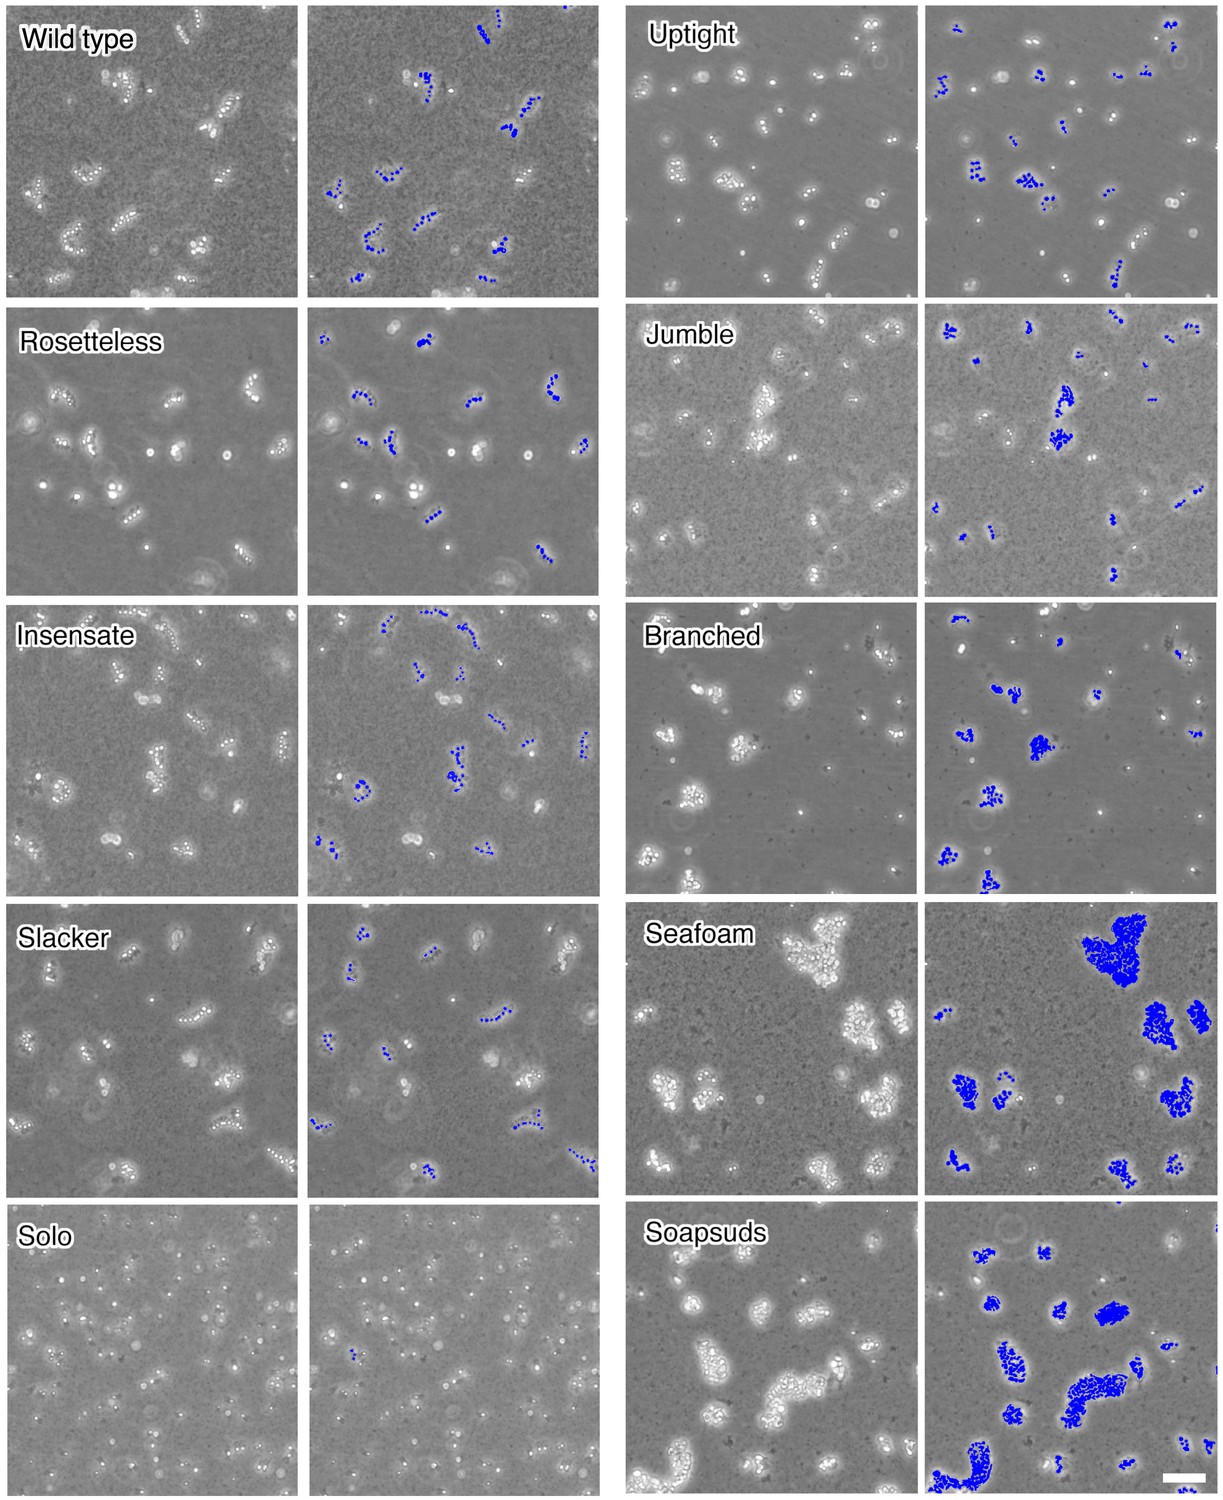
Chain colony morphologies of diverse mutants.
S. rosetta chain colonies from wild-type and mutant cultures grown without exposure to A. machipongonensis signals are shown at low magnification to document the morphologies of numerous chain colonies. Each phase-bright circle is a choanoflagellate cell, while the dark specks are bacteria. To the right of each image, the cells of each in focus chain colony have been false colored blue to identify chains and emphasize chain morphology. Three mutants (Rosetteless, Insensate, and Slacker) exhibit essentially wild-type chains. Solo is largely single-celled and rarely forms chains. The five remaining mutants all form chains that are more branched or highly clustered than wild-type chains. Scale bar = 50 µm.
Figure 4 with 3 supplements
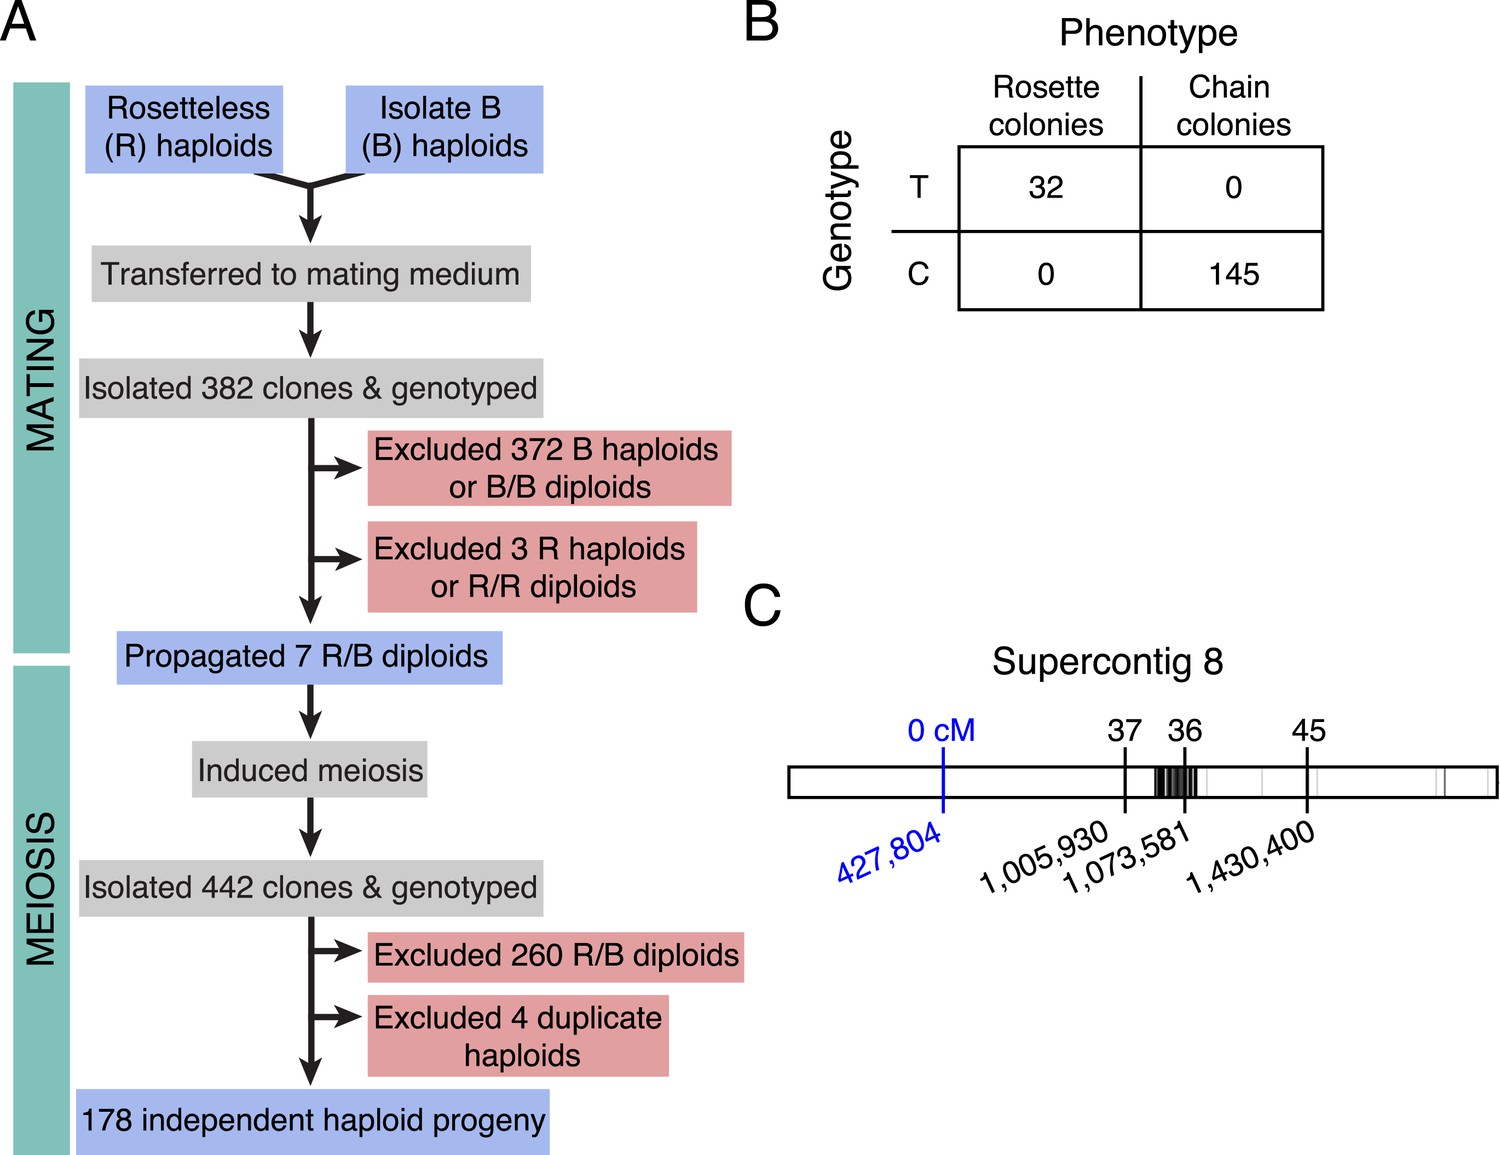
Rosetteless maps to EGD82922.
(A) Design of the mapping cross. Rosetteless cells were mixed with Isolate B, an S. rosetta culture capable of forming rosettes. Mating was induced by starvation. To isolate the products of outcrossed mating, cells then underwent clonal isolation, and clonal populations were genotyped to identify outcrossed, diploid heterozygotes. These heterozygotes were expanded and induced to undergo meiosis, after which clonal isolation and genotyping were repeated. Haploid progeny of the cross were homozygous at all three markers. (B) 2 × 2 contingency table shows that the Rosetteless phenotype was tightly linked to the genotype of the supercontig 8: 427,804 candidate splice donor mutation. (C) Map of the supercontig 8 markers. Top numbers show the genetic distance between the markers and the Rosetteless phenotype in centimorgans (cM). Bottom numbers show marker genomic positions on supercontig 8. Black lines within the central bar show all sites of predicted polymorphism (i.e., possible marker positions) between Rosetteless and Isolate B. The blue marker is the EGD82922 splice donor mutation.
-
Figure 4—source data 1
Full genotyping data for all progeny of the Rosetteless x Isolate B cross.
For each isolated progeny of the cross, we provide the phenotype when grown in HN media (chains or rosettes), the identity of the heterozygous flask from which the haploid isolate was derived (‘Flask isolated from’), and the genotypes at 60 SNV and microsatellite loci. For the microsatellite loci, numbers indicate the approximate size of the amplicon. Missing genotype data is indicated by ‘NA’. Color-coding shows genotypes and phenotypes that match Isolate B (white) or Rosetteless (yellow). Genotyping data was used to construct a linkage map for S. rosetta (Figure 4—figure supplement 3). For each marker, we list its linkage group and its inferred position within the linkage group. Four of the cross isolates were excluded from further analyses because their genotypes were identical to other cross isolates.
- https://doi.org/10.7554/eLife.04070.010
Figure 4—figure supplement 1
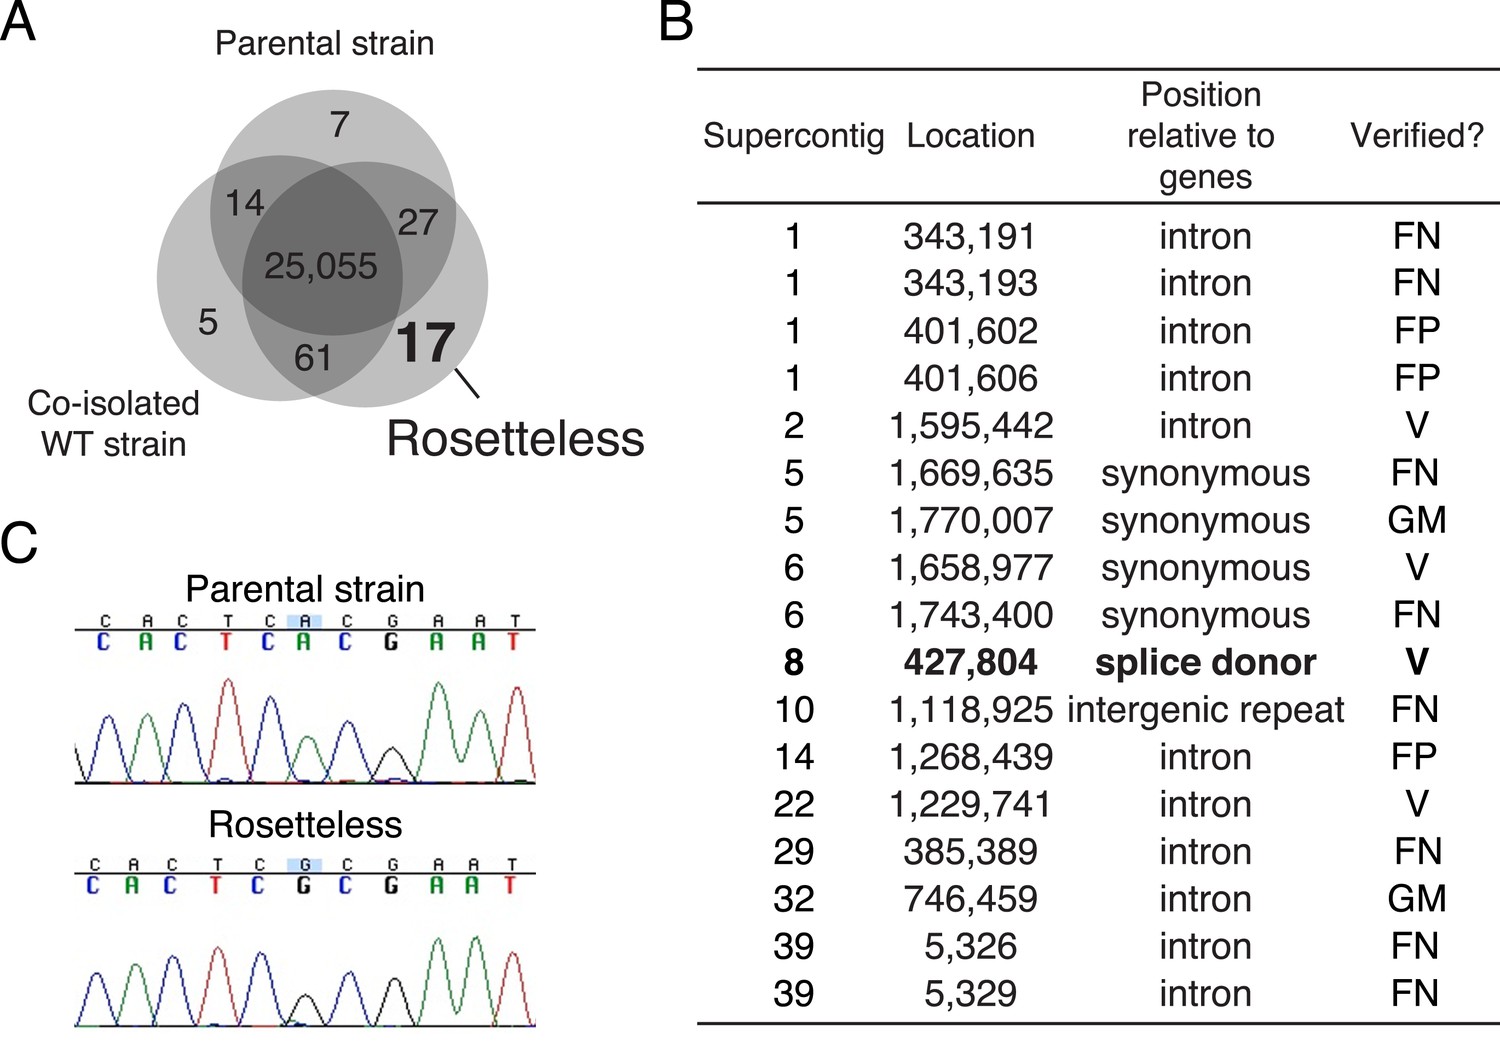
Identification of Rosetteless-specific mutations.
(A) Venn diagram of the high-quality single nucleotide variants (SNVs) detected in the genome sequences of Rosetteless, the parental strain, and a co-isolated wild-type strain as compared to the S. rosetta reference genome. The vast majority of detected SNVs (25,055) were shared among all three isolates. Only 17 unique, high-quality SNVs were predicted in Rosetteless. (B) The seventeen predicted, Rosetteless-specific SNV calls. Genotyping of Rosetteless and wild-type S. rosetta was used to determine whether the putative unique SNV was verified (V, present in Rosetteless but absent in wild type), a false positive (FP, absent from both Rosetteless and wild type), a false negative (FN, present in both Rosetteless and wild type), or a mistakenly called SNV in a region where the S. rosetta reference genome was misassembled (GM). The SNV on supercontig 8 (bold) was the only one predicted to alter a coding region. (C) Cloning and Sanger sequencing confirmed that the supercontig 8: 427,804 SNV was polymorphic between Rosetteless and the parental strain. Note that the Sanger sequencing shown here was from the + strand, while the gene is encoded on the—strand.
Figure 4—figure supplement 2
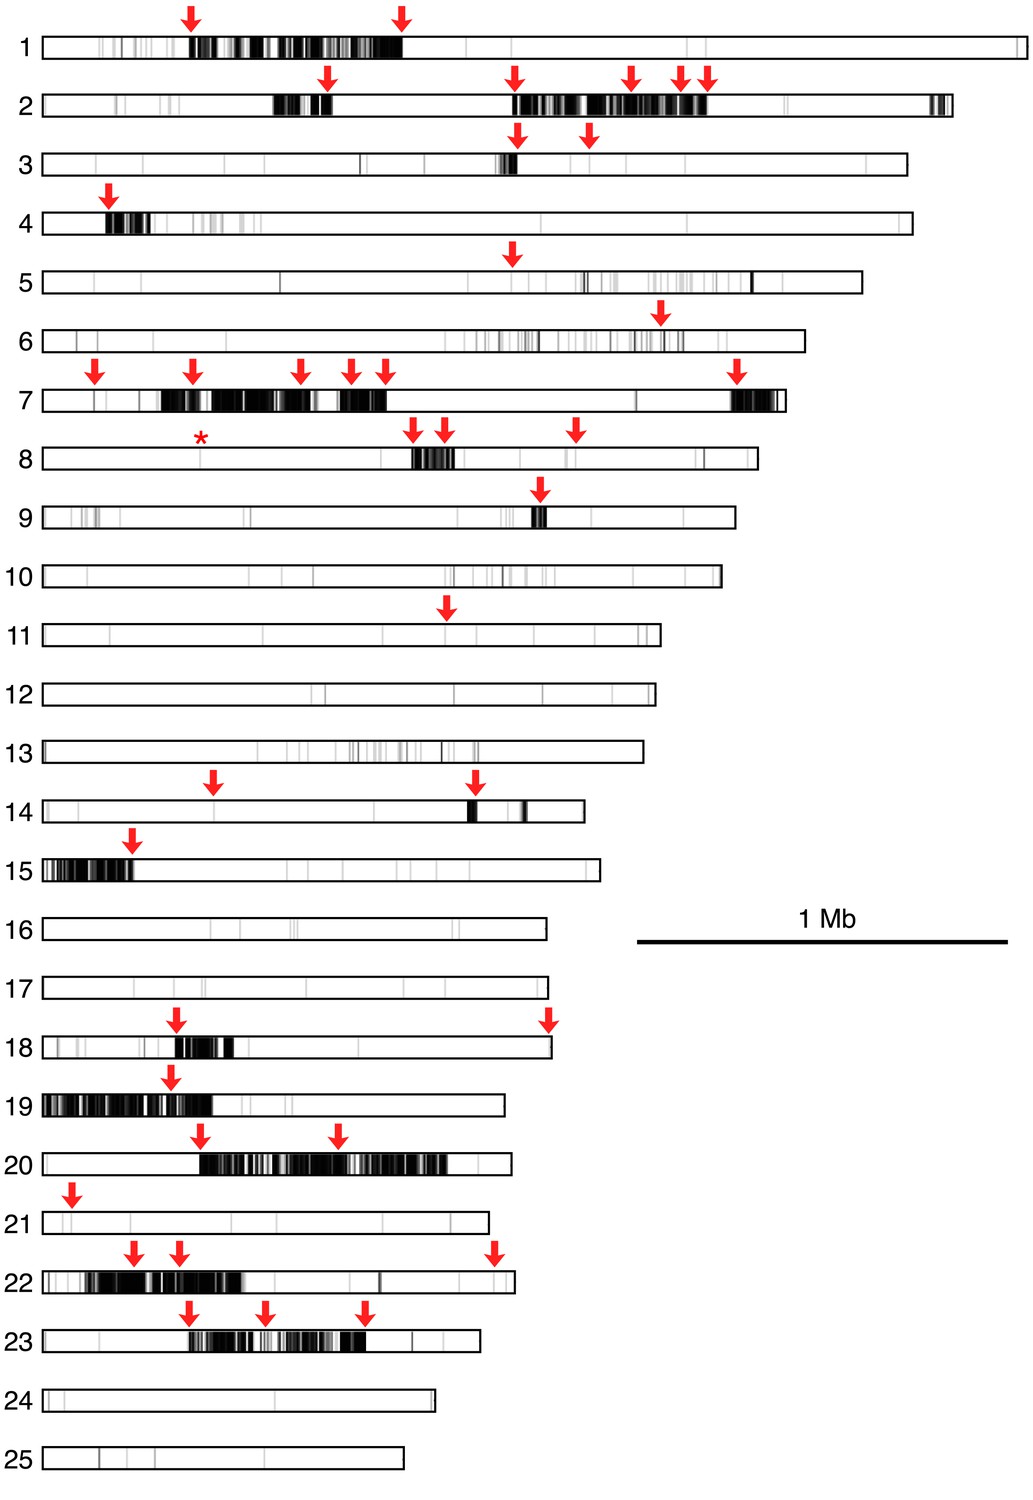
Map of polymorphisms and markers used in the cross.
Horizontal bars represent the 25 largest supercontigs in the S. rosetta genome. The positions of each predicted polymorphism, based on comparisons of the genome sequences of Rosetteless and Isolate B, are vertical lines mapped semi-transparently in black, such that regions with high variant density are darker than those with lower variant density. Red arrows show positions genotyped in all cross isolates, including the perfectly linked supercontig 8: 427,804 mutation (*, Figure 4—source data 1). Note that the supercontig 8: 427,804 mutation lies within a haplotype block with little to no polymorphism between Rosetteless and Isolate B.
Figure 4—figure supplement 3
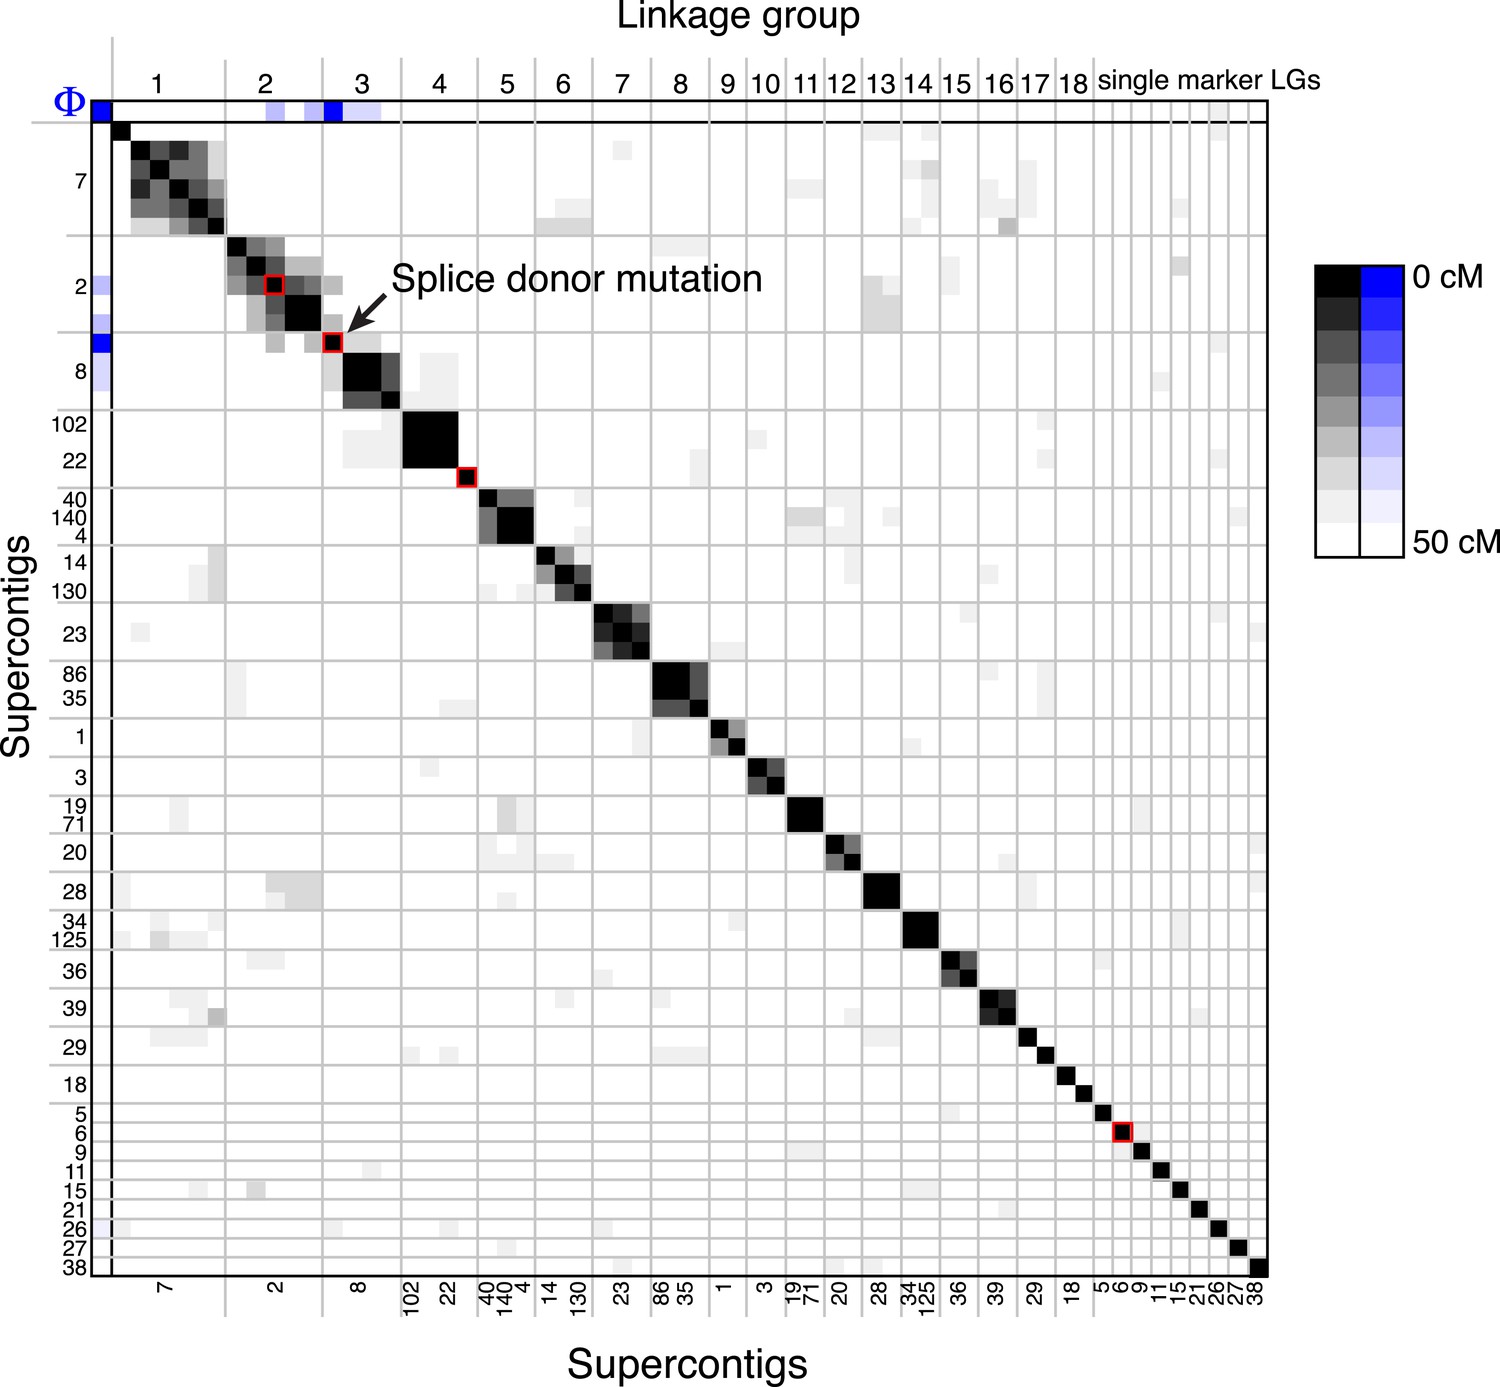
A linkage map for S. rosetta.
Linkage map of S. rosetta, based on the genotypes of the 178 independent Rosetteless–Isolate B cross progeny (LOD cutoff = 5). The color of each box represents the genetic distance between two markers (shades of gray; see key) or the genetic distance between a marker and the Rosetteless phenotype (shades of blue; see key), thresholded such that non-significant distances are white (one-tailed Fisher's exact test, p > 0.05). The boxes representing the four SNVs that were unique to Rosetteless are outlined in red. Gray lines show the boundaries between assembled linkage groups, labeled at the top of the figure. The supercontig locations of each marker are listed, in order, on the left and bottom sides of the figure. Note that the Rosetteless phenotype (blue) is tightly linked only to the splice donor mutation and not to any of the other genomic positions or Rosetteless-specific SNVs. Although there was some observed linkage between linkage groups 2 and 3, this may be an artifact of the segregation distortion and so we conservatively assigned these to separate linkage groups. Figure 4—source data 1 lists the exact genomic and linkage group positions for each marker.
Figure 5 with 2 supplements
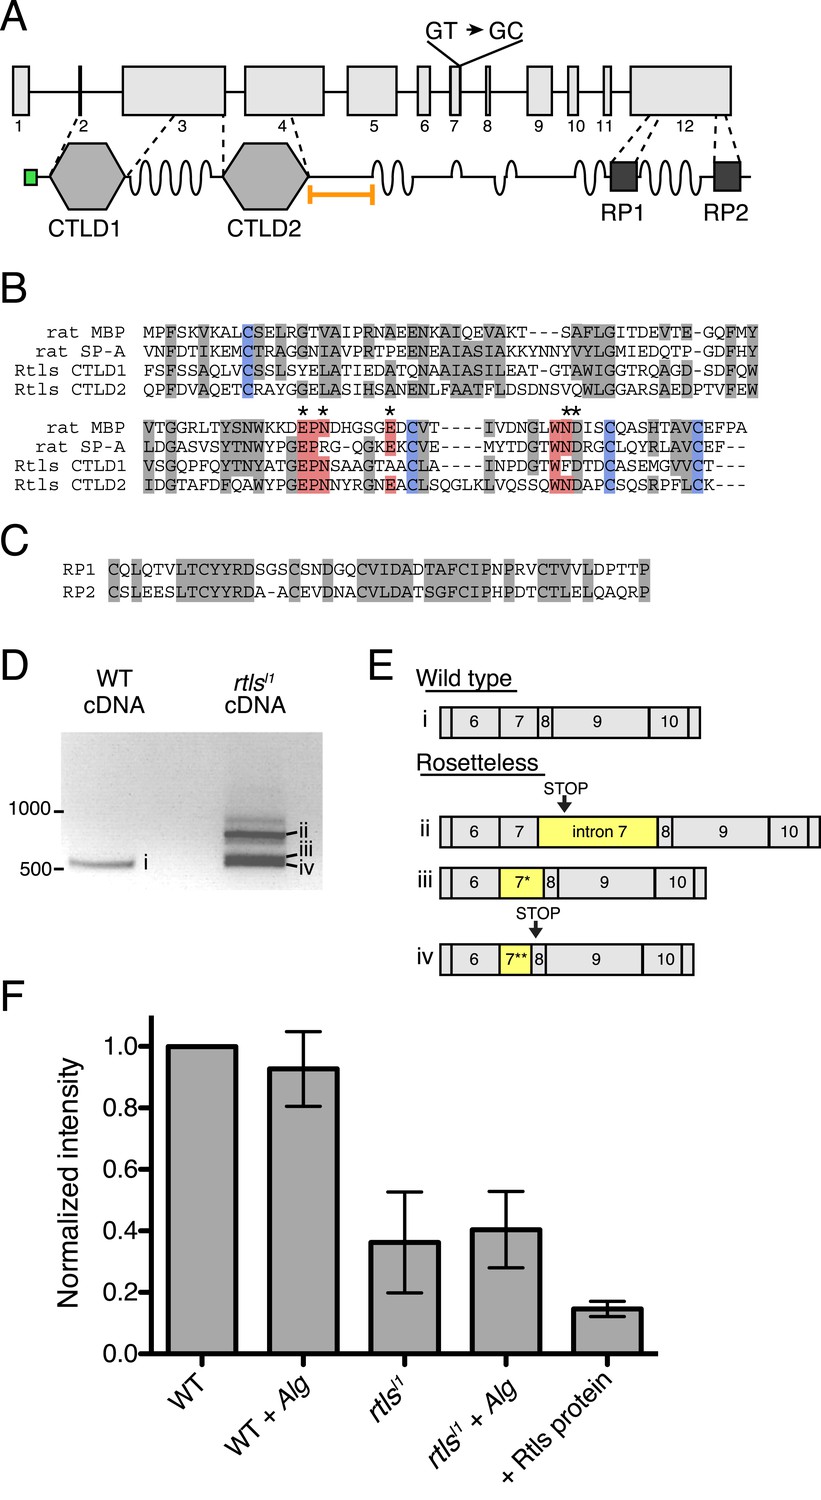
Gene structure, domain organization, and expression of rtls.
(A) The rtls gene (top) contains 12 exons (numbered) and encodes a protein (bottom) with an amino-terminal signal peptide (green), two C-type lectin-like domains (CTLDs), extended stretches of serines and threonines (wavy lines), and two internal repeats of unknown function (RP1 and RP2). The rtlsl1 SNV interrupts a splice donor in intron 7 (GT → GC). The epitope used to generate the anti-Rtls antibody is shown (orange bracket). (B) An alignment of Rtls CTLDs with CTLDs from rat surfactant protein A (rat SP-A, 1R13_A) and rat mannose-binding protein (rat MBP, 2MSB_A) revealed that residues used in disulfide bonds (blue), mannose-type sugar binding (red), and calcium ion binding (*) are conserved. Other conserved or similar residues are highlighted in gray. (C) Alignment of the RP1 and RP2 regions. (D) RT-PCR of rtls with primers to the exon 5/6 junction and exon 12 showed that wild-type cells produce a single isoform while Rosetteless cells produce diverse splice isoforms. (E) Wild-type cDNA yielded the expected splice isoform (i) while Rosetteless mutant cDNA yielded isoforms with: (ii) intron 7 retention or (iii–iv) variants of exon 7 that were longer (*) or shorter (**) than wild type. Isoforms ii and iv contained early stop codons (arrows). (F) Semi-quantitative analysis of the fluorescent signal observed in Rtls dot blots, normalized to the intensity of the wild-type culture (WT). Rosetteless mutant cells (rtlsl1) showed reduced Rtls signal both with and without A. machipongonensis (Alg) relative to WT (Figure 5—figure supplement 1C). Error bars show standard deviation.
Figure 5—figure supplement 1
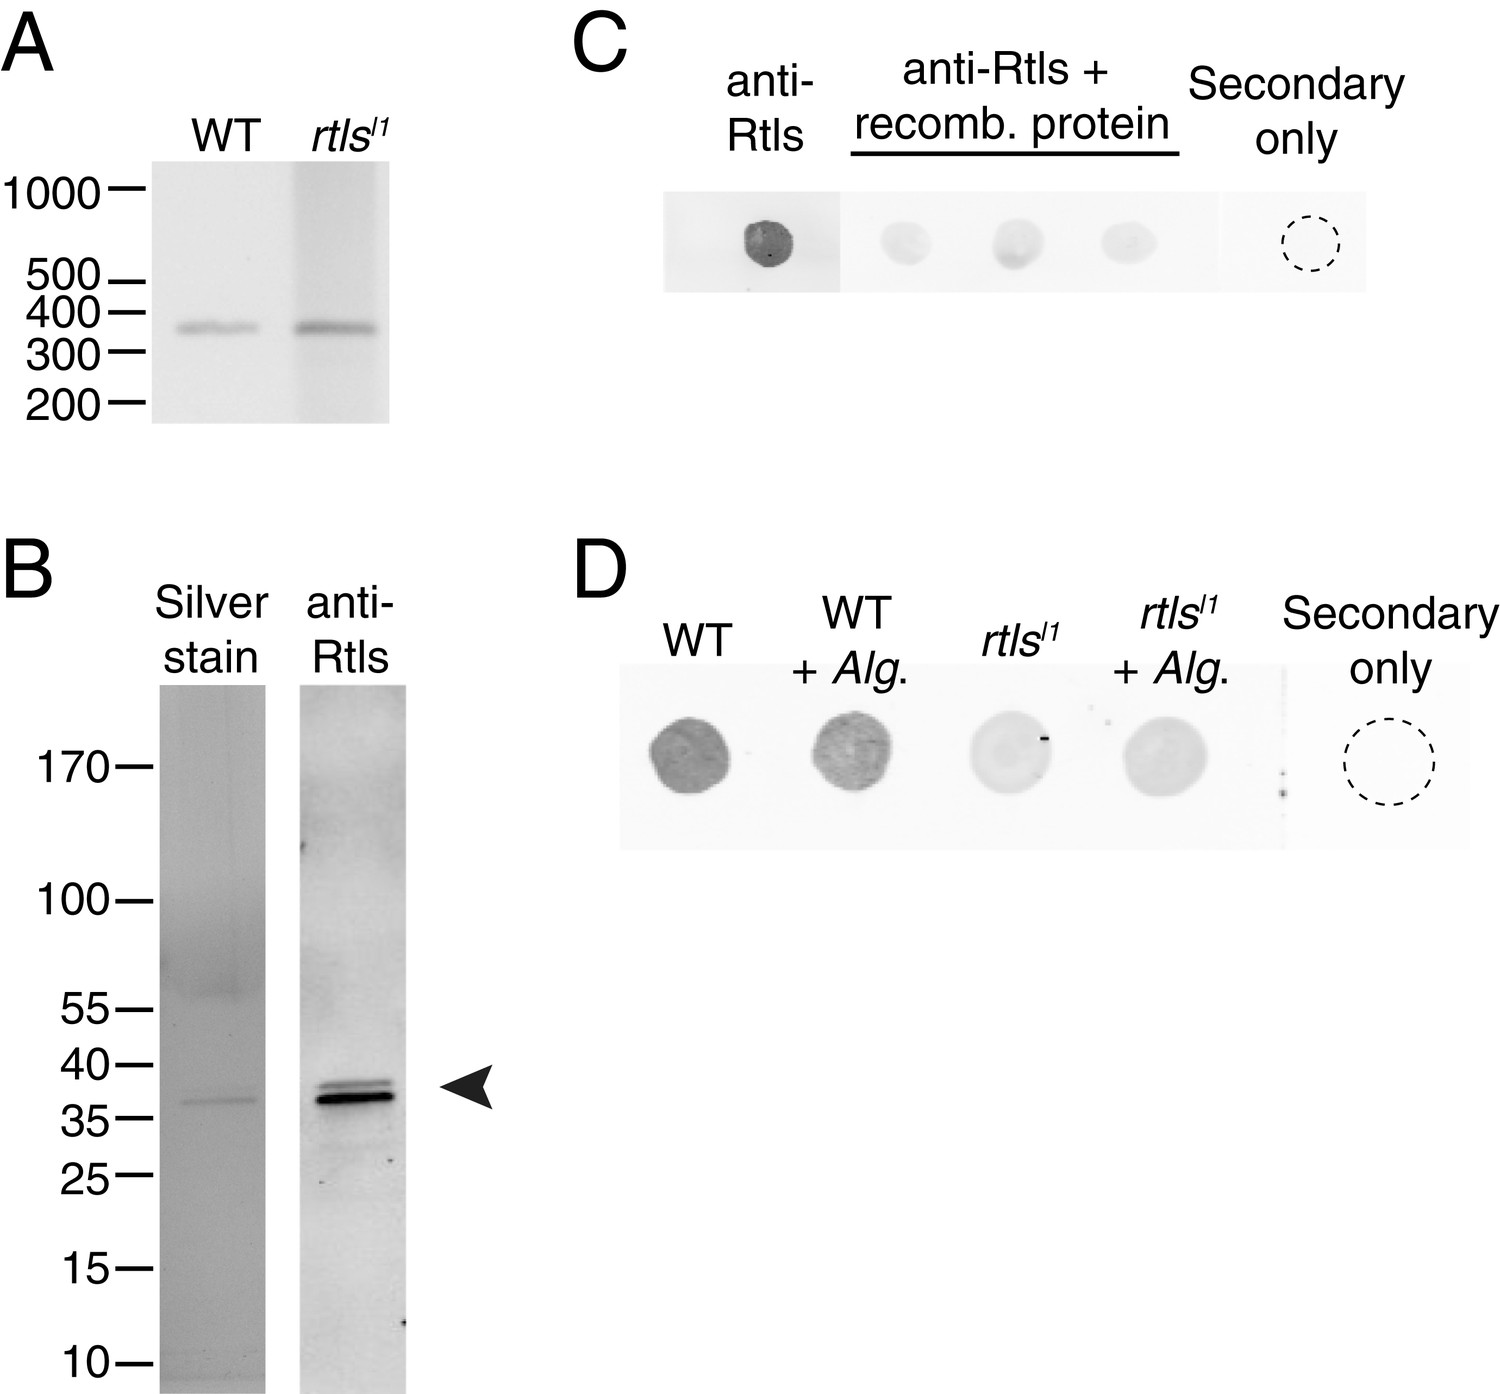
Rosetteless splicing and protein levels.
(A) RT-PCR with a primer bridging the exon 7/8 boundary of rtls paired with a primer in exon 12, amplified the wild-type rtls splice isoform from wild-type and rtlsl1 cDNA. This was in contrast with the diverse alternative rtls splice isoforms amplified from Rosetteless cells when RT-PCR was performed with a primer bridging the exon 5/6 junction and a primer in exon 12 (Figure 5D). (B) Purified, recombinant protein corresponding to the anti-Rtls epitope has a predicted size of approximately 38 kDa (arrowhead). The purity of 100 ng of recombinant protein was analyzed by silver stain (left) and by western blot with anti-Rtls (right) on two separate 4–12% gradient gels. (C) Raw data showing the validation of anti-Rtls on dot blots of wild-type cell lysates. Pre-incubation of anti-Rtls with the recombinant Rtls epitope competes away the staining, demonstrating that the majority of the signal is specific to the Rtls protein. Three replicate samples are shown. (D) Raw dot blot data showing levels of Rtls in wild-type (WT) or Rosetteless mutant (rtlsl1) cultures with or without inoculation with A. machipongonensis (Alg.). Each spot is normalized for total S. rosetta cell number.
Figure 5—figure supplement 2
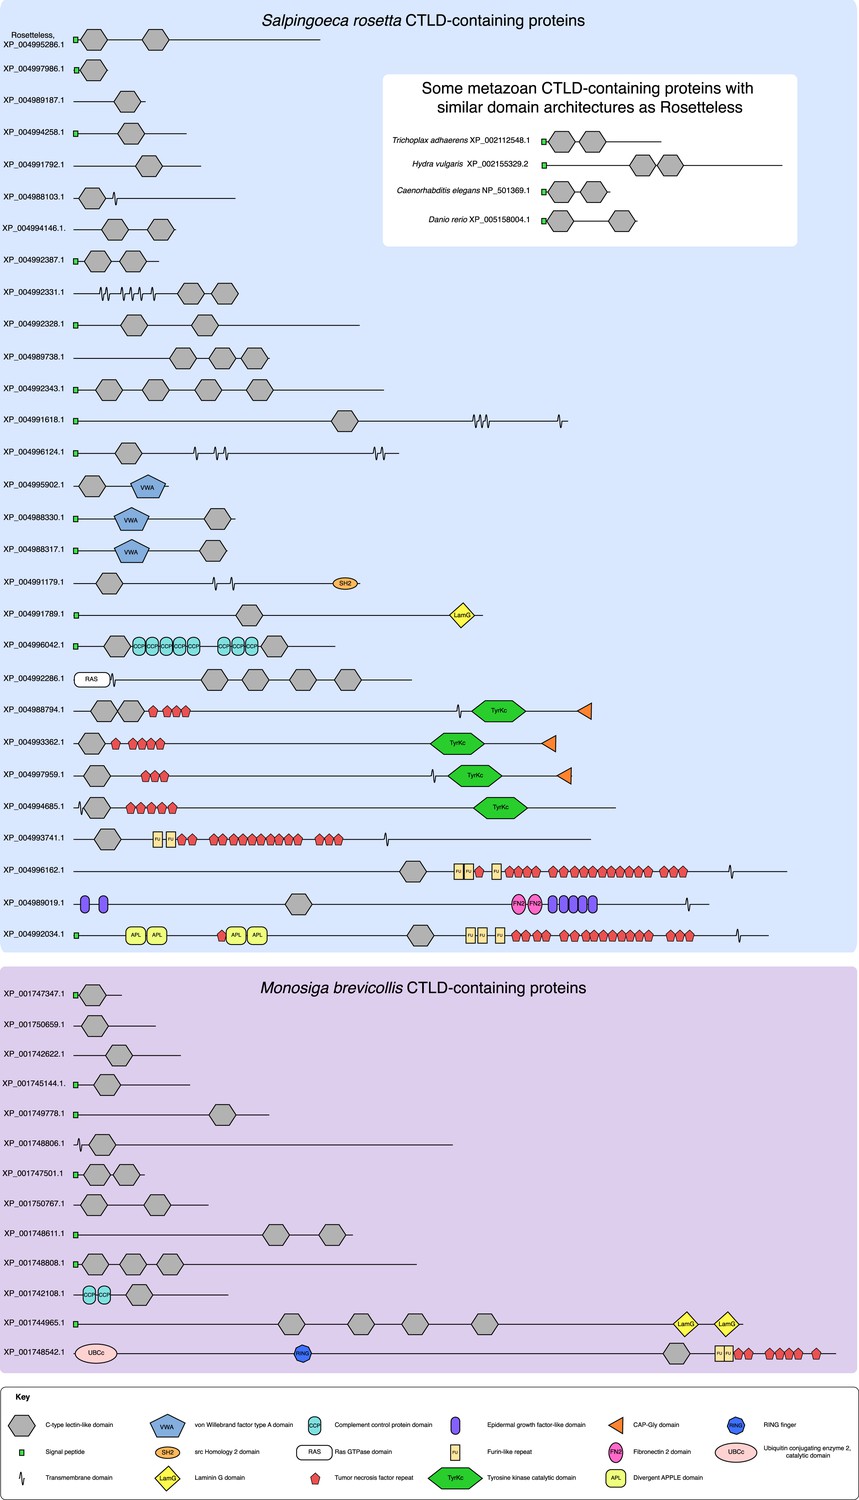
The diversity of S. rosetta and M. brevicollis CTLD-containing proteins.
The protein domain architectures of all CTLD-containing proteins predicted in the genomes of S. rosetta (blue) and M. brevicollis (purple) are shown. In addition, diagrams of select animal CTLD-containing proteins with similar architectures to Rosetteless are provided (white). Genbank accession numbers are listed at the left. All diagrams are drawn to scale. Although proteins in choanoflagellates are commonly assigned animal orthologs based on their diagnostic domain architecture, the minimal domain features of Rosetteless preclude any clear assignments of orthology. Additionally, within animals, C-type lectins are a family of rapidly evolving genes that exhibit extensive duplications and rearrangements among taxa (e.g., [Drickamer and Dodd, 1999], [Sattler et al., 2012]). It is thus not currently possible to assign clear orthology relationships between many of the animal C-type lectins, much less between animal C-type lectins and more evolutionarily distant CTLD-containing proteins found in choanoflagellates and other eukaryotes (e.g., [Wheeler et al., 2008]).
Figure 6 with 2 supplements

Rtls is required for rosette development and localizes to the center of rosettes.
(A) Rosette development in wild-type S. rosetta was inhibited in the presence of 50 µg/ml anti-Rtls antibody, leading to a significant reduction in the percentage of cells in rosettes (one-tailed t test, p < 0.05) as compared to BSA, pre-immune serum, and IgG negative controls. Error bars show standard deviation. (B–C) The localization pattern of cell-associated Rtls differs between wild-type rosettes, chains, and single cells. (B) In rosettes, Rtls (cyan) was detected as a thick layer associated with the basal poles of the cells. Commonly, a gap was observed in the Rtls staining between one pair of neighboring cells in each rosette (arrow). The collar microvilli and filopodia were stained with phalloidin (red) and anti-tubulin staining (white) was used to highlight the cell body and flagellum. (C) Rtls localization in (1) wild-type rosettes, (2) wild-type chains, (3) wild-type single cells, and (4) Rosetteless mutant single cells. In single cells and chains imaged as in Figure 6B (‘Rtls’, laser intensity = 2.0, zoom = 2.5, gain = 544), Rtls signal was nearly undetectable. However, when imaged with a higher photomultiplier gain (‘Rtls–high gain’, laser intensity = 2.0, zoom = 2.5, gain = 750), Rtls was detected in membrane-associated patches (arrowheads) in wild-type single cells and chains, but not in Rosetteless cells. Wild-type single cells and chains frequently also had immunoreactive material deposited on the slide adjacent to the cells (asterisk). All cell types showed faint, diffuse fluorescence throughout the cell body, but this was likely the result of non-specific staining (Figure 6—figure supplement 2). Scale bars = 5 µm.
Figure 6—figure supplement 1
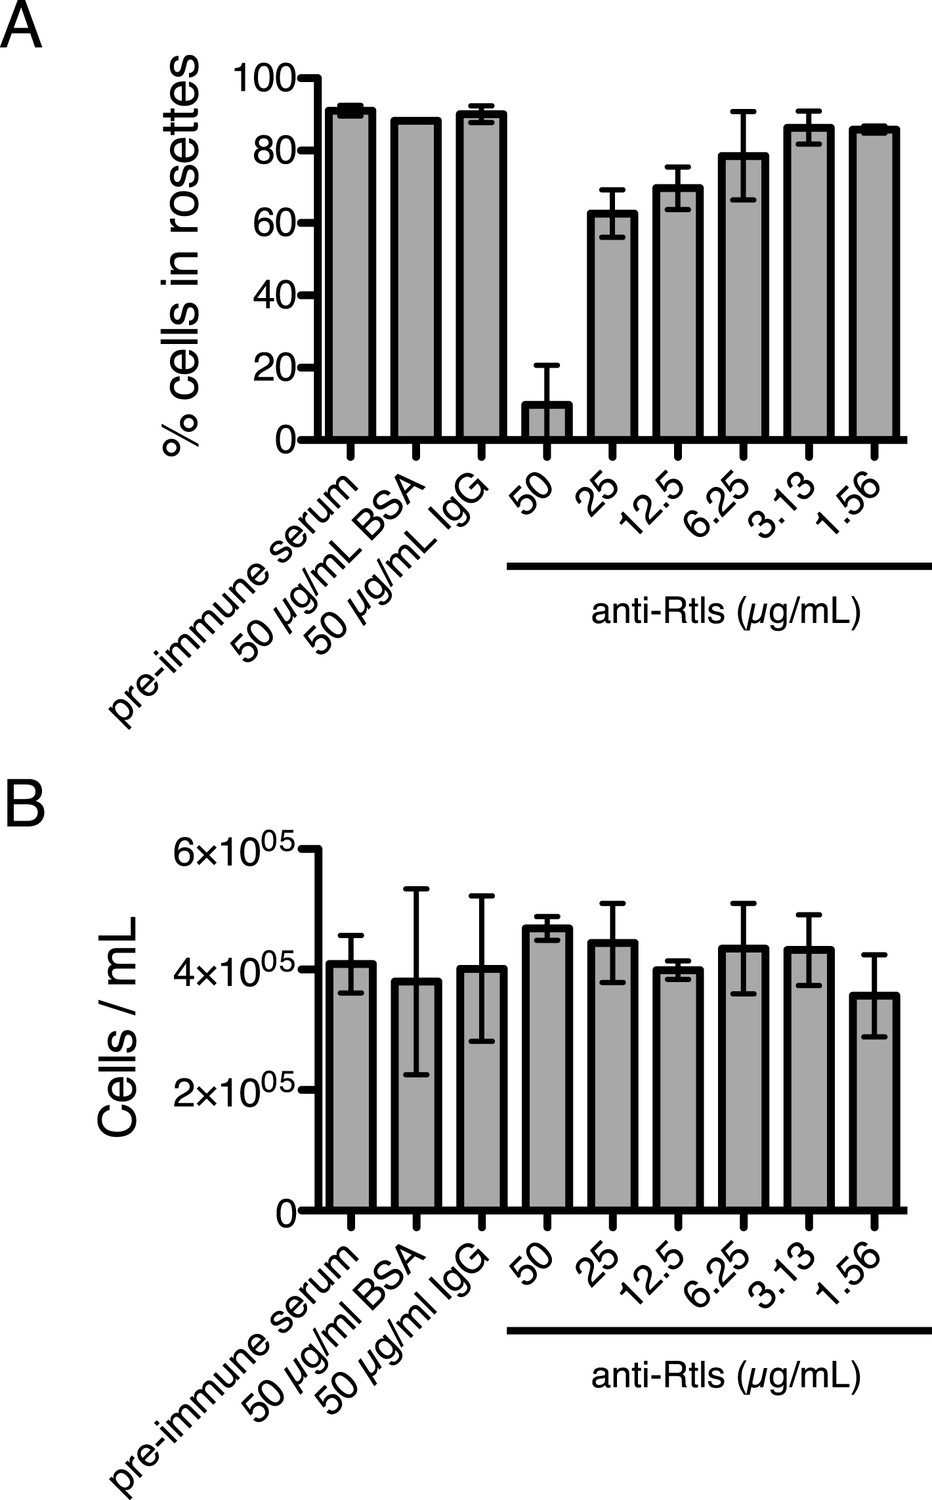
Anti-Rtls blocks rosette development.
(A) Extended data for Figure 6A, showing that increasing concentrations of anti-Rtls lead to a significant reduction in rosette development relative to BSA, IgG, and pre-immune serum negative controls. (B) Cell densities of wild-type S. rosetta incubated with 50 μg/ml BSA, pre-immune serum, 50 μg/ml IgG, or increasing concentrations of anti-Rtls for 24 hr for the experiment in (A), demonstrating that the reduction in rosette development following treatment with anti-Rtls was not due to growth inhibition.
Figure 6—figure supplement 2
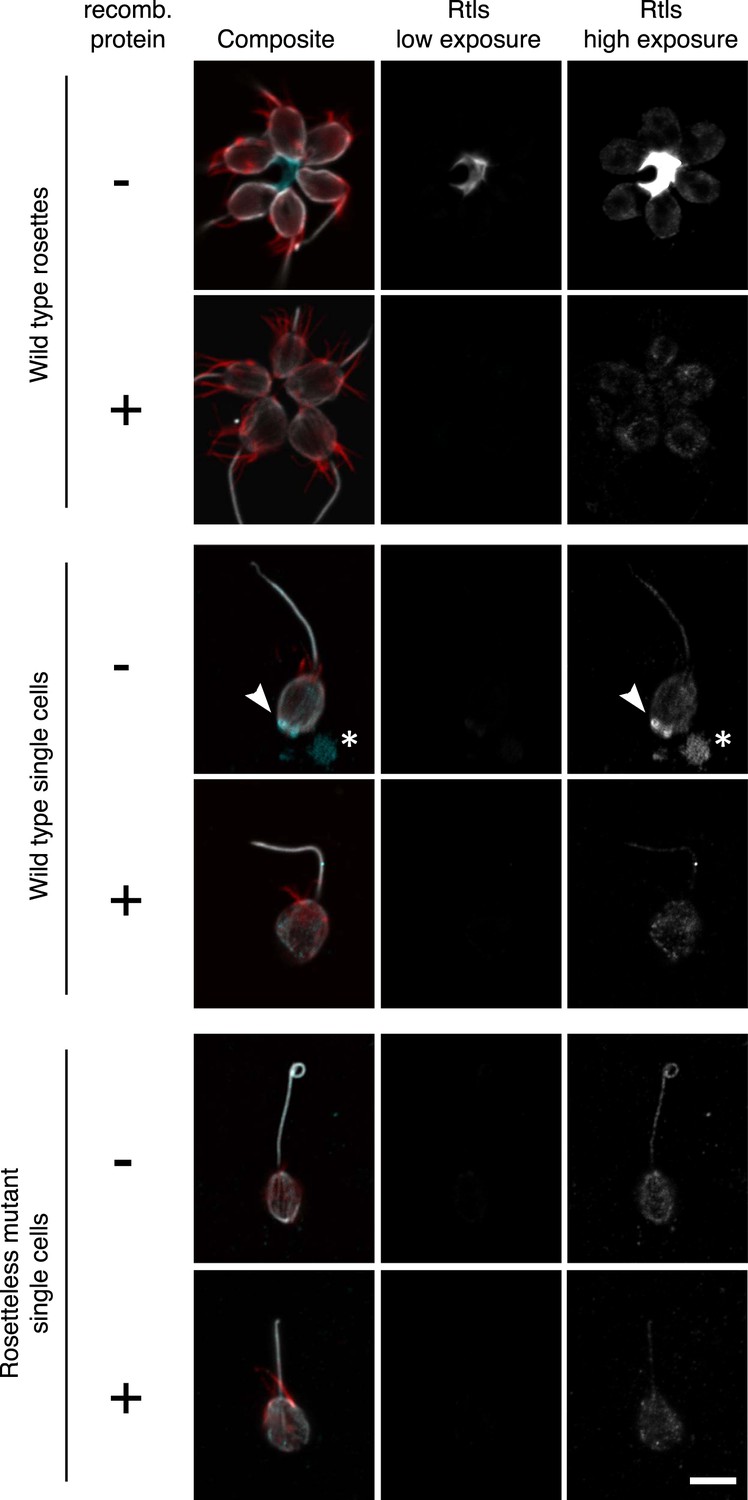
Validation of the anti-Rtls antibody in immunofluorescence.
To determine the specificity of the anti-Rtls antibody, the antibody was incubated either with (+) or without (−) the recombinant, purified epitope prior to the staining of wild-type or Rosetteless mutant cells. This pre-incubation of anti-Rtls with its purified epitope was expected to compete away the specific anti-Rtls signal and led to the loss of: the bright staining in the center of rosettes, the enriched patches of staining associated with the cell membranes of wild-type single cells (arrowhead), and immunoreactive material that was often detected on the slide surface adjacent to wild-type single cells (*). Notably, these are also the staining patterns that are missing from the Rosetteless mutant cells. (The loop at the apical tip of the flagellum was observed in wild-type and mutant cells and is not part of the Rosetteless phenotype.) In all cells following competition with the epitope there remained faint staining in the cell body; we thus infer that this is non-specific staining that does not reflect the distribution of Rtls protein in the cells. All cells were stained with the same concentration of anti-Rtls antibody and were imaged at the same exposures by confocal microscopy. Co-staining with phalloidin (red) and anti-tubulin (white) allowed for the visualization of the collar, cell body, and flagellum. Scale bar = 5 µm.
Tables
Table 1
Classification of mutant phenotypes
| Mutagen used | Observed rosette induction* | Other phenotypes | |||
|---|---|---|---|---|---|
| ACM | Live bacteria | Swimming† | Chain morphology | ||
| Wild type | N/A | 86% | 88% | Wild type | Primarily linear |
| Mutant class A | |||||
| Rosetteless | EMS | 0 | 0 | Wild type | Primarily linear |
| Mutant class B | |||||
| Insensate | X-rays | 0 | 5 | Wild type | Primarily linear |
| Mutant class C | |||||
| Slacker | X-rays | 20 | 42 | Wild type | Primarily linear |
| Mutant class D | |||||
| Uptight | X-rays | 33 | 56 | Wild type | Branched |
| Mutant class E | |||||
| Jumble | EMS | 0 | 0 | Wild type | Branched |
| Branched | X-rays | 0 | 0 | Wild type | Branched |
| Mutant class F | |||||
| Seafoam | X-rays | 0 | 0 | Wild type | Large clusters |
| Soapsuds | X-rays | 0 | 0 | Wild type | Large clusters |
| Mutant class G | |||||
| Solo | X-rays | 0 | 0 | Slow, shaking | Primarily solitary |
-
*
The percentage of cells in rosettes following induction.
-
†
Swimming phenotypes of single cells.
Additional files
-
Supplementary file 1
Primers used for genotyping and assessing splicing.
- https://doi.org/10.7554/eLife.04070.020
-
Supplementary file 2
Polymorphic sequences targeted by KASP genotyping.
- https://doi.org/10.7554/eLife.04070.021
Download links
A two-part list of links to download the article, or parts of the article, in various formats.
Downloads (link to download the article as PDF)
Open citations (links to open the citations from this article in various online reference manager services)
Cite this article (links to download the citations from this article in formats compatible with various reference manager tools)
The rosetteless gene controls development in the choanoflagellate S. rosetta
eLife 3:e04070.
https://doi.org/10.7554/eLife.04070


