Adiponectin is essential for lipid homeostasis and survival under insulin deficiency and promotes β-cell regeneration
- University of Texas Southwestern Medical Center, United States
- University of California Berkeley, United States
Figures
Figure 1 with 3 supplements
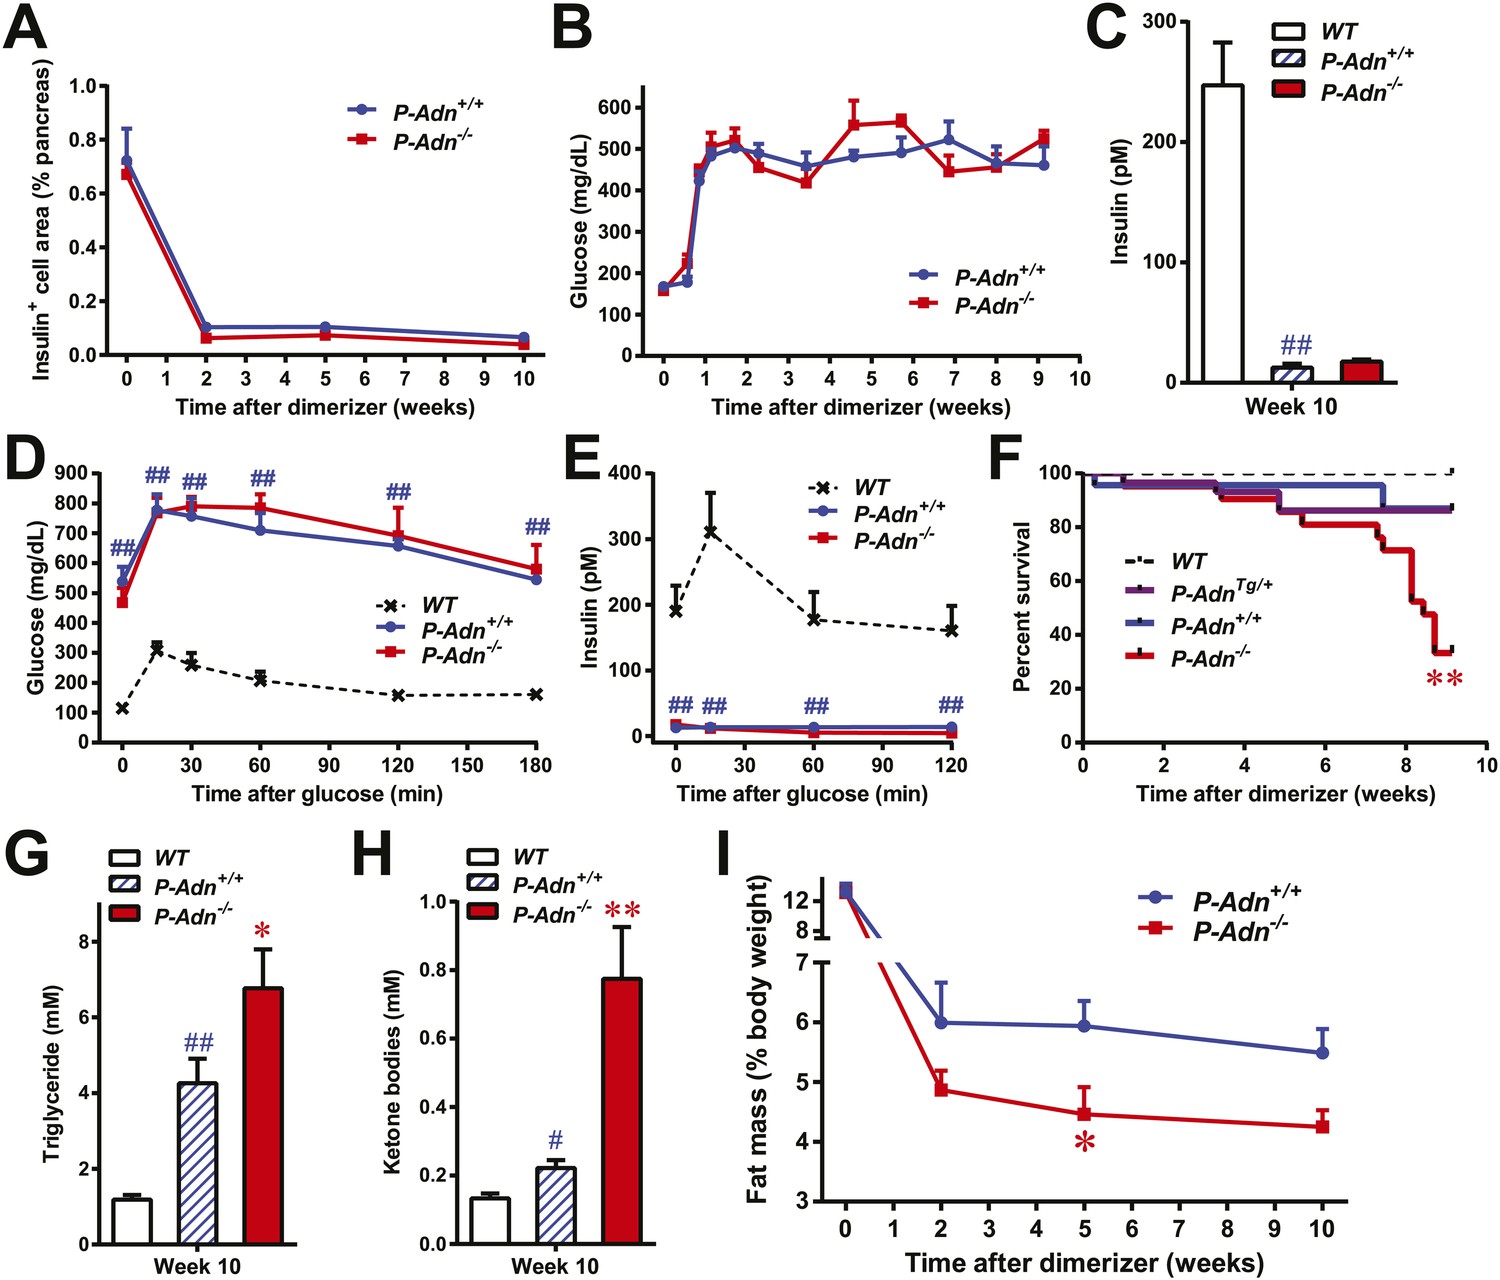
Adiponectin is required for minimal lipid homeostasis and survival in PANIC-ATTAC mice.
Mice with four different genotypes (wildtype [WT]; homozygous PANIC-ATTAC with adiponectin wildtype [P-Adn+/+], adiponectin knockout [P-Adn−/−], or transgenic adiponectin overexpressing mice [P-AdnTg/+]) were exposed to dimerizer. (A) Quantitation of insulin-immunostained cell area, normalized to total pancreas area. n = 3–6 mice per condition. Source files are available in Figure 1—source data 1. (B) Fasting blood glucose. n ≥ 8 mice per condition. (C–E) At 10 weeks after dimerizer treatment: (C) fasting blood insulin. (D) Blood glucose and (E) plasma insulin during an oral glucose tolerance test. (F) Survival curve. n = 25 (WT), 29 (P-AdnTg/+), 23 (P-Adn+/+) and 21 (P-Adn−/−) mice. (G and H) Blood triglycerides (G) and total ketone bodies (H) in mice under fed status. (I) Fat mass presented as percentage of mouse body weight. n ≥ 6 mice per condition unless specified. Data are presented as the mean ± SEM. *p < 0.05, **p < 0.01 for P-Adn−/− vs P-Adn+/+. #p < 0.05, ##p < 0.01 for P-Adn+/+ vs WT.
-
Figure 1—source data 1
Source files for insulin-positive cell area quantitation.
The zip file contains all the 2400-dpi scanned images of insulin-immunostained pancreas sections used for quantitation of insulin-positive cell area. Insulin is stained as brown, and the whole section is counterstained as blue with hematoxylin. Folders are named after genotypes (P-Adn++ or P-Adn−−) and subfolders after time points (week 0, 2, 5, or 10) post initial dimerizer administration. Related to Figure 1A.
- https://doi.org/10.7554/eLife.03851.004
Figure 1—figure supplement 1
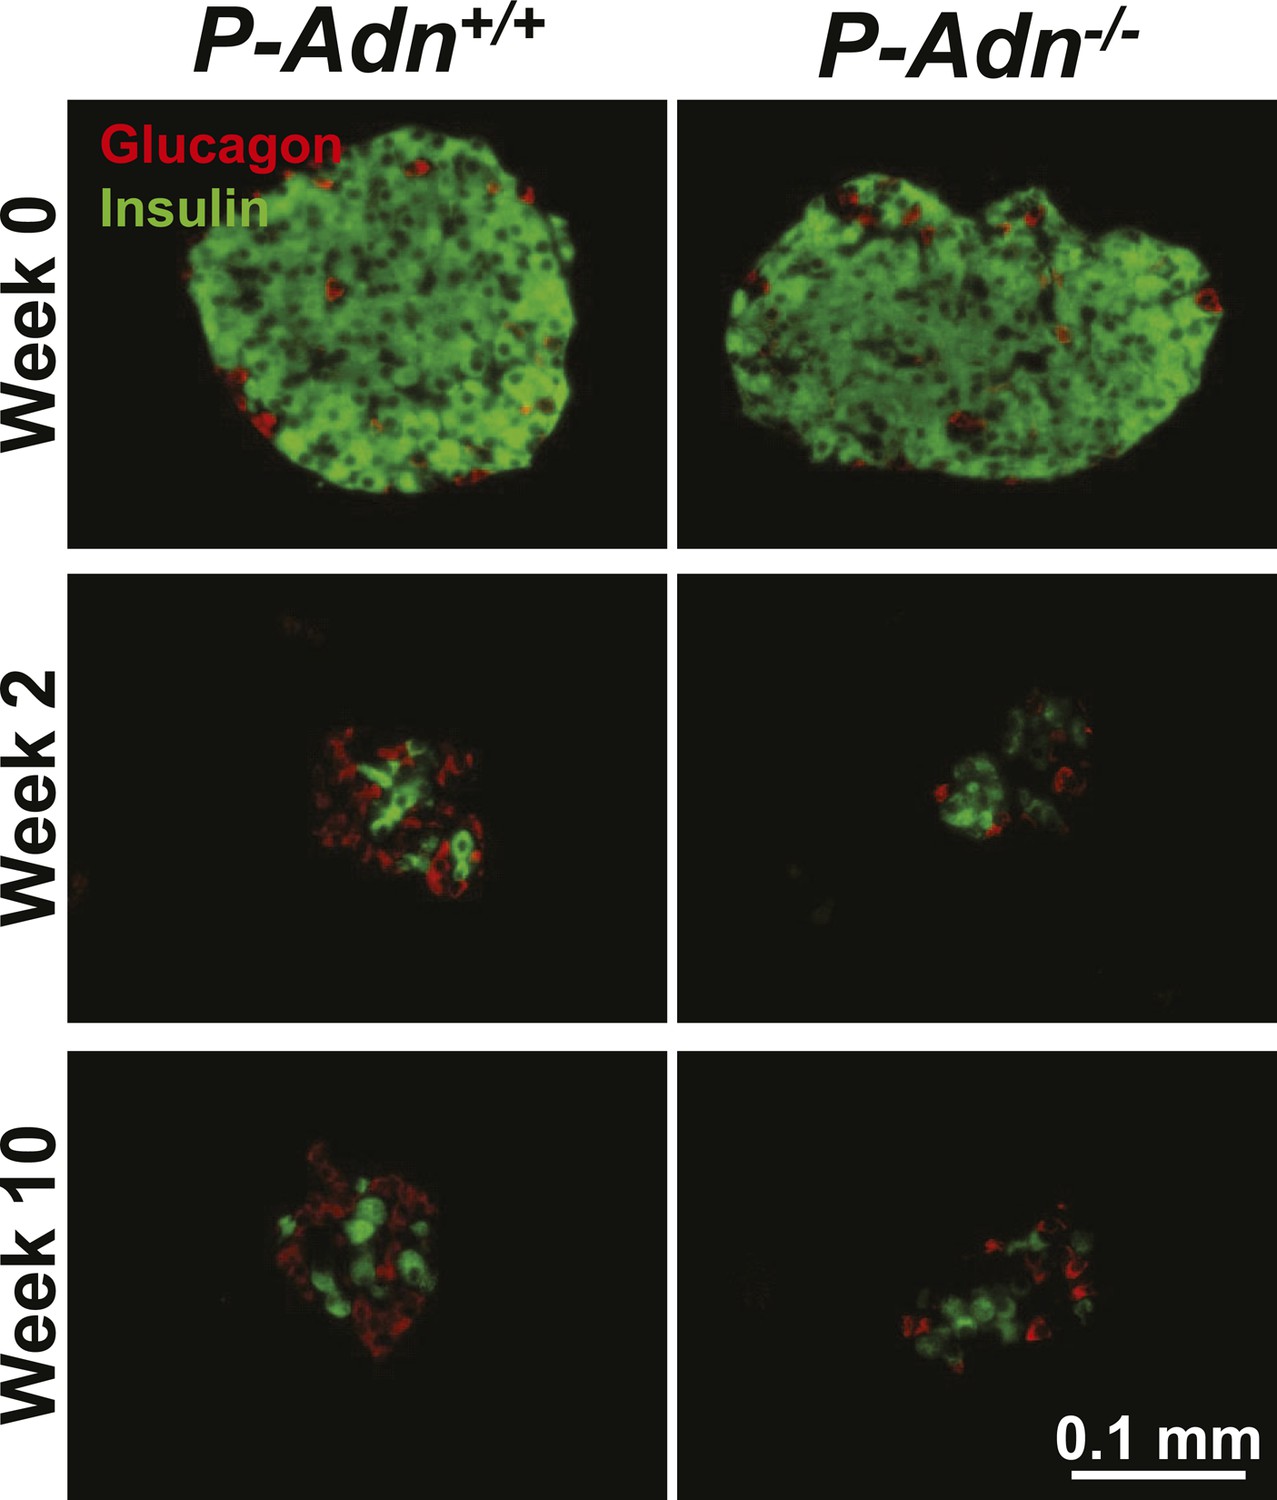
Sustained β-cell ablation in PANIC-ATTAC mice.
Representative immunofluorescence of glucagon (red) and insulin (green) on pancreatic islets from homozygous PANIC-ATTAC with adiponectin wild-type (P-Adn+/+) or knockout (P-Adn−/−) mice at 0, 2, and 10 weeks after dimerizer treatment. Related to Figure 1A.
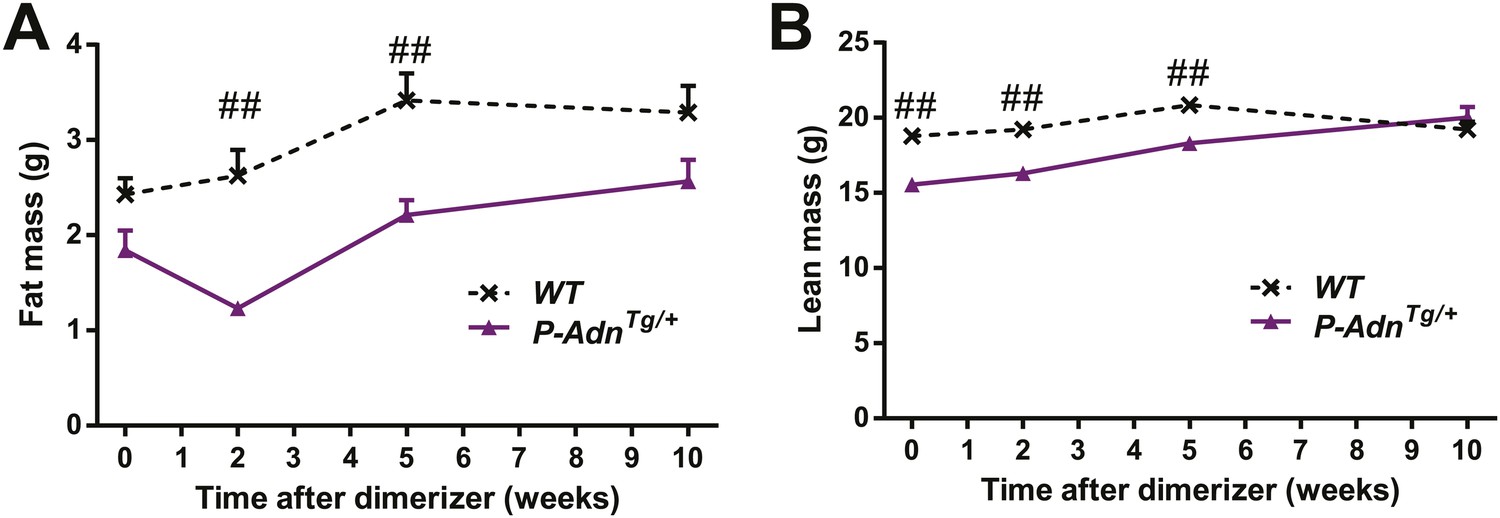
Figure 1—figure supplement 2
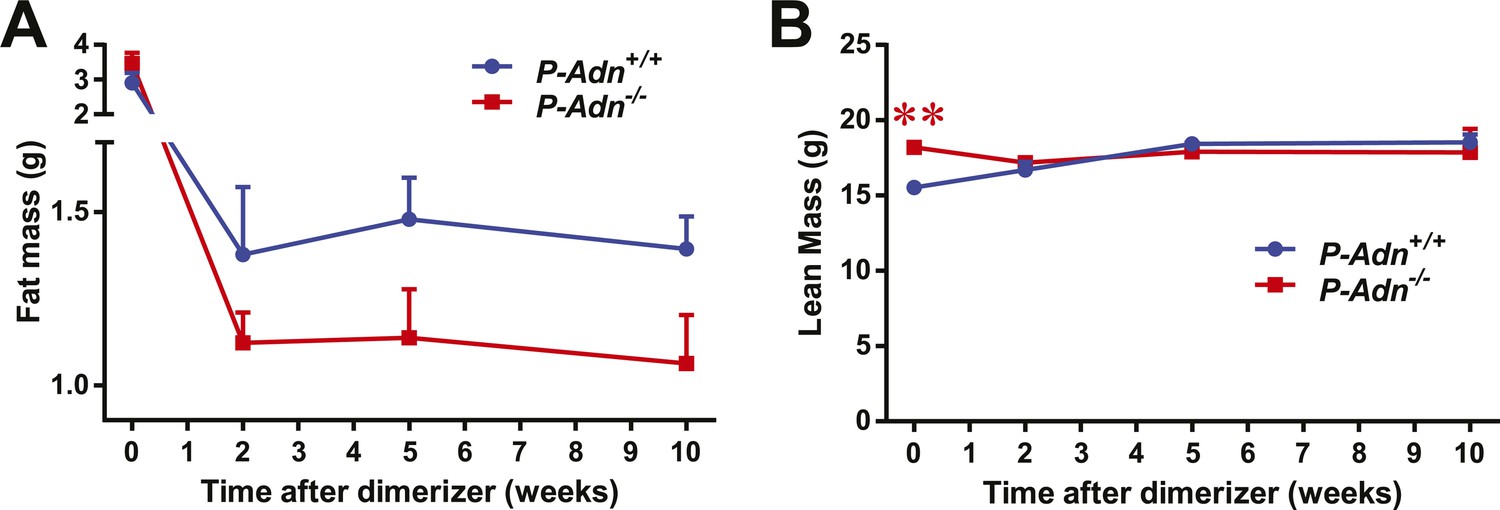
Body composition of PANIC-ATTAC mice.
Fat mass (A) and lean mass (B) at 0, 2, 5, 10 weeks after initial dimerizer treatment. n ≥ 6 mice per condition. Data are presented as the mean ± SEM. **p < 0.01 for P-Adn−/− vs P-Adn+/+. Related to Figure 1I.
Figure 1—figure supplement 3
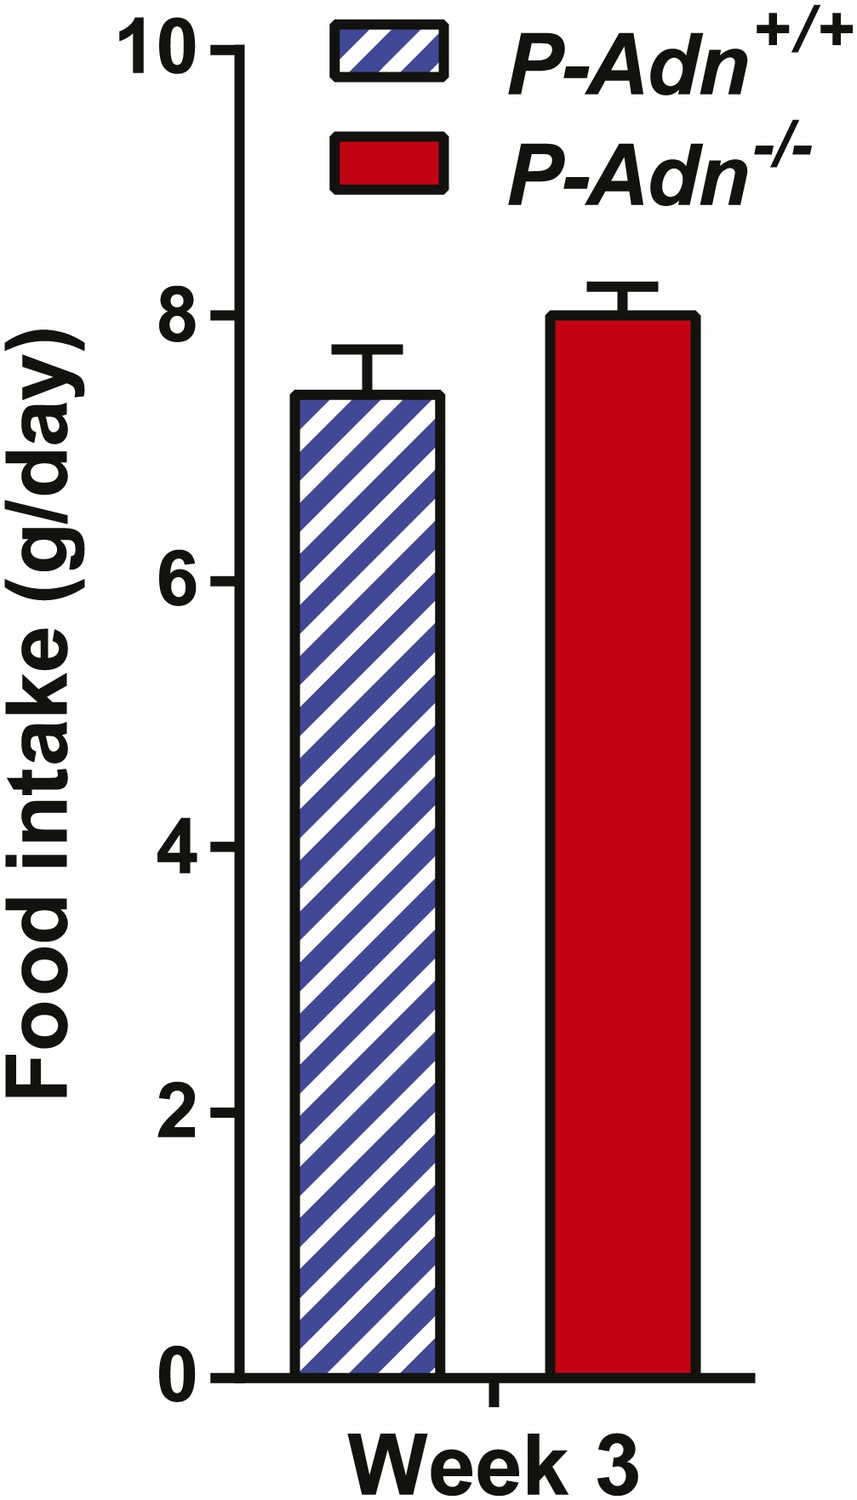
Food intake of PANIC-ATTAC mice.
Food intake during the third week after initial dimerizer treatment. n = 4 mice per genotype. Data are presented as the mean ± SEM. Related to Figure 1I.
Figure 2 with 6 supplements
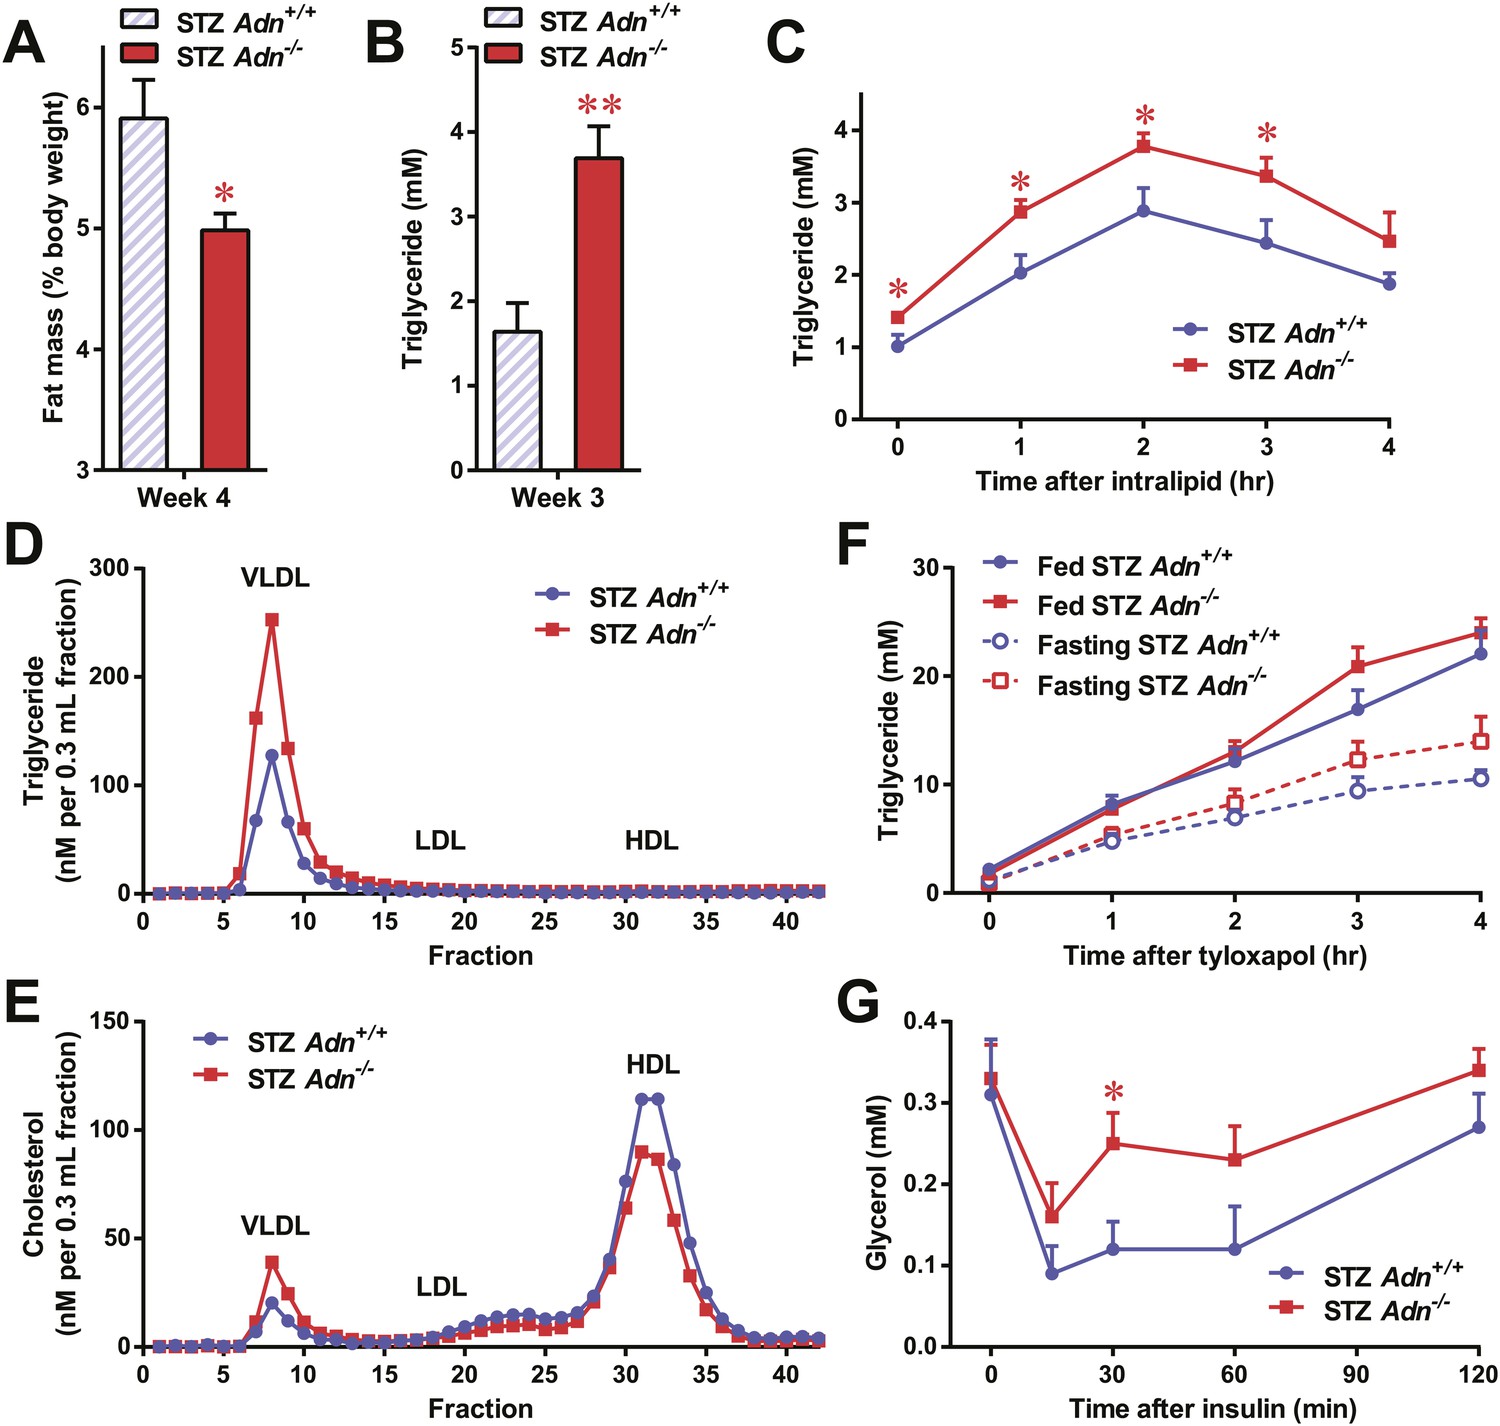
Adiponectin is essential for lipid metabolism in STZ-treated insulinopenic mice.
Adiponectin wild-type (Adn+/+) and knockout (Adn−/−) mice were treated with streptozotocin (STZ) to eliminate pancreatic β-cells and became hyperglycemic within 2 days after administration. (A) Fat mass 4 weeks after STZ treatment. (B) Fed triglyceride levels 3 weeks after STZ treatment. (C) Blood triglycerides during oral triglyceride tolerance test in mice 2 weeks after STZ treatment. (D and E) Pooled plasma samples from Adn+/+ and Adn−/− mice (n = 3) were subjected to FPLC lipoprotein fractionation. Triglyceride (D) and cholesterol (E) contents of the 0.3 ml fractions were assayed. (F) Blood triglycerides after tail vein injection of tyloxapol. 2 weeks after STZ treatment, mice were fed or fasted for 4 hr before tyloxapol administration. (G) Blood glycerol after intraperitoneal injection of insulin (0.1 mU/g BDW) in mice 3 days after STZ treatment. n ≥ 7 mice per condition unless specified. Data are presented as the mean ± SEM. *p < 0.05, **p < 0.01 for Adn+/+ vs Adn−/−.
Figure 2—figure supplement 1

Body composition of STZ-treated mice.
Fat mass and lean mass of mice 4 weeks after STZ treatment. n = 15 (Adn+/+) and 23 (Adn−/−). Data are presented as the mean ± SEM. *p < 0.05 for Adn+/+ vs Adn−/−. Related to Figure 2A.
Figure 2—figure supplement 2
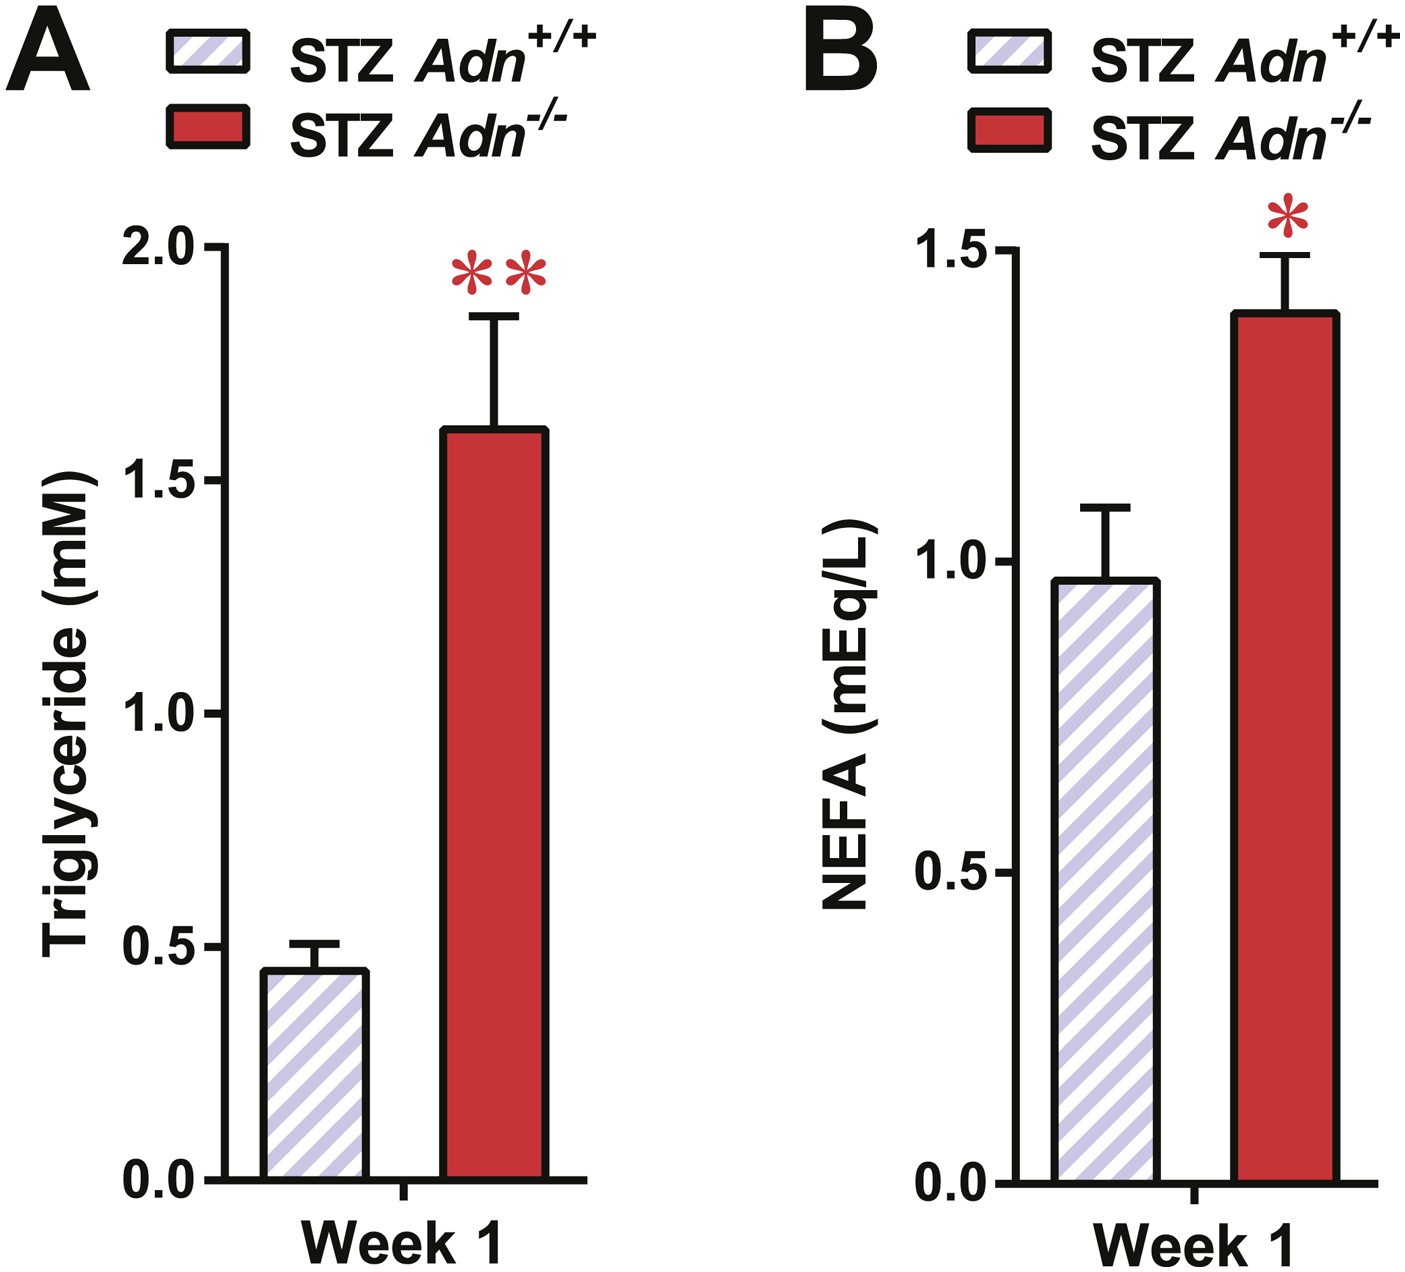
Serum lipids in overnight fasted STZ-treated mice.
Blood triglycerides (A) and NEFAs (B) in overnight fasted mice 1 week after STZ treatment. n = 7 mice per genotype. Data are presented as the mean ± SEM. *p < 0.05, **p < 0.01 for Adn+/+ vs Adn−/−. Related to Figure 2B.
Figure 2—figure supplement 3
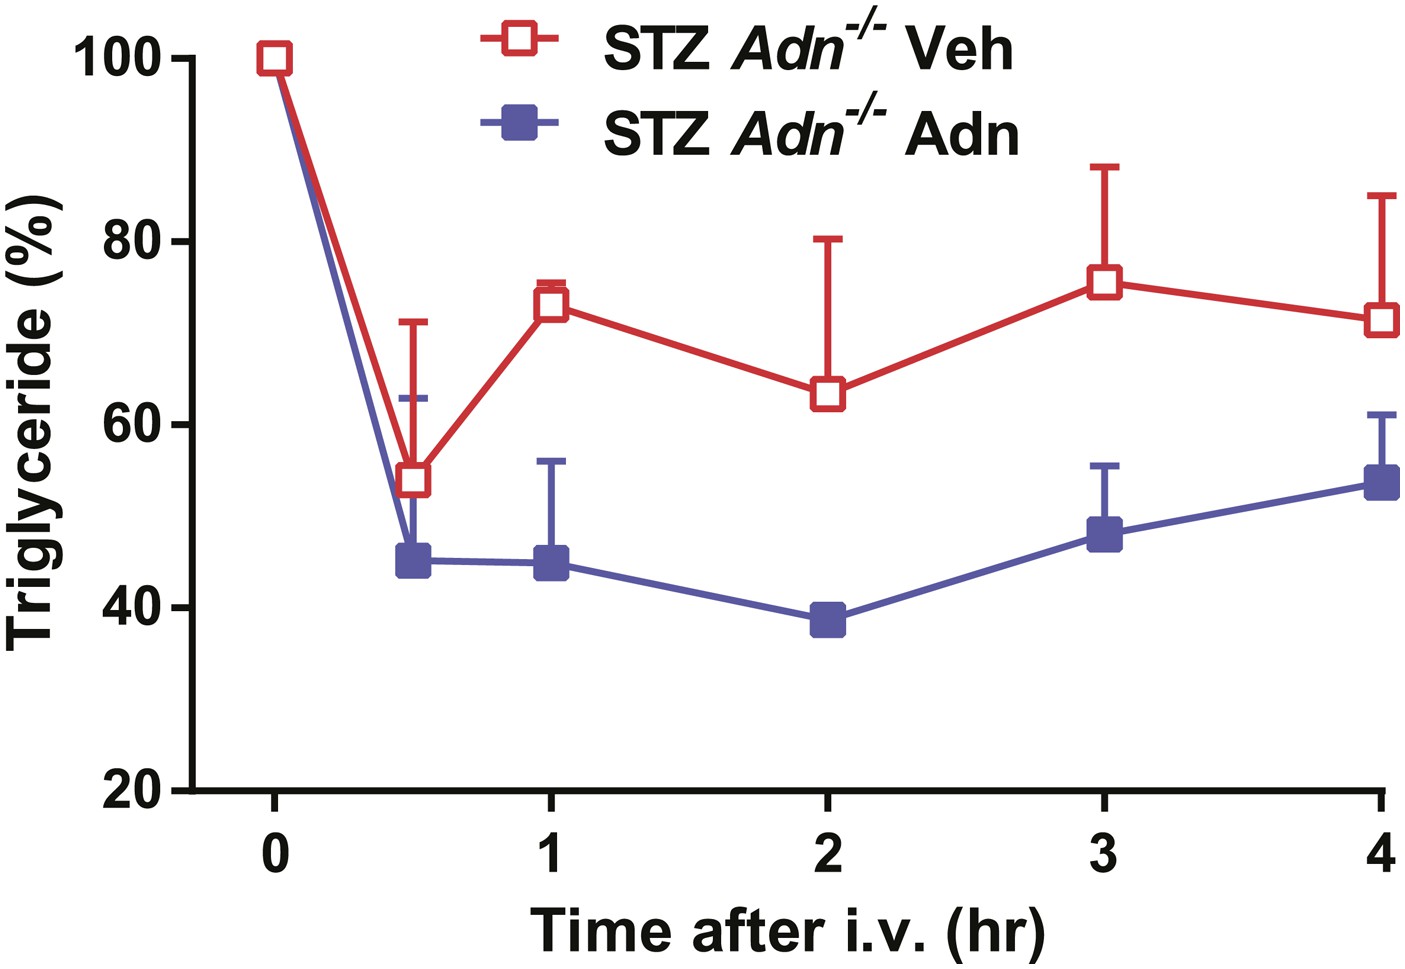
Recombinant adiponectin rescues triglyceride clearance in STZ-treated adiponectin null mice.
At 4 weeks after STZ treatment, Adn−/− mice were subjected to a tail vein injection of recombinant adiponectin (2 μg/g BDW) or vehicle solutions (PBS with 0.5 mM CaCl2) and measured for serum triglycerides at the indicated time points. n = 3 mice per condition. Data are presented as the mean ± SEM. Related to Figure 2C.
Figure 2—figure supplement 4
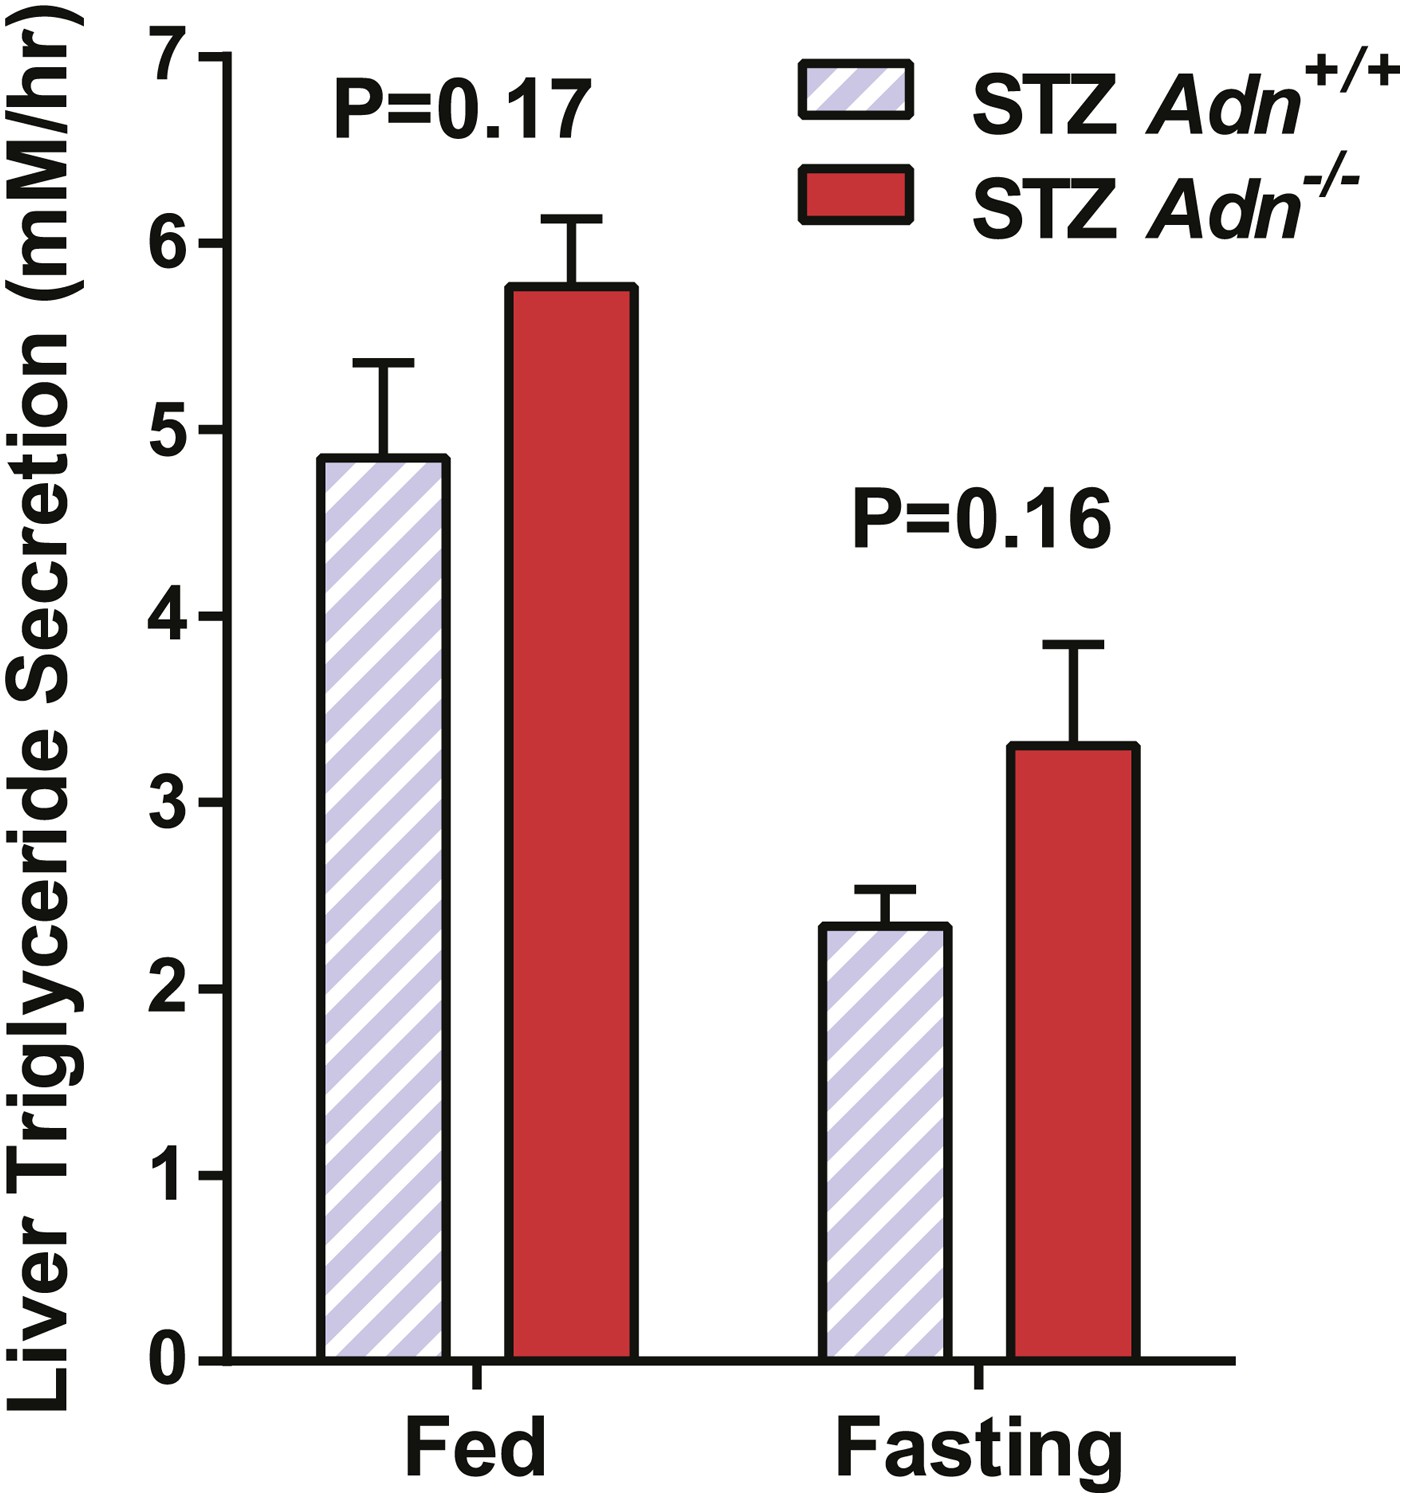
Hepatic secretion rates of triglycerides.
Slopes of plasma triglyceride over time after tyloxapol injection. n = 7–9 mice per condition. Data are presented as the mean ± SEM. Related to Figure 2F.
Figure 2—figure supplement 5
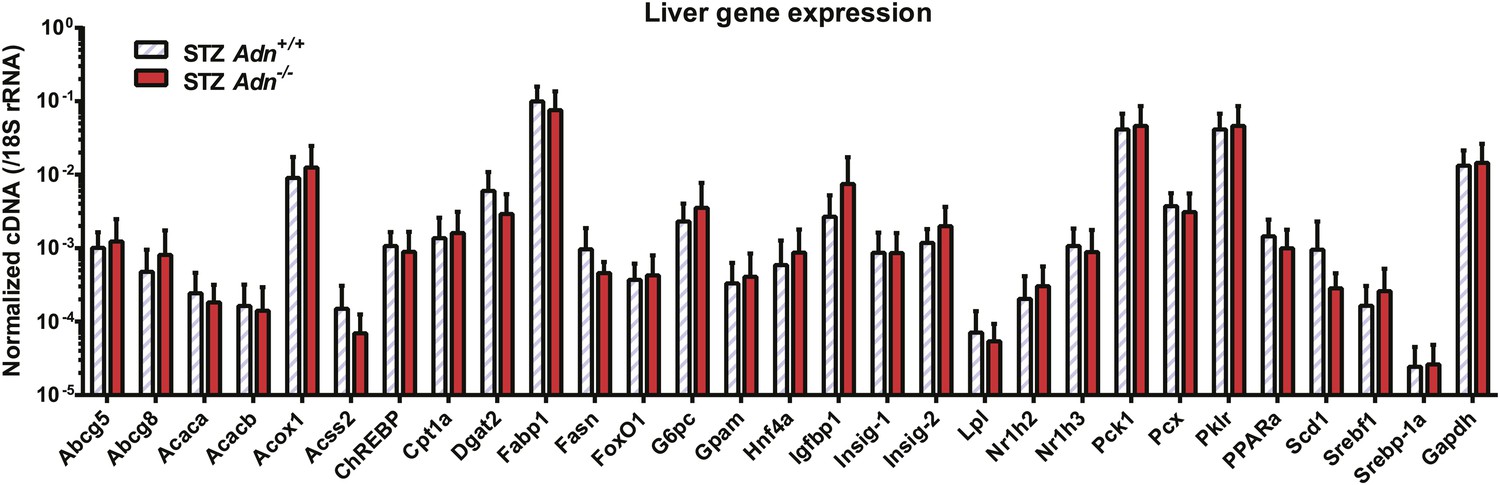
Hepatic expression of metabolic genes.
RT-qPCR analysis of gene expression in liver from mice 4 weeks after STZ treatment. cDNA abundances were normalized against 18S rRNA. n = 4 mice per genotype. Data are presented as the mean ± SEM. Related to Figure 2F.
Figure 2—figure supplement 6
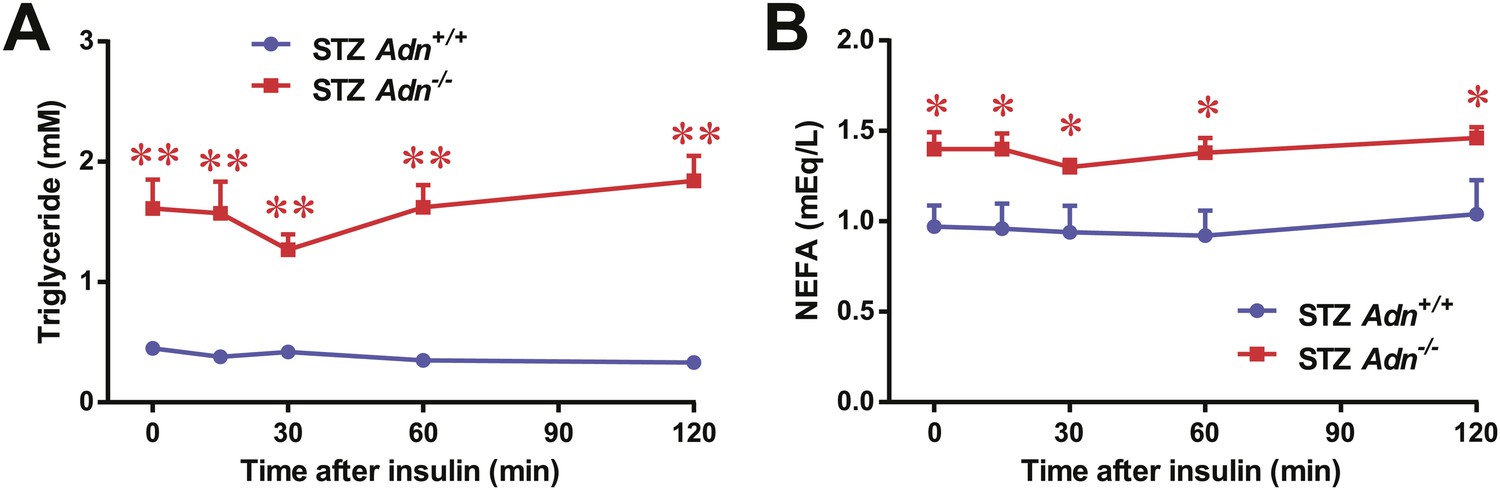
Serum triglycerides and NEFAs after low-dose insulin administration.
Plasma triglycerides (A) and NEFAs (B) in mice after intraperitoneal injection of insulin (0.1 mU/g BDW). n = 7 mice per genotype. Data are presented as the mean ± SEM. *p < 0.05, **p < 0.01 for Adn+/+ vs Adn−/−. Related to Figure 2G.
Figure 3 with 5 supplements
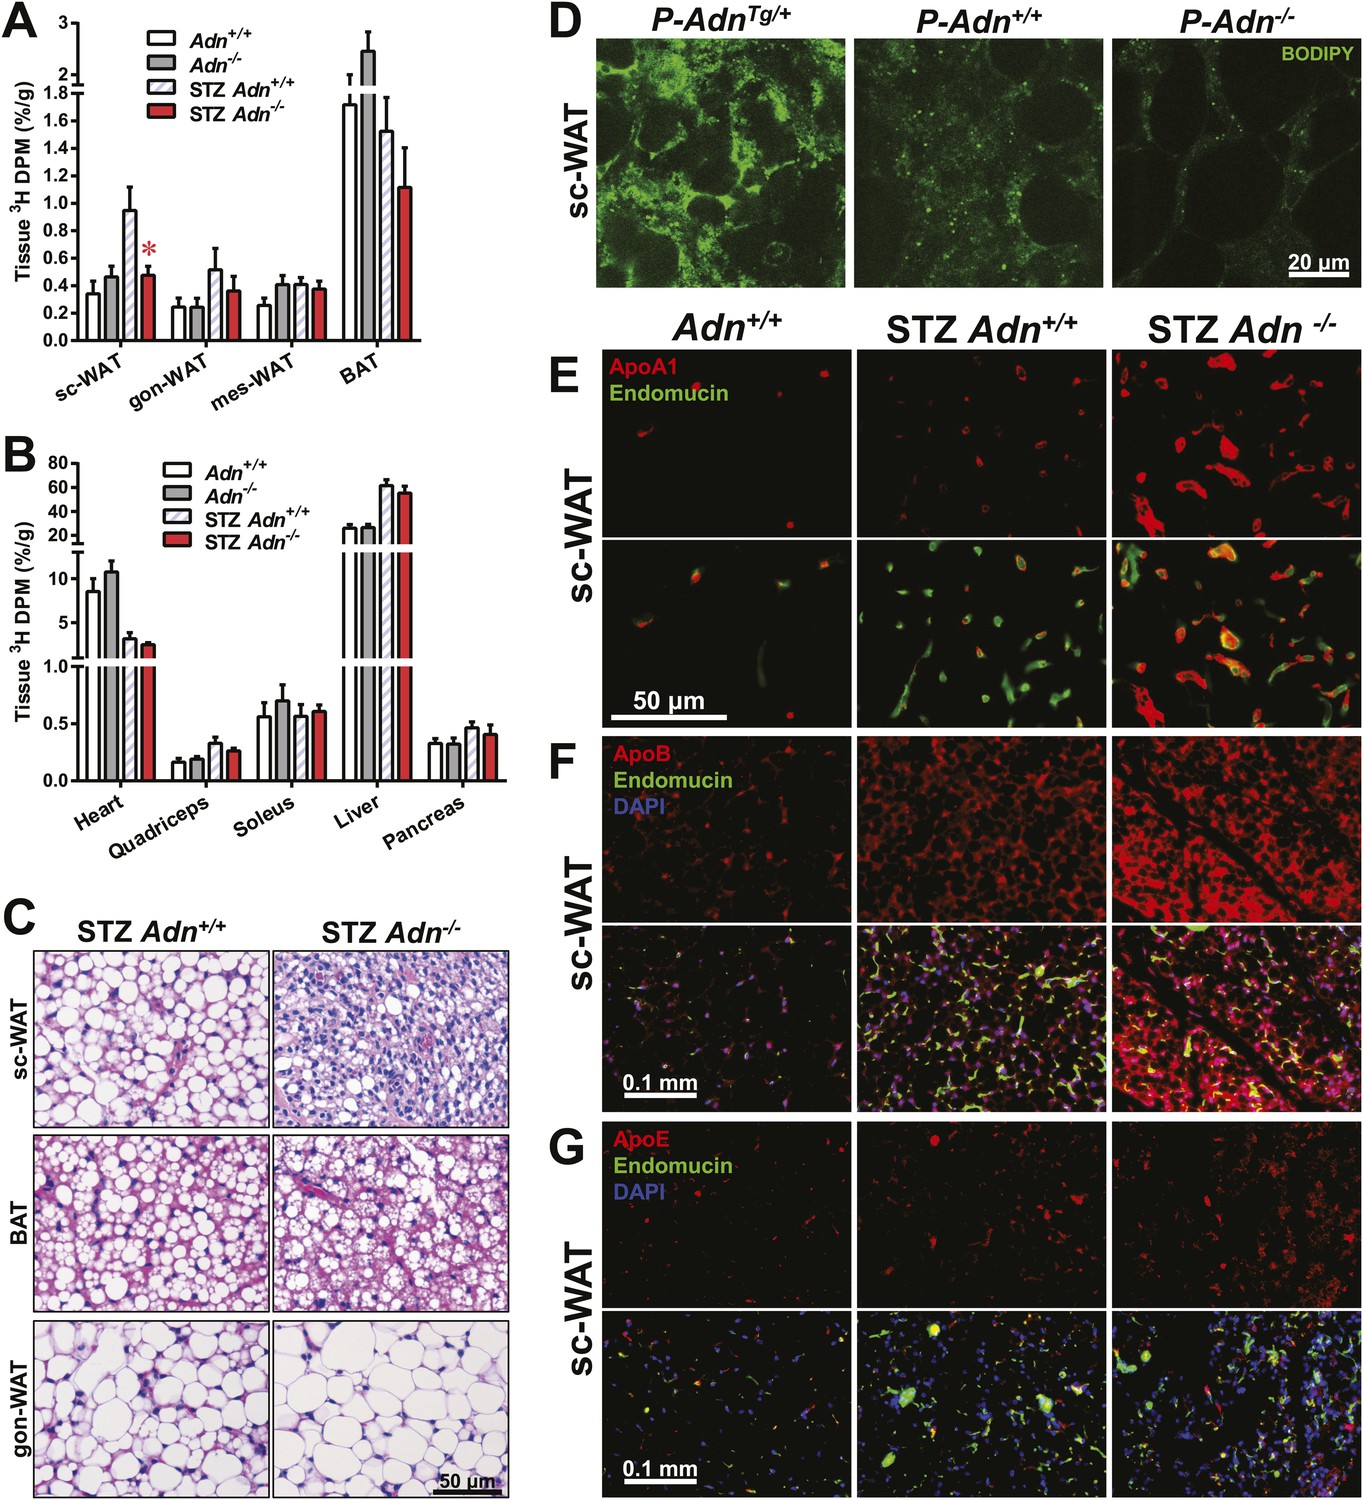
Adiponectin is critical for subcutaneous white adipose tissue lipid uptake in mice after β-cell ablation.
(A and B) Total 3H radioactivity in adipose tissues at the end of the 3H-triolein injection experiment. Radioactivity is calculated as percentage of input, and normalized against tissue weight. Sc: subcutaneous. Gon: gonadal. Mes: mesenteric. WAT: white adipose tissue. BAT: brown adipose tissue. Mice were either controls or used 3 weeks after STZ treatment. n ≥ 6 mice per condition. Data are presented as the mean ± SEM. *p < 0.05 for Adn+/+ vs Adn−/−. (C) Representative H&E stains of sections from subcutaneous WAT, BAT, and gonadal WAT. (D) Representative confocal microscopy of BODIPY fluorescence signal in whole-mount subcutaneous WAT. PANIC-ATTAC mice were at 3 weeks post dimerizer and subjected to an oral gavage of BODIPY-labeled fatty acids (2 μg/g BDW) 3 hr before tissue collection. (E–G) Representative immunofluorescence co-stain of apolipoproteins A1 (E), B (F), or E (G) (red), and endomucin (green) in subcutaneous WAT.
Figure 3—figure supplement 1

Tissue-specific catabolism of 3H-triolein.
For the 3H-triolein chase experiment: (A) disappearance rate of 3H radioactivity in blood. (B and C) At the end of the chase experiment, 3H radioactivity in the organic (B) and aqueous (C) phases of tissue lipid extracts were measured. Data are presented as the mean ± SEM. *p < 0.05 for Adn+/+ vs Adn−/−. Related to Figure 3A,B.
Figure 3—figure supplement 2
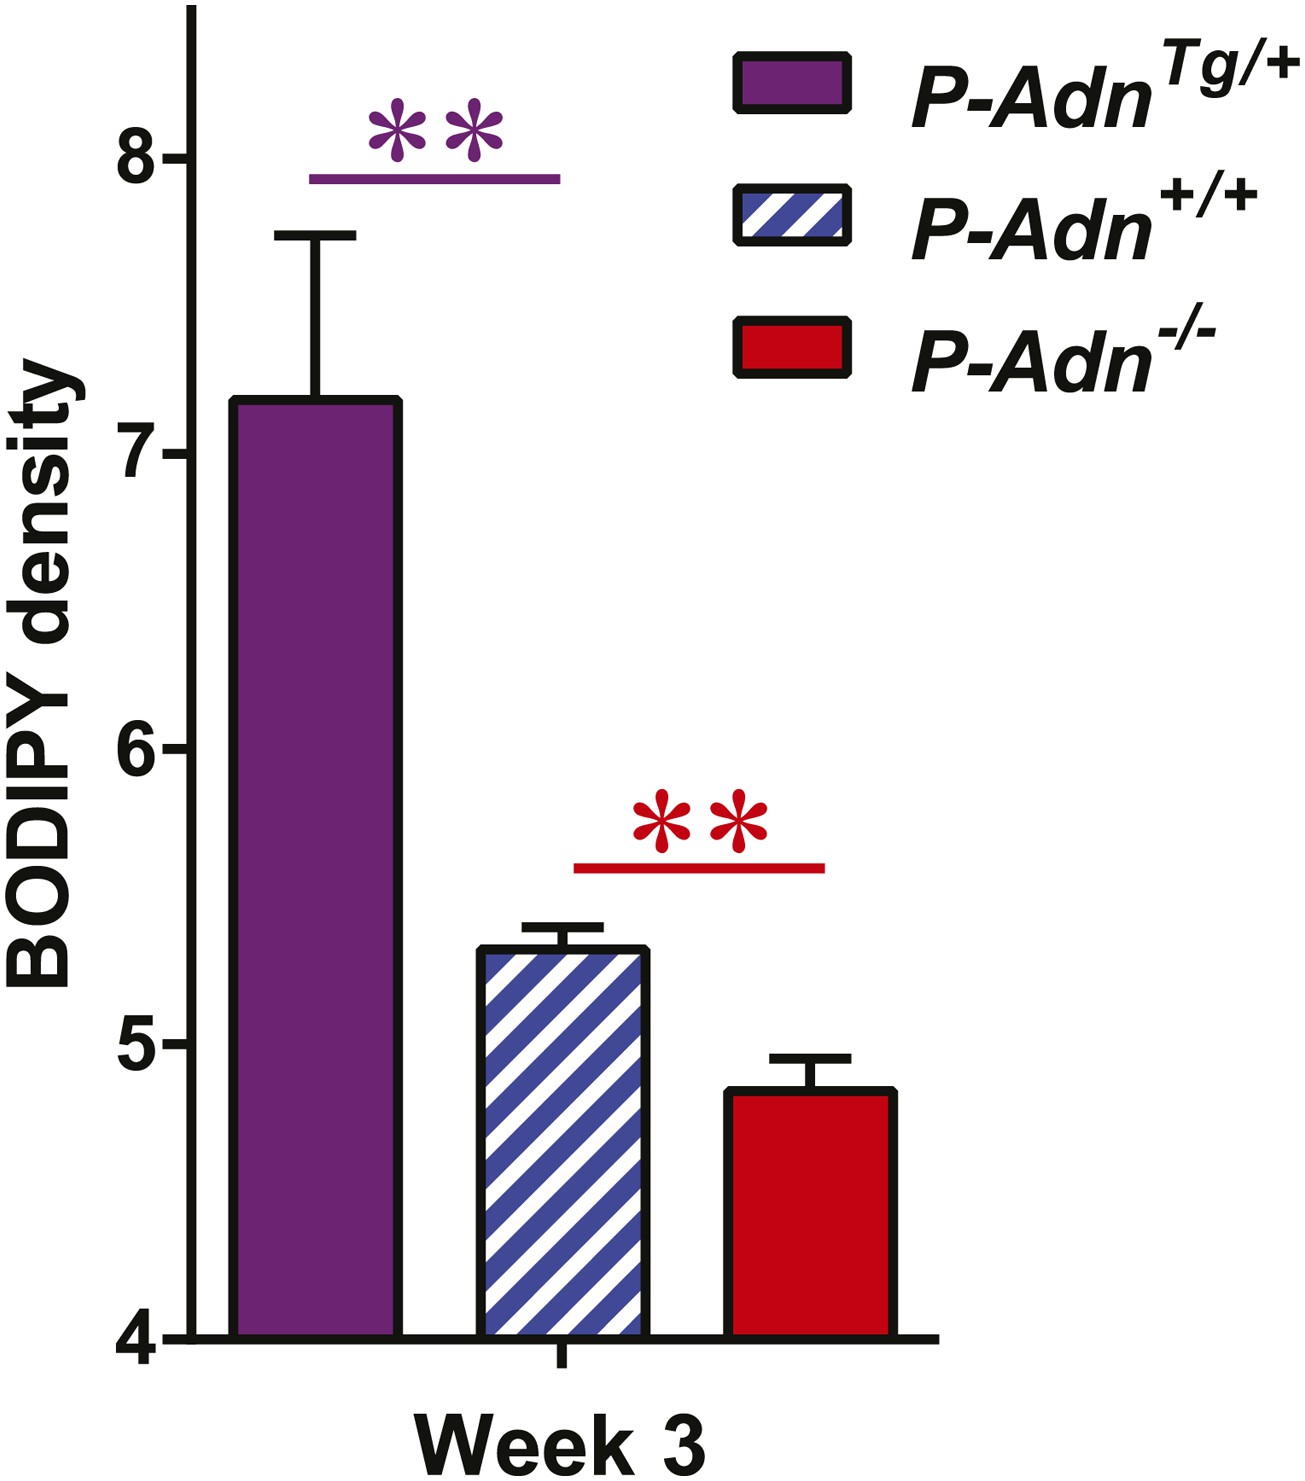
Quantitation of BODIPY signal in subcutaneous WAT.
Quantitation of BODIPY fluorescence intensity volume normalized against tissue area. n = 4 mice per phenotype. Data are presented as the mean ± SEM. **p < 0.01 vs P-Adn+/+. Related to Figure 3D.
Figure 3—figure supplement 3
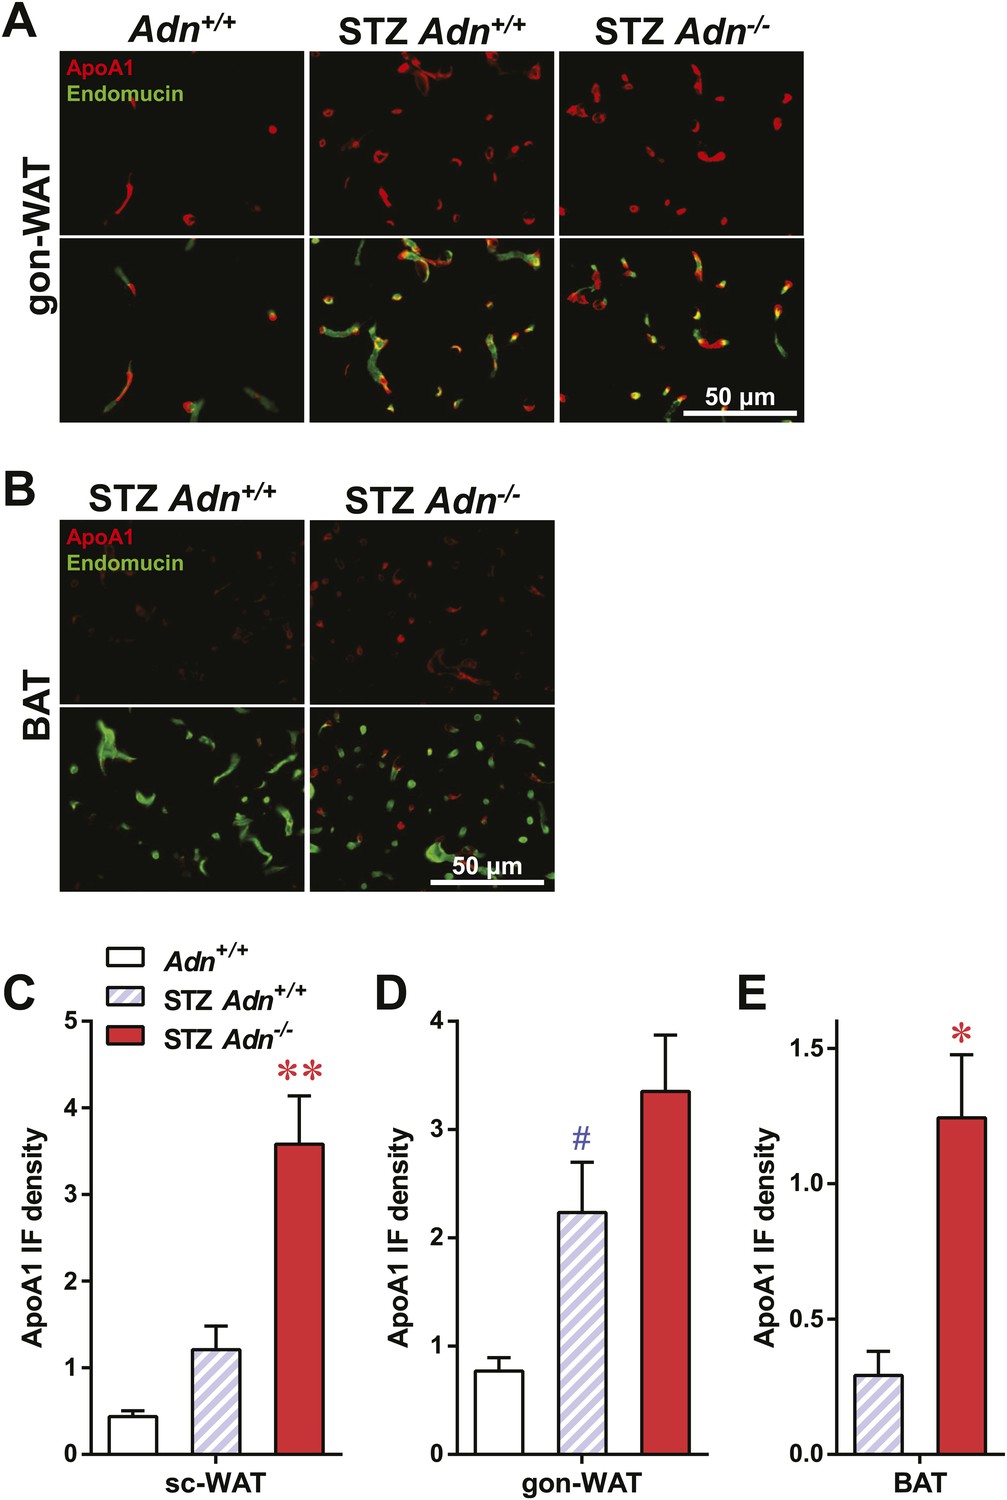
ApoA1 immunofluorescence in gonadal WAT and BAT with quantitation.
(A and B) Representative co-immunofluorescence of apolipoprotein A1 (ApoA1, red) and endomucin (green) on gonadal white adipose tissue (WAT, A) and brown adipose tissue (BAT, B). (C–E) Quantitation of ApoA1 immunofluorescence intensity volume normalized against tissue area in subcutaneous WAT (C), gonadal WAT (D), and BAT (E). n ≥ 3 mice per condition. Data are presented as the mean ± SEM. *p < 0.05, **p < 0.01 for STZ-treated Adn+/+ vs Adn−/−. #p < 0.05 for STZ-treated vs untreated Adn+/+. Related to Figure 3E.
Figure 3—figure supplement 4

ApoB immunofluorescence in gonadal WAT with quantitation.
(A) Representative co-immunofluorescence of apolipoprotein B (ApoB, red) and endomucin (green) on gonadal WAT. (B and C) Quantitation of ApoB immunofluorescence intensity volume normalized against tissue area in subcutaneous WAT (B) and gonadal WAT (C). n ≥ 3 mice per condition. Data are presented as the mean ± SEM. #p < 0.05, ##p < 0.01 for STZ-treated vs untreated Adn+/+. Related to Figure 3F.
Figure 3—figure supplement 5
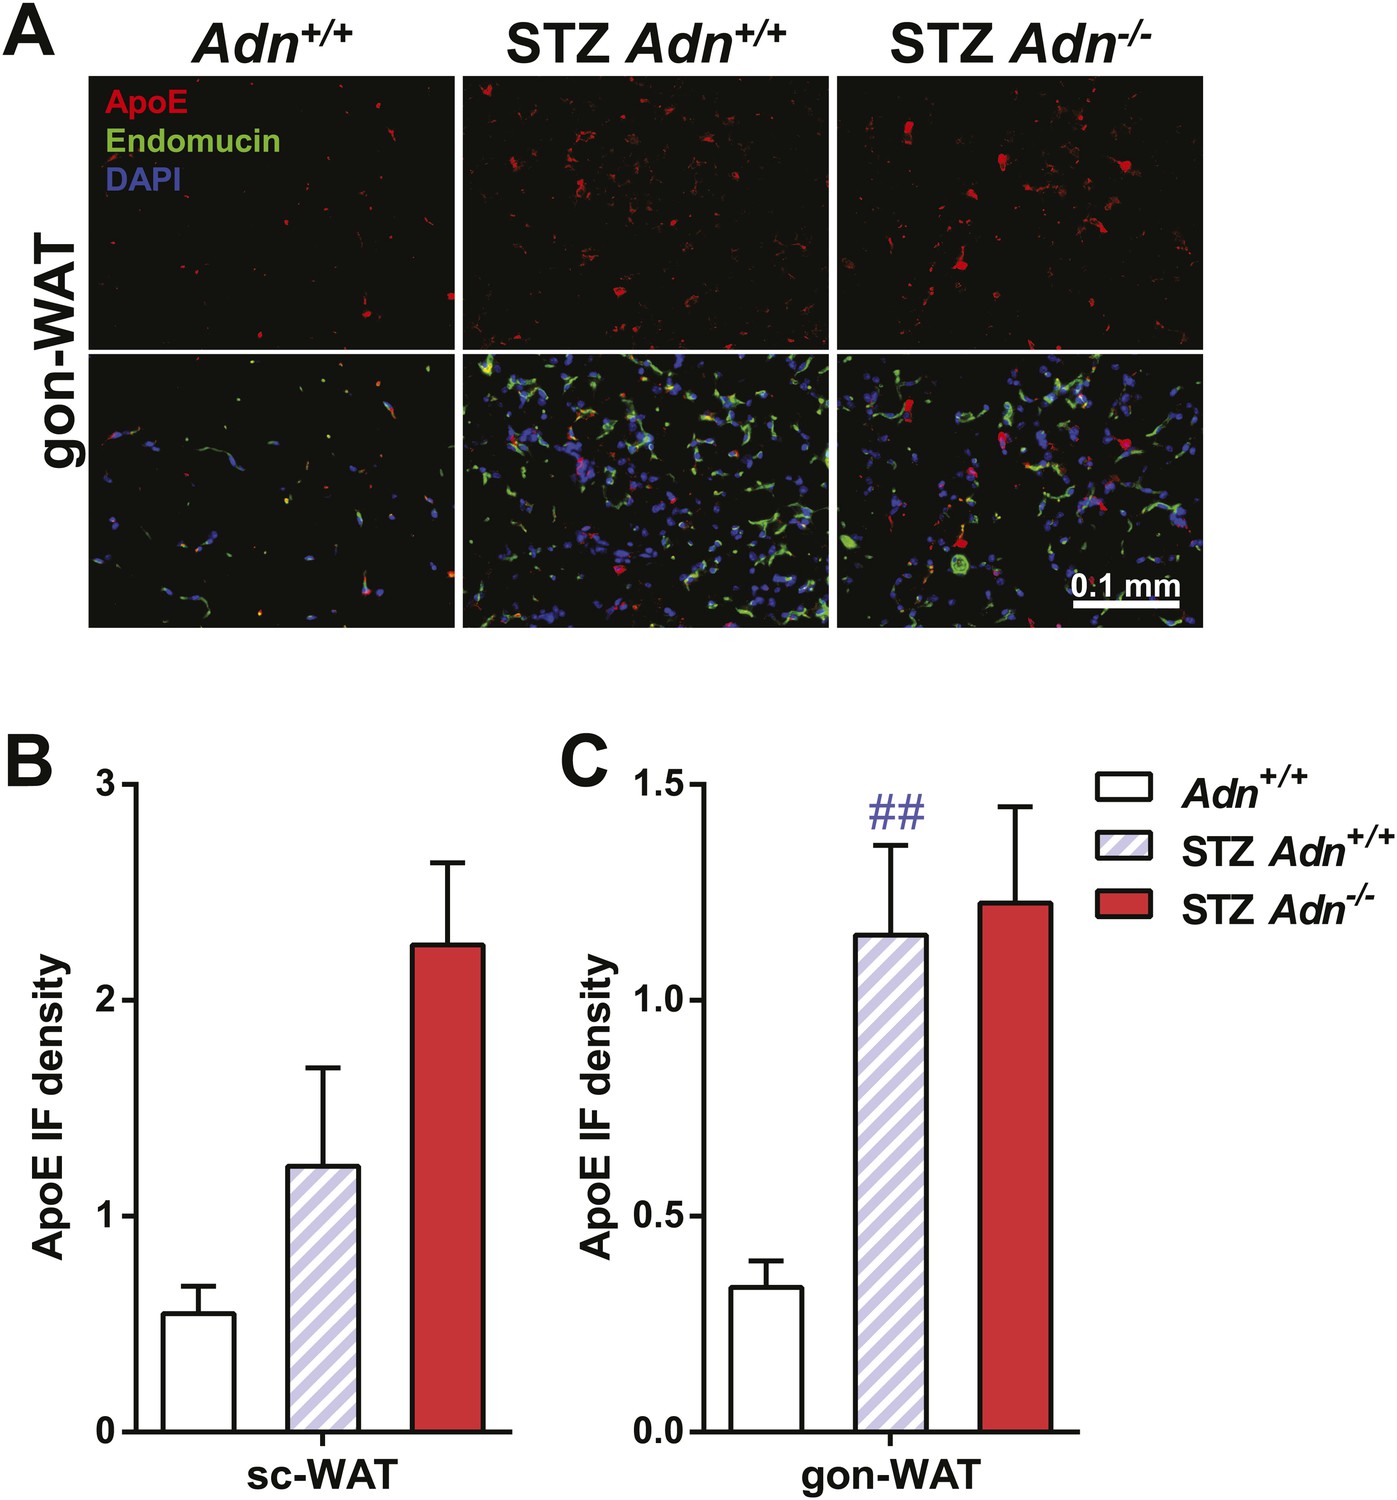
ApoE immunofluorescence in gonadal WAT with quantitation.
(A) Representative co-immunofluorescence of apolipoprotein E (ApoE, red) and endomucin (green) on gonadal WAT. (B and C) Quantitation of ApoE immunofluorescence intensity volume normalized against tissue area in subcutaneous WAT (B) and gonadal WAT (C). n ≥ 3 mice per condition. Data are presented as the mean ± SEM. ##p < 0.01 for STZ-treated vs untreated Adn+/+. Related to Figure 3G.
Figure 4 with 4 supplements
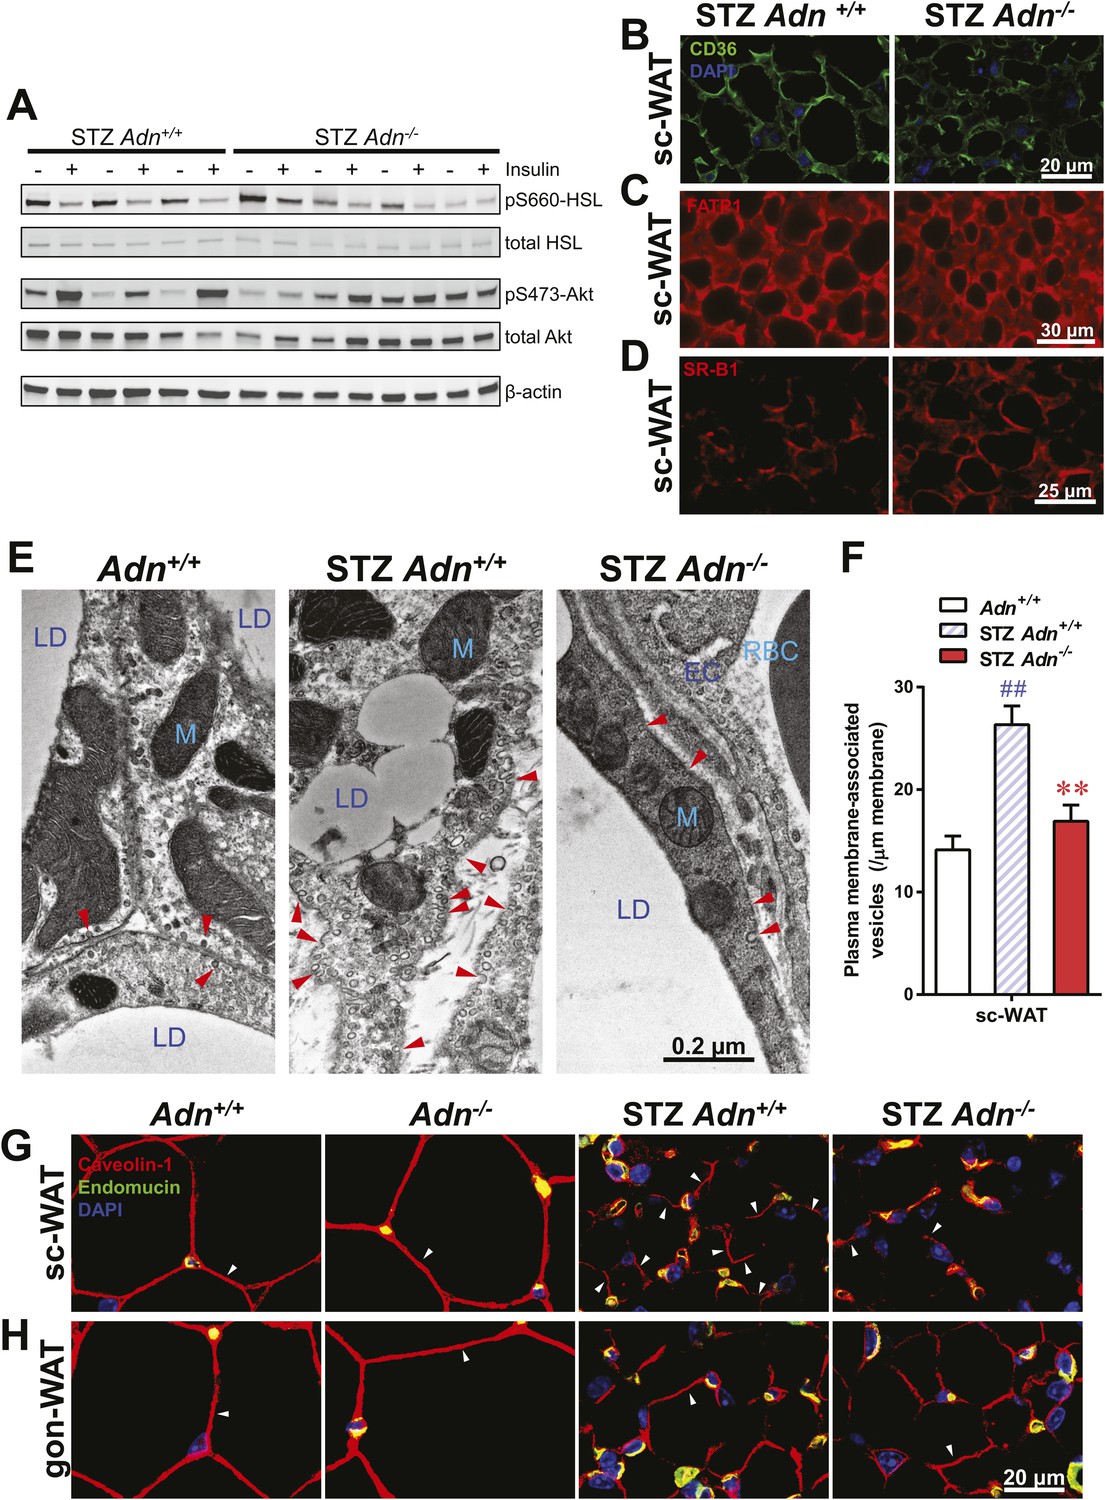
Adiponectin is important for caveolar structures and Caveolin-1 expression in subcutaneous white adipose tissue of STZ-treated mice.
(A) Western blots of insulin signaling molecules, hormone-sensitive lipase (HSL, serine 660 phosphorylated and total) and Akt (serine 473 phosphorylated and total) in inguinal subcutaneous WAT. 1 week after STZ treatment, overnight fasted mice were subjected to a tail vein injection of insulin (0.2 mU/g BDW). Every two adjacent lanes represent the paired fat pads from an individual mouse, before (−) or 5 min after (+) insulin injection. (B–D) Representative immunofluorescence of CD36 (B), fatty acid transport protein 1 (FATP1) (C), and HDL receptor SR-B1 (D) on subcutaneous WAT of STZ-treated mice. (E and F) Transmission electron microscopy of subcutaneous white adipocytes. Vesicles <10 nm from the plasma membrane were defined as ‘PM associated’. (E) Representative fields of adipocyte plasma membranes. LD: lipid droplet. M: mitochondrion. EC: endothelial cell. RBC: red blood cell. Arrowheads: examples of vesicles associating with plasma membrane. (F) Quantitation of plasma membrane-associated vesicles normalized against membrane length. n ≥ 17 fields per condition. (G and H) Representative confocal co-immunofluorescence of caveolin-1 (red) and endomucin (green) on subcutaneous (G) and gonadal (H) WAT. Arrowheads: examples of caveolin-1 signal on adipocytes. Data are presented as the mean ± SEM. **p < 0.01 for Adn−/− vs Adn+/+ after STZ treatment. ##p < 0.01 for STZ-treated vs untreated Adn+/+.
Figure 4—figure supplement 1
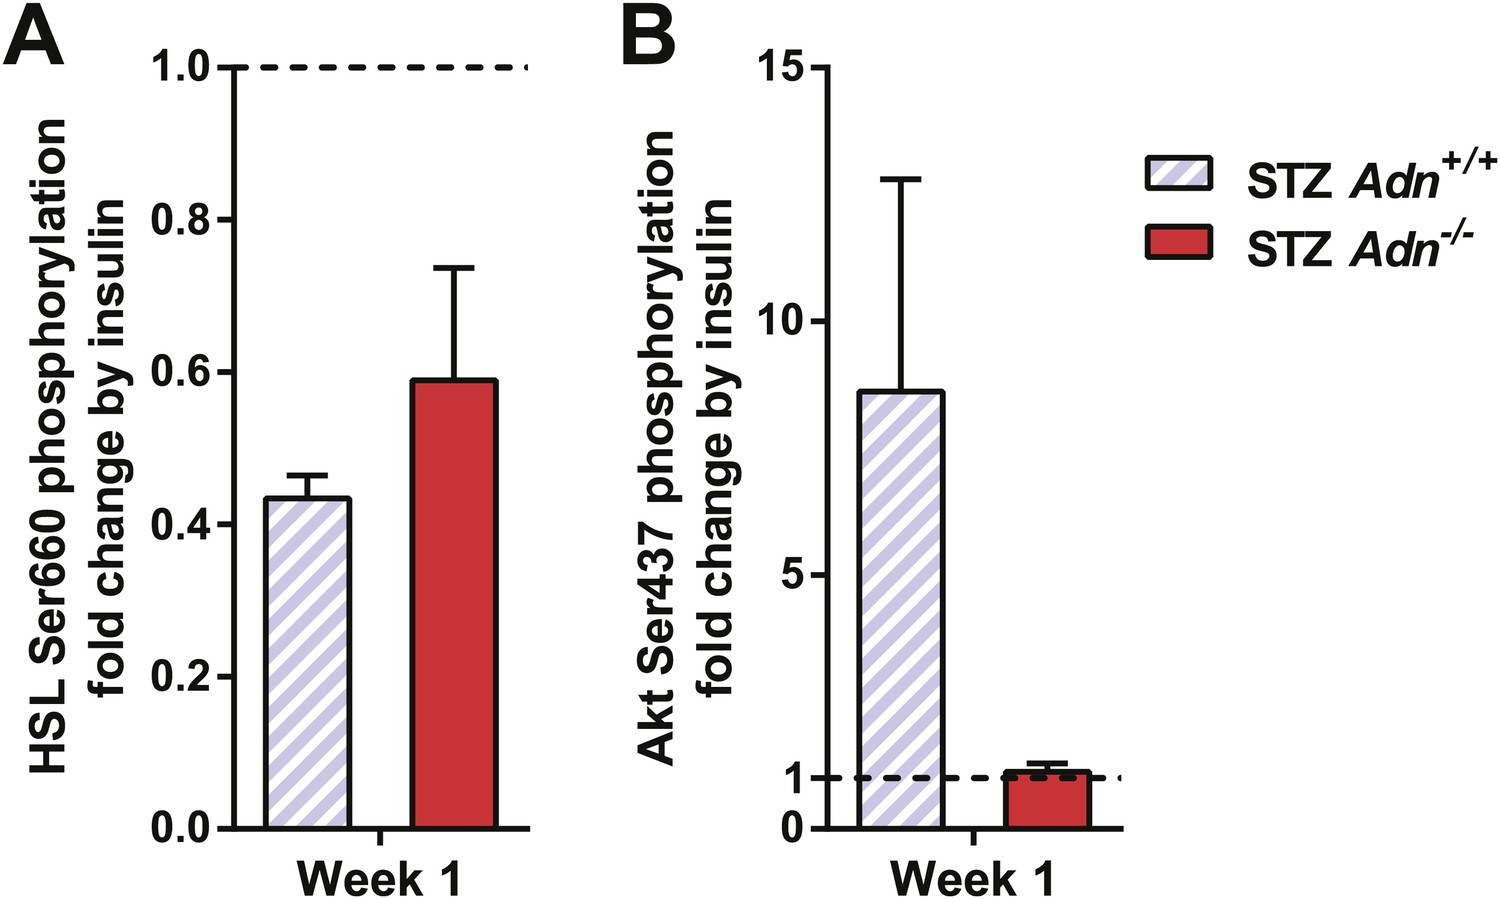
Quantitation of insulin effect on phosphorylation of HSL and Akt.
Western blots were quantitated for infrared signal volume subtracting local background. Phosphorylated HSL (A) and Akt (B) were first normalized against the corresponding total protein. The insulin effect on phosphorylation was then calculated by normalizing the insulin-stimulated samples against their corresponding ones before insulin treatment. Data are presented as the mean ± SEM. Related to Figure 4A.
Figure 4—figure supplement 2
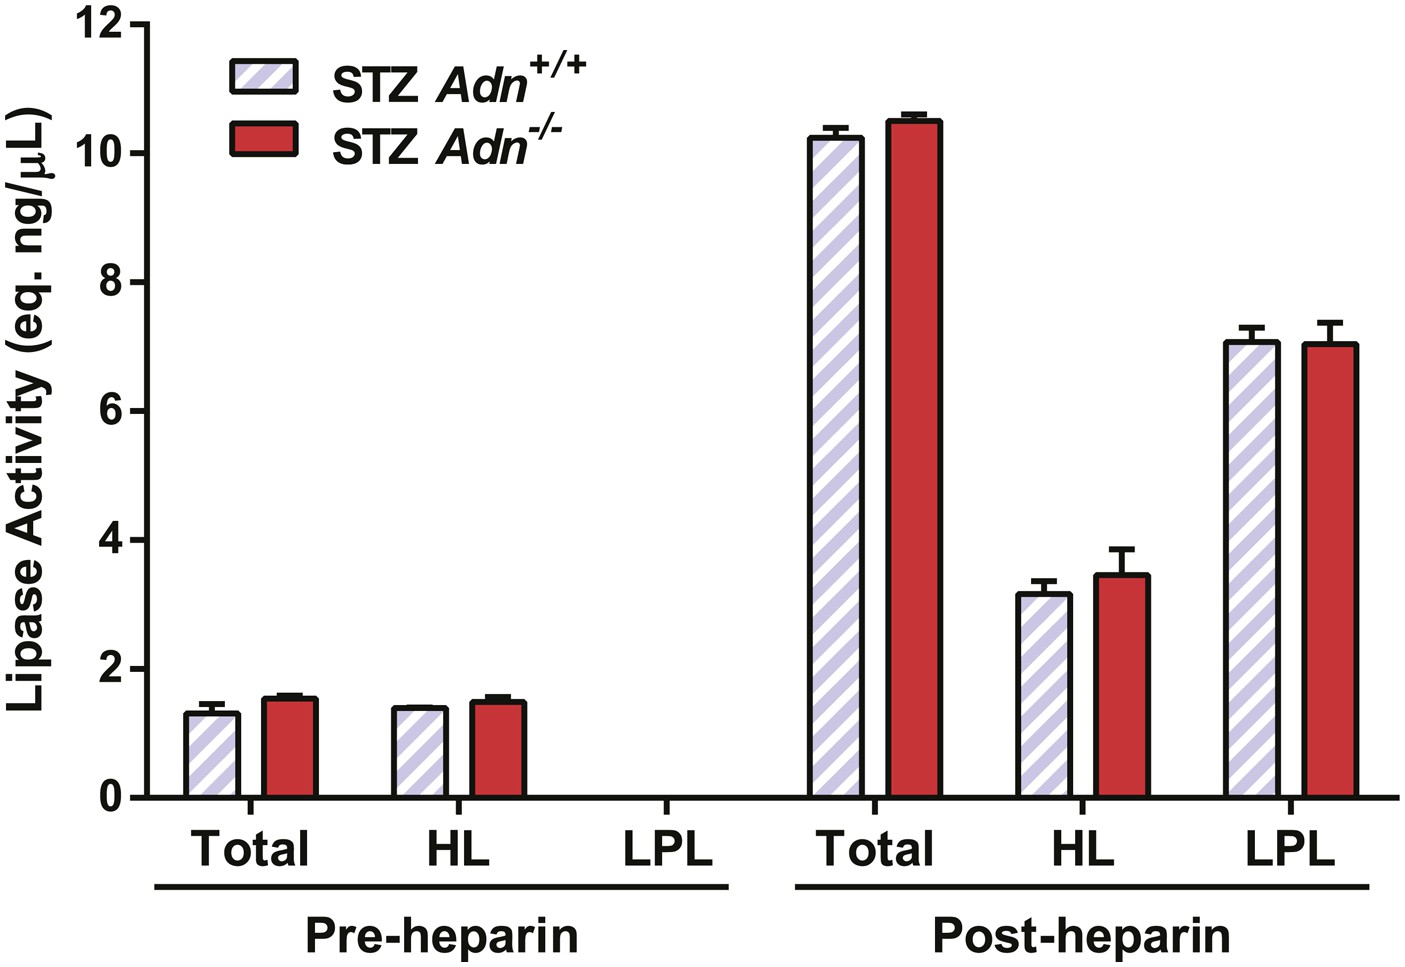
Lipoprotein lipase activity.
Pre- and post-heparin plasma was collected from STZ-treated mice and assayed for total and hepatic lipase activity, which difference was calculated as activity from lipoprotein lipase. n = 3 mice per genotype, and assay was triplicated per sample.
Figure 4—figure supplement 3
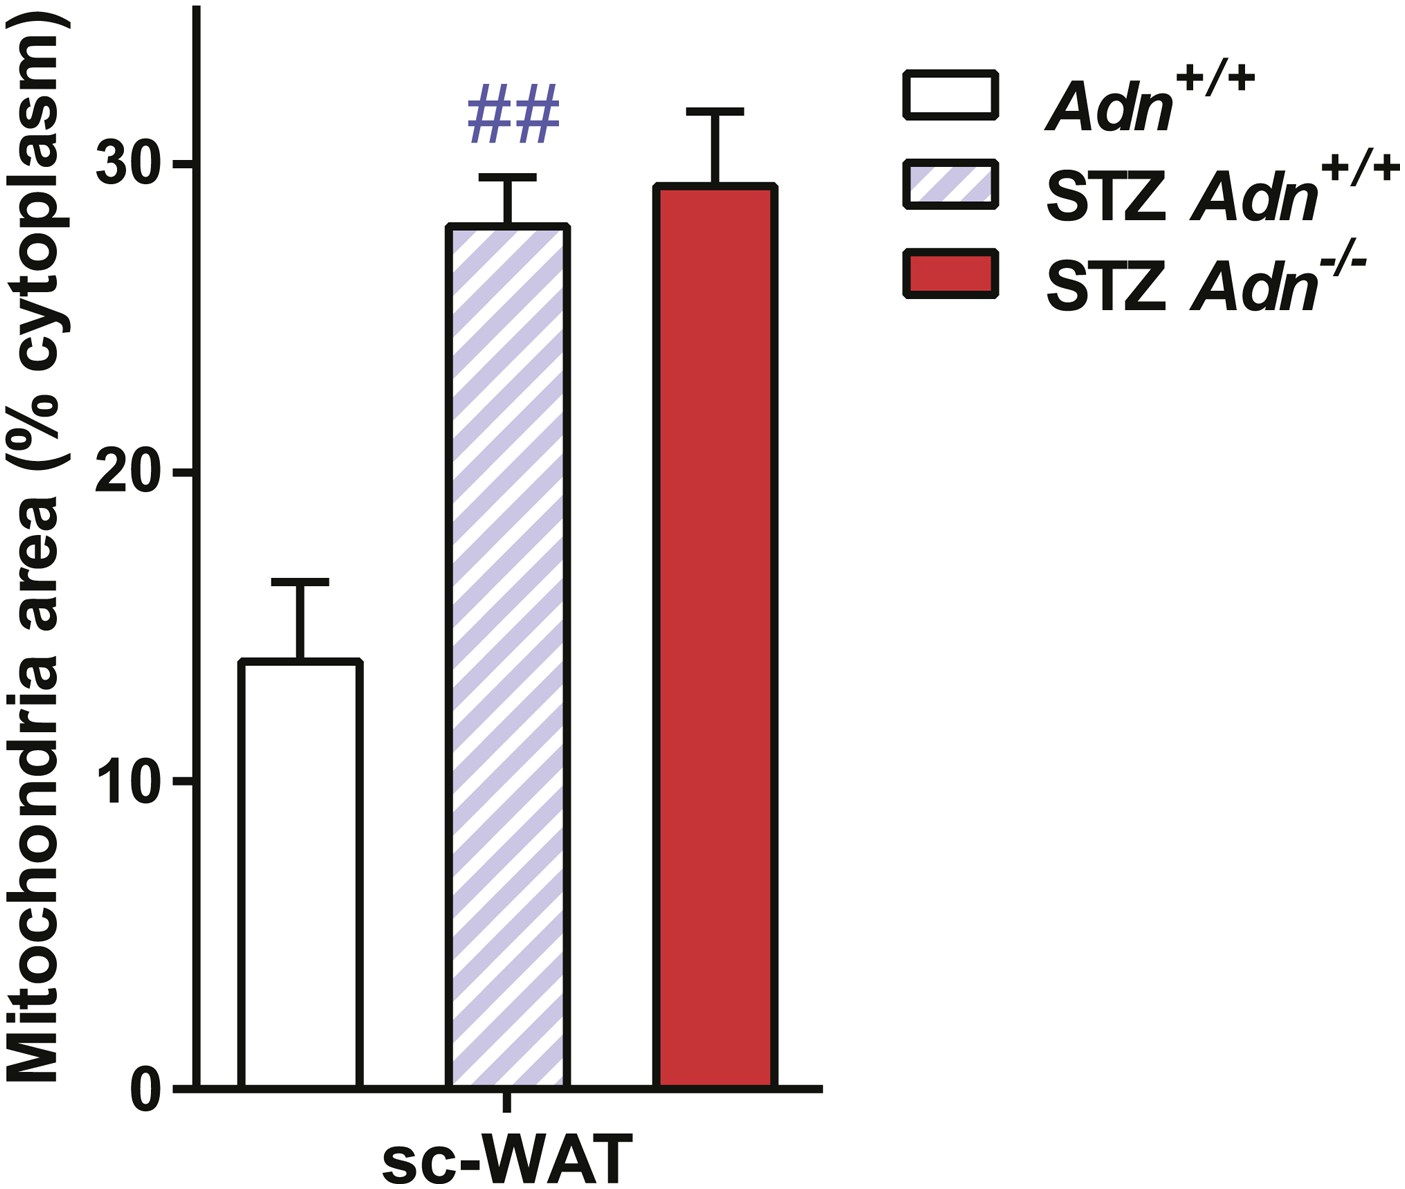
Quantitation of mitochondrial density on electron microscopic images.
Quantitation of cellular mitochondrial areas, normalized against areas of cytoplasm excluding lipid droplets. n ≥ 7 cells per condition. Data are presented as the mean ± SEM. ##p < 0.01 for STZ-treated vs untreated Adn+/+. Related to Figure 4E.
Figure 4—figure supplement 4
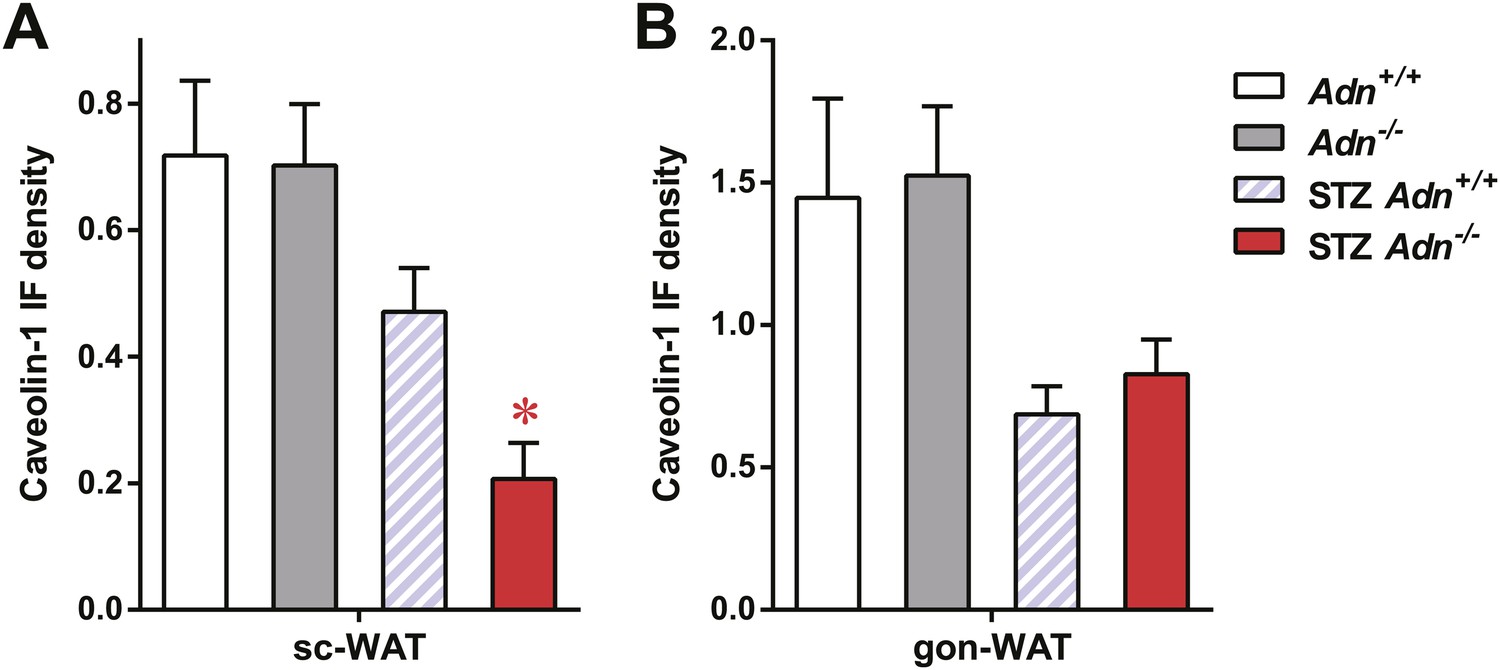
Quantitation of caveolin-1 immunofluorescence.
Quantitation of caveolin-1 immunofluorescence signal not related to endomucin signal in subcutaneous WAT (A) and gonadal WAT (B). n ≥ 3 mice per condition. Data are presented as the mean ± SEM. *p < 0.05 for Adn+/+ vs Adn−/−. Related to Figure 3G,H.
Figure 5 with 2 supplements
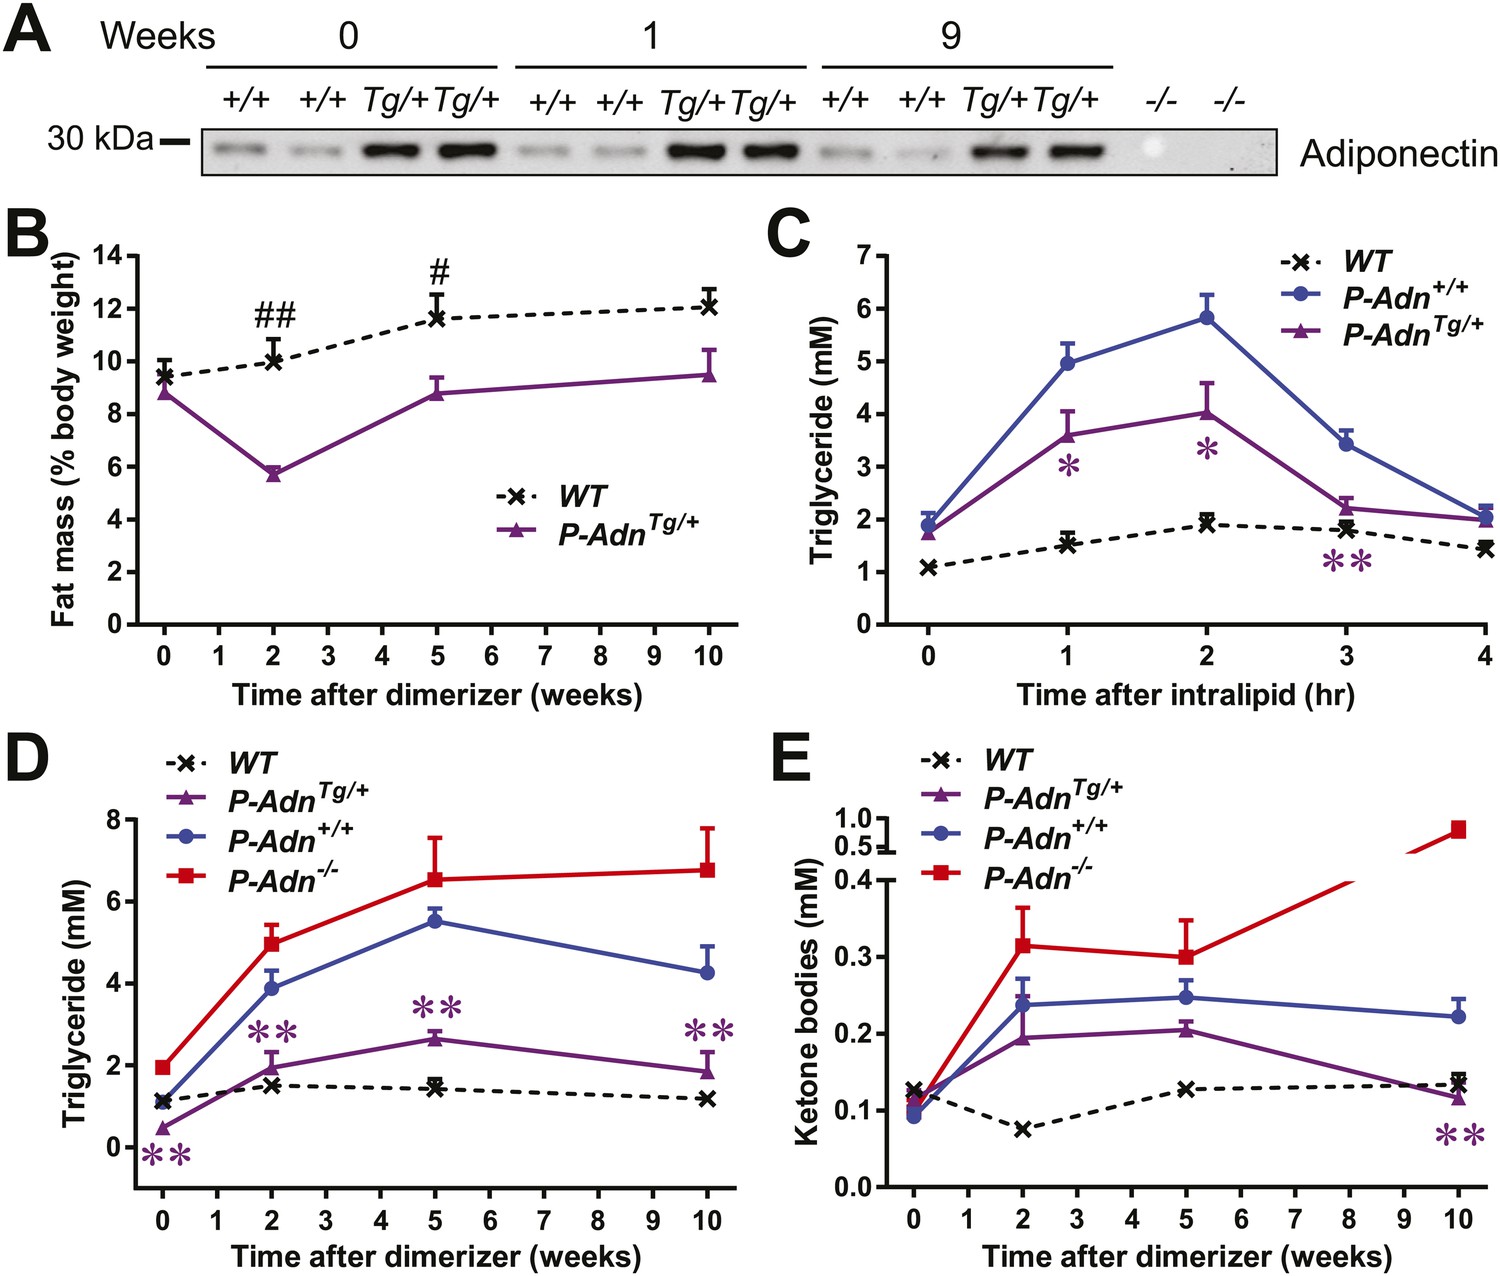
Adiponectin improves systemic lipid metabolism in PANIC-ATTAC mice.
(A) Serum samples were collected from P-Adn+/+ (+/+) and P-AdnTg/+ (Tg/+) mice, 0, 1, and 9 weeks after initial dimerizer treatment and subjected to Western blotting for adiponectin. Equal volume of serum was loaded for each lane. Serum samples from adiponectin knockout mice (−/−) were included as negative controls. (B) Fat mass presented as percentage of mouse body weight (BDW). (C) Blood triglyceride during oral triglyceride tolerance test in mice 2 weeks after initial dimerizer treatment. (D and E) Plasma triglyceride (D) and total ketone bodies (E) in mice under fed status. Data of WT, P-Adn+/+, and P-Adn−/− at week 10 were presented in Figure 1G,H. For B to E, n ≥ 5 mice per condition. Data are presented as the mean ± SEM. *p < 0.05, **p < 0.01 for P-AdnTg/+ vs P-Adn+/+. #p < 0.05, ##p < 0.01 for WT vs P-AdnTg/+.
Figure 5—figure supplement 1
Body composition of PANIC-ATTAC mice.
Fat mass (A) and lean mass (B) at 0, 2, 5, 10 weeks after initial dimerizer treatment. n ≥ 6 mice per condition. Data are presented as the mean ± SEM. #p < 0.05, ##p < 0.01 for P-AdnTg/+ vs WT. Related to Figure 5B.
Figure 5—figure supplement 2
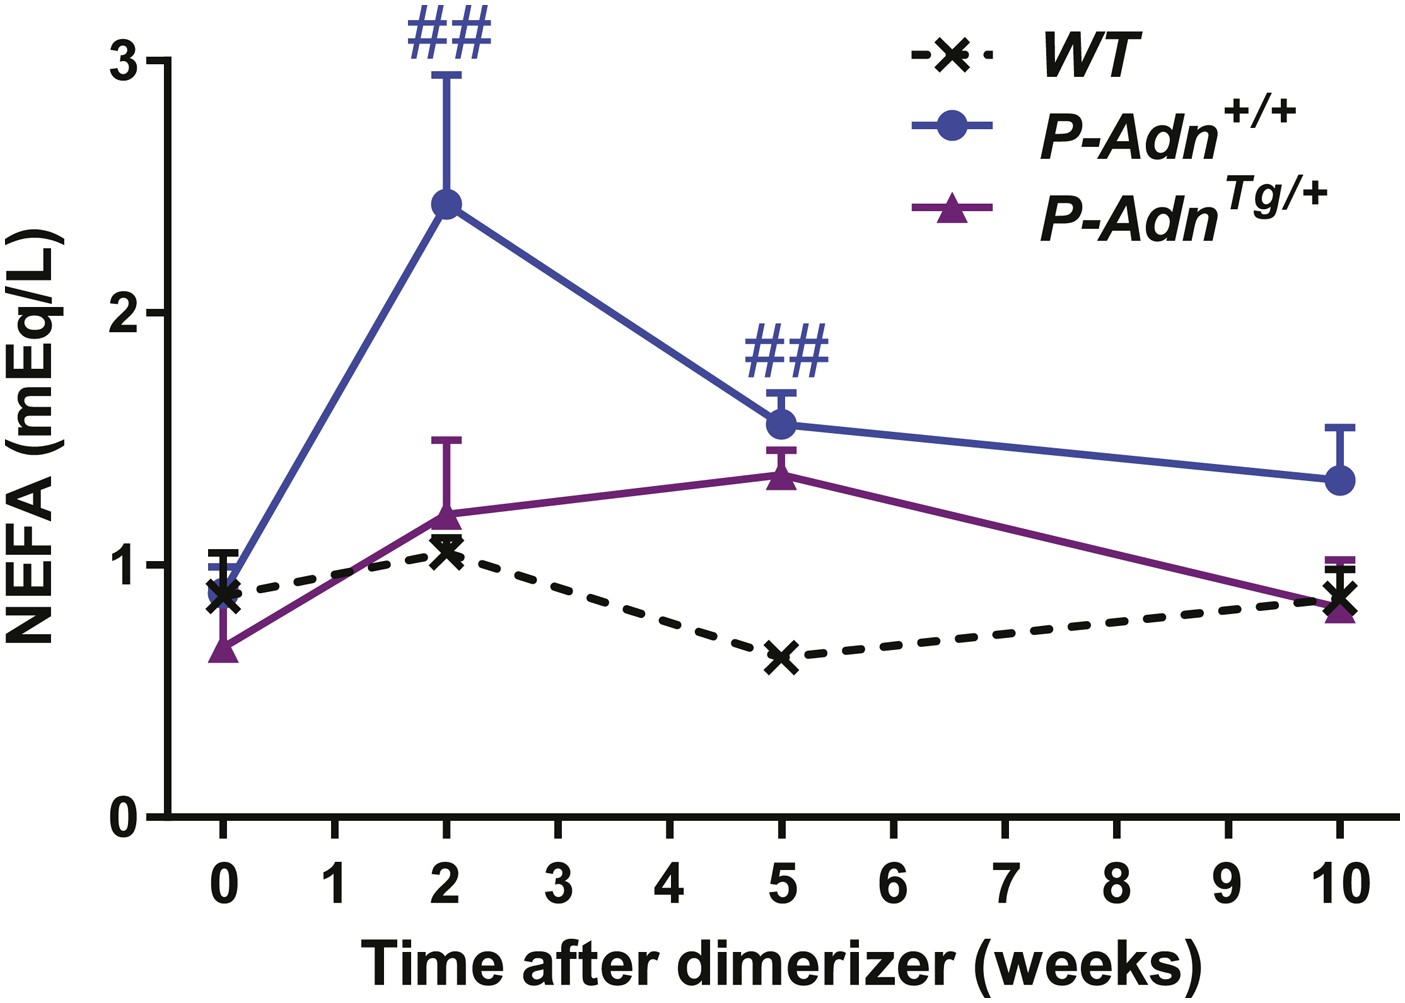
Fed NEFA levels in PANIC-ATTAC Mice.
Serum non-esterified fatty acid (NEFA) levels in mice under fed status. n = 4–13 mice per condition. Data are presented as the mean ± SEM. ##p < 0.01 for P-Adn+/+ vs WT.
Figure 6
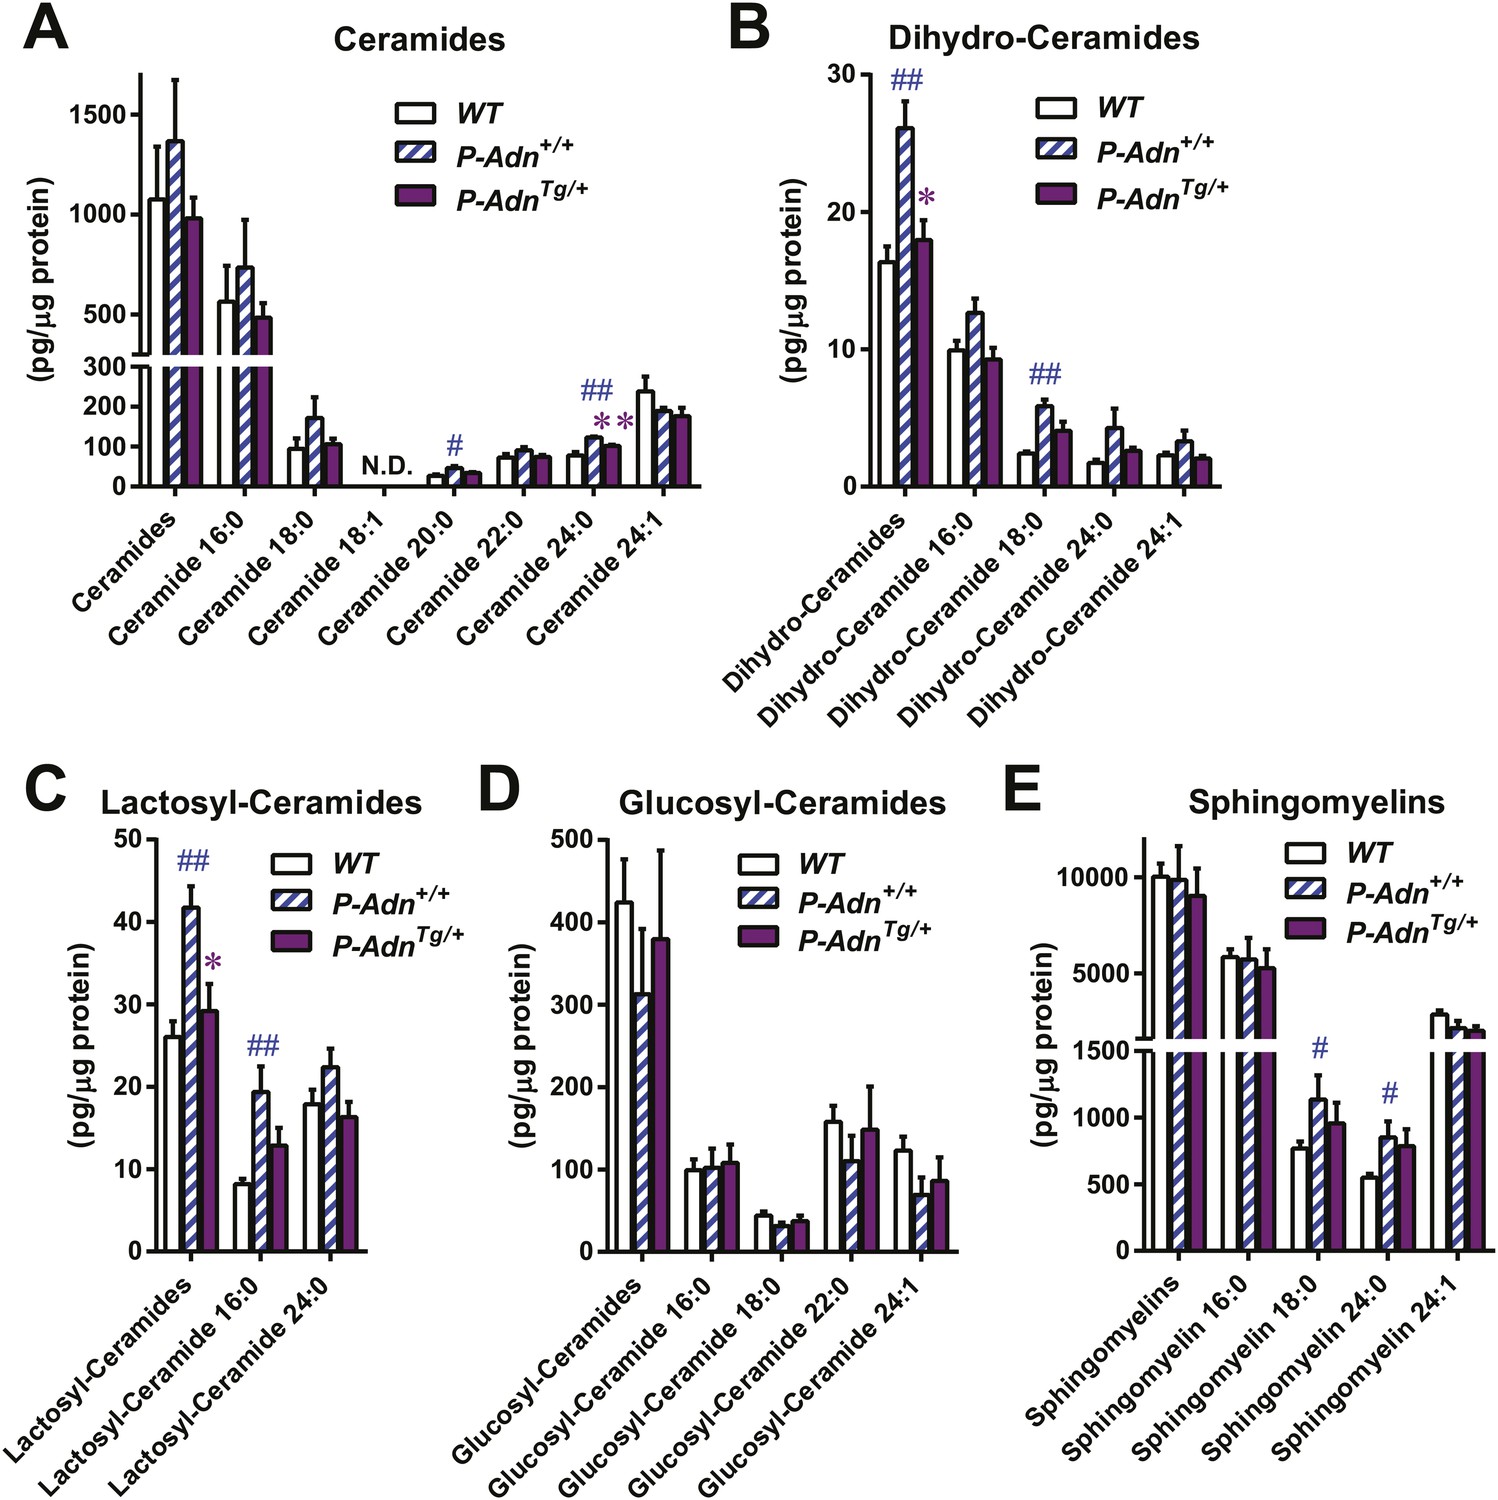
Adiponectin reduces lipotoxic sphingolipids in regenerating PANIC-ATTAC islets.
Sphingolipids were assayed by mass spectrometry in pancreatic islets isolated from mice 5 weeks after initial dimerizer treatment and normalized against protein content of islet samples. n = 3–5 samples per genotype. Sphingolipid species are categorized as (A) ceramides, (B) dihydro-ceramides, (C) lactosyl-ceramides, (D) glucosyl-ceramides, and (E) sphingomyelins. In every panel, the first group of columns from the left represents the sums of all species combined. Data are presented as the mean ± SEM. *p < 0.05, **p < 0.01 for P-AdnTg/+ vs P-Adn+/+. ##p < 0.01 for P-Adn+/+ vs WT. N.D.: not detected.
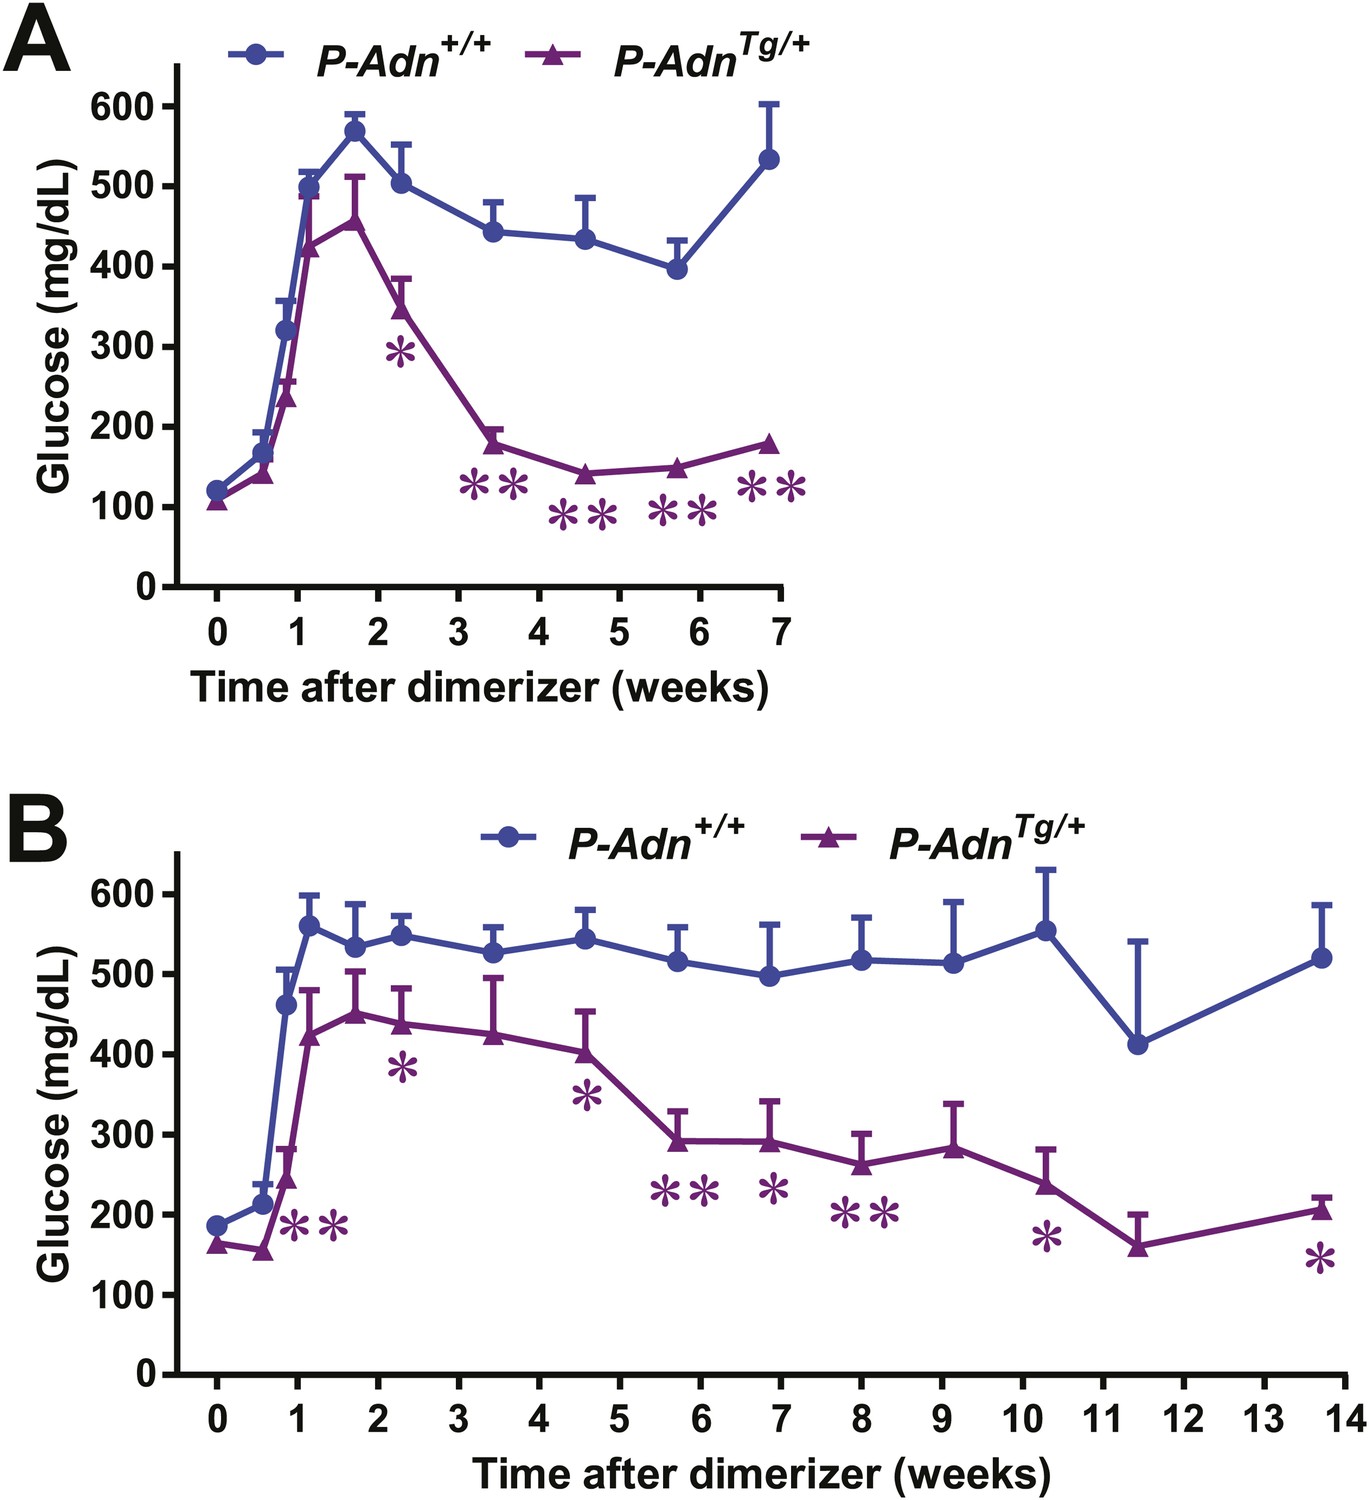
Figure 7 with 5 supplements
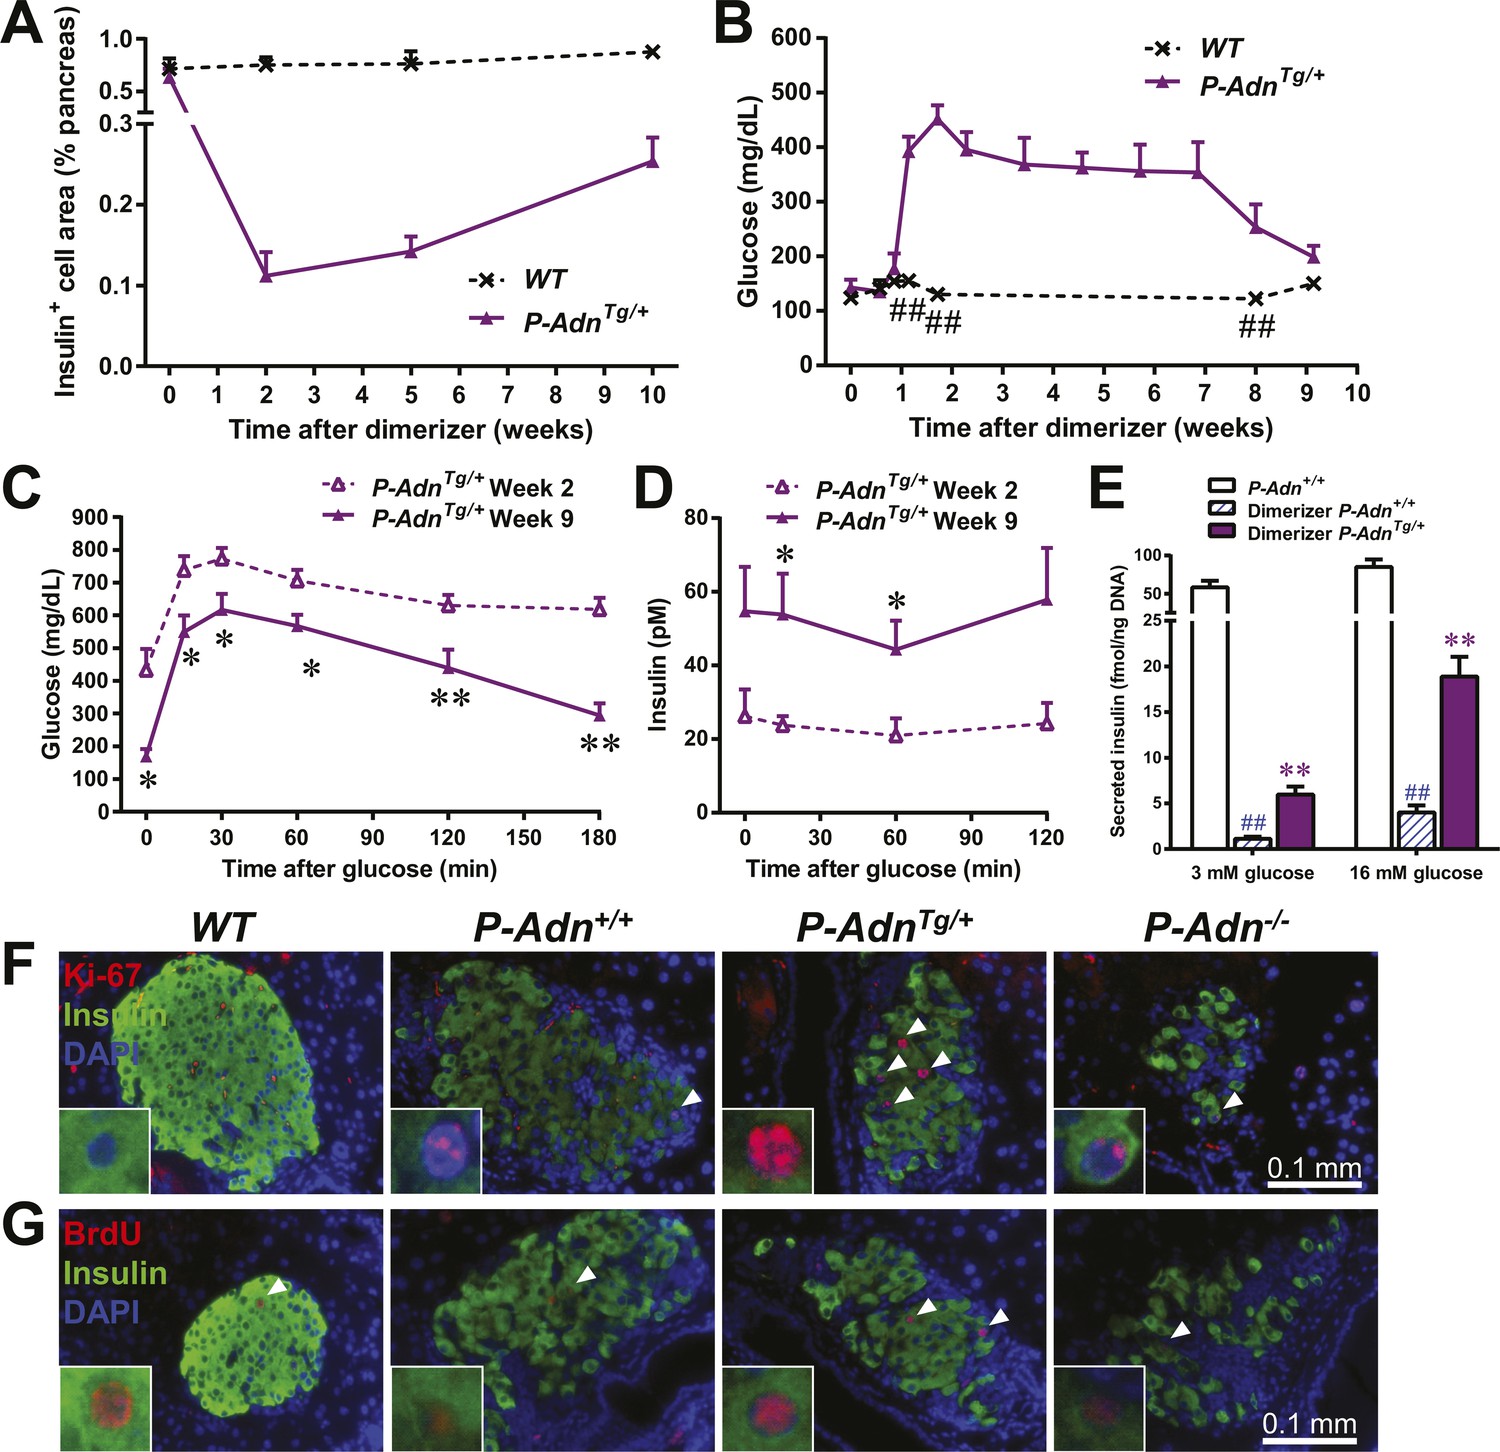
Adiponectin promotes β-cell recovery in PANIC-ATTAC mice.
(A) Quantitation of insulin-immunostained cell area normalized to total pancreas area. n = 3–7 mice per condition. Source files are available in Figure 7—source data 1. (B) Fasting blood glucose. n ≥ 5 mice per condition. ##p < 0.01. (C and D) At 2 and 9 weeks after initial dimerizer treatment, P-AdnTg/+ were subjected to an oral glucose tolerance test. Plasma glucose (C) and insulin (D) were determined. n ≥ 5 mice per condition. *p < 0.05, **p < 0.01. (E) Pancreatic islets were isolated from dimerizer-treated P-Adn+/+ and P-AdnTg/+ mice at the recovery stage, with untreated P-Adn+/+ mice as controls. Insulin secretion from islets under basal (3 mM) or stimulating (16 mM) glucose concentrations was measured and normalized against the DNA content of islets. n = 3–8 samples per condition. **p < 0.01 for dimerizer-treated P-Adn+/+ vs P-AdnTg/+. ##p < 0.01 for dimerizer-treated vs untreated P-Adn+/+. (F and G) Representative immunofluorescence (red) of Ki-67 (F) and BrdU (G) stains in pancreatic islets of mice 5 weeks after initial dimerizer treatment, merged with insulin (green) and DAPI (blue). Arrowheads: Ki-67+ Insulin+ (F) or BrdU+ Insulin+ (G) cells. Insets: representative nuclear signal (purple). For BrdU incorporation, mice were subjected to an i.p. injection of BrdU at the dose of 100 μg/g BDW 6 hr before sacrifice and tissue processing. Data are presented as the mean ± SEM.
-
Figure 7—source data 1
Source files for insulin-positive cell area quantitation.
The zip file contains all the 2400-dpi scanned images of insulin-immunostained pancreas sections used for quantitation of insulin-positive cell area. Insulin is stained as brown, and the whole section is counterstained as blue with hematoxylin. Folders are named after genotypes (WT or P-AdnTg+) and subfolders after time points (week 0, 2, 5, or 10) post initial dimerizer administration. Related to Figure 7A.
- https://doi.org/10.7554/eLife.03851.031
Figure 7—figure supplement 1
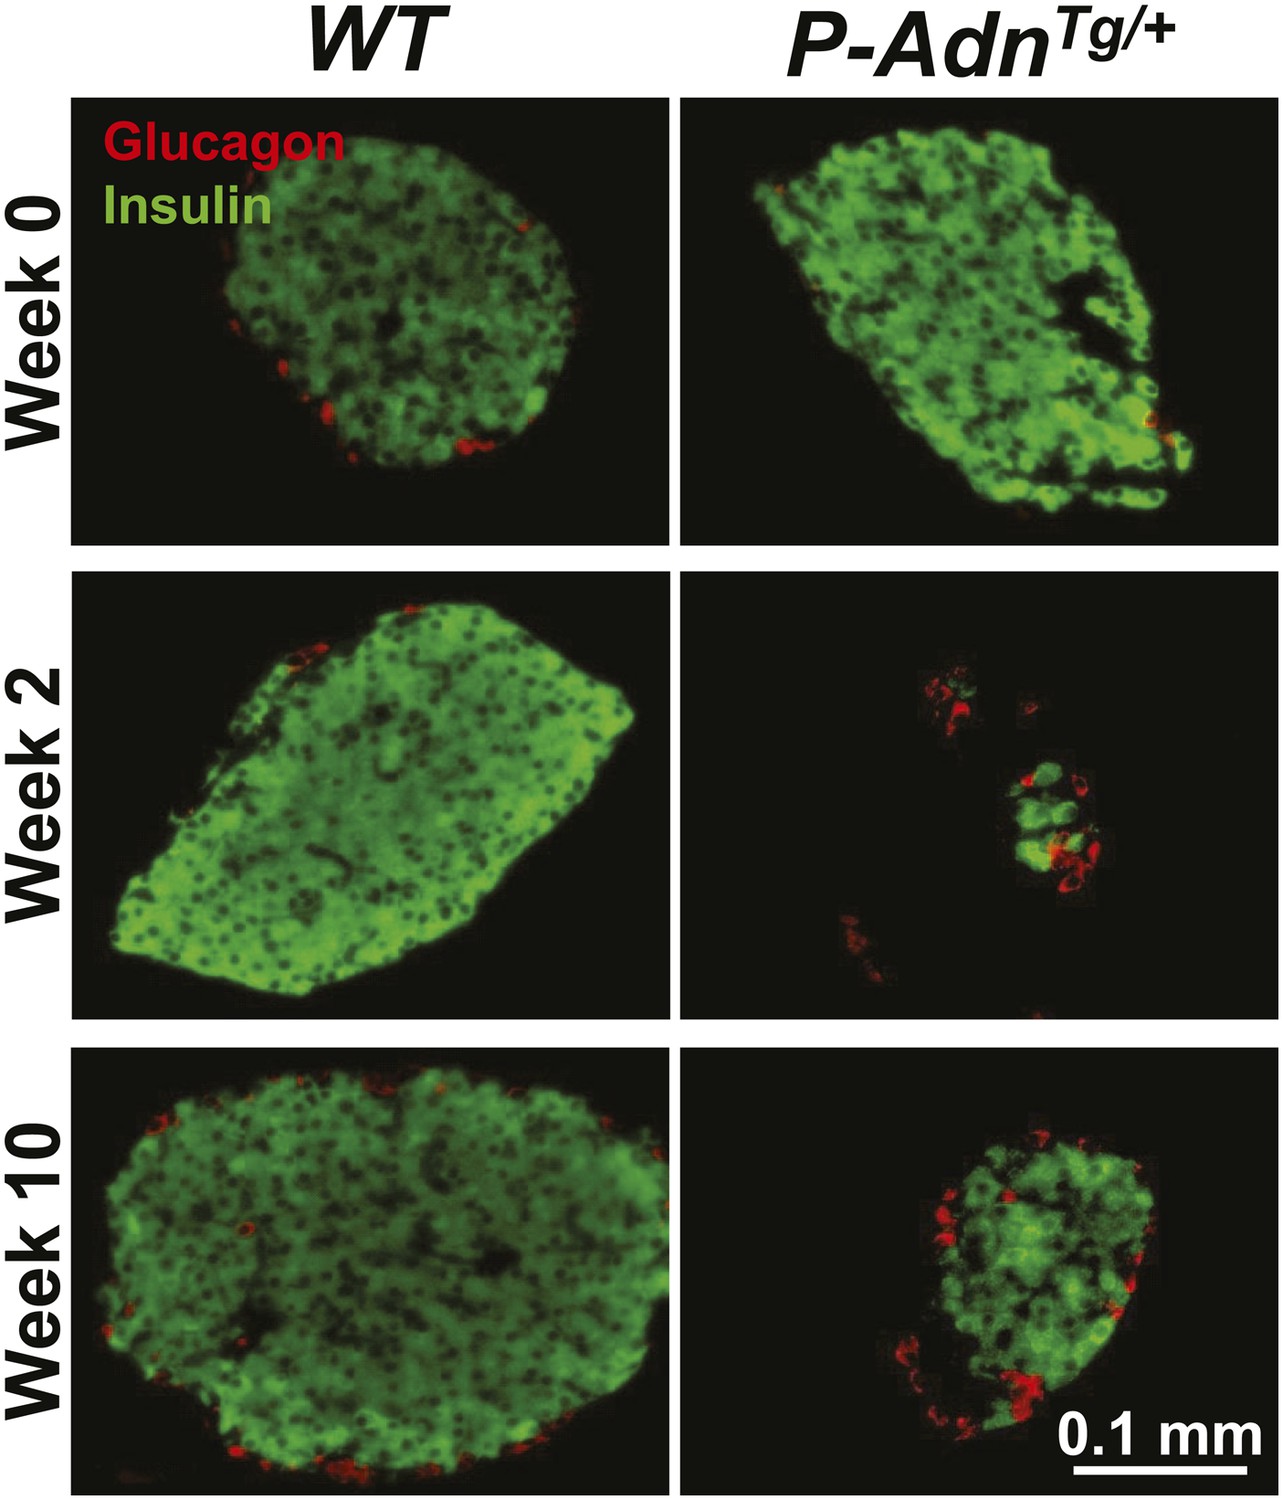
Adiponectin promotes β-cell recovery in PANIC-ATTAC mice.
Representative immunofluorescence of glucagon (red) and insulin (green) on pancreatic islets from WT and P-AdnTg/+ mice at 0, 2, and 10 weeks after dimerizer treatment. Related to Figure 7A.
Figure 7—figure supplement 2
Adiponectin restores glycemic control in female and aged PANIC-ATTAC mice.
Dimerizer treatment was applied to 2-month old females (n = 4–6 mice per condition) (A) and 1.5-year old males (n = 3–11 mice per condition) (B). Fasting blood glucose was measured. Data are presented as the mean ± SEM. *p < 0.05, **p < 0.01. Related to Figure 7B.
Figure 7—figure supplement 3
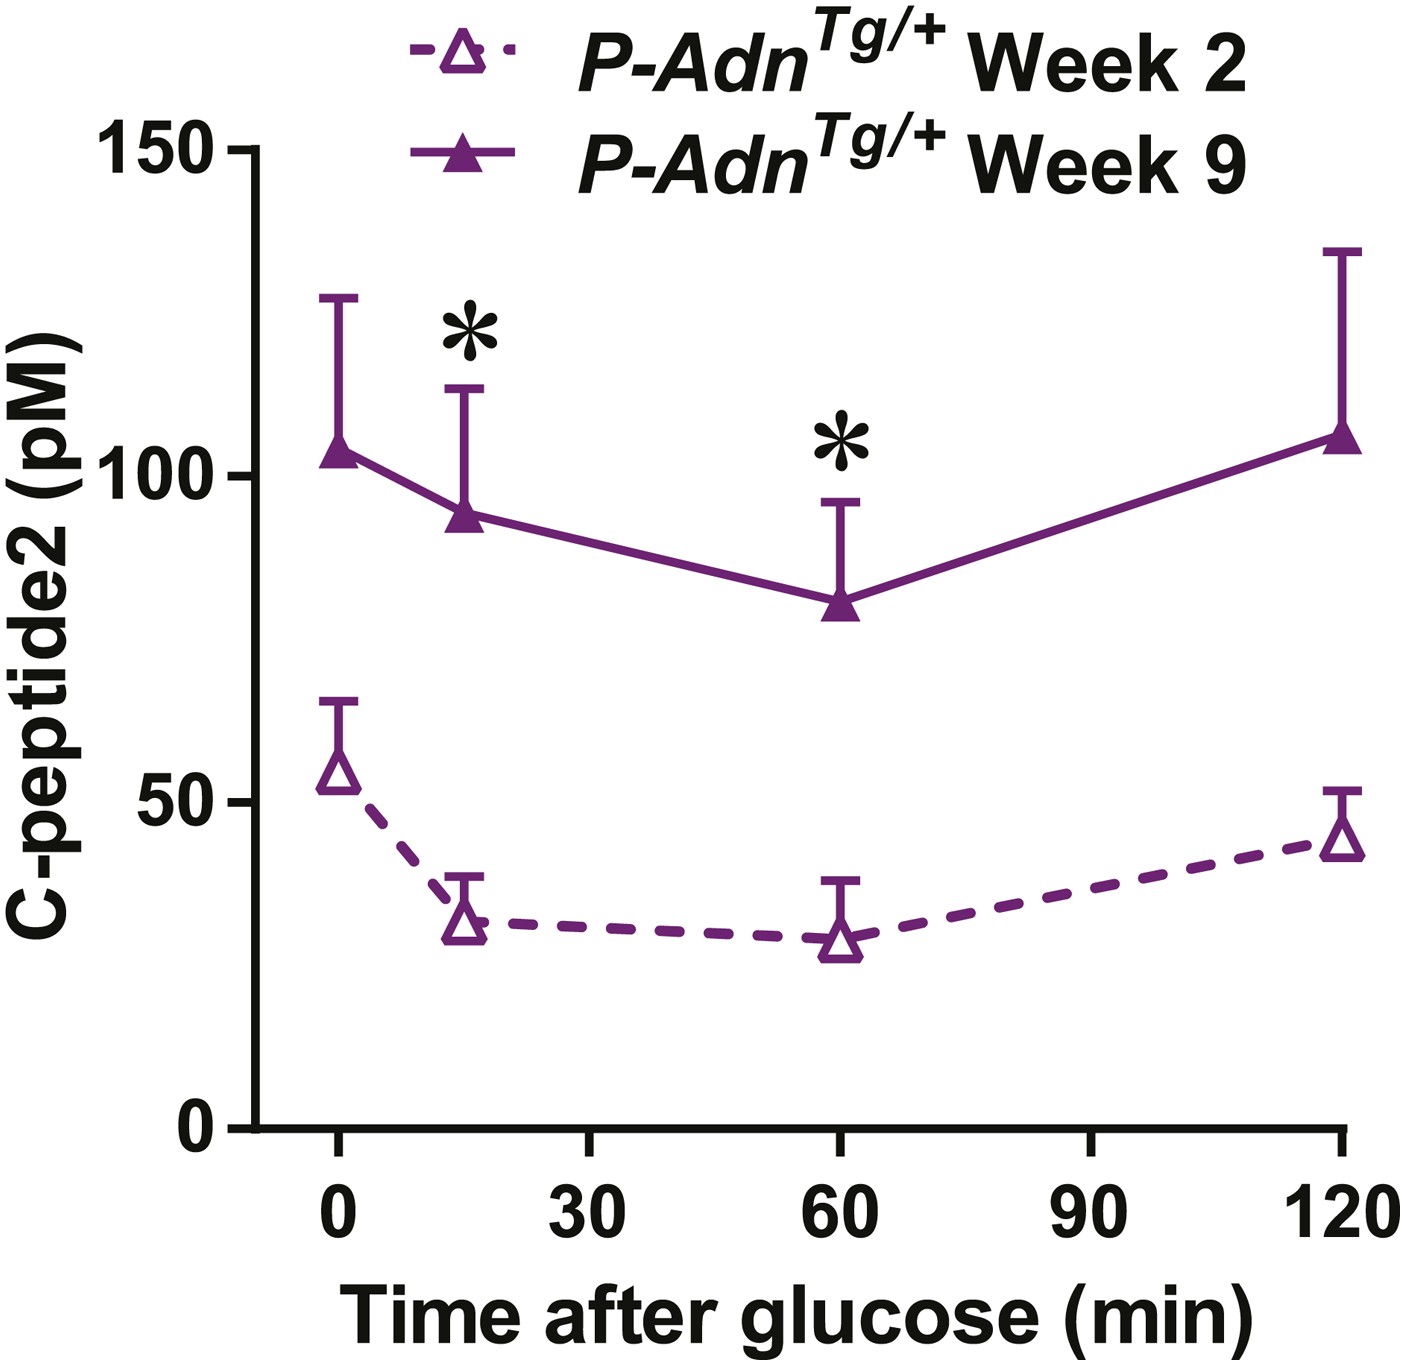
Adiponectin enhances in vivo GSIS in PANIC-ATTAC mice.
Plasma C-peptide2 levels during oral glucose tolerance tests. Data are presented as the mean ± SEM. *p < 0.05. Related to Figure 7C,D.
Figure 7—figure supplement 4
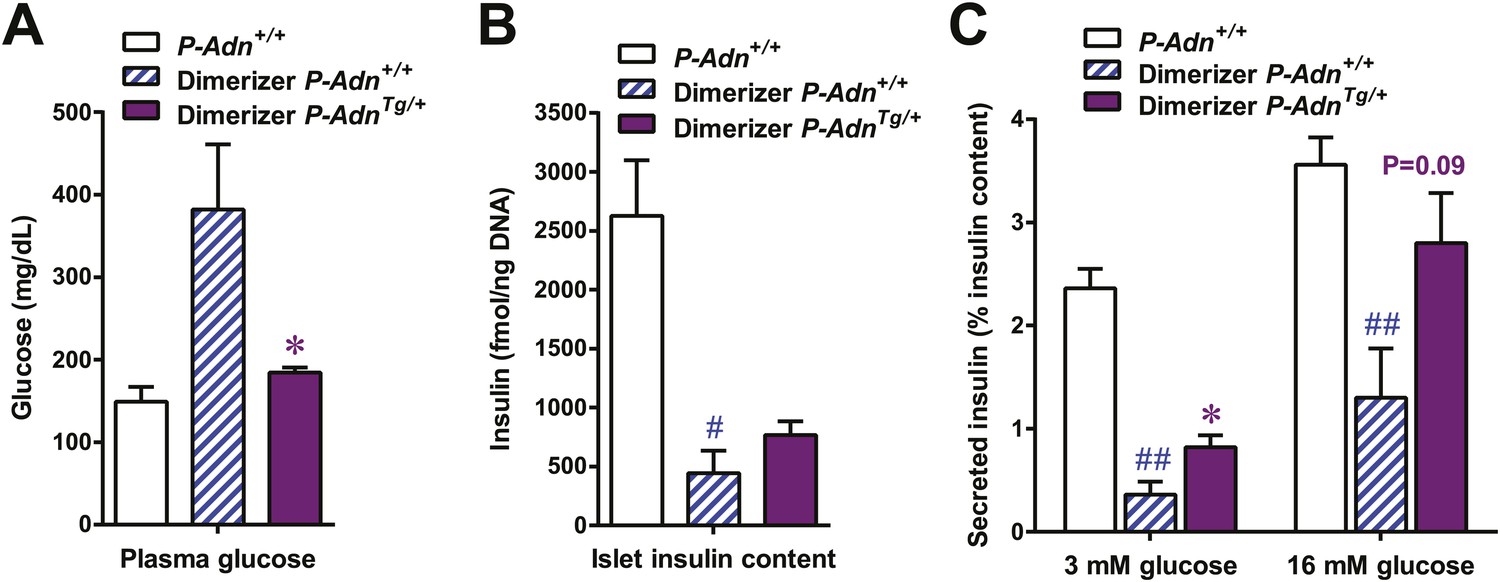
Adiponectin enhances insulin content and in vitro GSIS in islets isolated from PANIC-ATTAC mice.
For the glucose-stimulated insulin secretion from isolated islets: (A) plasma glucose of mice. (B) Insulin content in isolated islets normalized against DNA content. (C) Insulin secretion under basal (3 mM) or stimulating (16 mM) glucose concentration normalized against the insulin content of islets. n = 3–8 samples per condition. Data are presented as the mean ± SEM. *p < 0.05 for dimerizer-treated P-Adn+/+ vs P-AdnTg/+. #p < 0.05, ##p < 0.01 for dimerizer-treated vs untreated P-Adn+/+. Related to Figure 7E.
Figure 7—figure supplement 5

Quantitation of proliferating β-cells.
All islets on the pancreas sections were counted and calculated for the percentage of Ki-67+ insulin+ cells (A) or BrdU+ insulin+ cells (B) within the population of insulin+ cells. n ≥ 3 mice per genotype. Data are presented as the mean ± SEM. Related to Figure 7F,G.
Additional files
-
Supplementary file 1
Primers for RT-qPCR.
- https://doi.org/10.7554/eLife.03851.037
Download links
A two-part list of links to download the article, or parts of the article, in various formats.
Downloads (link to download the article as PDF)
Open citations (links to open the citations from this article in various online reference manager services)
Cite this article (links to download the citations from this article in formats compatible with various reference manager tools)
Adiponectin is essential for lipid homeostasis and survival under insulin deficiency and promotes β-cell regeneration
eLife 3:e03851.
https://doi.org/10.7554/eLife.03851


