Structure and substrate ion binding in the sodium/proton antiporter PaNhaP
- Max Planck Institute of Biophysics, Germany
Figures
Figure 1 with 3 supplements
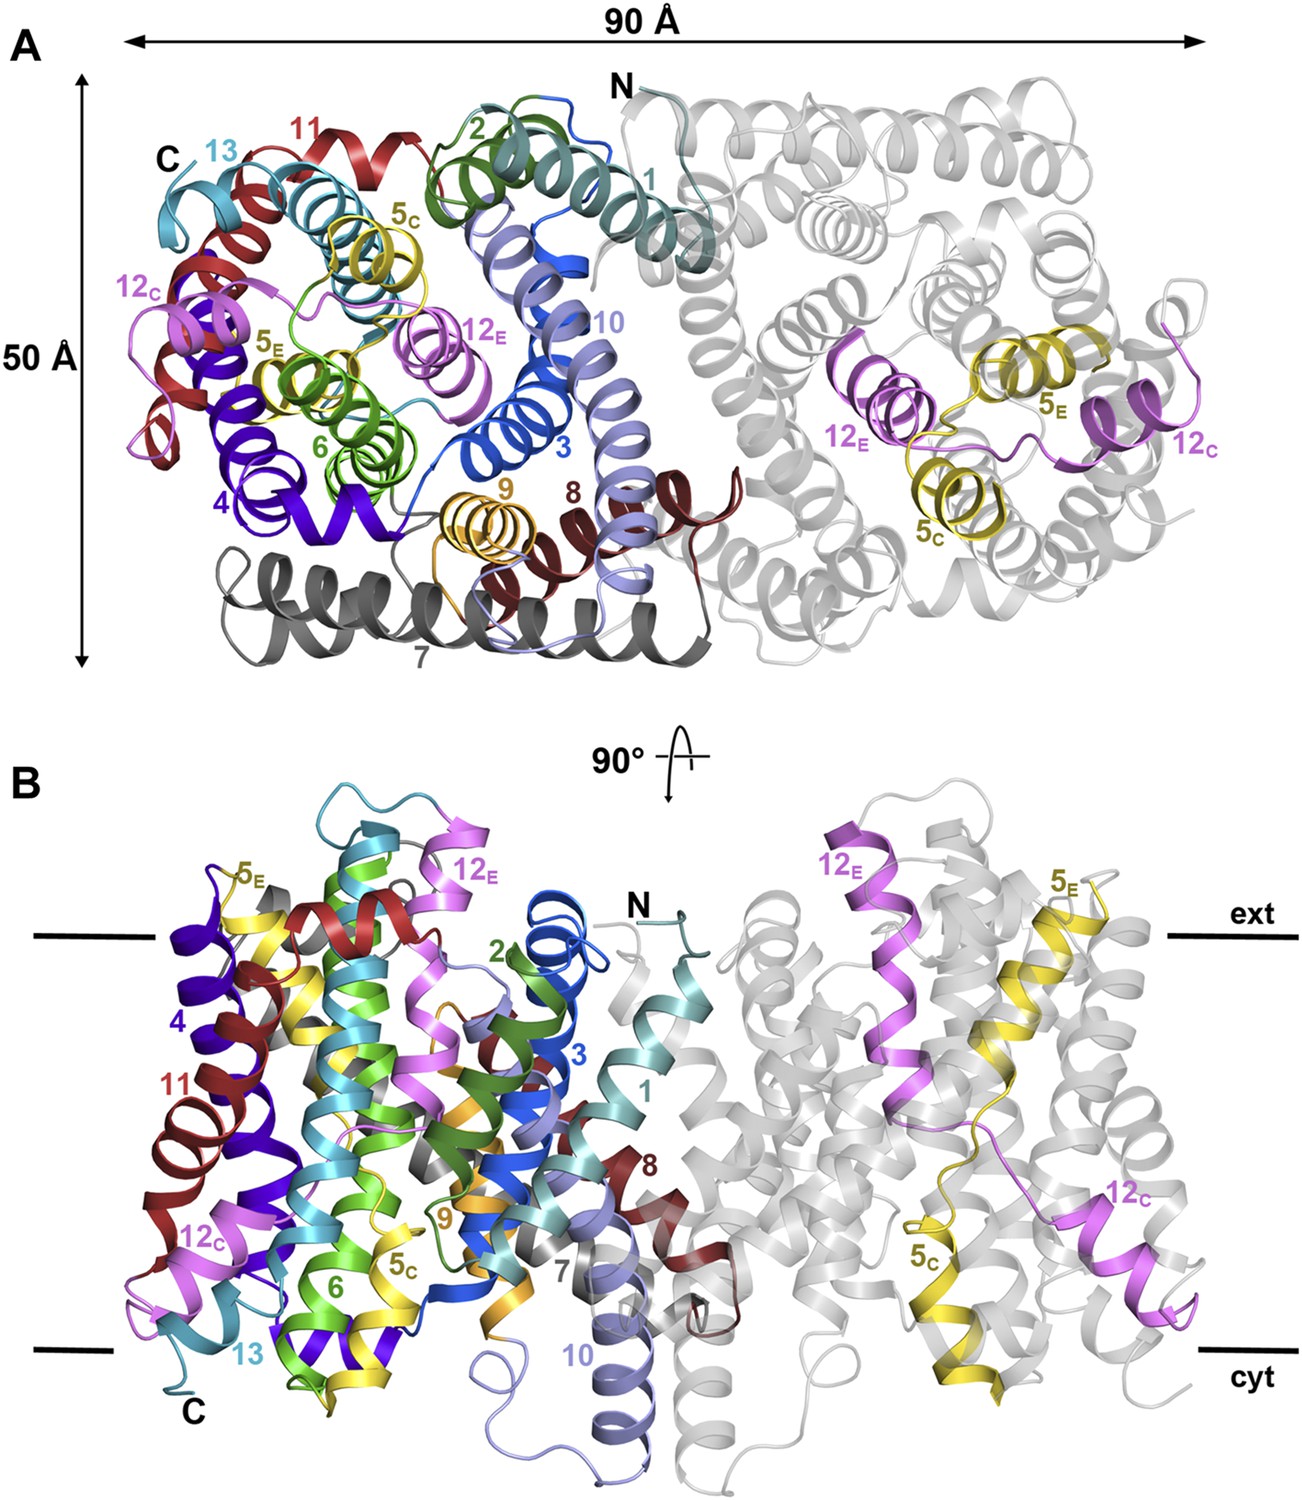
PaNhaP at pH 8.
(A) Cytoplasmic view of the PaNhaP dimer. Helices H1 to H13 are color-coded and numbered in one protomer. In the other protomer only the partly unwound helices H5 and H12 are coloured. (B) Side view with the C-terminus of helix H13 on the cytoplasmic side.
Figure 1—figure supplement 1
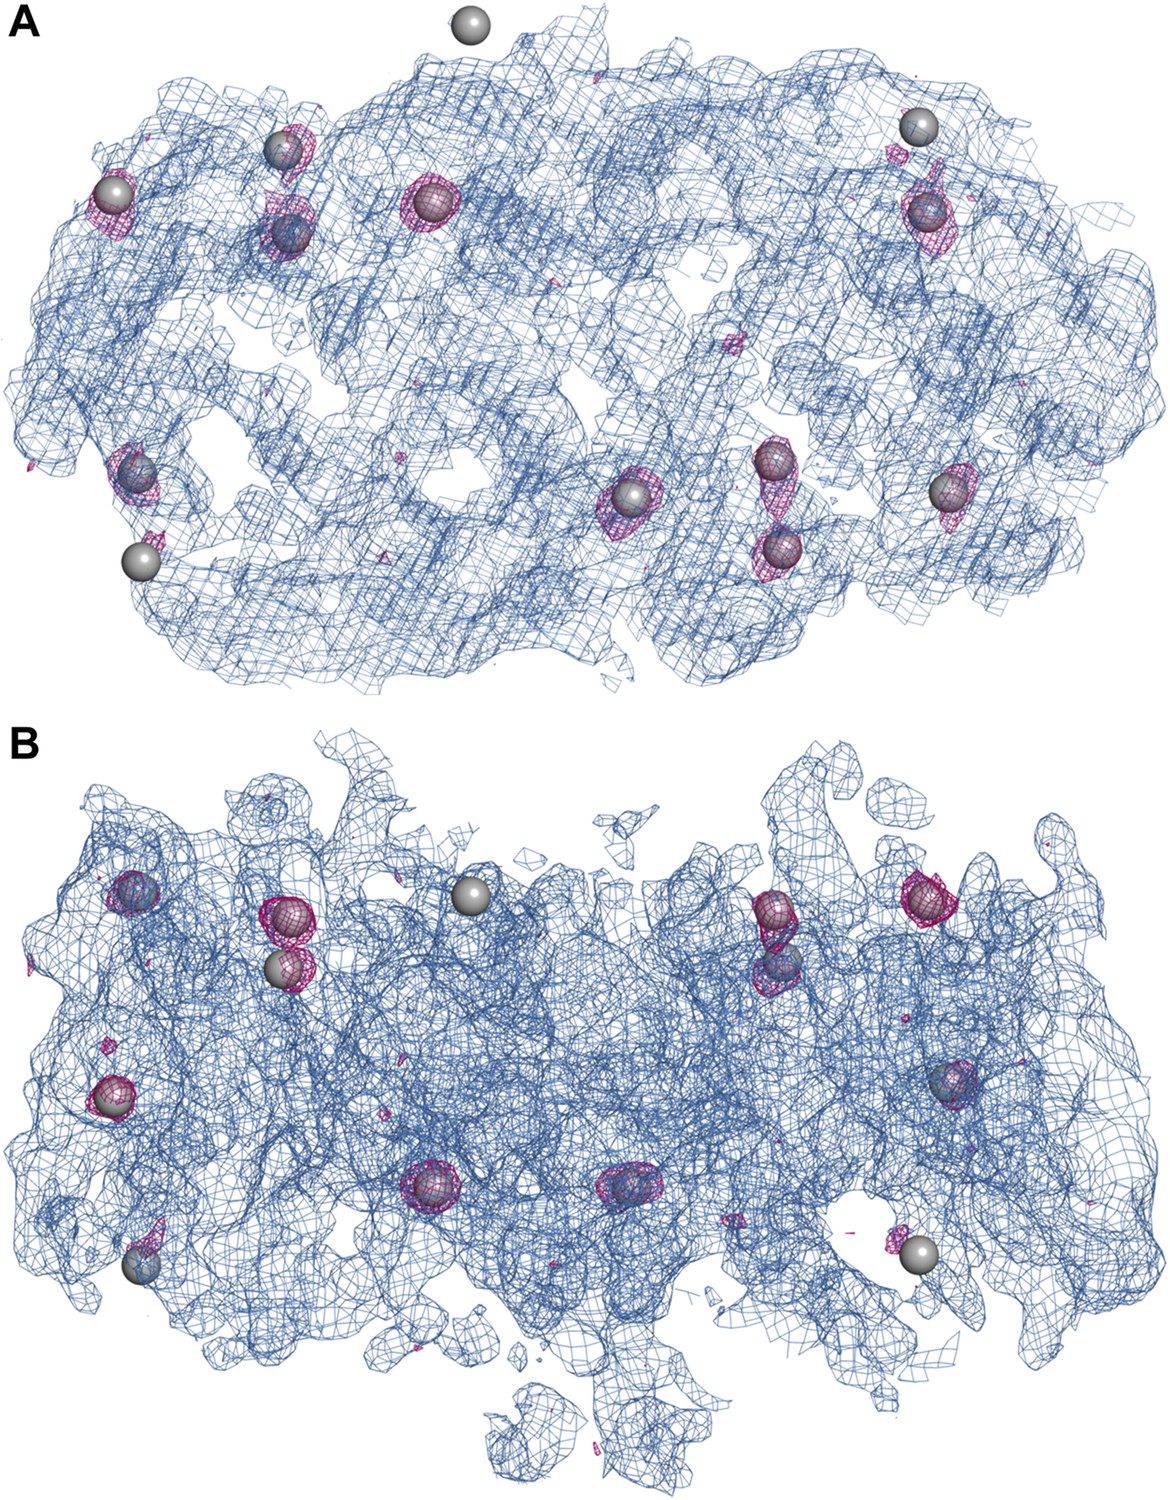
Experimental electron density map of PaNhaP.
The structure was solved at 3.15 Å by SeMet-SAD. Twelve of the 14 SeMet positions (grey spheres) in the asymmetric unit were resolved in the anomalous difference map (purple densities at 4σ). SeMet positions werfe used to generate an initial map (blue density at 1σ) and to trace the polypeptide chain. (A) Cytoplasmic view of PaNhaP dimer. (B) Side view with the extracellular side above.
Figure 1—figure supplement 2
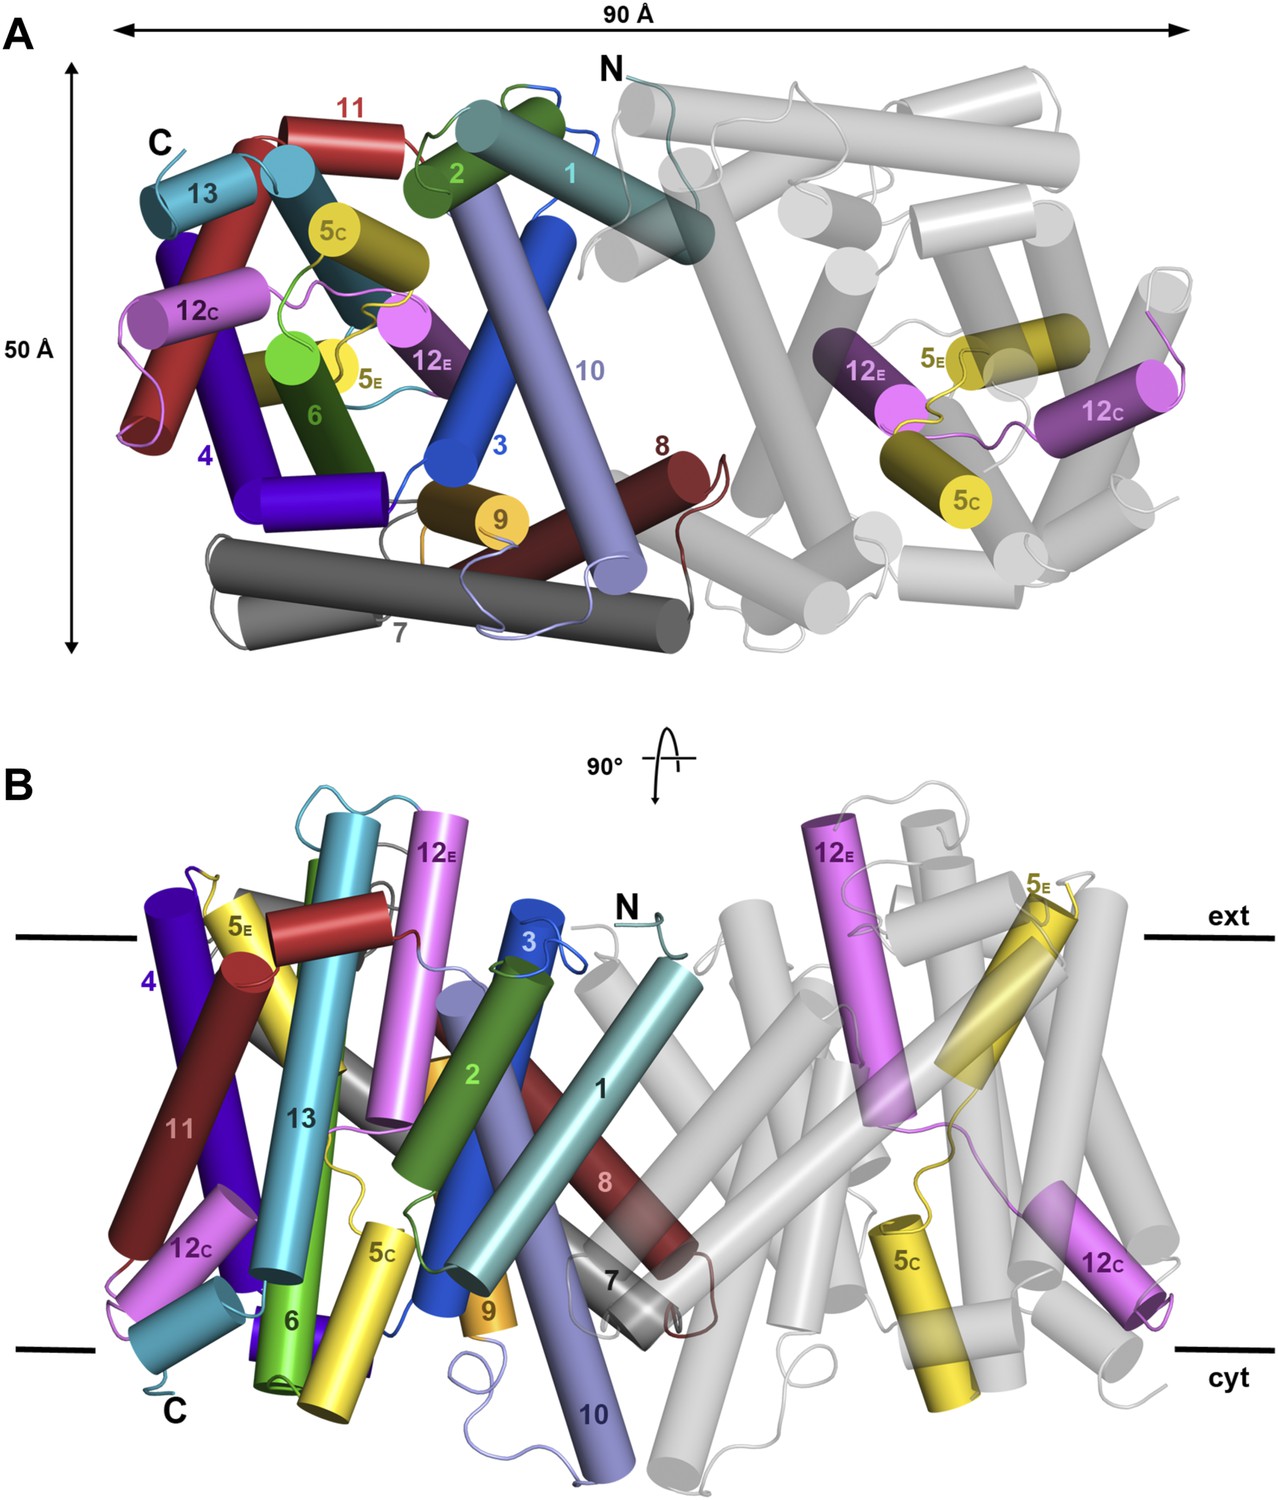
X-ray structure of PaNhaP.
Cartoon representation of PaNhaP with helices shown as cylinders. (A) Cytoplasmic and (B) side view of the dimer colour-coded as in the main figure.
Figure 1—figure supplement 3
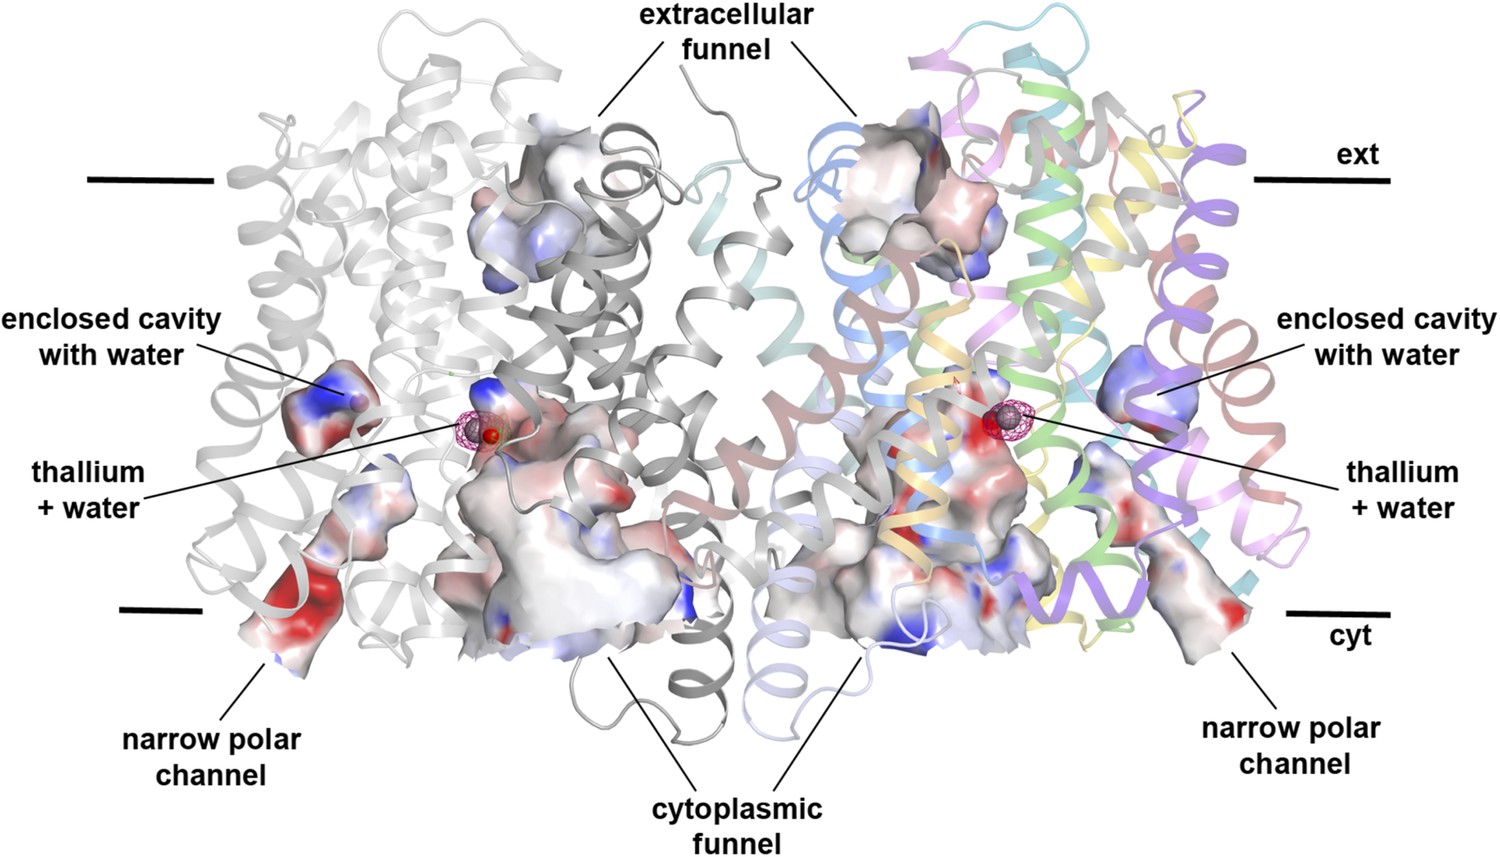
Hydrophilic cavities in PaNhaP.
Side view of the dimer with hydrophilic cavities coloured by surface potential. The substrate-binding site is accessible from the cytoplasmic side through the cytoplasmic funnel and a narrow polar channel. Access from the extracellular side is blocked. One water molecule is trapped in an enclosed polar cavity near the ion-binding site.
Figure 2 with 1 supplement
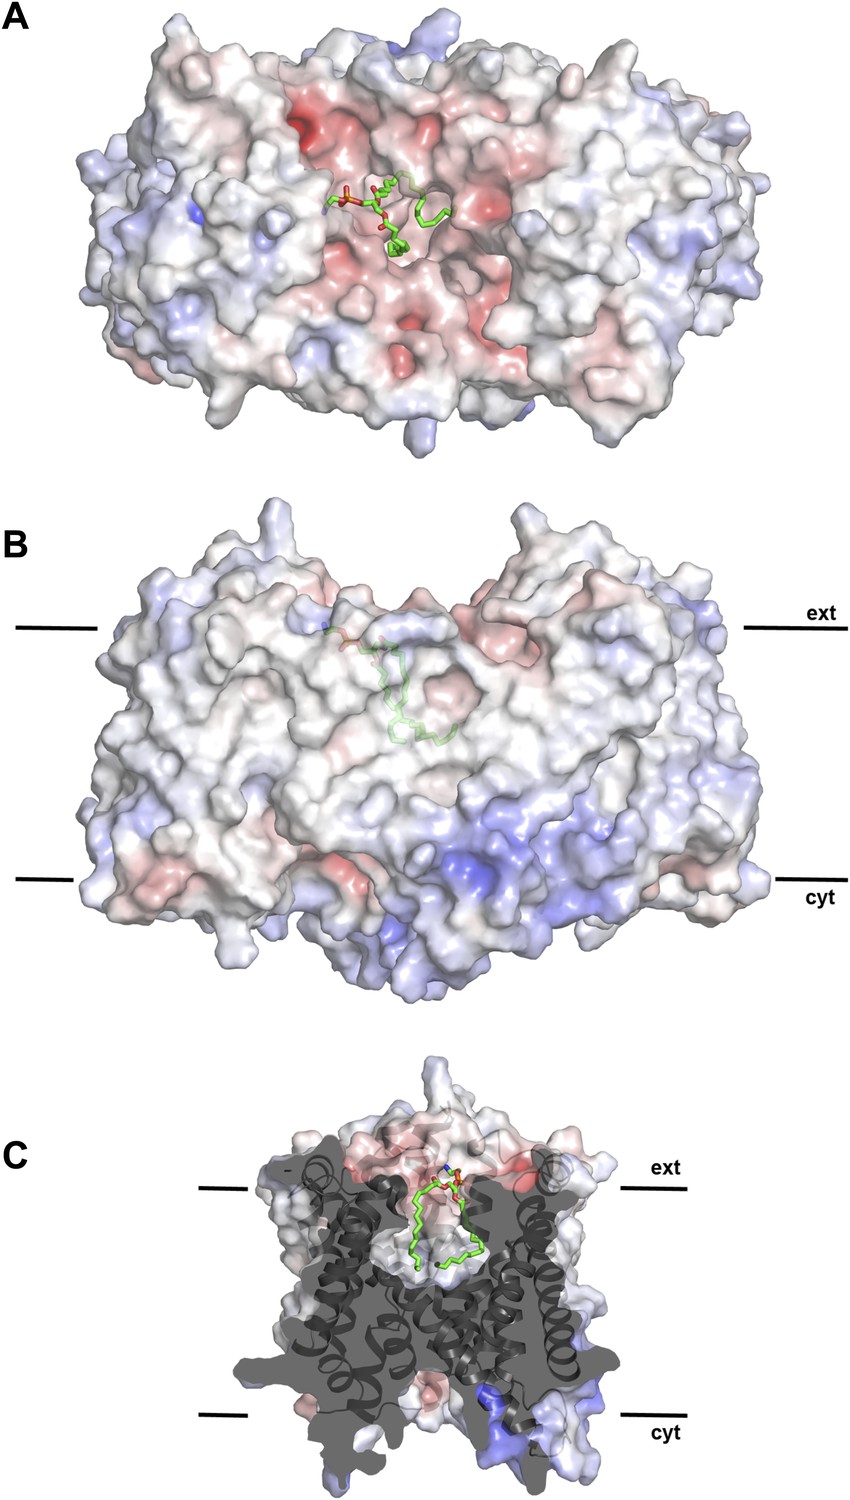
Hydrophobic extracellular cavity with bound lipid.
(A) One lipid molecule (PE, green) in the cavity between the two protomers in the dimer contributes to the hydrophobic contacts across the dimer interface. The extracellular surface is slightly negatively charged. (B) The alkyl chain of the lipid extends to the center of the molecule. (C) The lipid-facing surface of the central cavity is mainly hydrophobic. The surface potential was calculated at pH 7.0 by APBS.
Figure 2—figure supplement 1
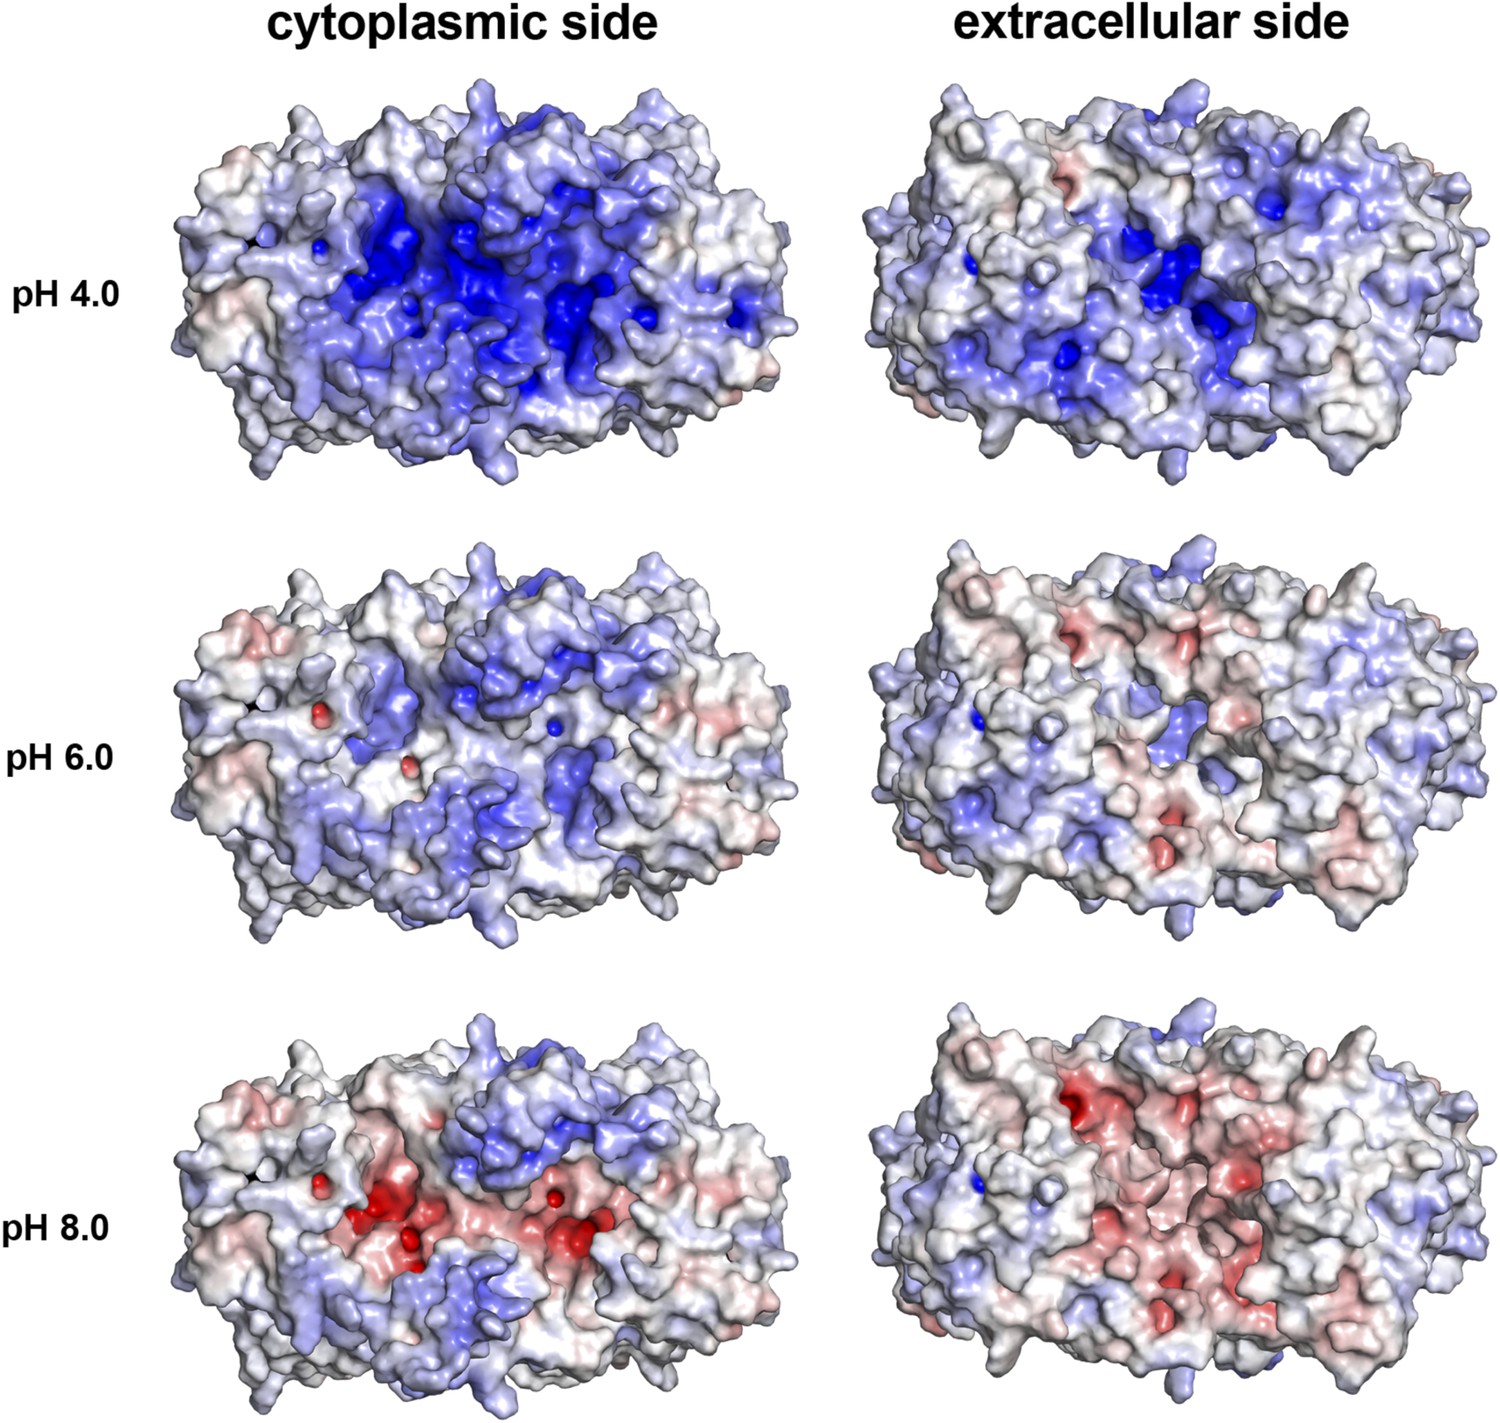
pH-dependent charge distribution.
The surface potential of the PaNhaP dimer was calculated at pH 4, pH 6, and pH 8 by APBS and visualized in PyMOL. At pH 4 the cytoplasmic surface is strongly positively charged. At pH 6, the extracellular surface and the cytoplasmic funnel are largely neutral. At pH 8 the extracellular surface is predominantly negatively charged and the cytoplasmic funnel is strongly negatively charged, inhibiting the release of substrate ions. The ion-binding site is located at the bottom of the cytoplasmic funnel.
Figure 3
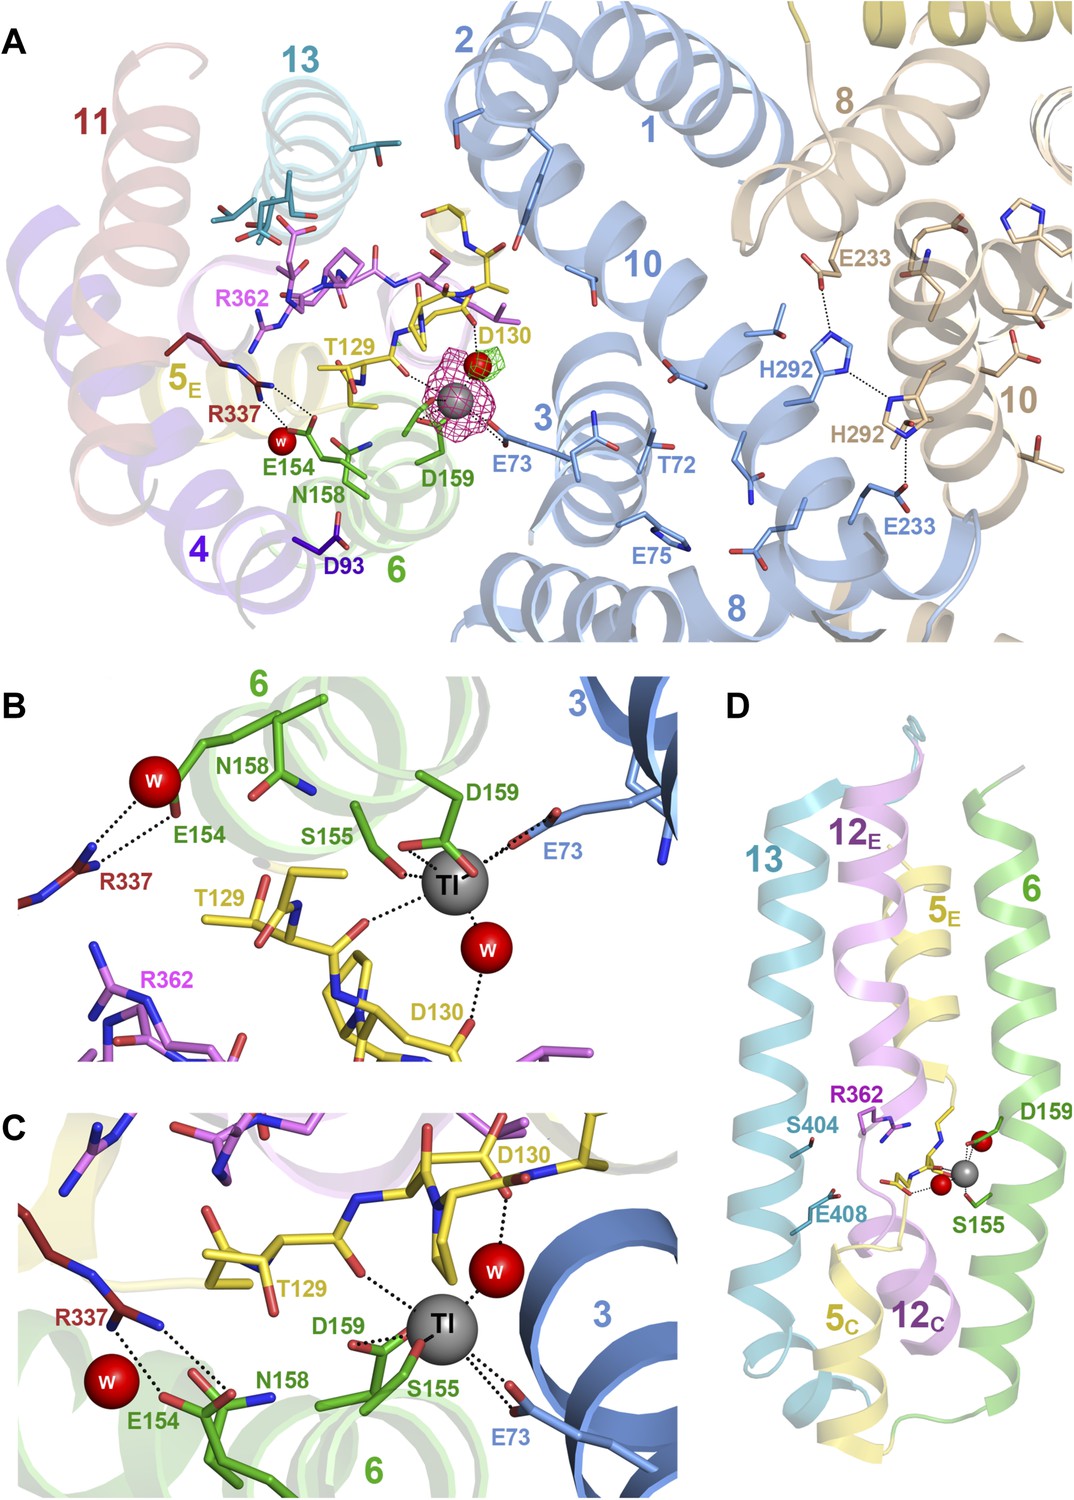
Substrate ion coordination in PaNhaP.
(A) Section view of the ion-binding site and interface region of PaNhaP from the cytoplasmic side. Interface helices of the two protomers are shown in blue and beige, respectively. The acidic side chains of Glu73, Asp159, a water molecule held by Asp130, the hydroxyl group of Ser155 and the main-chain carbonyl of Thr129 coordinate the substrate ion. The anomalous density for the Tl+ ion (grey sphere) in the substrate-binding site between helix H3, H6 and the unwound stretch of H5 is shown in magenta at 4σ. The 3σ omit map for the H2O molecule next to Tl+ is green. The water molecule near Glu154 and Asn158 is not directly involved in ion coordination. (B, C) Detailed views of the substrate-coordinating residues from the extracellular and cytoplasmic side, respectively. (D) Side view of core helices and substrate-binding residues in the 6-helix bundle.
Figure 4
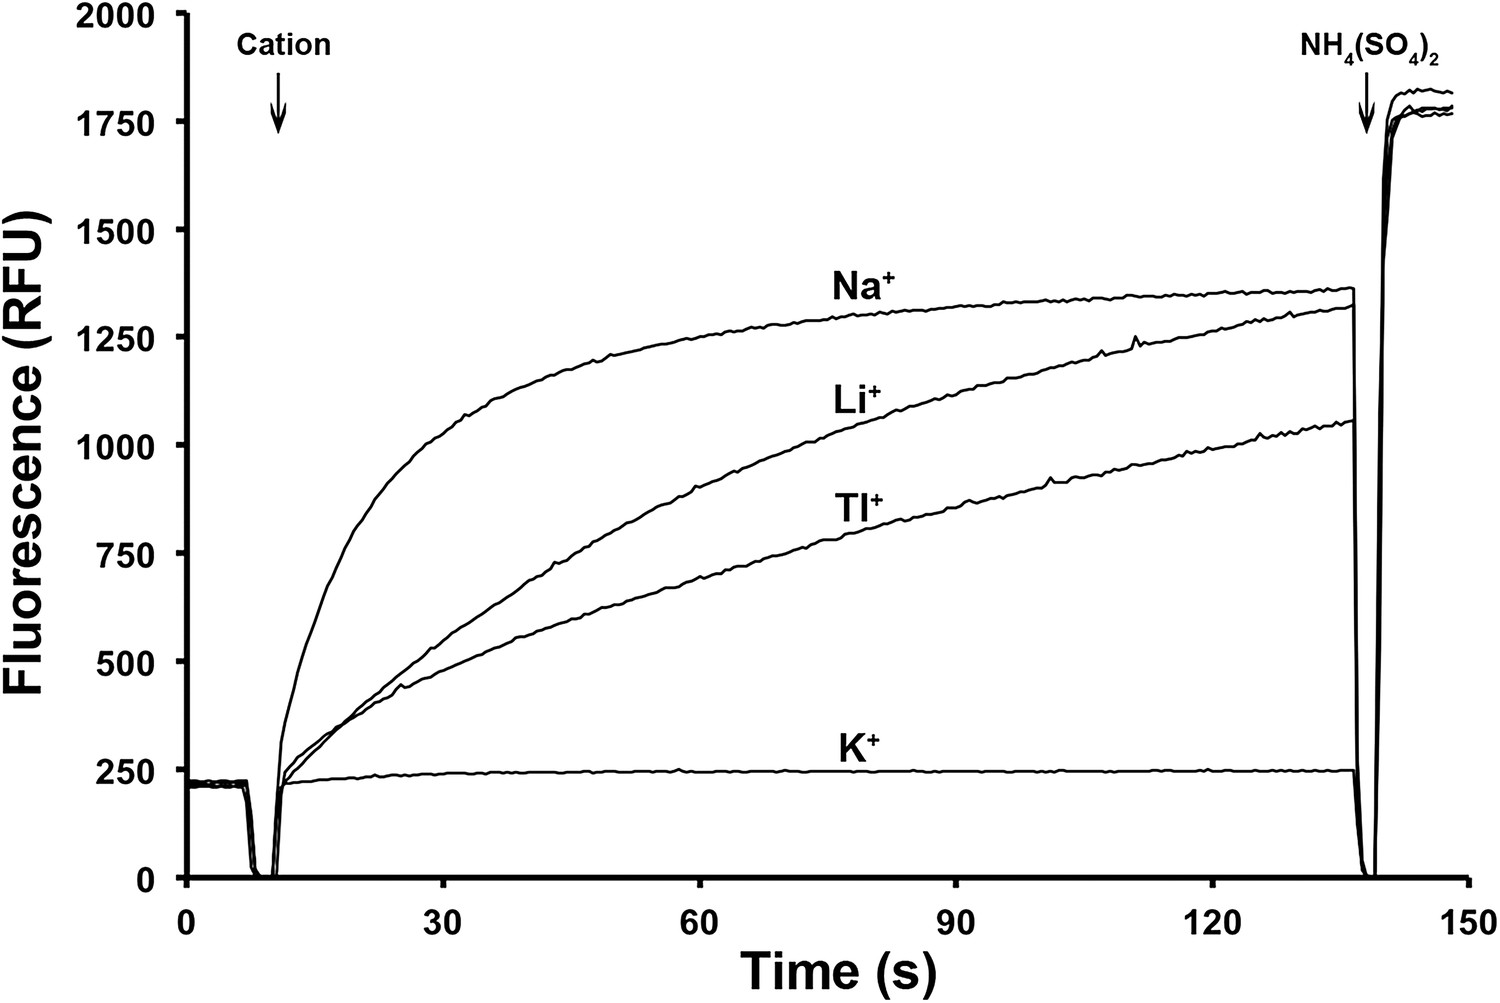
Ion selectivity of PaNhaP.
Ion selectivity was determined by acridine orange fluorescence at pH 6. Na+, Li+, Tl+ are transported by PaNhaP, K+ is not.
Figure 5 with 2 supplements
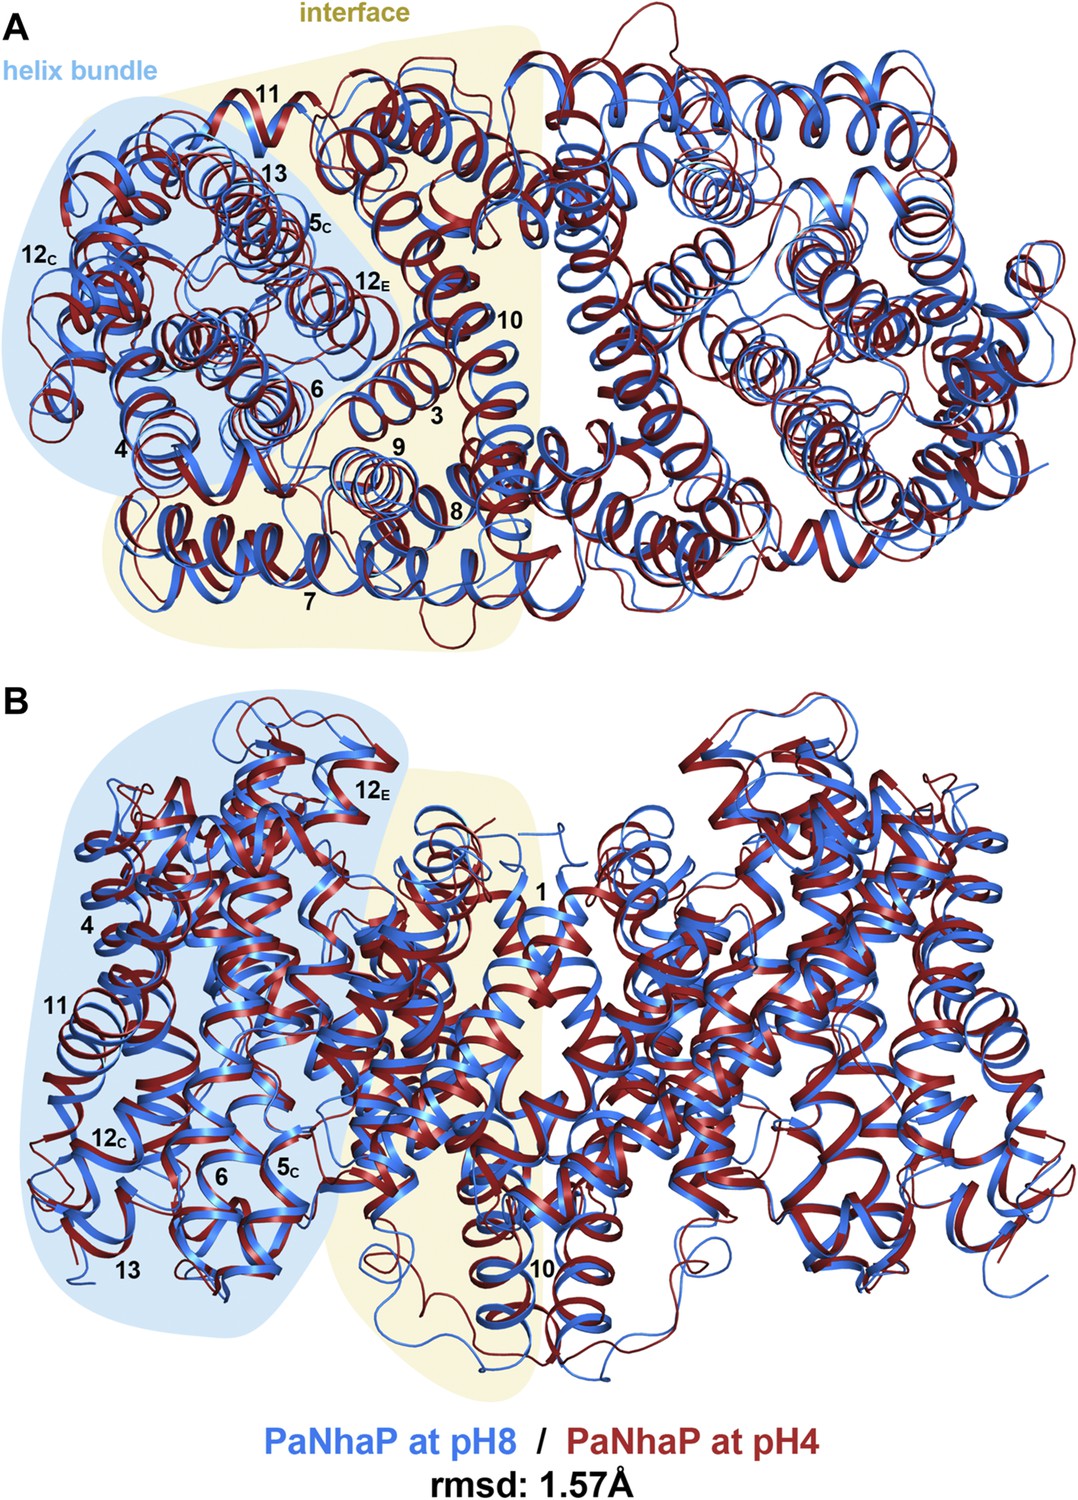
pH-induced conformational changes in the PaNhaP dimer.
(A) cytoplasmic view, (B) side view as in Figure 1. At pH 4 (red), helix H4 moves towards the cytoplasm by 1.5 Å. Within the 6-helix bundle, the extracellular ends of helix H5E and H6 move towards H12 by ∼1.5 Å. Helix H11 and H13 tilt by about 2–3° each, such that the cytoplasmic end of helix H11 moves towards H12C, which shifts by a similar amount in the same direction. The extracellular end of helix H12E moves towards helix H3 by ∼3 Å. The rmsd between the structures at pH 8 and pH 4 is 1.57 Å.
Figure 5—figure supplement 1
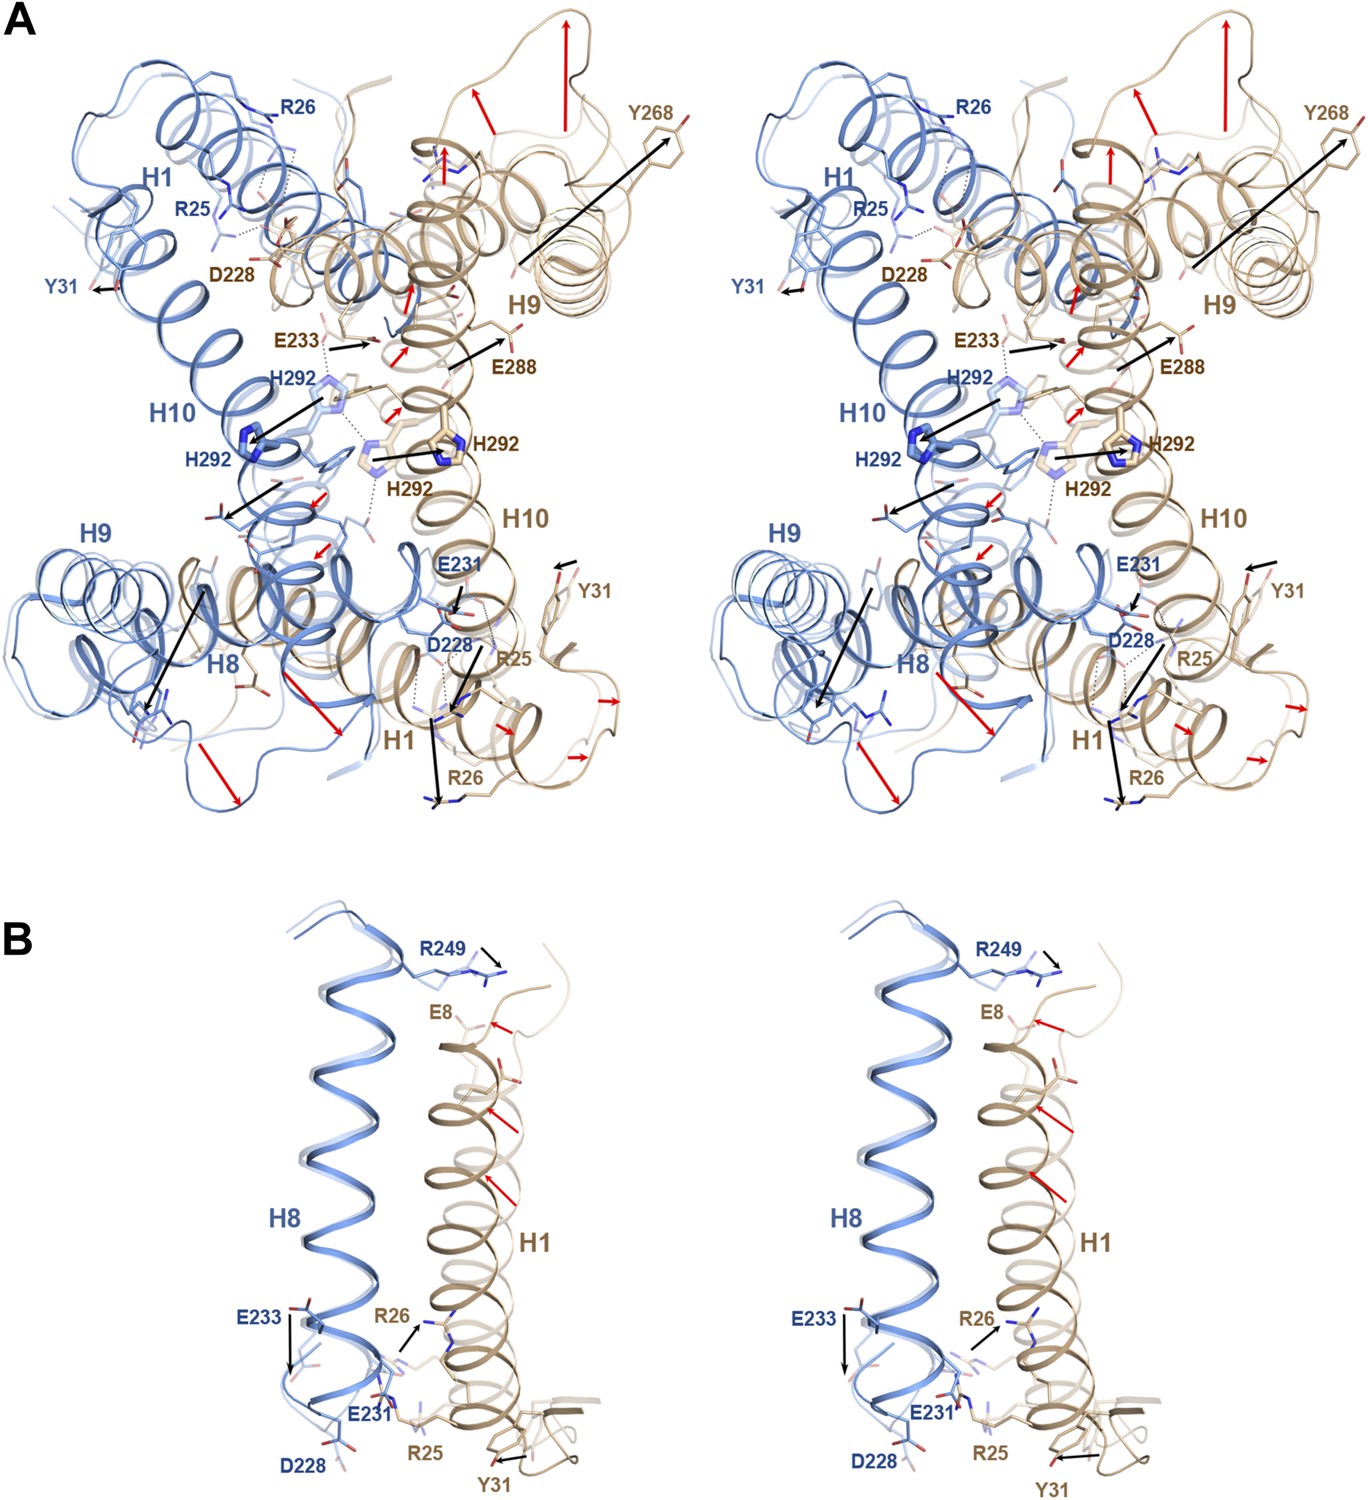
pH-induced conformational changes at the dimer interface.
The pH 8 structure (transparent) is superposed on the pH 4 structure. Red and black arrows indicate mainchain and sidechain movements, respectively. (A) At pH 4, His292 at the dimer interface moves by 6–8 Å from its pH 8 position towards the centre of H3. At pH 8, the two His292 in the dimer form a line of hydrogen bonds with glutamates Glu233 on either side (dashed lines). Protonation at pH 4 disrupts the hydrogen bond network, so that the His sidechains and H10 move towards the helix bundle. (B) Six salt bridges between the cytoplasmic end of H1 and H7/8 present at pH 8 break at pH 4. The N-terminus of H1 on the extracellular side becomes more ordered at pH 4 and moves towards H8.
Figure 5—figure supplement 2

pH-induced conformational changes in the substrate binding site.
(A) In protomer A, Asp130 in the unwound stretch of H5 and Glu73 in H3 move towards the ion-coordinating Asp159. The ion-binding site in protomer B changes only slightly from pH 8 to pH 4. (B) At pH 8, Tyr31 is within hydrogen bonding distance of Asp130 in the substrate-binding site. At pH 4, the two residues do not interact. The rmsd between the pH 8 and pH 4 structures is 1.6 Å.
Figure 6 with 2 supplements
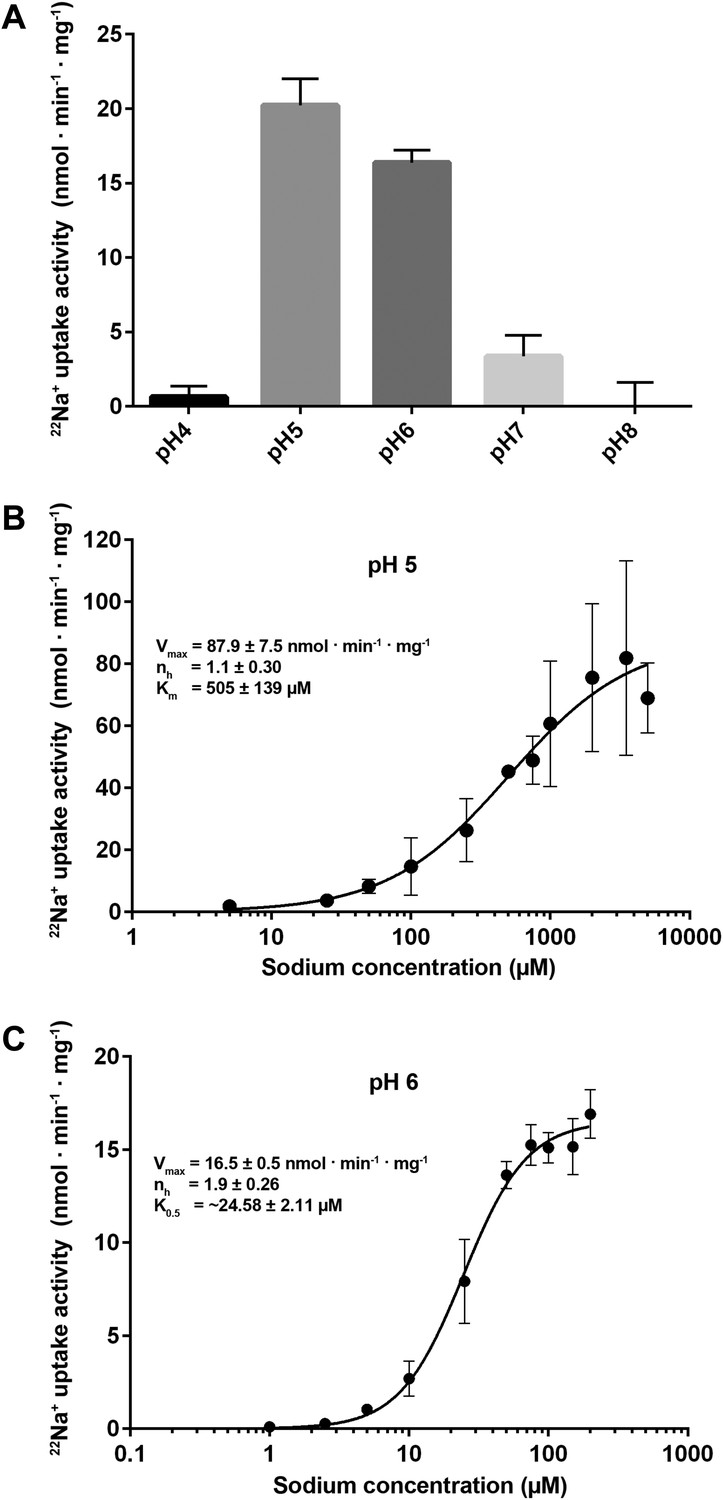
Transport activity of PaNhaP.
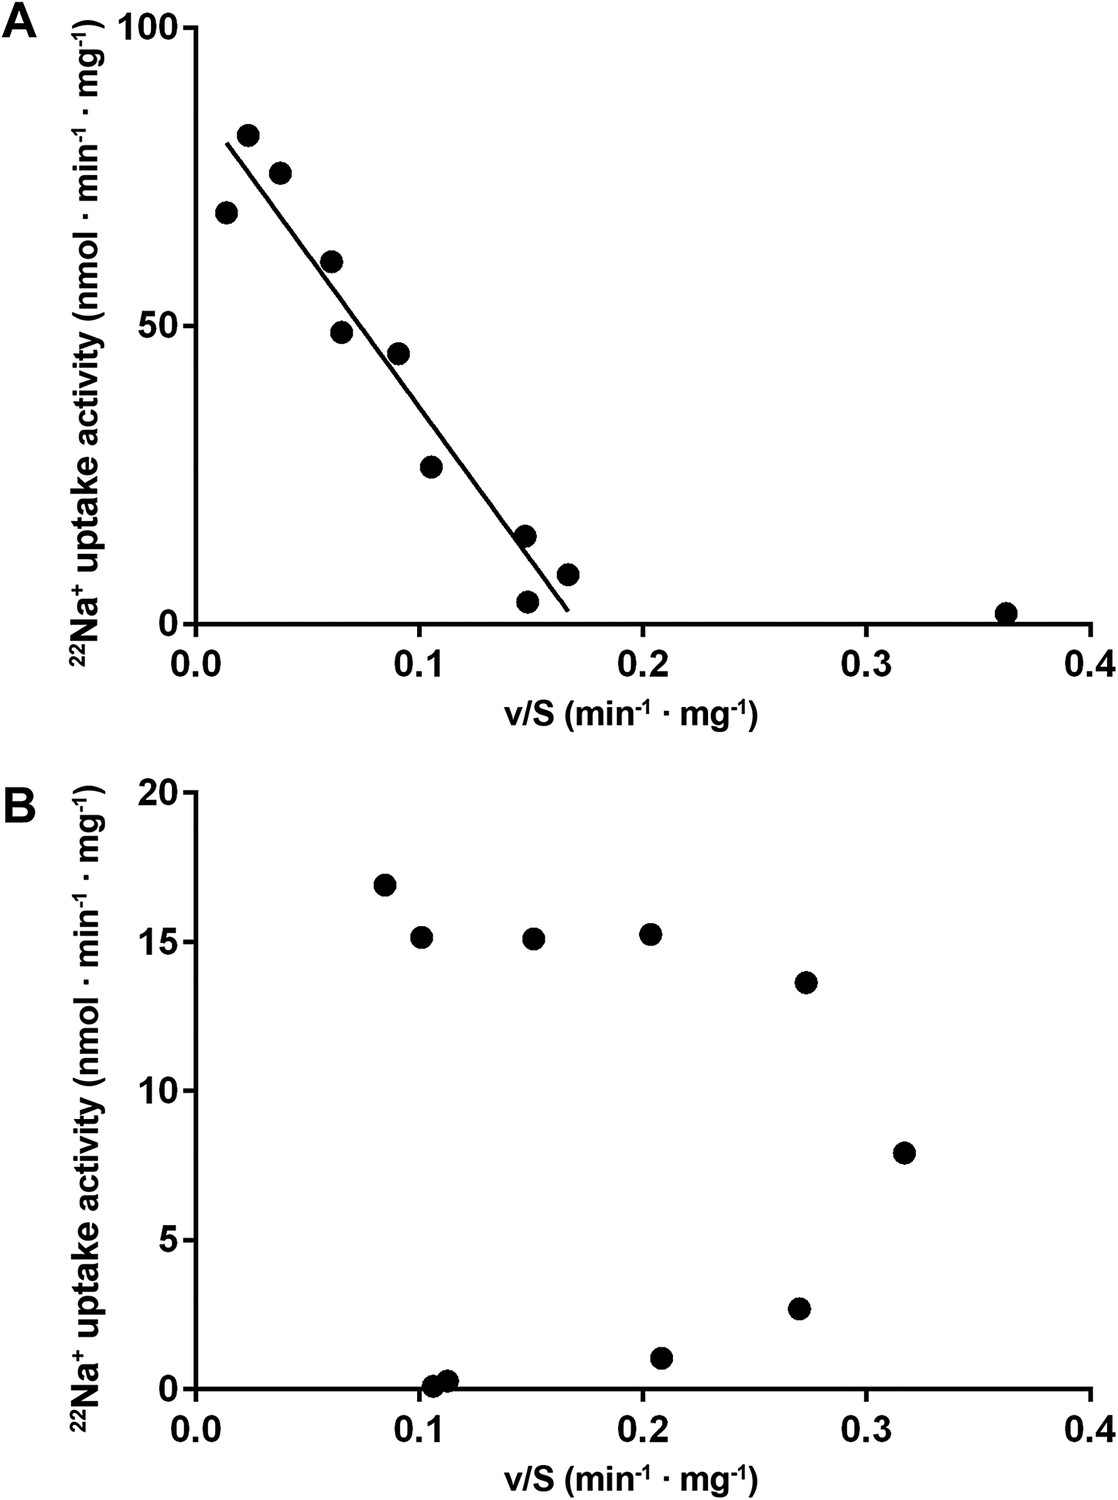
(A) pH dependence of transport activity determined by 22Na+ uptake with inside-acidic PaNhaP proteoliposomes. The antiporter is active at pH 5 and pH 6; at pH 4 and pH 7 transport drops to background level. (B) Concentration-dependent 22Na+-uptake by inside-acidic PaNhaP proteoliposomes at pH 5 gives a vmax of 87.9 ± 7.5 nmol · min−1 · mg−1 at room temperature, indicating a transport rate of 4.4 Na+ ions per protomer per minute. At pH 5 the Hill coefficient (nh) is 1.1 ± 0.30, indicating non-cooperative transport. (C) At pH 6, transport is cooperative, with a Hill coefficient of 1.9 ± 0.26, indicating allosteric coupling of the two ion-binding sites in the dimer. vmax at room temperature decreases to 16.5 ± 0.5 nmol · min−1 · mg−1.
Figure 6—figure supplement 1
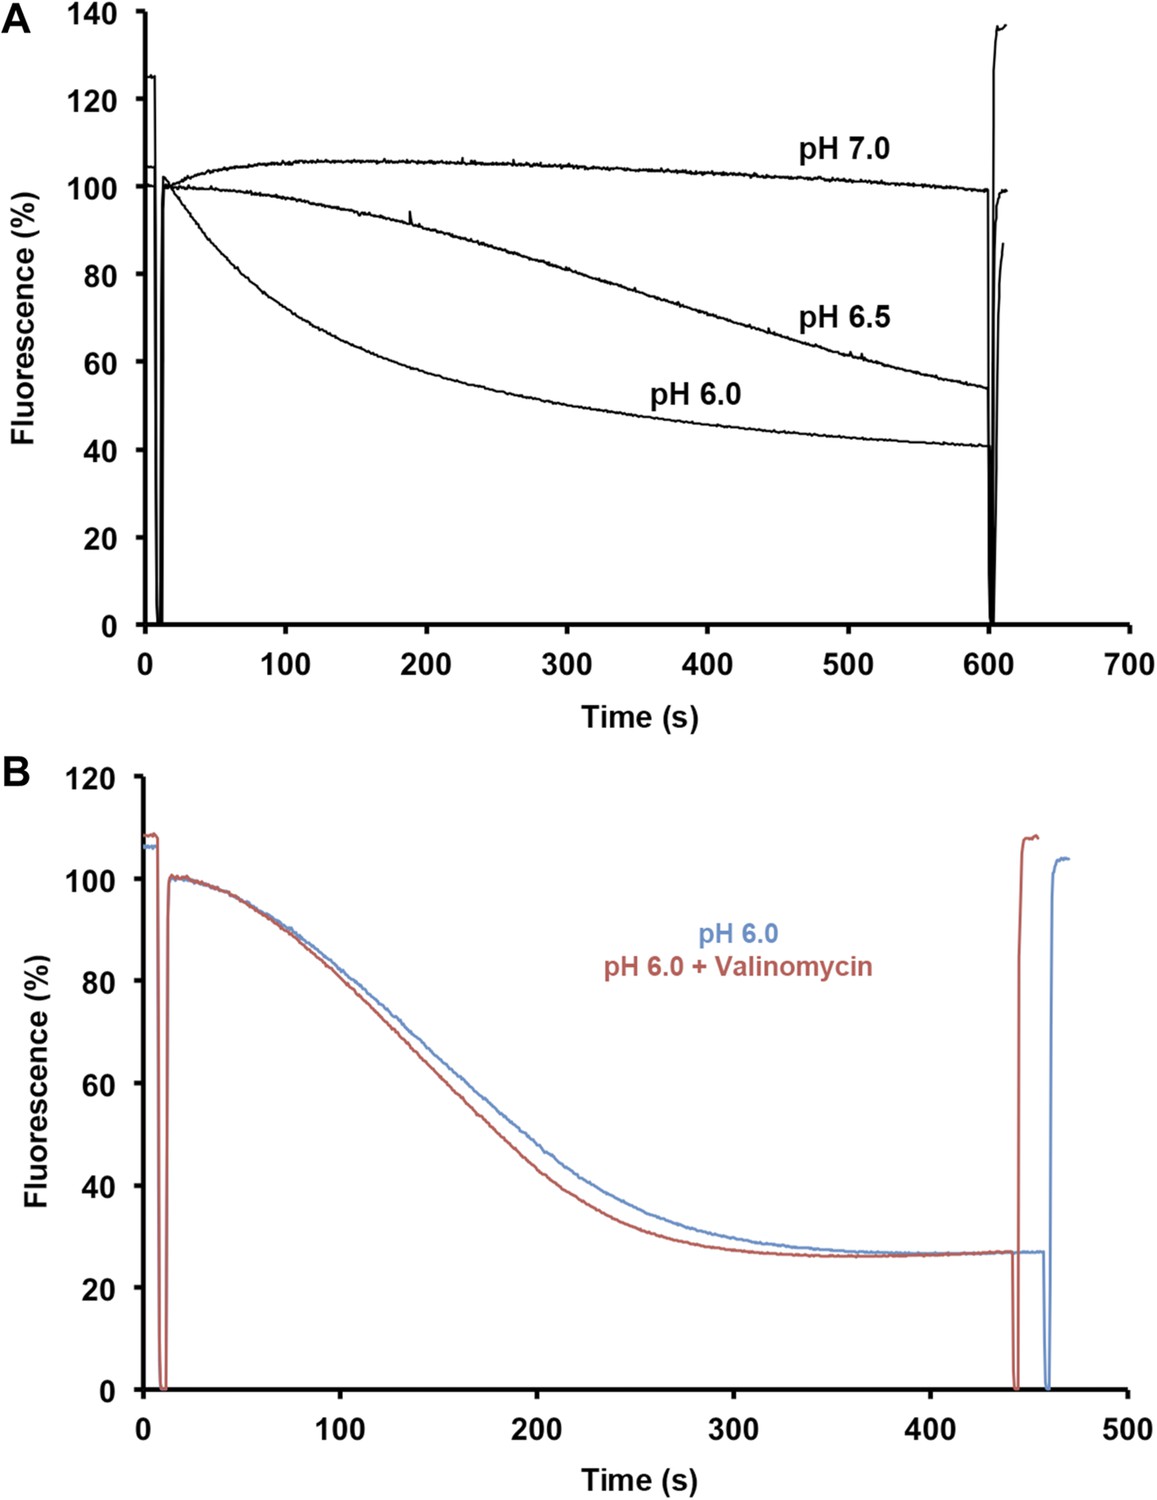
Sodium efflux measurements.
(A) Sodium efflux was measured under symmetrical pH conditions by acridine orange fluorescence with PaNhaP reconstituted into proteoliposomes. Transport activity of PaNhaP drops towards pH 7, consistent with 22Na uptake measurements (Figure 4). Transport was not affected by 100 nM valinomycin (B, red curve), indicating that PaNhaP is electroneutral.
Figure 6—figure supplement 2
Eadie-Hofstee plots.
(A) Eadie–Hofstee transformation of kinetic data at pH 5 shows a linear correlation typical for Michaelis–Menten kinetics. The data point at 5 µM sodium concentration was omitted from the linear regression. (B) Eadie–Hofstee transformation of pH 6 data results in a concave curve, indicating homotropic activation.
Figure 7
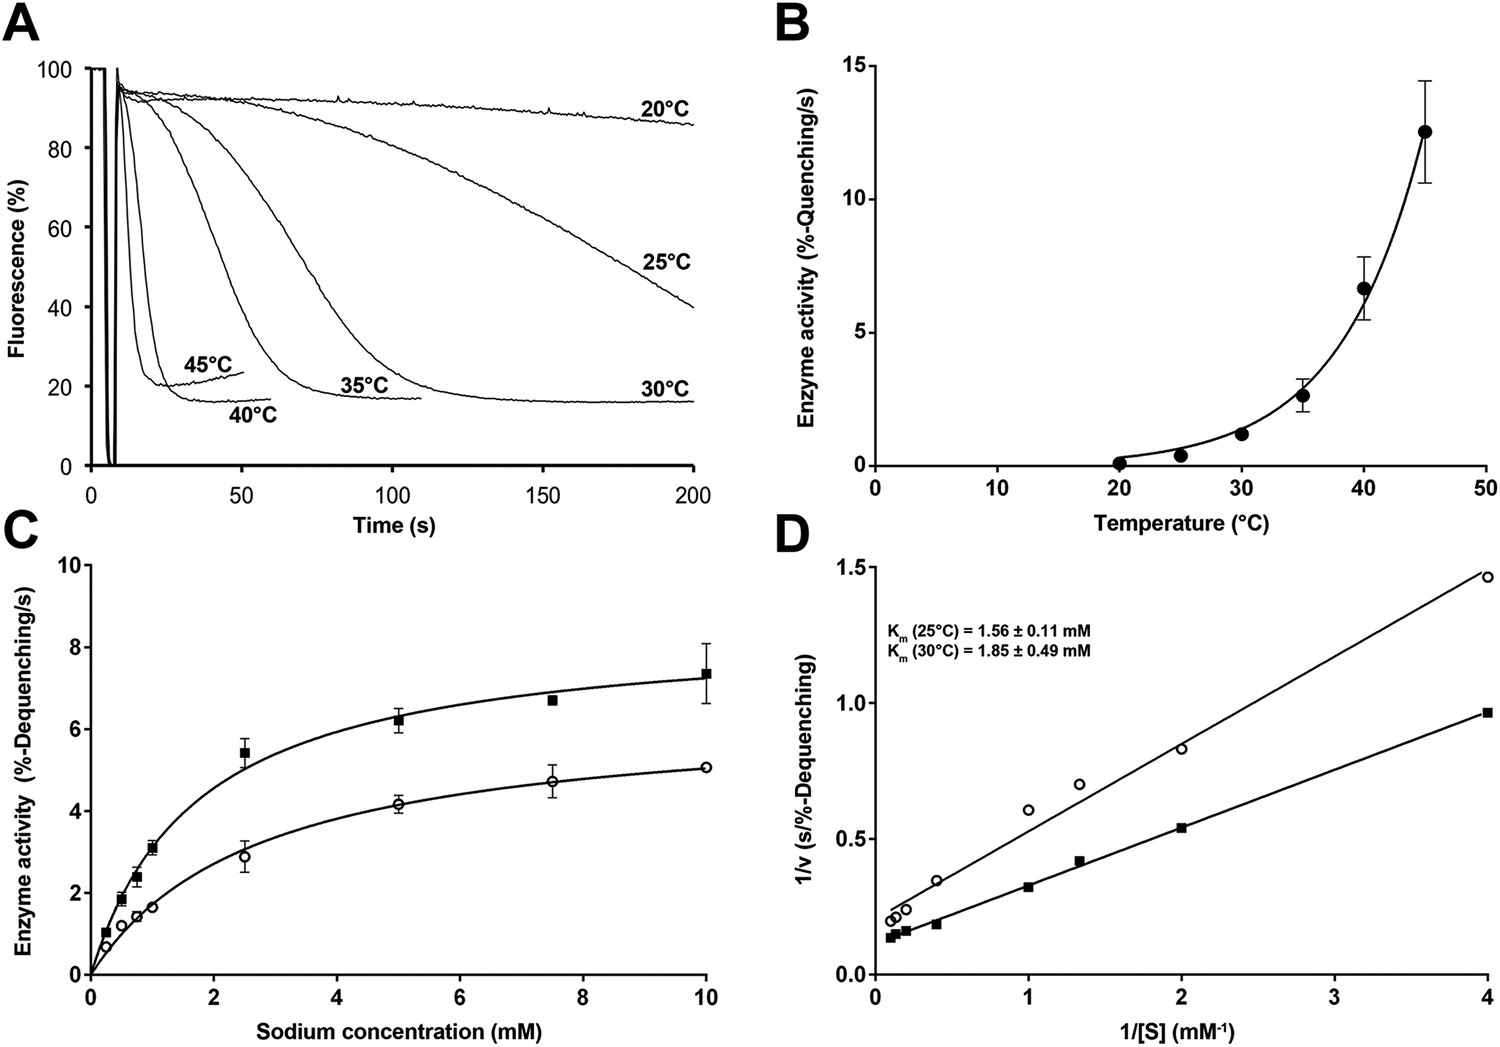
Temperature dependence of PaNhaP.
(A, B) At pH 6 transport activity increases by a factor of 2.1 for every 5°C rise in temperature, as measured by sodium efflux under symmetrical pH. The slight rise in fluorescence towards longer times at 40°C and above in A is due to increasing proton leakage of the proteoliposomes. (C, D) Effect of temperature on substrate affinity at 25°C (empty dots) and 30°C (filled squares) measured by ΔpH-driven sodium uptake in proteoliposomes using Acridine orange fluorescence. In contrast to vmax, Km does not change much with increasing temperature (1.56 ± 0.11 mM at 25°C; 1.85 ± 0.49 mM at 30°C).
Figure 8 with 1 supplement
Transport activity of binding site mutants.
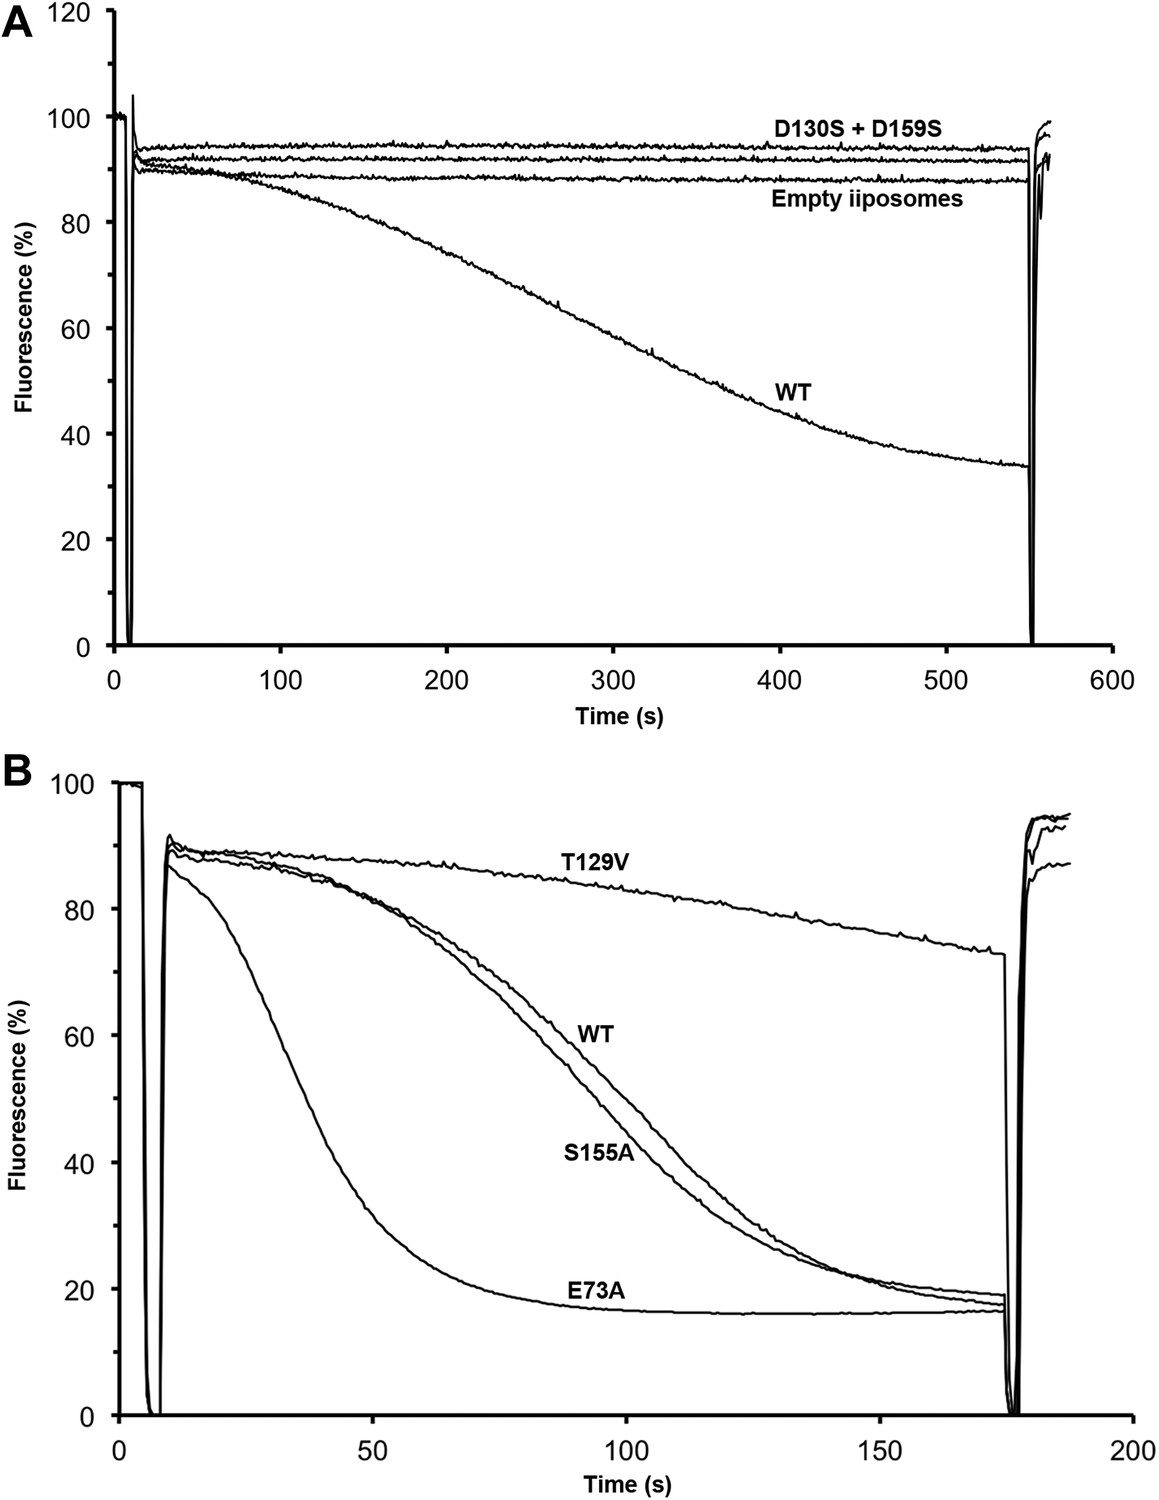
Sodium efflux from proteoliposomes at pH 6 was measured to investigate PaNhaP mutants. Antiport activity establishes a ΔpH across the membrane, which results in acridine orange fluorescence quenching. (A) Mutation of Asp130 or Asp159 to serine abolishes transport activity. (B) Replacement of Thr129 by valine, as in eukaryotic antiporters, reduces the transport activity. Replacement of Glu73 by alanine increases activity significantly, whereas exchanging Ser155 against alanine has no effect compared to wildtype.
Figure 8—figure supplement 1
Interface crosslinks.
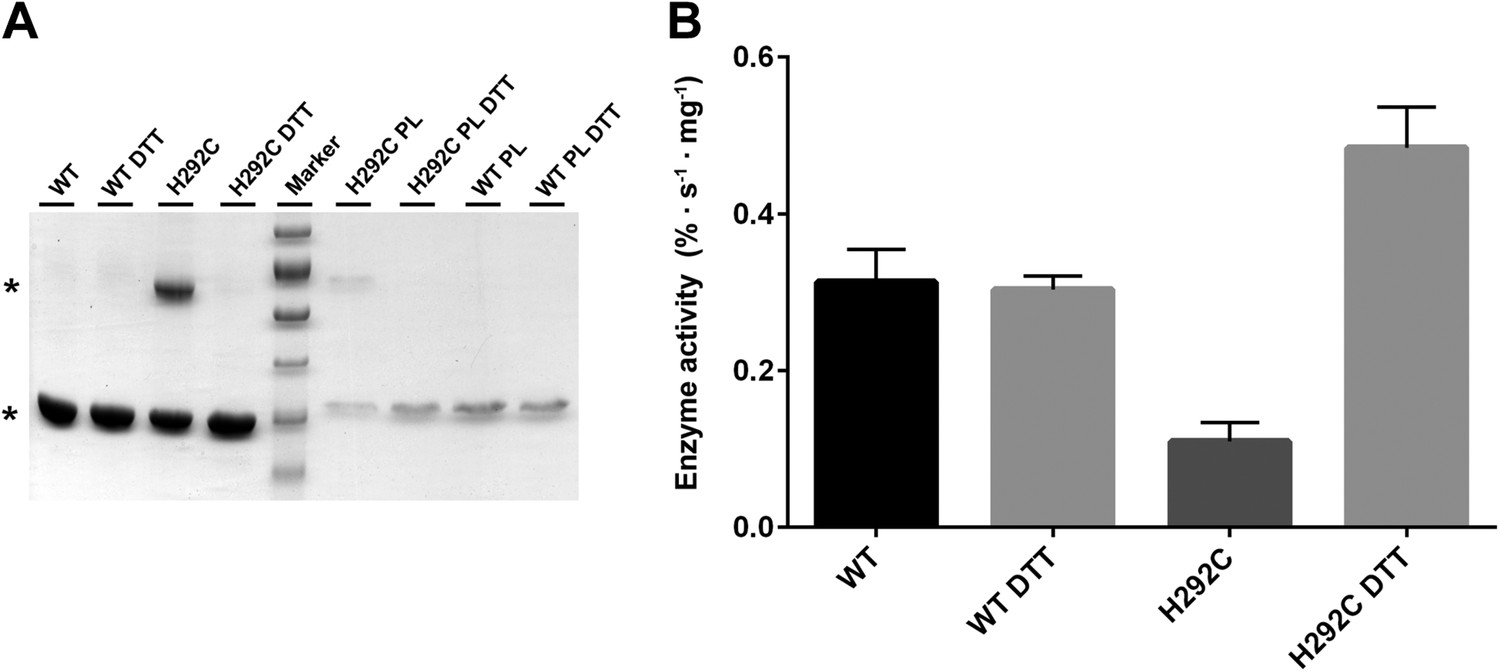
(A) Mutation of His292 to cysteine results in a prominent dimer band under oxidizing conditions, as protomers are crosslinked by covalent disulfide bonds across the dimer interface both in detergent and in proteoliposomes (PL). Addition of reducing agent (10 mM DTT) breaks the disulfide bonds between crosslinked protomers. Asterisks mark the PaNhaP monomer and dimer on SDS-PAGE. (B) Transport measurements indicate a 60 % drop in activity of cross-linked PaNhaP dimers compared to wildtype. Under reducing conditions the activity of the H292C mutant is 50 % higher than wildtype, due to weaker protomer interactions.
Figure 9
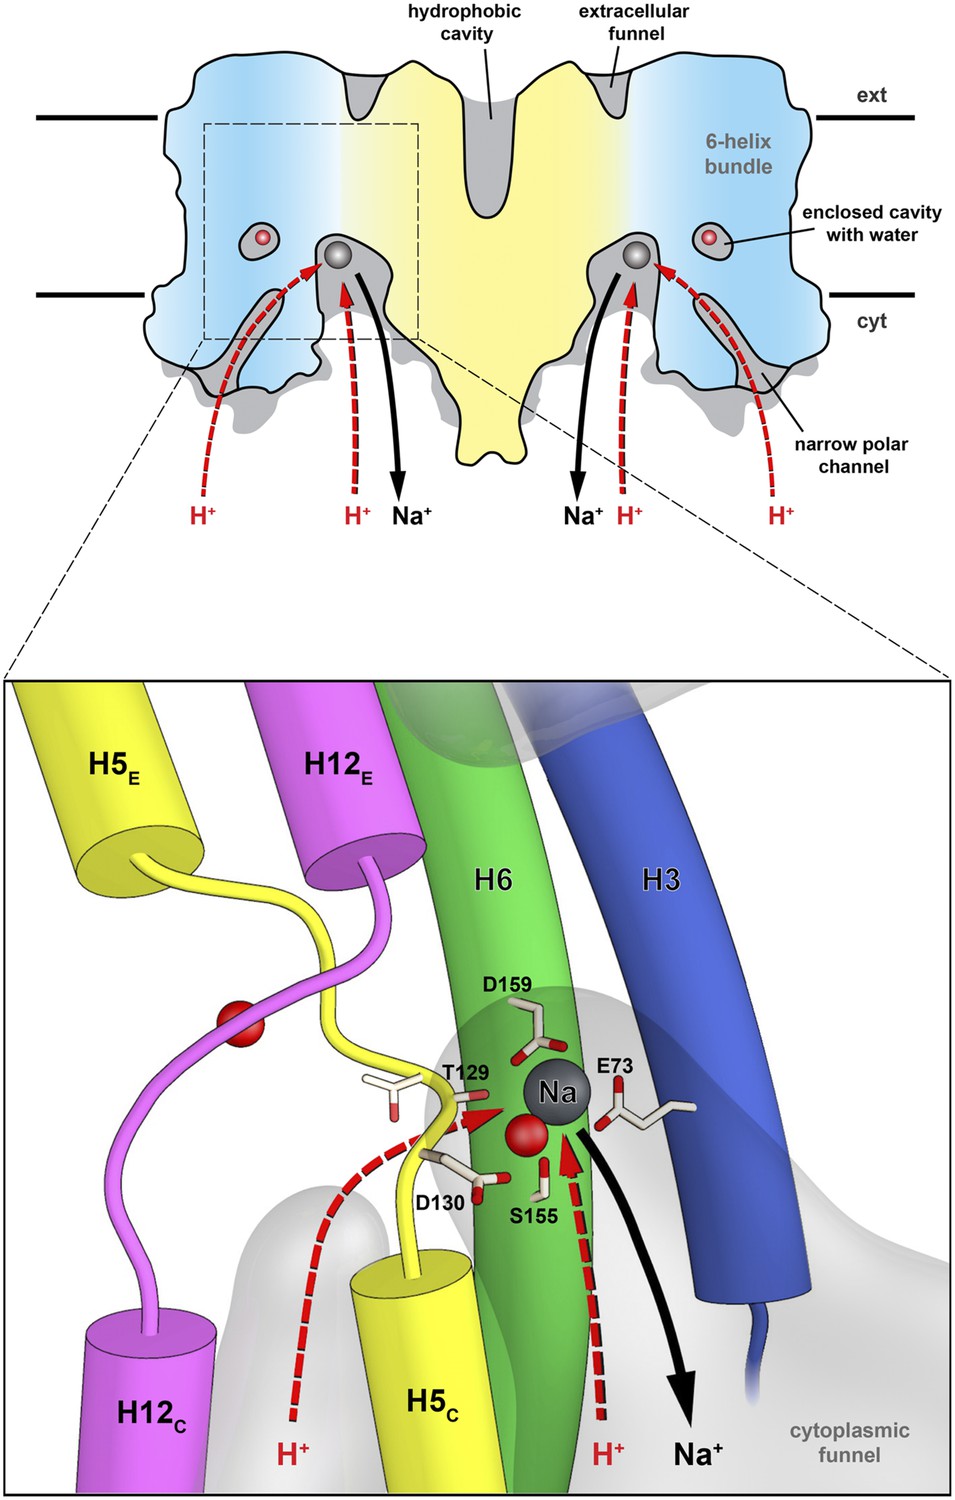
Substrate ion exchange on the cytoplasmic side.
The substrate-binding site of PaNhaP is located between the unwound stretches in the six-helix-bundle and the interface domain. The substrate ion is bound by acidic sidechains and polar groups in the bundle helices H5 and H6, and a glutamate in the interface helix H3 at the deepest point of the cytoplasmic funnel. While the funnel extends between the six-helix bundle and the dimer interface, the narrow polar channel is defined by the bundle helices H5C, H12C, H6 and H13. Protons may approach the binding site either through the cytoplasmic funnel, or through the narrow polar channel (red arrows). A proton displaces the bound substrate ion, which escapes to the cytoplasm (black arrow). Employing the narrow polar channel as the proton path would separate the Na+ ion and proton currents on the cytoplasmic side, which may be advantageous at high transport rates.
Videos
Video 1
Movie of PaNhaP monomer with hydrophilic cavities.
https://doi.org/10.7554/eLife.03579.009
Video 2
pH-induced conformational changes in PaNhaP.
A morph between the pH 4 and pH 8 structures reveals only small changes in the 6-helix bundle, but significant rearrangements at the dimer interface. Six ion bridges that lock the two protomers together at pH 8 break at pH 4. As a result, the two protomers tilt away from each other at lower pH. His292 has a pivotal role in the allosteric pH-dependent protomer interaction. At pH 4, the protonated His292 side chains on the cytoplasmic side of the dimer interface repel one another by electrostatic repulsion, resulting in a ∼7 Å movement that disrupts the hydrogen-bonding network with Glu233.
Tables
Table 1
Data collection and refinement statistics
| SeMet @ pH 8 | Thallium @ pH 8 | Native @ pH 4 | |
|---|---|---|---|
| Data collection | SLS PXII | ||
| Wavelength | 0.979 | 0.979 | 0.978 |
| Space group | P21 | P21 | P64 |
| Cell dimensions | |||
| a, b, c (Å) | 54.5, 107.9, 107.9 | 54.1, 107.4, 99.8 | 109.6, 109.6, 209.6 |
| α, β, γ (°) | 90.0, 95.2, 90.0 | 90.0, 96.4, 90.0 | 90.0, 90.0, 120.0 |
| Resolution (Å) | 48.5–3.15 (3.35–3.15) | 49.6–3.20 (3.40–3.20) | 48.6–3.50 (3.72–3.50) |
| Rpim | 0.033 (0.503) | 0.038 (0.622) | 0.021 (0.486) |
| I / σI | 11.9 (1.5) | 13.4 (1.8) | 19.9 (1.9) |
| CC* | 1.000 (0.943) | 1.000 (0.936) | 1.000 (0.906) |
| Completeness (%) | 99.5 (99.2) | 99.6 (99.4) | 100.0 (100.0) |
| Multiplicity | 10.8 (10.4) | 17.1 (17.4) | 9.2 (9.1) |
| Refinement | |||
| Resolution (Å) | 48.5–3.15 (3.35–3.15) | 49.6–3.20 (3.40–3.20) | 48.6–3.5 (3.72–3.5) |
| Unique reflections | 38,952 | 34,763 | 33,232 |
| Reflections in test set | 2111 | 1884 | 1782 |
| Rwork/Rfree (%) | 23.8/27.8 (31.8/39.9) | 24.8/29.5 (35.9/43.4) | 24.1/26.4 (31.8/35.6) |
| CC(work)/CC(free) | 0.843/0.898 (0.842/0.760) | 0.861/0.754 (0.813/0.713) | 0.791/0.935 (0.749/0.617) |
| Wilson B-Factor (Å2) | 133 | 81 | 146 |
| No. atoms in AU | 6715 | 6651 | 6592 |
| Protein | 6582 | 6560 | 6560 |
| Ligands | 129 | 81 | 31 |
| Water | 4 | 10 | 1 |
| r.m.s. deviations: | |||
| Bond lengths (Å) | 0.003 | 0.003 | 0.009 |
| Bond angles (°) | 0.758 | 0.714 | 1.002 |
Table 2
Data collection and phasing statistics
| Dataset 1 | Dataset 2 | Merge | |
|---|---|---|---|
| Data collection | SLS PXII | ||
| Wavelength | 0.979 | 0.979 | 0.979 |
| Space group | P21 | P21 | P21 |
| Cell dimensions | |||
| a, b, c (Å) | 54.7, 109.0, 110.8 | 54.6, 108.3, 110.5 | 54.7, 108.9, 110.7 |
| α, β, γ (°) | 90.0, 94.6, 90.0 | 90.0, 95.0, 90.0 | 90.0, 94.7, 90.0 |
| Resolution (Å) | 49.3–3.8 (3.97–3.8) | 49.0–3.8 (3.97–3.8) | 49.2–3.8 (3.97–3.8) |
| Rpim | 0.029 (0.470) | 0.034 (0.228) | 0.036 (0.315) |
| I / σI | 13.8 (2.1) | 12.4 (3.9) | 14.5 (2.9) |
| CC* | 1.000 (0.929) | 0.996 (0.985) | 1.000 (0.981) |
| Completeness (%) | 99.7 (99.7) | 99.7 (99.6) | 100 (100) |
| Multiplicity | 24.5 (16.5) | 9.1 (9.5) | 33.0 (25.8) |
| Phasing | |||
| CCanom | 0.348 | ||
| Anom slope | 1.061 | ||
| FOM after Phasing (Refmac) | 0.230 | ||
| FOM after DM (Parrot) | 0.594 | ||
Download links
A two-part list of links to download the article, or parts of the article, in various formats.
Downloads (link to download the article as PDF)
Open citations (links to open the citations from this article in various online reference manager services)
Cite this article (links to download the citations from this article in formats compatible with various reference manager tools)
Structure and substrate ion binding in the sodium/proton antiporter PaNhaP
eLife 3:e03579.
https://doi.org/10.7554/eLife.03579


