microRNA-1 regulates sarcomere formation and suppresses smooth muscle gene expression in the mammalian heart
- Gladstone Institute of Cardiovascular Disease, United States
- University of California, San Francisco, United States
- Children’s Hospital Oakland Research Institute, United States
Figures
Figure 1 with 7 supplements
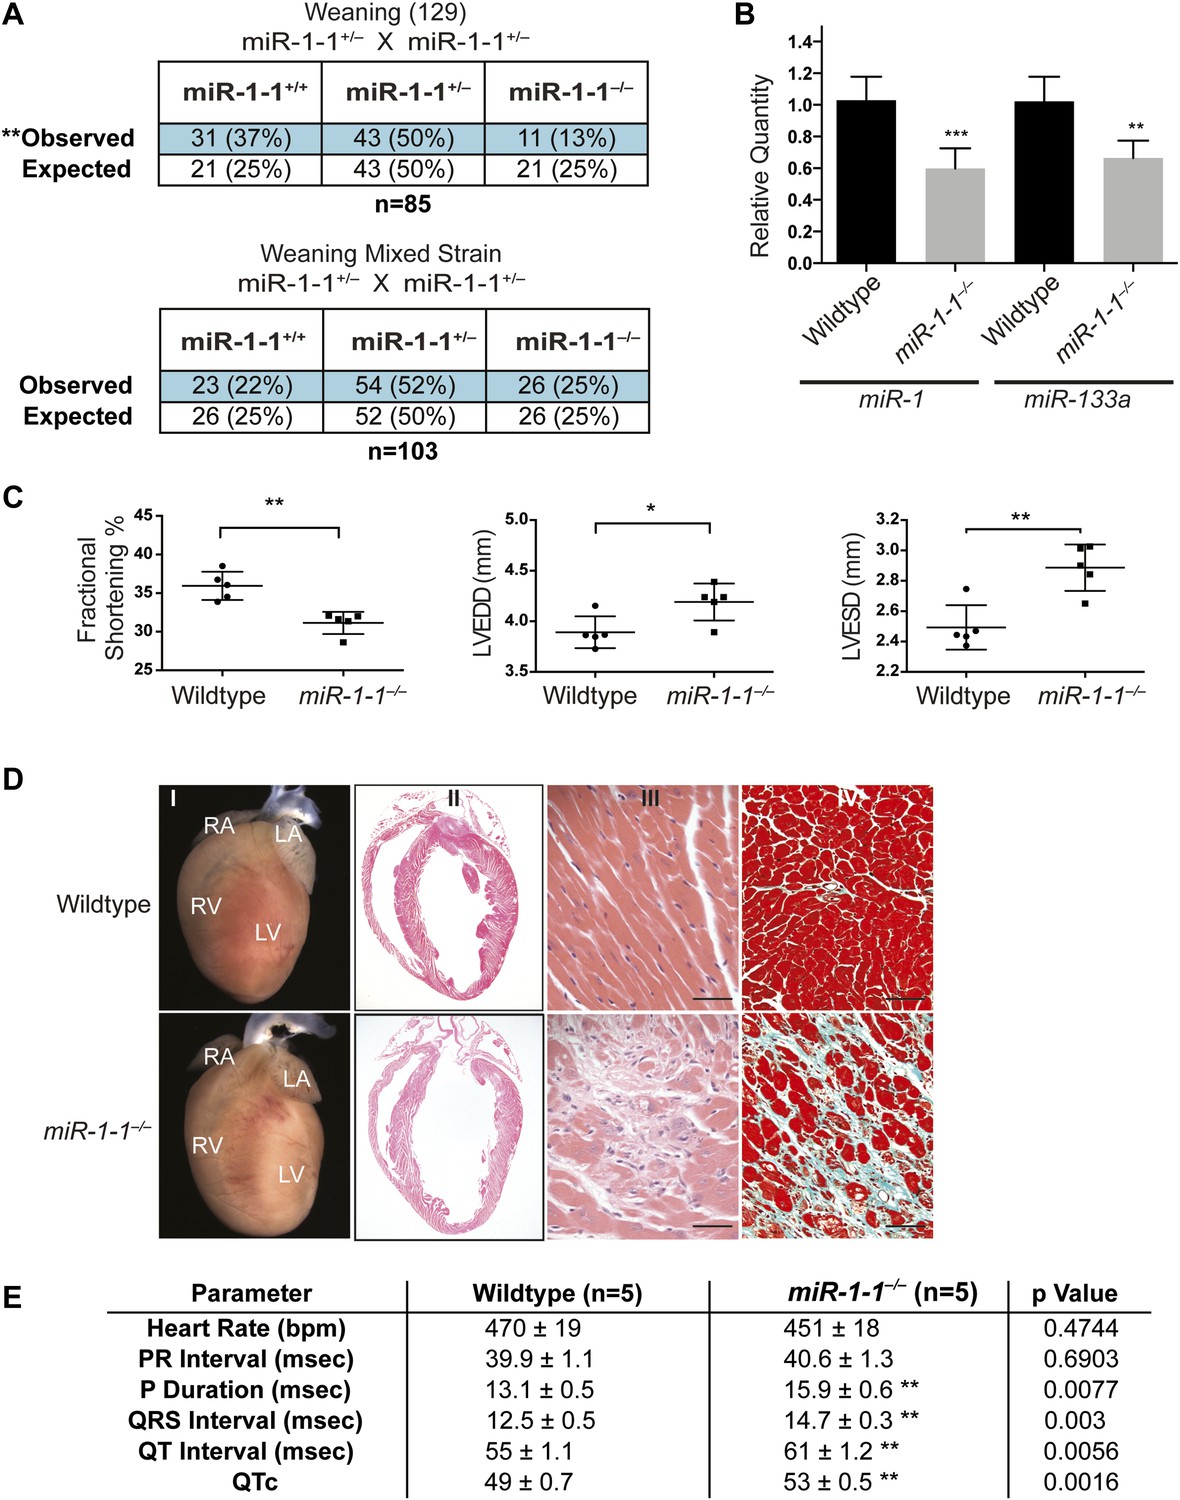
Viability and cardiac function of miR-1-1−/− mice.
(A) Genotypes of offspring generated from miR-1-1+/− intercrosses on either a pure 129 background (upper) or a mixed BL6/129 strain (lower). Numbers of expected and observed genotype ratios are given for weaning-age (3-week-old) pups. (B) qPCR of mature miR-1 and miR-133a in post-natal day 2 hearts. N = 6 per genotype. (C) Analyses of cardiac function by echocardiography of adult animals of indicated genotypes on a pure 129 background. N = 5 per genotype. LVEDD, left ventricular end-diastolic dimension; LVESD, left ventricular end-systolic dimension. (D) Adult wildtype (upper) and miR-1-1−/− (lower) hearts on a pure 129 background (I). RA, right atrium; LA, left atrium; RV, right ventricle; LV, left ventricle. Hematoxylin and eosin images taken at 1.25X magnification (II); and 40X magnification; scale bar indicates 25 μm (III). Masson trichrome stain of miR-1-1 knockout myocardium, images taken at 40X; scale bar 50 μm (IV) (E) Analyses of cardiac conduction by electrocardiogram (EKG) of adult animals of indicated genotypes on a pure 129 background. *p<0.05; **p<0.01; ns, not significant.
Figure 1—figure supplement 1
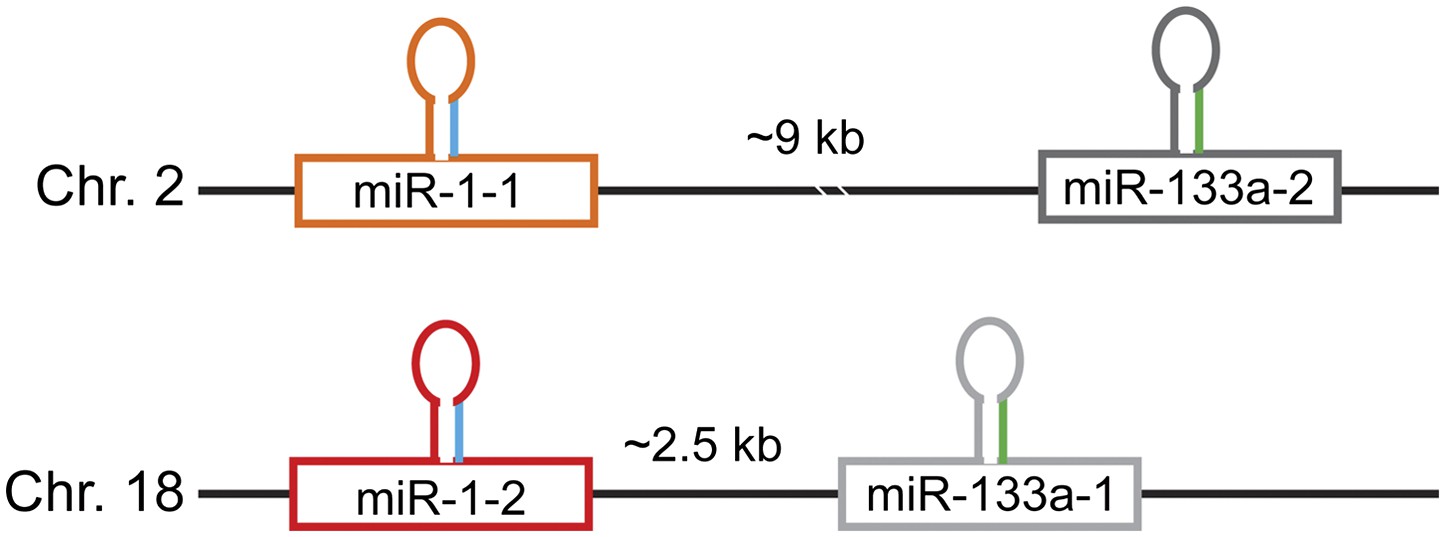
Schematic of the miR-1/133a genomic loci.
The mature miR-1 sequence (depicted in blue) is processed from two distinct miR-1 precursors encoded in the murine genome, miR-1-1 on chromosome 2 and miR-1-2 on chromosome 18. Both miR-1 copies are co-transcribed with miR-133a (mature depicted in green) with the genomic distances between the two miRNAs indicated.
Figure 1—figure supplement 2

Identical sequences of mature miR-1-1 and miR-1-2.
The miR-1 seed sequences (nt 2–8) is indicated in red.
Figure 1—figure supplement 3
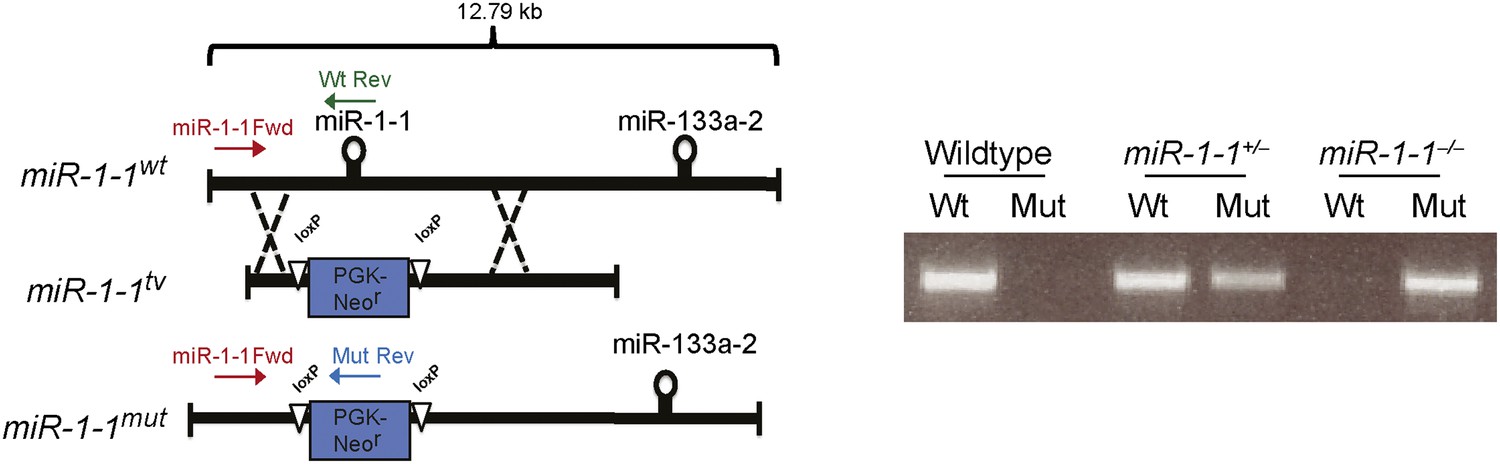
Left, targeting scheme for deletion of the miR-1-1 locus.
Location of genotyping primers indicated. Right, PCR genotyping results from miR-1-1 wild-type, heterozygous, or homozygous knockout animals.
Figure 1—figure supplement 4
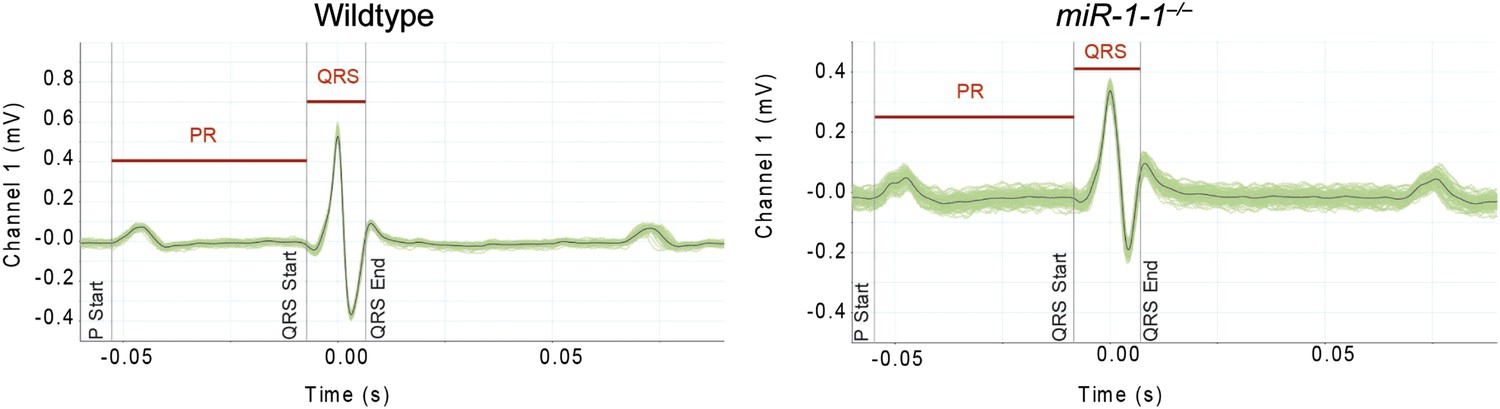
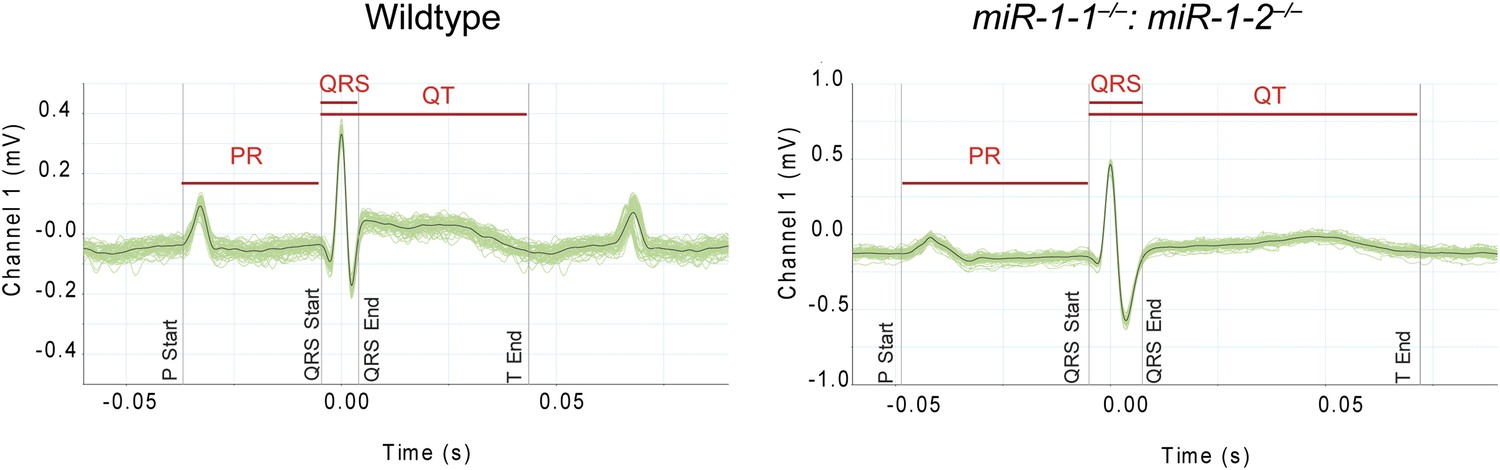
Averaged electrocardiogram tracings tracing from lead I of an adult wild-type or miR-1-1 knockout animal on a pure 129 background.
Green lines represent multiple overlaid EKG tracings with average indicated by black line. PR and QRS intervals indicated.
Figure 1—figure supplement 5
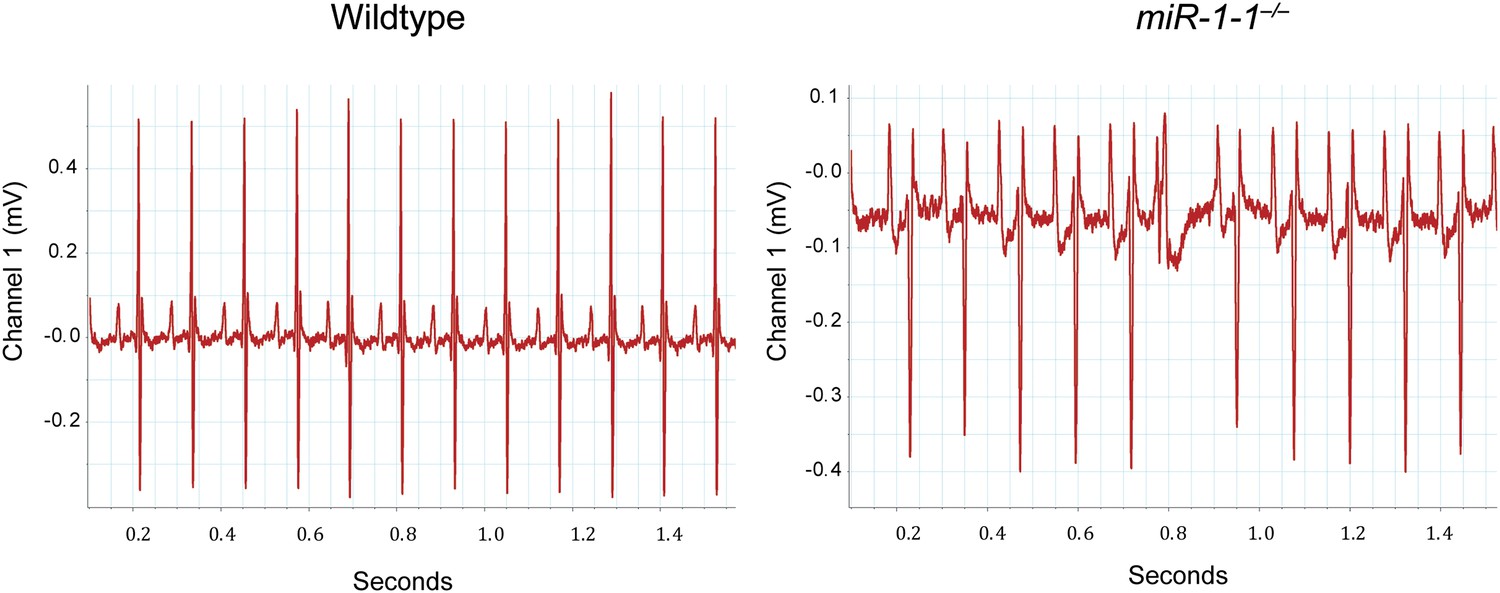
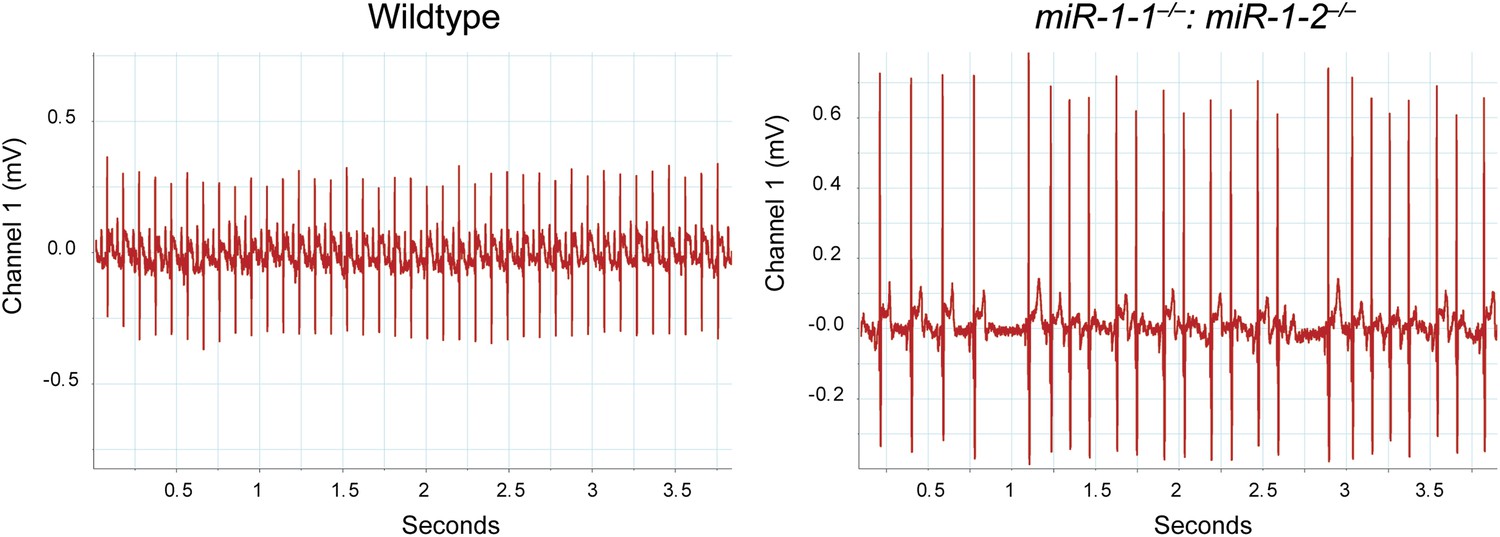
Electrocardiogram tracings of an adult wild-type or miR-1-1 knockout animal on a pure 129 background.
The miR-1-1−/− tracing (right) indicates the presence of an arrhythmia not observed in the wild-type control (left).
Figure 1—figure supplement 6
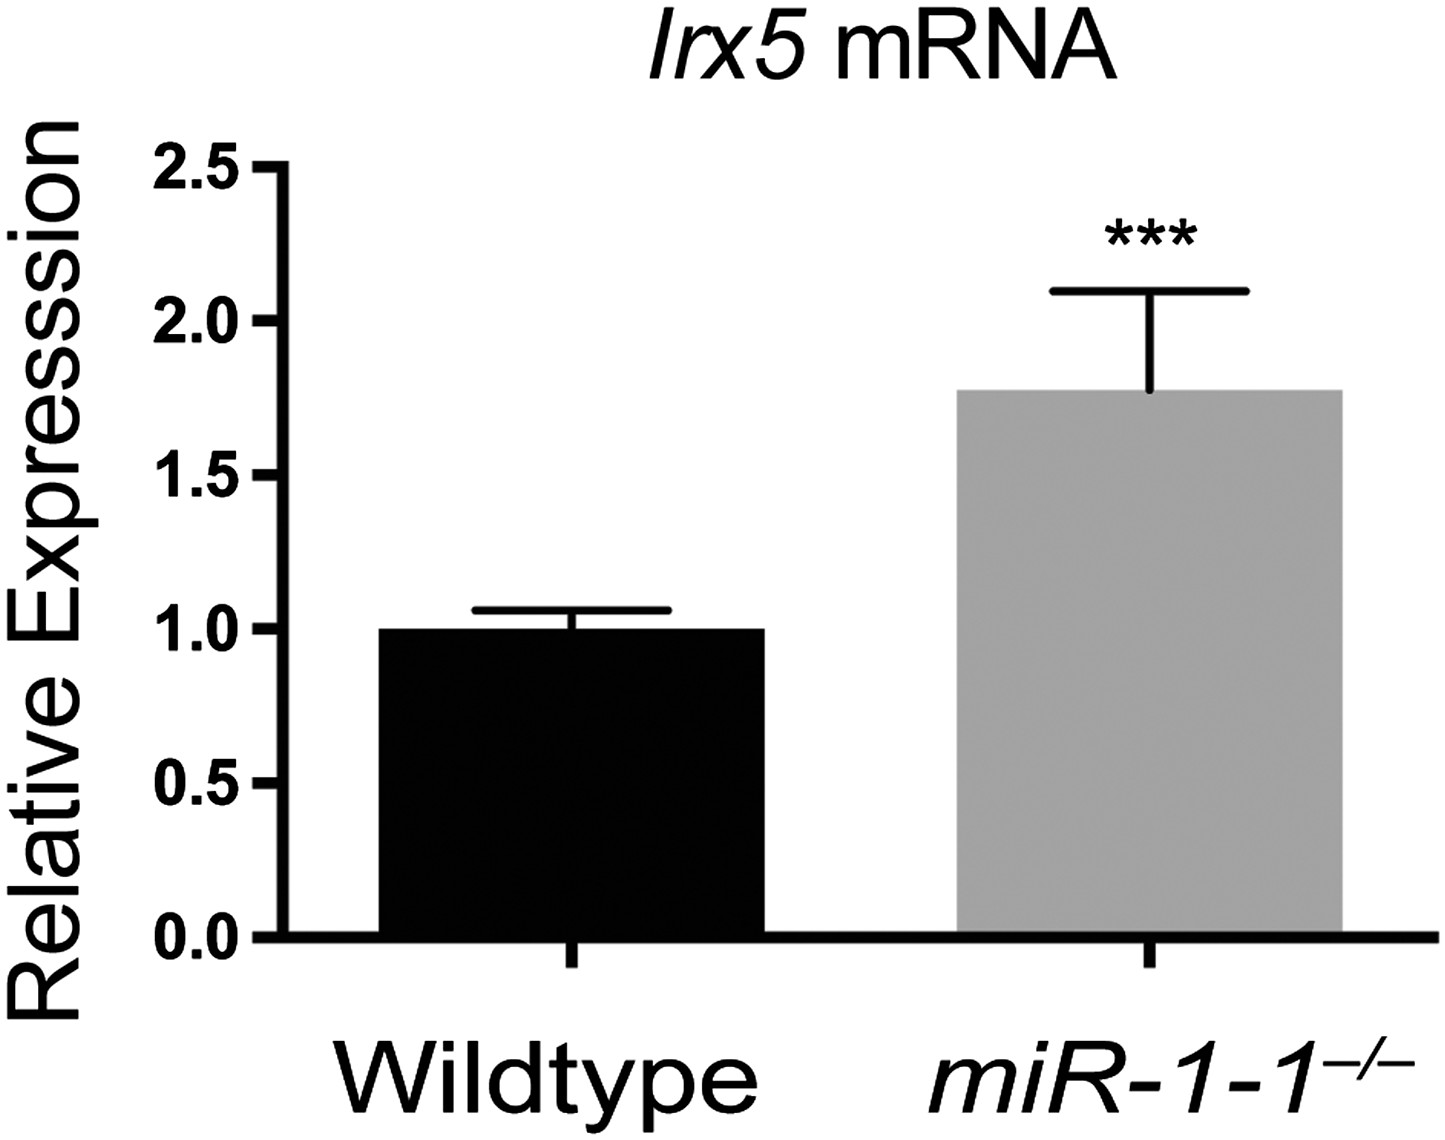
qPCR for the miR-1 target, Irx5, in adult miR-1-1−/− and wild-type hearts.
N = 5 per genotype.
Figure 1—figure supplement 7
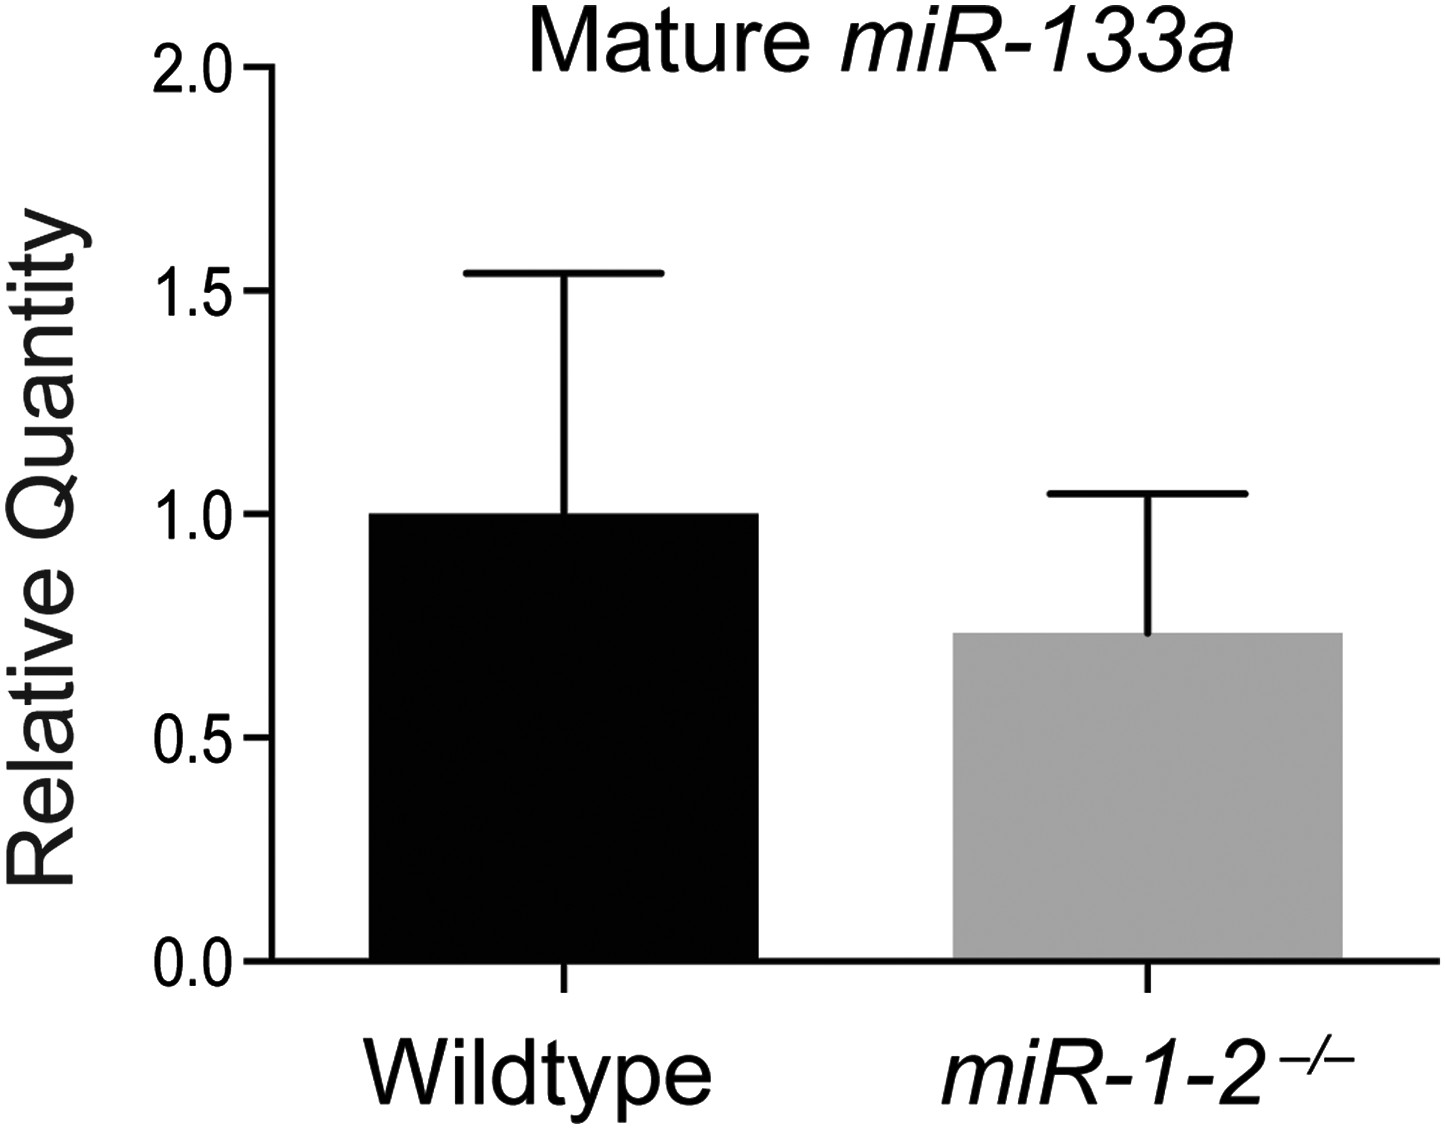
qPCR for mature miR-133a in adult wild-type and miR-1-2 knockout hearts.
https://doi.org/10.7554/eLife.01323.010
Figure 2 with 10 supplements
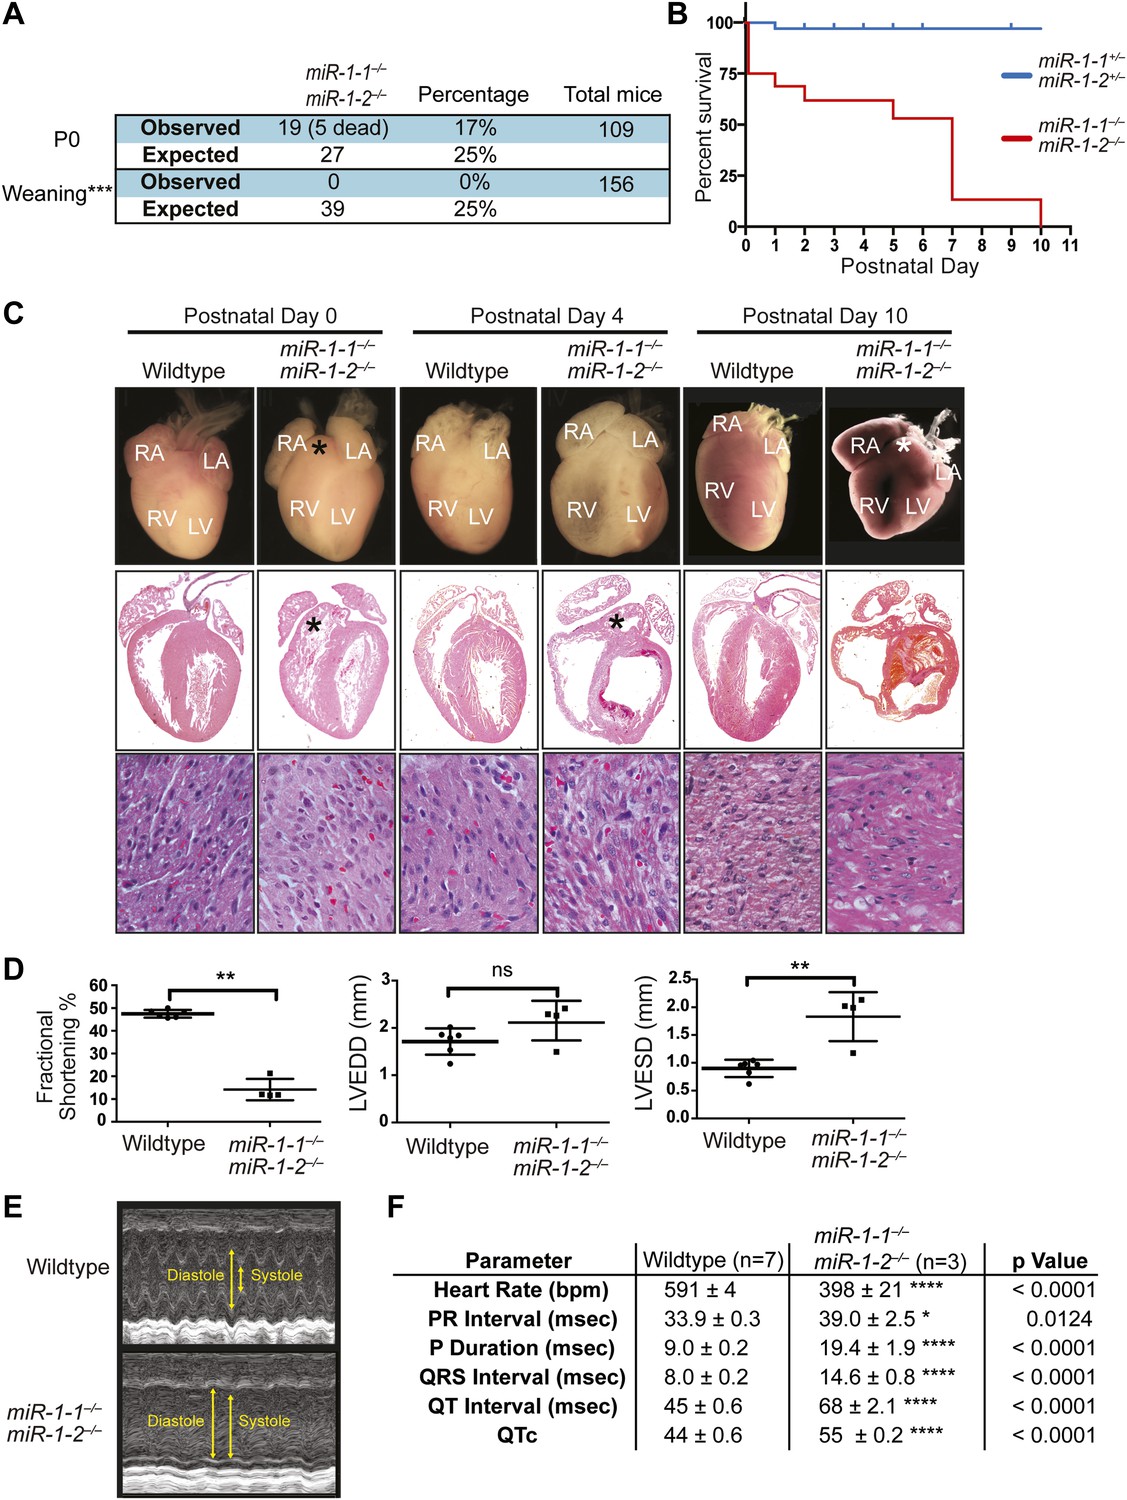
Compound miR-1 knockout mice exhibit lethality due to a spectrum of cardiac defects.
(A) Genotypes of offspring generated from miR-1-1−/+:miR-1-2−/− X miR-1-1−/−: and miR-1-2+/− intercrosses on a mixed BL6/129 background. Numbers of expected and observed genotype ratios are given for post-natal day 0 (P0) and weaning-age (3-week-old) pups. (B) Kaplan-Meier survival curve of miR-1 double-knockout animals and double-heterozygous littermates. (C) Abnormal cardiac morphology in postnatal miR-1 double-knockout mice includes an elongated outflow tract, as evidenced by bulging of the conus at P0 (asterisk). By P4, chamber dilation and thinning of the myocardium was apparent and ventricular clots were commonly observed. RA, right atrium; LA, left atrium; RV, right ventricle; LV, left ventricle. Middle panel images taken at 1.25X magnification; lower panel images taken at 40X magnification. (D) Echocardiography showed abnormal cardiac function in P2 miR-1 null compared to wild-type animals. N = 7 for wild-type mice and N = 4 for miR-1 null mice. LVEDD, left ventricular end-diastolic dimension; LVESD, left ventricular end-systolic dimension. (E) Representative M-mode image by echocardiography indicating diastolic and systolic dimensions. (F) Electrocardiographic analysis revealed conduction abnormalities in miR-1 double-knockout animals by P2, including a decreased heart rate and elongated QRS relative to wild-type controls. *p<0.05; **p<0.01; ***p<0.001;****p<0.0001; ns, not significant.
Figure 2—figure supplement 1
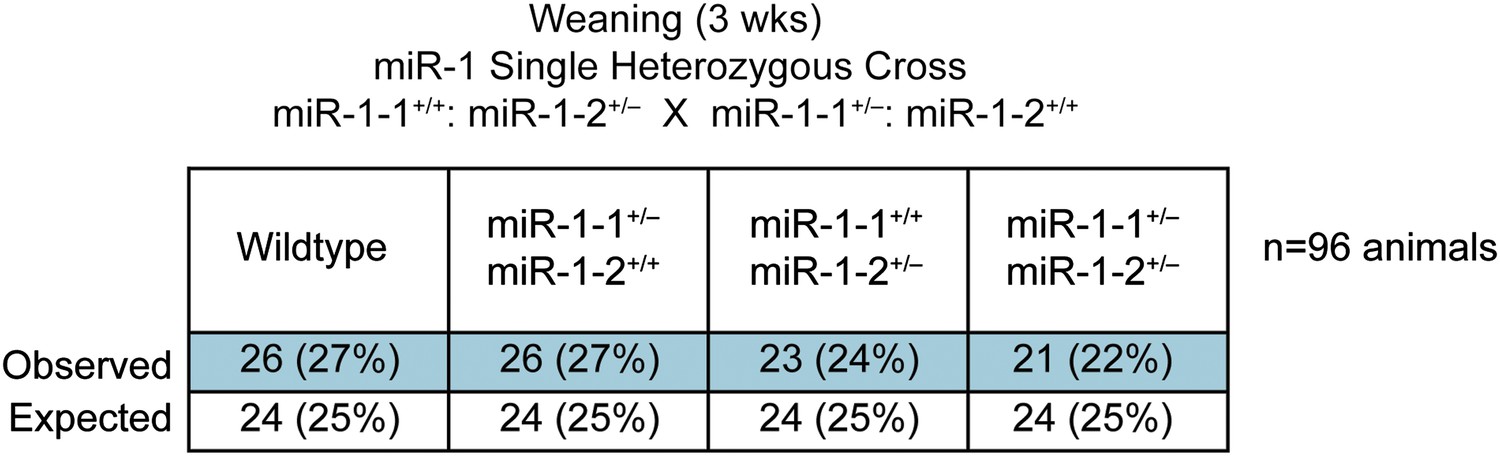
Genotypes of offspring generated from miR-1-1+/−: miR-1-2+/+ X miR-1-1+/+: and miR-1-2+/− intercrosses on a mixed BL6/129 background.
Numbers of expected and observed genotypes are given for weaning-age (3-week-old) pups.
Figure 2—figure supplement 2
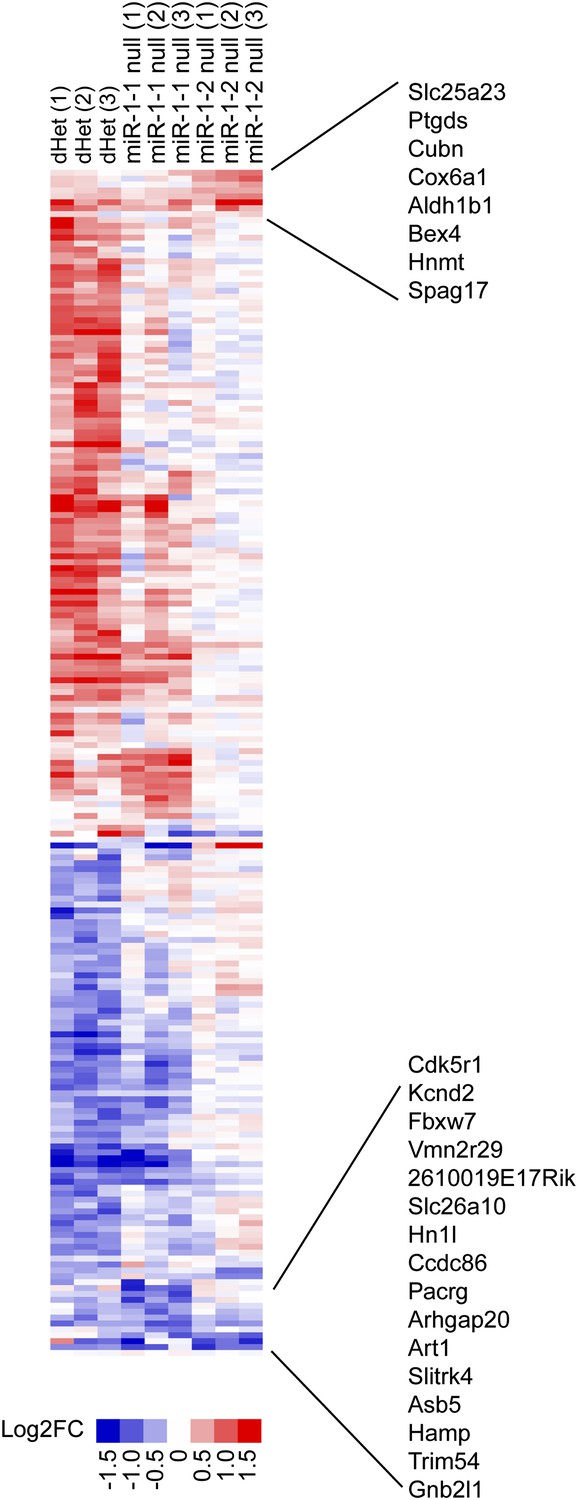
Cluster analysis of relative gene expression changes in miR-1-1−/− and miR-1-2−/− single knockout and miR-1-1+/−:miR-1-2+/− double-heterozygous hearts.
Data presented as Log2 of the fold change compared to averaged wild-type controls. Genes that were coordinately regulated among all three genotypes are indicated. N = 3 per genotype.
Figure 2—figure supplement 3
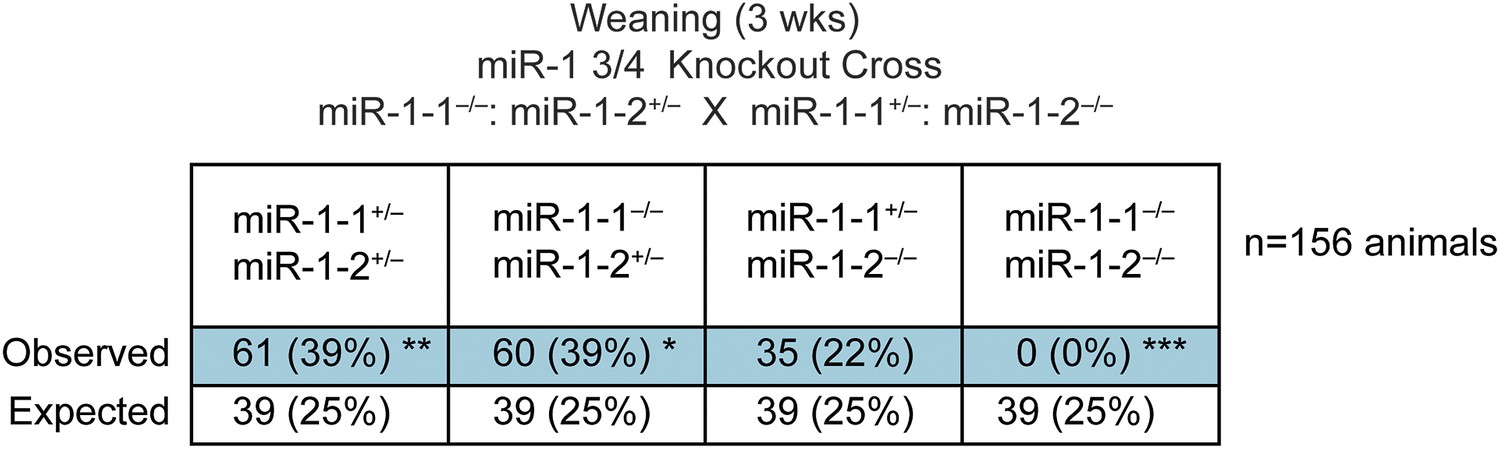
Genotypes of offspring generated from miR-1-1−/−: miR-1-2+/− X miR-1-1+/−: miR-1-2−/− intercrosses on a mixed BL6/129 background at weaning.
Numbers of expected and observed genotypes are given for weaning-age (3-week-old) pups.
Figure 2—figure supplement 4
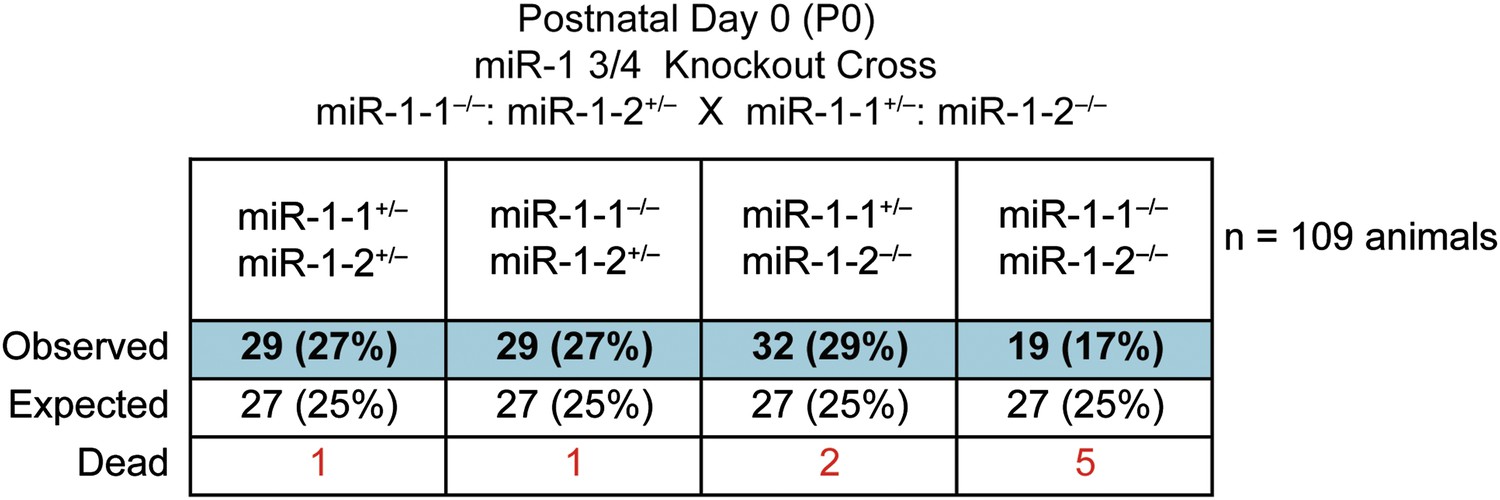
Genotypes of offspring generated from miR-1-1−/−: miR-1-2+/− X miR-1-1+/−; and miR-1-2−/− intercrosses on a mixed BL6/129 background at birth.
Numbers of expected and observed genotypes are given for postnatal day 0 pups. Animals discovered dead at birth are indicated.
Figure 2—figure supplement 5
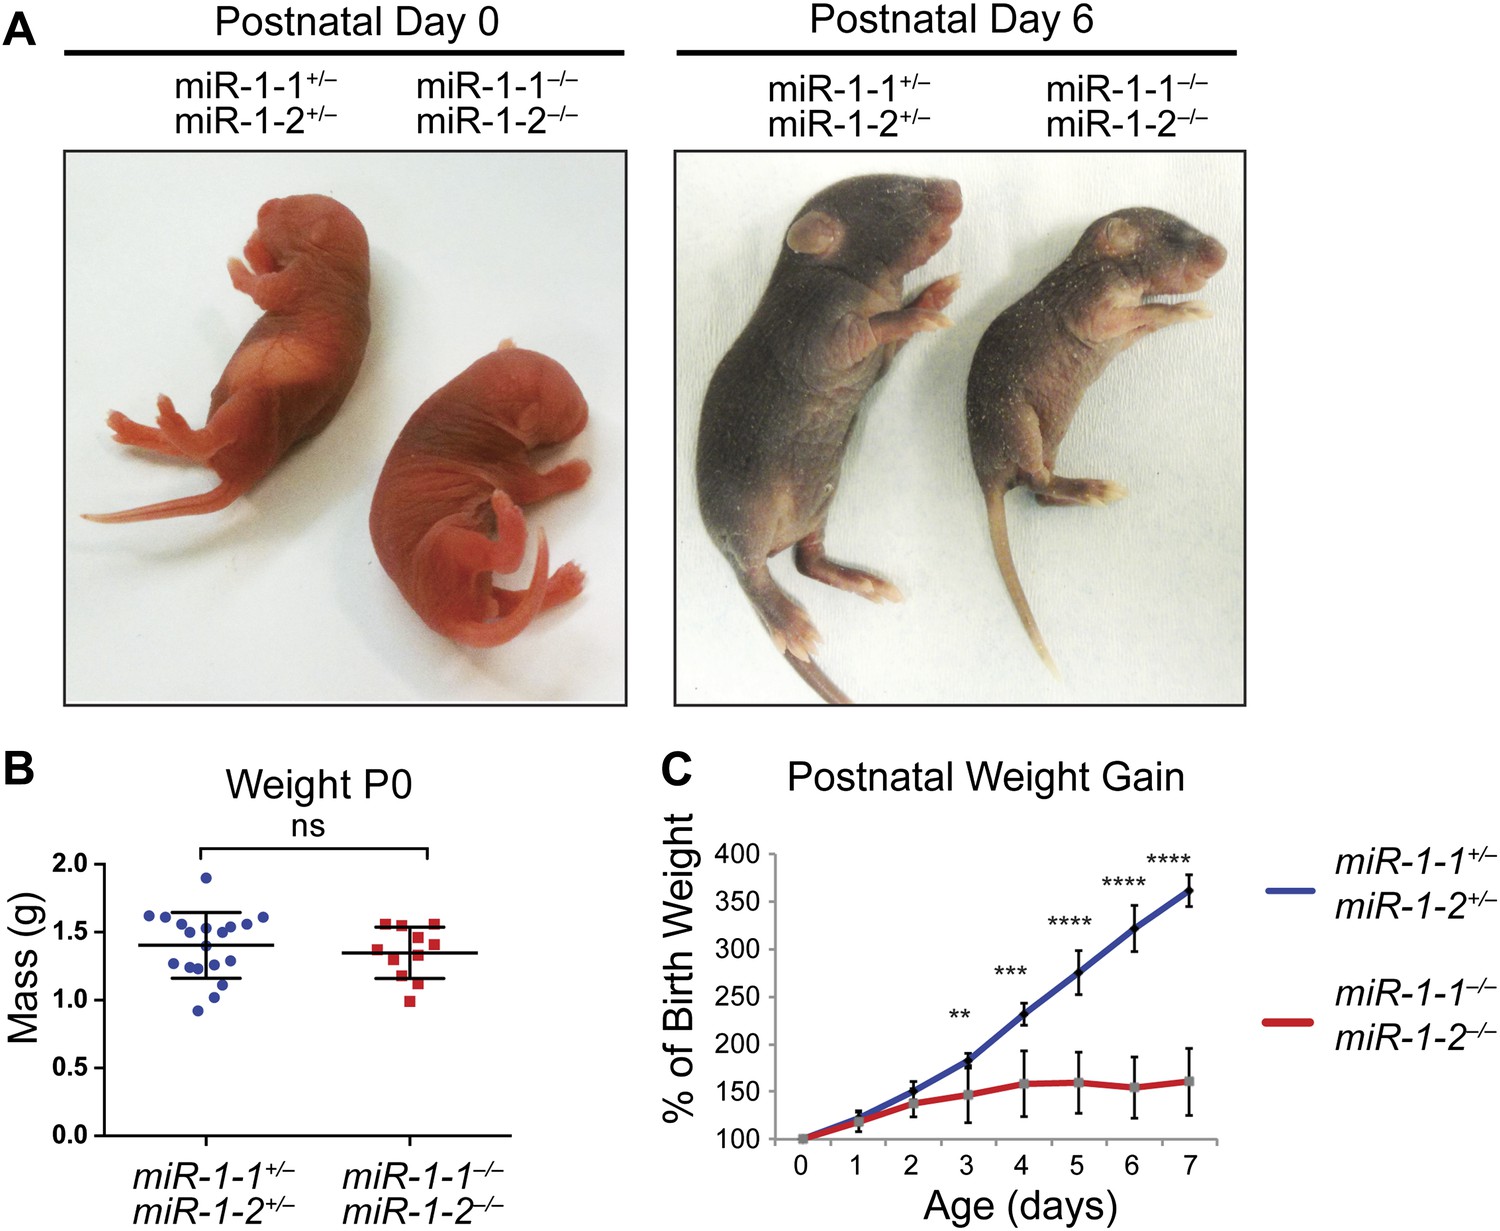
miR-1 double-knockouts fail to thrive.
(A) Images of miR-1 knockout animals and double-heterozygous littermates at indicated ages. (B) Mass of P0 double-knockout animals (n = 11) or double-heterozygous littermates (n = 19). (C) Post-natal weight gain as a percentage of birth weight of miR-1 double-knockouts or double-heterozygous littermates.
Figure 2—figure supplement 6
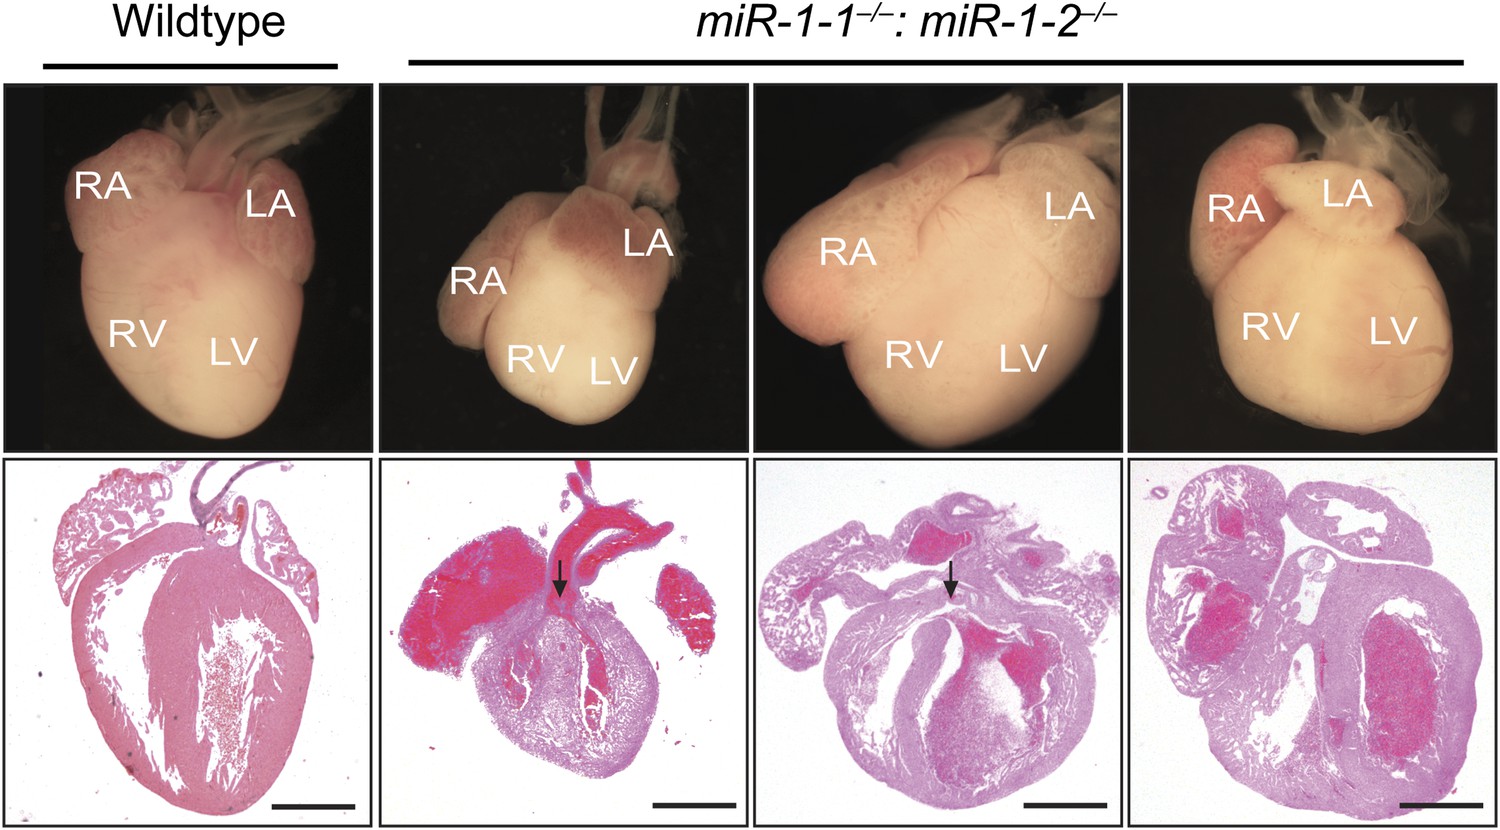
Abnormal cardiac morphology in miR-1 double-knockouts found dead at birth compared to wild-type control.
A subset of miR-1 null mice found dead at birth had ventricular septal defects (arrows). All animals displayed dilated atria. RA, right atrium; LA, left atrium; RV, right ventricle; LV, left ventricle.
Figure 2—figure supplement 7
Averaged electrocardiogram tracings from lead I of P2 miR-1 null (right) or wild-type (left) mice.
Green lines represent multiple overlaid EKG tracings with average indicated by black line. PR, QRS and QT intervals indicated.
Figure 2—figure supplement 8
Electrocardiogram tracings of a postnatal wild-type or miR-1 null animal on a mixed background.
The miR-1 null tracing (right) indicates the presence of multiple arrhythmias not observed in the wild-type control (left).
Figure 2—figure supplement 9
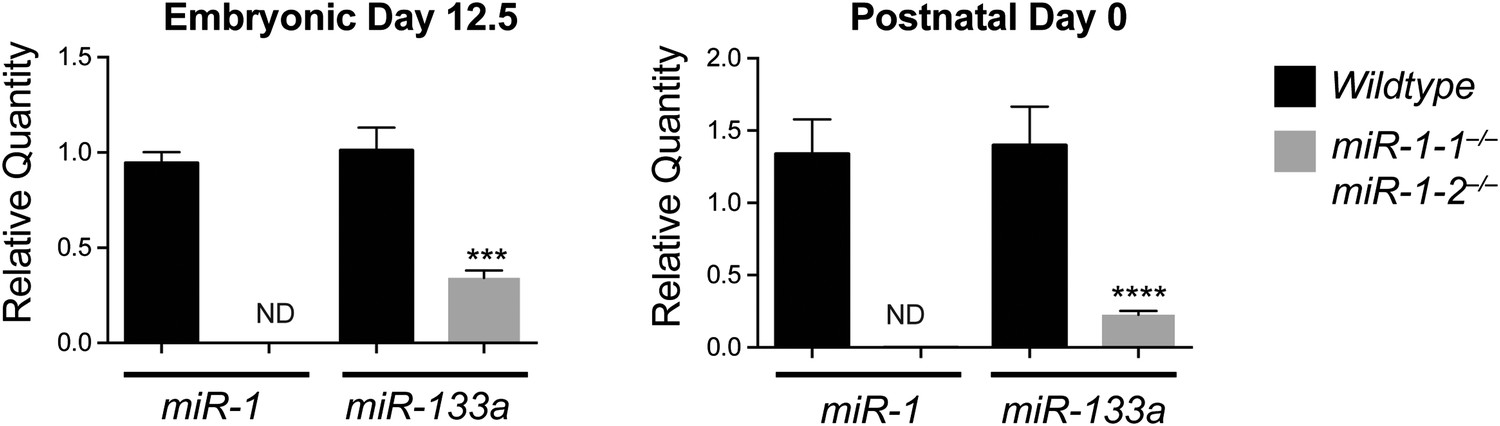
Left, qPCR of mature miR-1 or miR-133a in E12.5 wild-type or miR-1 null hearts (n = 3 per genotype). Right, mature miRNA expression in P0 wild-type or miR-1 null hearts (n = 5 per genotype).
ND = not detected.
Figure 2—figure supplement 10
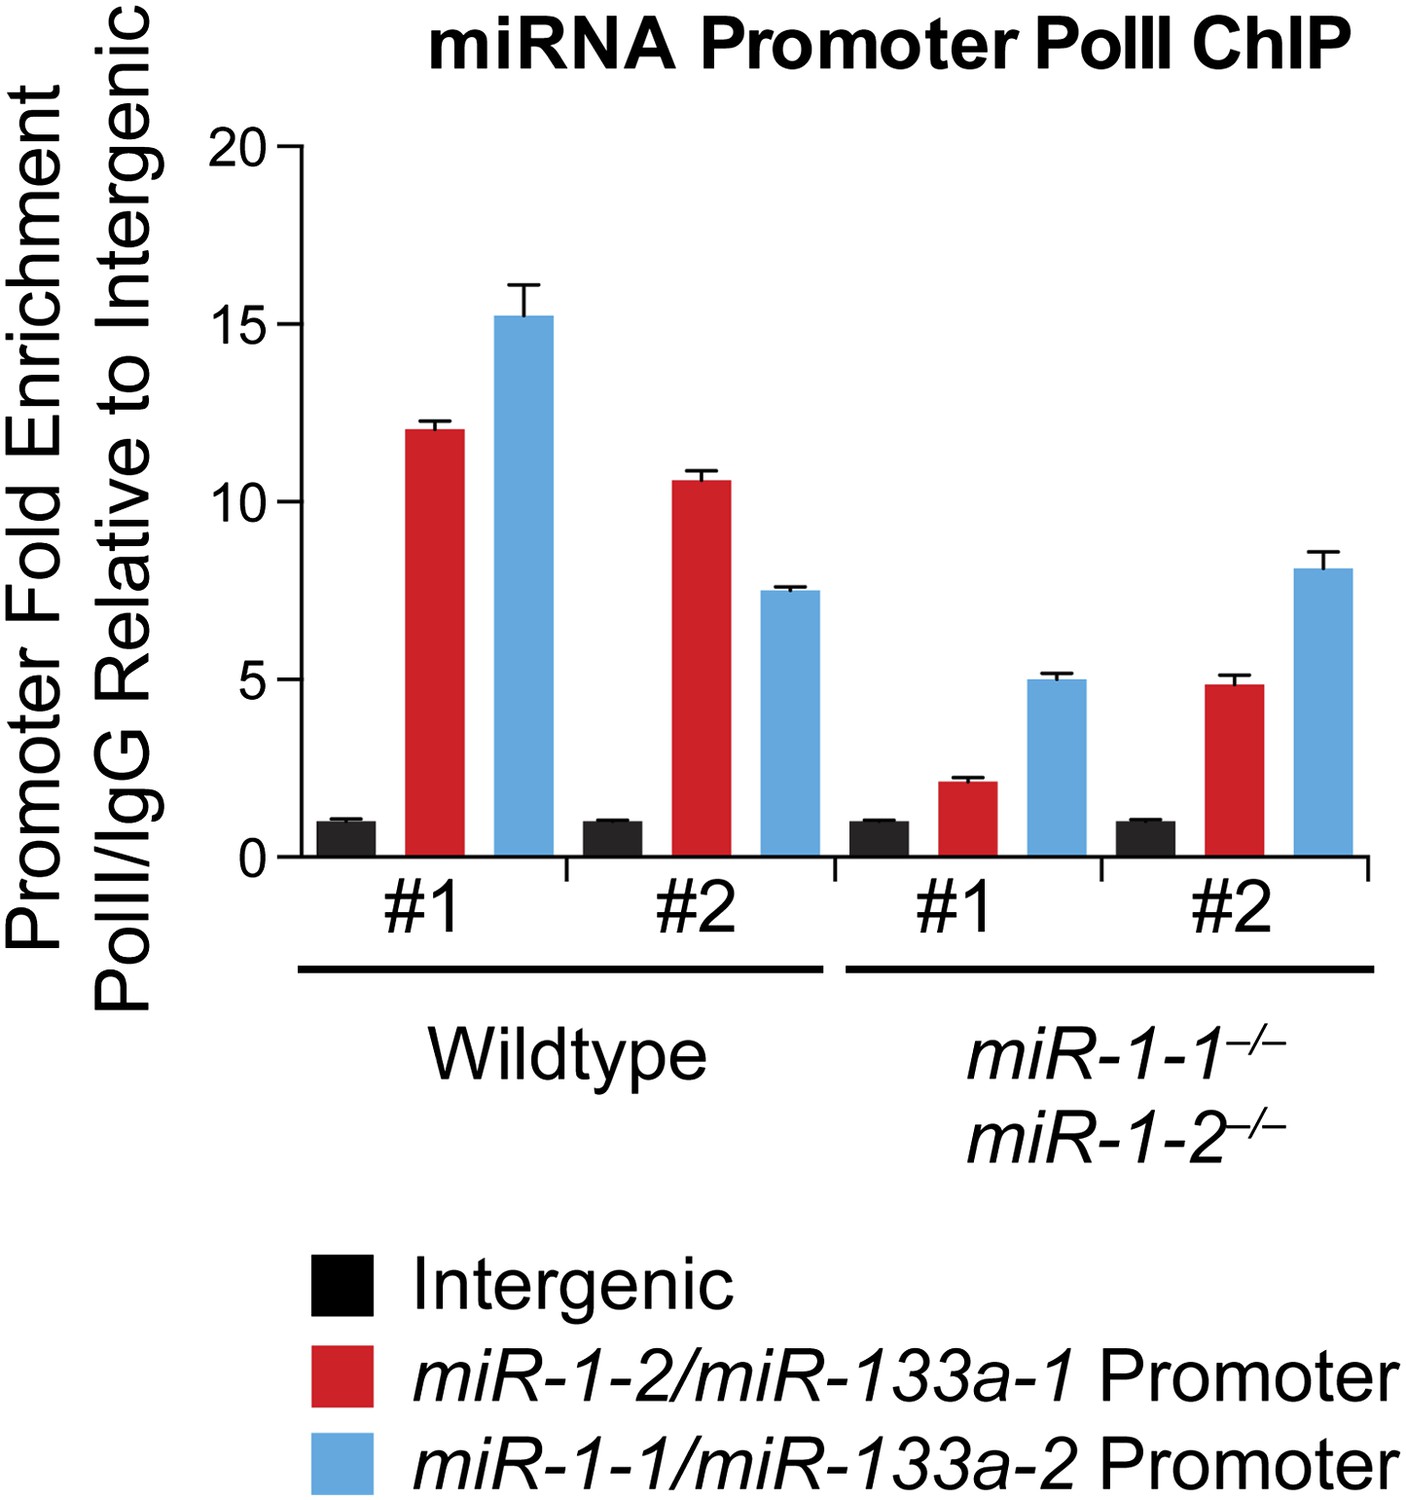
qPCR to detect the miR-1-2/133a-1 or miR-1-1/133a-2 promoter sequences, or an intergenic genomic sequence, following chromatin immunoprecipitation (ChIP) of RNA polymerase II (RNA Pol II) in P2 wild-type or miR-1 null hearts.
https://doi.org/10.7554/eLife.01323.021
Figure 3 with 3 supplements
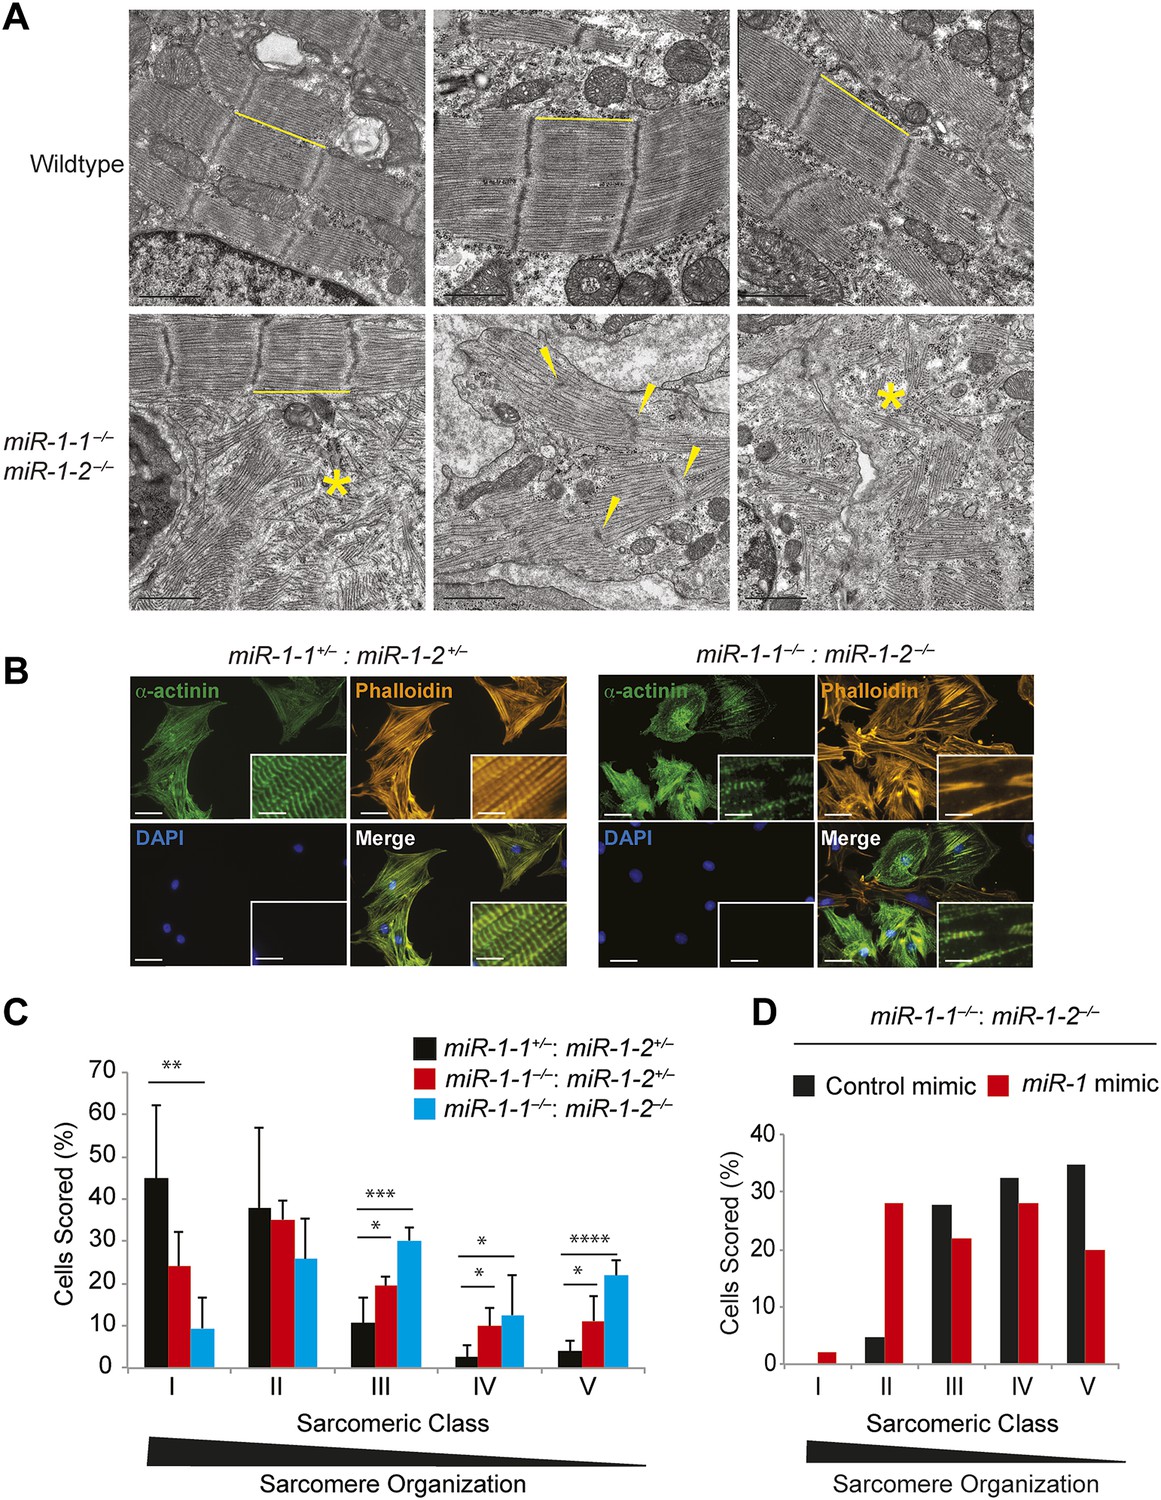
Sarcomere disruption in miR-1 null cardiomyocytes.
(A) Transmission electron microscopy (TEM) of P0 wild-type or miR-1 double-knockout myocardium. Representative areas of sarcomeric disarray are indicated (*). Distance between Z-lines is indicated with lines. Arrows indicate disrupted Z-line structures. Scale bar, 1 μm. (B) Immunofluorescence of sarcomeric structures in isolated P0 cardiomyocytes with Phalloidin (F-actin cytoskeleton [orange]) and sarcomeric alpha-actinin (green) DAPI (blue) indicates nuclei. Images captured at 40X magnification. (C) Percentage of cardiomyocytes of individual sarcomeric classes observed. N = 3 for miR-1 null mice; N = 2 for miR-1-1−/−:miR-1-2+/− mice; and n = 6 for miR-1 double-heterozygous mice, with a minimum of 50 cells classified per animal. (D) Representative analysis showing percentage of P5 miR-1 null cardiomyocytes of individual sarcomeric classes observed 24 hr after transfection of a miR-1 mimic or control RNA mimic. Roughly 50 cardiomyocytes per condition were evaluated. *p<0.05; **p<0.01; ***p<0.001;****p<0.0001; ns, not significant.
Figure 3—figure supplement 1
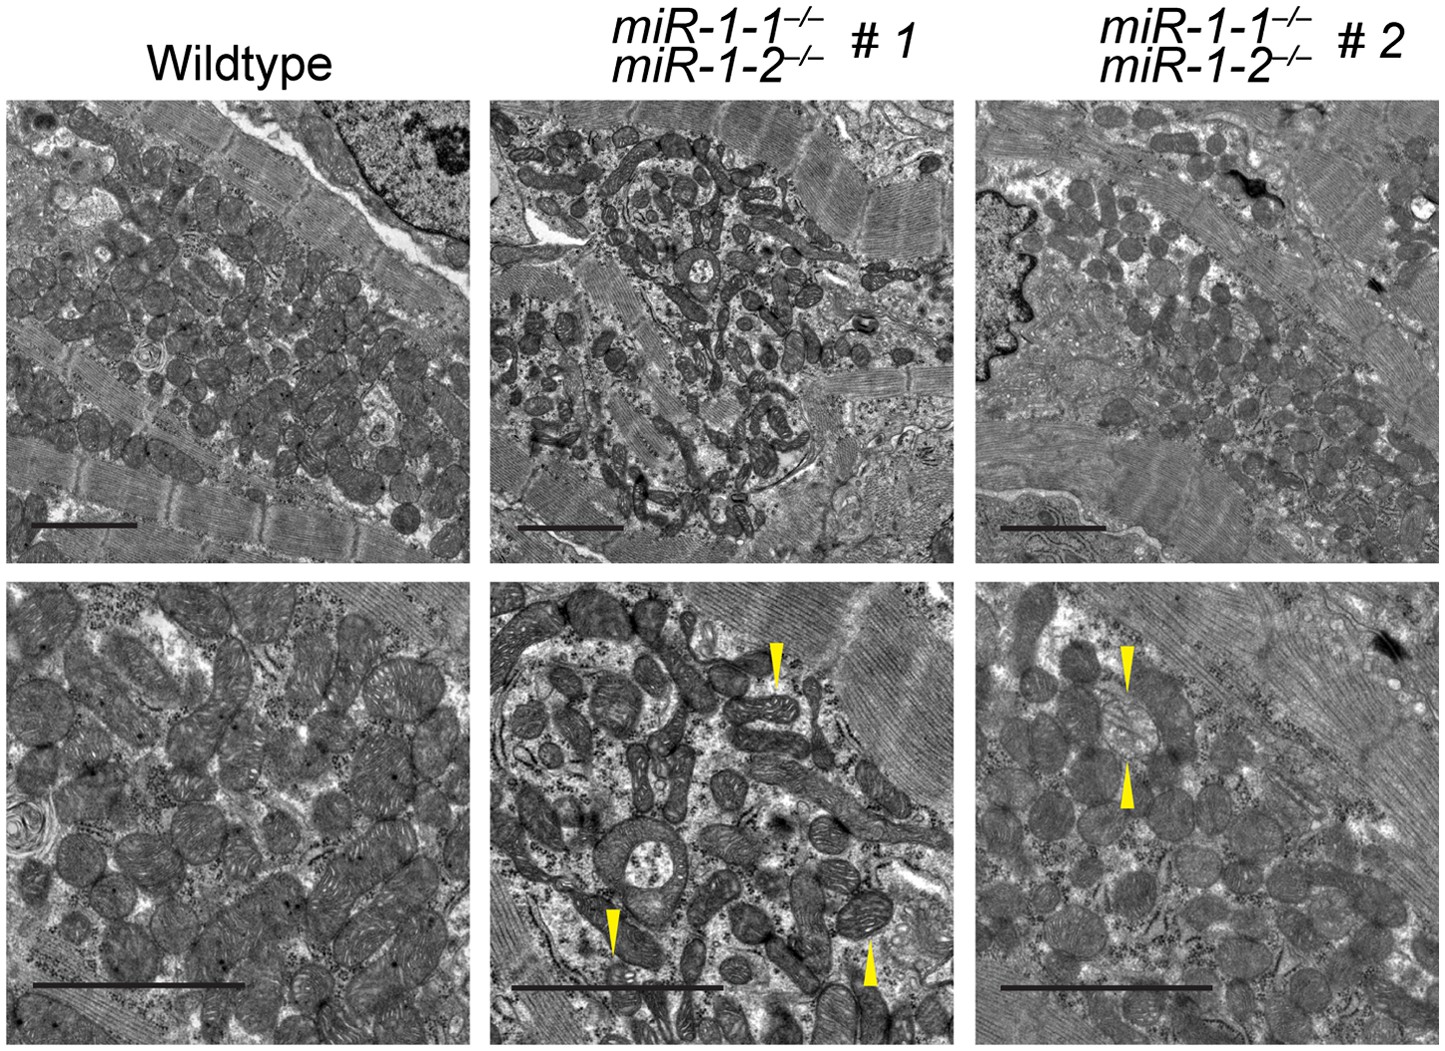
Transmission electron microscopy (TEM) reveals mitochondrial morphology defects in miR-1 null hearts.
TEM of P0 wild-type or two miR-1 double-knockout animals. Arrowheads indicate mitochondria with low cristae density. Scale bars equal 2 μm.
Figure 3—figure supplement 2
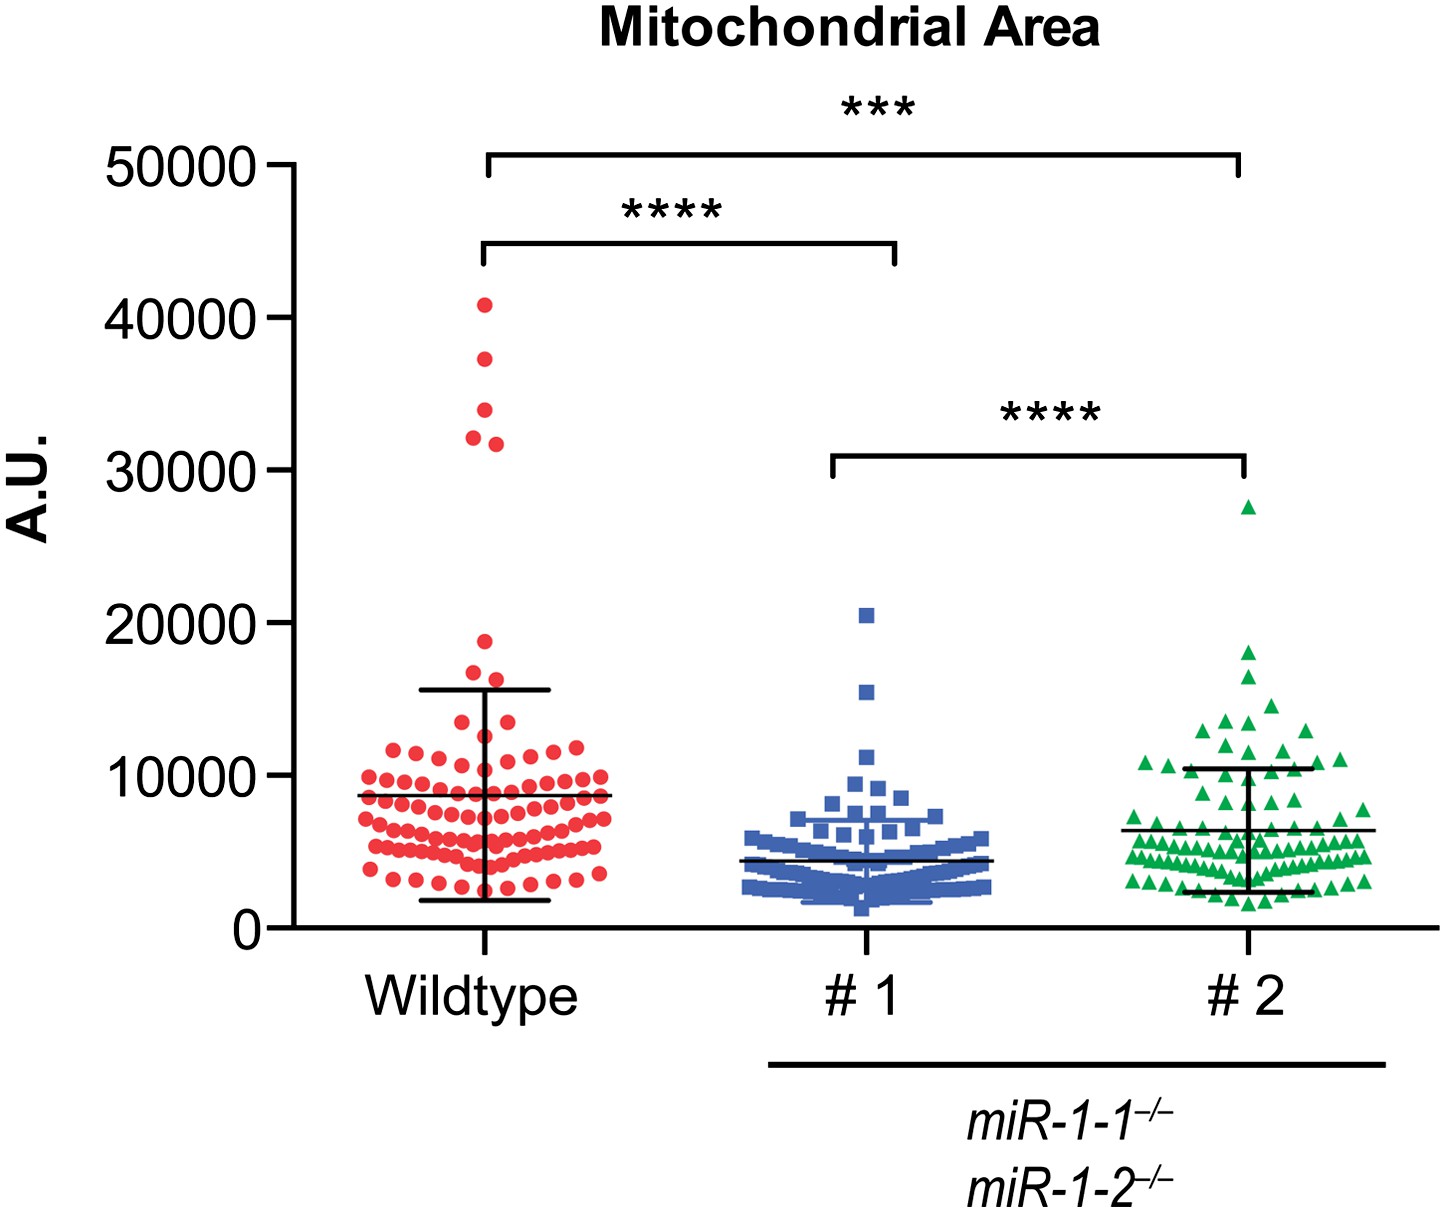
Quantification of mitochondrial area from TEM images reveals a reduction in mitochondrial area in both miR-1 double-knockouts compared to controls, although the degree to which mitochondrial area is reduced varies.
https://doi.org/10.7554/eLife.01323.024
Figure 3—figure supplement 3
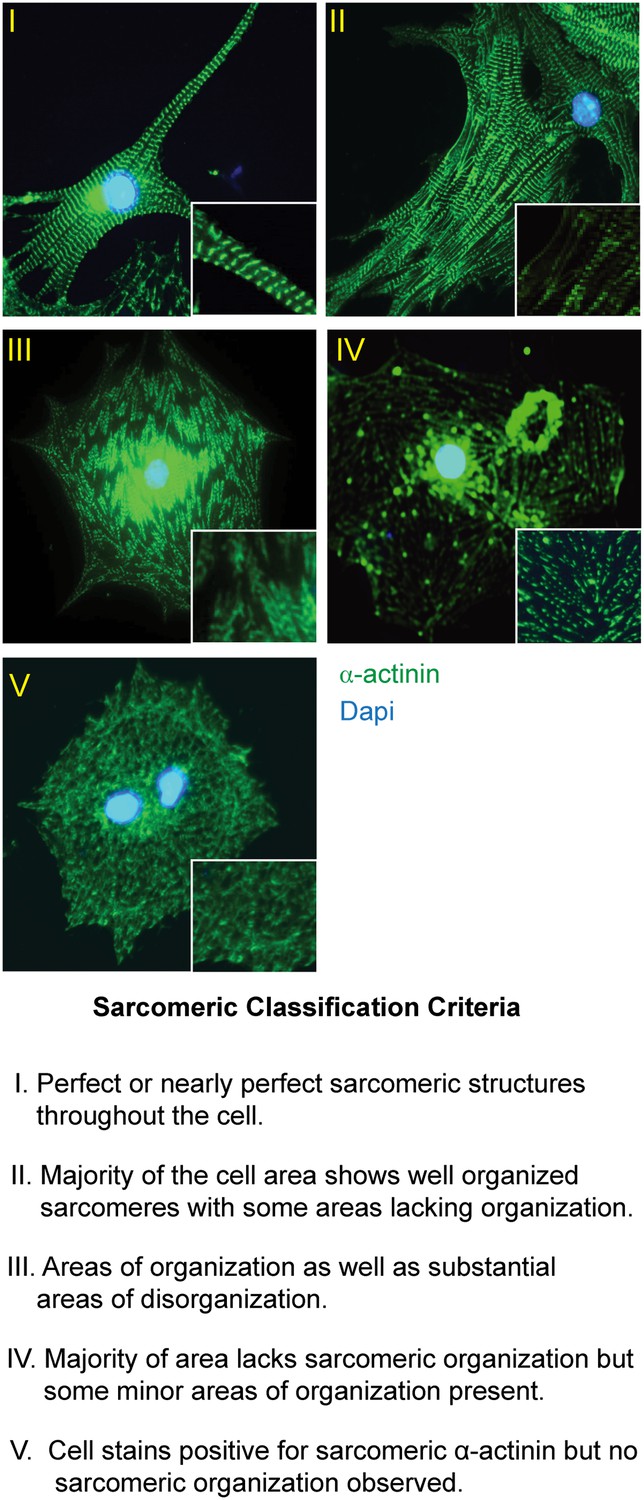
Sarcomeric organization classification scheme.
Description of sarcomeric organization scheme used in Figure 3C and D with corresponding representative images. Sarcomeric structure highlighted with immunostaining for the Z-line protein α-actinin (green). Nuclei stained with DAPI (blue).
Figure 4 with 1 supplement
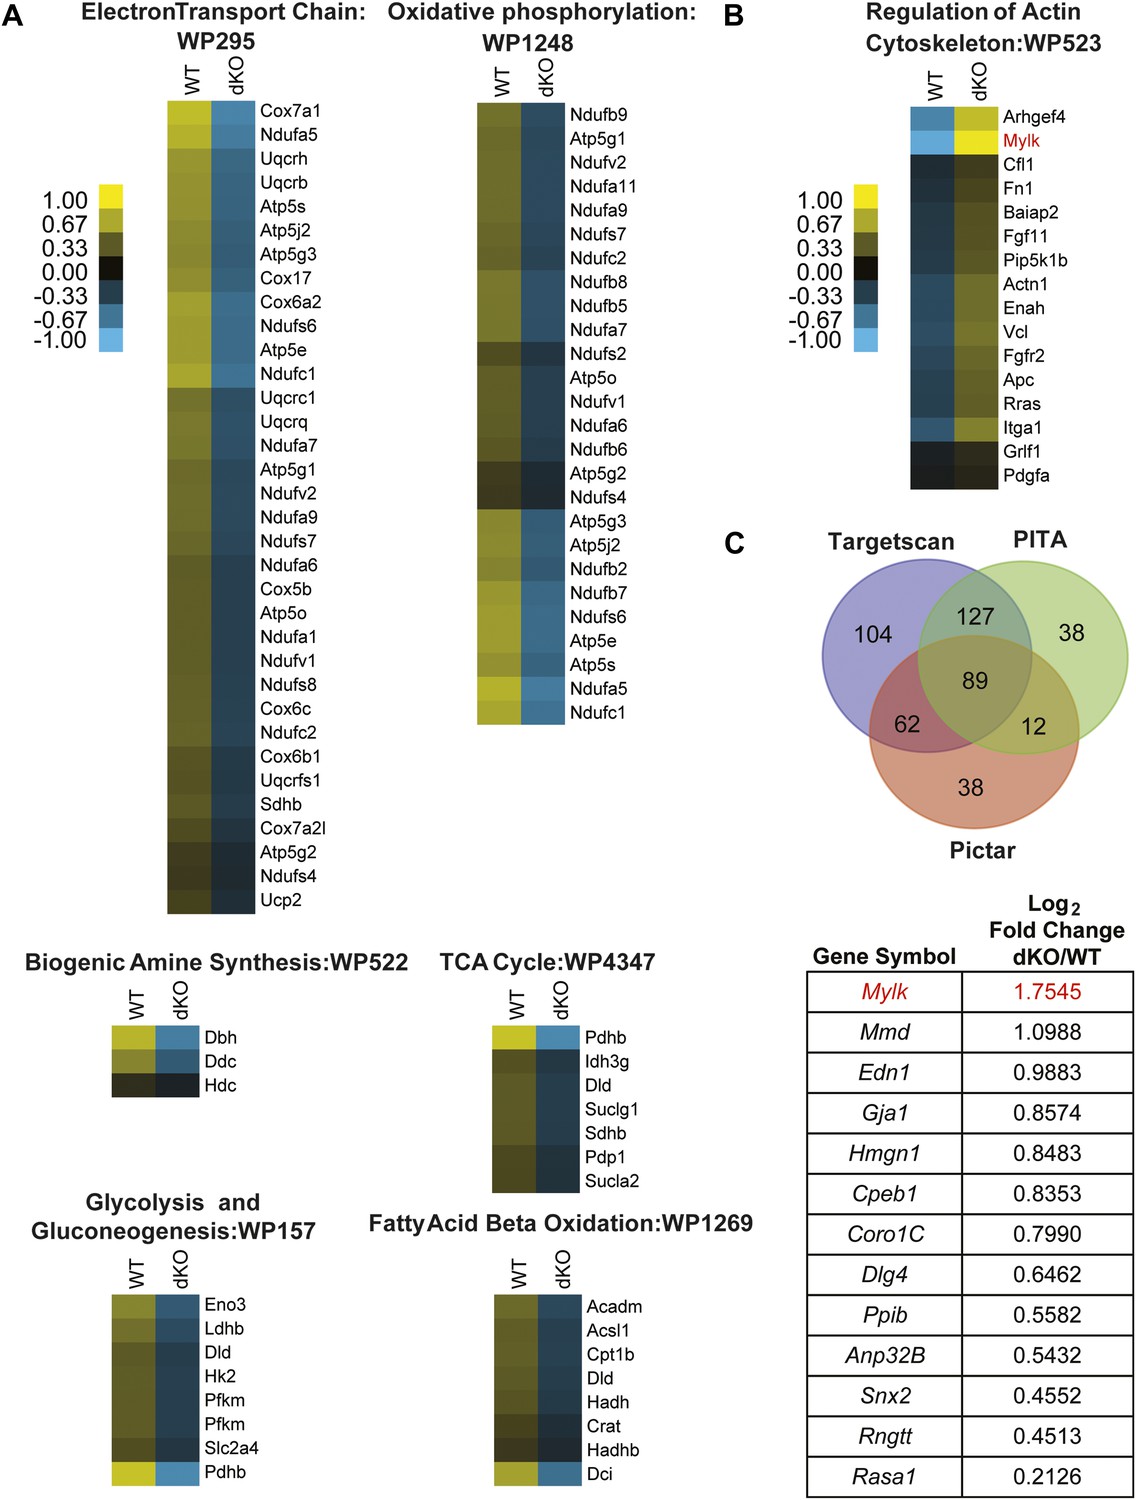
Pathway analysis of genes dysregulated in E18 miR-1 null hearts.
(A) Pathway analysis of genes downregulated in E18 miR-1 null hearts identified via Go-elite and GenMAPP. Pathways related to metabolism are enriched. (B) Pathway analysis of genes upregulated in the miR-1 null hearts identified via Go-elite and GenMAPP. Values represent normalized mean centered log2 of FPKM for each genotype. (C) Venn diagram depicting overlap of miR-1 targets as predicted by three prediction algorithms: Targetscan, PITA and Pictar. The genes analyzed were expressed at a relative quantity of ≥1 in miR-1 null vs wild-type hearts based on their FPKM (upper). Consensus targets predicted by all three algorithms, showing significant upregulation in the miR-1 null vs wild-type hearts are presented as descending log2 fold change in miR-1 null over wild-type hearts (lower). Mylk (MLCK) in red was identified as a regulator of the actin cytoskeleton (B) and a significantly upregulated, predicted miR-1 target (C). dKO, double-knockout; WT, wild-type; FPKM, fragments per kilobase per million.
-
Figure 4—source data 1
miR-1 targets as predicted by three algorithms.
Putative miR-1 target genes as predicted by Targetscan, PITA and Pictar. Genes used for this analysis were expressed at a relative quantity of ≥1 based on FPKM in miR-1 null vs wild-type hearts. Genes indicated in bold were significantly upregulated (FDR<0.1) in miR-1 null vs wild-type hearts.
- https://doi.org/10.7554/eLife.01323.027
Figure 4—figure supplement 1
MicroRNA target enrichment analysis of genes that were expressed at a relative quantity of ≥1 in the miR-1 null vs wild-type hearts.
The miR-1/206 seed but not the miR-133a seed was enriched in this gene set.
Figure 5 with 1 supplement

Dysregulation of Telokin and Myosin light chain phosphorylation in miR-1 null hearts.
(A) Diagram of the gene products encoded within the Mylk locus. Independent promoters preceding exons are indicated by arrows. Exon-spanning qPCR primers used are indicated in red (Mlck/Telokin) or blue (Mlck). (B) Luciferase activity of a reporter construct containing ∼200 bp of the Mlck/Telokin 3′-UTR surrounding the predicted miR-1 binding site with or without the site deleted. The constructs were co-transfected into H9C2 myoblasts with a miR-1 mimic or a control mimic. Sequence of the putative miR-1 target site as predicted by Targetscan and site conservation between human (Hs) and mouse (Mm) is indicated. (C) Western blot of heart lysates (top) and qPCR of RNA (bottom) from P0 wild-type or miR-1 null mice. (N = 5 per group). (D) Model of Telokin function in smooth muscle to promote the activity of myosin light chain phosphatase and inhibit the activity of the myosin light chain kinase. (E) Western blot of total myosin light chain 2 (MLC2) and phosphorylated myosin light chain (p-MLC2) in P0 wild-type or miR-1 null hearts; GAPDH serves as loading control. (F) qPCR of the Telokin promoter sequence or an intergenic genomic sequence following chromatin immunoprecipitation (ChIP) of RNA polymerase II in P2 wild-type or miR-1 null hearts. For the Telokin promoter, two non-overlapping probe sets were used, indicated as Telokin promoter A and B.
Figure 5—figure supplement 1
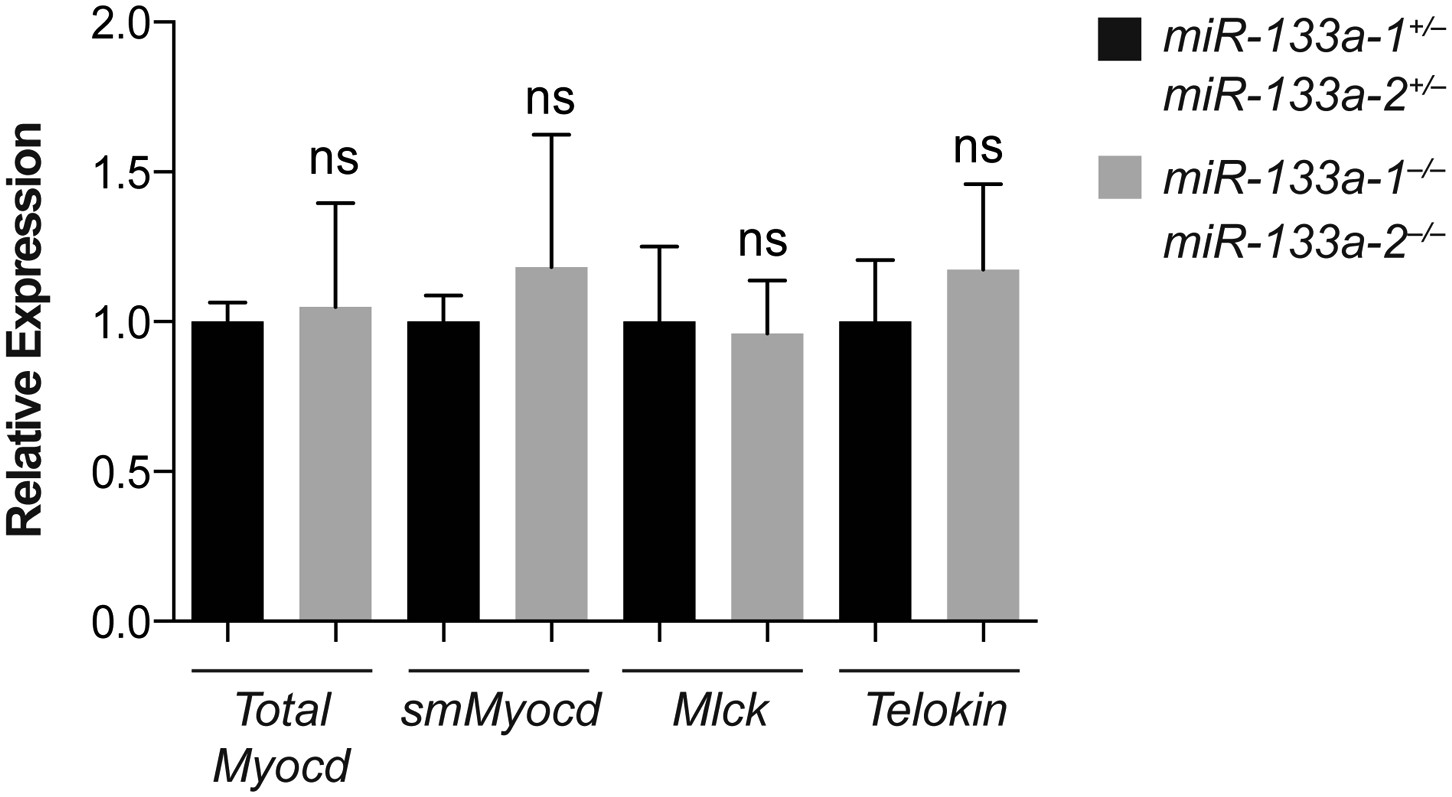
Putative miR-1 targets dysregulated in miR-1 null hearts were not affected in miR-133a double-knockout hearts.
qPCR of indicated transcripts in adult hearts from miR-133a double-knockout or double-heterozygous animals. N = 2 per genotype.
Figure 6 with 2 supplements
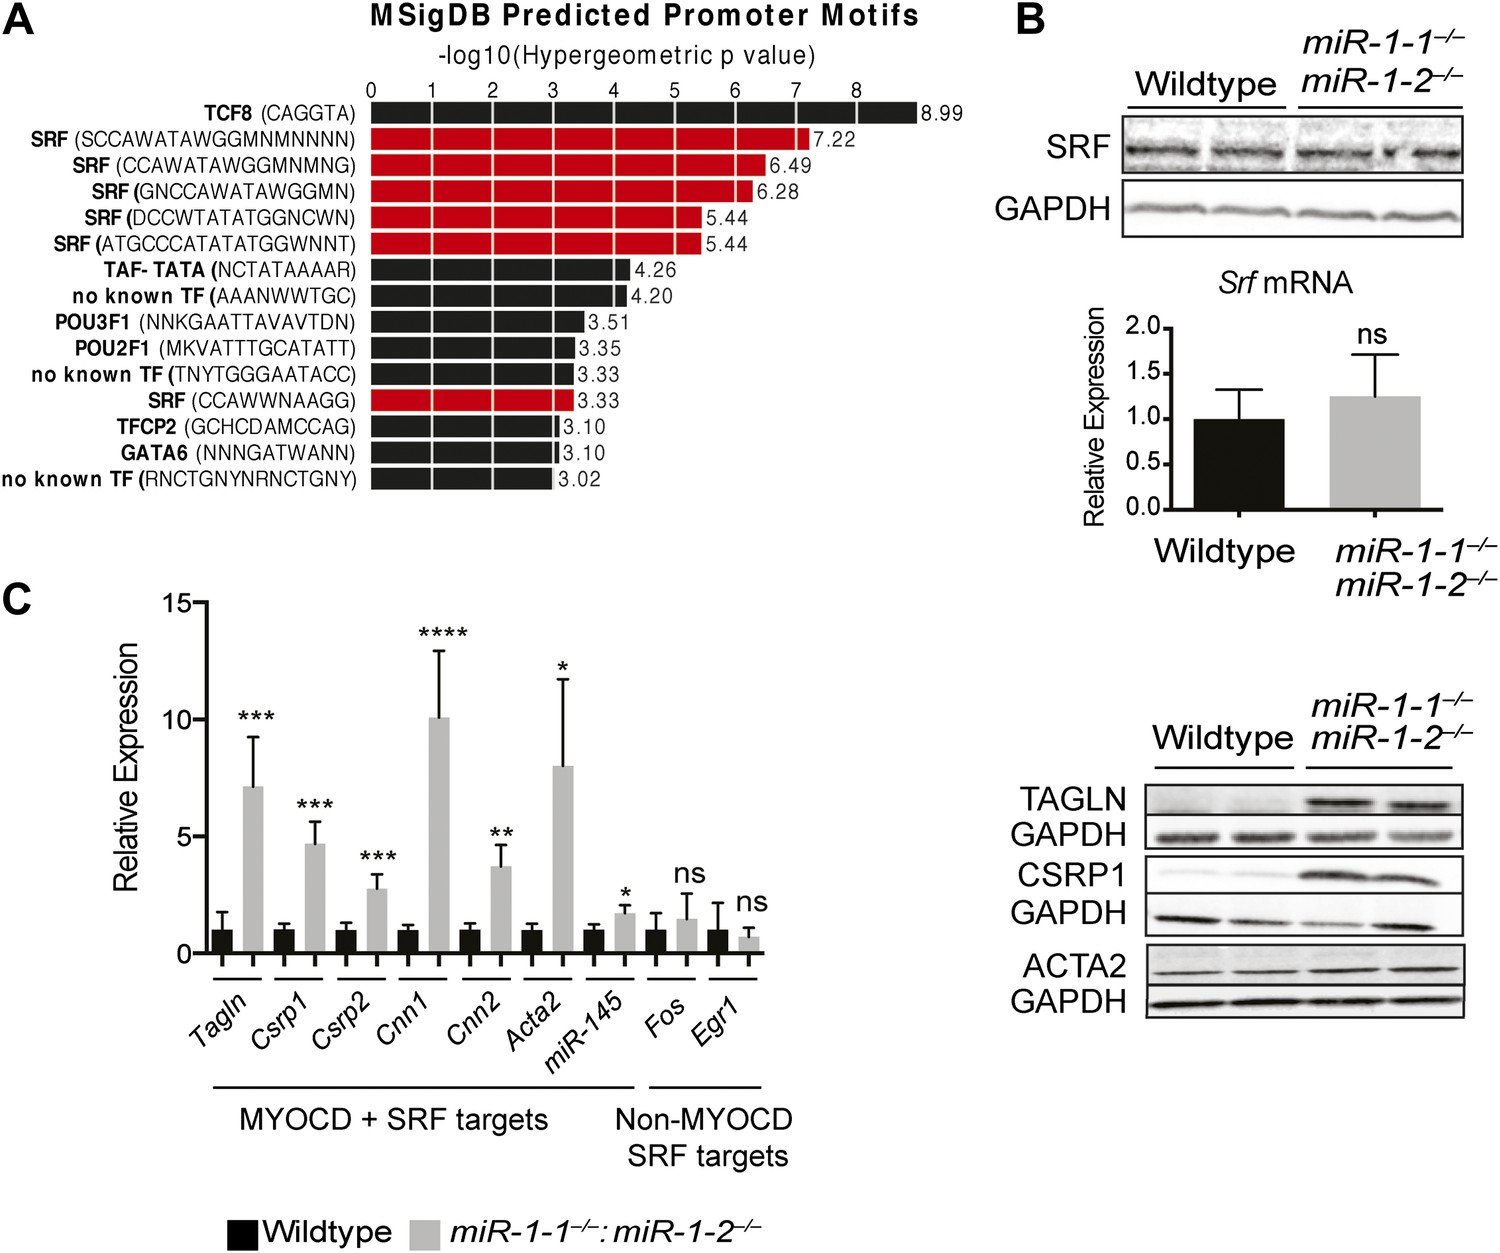
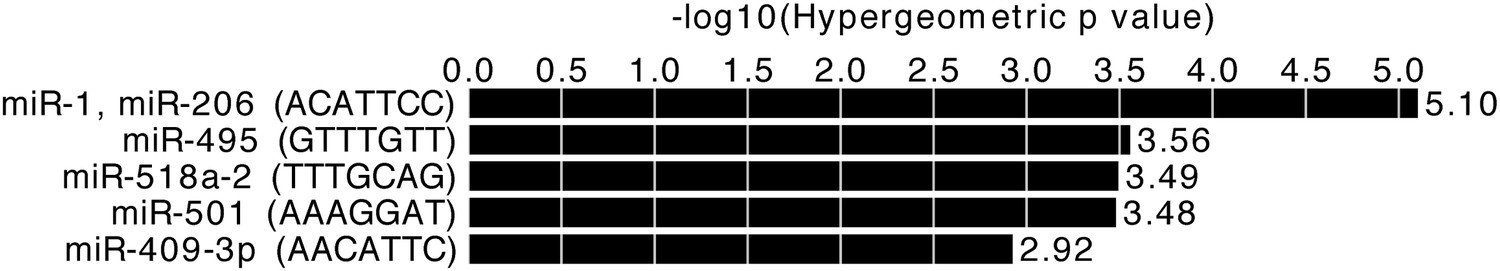
Upregulation of SRF targets in miR-1 null hearts.
(A) Promoter motif enrichment in genes upregulated in miR-1 double-knockout hearts. Motif sequences and transcriptional regulators are indicated (left) with the log10 of the hypergeometric p value graphed. Multiple CArG box sequences, the motif bound by SRF, were identified (red). (B) Western blot (top), and qPCR (bottom) for Srf expression in post-natal miR-1 null or wild-type hearts. (C) Myocardin dependent and independent SRF target gene expression in postnatal miR-1 null or wild-type hearts by qPCR (left). Western blots of selected Myocardin-dependent SRF target genes (right). Tagln, Transgelin/Sm22; Csrp1,2, Cysteine And Glycine-Rich Protein 1,2; Cnn1,2, Calponin1,2; Acta2, smooth muscle alpha actin; miR-145, microRNA-145; Fos, FBJ Murine Osteosarcoma Viral Oncogene Homolog; Egr1, Early growth response 1. *p<0.05; **p<0.01; ***p<0.001;****p<0.0001; ns, not significant.
Figure 6—figure supplement 1
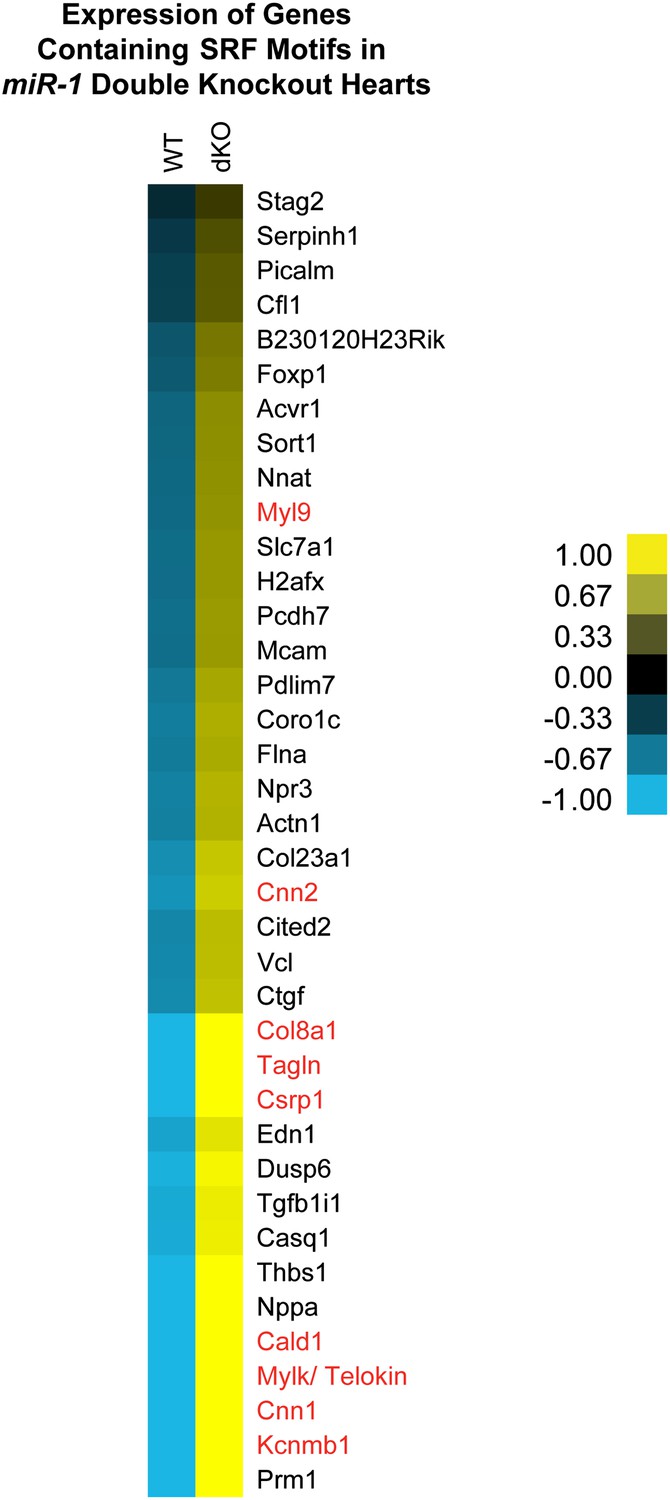
Dysregulation of SRF targets in miR-1 double-knockout hearts.
Relative expression of SRF regulated genes identified via GREAT analysis. Smooth muscle genes are highlighted in red. Values indicated represent the normalized gene expression of the log2 FPKM. FPKM, fragments per kilobase per million.
Figure 6—figure supplement 2
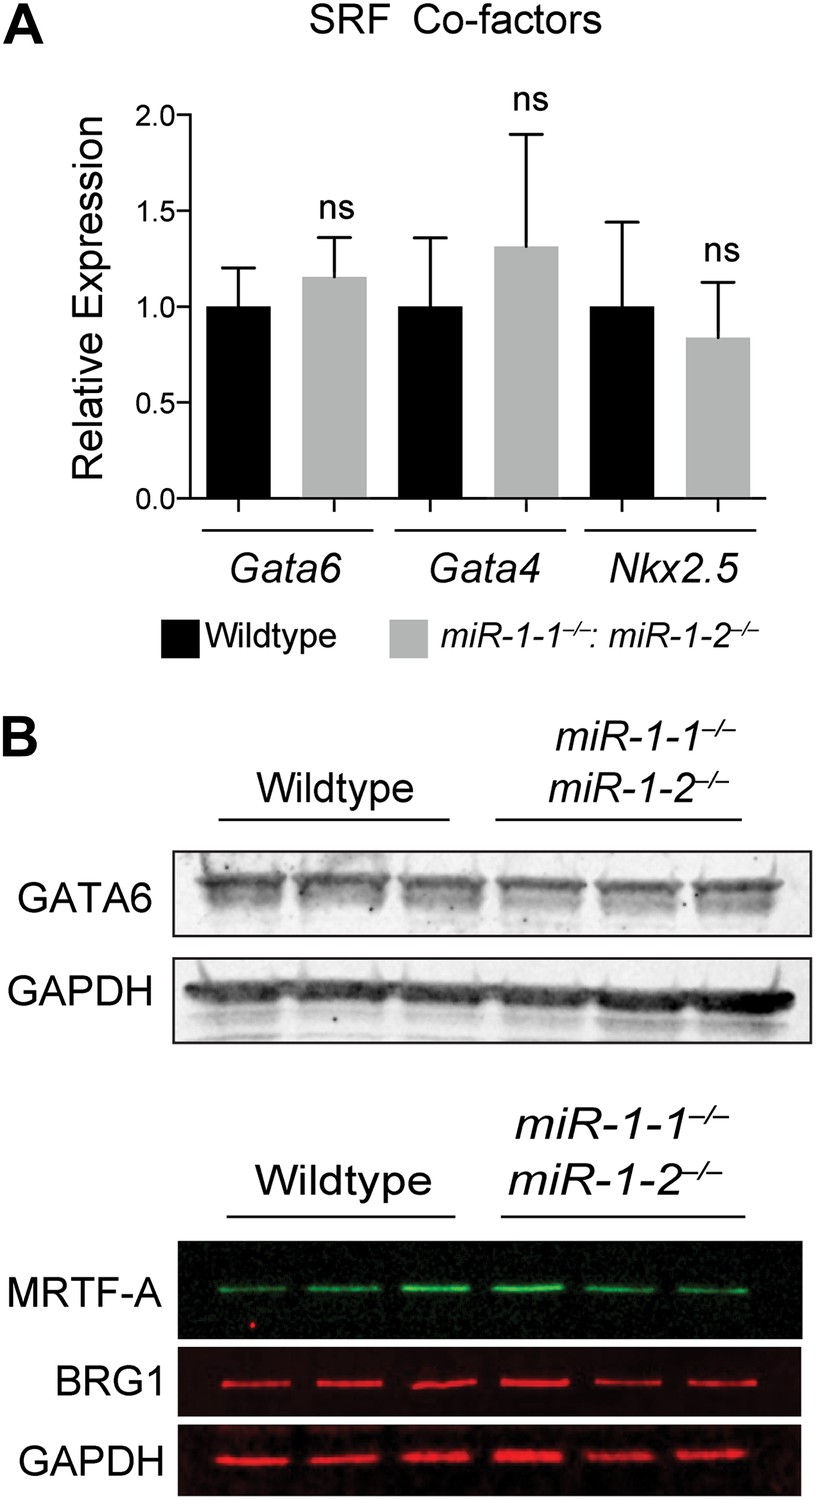
(A) qPCR of SRF co-factors in miR-1 wild-type or double-knockout hearts. N = 5. (B) Western blot for protein expression of SRF co-factors. ns, not significant.
https://doi.org/10.7554/eLife.01323.033
Figure 7
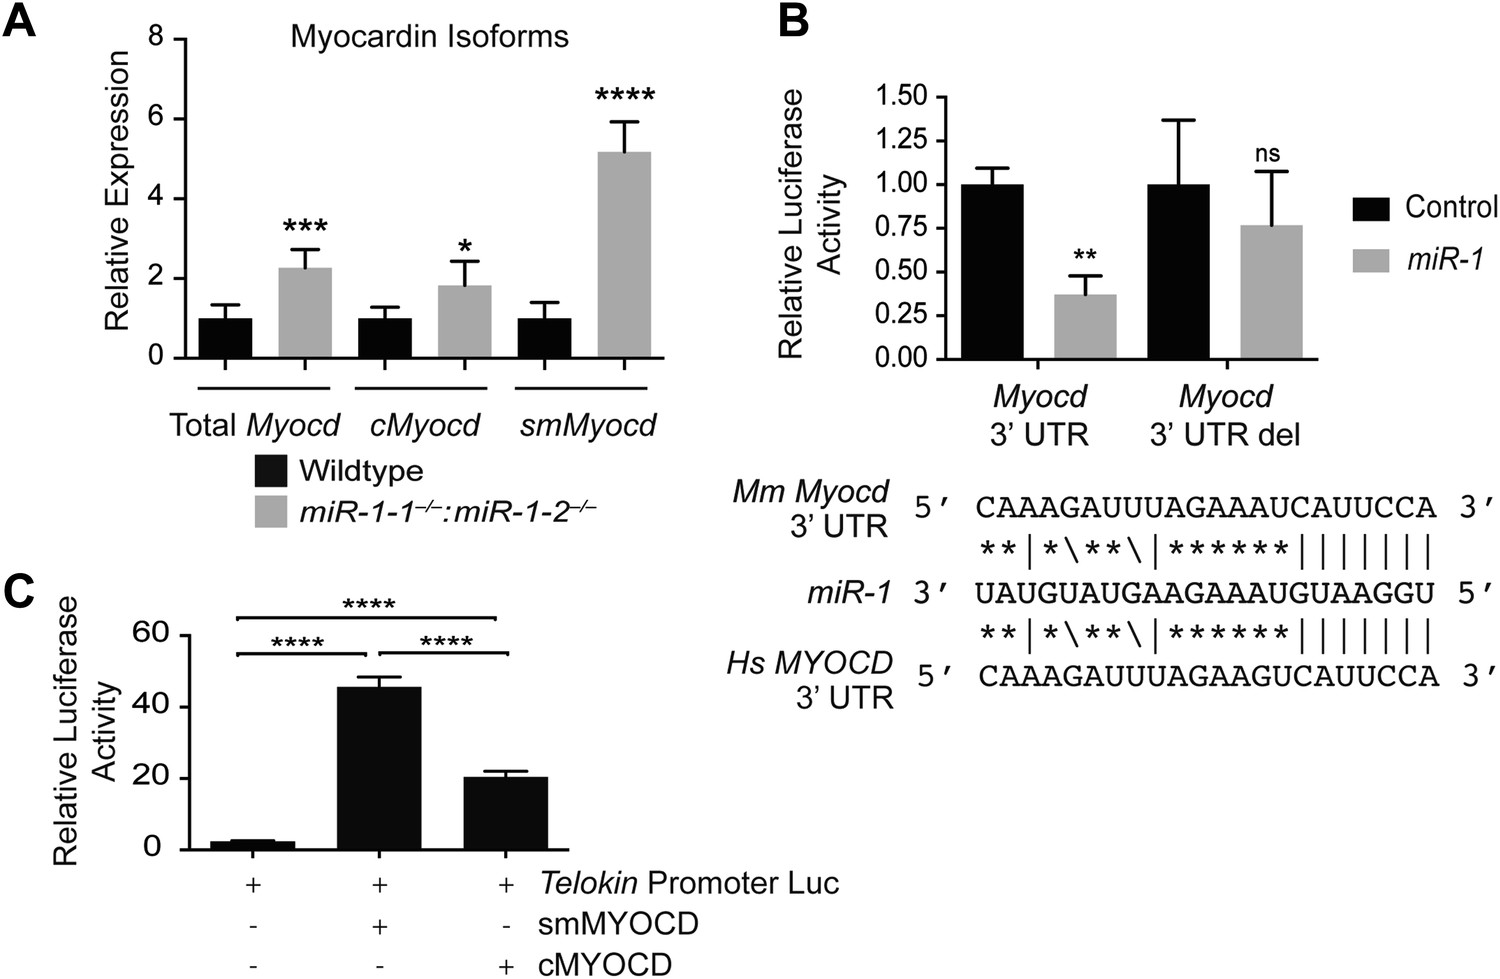
miR-1 regulates the SRF co-factor, Myocardin.
(A) qPCR for Myocardin (Myocd) expression. Probe sets are specific for inclusion of exon 2a for smooth muscle Myocd (smMyocd), exclusion of exon 2a for cardiac Myocd (cMyocd), or for downstream exons common to both transcripts (Total Myocd). P0 hearts were analyzed, N = 5 per genotype. (B) Luciferase activity of a reporter construct containing the miR-1 putative target site derived from the Myocd 3′ UTR or a deleted site. The constructs were co-transfected into H9C2 myoblasts with either a miR-1 mimic or a control mimic. The sequence of the putative miR-1 target site as predicted by Targetscan and site conservation between human (Hs) and mouse (Mm) is indicated. (C) The expression of luciferase driven by the Telokin+370 promoter when transfected into Cos cells, alone or with either full-length smMyocd or cMyocd. *p<0.05; **p<0.01; ***p<0.001;****p<0.0001; ns, not significant.
Figure 8
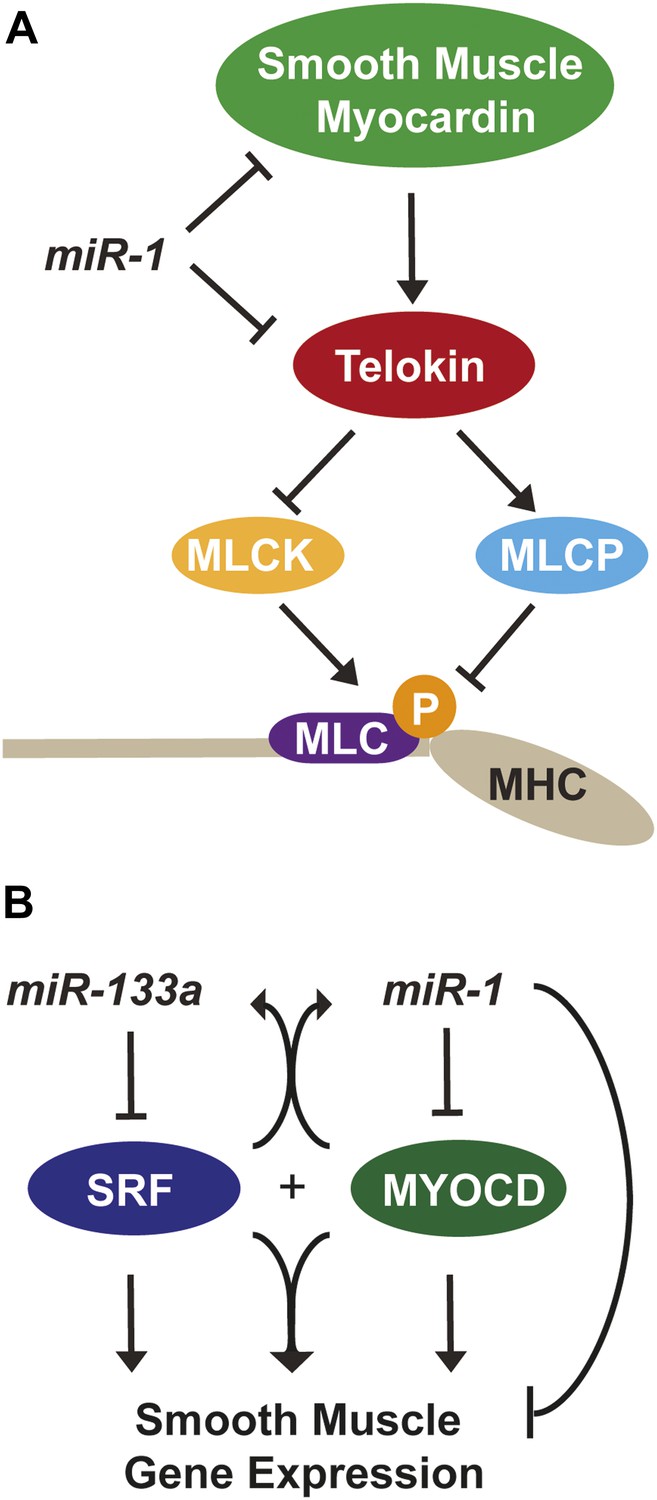
miR-1 regulation of Myosin light chain phosphorylation and smooth muscle gene expression.
(A) Dual regulatory model by which miR-1 acts to normally repress Telokin expression in the heart by directly targeting its 3′ UTR and its upstream transcriptional regulator, smooth muscle myocarding (smMYOCD). MLCK, myosin light chain kinase; MLCP, myosin light chain phosphatase; MLC, myosin light chain; MHC, myosin heavy chain; P, phosphorylation. (B) Regulatory model by which the miR-1/133a cluster cooperates to suppress smooth muscle gene expression in the heart.
Additional files
-
Supplementary file 1
Probe sequence/part number.
- https://doi.org/10.7554/eLife.01323.036
Download links
A two-part list of links to download the article, or parts of the article, in various formats.
Downloads (link to download the article as PDF)
Open citations (links to open the citations from this article in various online reference manager services)
Cite this article (links to download the citations from this article in formats compatible with various reference manager tools)
microRNA-1 regulates sarcomere formation and suppresses smooth muscle gene expression in the mammalian heart
eLife 2:e01323.
https://doi.org/10.7554/eLife.01323


