Mechanism for priming DNA synthesis by yeast DNA Polymerase α
- University of Cambridge, United Kingdom
Figures
Figure 1 with 7 supplements
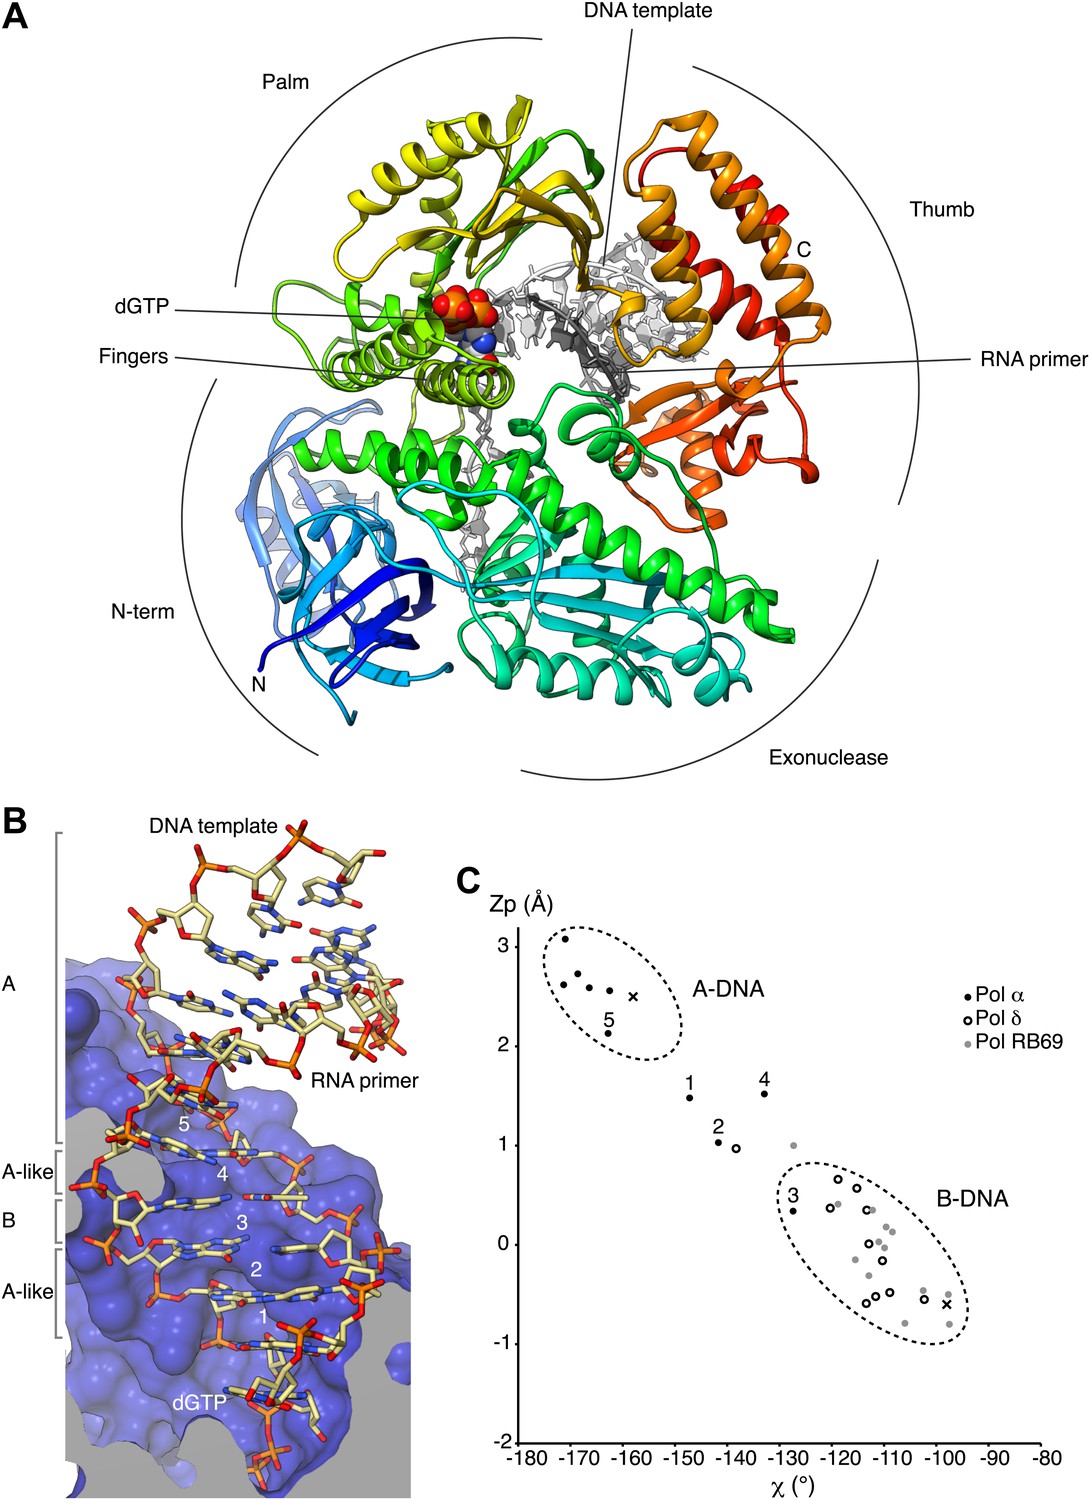
Overall structure of actively copying Pol α.
(A) The polymerase domain of yeast Pol α is shown in complex with an RNA primer/DNA template and dGTP bound in the active site. The polymerase is represented as ribbon, colored blue to red from the N-terminus. The RNA primer and DNA template are shown in dark and light gray, respectively. The two deoxyguanosine nucleotides added to the RNA primer by Pol α during the crystallization experiment as shown in light gray. The dGTP nucleotide is shown in spacefill representation. The different subdomains of the polymerase structure are marked in the figure. (B) A view of the RNA primer/DNA template double helix bound to Pol α. The nucleic acids are shown as stick models; carbon atoms in light brown, nitrogen atoms in blue, oxygen atoms in red and phosphate atoms in orange. The 2′-hydroxyl oxygen atoms of the ribose moieties of the RNA primer are shown in magenta. The polymerase is shown as a clipped molecular surface, in blue. The conformation assigned to each dinucleotide step in the RNA/DNA helix is indicated on the left-hand side of the panel. The first five di-nucleotide steps of the hybrid RNA/DNA helix are numbered one to five, from the 3′-terminus of the RNA primer. (C) Scatter plot of zP, the mean z-coordinate of the backbone phosphorus atoms with respect to individual dinucleotide reference frames, against the mean value for the four χ torsion angles at each di-nucleotide step, for the RNA/DNA helix bound to Pol α (black dots). The data points of the first five steps in the RNA/DNA helix bound to Pol α are numbered. For comparison, the values obtained for the DNA double helix bound to yeast Pol δ (empty dots; PDB entry 3IAY) and phage RB69 Pol (gray dots; PDB entry 1IG9) are also shown. For reference, the values obtained for A- and B-form DNA models based on fiber diffraction analysis are marked in the plot with a black cross. The stereochemical analysis of the RNA/DNA helix was performed with 3DNA (Lu and Olson, 2003).
Figure 1—figure supplement 1
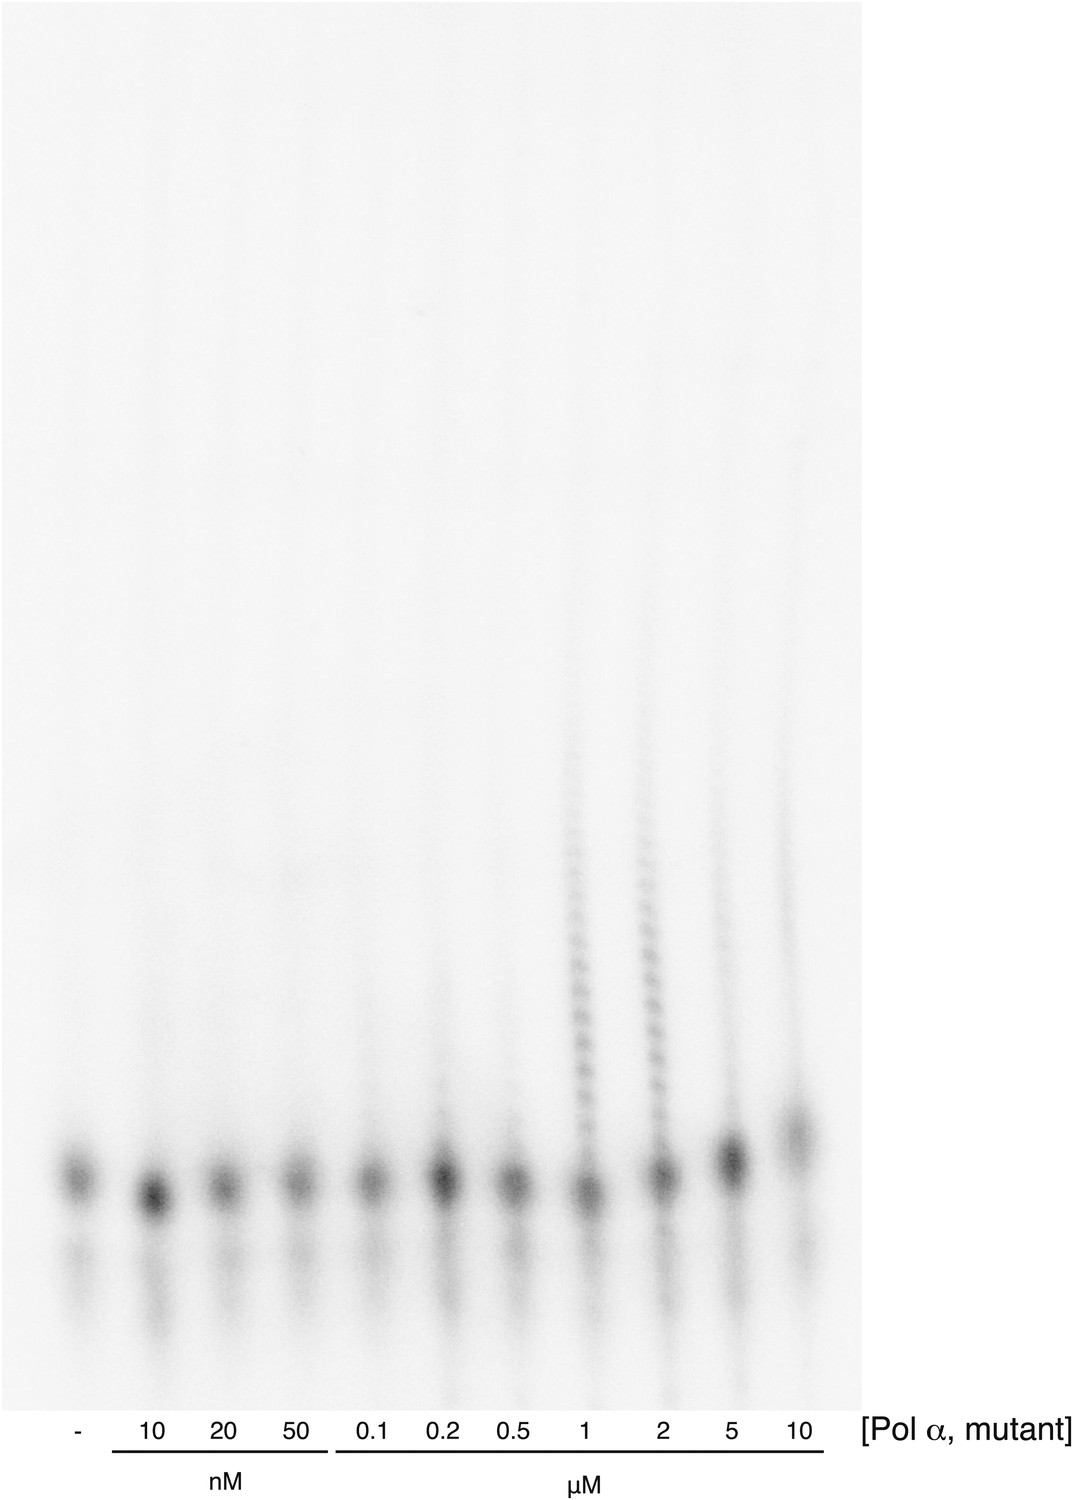
Primer extension assay for the D998N, R508A, N509A Pol α mutant.
The assay was performed as described in the 'Materials and methods'. The range of protein concentrations tested in the experiment is indicated in the figure. Incubation time was 90 s. Polymerase activity is readily detectable at micromolar levels of protein concentrations.
Figure 1—figure supplement 2
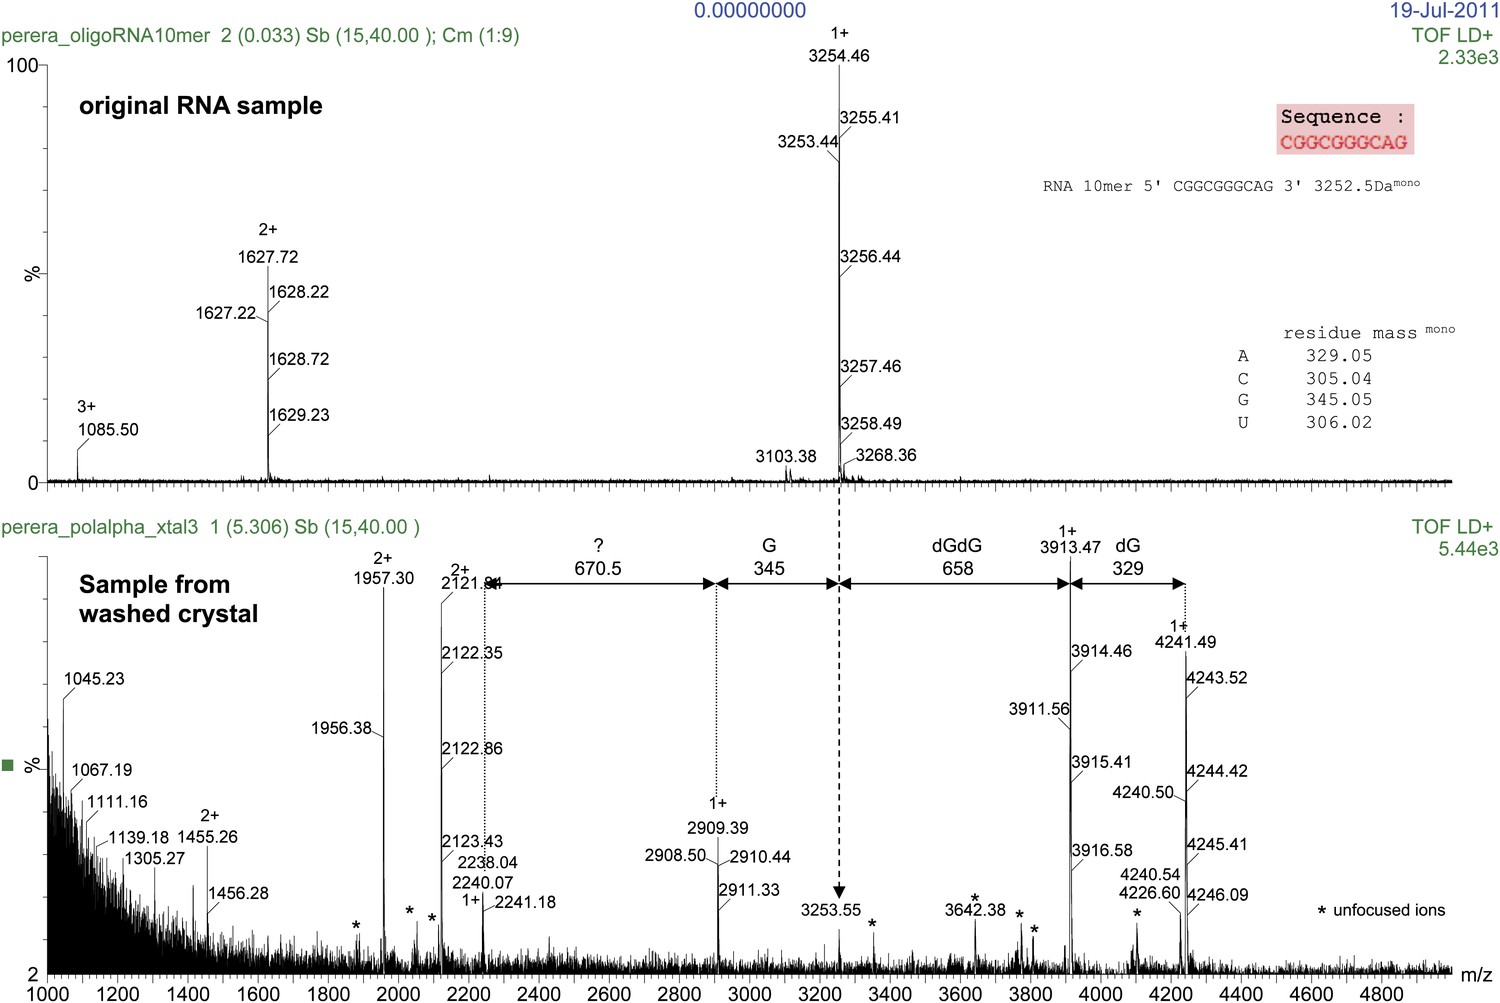
Mass spectrometry analysis of the RNA 10mer used in the crystallisation of the ternary complex.
The results of the analysis for the RNA 10mer in solution (control; top panel) and recovered from a sample of washed crystals of the ternary complex (bottom panel) are shown. The analysis shows primer extension by two dGMP nucleotides and partial incorporation of a third dGMP, during the crystallization process. Translocation onto the next templating base (Adenine at position -1, see Figure 2C) was prevented from formation of the crystal lattice based on the non-crystallographic dimer of ternary complexes, illustrated in Figure 1—figure supplement 6.
Figure 1—figure supplement 3
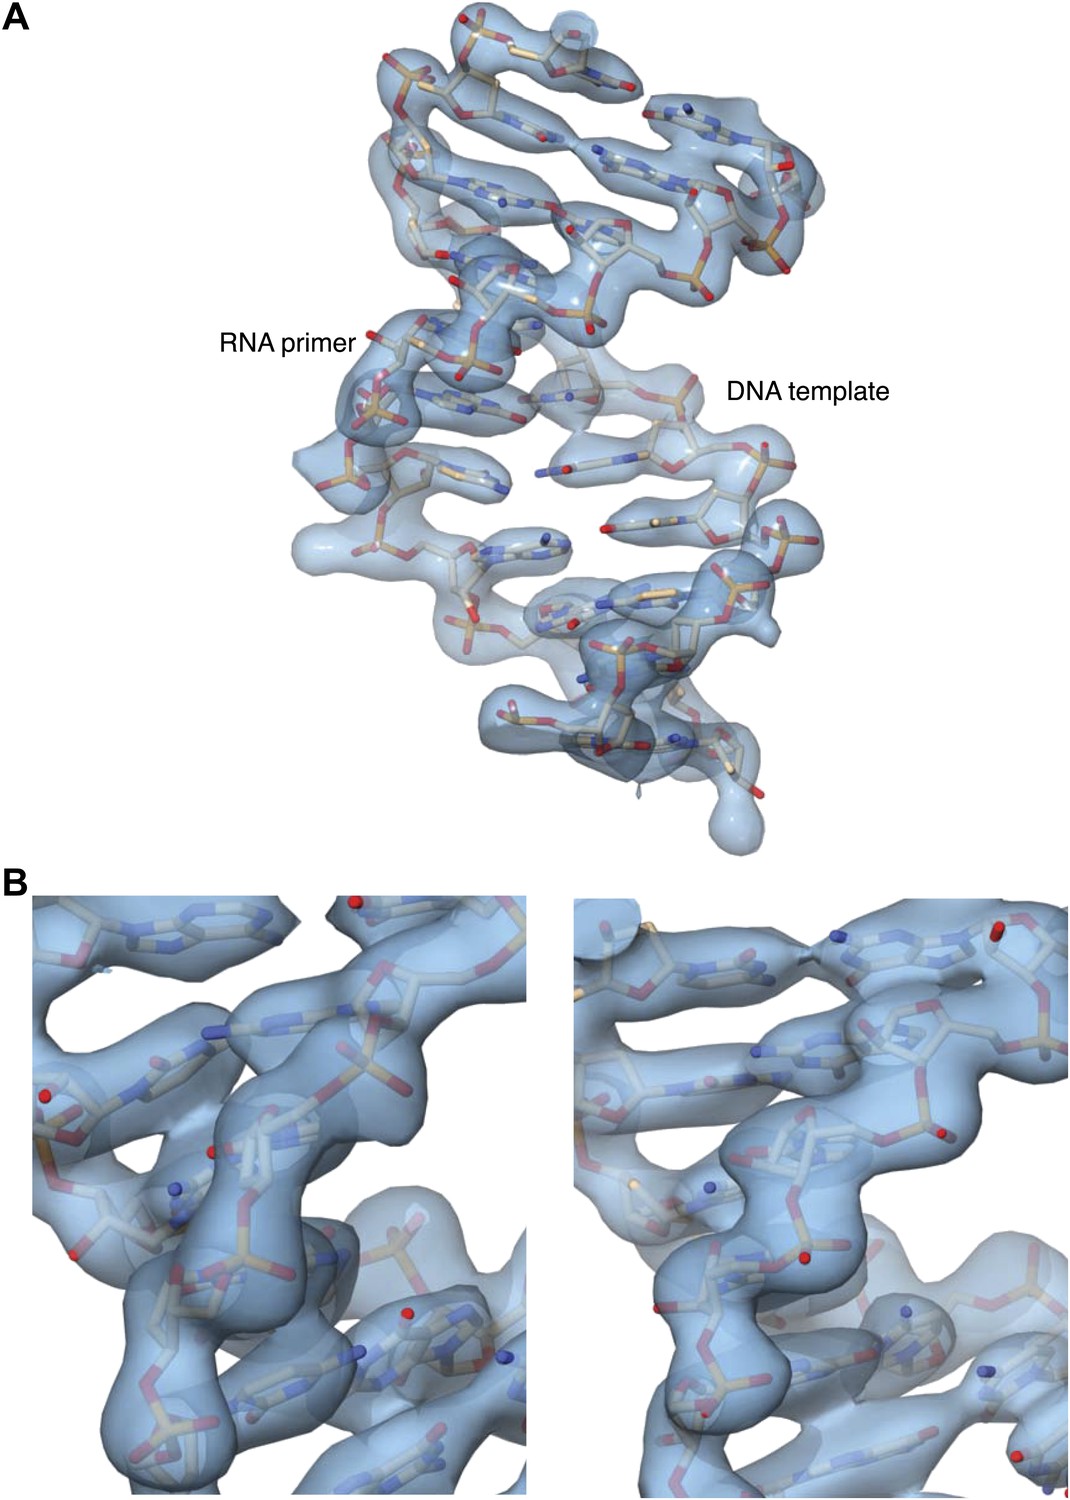
Details of the 2Fo-Fc electron density map at 3.1 Å resolution, after B-sharpening and contoured at 2.5 rmsd.
The map was calculated in PHENIX and displayed in Chimera. (A) Overall view of the double-stranded region of the RNA primer-DNA template in the ternary complex. The refined crystallographic model is shown in stick representation, superimposed on the electron density. (B) Two views of electron density for the ribophosphate backbone of the DNA template (left panel) and RNA primer (right panel), with the refined model superimposed on the density.
Figure 1—figure supplement 4

Close-up view of Pol α's active site, showing the dGTP nucleotide and side chains of amino acids important for catalysis and nucleotide binding.
For comparison, the active site of yeast Pol δ (PDB id: 3IAY) is shown, superimposed on Pol α. The polymerase chains are represented as blue (Pol α) or light blue (Pol δ) ribbons; the nucleic acid, nucleotides and amino acid side chains are drawn as sticks. Carbon atoms in Pol α are coloured white, whereas in Pol δ are coloured in light brown. Only amino acids belonging to Pol α are labeled, for clarity. The 3′-hydroxyl in the templated primer bound to Pol α is labelled. Three Ca2+ ions identified in the active site of Pol δ are also shown, as green spheres.
Figure 1—figure supplement 5
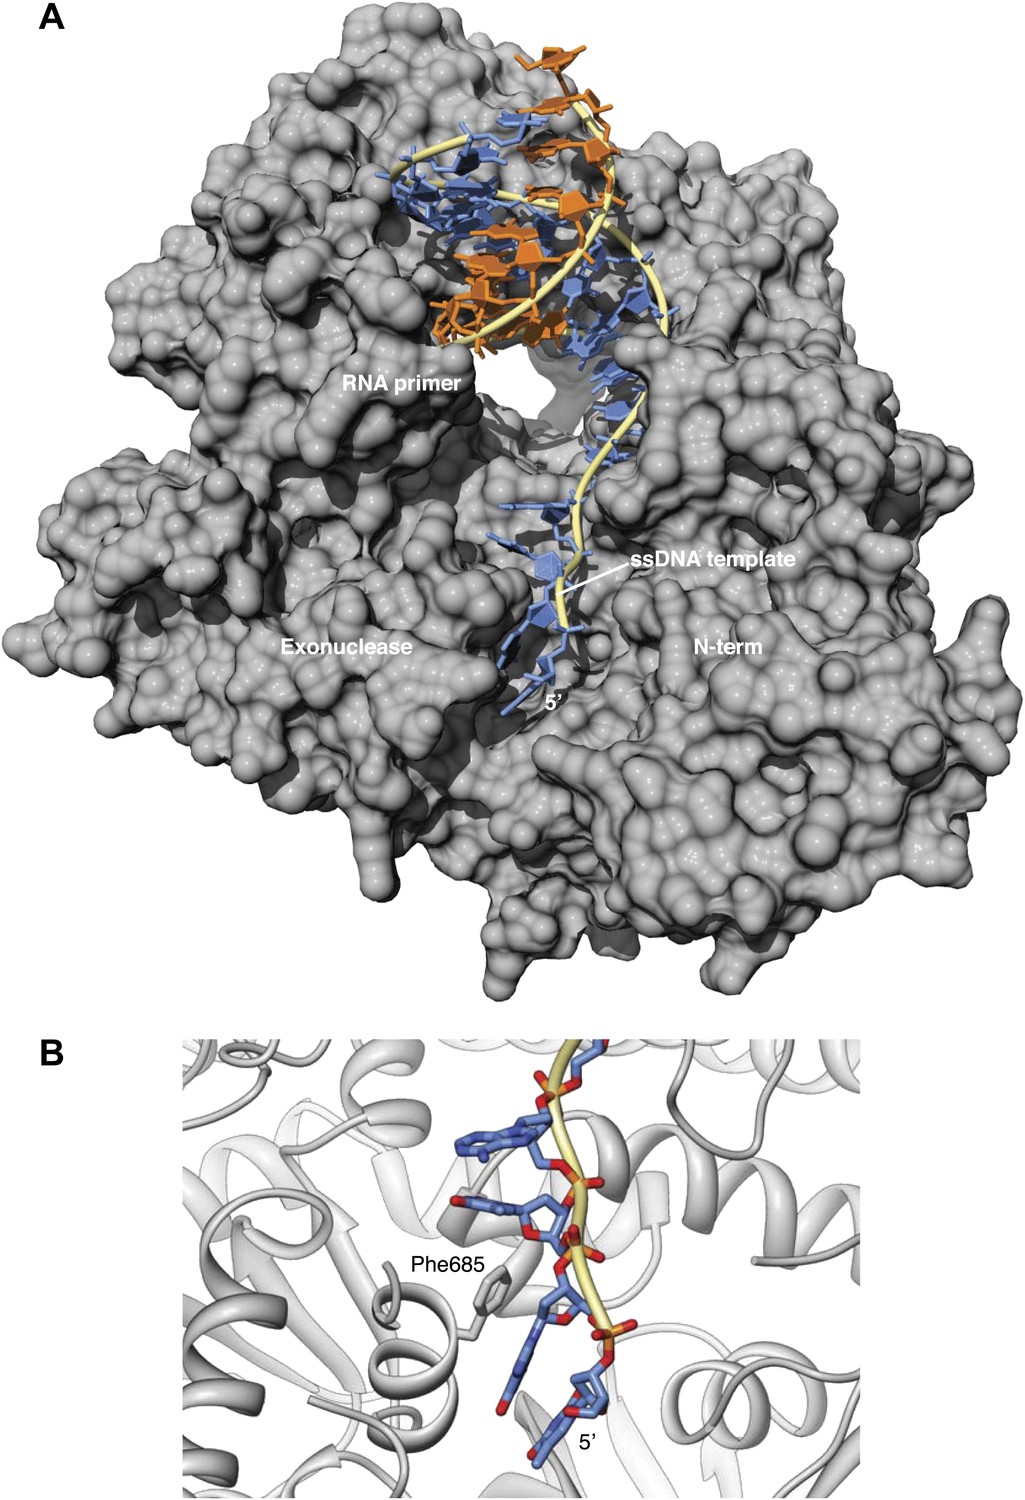
Interaction of the single-stranded DNA template with Pol α.
(A) Trajectory of the ssDNA template on the surface of Pol α. The deoxy-nucleotides of the DNA template ahead of the templating base fit in a groove formed by the exonuclease and N-terminal regions of Pol α. (B) In the ternary complex, the aromatic bases project inwards towards the polymerase, whereas the ribophosphate backbone remains largely exposed to solvent. Phe685 in the exonuclease domain protrudes into the groove and stacks its phenyl ring against the base of guanidine in position -3 of the DNA template.
Figure 1—figure supplement 6
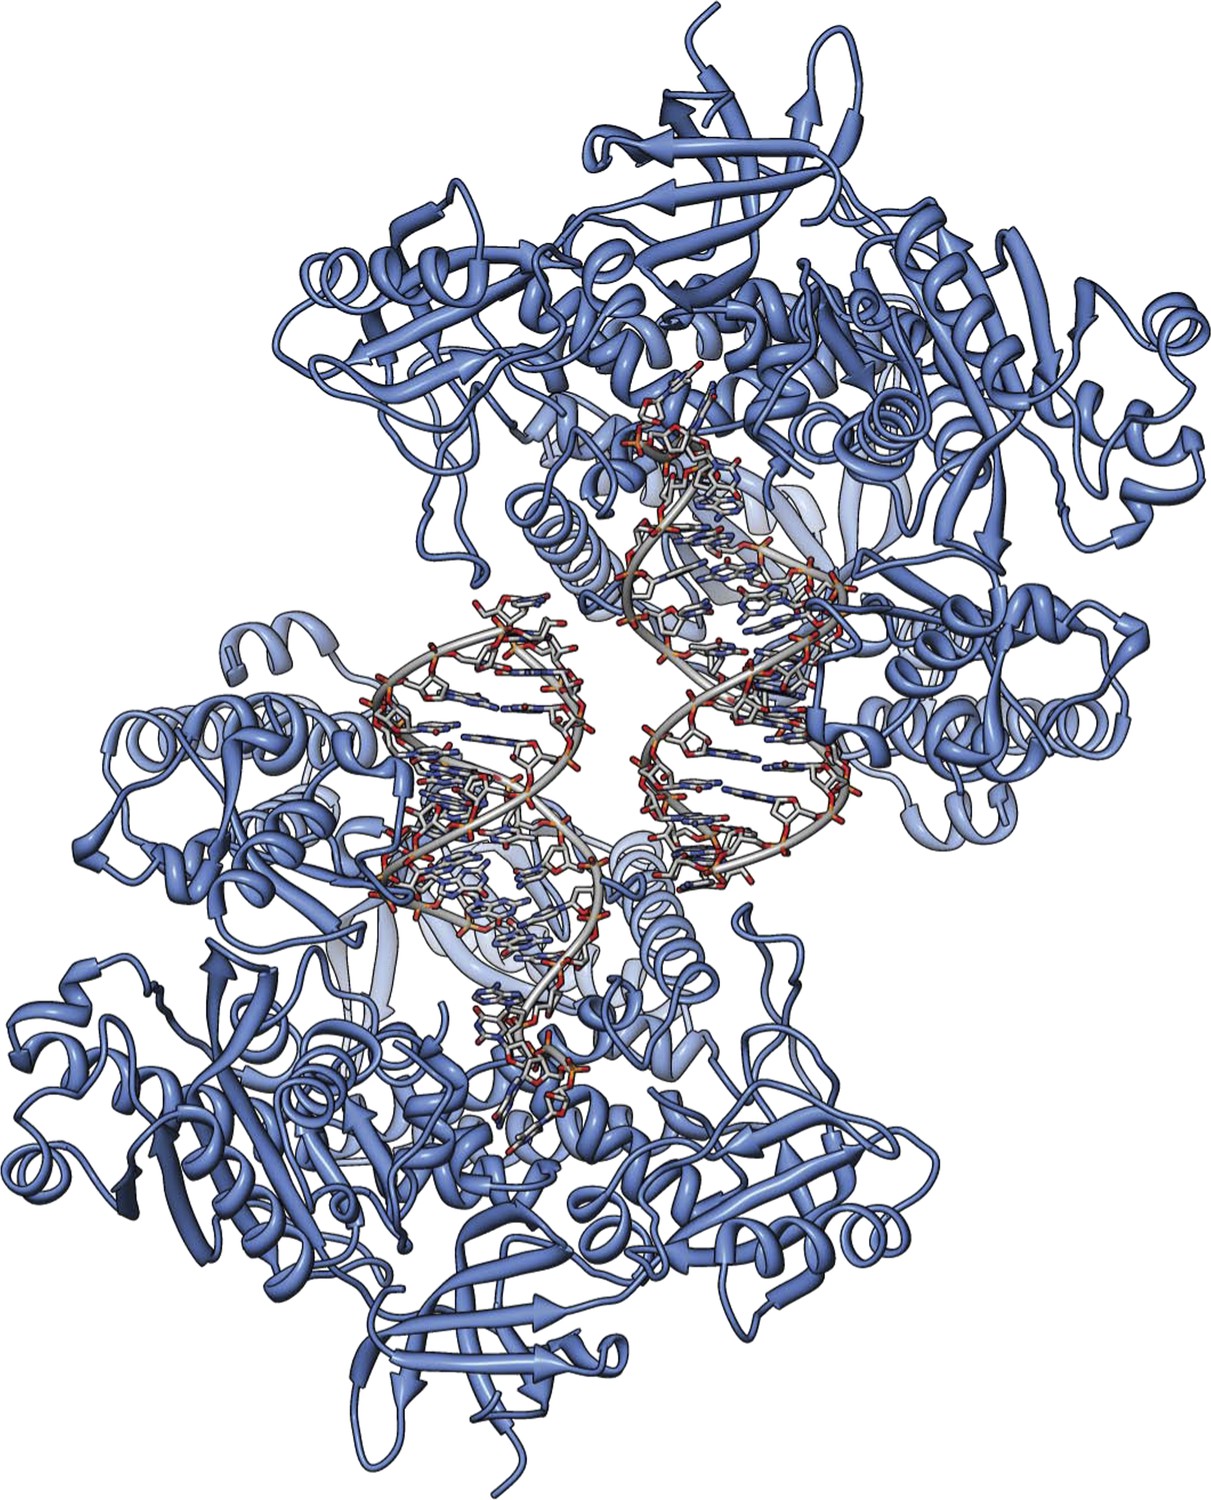
The actively copying Pol α crystallizes with two copies of the ternary complex in the asymmetric unit.
The figure shows a view of the asymmetric unit that highlights the non-crystallographic dyad relating the two copies of ternary complex. The protein is shown as a ribbon in light blue, and the RNA-DNA duplex as an all-atom stick model, with a thin tube running through the positions of the phosphorus atoms of the ribo-phosphate backbone.
Figure 1—figure supplement 7
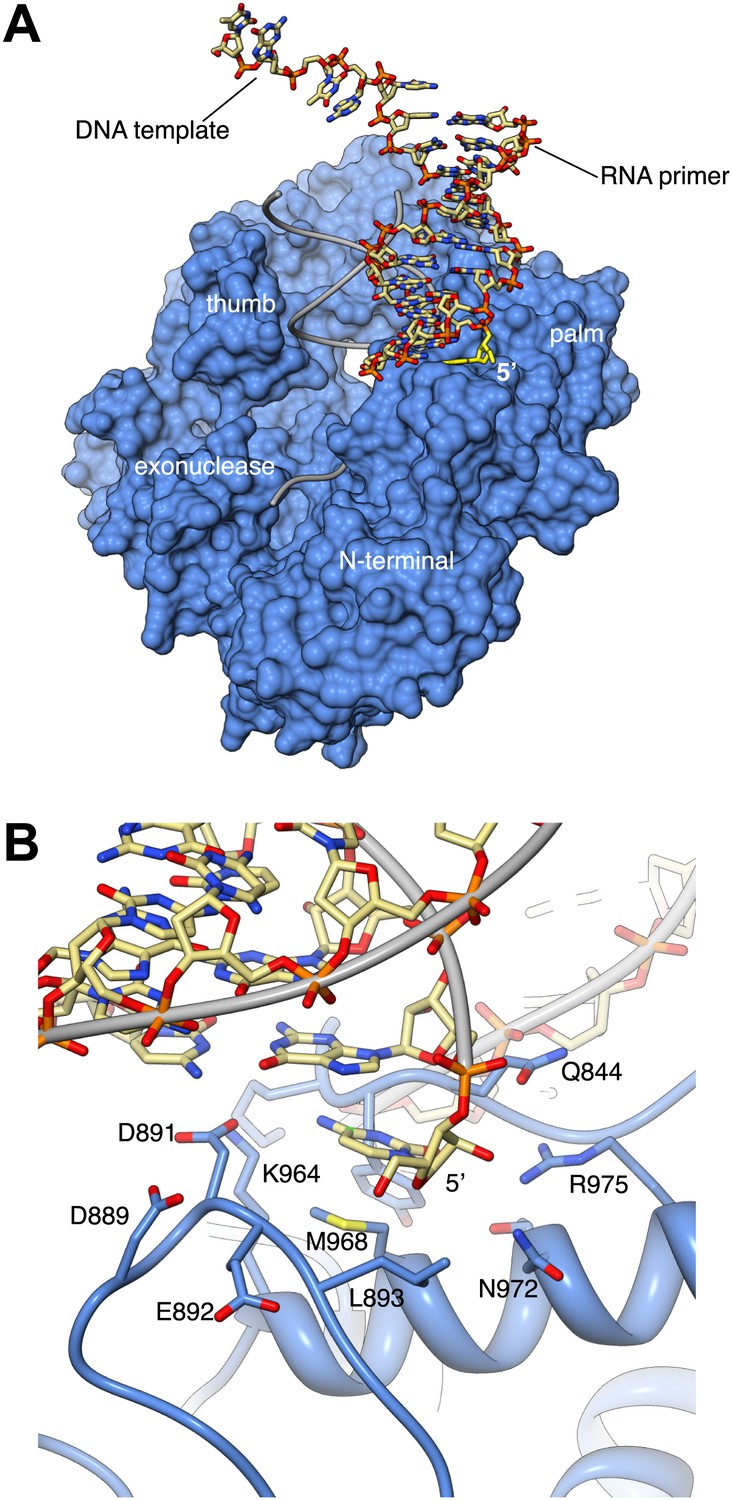
Interaction with the non-crystallographic copy of Pol α captures the 5′-terminal nucleotide of the RNA primer in a surface pocket of the palm domain, in the crystals of ternary complex.
(A) General view of the contact between Pol α and the second, non-crystallographic RNA-DNA molecule in the asymmetric unit. The polymerase is shown as molecular surface in light blue and the position of its RNA-DNA substrate is shown by thin gray tubes. The non-crystallographic RNA-DNA molecule is shown as an all-atom stick model, with the 5′-terminal nucleotide of the RNA primer highlighted in yellow. (B) Atomic details of the non-crystallographic interface between Pol α and the second copy of the RNA-DNA molecule in the asymmetric unit of the ternary complex crystals. A negatively-charged loop in the palm domain of Pol α, including residues D889, D891 and E892, unwinds the 5′-terminal nucleotide of the templated RNA primer. The 5′-terminal nucleotide of the RNA primer remains trapped by multiple polar and hydrophobic interactions in a pocket on the surface of the palm domain, whilst its templating nucleotide in the DNA molecule is disordered in the electron density map and is not included in the crystallographic model.
Figure 2

Specific recognition of the RNA/DNA helix by Pol α.
(A) Identical views of active complexes of yeast Pols α (left) and δ (Swan et al., 2009; right; PDB entry 3IAY), bound to primer/template duplexes and incoming deoxynucleotide. The polymerase structures are depicted as ribbons (Pol α, blue; Pol δ, cyan). Primer/template duplexes are shown in spacefill representation and colored light brown, with the exception of the phosphate groups that have red oxygen atoms and orange phosphate atoms. The 2′-hydroxyl oxygen atoms in the ribose moieties of the RNA are highlighted in magenta. (B) The interface between the thumb domain of Pol α and the RNA primer/DNA template duplex. The ribo-phosphate backbone is shown as a thin tube, in salmon and pale yellow color for the RNA and DNA strands, respectively, and the bases are depicted as rungs of a ladder. Pol α is shown as a molecular surface, colored gray except for atoms that are within a 5 Å radius of the RNA primer or the DNA template, that are colored as the nucleic acid strand. (C) Schematic diagram of the interactions of Pol α′s thumb domain with the RNA/DNA helix. The ribophosphate portion of nucleotides that interact with the thumb domain is shaded gray. A small circle at position two of the ribose ring indicates the RNA nucleotides. (D) Hydrophobic contacts of the thumb domain with the exposed minor groove of the RNA/DNA helix. The protein is shown as thin blue tube and amino acid side chains as sticks with white carbon atoms, yellow sulfur atoms and red oxygen atoms. The RNA primer is shown as sticks, with atoms colored as in panel A. Protein-RNA contacts are shown as dashed green lines.
Figure 3
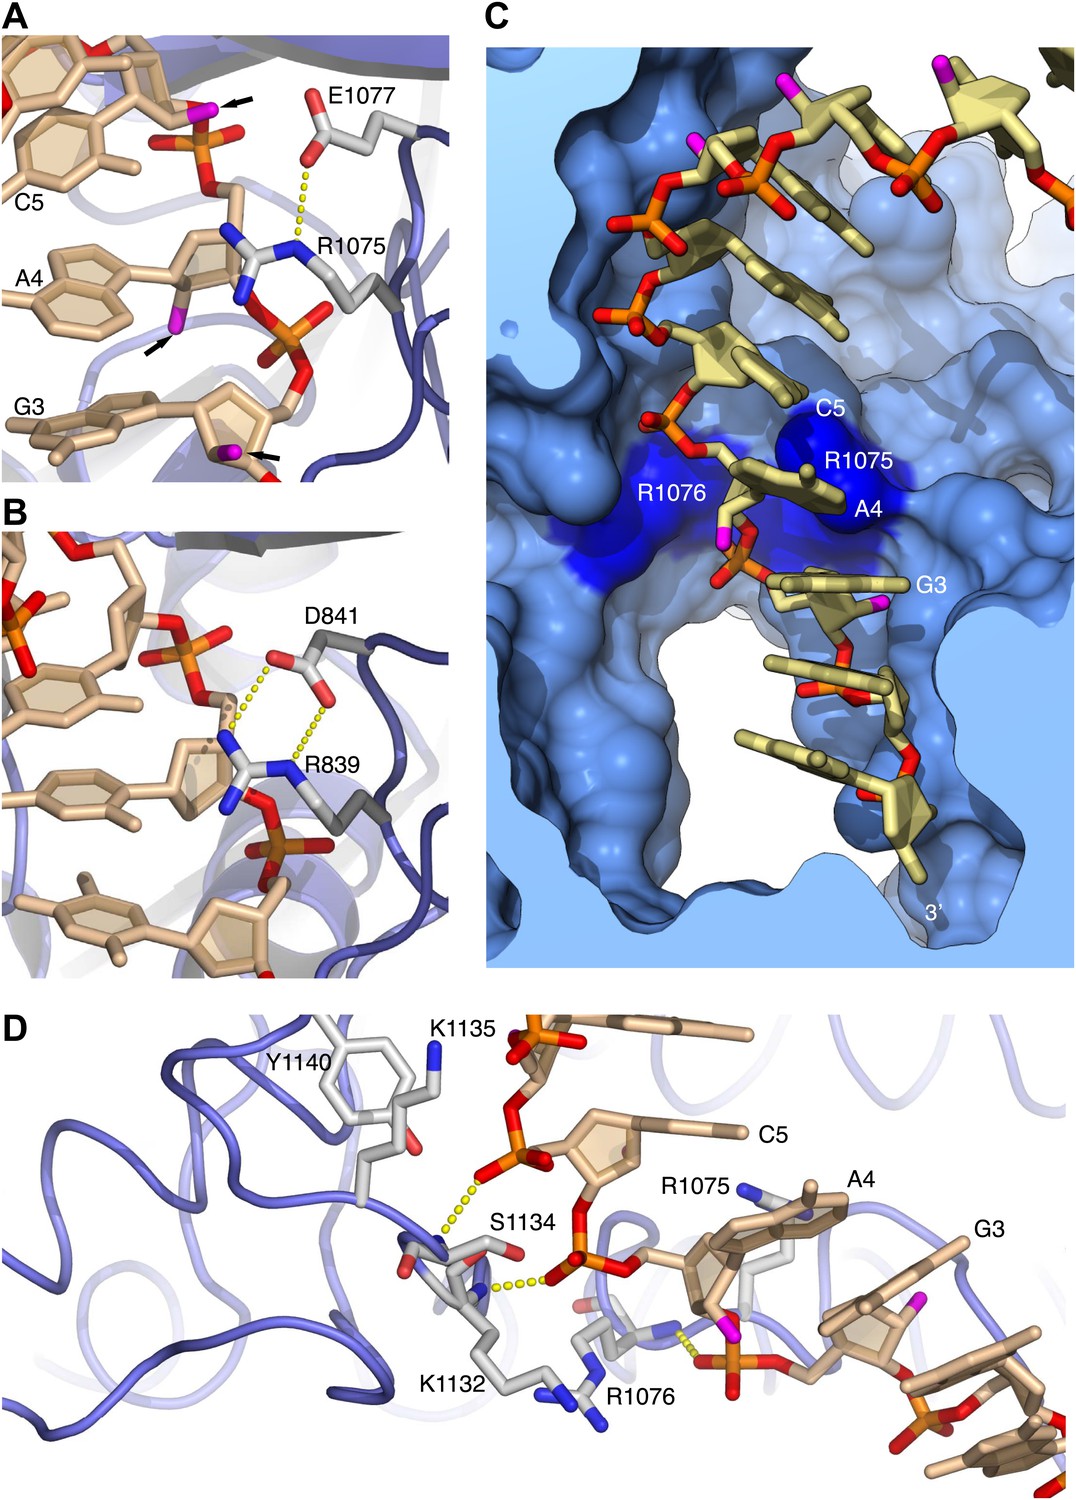
Arginines 1075 and 1076 anchor Pol α to the RNA primer.
(A) Close-up view of the interaction of Arg1075 with the RNA primer. A hydrogen bond interaction between the carboxylate group of Glu1077 and Arg1075 is also shown, as a yellow dashed line. The protein is shown as thin blue tube and amino acid side chains as sticks with white carbon atoms, blue nitrogen atoms and red oxygen atoms. The RNA primer is shown as sticks, with atoms colored as in Figure 2A. A black arrow highlights the position of the 2′-hydroxyl moiety of the ribose ring. For clarity, the DNA template has been omitted. (B) Close-up view of the interaction of Pol δ Arg839 with the DNA primer, in the same orientation as Pol α in panel A. The interaction of Asp841 with Arg839 is also shown. (C) Conformation of the RNA primer bound to Pol α. The polymerase is shown as a clipped molecular surface, in light blue. The position of Arg1075 and Arg1076 is indicated in dark blue. Color scheme is as in Figure 2A. The DNA template strand is omitted for clarity. (D) Polar contacts at the interface between Pol α's thumb domain and the RNA primer. Hydrogen bonds between the phosphate groups of the RNA primer and main chain nitrogen atoms of the thumb domain are depicted as dashed yellow lines. Color scheme is as in Figure 2A. The DNA template strand is omitted for clarity.
Figure 4
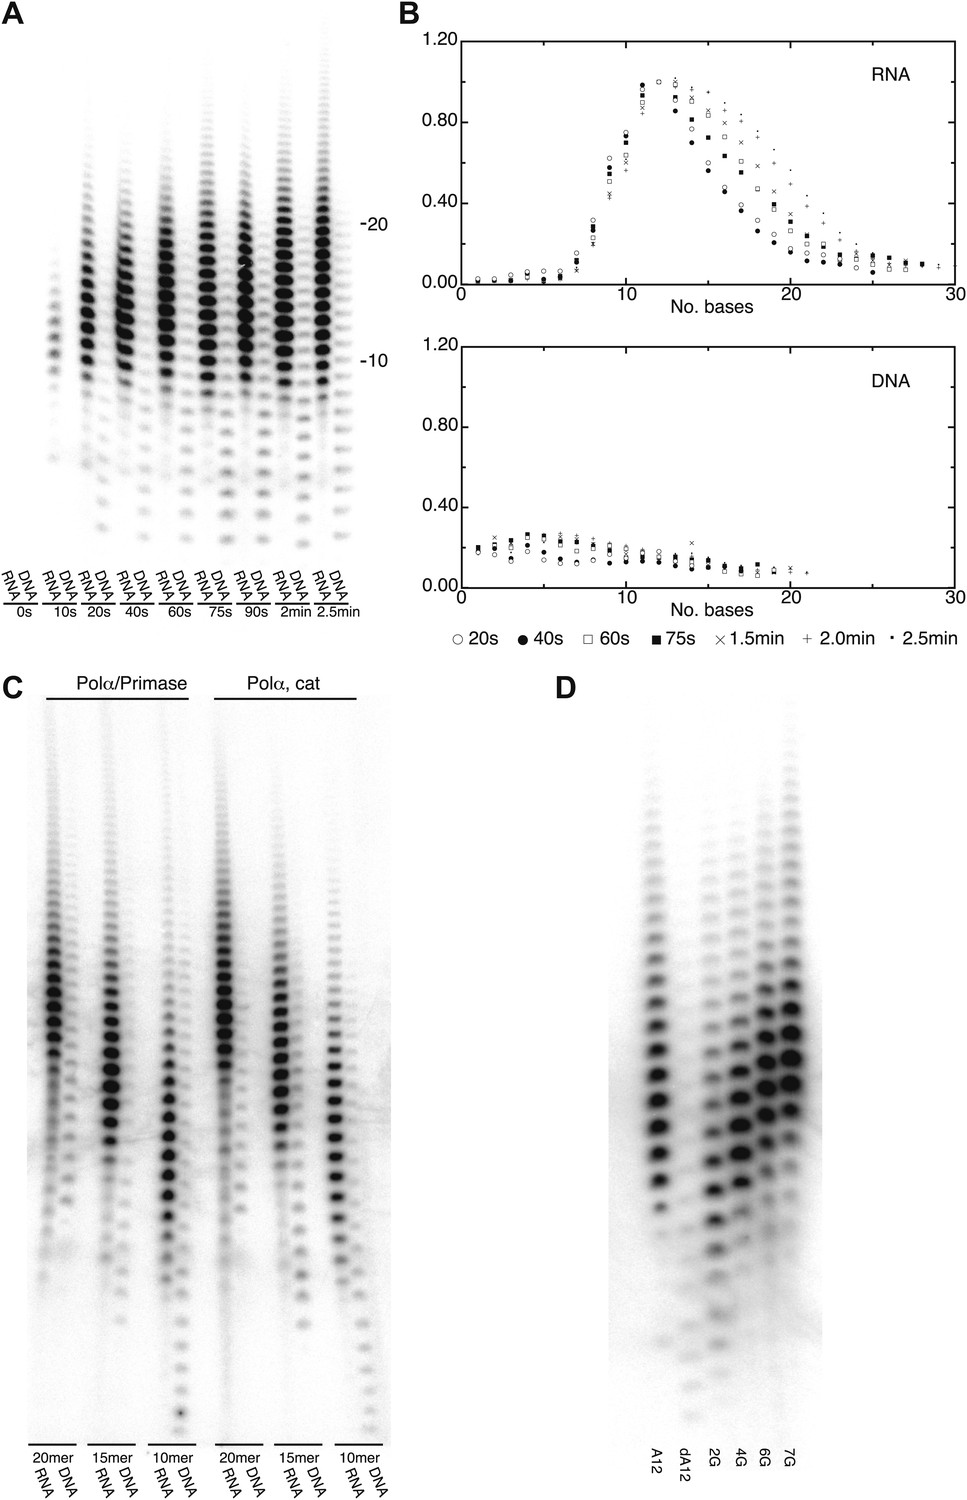
DNA- and RNA-primed dNTP polymerization by Pol α.
(A) Primer extension assay, analyzed by denaturing acrylamide gel electrophoresis and [α-32P]dATP phosphorimaging. The wild-type polymerase domain of yeast Pol α was incubated at 37°C with poly(dT) 70mer template, dATP and either an oligo(A) or oligo(dA) 15mer primer (see ‘Materials and methods' for details). The reaction products were analyzed at the indicated time points. (B) Quantitative product size-distribution analysis of the primer extension assay in panel A. For each time point, the intensities of the RNA and DNA primer extension products were measured and normalized relative to the measured intensity of the 12mer product in the RNA primer lane. The normalized values of the RNA and DNA-primer extension products are plotted against the size of the extension product, as number of bases, in the top and bottom panels, respectively. The normalized values are the average of three independent measurements. (C) Primer extension assay. The catalytic domain of yeast Pol α and a recombinant version of the yeast Pol α/primase complex were incubated at 37°C and for 60 s with a poly(dT) 70mer template, dATP and either an oligo(A) or oligo(dA) of different length, as indicated in the panel. (D) Primer extension assay. The catalytic domain of yeast Pol α was incubated at 37°C and for 60 s with dATP and one of the following 5′-to-3′ primer/template pairs: A12, A12/(dT)50; dA12, (dA)12/(dT)50; 2 G, A5GGA5/T43CCT5; 4 G, AGGA2GGA5/T43CCT2CCT ; 6 G, AGGA2GGAGGA2/T40CCTCCT2CCT; 7 G, AGGAGGGAGGA2/T40CCTCCCTCCT.
Figure 5 with 1 supplement
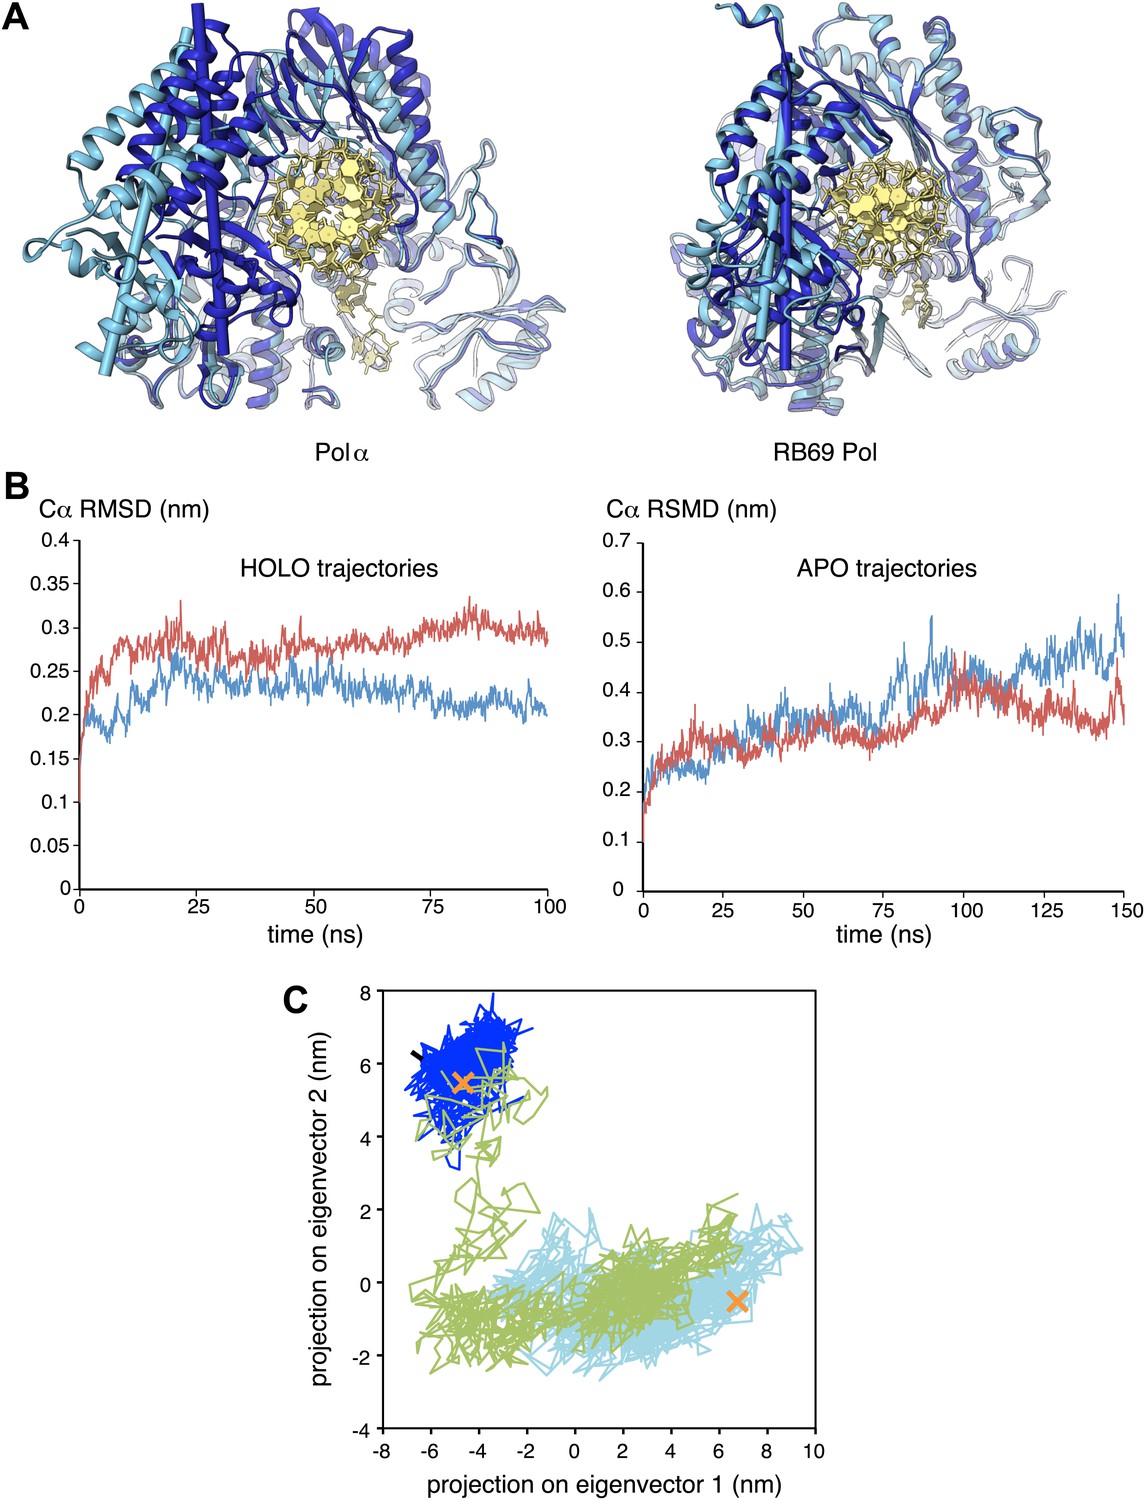
Conformational changes of Pol α during DNA priming.
(A) Structural superposition of the isolated and active conformations of the polymerase domain of Pol α (left) and RB69 Pol (Wang et al., 1997; Franklin et al., 2001; right; PDB entries 1IH7 and 1IG9). The protein is shown as ribbons and the nucleic acid duplex as sticks. The polymerase domain is colored light blue (apo) and dark blue (active conformation). In order to help visualize the difference between apo and active conformations of the polymerase, the major inertia axis of the thumb domain for each structure is also shown (Pettersen et al., 2004). (B) Change in root mean square deviation (RMSD) of the Cα positions over the time of simulation for the HOLO (100 ns; left panel) and APO trajectories (150 ns; right panel), calculated relative to the starting structure of the trajectory (see ‘Materials and methods' for details). (C) Time-dependent projection on the first two principal components of the trajectory of the apo polymerase structure (150 ns, light blue trace), the polymerase structure in the ternary complex (100 ns, dark blue trace) and the polymerase structure starting from the conformation adopted in the ternary complex, but in absence of the RNA/DNA duplex and deoxynucleotide (100 ns; green trace). A black arrow marks the starting position of the green trace. The position of the crystallographic models of the polymerase in the apo form and in the ternary complex is marked by an orange cross.
Figure 5—figure supplement 1

Difference between the root mean square fluctuation (RMSF) values of the APO and HOLO trajectories at each Cα position of the polymerase structure.
The mean RMSF values of the two HOLO trajectories were subtracted from the mean RMSF value of the two APO trajectories. The approximate boundaries of the polymerase domains are indicated below the diagram.
Figure 6 with 1 supplement
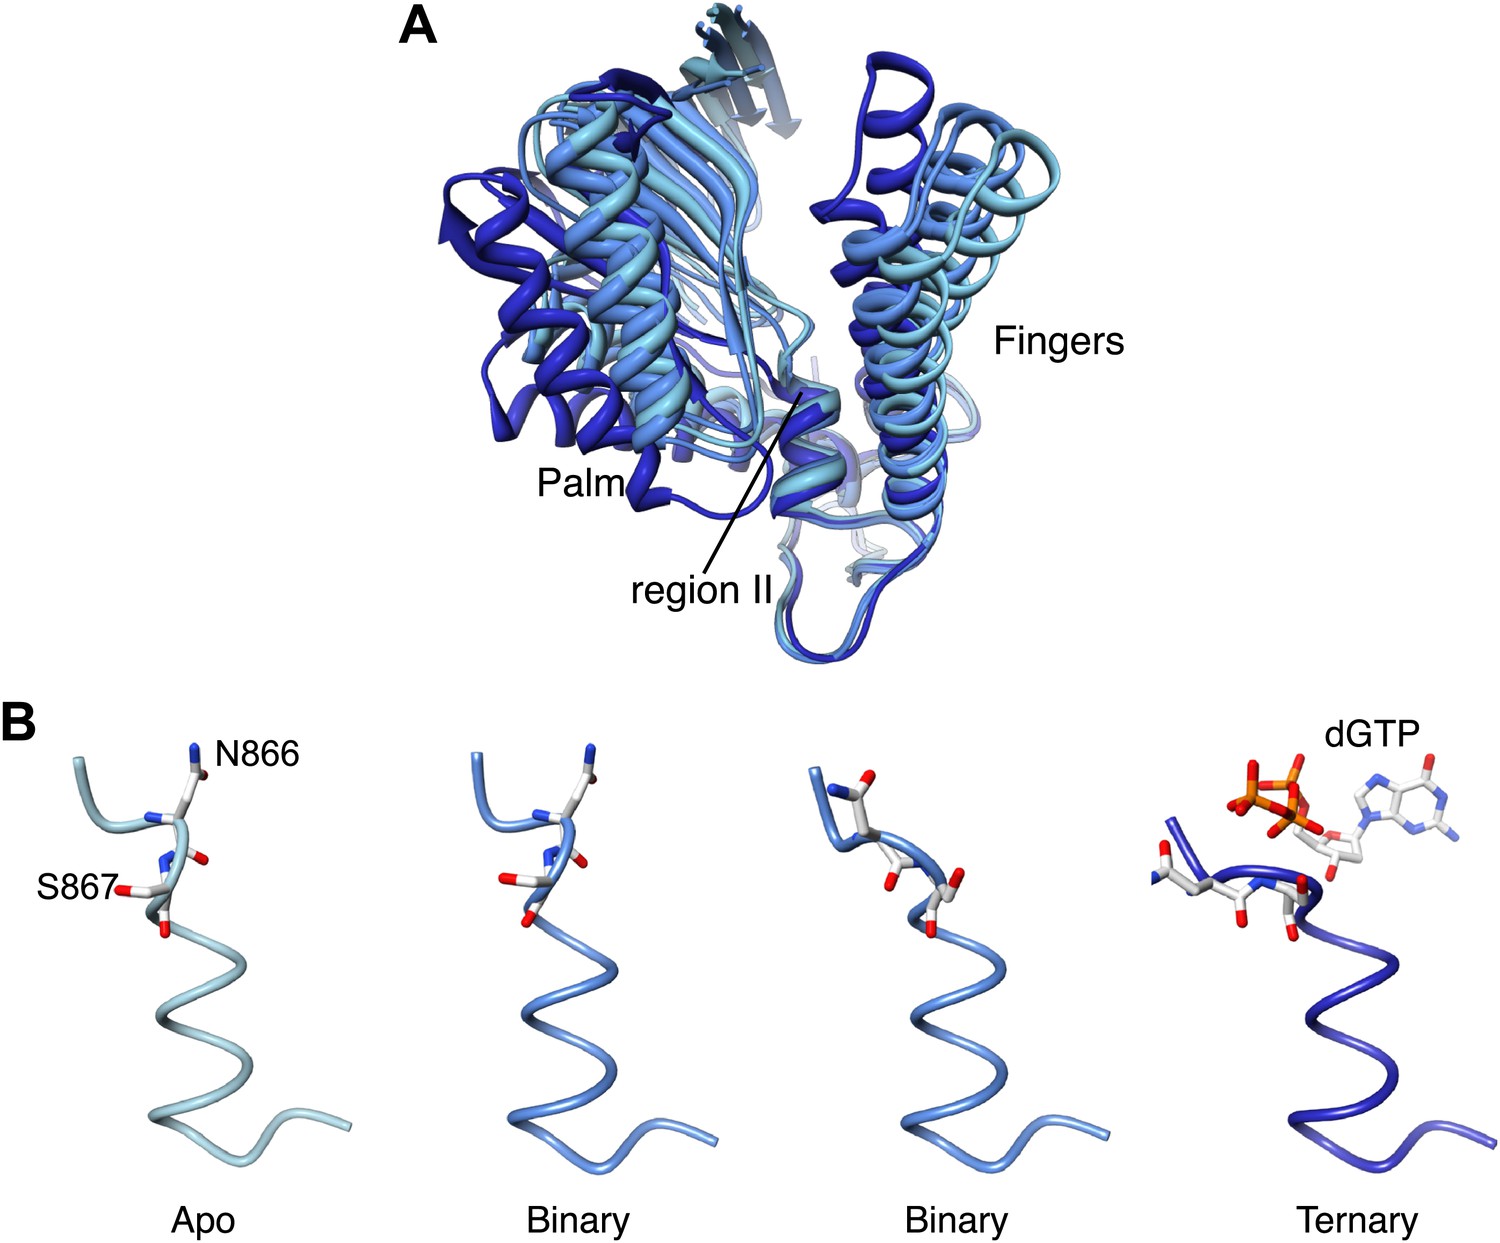
Palm domain movement controls nucleotide access to active site.
(A) Structural superposition of the polymerase domain of Pol α in the apo form (light blue), in the binary (blue) and ternary (dark blue) complex. Only the palm and fingers domains of the polymerase are shown. The position of the region II sequence, conserved in B-family DNA polymerases, is indicated. (B) Polypeptide conformation in the region II sequence of Pol α. From left to right, the panel shows the conformation of the polymerase in the apo form (light blue), in the two polymerase molecules in the asymmetric unit of the binary complex crystals (blue) and in the ternary complex form (dark blue). The polypeptide is shown as a thin tube. The 866-NS-867 di-peptide and the dGTP nucleotide are shown as sticks.
Figure 6—figure supplement 1
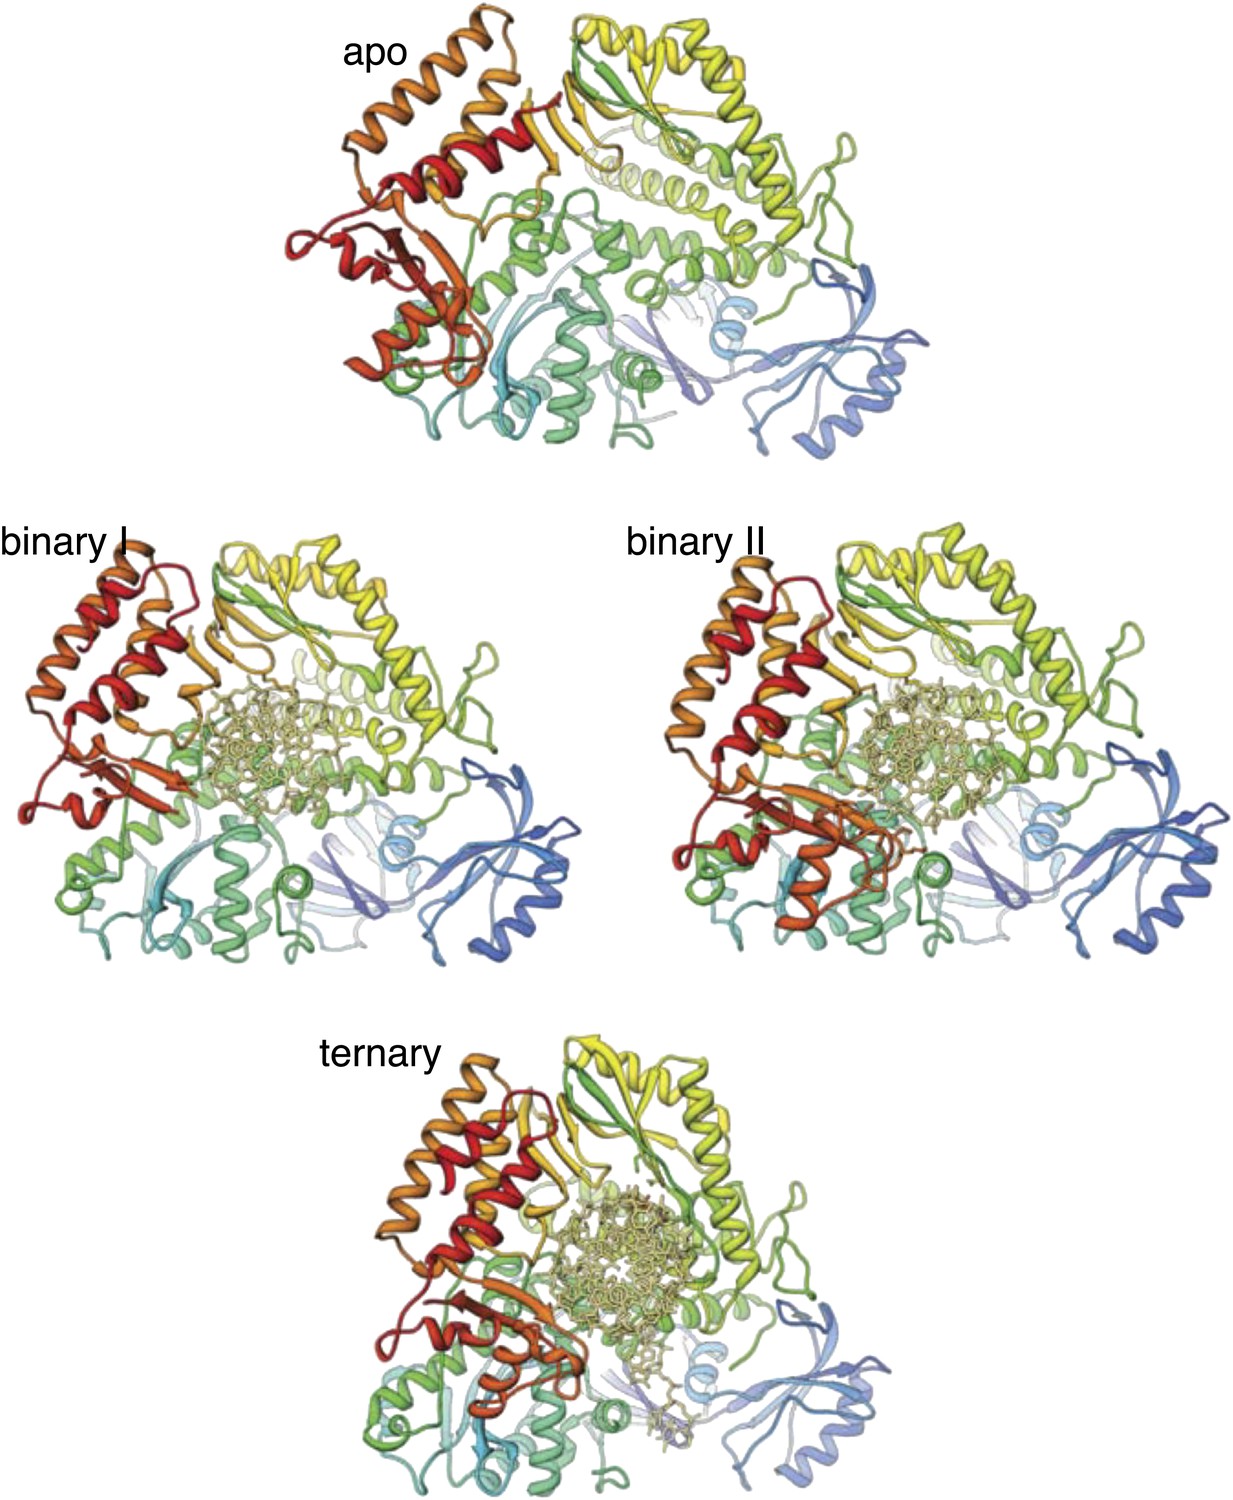
Structures of Pol α in the apo form, in a binary complex with RNA/DNA and in a ternary complex with RNA/DNA and dGTP.
Both structures present in the asymmetric unit of the binary complex crystals are shown, as they differ markedly in conformation of the thumb and palm domains (see also text for details). The polymerase is shown as ribbon, coloured blue to red from the N-terminus. The RNA/DNA molecule is shown as all-atom stick model.
Figure 7
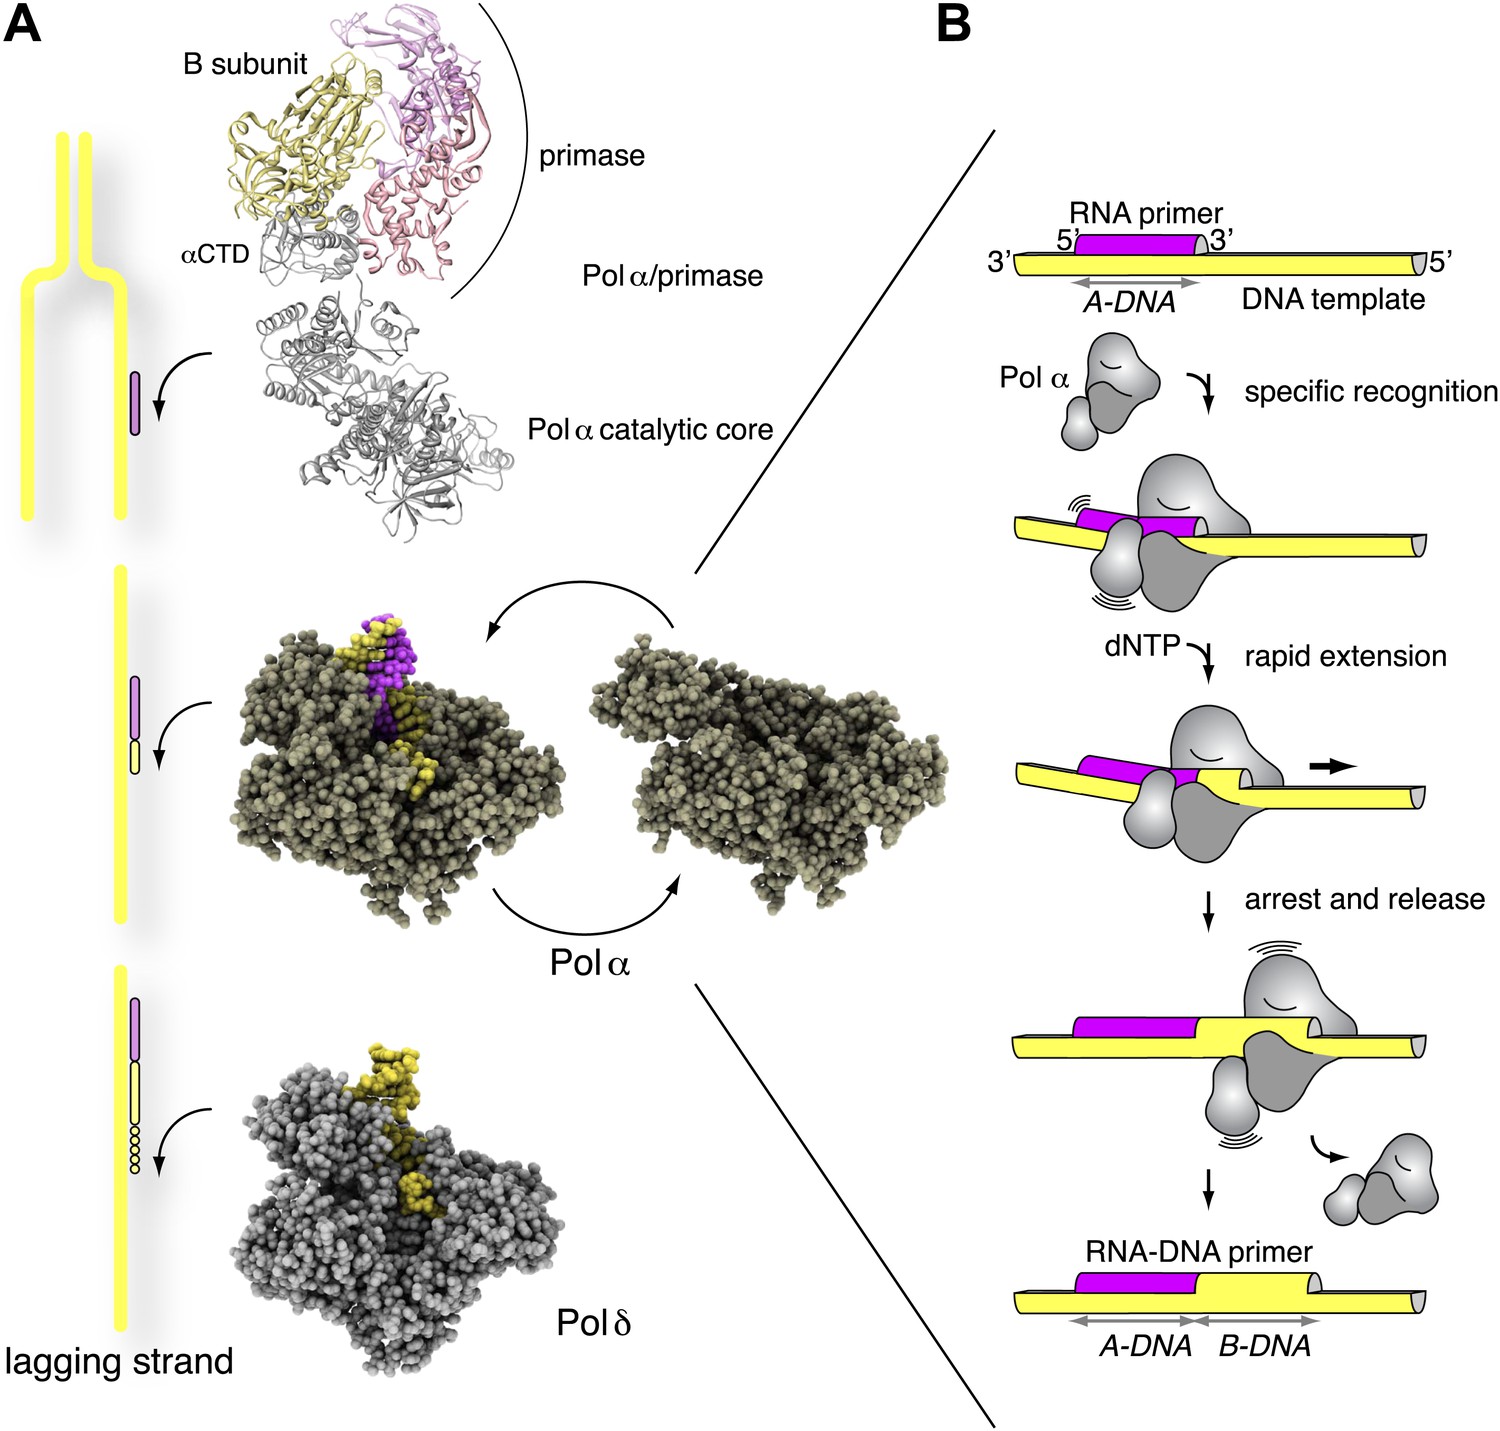
Mechanism of DNA primer synthesis by Pol α.
(A) Priming eukaryotic replication requires synthesis of an RNA primer by the primase subunit of the Pol α/primase complex, intramolecular primer hand-off to the catalytic subunit of Pol α and limited primer extension with DNA; processive elongation of the completed RNA-DNA primer by Pol δ results in Okazaki fragment synthesis. The ribbon model of the Pol α/primase complex was assembled from the crystal structures of apo Pol α (this manuscript), the yeast Pol α CTD–B subunit complex (Klinge et al., 2009), and the archaeal primase (Lao-Sirieix et al., 2005a). The location of the Pol α/primase complex components in the model is based on previous electron microscopy and biochemical data (Nunez-Ramirez et al., 2011; Kilkenny et al., 2012) and is not meant to give an accurate representation of their reciprocal spatial relationship. The crystal structures of isolated and copying Pol α and Pol δ are shown in spacefill representation. The model of Pol δ is based on PDB entry 3IAY (Swan et al., 2009). In the diagram, DNA is shown in yellow and RNA in magenta. (B) The catalytic cycle of Pol α consists of specific recognition of the templated RNA primer, rapid and limited primer extension with dNTPs and termination of synthesis induced by polymerization of B-form DNA. Constitutive tethering of primase to Pol α (not drawn in the panel; Kilkenny et al., 2012) ensures efficient recycling of Pol α onto the 3′-terminus of the next RNA primer.
Videos
Video 1
Principal motion of the Pol α structure in the simulated trajectory of the polymerase, starting from the conformation adopted in the ternary complex but in the absence of RNA/DNA and dGTP (APOFORCED trajectory; see ‘Materials and methods' for details). The movie was prepared with the MD movie tool in Chimera, by interpolation of 30 Pol α structures representative of the APOFORCED trajectory. The Pol α structure is shown as a ribbon, coloured blue to red from the N- to the C-terminal end of the polypeptide.
Video 2
Animation that shows morphing between the Pol α structures in the ternary complex and in the apo form. Pol α is shown in ribbon representation, coloured light blue. The animation was prepared with the MD movie tool in Chimera.
Tables
Table 1
X-ray data processing and crystallographic refinement
| X-ray data processing | ||||||||||||
| Seleno-methionine | Apo | Binary complex | Ternary complex | |||||||||
| Space group | P 2 21 21 | P21 | P1 | P 21 21 21 | ||||||||
| Unit cell (Å) | 74.0 127.5 144.1 | 74.4 127.1 74.5 | 72.1 74.8 117.0 | 111.7 145.7 197.2 | ||||||||
| Angles (°) | 90.0 90.0 90.0 | 90.0 104.8 90.0 | 82.3 72.6 82.4 | 90.0 90.0 90.0 | ||||||||
| Mosaicity | 0.39 | 0.54 | 0.77 | 0.35 | ||||||||
| Overall | Innershell | Outershell | Overall | Innershell | Outershell | Overall | Innershell | Outershell | Overall | Innershell | Outershell | |
| Low resolution limit (Å) | 73.97 | 73.97 | 2.81 | 53.51 | 53.51 | 2.42 | 58.77 | 58.77 | 3.16 | 49.39 | 49.39 | 3.26 |
| High resolution limit (Å) | 2.67 | 8.43 | 2.67 | 2.3 | 7.27 | 2.3 | 3 | 9.49 | 3 | 3.1 | 9.79 | 3.1 |
| Rmerge | 0.133 | 0.052 | 0.663 | 0.085 | 0.039 | 0.512 | 0.073 | 0.03 | 0.921 | 0.105 | 0.042 | 0.974 |
| Rmerge in top intensity bin | 0.061 | - | - | 0.051 | - | - | 0.029 | - | - | 0.046 | - | - |
| Rmeas (within I+/I−) | 0.14 | 0.054 | 0.703 | 0.104 | 0.048 | 0.621 | 0.085 | 0.035 | 1.068 | 0.113 | 0.046 | 1.05 |
| Rmeas (all I+ & I−) | 0.148 | 0.071 | 0.702 | 0.1 | 0.045 | 0.609 | 0.085 | 0.035 | 1.068 | 0.113 | 0.046 | 1.05 |
| Rpim (within I+/I−) | 0.043 | 0.017 | 0.229 | 0.058 | 0.027 | 0.35 | 0.043 | 0.018 | 0.539 | 0.042 | 0.018 | 0.386 |
| Rpim (all I+ & I−) | 0.033 | 0.016 | 0.165 | 0.04 | 0.019 | 0.246 | 0.043 | 0.018 | 0.539 | 0.042 | 0.018 | 0.386 |
| Fractional partial bias | −0.008 | −0.043 | −0.028 | −0.035 | −0.025 | −0.045 | −0.039 | −0.034 | −0.178 | −0.007 | −0.006 | −0.127 |
| Total number of observations | 781,855 | 25,826 | 97,175 | 355,357 | 10,427 | 50,930 | 175,884 | 5217 | 25,591 | 428,397 | 13,181 | 61,528 |
| Total number unique | 39,626 | 1401 | 5656 | 58,906 | 1764 | 8523 | 45,027 | 1413 | 6546 | 59,154 | 1990 | 8380 |
| Mean((I)/sd(I)) | 17.9 | 39.6 | 4.6 | 11.3 | 30.1 | 3 | 13.6 | 55.6 | 1.5 | 10.8 | 28.9 | 2.1 |
| Completeness | 100 | 99.6 | 99.8 | 99.3 | 91.4 | 99.1 | 97.8 | 96.7 | 97.5 | 99.7 | 97.2 | 98.4 |
| Multiplicity | 19.7 | 18.4 | 17.2 | 6 | 5.9 | 6 | 3.9 | 3.7 | 3.9 | 7.2 | 6.6 | 7.3 |
| Anomalous completeness | 99.9 | 99.7 | 99.5 | |||||||||
| Anomalous multiplicity | 10.3 | 11 | 8.8 | |||||||||
| DelAnom correlation between half-sets | 0.602 | 0.823 | 0.068 | |||||||||
| Mid-slope of Anom normal probability | 1.372 | - | - | |||||||||
| Crystallographic refinement | ||||
| Seleno-methionine | Apo | Binary complex | Ternary complex | |
| R-factor (overall/outershell) | 0.1959 (0.2405) | 0.2051 (0.3079) | 0.2551 (0.3623) | 0.2111 (0.3570) |
| R-free (overall/ outershell) | 0.2341 (0.3058) | 0.2361 (0.3453) | 0.2858 (0.4040) | 0.2479 (0.3909) |
| Number of atoms | 13,497 | 13,690 | 27,707 | 29,108 |
| macromolecules | 6637 | 6683 | 13,914 | 14,680 |
| ligands | 62 | |||
| water | 110 | 216 | 0 | 0 |
| Protein residues | 827 | 829 | 1687 | 1754 |
| RMS(bonds) | 0.002 | 0.002 | 0.003 | 0.003 |
| RMS(angles) | 0.57 | 0.59 | 0.77 | 0.75 |
| Ramachandran favored (%) | 97 | 97 | 96 | 94 |
| Ramachandran outliers (%) | 0.12 | 0 | 0.061 | 0.24 |
| Clashscore | 3.74 | 2.75 | 10.04 | 11.55 |
| Wilson B-factor | 45.94 | 42.31 | 91.64 | 97.34 |
| Average B-factor | 56.5 | 62.4 | 108 | 111.6 |
| macromolecules | 56.7 | 62.7 | 108 | 111.6 |
| solvent | 45.8 | 54.9 | ||
Table 2
Oligonucleotides used in the primer extension assay of Figure 4D
| Primer name | Type | Primer5–3′ | Template5–3′ |
| A12 | RNA | A12 | T50 |
| dA12 | DNA | dA12 | T50 |
| G2 | DNA | AAAAAGGAAAAA | T43CCT5 |
| G4 | DNA | AGGAAGGAAAAA | T43CCTTCCT |
| G6 | DNA | AGGAAGGAGGAA | T40CCTCCTTCCT |
| G7 | DNA | AGGAGGGAGGAA | T40CCTCCCTCCT |
Download links
A two-part list of links to download the article, or parts of the article, in various formats.
Downloads (link to download the article as PDF)
Open citations (links to open the citations from this article in various online reference manager services)
Cite this article (links to download the citations from this article in formats compatible with various reference manager tools)
Mechanism for priming DNA synthesis by yeast DNA Polymerase α
eLife 2:e00482.
https://doi.org/10.7554/eLife.00482


