The positive predictive value of genetic screening tests
- Published
- Accepted
- Subject Areas
- Genetics, Genomics, Public Health, Medical Genetics
- Keywords
- genetic screening, epidemiologic methods, clinical validity, positive predictive value, clinical test validation, population screening, genomics
- Copyright
- © 2019 Hagenkord et al.
- Licence
- This is an open access article distributed under the terms of the Creative Commons Attribution License, which permits unrestricted use, distribution, reproduction and adaptation in any medium and for any purpose provided that it is properly attributed. For attribution, the original author(s), title, publication source (PeerJ Preprints) and either DOI or URL of the article must be cited.
- Cite this article
- 2019. The positive predictive value of genetic screening tests. PeerJ Preprints 7:e27922v1 https://doi.org/10.7287/peerj.preprints.27922v1
Abstract
As the cost of DNA sequencing continues to fall, more individuals are opting to undergo genomic testing in the absence of a clinical indication. Testing asymptomatic individuals for unsuspected conditions is not new to the medical and public health communities. However, the application of screening principles to inherited diseases with unknown prevalence in an unselected (low-risk) test population raises unique challenges. This paper examines the effect of disease prevalence on the positive predictive value of a test result. Many inherited conditions have very low prevalence in an unselected population, which increases the probability that some likely pathogenic variants may be false positives. In situations where the adverse impact of a false positive result is significant, laboratories should address this issue by either increasing the interpretive specificity of the test, performing a clinical confirmatory test to establish the presence of disease, or restricting the test to a population with increased disease prevalence. Here, we review the statistical concepts relevant to screening tests, apply these concepts to genetic disease screening, create a model to estimate prevalence and positive predictive value, and provide a framework for further discussion.
Author Comment
This article has been submitted as an invited review to Genetics in Medicine.
Supplemental Information
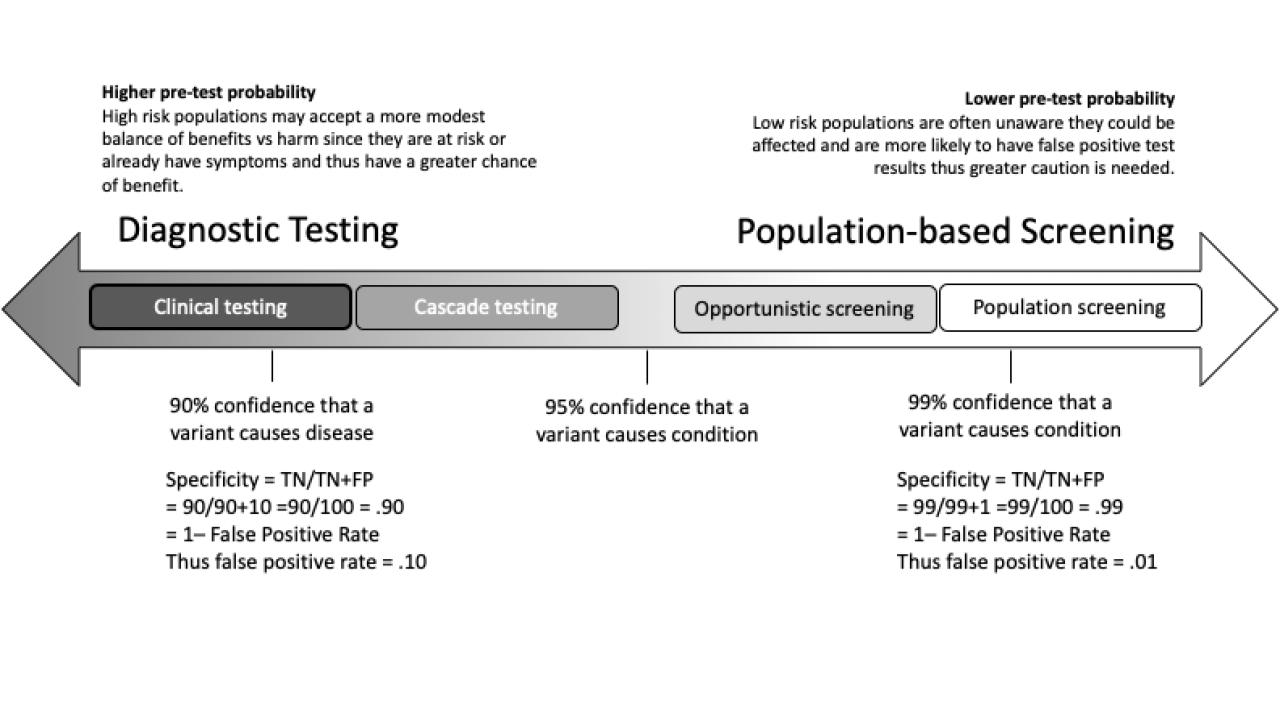
Figure 1. Intended Use or Purpose of the Test
The clinical implications of false results must be considered when determining the appropriate sensitivity and specificity for the intended use. Tests intended for higher risk populations (diagnostic testing) may tolerate more false positives than tests intended for low risk populations (screening). The false positive rate is reflected in the test’s clinical specificity.
Table 1. Generic test development definitions and examples of their application to genetic testing
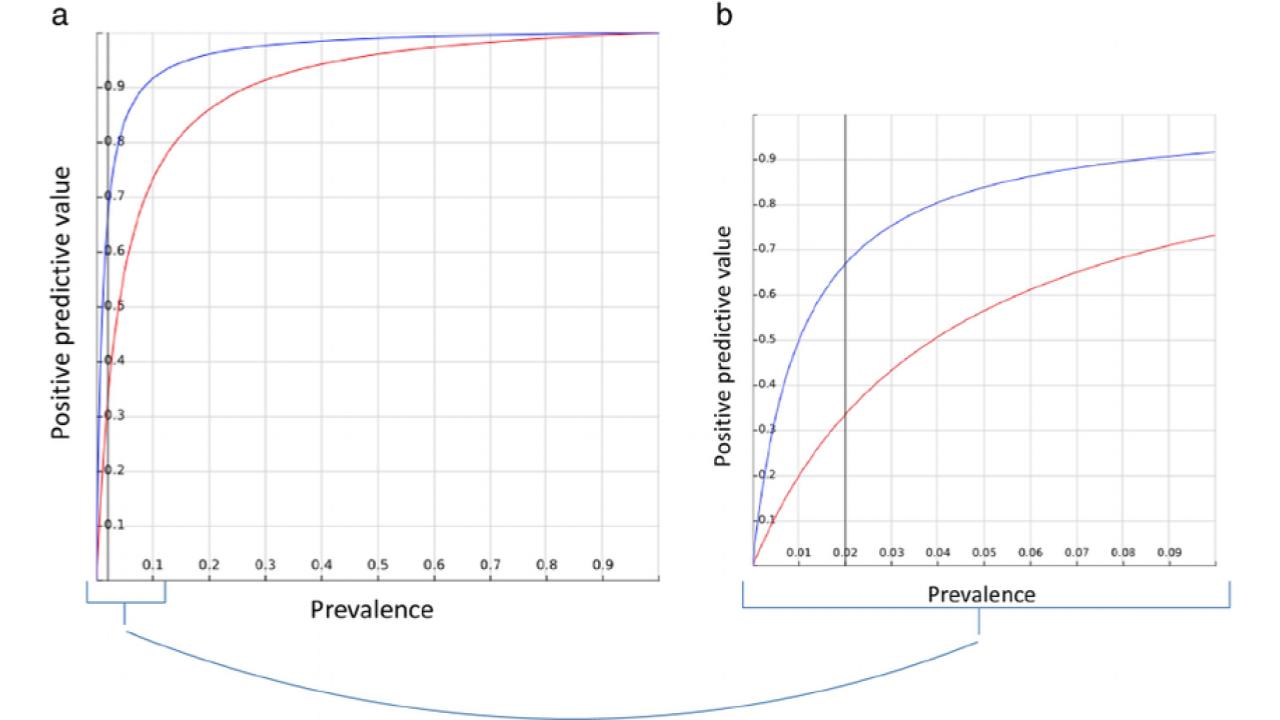
Figure 2. Impact of prevalence on PPV
When the disease prevalence is low in the test population, small changes in the specificity can have a large impact on the positive predictive value of the test. PPV as a function of prevalence for two tests: Test A (blue), with a sensitivity of 99% and a specificity of 99%; and Test B (red), with a sensitivity of 99% and a specificity of 96%. a) Full range of possible PPV and prevalence, from 0 to 1. b) Magnified region of prevalence <0.1, a gray line to show an example prevalence of 0.02. A decrease of only 3% in specificity can mean a 50% decrease in PPV: from 0.33 to 0.66. Adapted with permission from Romero-Brufau, et al. 45 The prevalence of the disease is equal to the a priori probability that a subject selected at random from the test population has the condition.
Table 2. Estimating the Test Specificity
Test specificity is estimated by assuming ⅓ of the overall positive rate is due to likely pathogenic variants (LP) and then calculating the specificity as described in Supplemental Figure 2 (Specificity = TN/(TN+FP) = (1 - Positive Rate)/(1 - 29/30 x Positive Rate). Note how specificity changes with overall positive rate (orange). *Some conditions on ACMG59TM have a prevalence less than 1/10,000.
Table 3. Computing the PPV from prevalence and specificity
Small decreases in specificity can have a significant impact on the PPV of likely pathogenic variants over a range of prevalences representative of monogenic inherited diseases. The PPV calculations for CDC Tier 1 (yellow) and ACMG59 (orange) conditions are as follows: PPV = sensitivity x prevalence / [sensitivity x prevalence + (1 - specificity) x (1 - prevalence)]. 46 The specificity estimates for CDC Tier 1 (yellow) and ACMG59TM (orange) conditions are from Table 2. The model is intended to provide estimates and show trends. In practice, each condition should be considered individually.
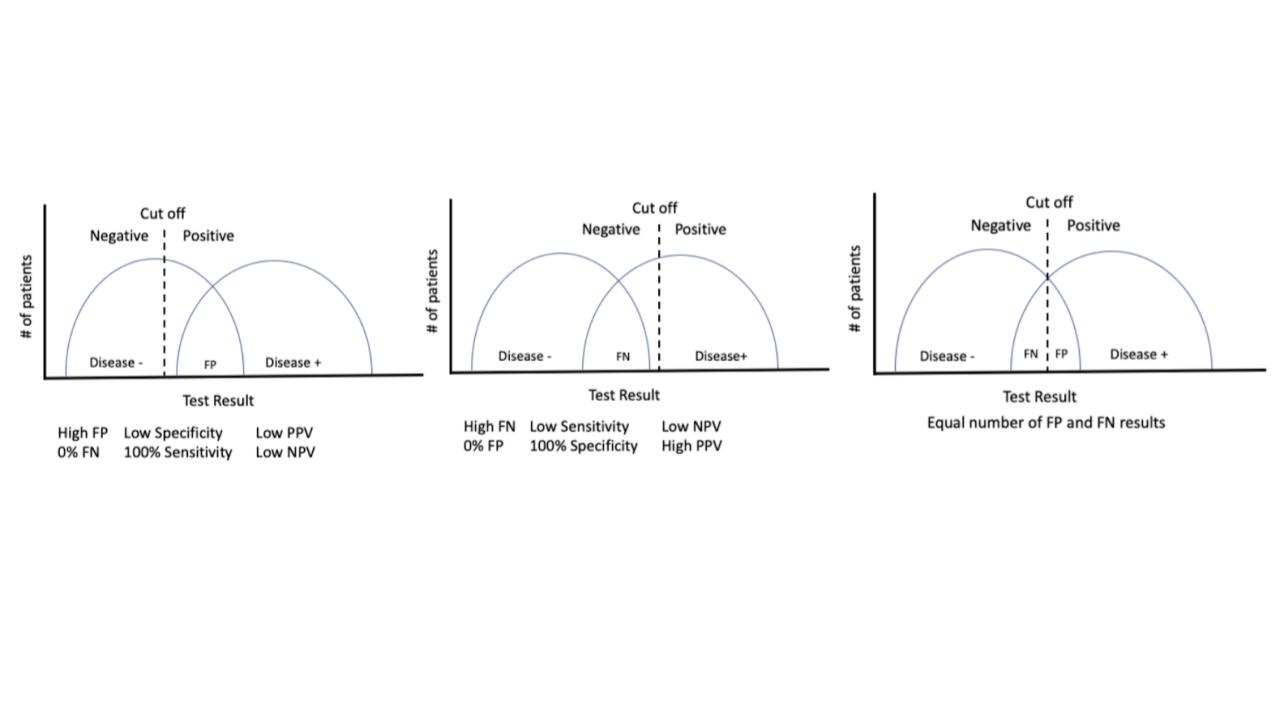
Supplemental Figure 1.
The sensitivity and specificity of a test can be adjusted during the test development phase to allow for more or less false positives or false negatives, as appropriate for the test’s intended use. The graphs show the results obtained by the new test when it tested a cohort of known positive samples and known negative samples, as determined by an existing diagnostic test. Ideally, the new test could perfectly discriminate between positive and negative samples. In practice this is rarely the case, so thoughtful trade offs between desired sensitivity and specificity are necessary. FP = false positive, FN = false negative, PPV = positive predictive value, NPV = negative predictive value
Supplemental Table 1. Screening test and confirmatory diagnostic test pairs
Examples of screening tests and confirmatory tests. Confirmatory tests can serve as the “gold standard” or index test comparator during test validation as well as a follow up test for positive screening results in practice.
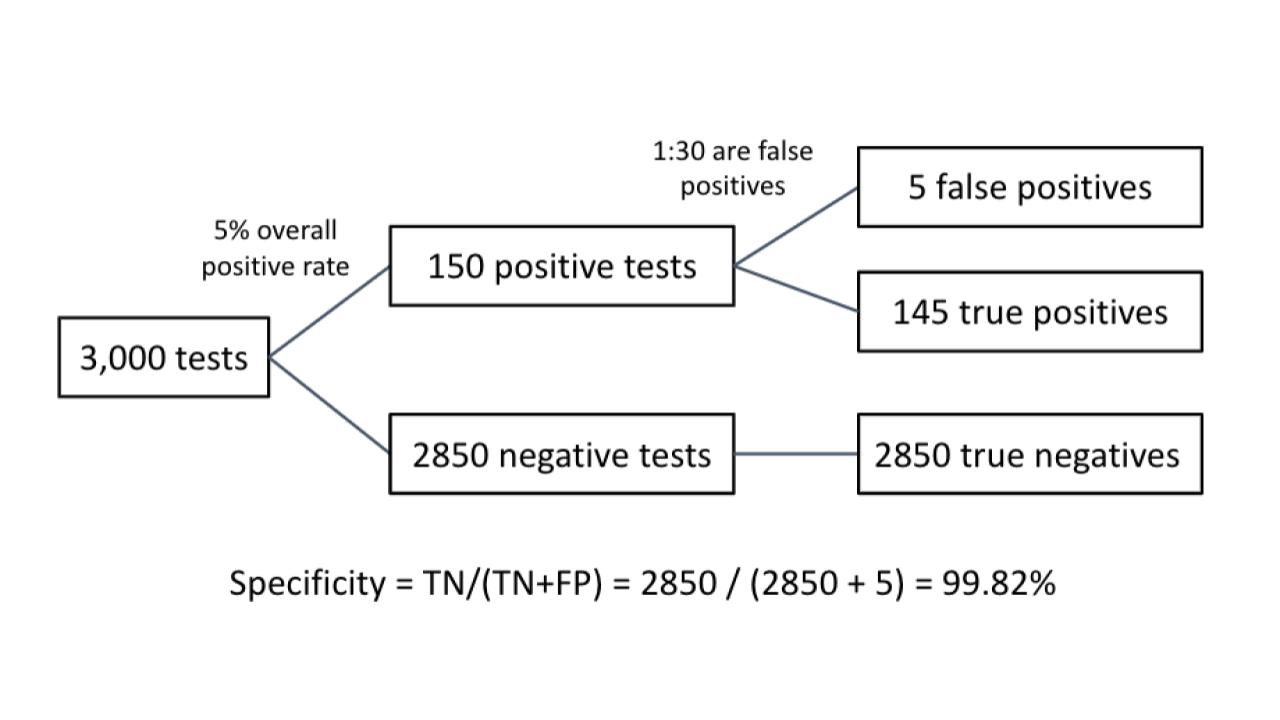
Supplemental Figure 2. Relationship between overall positive rate and specificity
In this example, the test has 100% analytical sensitivity and specificity, as determined during the test validation. After processing 3,000 samples, the lab determined that the positive rate in their setting is 5%. This means they have 150 positive results and 2850 negative results. The positive/negative cut off has been set to allow for 1/10 LP positives to be a false positive; thus 1/30 positives are false positives . Therefore, 5 of the positive results are false positives. and test specificity = 2850/(2850+5) = 99.82%. This method is used to calculate specificities for Tables 2 and 3 for varying positive test rates.