Human feeding biomechanics: performance, variation, and functional constraints
- Published
- Accepted
- Subject Areas
- Anthropology, Computational Biology, Evolutionary Studies, Anatomy and Physiology
- Keywords
- evolution, loading, bone strain, cranium
- Copyright
- © 2016 Ledogar et al.
- Licence
- This is an open access article distributed under the terms of the Creative Commons Attribution License, which permits unrestricted use, distribution, reproduction and adaptation in any medium and for any purpose provided that it is properly attributed. For attribution, the original author(s), title, publication source (PeerJ Preprints) and either DOI or URL of the article must be cited.
- Cite this article
- 2016. Human feeding biomechanics: performance, variation, and functional constraints. PeerJ Preprints 4:e2113v1 https://doi.org/10.7287/peerj.preprints.2113v1
Abstract
The evolution of the modern human (Homo sapiens) cranium is characterized by a reduction in the size of the feeding system, including reductions in the size of the facial skeleton, postcanine teeth, and the muscles involved in biting and chewing. The conventional view hypothesizes that gracilization of the human feeding system is related to a shift toward eating foods that were less mechanically challenging to consume and/or foods that were processed using tools before being ingested. This hypothesis predicts that human feeding systems should not be well-configured to produce forceful bites and that the cranium should be structurally weak. An alternate hypothesis states that the modern human face is adapted to generate and withstand high biting forces. We used finite element analysis (FEA) to test two opposing mechanical hypotheses: that compared to our closest living relative, chimpanzees (Pan troglodytes), the modern human craniofacial skeleton is 1) less well configured, or 2) better configured to generate and withstand high magnitude bite forces. We considered intraspecific variation in our examination of human feeding biomechanics by examining a sample of geographically diverse crania that differed notably in shape. We found that our biomechanical models of human crania had broadly similar mechanical behavior despite their shape variation and were, on average, less structurally stiff than the crania of chimpanzees during unilateral biting when loaded with physiologically-scaled muscle loads. Our results also show that modern humans are efficient producers of bite force, consistent with previous analyses. However, highly tensile reaction forces were generated at the working (biting) side jaw joint during unilateral molar bites in which the chewing muscles were recruited with bilateral symmetry. In life, such a configuration would have increased the risk of joint dislocation and constrained the maximum recruitment levels of the masticatory muscles on the balancing (non-biting) side of the head. Our results do not necessarily conflict with the hypothesis that anterior tooth (incisors, canines, premolars) biting could have been selectively important in humans, although the reduced size of the premolars in humans has been shown to increase the risk of tooth crown fracture. We interpret our results to suggest that human craniofacial evolution was probably not driven by selection for high magnitude unilateral biting, and that increased masticatory muscle efficiency in humans is likely to be a secondary byproduct of selection for some function unrelated to forceful biting behaviors. These results are consistent with the hypothesis that a shift to softer foods and/or the innovation of pre-oral food processing techniques relaxed selective pressures maintaining craniofacial features favoring forceful biting and chewing behaviors, leading to the characteristically small and gracile faces of modern humans.
Author Comment
This is a submission to PeerJ for review.
Supplemental Information
Cortical bone mechanical properties collected from two cadaveric human specimens
E3 and v23 refer to the elastic (Young’s) modulus and Poisson’s ratio in the axis of maximum stiffness, respectively. For modulus, factor and temperature data were used to distribute regionally variation mechanical properties throughout each of the ALL-HUM models (see Main Text).
Strain and strain energy density results from simulated premolar bites
Maximum principal strain (MaxPrin), minimum principal strain (MinPrin), strain mode (Mode), maximum shear strain (Shear), von Mises strain, and strain energy density (SED) generated during simulated premolar (P3) biting in the ALL-HUM variants of “extreme” and “average” modern human cranial FEMs. Site numbers follow Fig. 4.
Strain and strain energy density results from simulated molar bites
Maximum principal strain (MaxPrin), minimum principal strain (MinPrin), strain mode (Mode), maximum shear strain (Shear), von Mises strain, and strain energy density (SED) generated during simulated molar (M2) biting in the ALL-HUM variants of “extreme” and “average” modern human cranial FEMs. Site numbers follow Fig. 4.
Beam forces used in sensitivity analysis
Total muscle forces, beam count, and force per beam for each muscle group assigned to the GRGL model in the sensitivity analysis. Forces are in Newtons (N).
In vitro loading of human cranium
Illustration of the loading apparatus constructed for the current analysis within the INSTRON loading machine during loading of the left P3.
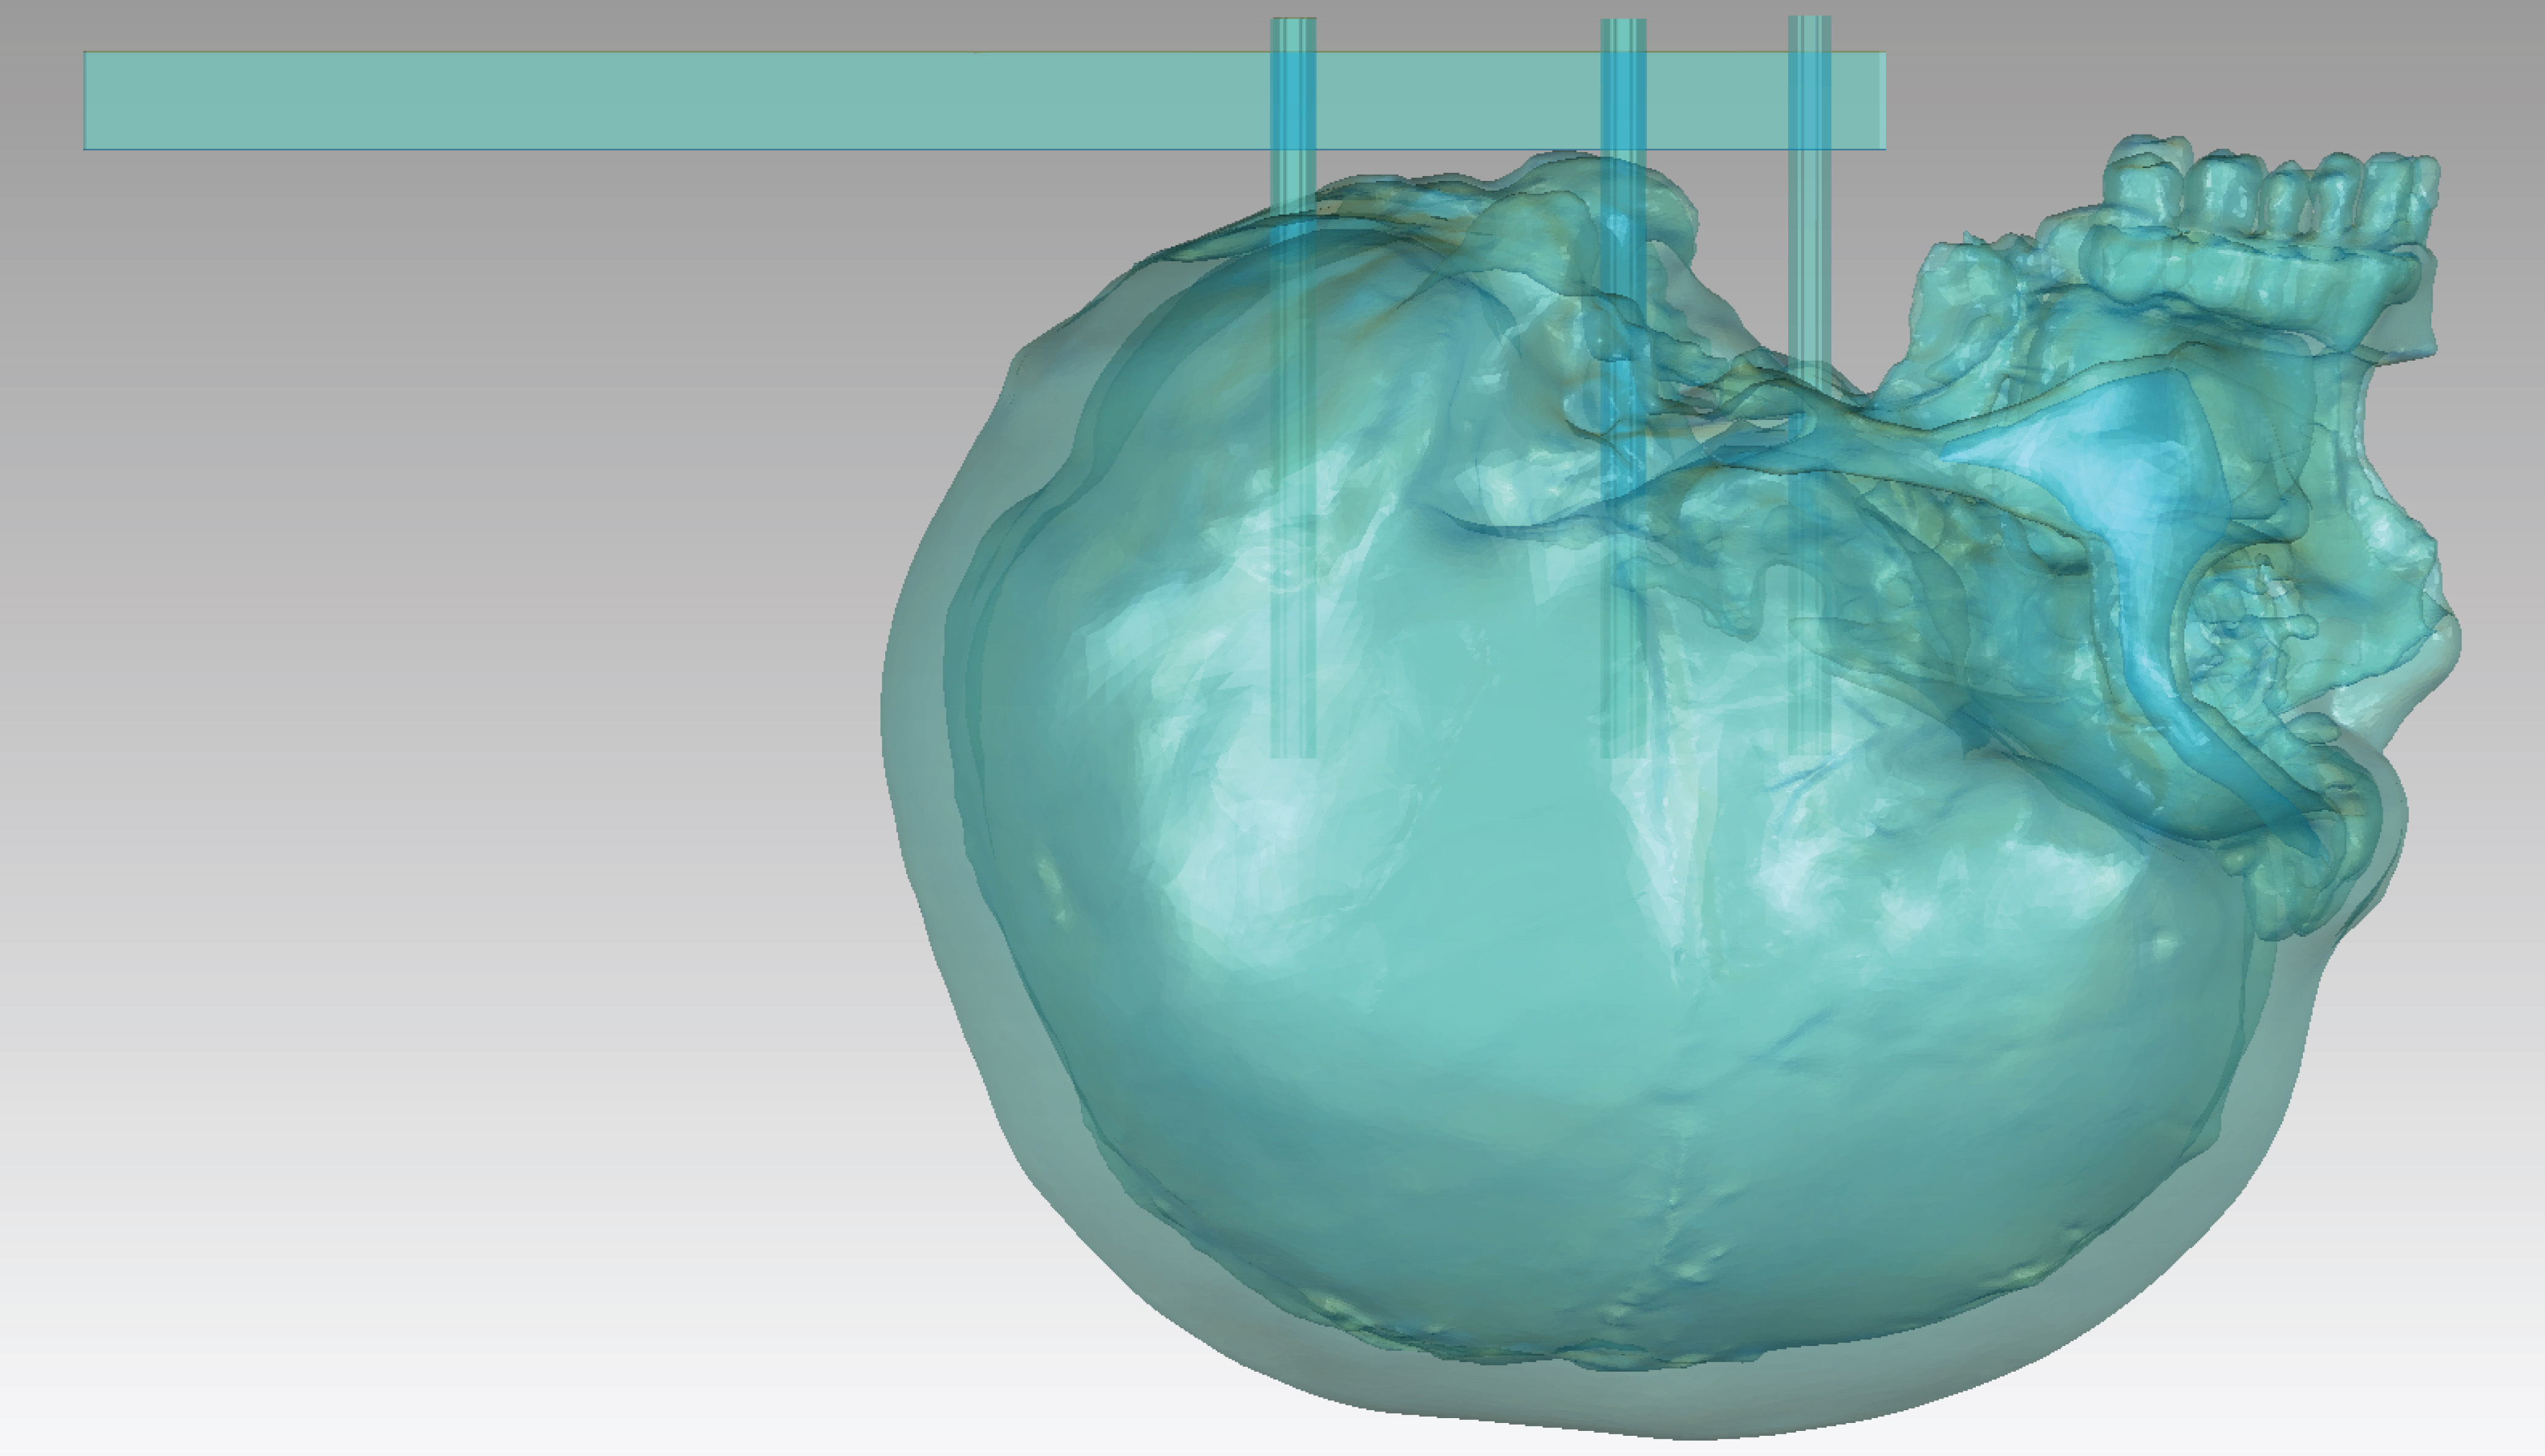
Transparent view of the model under in vitro validation
The surface model is shown in the position it was constrained during muscle loading, as in Fig. S1.
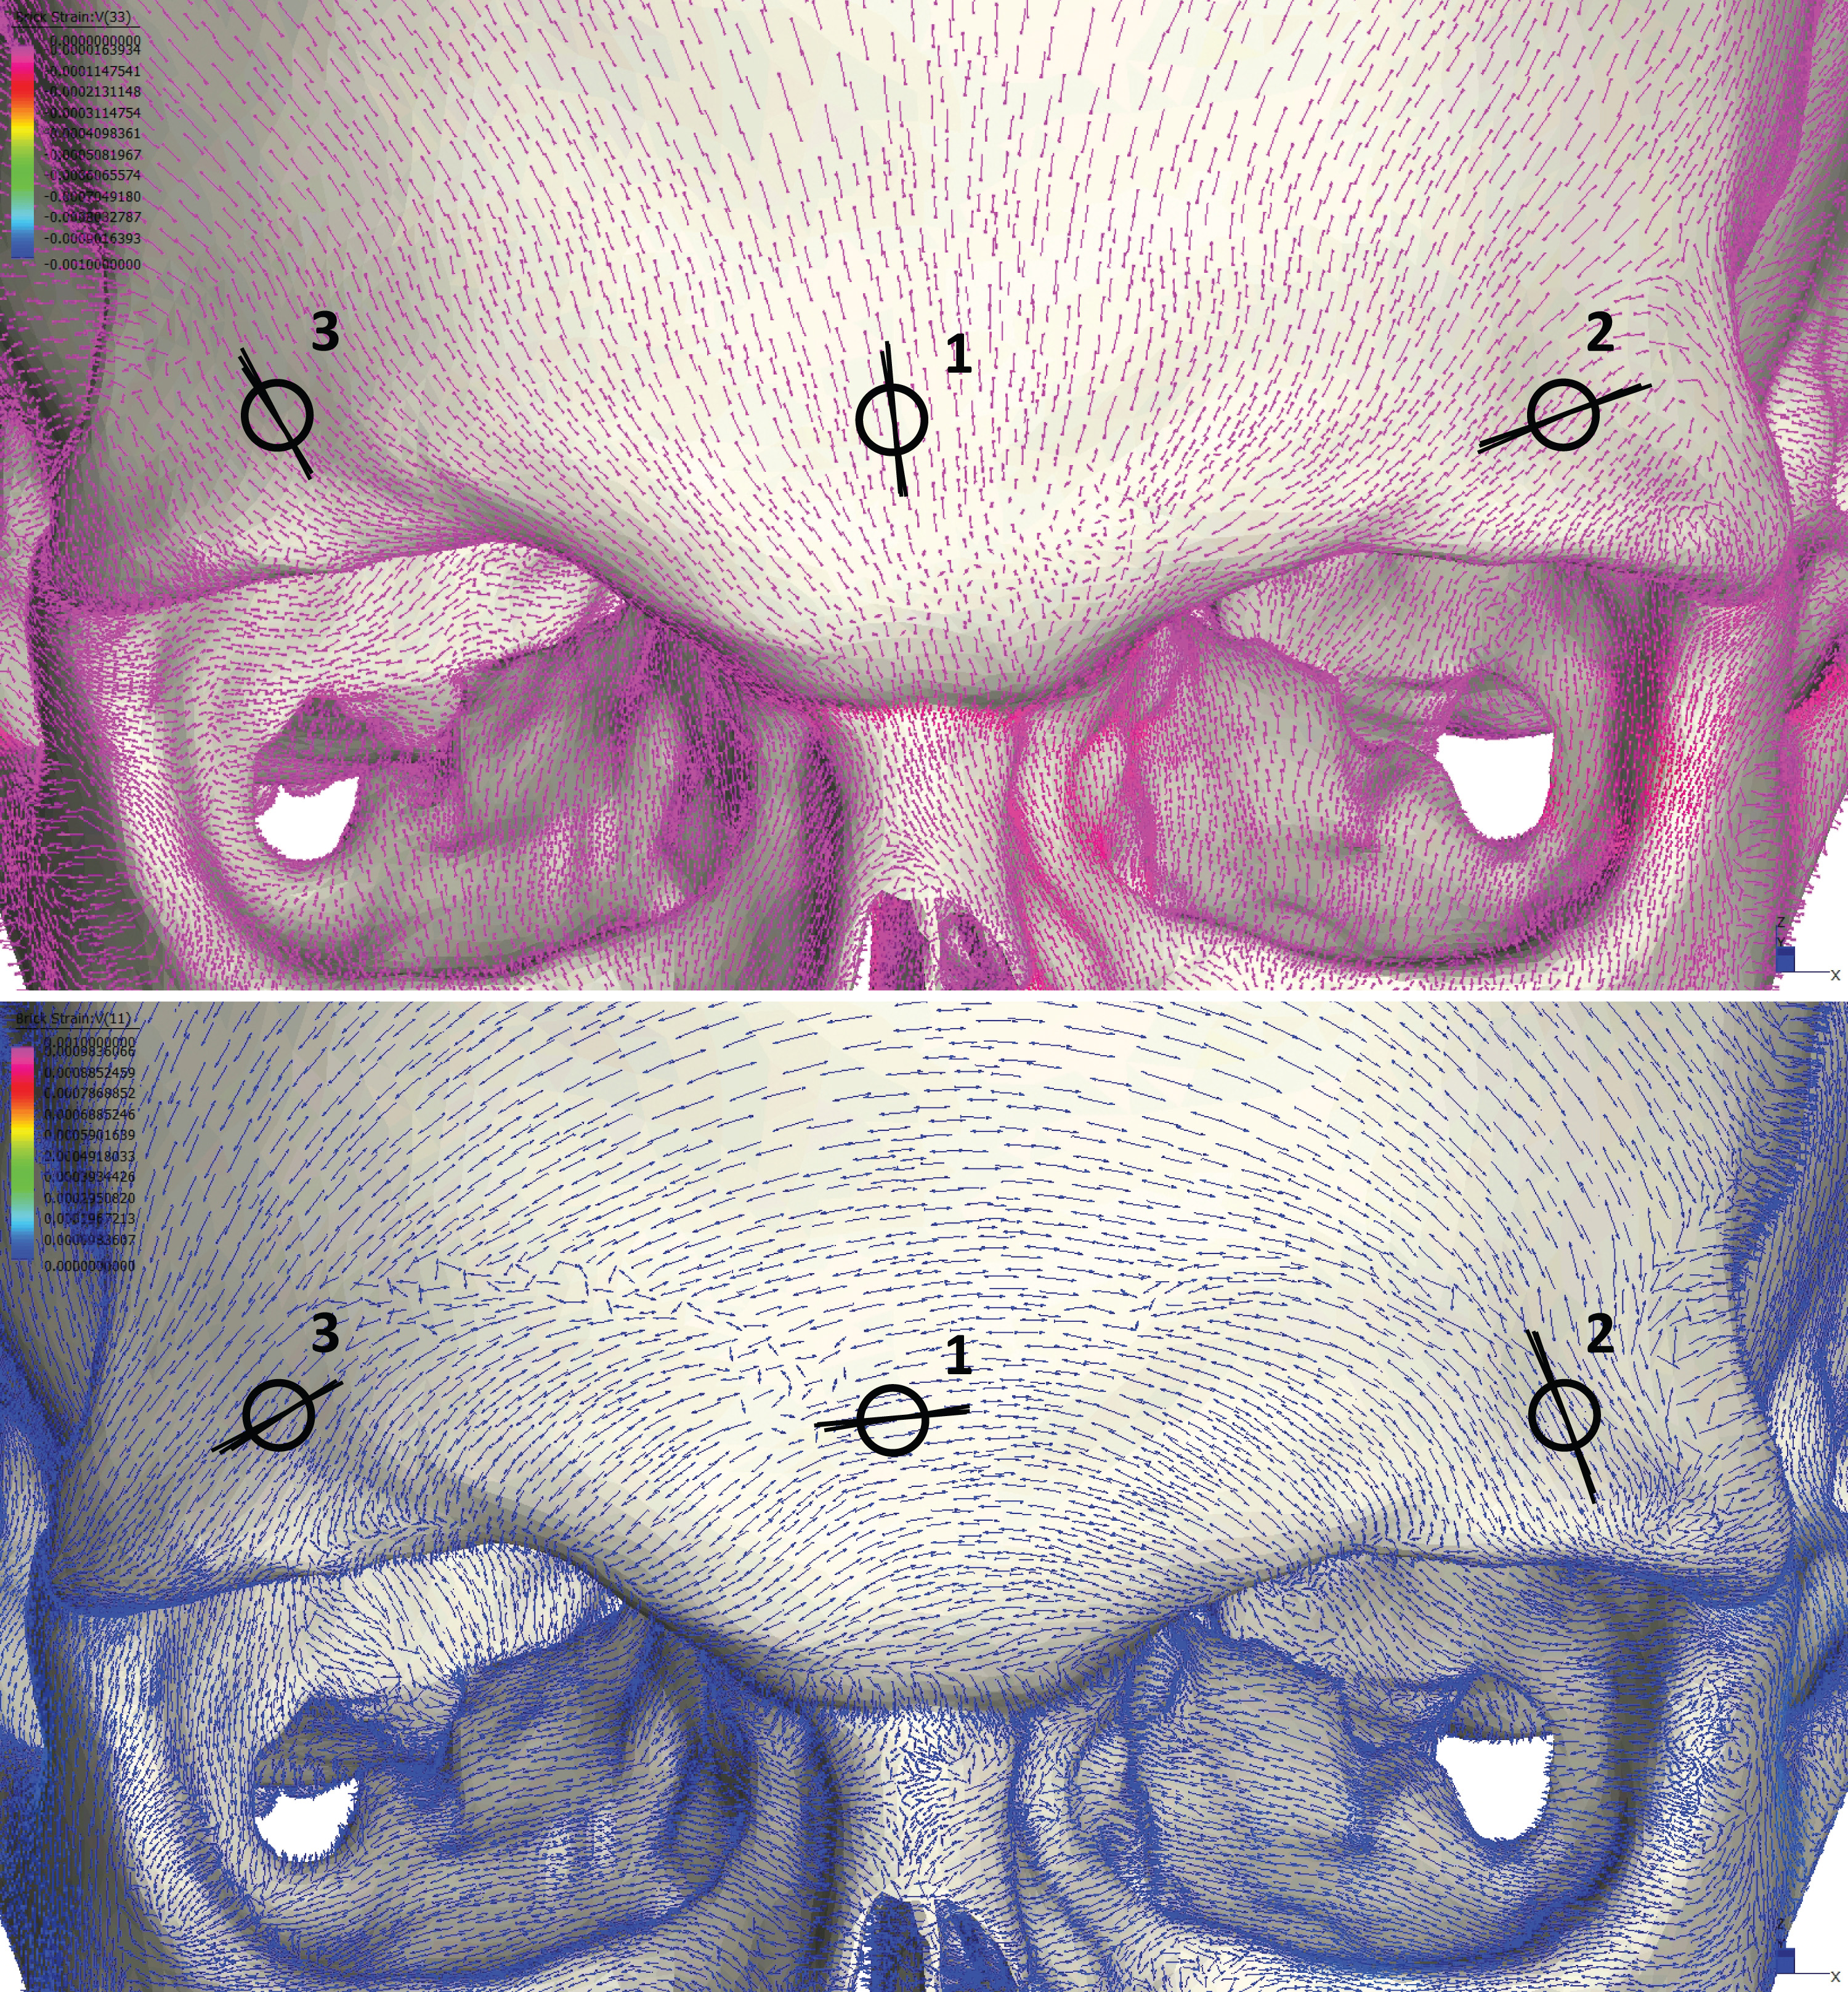
Principal strain orientations recorded during validation analysis: Sites 1, 2, and 3
Purple lines represent the orientation of minimum principal strain (compression), which is 90° to orientation of maximum principal strain. Black circles represent location of strain gages at the dorsal interorbital (site 1), working-side dorsal orbital (site 2), and balancing-side dorsal orbital (site 3) during in vitro bone strain analysis. Three lines through each gage correspond to the orientation of principal strains during the in vitro loading analysis which were recorded in degrees relative to the A element of the gage.
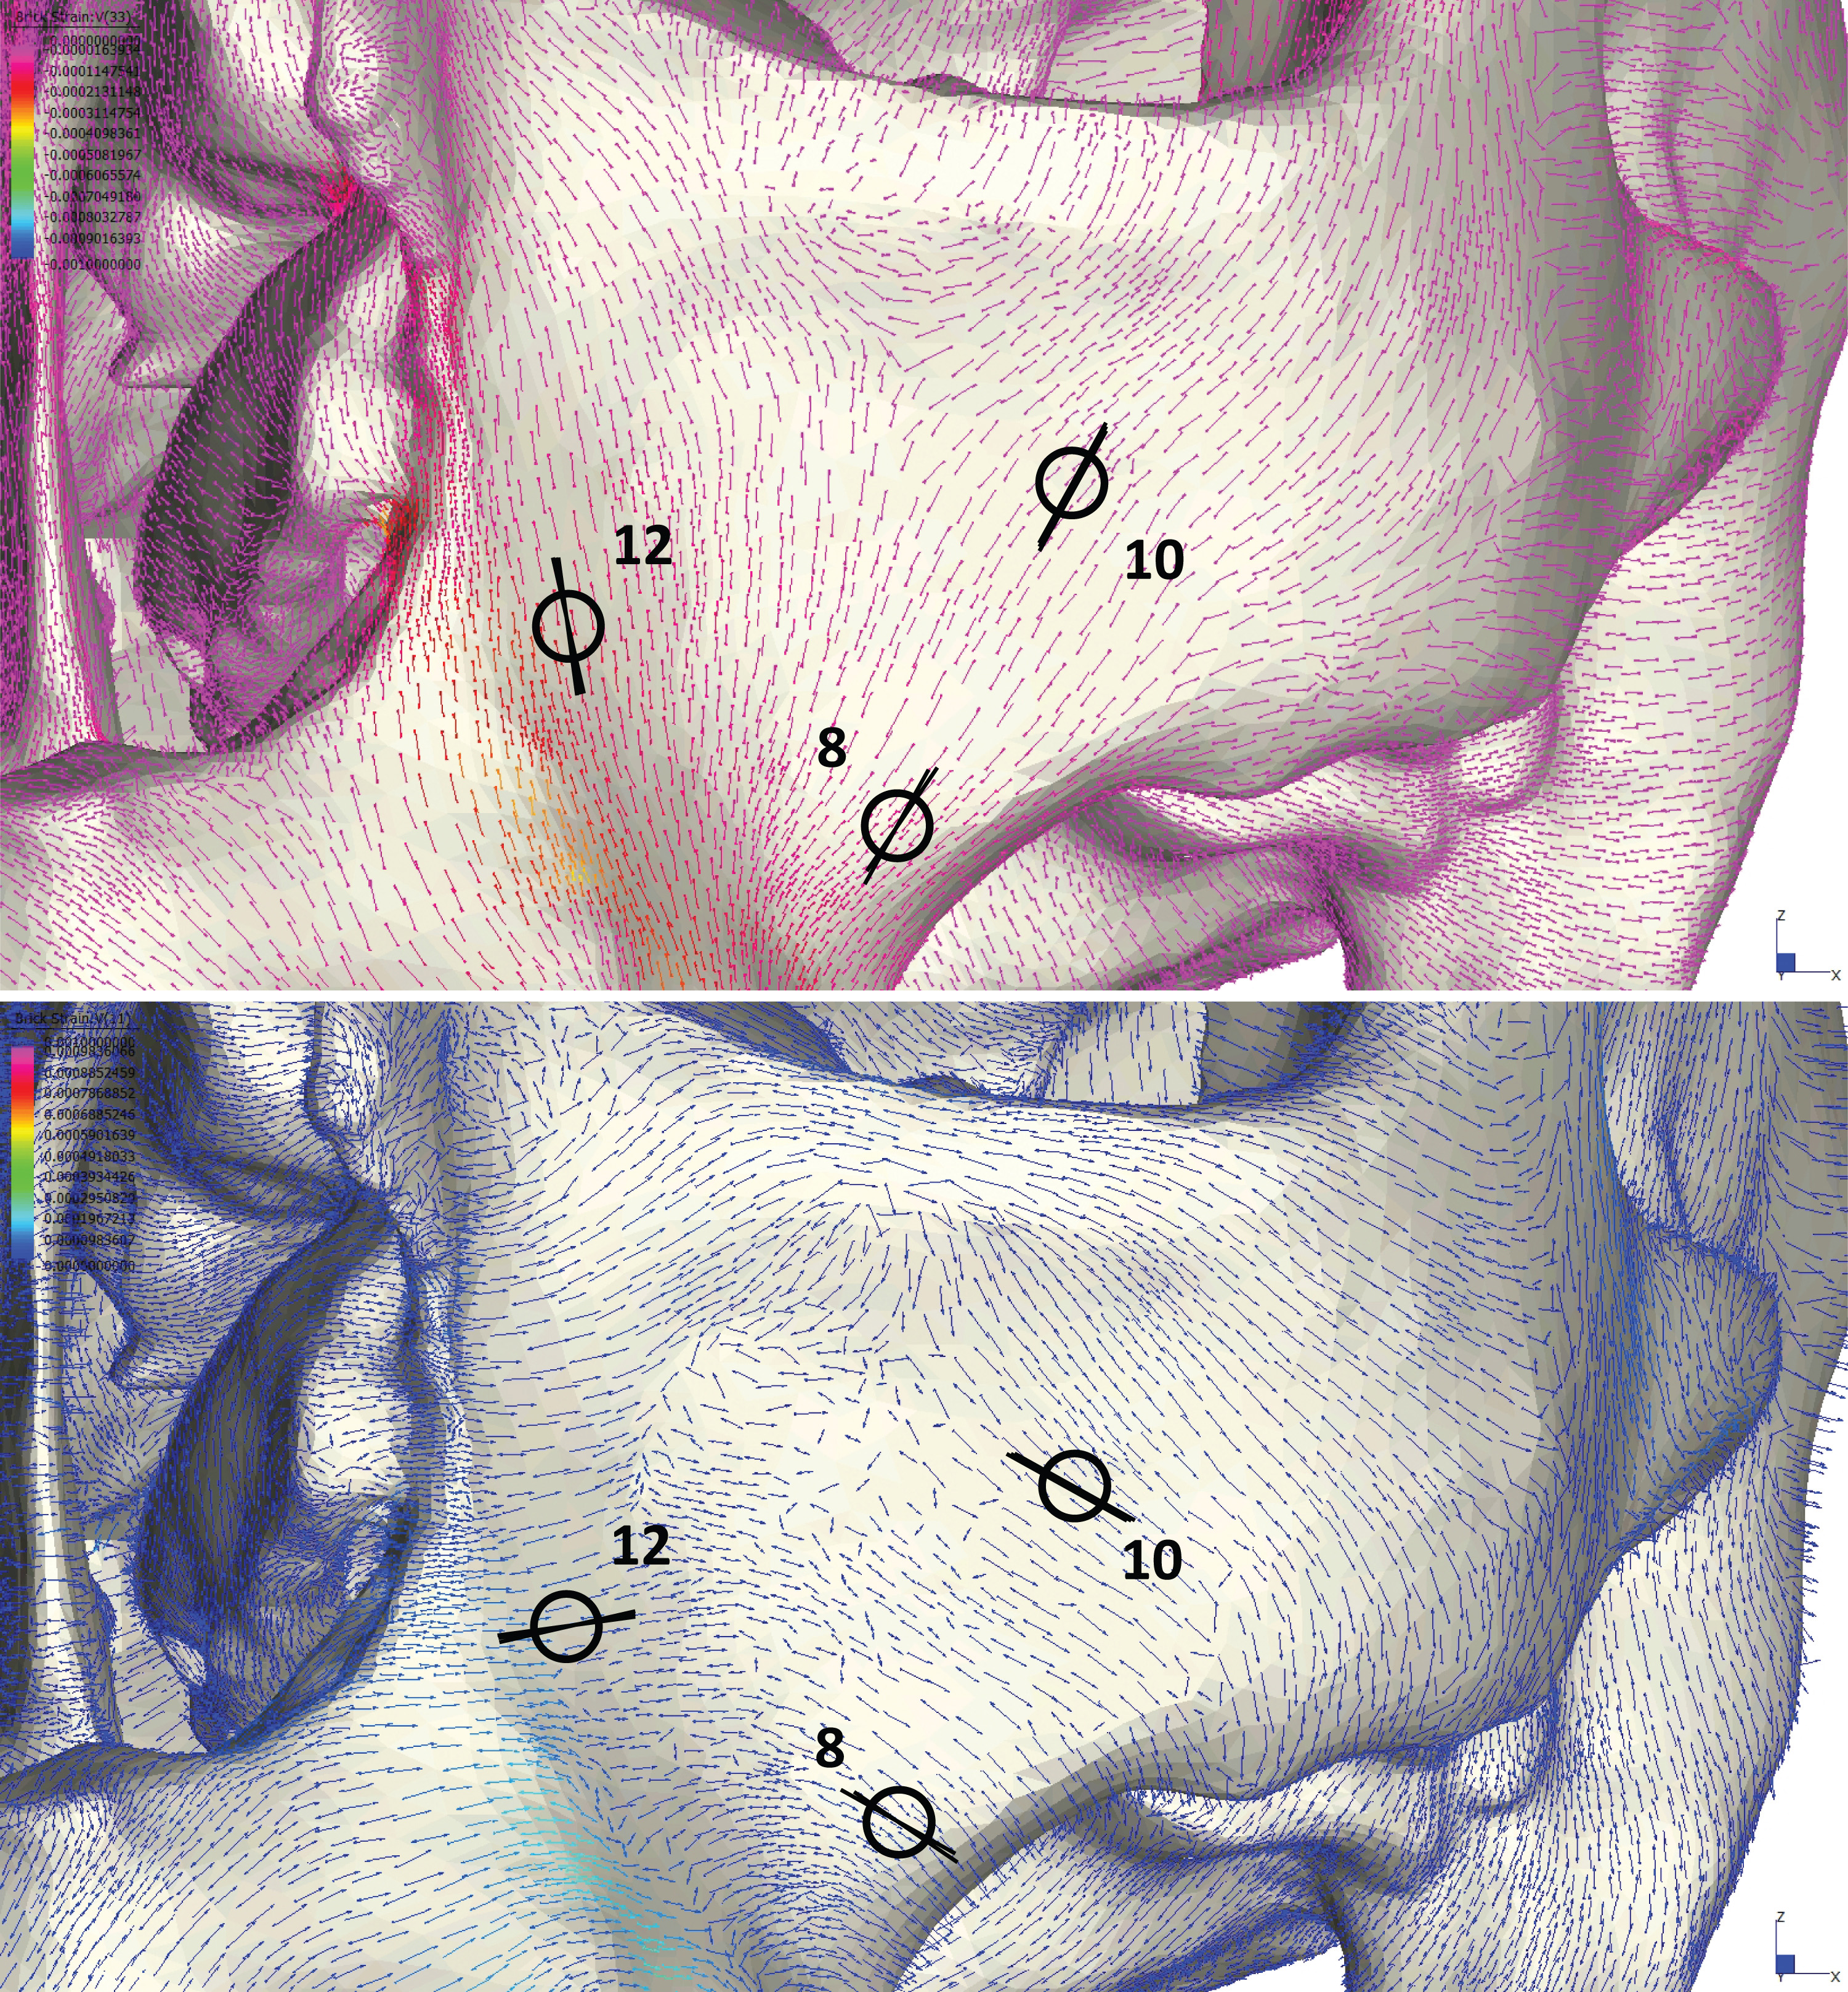
Principal strain orientations recorded during validation analysis: Sites 8, 10, and 12 strain
Blue lines represent the orientation of maximum principal strain (tension). Purple lines represent the orientation of minimum principal strain (compression), which is 90° to orientation of maximum principal strain. Black circles represent location of strain gages at the working-side zygomatic root (site 8), working-side infraorbital (site 10), and working-side nasal margin (site 12) during in vitro bone strain analysis. Three lines through each gage correspond to the orientation of principal strains during the in vitro loading analysis which were recorded in degrees relative to the A element of the gage.
Principal strain orientations recorded during validation analysis: Sites 9 and 11
Blue lines represent the orientation of maximum principal strain (tension). Purple lines represent the orientation of minimum principal strain (compression), which is 90° to orientation of maximum principal strain. Black circles represent location of strain gages at the balancing-side zygomatic root (site 9) and balancing-side infraorbital (site 11) during in vitro bone strain analysis. Three lines through each gage correspond to the orientation of principal strains during the in vitro loading analysis which were recorded in degrees relative to the A element of the gage.
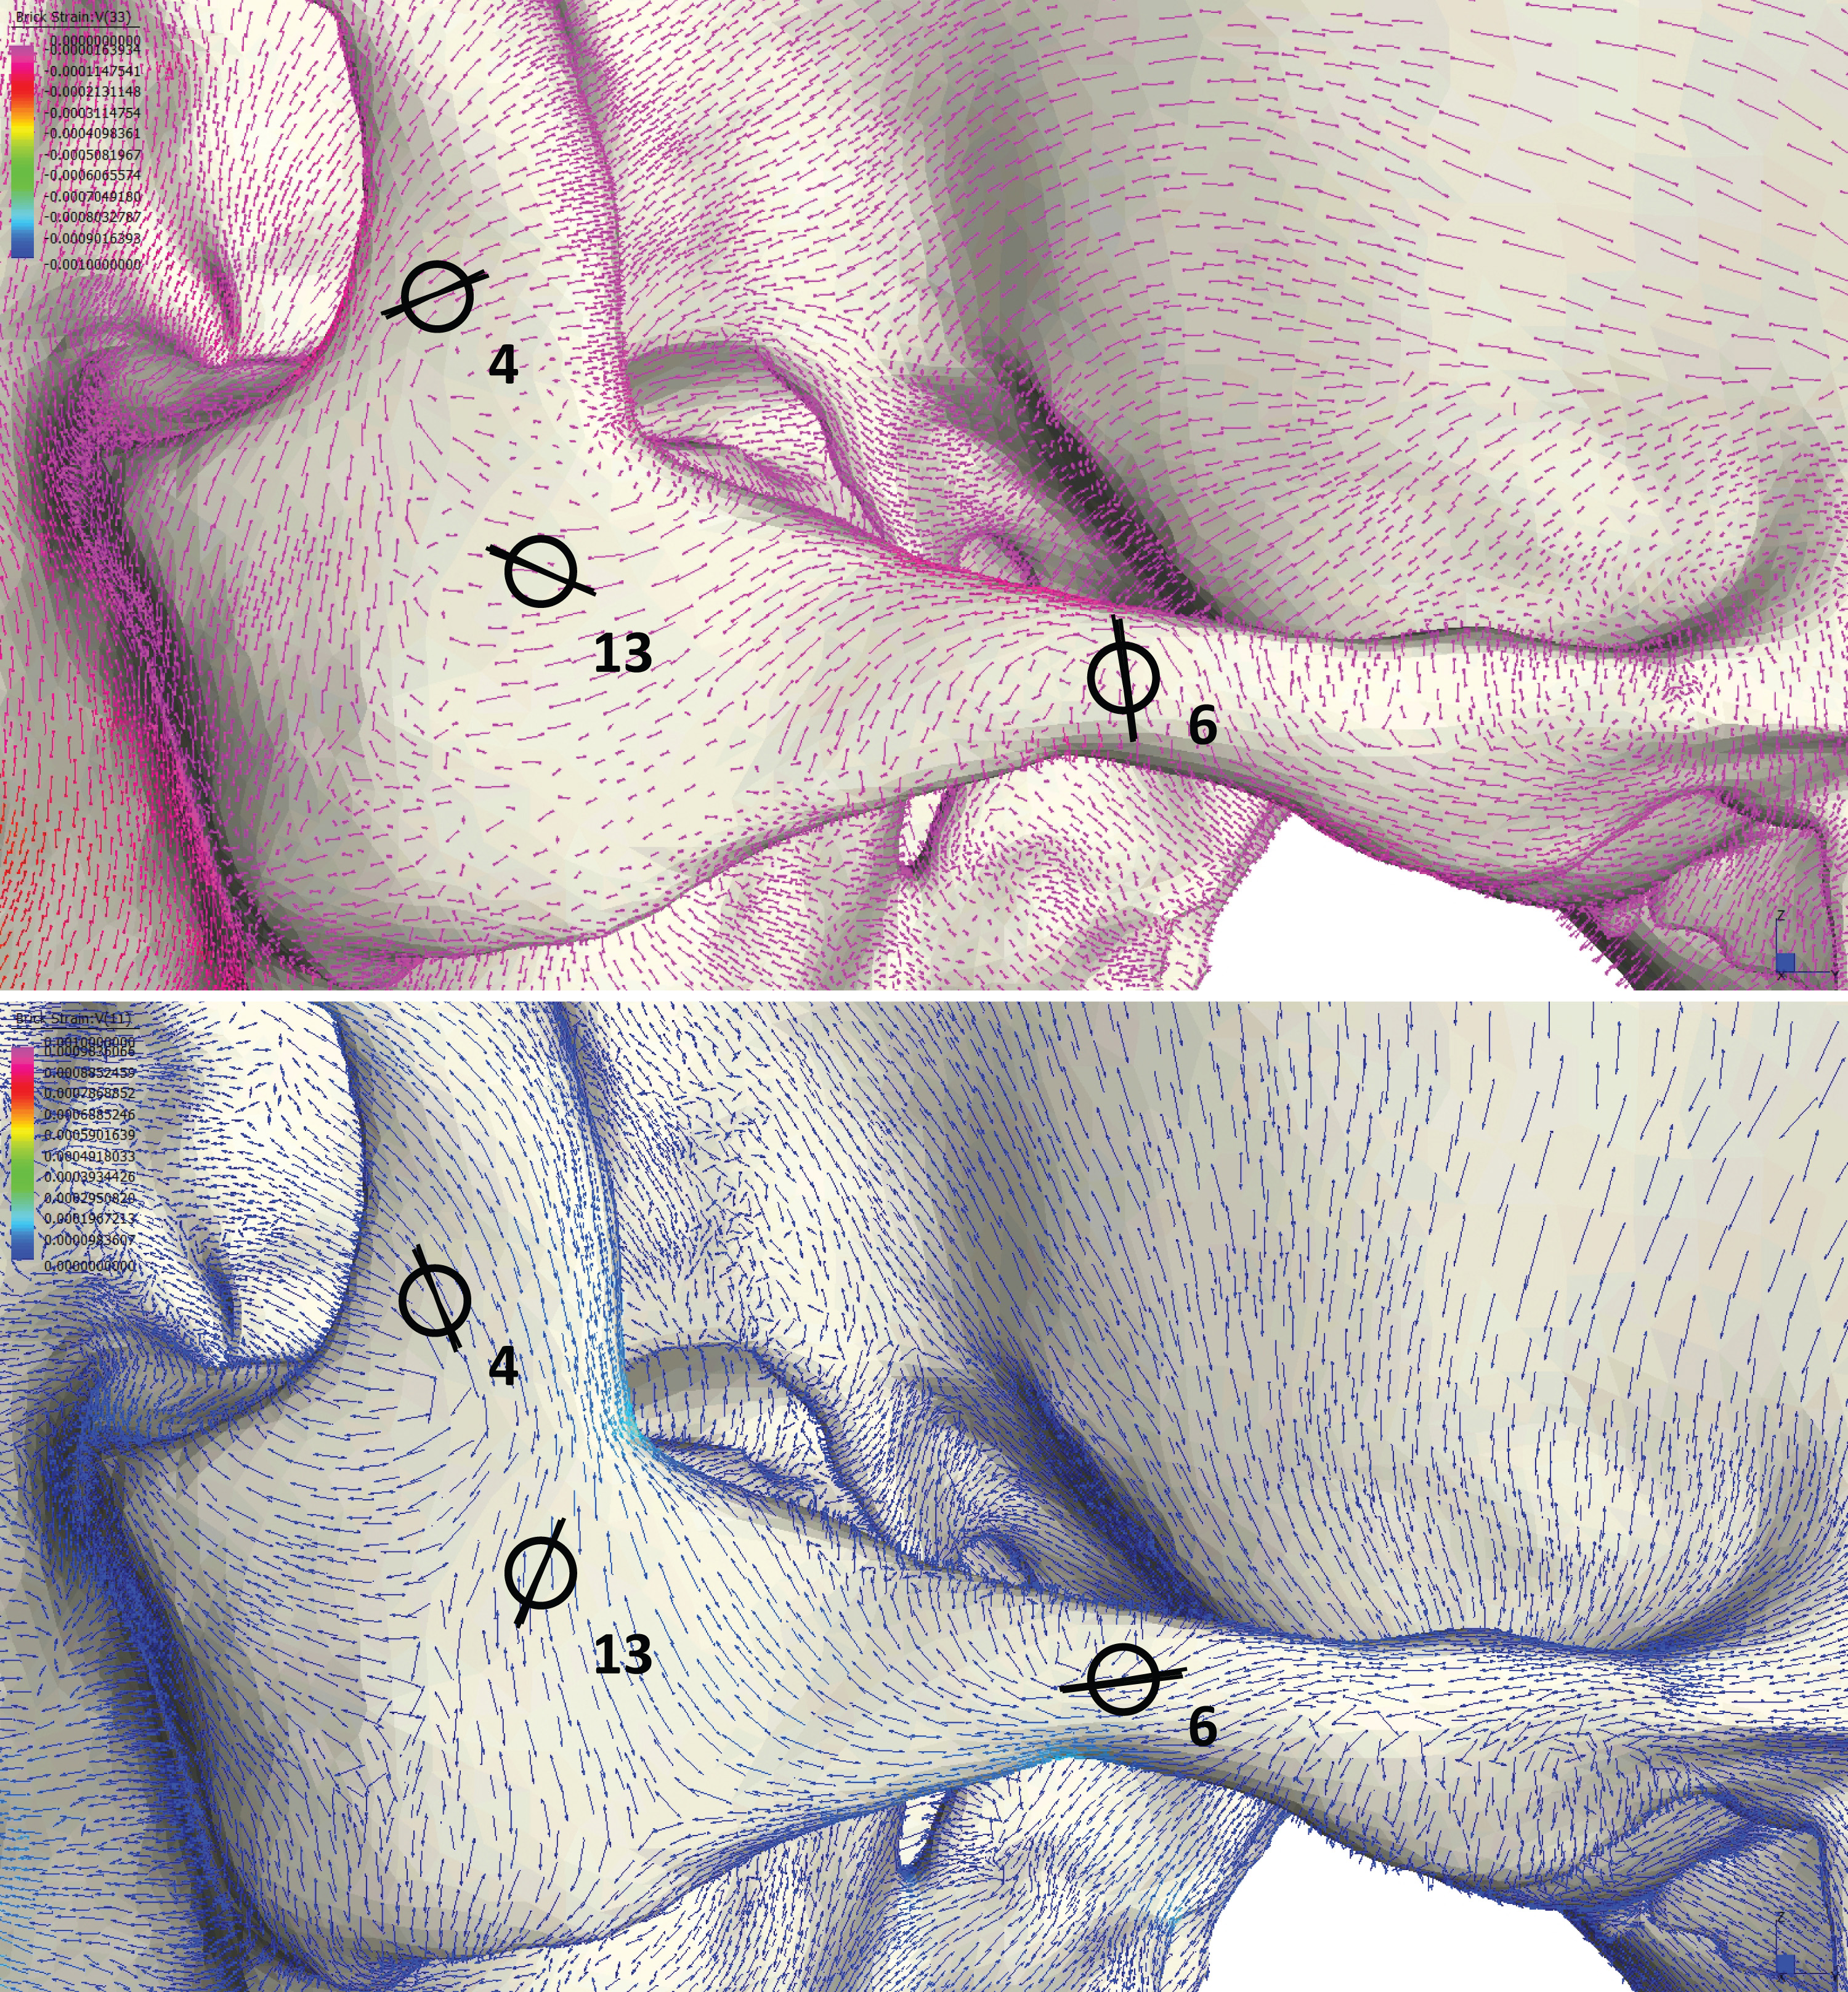
Principal strain orientations recorded during validation analysis: Sites 4, 6, and 13
Blue lines represent the orientation of maximum principal strain (tension). Purple lines represent the orientation of minimum principal strain (compression), which is 90° to orientation of maximum principal strain. Black circles represent location of strain gages at the working-side postorbital bar (site 4), working-side zygomatic arch (site 6), and the working-side zygomatic body (site 13) during in vitro bone strain analysis. Three lines through each gage correspond to the orientation of principal strains during the in vitro loading analysis which were recorded in degrees relative to the A element of the gage.
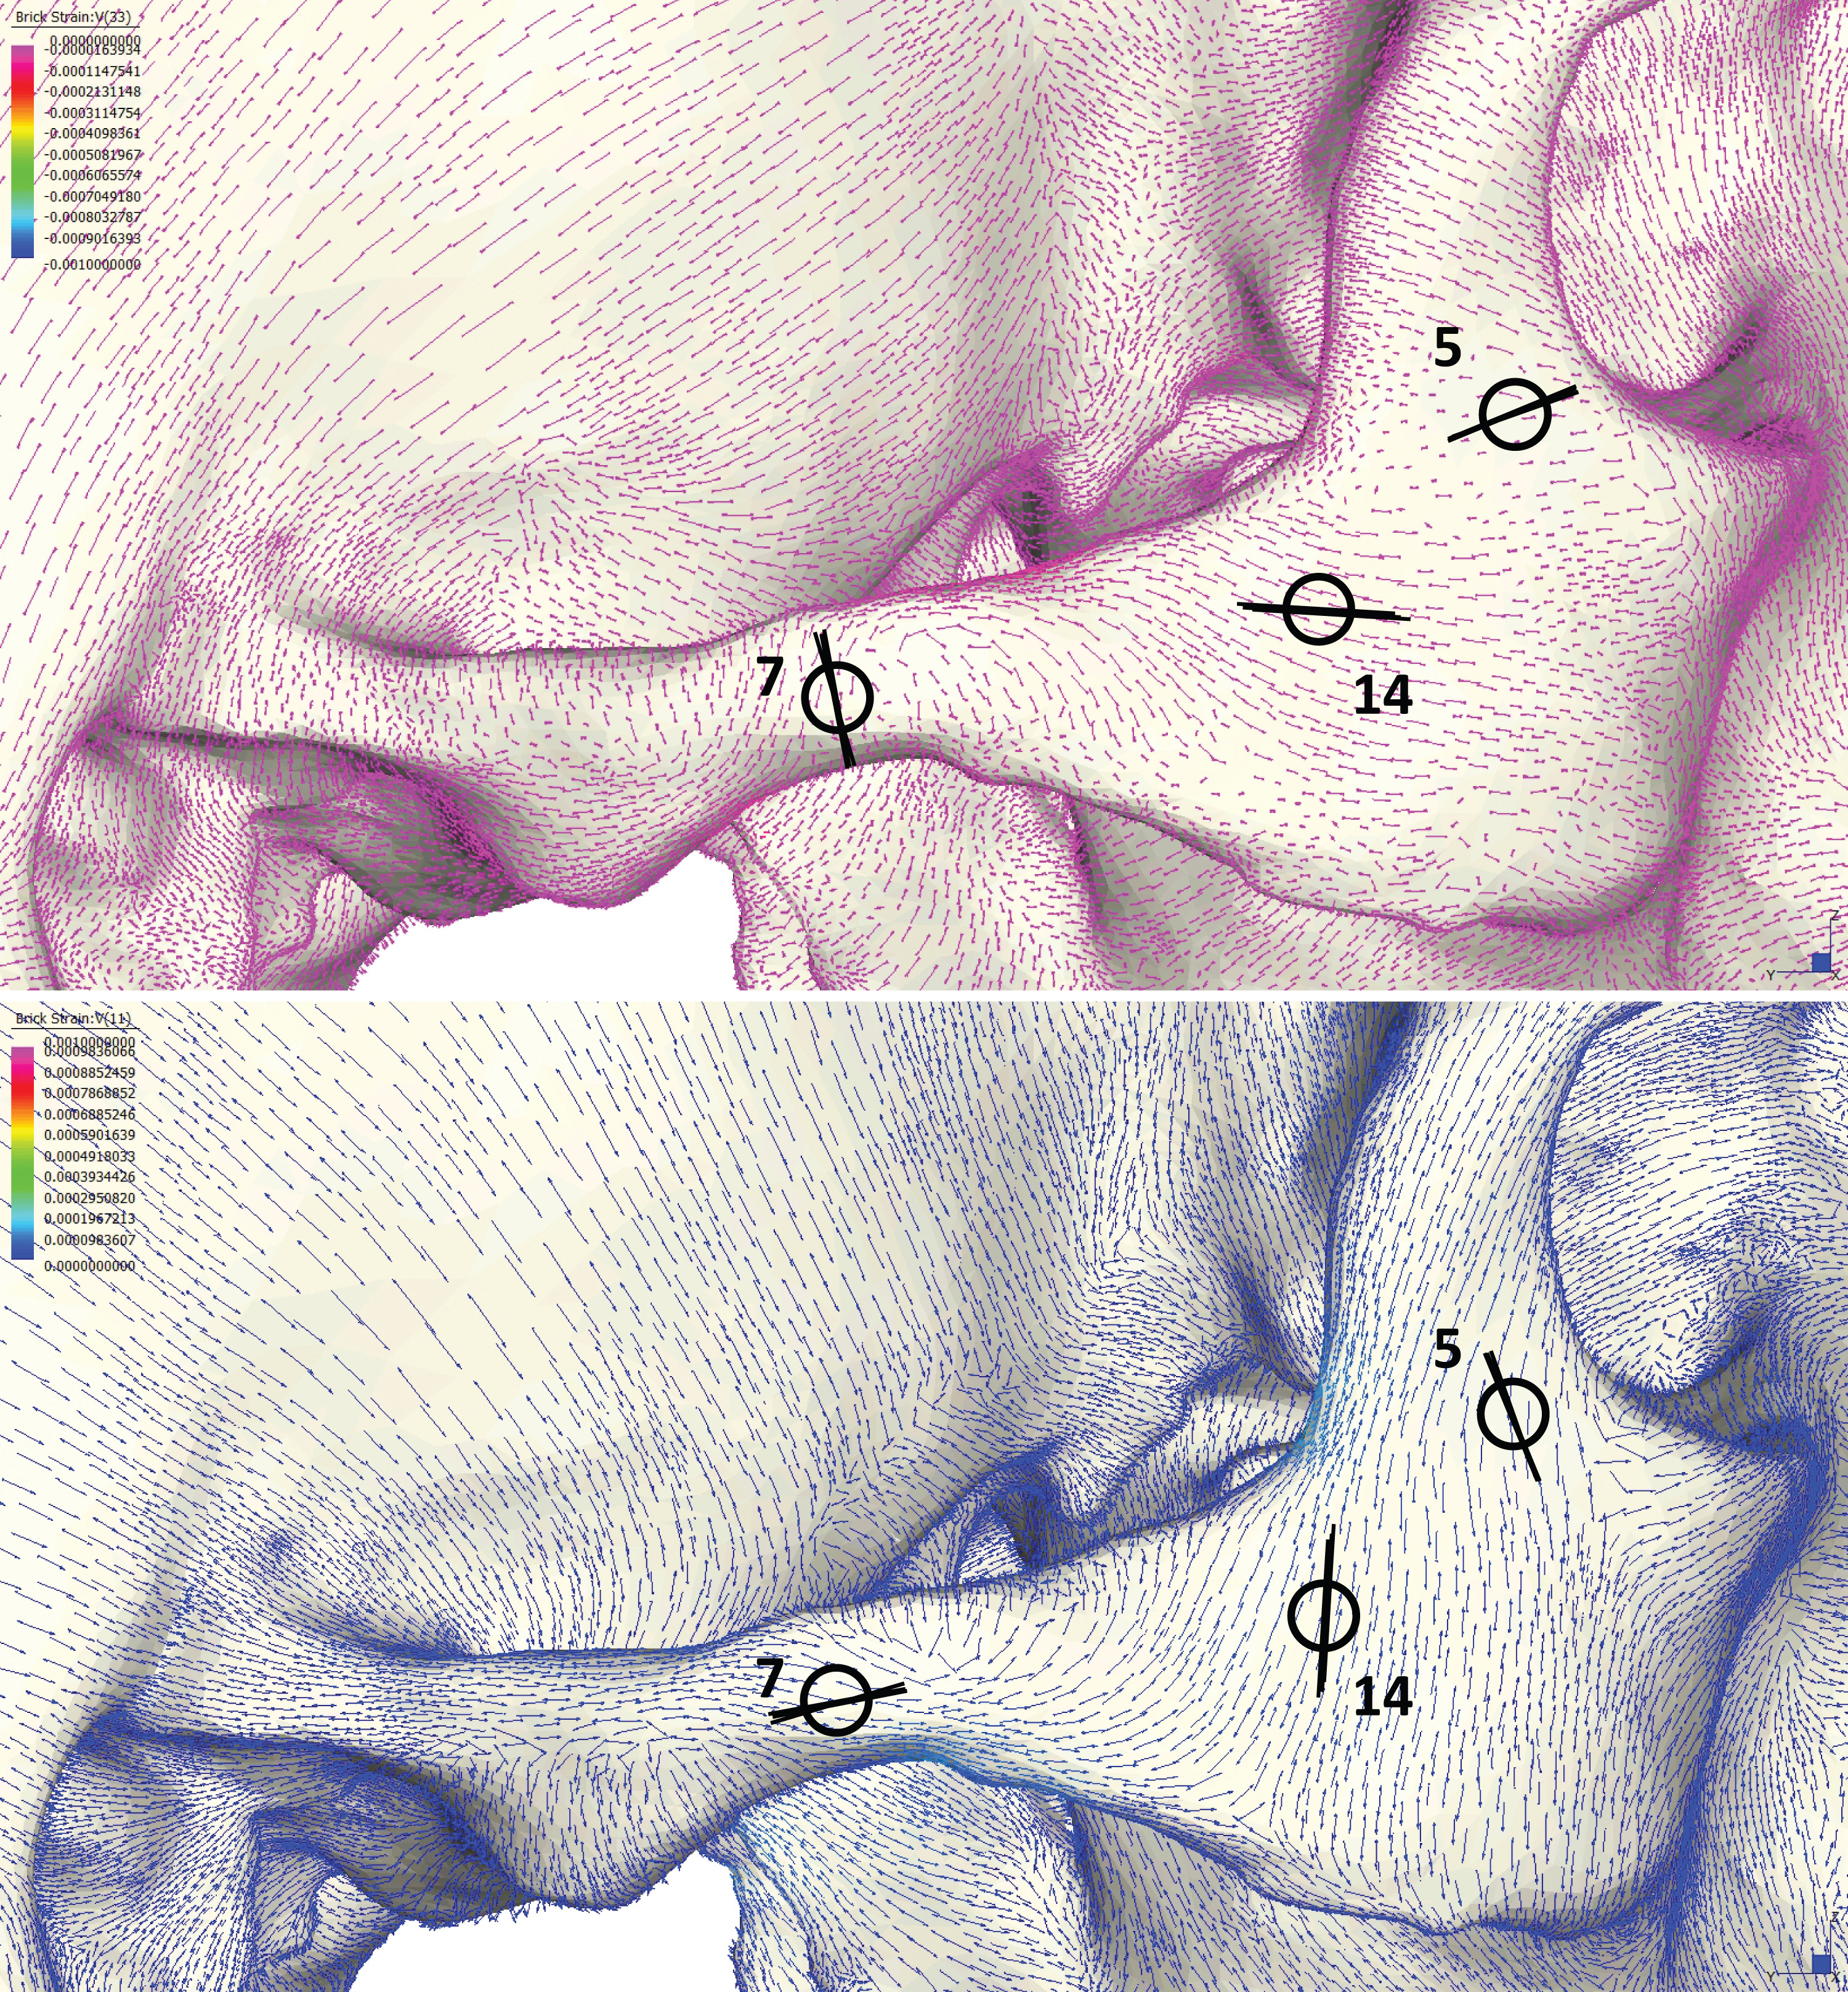
Principal strain orientations recorded during validation analysis: Sites 5, 7, and 14
Blue lines represent the orientation of maximum principal strain (tension). Purple lines represent the orientation of minimum principal strain (compression), which is 90° to orientation of maximum principal strain. Black circles represent location of strain gages at the balancing-side postorbital bar (site 5), balancing-side zygomatic arch (site 7), and balancing-side zygomatic body (site 14) during in vitro bone strain analysis. Three lines through each gage correspond to the orientation of principal strains during the in vitro loading analysis which were recorded in degrees relative to the A element of the gage.
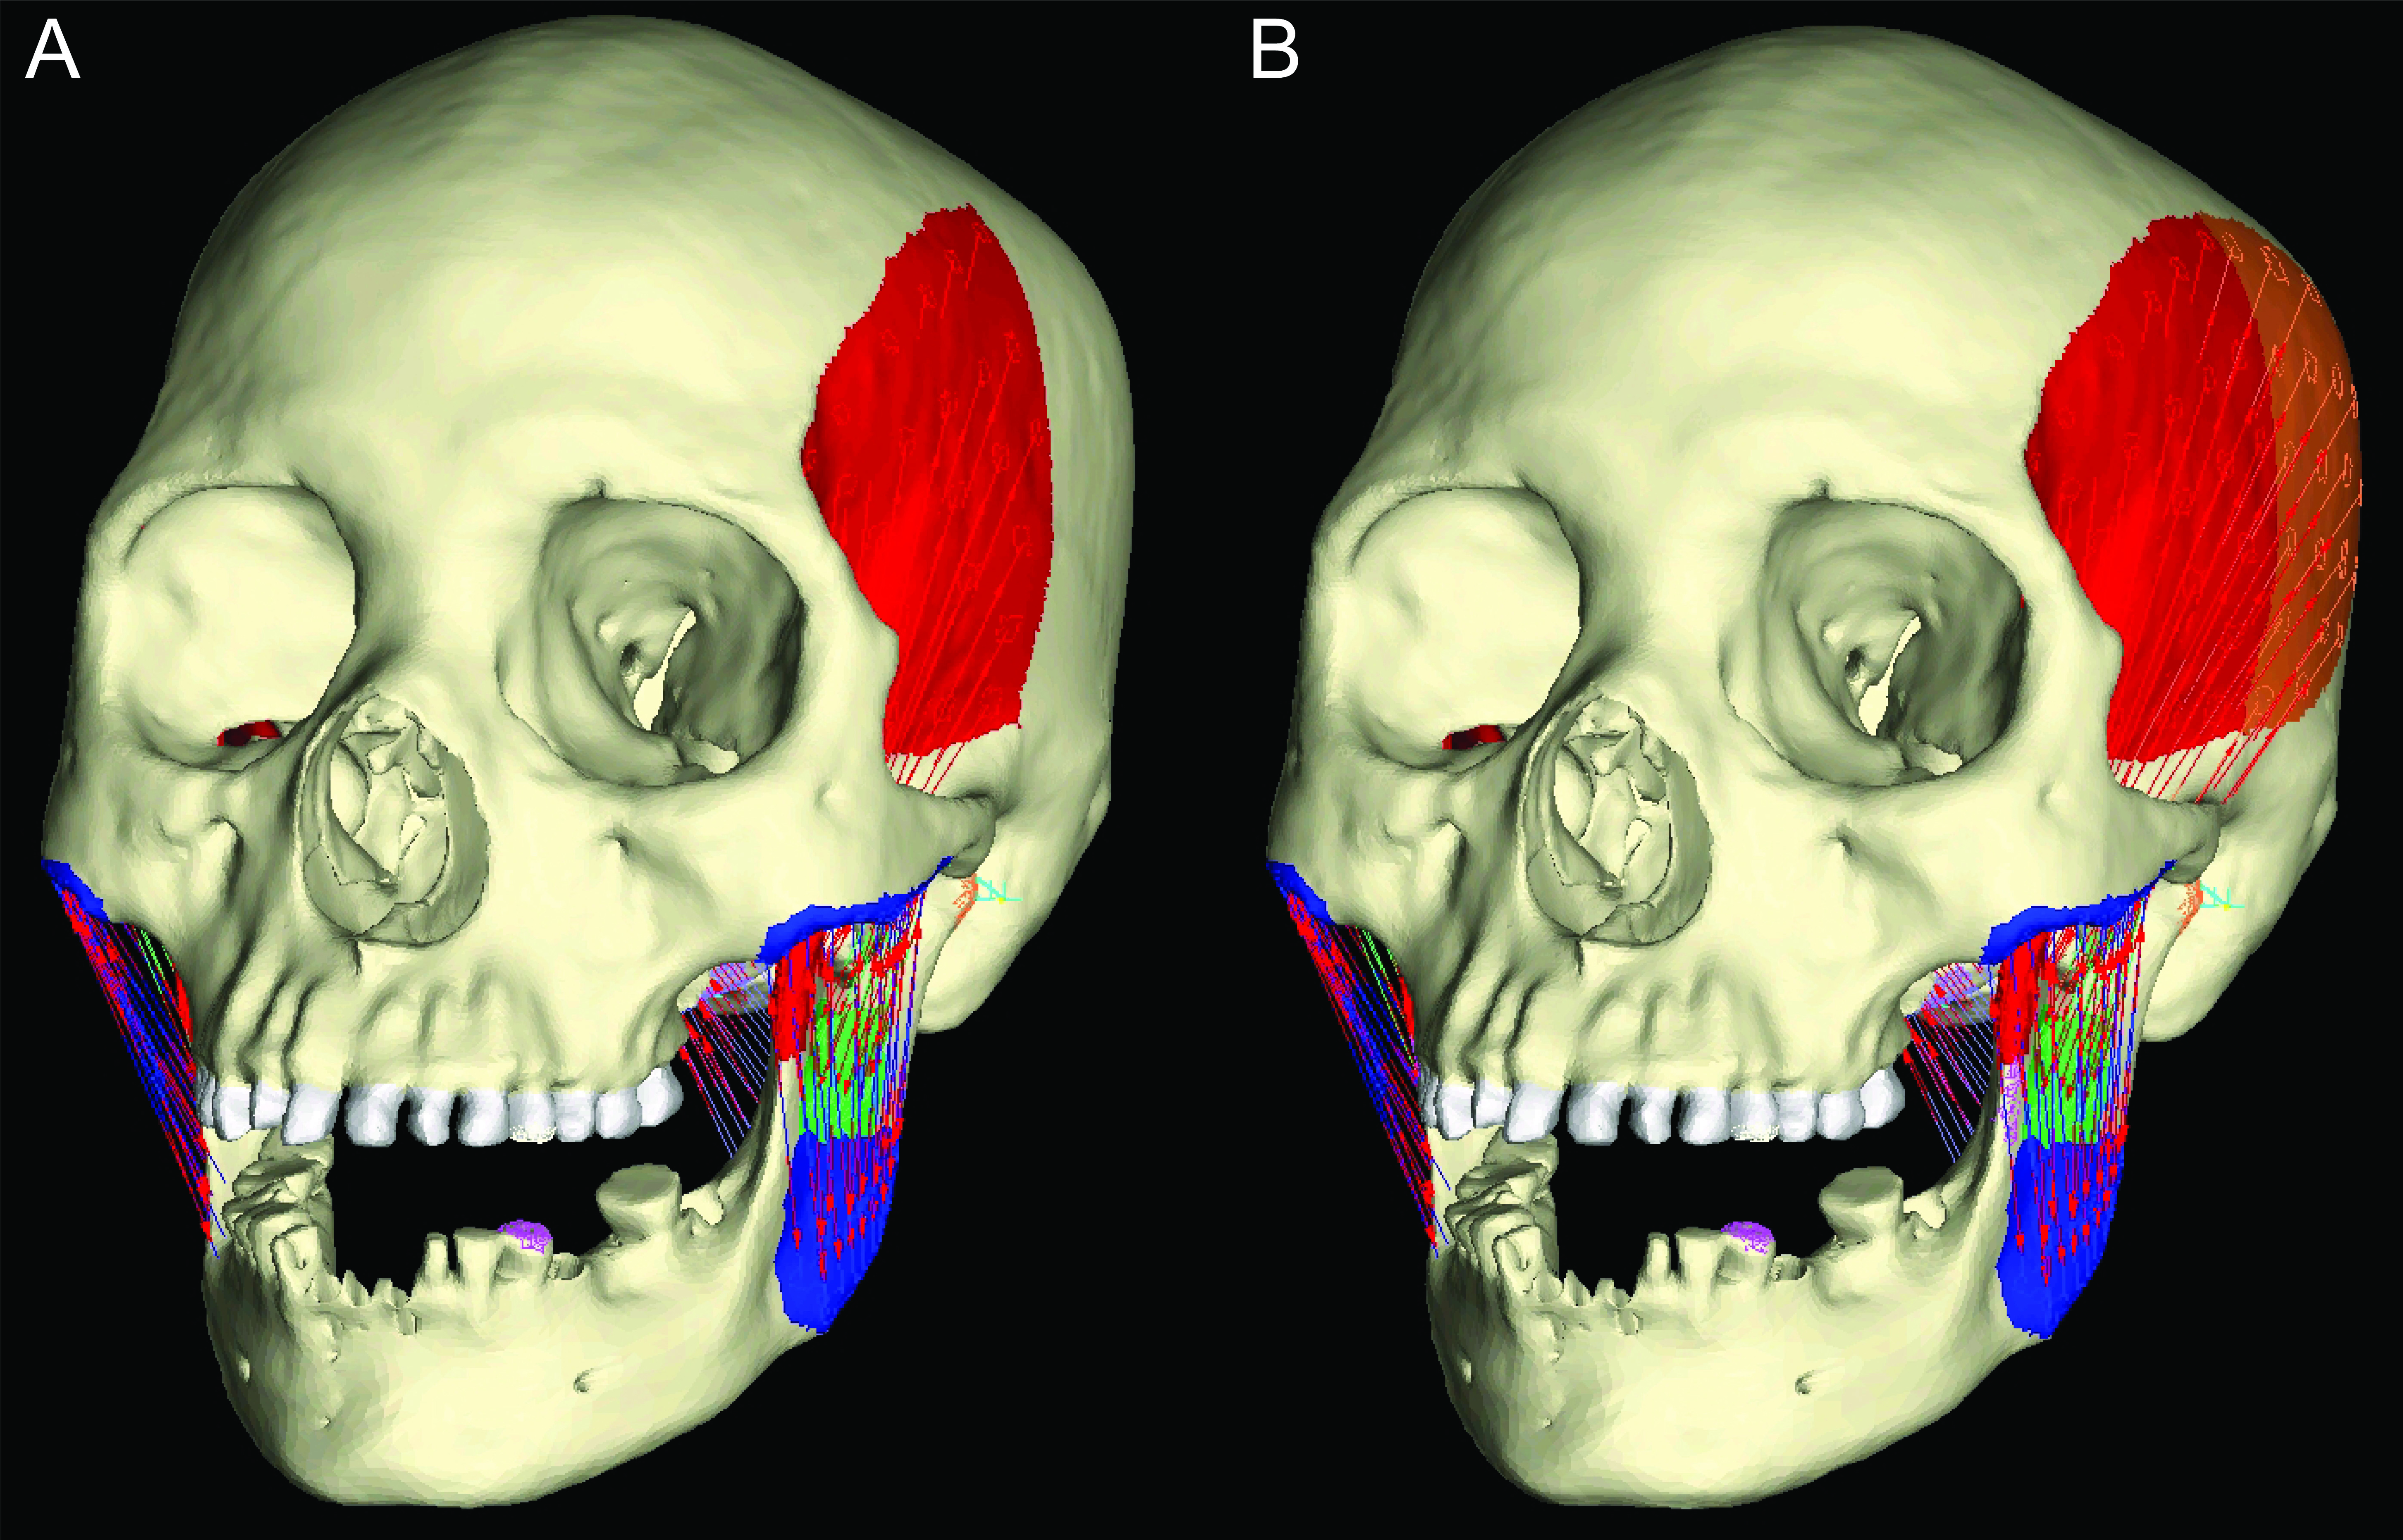
The GRGL finite element model showing constraints and muscle loads applied following Wroe et al. (2010)
We compared two variants of this “beamed” model to our original “boneloaded” model, one that only included muscle beams for the anterior temporalis, superficial masseter, deep masseter, and medial pterygoid muscles (A), and a second that also included that posterior temporalis (B).
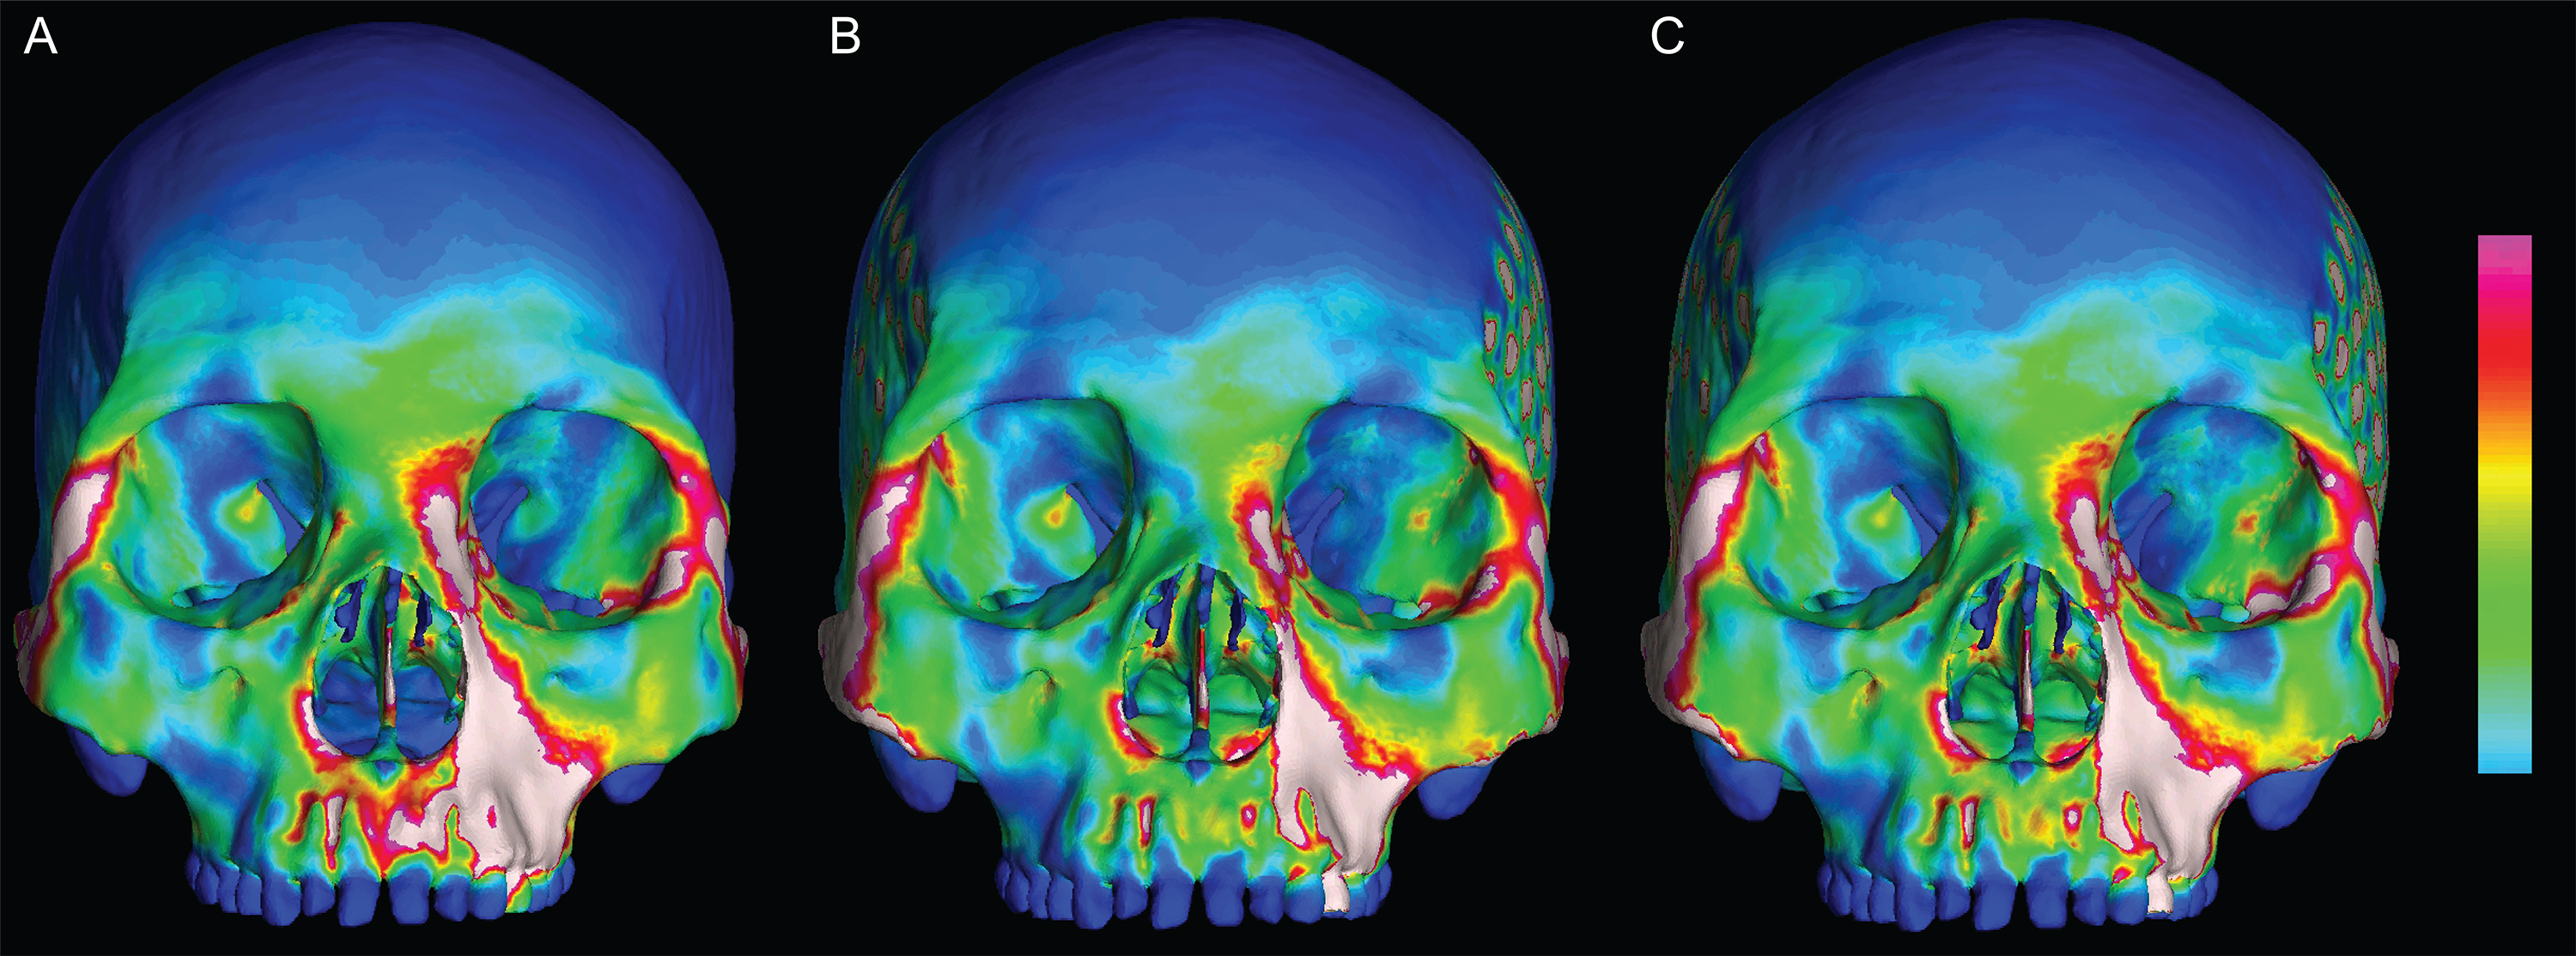
Results of sensitivity analysis: color maps of von Mises strain magnitudes
Panels show strain distributions during premolar (P3) biting in the (A) original “boneloaded” ALL-HUM model, (B) “beamed” model lacking a posterior temporalis, and (C) “beamed” model including a posterior temporalis. Scales are set to range from 0 – 300 με White regions exceed scale.
Results of sensitivity analysis: line plot of von Mises strain
Plot shows the microstrain generated during simulated premolar (P3) biting, recorded from 14 identical brick elements across the craniofacial skeletons of our original “boneloaded” model, a “beamed” variant with muscle forces and constraints modeled following Wroe et al. (2010), and a third model analyzed following Wroe et al. (2010) but with the addition of the posterior temporalis (PT) muscle.