
|
Open Access Repositorium für Messinstrumente |
Luxembourg Workplace Mobbing Scale (LWMS)
- Messinstrument
- Dokumentation
- Zitieren
- Nutzungsbedingungen
- CC-BY-NC-SA-4.0
- Zur Nutzung für andere Zwecke
kontaktieren Sie die Autor*innen
The Luxembourg Workplace Mobbing Scale (LWMS) was developed in the context of the Quality of Work study (Steffgen et al., 2015; 2020) as an instrument to assess workplace mobbing exposure in the general working population. The LWMS was originally also translated into Portuguese. However, this language version could not be validated due to the fact that only few respondents used it. Since 2017 the LWMS is also regularly used in English but is also only used by a few respondents that hinder a validation. Thus, these language versions of the LWMS are not empirically evaluated yet and the findings reported do not pertain to these versions. However, other researchers are cordially invited to test and validate these versions of the LWMS. To make scale content accessible to non-German speakers as well, the authors provide the English version of the instruction and items in the documentation. The Portuguese and the English language version are documented in the answer sheet.
Instruction
The instruction is: "How often from your point of view do difficult situations arise with your colleagues or your superior?"; German Version: „Wie häufig sind aus Ihrer Sicht schwierige Situationen mit Kollegen und Kolleginnen oder Vorgesetzten?”; French Version: „De votre point de vue, À quelle fréquence des situations difficiles avec des collègues ou un supérieur surviennent-elles?”; Luxembourgish Version: „Wéi oft kommen aus Ärer Siicht schwiereg Situatiounen mat Kollegen a Kolleginnen oder Ärem Viergesetzten vir?”
Items
Table 1
Items of the LWMS
|
No. |
Item |
|
|
English |
|
1 |
How often is your work criticised by your colleagues or by your superior? |
|
2 |
How often are you ignored at work by your colleagues or your superior? |
|
3 |
How often are you assigned meaningless tasks by your superior? |
|
4 |
How often are you ridiculed in front of others by your superior or by your colleagues? |
|
5 |
How often are you in conflict with your colleagues or superior? |
|
|
German |
|
1 |
Wie häufig wird Ihre Arbeit durch Ihre Kollegen oder Ihren Vorgesetzten kritisiert? |
|
2 |
Wie häufig werden Sie auf der Arbeit von Ihren Kollegen oder Ihrem Vorgesetzten ignoriert? |
|
3 |
Wie häufig kriegen Sie von Ihrem Vorgesetzten sinnlose Aufgaben zugewiesen? |
|
4 |
Wie häufig werden Sie von Ihrem Vorgesetzten oder von Ihren Kollegen vor anderen lächerlich gemacht? |
|
5 |
Wie häufig haben Sie Konflikte mit Ihren Kollegen oder Vorgesetzten? |
|
|
French |
|
1 |
À quelle fréquence vos collègues ou votre supérieur critiquent-ils votre travail? |
|
2 |
À quelle fréquence vos collègues ou votre supérieur vous ignorent-ils au travail? |
|
3 |
À quelle fréquence votre supérieur vous assigne-t-il des missions dénuées de sens? |
|
4 |
À quelle fréquence votre supérieur ou vos collègues vous ridiculisent-ils devant d'autres personnes? |
|
5 |
À quelle fréquence êtes-vous en conflit avec vos collègues ou votre supérieur? |
|
|
Luxembourgish |
|
1 |
Wéi oft gëtt Är Aarbecht vun Äre Kollegen oder Ärem Viergesetzten kritiséiert? |
|
2 |
Wéi oft gitt Dir op der Aarbecht vun Äre Kollegen oder Ärem Viergesetzten ignoréiert? |
|
3 |
Wéi oft kritt Dir vun Ärem Viergesetzten Aufgaben zougewisen, déi kee Sënn maachen? |
|
4 |
Wéi oft gitt Dir vun Ärem Viergesetzten oder vun Äre Kollegen virun aneren lächerlech gemaach? |
|
5 |
Wéi oft hutt Dir Konflikter mat Äre Kollegen oder Ärem Viergesetzten? |
Response specifications
The response categories are 1 (= Never), 2 (= Rarely), 3 (= Sometimes), 4 (= Often), 5 (= Almost always). German version: 1 (= Niemals), 2 (= Selten), 3 (= Manchmal), 4 (= Oft) and 5 (= Fast immer). French version: 1 (= Jamais), 2 (= Rarement), 3 (= Parfois), 4 (= Souvent) and 5 (= Presque tout le temps). Luxembourgish version: 1 (= Ni), 2 (= Seelen), 3 (= Munchmol), 4 (= Oft) and 5 (= Bal ëmmer).
Scoring
All items are positively keyed. Values for the LWMS are obtained by either calculating the unweighted mean for the five items or by using factor analytical methods. Higher scores reflecting a higher level of workplace mobbing exposure. Full information maximum likelihood (FIML) or multiple imputation might be used to account for missing data.
Application field
Workplace mobbing is a serious phenomenon that has various negative consequences for the targeted employees' health (e.g., depression, burnout), attitudes (e.g., lower job commitment), and work-related behavior (e.g., absence; Bowling & Beehr, 2006; Nielsen & Einarsen, 2012). A critical task in workplace mobbing research concerns the estimation of prevalence rates for differential groups and the identification of possible risk groups (e.g., Mikkelsen, & Einarsen, 2001; Ortega et al., 2009). Due to its briefness while at the same time being robust against language, age, gender, and occupational group factors and exhibiting meaningful criterion validity, the LWMS is particularly attractive for large-scale surveys as well as for single-case assessment. No more than 1 or 2 minutes (authors' estimate) are needed to complete the LWMS. The LWMS has been developed to assess workplace mobbing exposure in the general working population. It has been validated with data collected via computer-assisted telephone interviewing. However, other survey modes are also suitable to assess the LWMS. Percentile norms of the LWMS are reported in Table 7.
Workplace mobbing can include personal attacks, social ostracism, hostile interactions or communications, and physical violence or threats, respectively (Lutgen-Sandvik, 2006). Our use of the term workplace mobbing will refer to the following situation: An employee experiences workplace mobbing, when (s)he is being subjected to a series of negative and/or hostile acts or other behaviors that are experienced as annoying and/or oppressive at the workplace (Agervold & Mikkelsen, 2004). This definition includes workplace abuse from individual to individual as well as from group to individual. Workplace mobbing is a serious phenomenon that is costly to organizations and has various negative consequences for the targeted employees (see the various systematic reviews and meta-analyses in Gupta et al., 2020, Table 1). It can be hypothesized that prolonged exposure to workplace mobbing threatens fundamental psychological needs (e.g., sense of belonging; Aquino & Thau, 2009). The victim is at the receiving end of negative social behavior that aims to stigmatize, to repress, and to belittle accomplishments (e.g., being ignored, ridiculed, criticized). In consequence, this fosters feelings of isolation, ostracism, oppression, incompetence, and self-doubt (e.g., Sischka et al., 2021) in the mobbing victim. Self-determination theory states that such violations of basic psychological needs influence employee's functioning and well-being (Deci & Ryan, 2008). Prolonged exposure to mobbing experiences at the workplace has been shown to decrease the overall job satisfaction (Nielsen & Einarsen, 2012) as well as life satisfaction (Bowling & Beehr, 2006). Moreover, it does not just have negative consequences for employees' health and well-being, but also for the company. Mobbing victims tend to have more sickness absence due to their mobbing-related health issues (Nielsen & Einarsen, 2012). Similarly, the strain, fatigue, and reduced satisfaction with work resulting from prolonged exposure to mobbing can lead to reduced commitment as well as increased intention to leave or actual turnover (Hershcovis & Barling, 2010).
Item generation and selection
In a first step, the workplace mobbing literature was screened for relevant workplace mobbing behaviors. During this literature review, priority was given to those mobbing behaviors that are typically found to be particularly detrimental. Accordingly, studies found that criticism and devaluation concerning an employee's work have the worst effect on psychological health, while ignoring an employee and assigning pointless tasks to someone have the worst effects on self-esteem (e.g., Vartia, 2001, 2003). Thus, four items were developed based on the Leymann Inventory of Psychological Terror (LIPT; Leymann, 1996a, 1996b) that covers these forms of mobbing behavior. The authors chose one item out of three of the five categories of mobbing acts listed by Leymann (1996b) (Items "criticized", "ridiculed", "absurd duties"). Another item was self-formulated that covers the isolation category of mobbing listed by Leymann (Item "ignored"). The last item was developed because of its high sensitivity (Item "conflicts"). In light of the recent debate on the usefulness of frequency and duration of mobbing behaviors (Agervold, 2007), it was also decided against including time limitations in the item set (such as "in the last 12 months"). The LWMS was validated in three language versions: German, French, Luxembourgish. The LWMS was first compiled and developed in English. Subsequently, the German, French, Luxembourgish (and Portuguese) versions were derived from the English version. For the translation of the questionnaire two translators for each language version were used. To check for correct translation, the questionnaire was back-translated using two other translators, subsequently. The translators were academic researcher with high linguistic competence.
Samples
The LWMS was evaluated as part of a research project on the quality of work and its effects on health and well-being in Luxembourg (Steffgen et al., 2015; 2020). This project was implemented by the University of Luxembourg in collaboration with the Luxembourg Chamber of Labor as an assessment over yearly waves since 2014. It entails Computer-Assisted Telephone Interviews (CATI) with about 1,500 employees from Luxembourg's working population. The first study (Steffgen et al., 2019) used the 2014 wave, the second study (Sischka et al., 2020) the 2016 wave. A dual-frame approach of landline and mobile phone numbers (Schneiderat & Schlinzig, 2012) – representing a simple random sampling design – was used to contact employees working in Luxembourg (i.e., Luxembourgish residents and commuters from France, Belgium, and Germany). Respondents were not incentivized for their study participation. As Luxembourg is a multilingual country, the questionnaire was developed in German, French, Luxembourgish, Portuguese (and since 2017 in English). Respondents could choose their preferred language version.
Sample 1
The initial sample in the first study (Steffgen et al., 2019) consisted of 1,532 employees. Due to incomplete data 1.7% (n = 26) of participants had to be excluded from the analyses. Only 0.4% (n = 6) of participants used the Portuguese version, thus it was excluded as well. Therefore, the effective sample consisted of 1,500 employees (47.3% females, n = 708). In the effective sample, 13.8% (n = 207) answered the Luxembourgish version, 47.6% (n = 714) the French, and 38.6% (n = 579) the German questionnaire. Included were Luxembourg residents (59.7%, n = 895) and commuters from Belgium (9.9%, n = 148), France (20.1%, n = 302), and Germany (10.3%; n = 155), who received wages for work with at least 10 hr of work per week. People doing unpaid voluntary work or internships were excluded from the sample. The sample is representative in terms of workers' state of residency in Luxembourg (Inspection générale de la sécurité social Luxembourg, 2014; χ2(3) = 5.631, p = .131). The interviewees' age ranged from 17 to 64 years (M = 44.0, SD = 9.4). The majority of participants had an apprenticeship (34.3%, n = 511) or an academic degree (37.5%, n = 558). Most participants worked in commercial or business-related service professions (34.9%, n = 495) followed by production-oriented professions (29.5%, n = 418), personal service professions (25.2%, n = 357), other services (7.5%, n = 107), and IT- and natural science services (3.0%, n = 42).
Sample 2
The initial sample in the second study (Sischka et al., 2020) consisted of 1,506 employees.[1] Due to incomplete data 1.7% (n = 26) of participants had to be excluded from the analyses. Therefore, the effective sample consisted of 1,480 employees (45.7% females, n = 676). Included were Luxembourg residents (59.9%, n = 886) and commuters from Belgium (10.3%, n = 152), France (20.3%, n = 301), and Germany (9.5%; n = 141), who received wages for working at least 10 hrs/week. The interviewees' age ranged from 16 to 66 years (M = 45.7, SD = 8.9). The majority of participants had an apprenticeship (33.4%, n = 495) or an academic degree (37.9%, n = 561). Employees' occupations were classified according to the International Standard Classification of Occupations (ISCO-08; International Labour Organization, 2012). Most participants worked in a profession (26.7%, n = 395) followed by technicians and associate professionals (25.1%, n = 371), clerical support workers (12.8%, n = 190), service and sales workers (10.8%, n = 160), craft and related trades workers (9.5%, n = 141), managers (5.3%, n = 78), plant and machine operators, and assemblers (4.5%, n = 66), elementary occupations (3.6%, n = 54), and others (1.7%, n = 25).
Item analyses
The factor structure was tested with a confirmatory factor analysis (CFA; Steffgen et al., 2019). A unidimensional congeneric measurement model was applied. The fixed-factor method was used for scale setting (Little, 2013). Due to high univariate skewness (0.60–3.03) and kurtosis (0.05–10.15) as well as multivariate kurtosis (Mardia's normalized multivariate kurtosis = 24.34), Satorra-Bentler scaled χ2 and robust SEs (Satorra & Bentler, 2001) were calculated as they have been found to provide more accurate parameter estimations (Finney & DiStefano, 2013). Analysis was done with R version 3.4.3 (R Core Team, 2017) and the lavaan package (Rosseel, 2012). Factor loadings for the Maximum Likelihood estimation ranged from .55 to .63 for the complete sample (see Figure 1). The results indicated that the single-factor model presented a good fit to the data for all versions in Sample 1 (Table 2). While χ2 was significant for the whole sample, it became nonsignificant for all language versions. The unidimensional congeneric measurement model established in Steffgen et al. (2019) was also confirmed in the second study (Sischka et al., 2020; e.g., fit for the whole sample was χ2 = 6.527; df = 5; p = .258; RMSEA [90% CI] = .014 [.000; .035]; SRMR = .013; CFI = .998; TLI = .995).
Figure 1
t-Congeneric Measurement Model of the LWMS in Sample 1
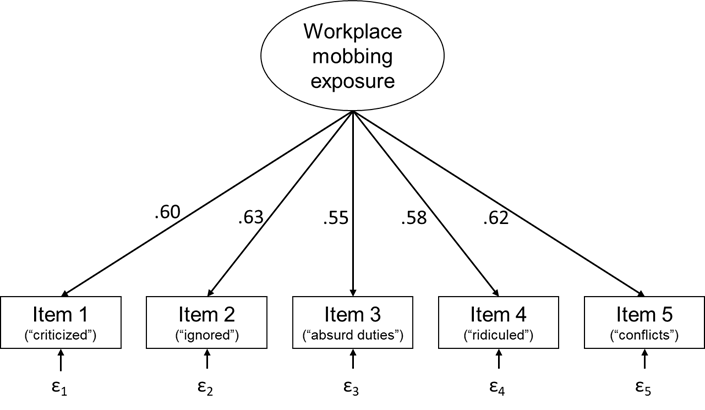
Note. Standardized factor loadings.
Table 2
Fit Indices for the t-Congeneric Measurement Model of the LWMS in Sample 1
|
Version |
χ2 |
p |
RMSEA [90% CI] |
SRMR |
CFI |
TLI |
|
Total (N = 1500) |
22.770 |
.000 |
.049 [.033; .065] |
.022 |
.978 |
.956 |
|
Luxembourg (n = 207) |
6.991 |
.221 |
.044 [.000; .098] |
.034 |
.985 |
.971 |
|
French (n = 714) |
8.317 |
.140 |
.030 [.000; .059] |
.019 |
.991 |
.981 |
|
German (n = 579) |
13.257 |
.021 |
.053 [.026; .082] |
.027 |
.978 |
.956 |
Note. df = 5. RMSEA [90% CI] = root mean squared error of approximation with 90% confidence interval; SRMR = standardized root mean square residual; CFI = comparative fit index.
Table 3 shows the results for the tests of different forms of measurement invariance in Sample 1.[2] The ΔCFI was used to assess goodness of fit of measurement invariance models. A ΔCFI of ≥ -.01 between a baseline model and the resulting model indicates measurement invariance (Little, 2013). Factor-form and metric invariance were confirmed but scalar invariance was rejected between the different language versions of the LWMS. Therefore, a model with partial scalar invariance was estimated (Steinmetz et al., 2009). Guided by modification indices, the intercept of Item 1, 2, and 5 were freely estimated. This partial scalar invariance model was confirmed.
Table 3
Test of Measurement Invariance and Fit Indices for the t-Congeneric Measurement Model of the LWMS across Language Versions in Sample 1 (N = 1500)
|
Form of invariance |
χ2 |
df |
p |
RMSEA |
ΔRMSEA |
CFI |
ΔCFI |
|
Configural invariance |
28.383 |
15 |
.019 |
.042 |
|
.984 |
|
|
Metric invariance |
35.170 |
23 |
.050 |
.033 |
-.009 |
.986 |
.002 |
|
Scalar invariance |
69.967 |
31 |
.000 |
.050 |
.017 |
.954 |
-.032 |
|
Partial scalar invariance |
37.474 |
25 |
.052 |
.032 |
-.001 |
.985 |
-.001 |
Notes. RMSEA = root mean squared error of approximation; CFI = comparative fit index.
Item parameters
Table 4 displays the means, standard deviations, skewness, kurtosis, and completely standardized factor loadings for the total sample and the different language versions in Sample 1 (Steffgen et al., 2019).
Table 4
Means, Standard Deviations, Skewness, Kurtosis, and Completely Standardized Factor Loadings for the One-Factor LWMS Model in Sample 1
|
|
M |
SD |
Skewness |
Kurtosis |
ML l |
|
Total (N = 1500) |
|
||||
|
Item 1 ("criticized") |
2.22 |
0.84 |
0.72 |
0.89 |
.60 |
|
Item 2 ("ignored") |
1.73 |
0.90 |
1.30 |
1.42 |
.63 |
|
Item 3 ("absurd duties") |
1.85 |
0.96 |
1.09 |
0.70 |
.55 |
|
Item 4 ("ridiculed") |
1.27 |
0.63 |
2.72 |
7.97 |
.58 |
|
Item 5 ("conflicts") |
1.93 |
0.80 |
0.78 |
0.84 |
.62 |
|
Luxembourg version (n = 207) |
|
||||
|
Item 1 |
2.25 |
0.87 |
0.83 |
0.91 |
.66 |
|
Item 2 |
1.70 |
0.95 |
1.45 |
1.62 |
.55 |
|
Item 3 |
1.89 |
0.96 |
0.91 |
0.05 |
.61 |
|
Item 4 |
1.36 |
0.69 |
2.11 |
4.22 |
.59 |
|
Item 5 |
1.98 |
0.87 |
0.77 |
0.53 |
.74 |
|
French version (n = 714) |
|
||||
|
Item 1 |
2.20 |
0.87 |
0.60 |
0.39 |
.59 |
|
Item 2 |
1.82 |
0.94 |
1.11 |
0.79 |
.65 |
|
Item 3 |
1.90 |
0.97 |
0.99 |
0.44 |
.51 |
|
Item 4 |
1.28 |
0.65 |
2.72 |
8.03 |
.54 |
|
Item 5 |
1.88 |
0.80 |
0.69 |
0.28 |
.61 |
|
German version (n = 579) |
|
||||
|
Item 1 |
2.24 |
0.78 |
0.90 |
1.73 |
.60 |
|
Item 2 |
1.63 |
0.83 |
1.49 |
2.48 |
.64 |
|
Item 3 |
1.77 |
0.95 |
1.31 |
1.42 |
.57 |
|
Item 4 |
1.22 |
0.57 |
3.03 |
10.15 |
.64 |
|
Item 5 |
1.97 |
0.77 |
0.91 |
1.79 |
.58 |
Note. Scale ranging from 1 (Never) to 5 (Almost always).
Objectivity
The standardized questionnaire format and written instructions, the labelled response categories, and fixed scoring rules enable objective application, evaluation, and interpretation of the LWMS.
Reliability
Table 5 displays the reliability in terms of two internal consistency measures, namely Cronbach's alpha (Cronbach, 1951) and McDonald's omega (McDonald, 1999) for the total samples as well as for specific subgroups. We report Cronbach's alpha because it is still the most used measure of internal consistency (e.g., Crutzen & Peters, 2017), although often misinterpreted (Hoekstra et al., 2019). On the other hand, McDonald's omega is more appropriate in case of a congeneric scale (e.g., McNeish, 2018). The reliability estimates ranged between .71 and .76 for the different language versions that can be deemed sufficient for many research purposes (Aiken & Growth-Marnat, 2006).
Table 5
Internal Consistency Estimates
|
(Sub-)sample |
Cronbach's alpha |
McDonald's omega |
|
Total |
.73a/.72b |
.73c/.73b |
|
Language versions |
|
|
|
German |
.73a |
.73c |
|
French |
.71a |
.71c |
|
Luxembourgish |
.76a |
.77c |
|
Gender |
|
|
|
Men |
.70b |
.70b |
|
Women |
.74b |
.75b |
|
Age groups |
|
|
|
16-34 |
.68b |
.68b |
|
35-44 |
.70b |
.70b |
|
45-54 |
.74b |
.74b |
|
55+ |
.75b |
.76b |
|
Occupation |
|
|
|
Professionals |
.71b |
.71b |
|
Clerical support workers |
.75b |
.75b |
|
Serve and sales workers |
.75b |
.76b |
|
Technicians and associate professionals |
.72b |
.73b |
Note. aSteffgen et al., 2019; bSischka et al., 2020; cnewly calculated based on the sample from Steffgen et al., 2019.
Validity
The items of the LWMS tap into the different categories listed by Leymann (1996b) and cover work-related as well as person-related negative behavior (Einarsen et al., 2009). Thus, the content validity can be deemed high. The evaluation of the factor structure confirmed the undimensionality of the LWMS (see Figure 1 and Table 2-4). Based on recent findings on workplace mobbing (e.g., Bowling & Beehr, 2006; Nielsen & Einarsen, 2012), several measures were used to assess the construct and criterion validity and to elaborate the nomological net of the LWMS. This was done based on manifest correlations. The LWMS was meaningfully related with different working conditions (e.g., mental strain at work, communication and feedback), work-related attitudes (work satisfaction, perceived respect, turnover intention), work-related behavior (absenteeism, work performance), (work-related) mental health and well-being (burnout, vigor, general psychological well-being, suicidal thoughts), health behavior (e.g., sleeping hours), and self-labelled workplace mobbing experiences (Table 6; Steffgen et al., 2019; Sischka et al., 2020). The LWMS showed a moderate correlation with self-labelled workplace mobbing experience. Regarding the dichotomous variables Sischka et al. (2020) found considerable deviation from a 50% base rate for turnover intention (14.6%), mobbing self-labelling (5.7%), and suicidal thoughts (3.3%), making the interpretation of AUCs more appropriate than point-biserial correlations (Babchishin & Helmus, 2016). Regarding AUCs, the LWMS showed moderate links with turnover intention (AUC = .66, p < .01, 95% CI [.62; .70]), suicidal thoughts (AUC = .69, p < .01, 95% CI [.61; .77]), and a very strong link with self-labelled mobbing victim status (AUC = .87, p < .01, 95% CI [.82; .91]).
Table 6
Correlation Coefficients of the LWMS with Different Constructs
|
Working conditions |
Pearson correlation/point-biserial correlation |
|
Communication and feedbacka |
-.31** |
|
Cooperationa |
-.26** |
|
Appraisalab |
-.22** |
|
Mental strain at worka |
.29** |
|
Workplace mobbing self-labellingb |
.40** |
|
Work-related attitudes |
|
|
Work satisfactiona |
-.53** |
|
Respecta |
-.53** |
|
Turnover intentionsb |
.21** |
|
Work-related behavior |
|
|
Subjective work performanceb |
-.23** |
|
Absenteeismb |
.11** |
|
(Work-related) mental health and well-being |
|
|
General well-being (WHO-5 well-being index)b |
-.33** |
|
Subjective physiological health problemsb |
.33** |
|
Suicidal thoughtsb |
.16** |
|
Work-related burnoutb |
.50** |
|
Vigorb |
-.33** |
|
Psychological stressa |
.49** |
|
Health behavior |
|
|
Sleeping hoursb |
-.18** |
|
Alcohol useb |
.02 |
|
Smokingb |
.01 |
|
BMIb |
.08* |
Note. aSteffgen et al., 2019; bSischka et al., 2020; *p < .05, **p < .01.
Descriptive statistics (scaling)
As the LWMS is (at least partial) scalar measurement invariant across language, gender, age groups, and occupation and no language, gender, age, or occupation effects occurred (Sischka et al., 2020; Steffgen et al., 2019; see also the next chapter), we provided information about the distribution and descriptive statistics as well as percentile norms of the LWMS only for the total samples (see Figure 2 and Table 7).
Figure 2
Kernel Density Estimation of the Manifest LWMS Scores and Descriptive Statistics
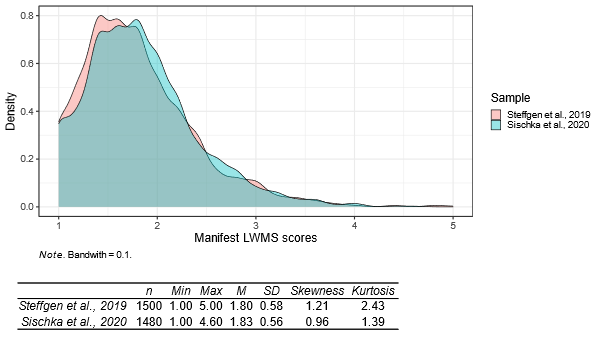
Table 7
Percentile Norms of the Manifest LWMS Scores
|
LWMS score |
Percentile rank |
LWMS score |
Percentile rank |
|
1.00 |
1-7% |
2.31 |
83% |
|
1.20 |
8-15% |
2.40 |
84-88% |
|
1.40 |
16-30% |
2.60 |
89-92% |
|
1.60 |
31-45% |
2.80 |
93-95% |
|
1.80 |
46-60% |
3.00 |
96% |
|
1.84 |
61% |
3.20 |
97-98% |
|
2.00 |
62-73% |
3.60 |
99% |
|
2.20 |
74-82% |
4.60 |
100% |
Note. Norms based on the sample from Sischka et al., 2020.
Further quality criteria
The LWMS exhibits a processing time of 1-2 minutes (authors' estimate); thus, it can be deemed as an economic measurement instrument. In comparison to other workplace mobbing exposure instruments (e.g., LIPT; Leymann, 1996a, 1996b with 45 items), the LWMS is especially economic, however, with the costs of slightly reduced reliability. Nevertheless, the reliability of the LWMS can be deemed sufficient for many research purposes (Aiken & Growth-Marnat, 2006). As workplace mobbing exposure might be a sensitive issue, the LWMS may be prone to effects of social desirability and response bias. However, the items are written in behavioral terms with no reference to the term "mobbing". Thus, employees exposed to workplace mobbing do not have to label themselves as mobbing victims which has been found to be associated with feelings of shame (Felbinger, 2008; Lewis, 2004).
The LWMS was tested for measurement invariance across gender, age groups, and occupation in Sample 2 (Sischka et al., 2020). The unidimensional congeneric measurement model was applied, and the effects-coding method was used for scale setting to estimate each construct's latent variance in a non-arbitrary metric (Little et al., 2006). A CFI change of ≥ -.01 between a baseline model and the resulting model was used as an indication of measurement invariance (Little, 2013). The results indicated that the LWMS was scalar invariant across men and women and across four different occupation groups (Table 8). The measurement invariance testing across four age groups confirmed metric invariance but rejected scalar invariance. Therefore, we tried to establish a partial scalar invariant model. We switched to the fixed-factor method for scale setting, as this scale setting method has been found to be superior to other scale setting methods regarding the identification of non-invariant parameters (Lee et al., 2011).
Using the scalar invariance model as baseline model, the intercepts were sequentially freed, and Satorra-Bentler scaled χ2-difference tests (Satorra & Bentler, 2001) with Bonferroni corrections applied. This procedure revealed no clear non-invariant parameter. Therefore, switching back to effects-coding method, we freed the intercepts with the highest influence on model fit (i.e., Items 1 and 2), thus leading to an acceptable deterioration in model fit compared to the metric invariance model. Partial scalar measurement invariance was also confirmed across language versions in Table 3 for Sample 1.
Table 8
Fit Indices for Single CFAs of the LWMS and Measurement Invariance Models Different Groups
|
|
χ2 a |
df |
p |
RMSEA [90% CI] |
SRMR |
CFI |
TLI |
|
Gender |
|
|
|
|
|
|
|
|
Men (n = 804) |
6.926 |
5 |
.226 |
.022 [.000; .051] |
.017 |
.994 |
.989 |
|
Women (n = 676) |
4.320 |
5 |
.504 |
.000 [.000; .036] |
.016 |
1.000 |
1.004 |
|
Configural invariance |
10.784 |
10 |
.375 |
.010 [.000; .035] |
.017 |
.999 |
.998 |
|
Metric invariance |
15.235 |
14 |
.362 |
.011 [.000; .032] |
.026 |
.998 |
.997 |
|
Scalar invariance |
19.986 |
18 |
.334 |
.012 [.000; .032] |
.029 |
.997 |
.997 |
|
Age |
|
|
|
|
|
|
|
|
16-34 (n = 175) |
5.217 |
5 |
.390 |
.016 [.000; .090] |
.034 |
.997 |
.994 |
|
35-44 (n = 430) |
11.271 |
5 |
.046 |
.054 [.023; .085] |
.034 |
.969 |
.938 |
|
45-54 (n = 641) |
1.799 |
5 |
.876 |
.000 [.000; .000] |
.009 |
1.000 |
1.021 |
|
55+ (n = 234) |
3.704 |
5 |
.593 |
.000 [.000; .066] |
.021 |
1.000 |
1.023 |
|
Configural invariance |
22.920 |
20 |
.293 |
.020 [.000; .044] |
.021 |
.996 |
.992 |
|
Metric invariance |
40.534 |
32 |
.143 |
.027 [.000; .045] |
.041 |
.988 |
.985 |
|
Scalar invariance |
64.498 |
44 |
.024 |
.035 [.018; .050] |
.046 |
.970 |
.973 |
|
Partial scalar invarianceb |
54.682 |
41 |
.075 |
.030 [.007; .046] |
.044 |
.980 |
.981 |
|
Occupation |
|
|
|
|
|
|
|
|
Professionals (n = 395) |
2.060 |
5 |
.841 |
.000 [.000; .028] |
.013 |
1.000 |
1.035 |
|
Clerical support workers |
5.977 |
5 |
.308 |
.032 [.000; .099] |
.029 |
.992 |
.984 |
|
Service and sales workers (n = 160) |
7.507 |
5 |
.186 |
.056 [.000; .108] |
.041 |
.967 |
.934 |
|
Technicians and associate professionals (n = 371) |
5.086 |
5 |
.406 |
.007 [.000; .065] |
.020 |
1.000 |
.999 |
|
Configural invariance |
21.846 |
20 |
.349 |
.018 [.000; .049] |
.022 |
.997 |
.993 |
|
Metric invariance |
33.164 |
32 |
.410 |
.011 [.000; .041] |
.041 |
.998 |
.997 |
|
Scalar invariance |
50.046 |
44 |
.246 |
.022 [.000; .044] |
.046 |
.989 |
.990 |
Note. a Satorra-Bentler corrected; b = Intercept of Items 1 and 2 freely estimated. RMSEA [90% CI] = root mean squared error of approximation with 90% confidence interval; SRMR = standardized root mean square residual; CFI = comparative fit index; TLI = Tucker-Lewis index.
Further literature
Steffgen, G., Sischka, P., Schmidt, A. F., Kohl, D., & Happ, C. (2019). The Luxembourg Workplace Mobbing Scale. European Journal of Psychological Assessment, 35(2), 164–171. https://doi.org/10.1027/1015-5759/a000381
Sischka, P. E., Schmidt, A. F., & Steffgen, G. (2020). Further Evidence for Criterion Validity and Measurement Invariance of the Luxembourg Workplace Mobbing Scale. European Journal of Psychological Assessment, 36(1), 32–43. https://doi.org/10.1027/1015-5759/a000483
Acknowledgement
This research was supported by a grant from the Luxembourg Chamber of Labor. The authors would like to thank Sylvain Hoffmann and David Büchel.
- Dr. Philipp E. Sischka, Department of Behavioural and Cognitive Sciences, Institute for Health and Behaviour, University of Luxembourg, Maison des Sciences Humaines 11, Porte des Sciences, L-4366 Esch-sur-Alzette. E-Mail: philipp.sischka@uni.lu
- Dr. Alexander F. Schmidt, Department of Psychology, Social and Legal Psychology, University of Mainz, Mainz, Germany. E-Mail: alexander.schmidt@uni-mainz.de
- Prof. Dr. Georges Steffgen, Department of Behavioural and Cognitive Sciences, Institute for Health and Behaviour, University of Luxembourg, Maison des Sciences Humaines 11, Porte des Sciences, L-4366 Esch-sur-Alzette. E-Mail: georges.steffgen@uni.lu