Received: Thu 29, Feb 2024
Accepted: Tue 26, Mar 2024
Abstract
Background: Abdominal aortic calcification (AAC) is a prevalent form of vascular calcification associated with adverse cardiovascular outcomes. While previous studies on AAC and cardiovascular risk exist, many have limitations such as small sample sizes and limited clinical significance outcomes. This study aims to prospectively investigate the association between AAC and all-cause and cardiovascular disease (CVD)-specific mortality rates in a nationally representative sample of adults in the United States, using data from the National Health and Nutrition Examination Survey (NHANES).
Methods: The study, conducted on NHANES participants aged 40 years or older during the 2013-2014 cycle, assessed AAC using the Kauppila scoring system. Demographic characteristics, mortality data, and comorbid factors such as age, gender, diabetes, and hypertension were considered. Statistical analyses, including weighted percentages, Kaplan-Meier survival curves, and multivariable Cox proportional hazards regression models, were employed to evaluate the associations between AAC and mortality risks.
Results: After analyzing a final sample of 2717 participants, the study found a significant association between severe AAC (SAAC) and higher all-cause mortality risk (HR 1.70, 95% CI 1.17-2.48). The dose-response relationship indicated an increased risk with higher AAC scores. However, no independent association was observed between AAC and cardiovascular mortality. Stratified analysis revealed variations in the AAC-all-cause mortality association based on gender and hypertension.
Conclusion: This population-based study provides valuable insights into the prospective association between AAC and all-cause mortality, emphasizing the potential role of AAC assessment in identifying individuals at higher risk.
Keywords
Abdominal aortic calcification, cardiovascular mortality, NHANES, Kauppila scoring system, stratified analysis
Highlights
i) Our study uncovers a significant link between AAC and mortality. Notably, individuals with SAAC face a 70% higher risk of all-cause mortality, emphasizing the clinical relevance of AAC assessment.
ii) We shed light on the nuanced interplay between demographic factors and AAC's influence on mortality. Gender and hypertension play crucial roles, with the association being more pronounced in females, older individuals, and those with hypertension.
iii) The increase in AAC scores is observed to have a linear relationship with a higher risk of all-cause mortality.
1. Introduction
Abdominal aortic calcification (AAC), a prevalent form of vascular calcification [1], is commonly observed in the general population, and its incidence and severity increase with advancing age [2]. Numerous epidemiological studies have robustly established an association between AAC and adverse cardiovascular outcomes, including stroke [3], coronary heart disease [4], and myocardial infarction [5]. The escalation in the severity of aortic calcification has been recognized as a predictor for specific cardiovascular events and overall mortality [6-10]. Some reports suggest that the visible amount of AAC in imaging tests determines the risk levels of cardiovascular events, fatal cardiovascular events, and all-cause mortality, with the highest risk observed in patients with advanced calcification [11-13].
Despite the recognized importance of AAC, existing studies suffer from limitations such as relatively small sample sizes, limited reporting of clinical significance outcomes, and a need to establish the relevance of AAC in various patient subgroups. The National Health and Nutrition Examination Survey (NHANES) is a periodic, cross-sectional health survey program that utilizes a stratified, multistage, and probability-cluster design to obtain a nationally representative sample of non-institutionalized individuals in the United States. Combining interviews and medical examinations, NHANES collects a wide range of demographic, socioeconomic, dietary, physiological, and laboratory information, providing a robust platform to investigate the prognostic implications of AAC.
To contribute to the existing evidence, our study prospectively exploring the relationship between AAC and all-cause, as well as cardiovascular mortality rates among adult individuals in the United States. Furthermore, we also aim to determine the strength of this association and assess whether it varies among populations with different comorbid factors such as gender, age, hypertension, and diabetes.
2. Methods
2.1. Study Design and Participants
Administered by the National Center for Health Statistics (NCHS), NHANES is conducted with approval from the institutional ethics review board of NCHS, and written informed consent is obtained from all participants. Our study specifically focused on NHANES participants aged 40 years or older during the 2013-2014 cycle. Inclusion criteria encompassed individuals with complete survival information, AAC measurements, and relevant demographic variables. At the outset, our initial study cohort consisted of 10175 participants. Subsequently, we refined the sample by excluding individuals below the age of 40 years (n = 6360), those with incomplete AAC data (n = 675), insufficient survival data (n = 9), and participants with missing covariate information (n = 690). Consequently, we derived a final analytical sample comprising 2717 participants.
The analyzed cohort exhibited common characteristics of younger age, higher PIR, cohabitation status, and lower educational levels. Moreover, the study cohort predominantly consisted of non-hispanic white participants (Table S1). It must be acknowledged that the differences between the included and excluded subsets highlight the need for cautious extrapolation of the study results to a broader population.
3. Study Variables
3.1. Demographic Characteristics
Demographic information, obtained through questionnaires during in-home interviews, categorized age into two groups (40-59 years or ≥ 60 years). Race included non-hispanic white, non-hispanic Asian, Mexican American, other hispanic, non-hispanic black, and other race. The PIR evaluated income in relation to federal poverty thresholds and was divided into three categories: < 1.38 (indicating low income), 1.38-3.99 (representing middle income), and ≥ 4.00 (reflecting high income) [14]. Marital status was characterized as either married/living with a partner or single [15]. Educational levels were categorized into college graduate or above, some college or associate's degree, and high school degree/equivalency or less [15].
3.2. Definition of Mortality
Baseline information from NHANES 2013-2014 was connected to mortality records sourced from the National Death Index death certificates, extending until December 31, 2019. The linkage employed a probabilistic matching algorithm to ascertain mortality status. The study's outcomes encompassed both all-cause mortality and mortality specific to cardiovascular disease (CVD) (coded I00-I09, I11, I13, I20-I51, and I60-I69), utilizing the International Classification of Diseases, Tenth Revision.
3.3. Measurements and Definition of AAC
The degree of AAC was evaluated through the utilization of the Kauppila scoring system [16], ranging from 0 to 3 for each of the eight segments, with a total score of 24. A widely accepted threshold designating severe abdominal aortic calcification (SAAC) was applied when the AAC score exceeded 6. In contrast, mild-moderate AAC (MAAC) was defined as a score ranging from 1 to 6 points [15, 17].
3.4. Statistical Methods
Considering the complex sampling design of NHANES, all analyses were conducted by incorporating sample weights, clustering, and stratification to ensure nationally representative estimates. Weighted percentages presented categorical variables, and weighted means were used for continuous variables.
The decision to categorize AAC was motivated by the evident skewness in the data, with around thirty percent of participants reporting AAC. Kaplan-Meier survival curves were employed to compute cumulative mortality, utilizing three score categories of AAC metrics (no, mild-moderate, severe). Survey-weighted multivariable Cox proportional hazards regression models were then utilized to derive hazard ratios (HRs) and corresponding 95% confidence intervals (CIs) to assess the associations of AAC with the risks of all-cause and CVD-specific mortality. Model 1 did not incorporate adjustments for any covariates; Model 2 was adjusted for gender, age (as a continuous variable), race, education levels, marital status, and poverty ratio (as a continuous variable); Model 3 expanded on Model 2 by incorporating hypertension and diabetes. Schoenfeld residuals were used to test the proportional hazards assumption, and no violation was observed. To visualize the dose-response association of AAC levels with all-cause and CVD-specific mortality, we additionally employed the restricted cubic spline (RCS) model without weights. This choice was made due to the unavailability of an RCS model specifically designed for complex, multistage sampling survey data.
To probe demographic-related disparities within susceptible subpopulations, we conducted stratified analyses based on age strata, sex, poverty ratio, hypertension, and diabetes. The significance of interactions was assessed by determining the P values for the product terms between AAC and the stratified factors. All statistical analyses were performed using R software (version 4.2.1), and a two-sided P value less than 0.05 was deemed statistically significant.
4. Results
4.1. Participants Characteristic
Following the application of weights, the study encompassed a total of 111799277 participants. Table 1 provides a summary of the baseline characteristics of the study population, organized by AAC level. The weighted mean age of the study participants was 57.42±11.53 years, with the weighted proportion of females being 51.34%. Statistically significant differences (all P values < 0.05) were observed in age, poverty status, education level, marital status, smoking, albuminuria, chronic kidney disease, hypertension, diabetes, CVD, albumin, and across different AAC levels (Table 1). Specifically, participants with SAAC were more likely to be older, economically disadvantaged, smokers, and single. They were also more likely to have concomitant renal insufficiency, diabetes, and cardiovascular diseases, as well as lower educational levels.
TABLE 1: Baseline Characteristics of the study
population.
|
Characteristic |
Overall N = 111799277 |
No AAC N = 79718967 |
MAAC N = 23402727 |
SAAC N = 8677583 |
P value |
|
Age, years |
57.42 (11.53) |
54.93 (10.42) |
60.87 (11.55) |
71.01 (9.12) |
<0.001 |
|
Age strata, % |
|
|
|
|
<0.001 |
|
40-59 |
66701183 (59.66%) |
54134866 (67.91%) |
11444718 (48.90%) |
1121600 (12.93%) |
|
|
60+ |
45098094 (40.34%) |
25584101 (32.09%) |
11958009 (51.10%) |
7555983 (87.07%) |
|
|
Sex, % |
|
|
|
|
0.611 |
|
Male |
54401504 (48.66%) |
38810090 (48.68%) |
11733521 (50.14%) |
3857892 (44.46%) |
|
|
Female |
57397773 (51.34%) |
40908877 (51.32%) |
11669206 (49.86%) |
4819691 (55.54%) |
|
|
Race, % |
|
|
|
|
0.107 |
|
Mexican American |
7279573 (6.51%) |
5784260 (7.26%) |
1117231 (4.77%) |
378083 (4.36%) |
|
|
Other Hispanic |
4826861 (4.32%) |
3686855 (4.62%) |
940534 (4.02%) |
199472 (2.30%) |
|
|
Non-Hispanic White |
80879994 (72.34%) |
56054541 (70.32%) |
17826198 (76.17%) |
6999257 (80.66%) |
|
|
Non-Hispanic Black |
10770883 (9.63%) |
8345197 (10.47%) |
1918524 (8.20%) |
507162 (5.84%) |
|
|
Non-Hispanic Asian |
5625387 (5.03%) |
4192816 (5.26%) |
1118065 (4.78%) |
314505 (3.62%) |
|
|
Other Race |
2416577 (2.16%) |
1655298 (2.08%) |
482175 (2.06%) |
279104 (3.22%) |
|
|
PIR |
3.17 (1.63) |
3.28 (1.63) |
2.96 (1.62) |
2.79 (1.52) |
0.032 |
|
PIR strata, % |
|
|
|
|
0.017 |
|
<1.38 |
22404818 (20.04%) |
15259255 (19.14%) |
5080976 (21.71%) |
2064586 (23.79%) |
|
|
≥1.38 and <3.99 |
44455719 (39.76%) |
29595626 (37.12%) |
10572743 (45.18%) |
4287351 (49.41%) |
|
|
≥3.99 |
44938740 (40.20%) |
34864086 (43.73%) |
7749008 (33.11%) |
2325646 (26.80%) |
|
|
Education level, % |
|
|
|
|
<0.001 |
|
High school degree/equivalency or less |
40606804 (36.32%) |
26897504 (33.74%) |
9576458 (40.92%) |
4132842 (47.63%) |
|
|
Some college or associates degree |
34010179 (30.42%) |
23970454 (30.07%) |
7419660 (31.70%) |
2620065 (30.19%) |
|
|
College Graduate or above |
37182294 (33.26%) |
28851009 (36.19%) |
6406609 (27.38%) |
1924676 (22.18%) |
|
|
Marital status, % |
|
|
|
|
<0.001 |
|
Married/Living with partner |
76338201 (68.28%) |
56430650 (70.79%) |
15566583 (66.52%) |
4340968 (50.03%) |
|
|
Single |
35461076 (31.72%) |
23288317 (29.21%) |
7836144 (33.48%) |
4336615 (49.97%) |
|
|
BMI, kg/m2 |
|
|
|
|
0.766 |
|
<25.0 |
29903589 (26.75%) |
21063261 (26.42%) |
6374560 (27.24%) |
2465768 (28.42%) |
|
|
≥25.0 |
81895688 (73.25%) |
58655706 (73.58%) |
17028167 (72.76%) |
6211815 (71.58%) |
|
|
Smoking, % |
|
|
|
|
0.001 |
|
Never |
59888254 (53.57%) |
45802771 (57.46%) |
10829399 (46.27%) |
3256084 (37.52%) |
|
|
Former |
31649422 (28.31%) |
20437866 (25.64%) |
7424490 (31.72%) |
3787065 (43.64%) |
|
|
Now |
20261601 (18.12%) |
13478330 (16.91%) |
5148838 (22.00%) |
1634434 (18.84%) |
|
|
Albuminuria, % |
12082469 (10.81%) |
7628036 (9.57%) |
2796959 (11.95%) |
1657474 (19.10%) |
0.002 |
|
CKD group, % |
|
|
|
|
<0.001 |
|
No CKD |
90206060 (80.69%) |
67412133 (84.56%) |
18170427 (77.65%) |
4623499 (53.28%) |
|
|
Stages 1-2 |
8751992 (7.83%) |
6012082 (7.54%) |
1783931 (7.62%) |
955978 (11.02%) |
|
|
Stages 3 |
12154239 (10.87%) |
5859156 (7.35%) |
3291125 (14.06%) |
3003958 (34.62%) |
|
|
Stages 4-5 |
686986 (0.61%) |
435596 (0.55%) |
157244 (0.67%) |
94147 (1.08%) |
|
|
Total cholesterol/HDL |
3.88 (1.38) |
3.85 (1.40) |
4.00 (1.40) |
3.77 (1.17) |
0.124 |
|
Diabetes, % |
20752507 (18.56%) |
12453375 (15.62%) |
4985826 (21.30%) |
3313307 (38.18%) |
<0.001 |
|
Hypertension, % |
49958133 (44.69%) |
30899192 (38.76%) |
12790754 (54.65%) |
6268187 (72.23%) |
<0.001 |
|
CVD, % |
11213750 (10.03%) |
5673310 (7.12%) |
3500128 (14.96%) |
2040312 (23.51%) |
<0.001 |
|
Albumin, g/dL |
4.25 (0.30) |
4.26 (0.30) |
4.25 (0.32) |
4.20 (0.27) |
0.036 |
|
Serum total calcium,
mg/dL |
9.46 (0.36) |
9.44 (0.36) |
9.49 (0.35) |
9.49 (0.35) |
0.205 |
|
Serum phosphorus, mg/dL |
3.79 (0.56) |
3.79 (0.56) |
3.77 (0.54) |
3.89 (0.57) |
0.170 |
|
Total 25-hydroxyvitamin
D, nmol/L |
74.85 (29.31) |
74.16 (28.99) |
74.37 (29.51) |
82.49 (30.66) |
0.001 |
Data are
presented as mean (SD), n (%), and P value.
Analysis conducted:
Wilcoxon rank-sum test for complex survey samples; chi-squared test with Rao
& Scott's second-order correction.
PIR:
Poverty Income Ratio; BMI: Body Mass Index; CKD: Chronic Kidney Disease; CVD:
Cardiovascular Disease; AAC: Abdominal Aortic Calcification; SAAC: Severe AAC;
MAAC: Mild-Moderate AAC.
CVD: Cardiovascular Disease; AAC: Abdominal Aortic Calcification; SAAC: Severe AAC; MAAC: Mild-Moderate AAC.
3.2. Surgical Characteristics
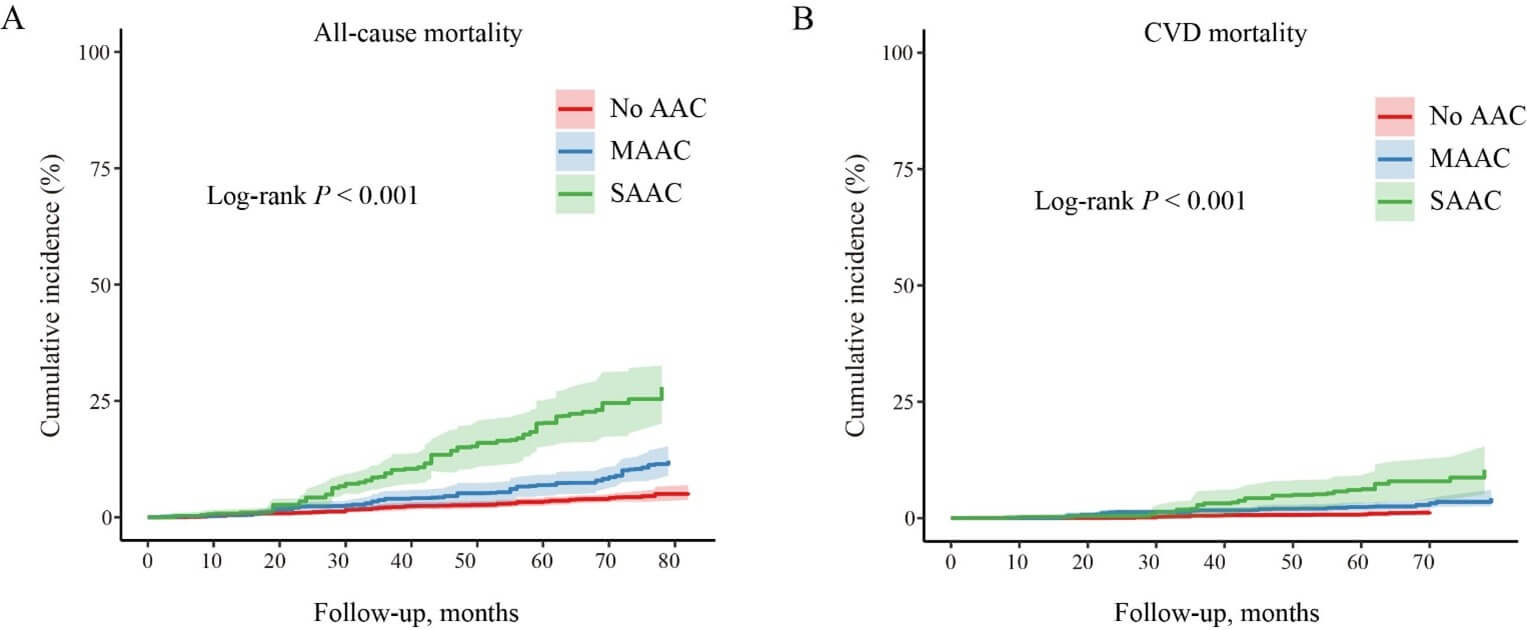
Over a median follow-up period of 72 months (up to 85 months), there were 235 all-cause deaths, including 78 attributed to CVD. The weighted death rates for all-cause mortality were 5.3%, 12.2%, and 26.6% for the no, mild-moderate, and severe AAC groups, respectively. Similarly, the weighted death rates for CVD-specific mortality were 1.3%, 4.3%, and 10.4% for the no, mild-moderate, and severe AAC groups, respectively. Participants with a higher AAC score exhibited a significantly elevated cumulative incidence rate of both all-cause and CVD-specific mortality (P < 0.001 for all log-rank tests, (Figure 1)).
4.2. Survival Analysis
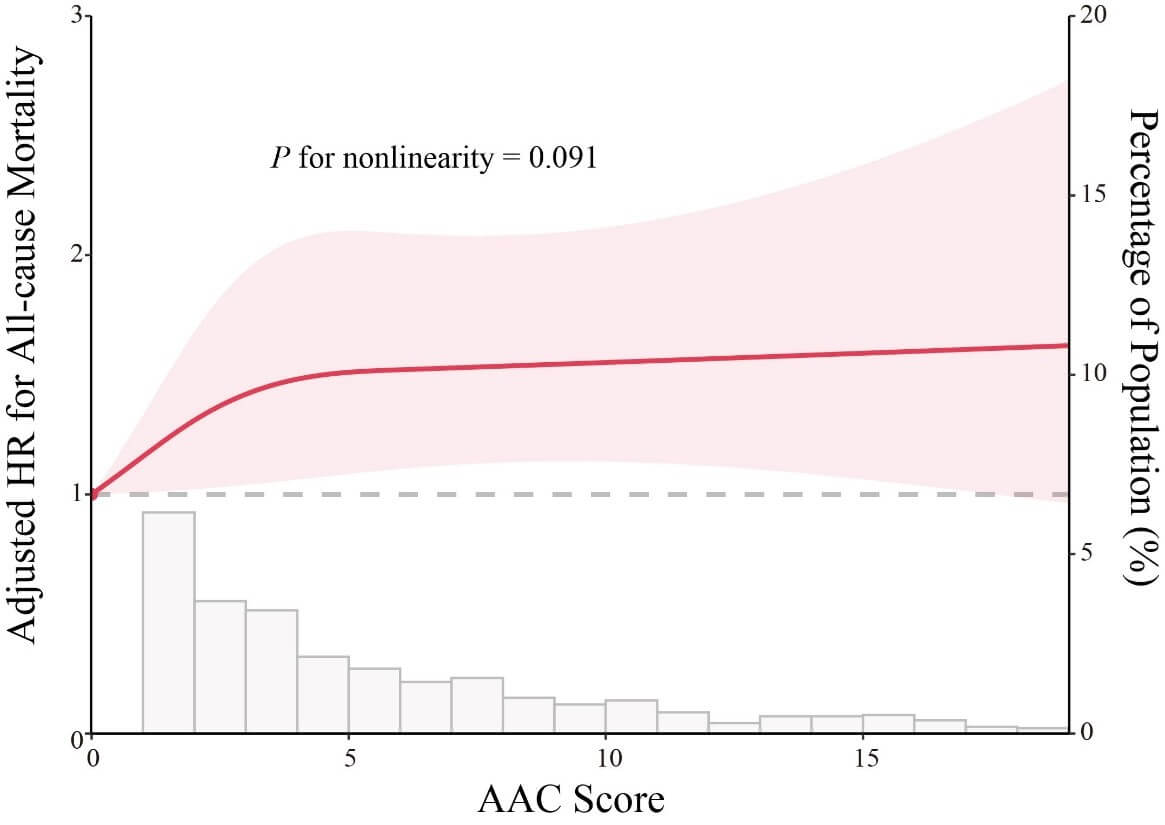
In the fully adjusted model (multivariable model 3), individuals with SAAC exhibited a higher risk of all-cause mortality in comparison to participants with no AAC (hazard ratio [HR] 1.70, 95% confidence interval [CI] 1.17-2.48). The multivariate-adjusted HR for every one-point increase in AAC score in association with all-cause mortality was 1.04 (95% CI 1.02-1.07; (Table 2)). Notably, there were approximately linear dose-response associations of AAC score with all-cause mortality (P for non-linearity >0.05; (Figure 2)), suggesting that the risk of all-cause mortality increased linearly as the AAC score increased.
TABLE 2: Survey-weighted association of AAC with
all-cause and CVD-specific mortality.
|
|
Model 1 |
|
Model 2 |
|
Model 3 |
|
|
Characteristic |
HR (95% CI), P Value |
P for trend |
HR (95% CI), P
Value |
P for trend |
HR (95% CI), P
Value |
P for trend |
|
All-cause mortality |
|
|
|
|
|
|
|
No AAC |
Reference |
|
Reference |
|
Reference |
|
|
MAAC |
2.29 (1.64, 3.19), <
0.001 |
|
1.34 (0.96, 1.88), 0.085 |
|
1.31 (0.95, 1.82), 0.103 |
|
|
SAAC |
6.31 (4.90, 8.14), <
0.001 |
< 0.001 |
1.85 (1.28, 2.67), <
0.001 |
0.003 |
1.70 (1.17, 2.48), 0.005 |
0.019 |
|
AAC score a |
1.15 (1.13, 1.16), <
0.001 |
|
1.05 (1.03, 1.07), <
0.001 |
|
1.04 (1.02, 1.07), 0.001 |
|
|
CVD mortality |
|
|
|
|
|
|
|
No AAC |
Reference |
|
Reference |
|
Reference |
|
|
MAAC |
2.74 (1.63, 4.60), <
0.001 |
|
1.51 (0.88, 2.59), 0.135 |
|
1.50 (0.88, 2.56), 0.140 |
|
|
SAAC |
7.22 (4.00, 13.06), <
0.001 |
< 0.001 |
1.73 (0.92, 3.26), 0.092 |
0.210 |
1.58 (0.81, 3.09), 0.179 |
0.299 |
|
AAC score a |
1.16 (1.12, 1.19), <
0.001 |
|
1.05 (1.01, 1.09), 0.020 |
|
1.04 (1.00, 1.08), 0.071 |
|
a: The analysis was performed per a 1-point
increase in the continuous variable.
Data are presented as HR,
95% CI, and P value.
Model 1 was adjusted for
none.
Model 2 was adjusted for
sex, age, race, marital status, education, and poverty level.
Model 3 was adjusted for
sex, age, race, marital status, education, poverty level, hypertension, and
diabetes.
HR:
Hazard Ratio; CI: Confidence Interval; AAC: Abdominal Aortic Calcification;
SAAC: Severe AAC; MAAC: Mild-Moderate AAC: CVD: Cardiovascular Disease.
AAC: Abdominal Aortic Calcification; HR: Hazard Ratio, CI: Confidence Interval.
Following adjustments for potential confounding factors, both MAAC (HR 1.50, 95% CI 0.88-2.56) and SAAC (HR 1.58, 95% CI 0.81-3.09) were not found to be independently associated with the risk of CVD-specific mortality. Additionally, with each incremental point increase in AAC score, there was no significant rise in the risk of CVD mortality (HR 1.04, 95% CI 1.00-1.08).
4.3. Stratified Analysis
To enhance the practicality of the study outcomes, this analysis segment divides AAC into two groups: the AAC group (AAC score ≥ 1 point) and the non-AAC group. The results of subgroup analyses are summarized in (Figure 3). We observed that the AAC group had higher all-cause mortality than those in the non-AAC group. In the majority of subgroups, there was a positive correlation between AAC and all-cause mortality. However, we noted that the relationship between AAC and all-cause mortality is modulated by the interaction of gender and hypertension (gender: P Value<0.001 for interaction; hypertension: P Value= 0.004 for interaction).
The direct association between AAC and all-cause mortality was not evident in males, those younger than 60 years old, and participants without hypertension. Conversely, the direct association between AAC and all-cause mortality was significant in females, those aged 60 years or older, and those with hypertension. These findings underscore the importance of considering demographic and clinical factors in assessing the impact of AAC on all-cause mortality.
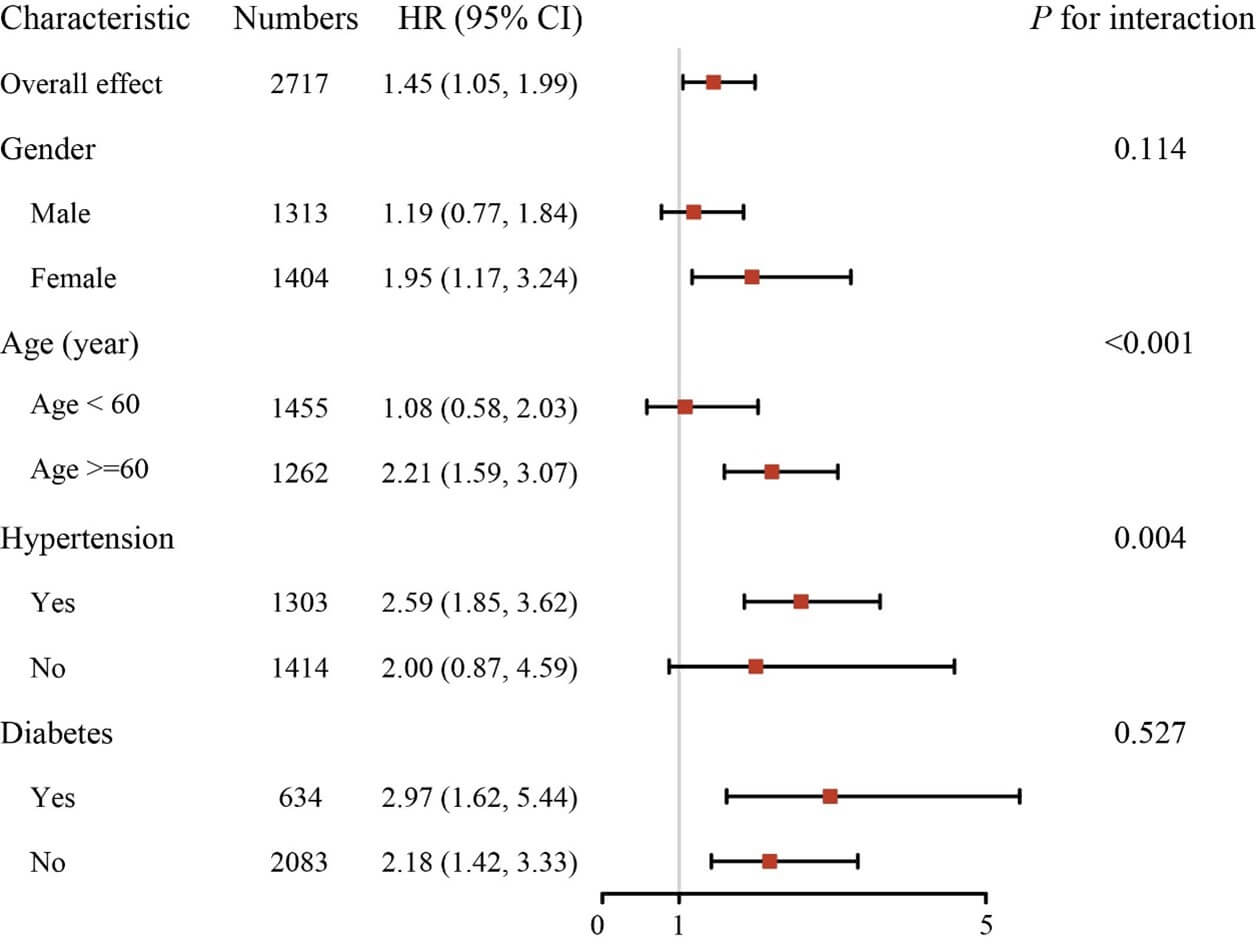
HR: Hazard Ratio; CI: Confidence Interval.
5. Discussion
Utilizing a substantial representative sample of U.S. adults, our study demonstrates that individuals with elevated AAC levels encounter a heightened risk of all-cause mortality. Specifically, compared to patients without AAC, those with SAAC experience a 70% higher risk of all-cause mortality. Furthermore, for each additional point increase in AAC score, participants face a 4% higher risk of all-cause mortality. However, the association with CVD-specific mortality was not as pronounced after adjusting for confounding factors. There is an approximately linear dose-response relationship between AAC score increases and the elevated risk of all-cause mortality. Subgroup analyses revealed that the correlation between AAC and all-cause mortality remains significant in females, older individuals, and those with hypertension. Age and hypertension status were identified as important factors modifying the relationship between AAC and the risk of all-cause mortality. These results provide new evidence for the prognostic value of AAC, proving to be practical in predicting future rates of all-cause mortality. Incidentally discovered AAC in patients without known cardiovascular risk factors may necessitate further cardiovascular diagnostic testing.
Previous studies have primarily focused on specific populations such as dialysis patients and those with chronic kidney disease [18-20]. Our study targets the general population, expanding the breadth of knowledge in this area. There is evidence supporting the promotive role of AAC in diabetes, cardiovascular diseases, and late-life mortality [2, 7, 9, 19]. A comprehensive systematic review and meta-analysis uncovered that individuals with advanced abdominal aortic calcification (AAC) face an elevated risk of cardiovascular events (risk ratio [RR] 1.83, 95% CI 1.40-2.39), all-cause mortality (RR 1.98, 95% CI 1.55-2.53), and fatal cardiovascular events (RR 1.85, 95% CI 1.44-2.39) [8]. Nevertheless, it is crucial to acknowledge that the encompassed studies were restricted to patients with chronic kidney disease and the elderly population, possibly amplifying the association between AAC and the risk of mortality.
There are also conflicting study results, such as the research conducted by Ohya et al., which recruited 137 patients [21]. They reported that AAC is not a significant prognostic factor for all-cause mortality (HR 1.02, 95% CI 0.99-1.04). Of course, due to the limited sample size, the strength of evidence is insufficient. In alignment with earlier investigations, this study affirms that affordable and widely accessible imaging modalities can be employed to identify populations characterized by a notably heightened risk of mortality [9]. Our study's linear dose-response findings suggest that any improvement is significant, particularly for patients with lower AAC scores, which is a novel result compared to previous research [8].
Notably, our study contributes to the literature by using NHANES, offering a larger and more diverse sample, thus enhancing the generalizability of the results. The stratified analysis revealed gender and hypertension as modifiers of the association between AAC and all-cause mortality. Hypertension is significantly associated with an elevated risk of CVD-specific and all-cause mortality [22]. Hypertension also mediates the relationship between aortic calcification and arterial stiffness, left ventricular hypertrophy, and diastolic dysfunction [23]. This emphasizes the importance of considering demographic factors in understanding the nuanced impact of AAC on mortality outcomes. Future research should explore the mechanisms underlying these variations and tailor preventive strategies accordingly. The prospective design enhances the credibility of the observed associations. However, limitations include the observational nature of the study, potential for residual confounding, and the exclusion of certain population segments, highlighting the need for cautious interpretation. Additionally, it must be acknowledged that, during the analysis, due to detected collinearity among covariates, our study did not account for numerous covariates, potentially introducing some degree of error into the results. However, on the flip side, it is worth noting that this study may be less susceptible to confounding factors.
It is now evident that SAAC can effectively identify individuals with an elevated risk of all-cause mortality. The potential utility of this information extends to aiding in treatment decisions, fostering patients' awareness of disease risks and symptoms, serving as a motivational tool for lifestyle decisions and changes, enhancing individual risk prediction, and presenting new targets for innovative treatments. Furthermore, future research should delve into whether knowledge about AAC has enhanced primary prevention and clinical management strategies. Given its potential to complement the assessment of coronary artery calcification, it holds promise for contributing to the early detection and primary prevention strategies of prevalent clinical cardiovascular diseases.
6. Conclusion
In conclusion, our study, based on a nationally representative sample, establishes a significant association between AAC and increased all-cause mortality risk. The findings underscore the importance of considering AAC as a predictive marker for adverse health outcomes in the general U.S. population. Further research and clinical attention to AAC could enhance risk prediction and inform preventive strategies.
Acknowledgments
We extend our gratitude to the dedicated NCHS staff for their meticulous design, data collection, and administration of NHANES, making the valuable data accessible to the public. Our sincere thanks also go to all study participants for their invaluable cooperation.
Author Contributions
CS: Writing-original draft, investigation, methodology, formal analysis, visualization. WH: methodology, funding acquisition. ML: supervision, writing-review & editing. PY: supervision, funding acquisition, writing-review & editing.
Funding
This study was supported by the Natural Science Foundation of Hunan Province (2023JJ30961), the National Key Research and Development Program of China (2023YFC3405200), the scientific research project of Furong laboratory of Central South University (2023SK2083).
Data Availability Statement
Publicly available datasets were analyzed in this study. This data can be found here: (Link) (accessed on 9 Oct 2023).
Ethics Approval and Consent to Participate
The NCHS Research Ethics Review Board reviewed and approved NHANES, and all participants provided written informed consent.
Consent for Publication
Not applicable.
Competing Interests
None.
Declaration of Generative AI and AI-Assisted Technologies in the Writing Process
Not applicable.
Abbreviations
AAC: Abdominal Aortic Calcification
CVD: Cardiovascular Disease
HR: Hazard Ratio
MAAC: Mild-Moderate Abdominal Aortic Calcification
NHANES: National Health and Nutrition Examination Survey
NCHS: National Center for Health Statistics
PIR: Poverty-Income Ratio
RCS: Restricted Cubic Spline
RR: Risk Ratio
SAAC: Severe Abdominal Aortic Calcification
REFERENCES
[1] Peter D
Reaven, Jerome Sacks “Reduced coronary artery and abdominal aortic
calcification in Hispanics with type 2 diabetes.” Diabetes Care, vol.
27, no. 5, pp. 1115-1120, 2004. View at: Publisher Site | PubMed
[2] Jonas W
Bartstra, Willem P Th M Mali, Wilko Spiering, et al. “Abdominal aortic
calcification: from ancient friend to modern foe.” Eur J Prev Cardiol,
vol. 28, no. 12, pp. 1386-1391, 2021. View at: Publisher Site | PubMed
[3] Yamini S
Levitzky, L Adrienne Cupples, Joanne M Murabito, et al. “Prediction of
intermittent claudication, ischemic stroke, and other cardiovascular disease by
detection of abdominal aortic calcific deposits by plain lumbar radiographs.” Am
J Cardiol, vol. 101, no. 3, pp. 326-331, 2008. View at: Publisher Site | PubMed
[4] Hung-Chih
Chen, Wei-Ting Wang, Chieh-Ning Hsi, et al. “Abdominal aortic calcification
score can predict future coronary artery disease in hemodialysis patients: a
5-year prospective cohort study.” BMC Nephrol, vol. 19, no. 1, pp. 313,
2018. View at: Publisher Site | PubMed
[5] Irene M
van der Meer, Michiel L Bots, Albert Hofman, et al. “Predictive value of
noninvasive measures of atherosclerosis for incident myocardial infarction: the
Rotterdam Study.” Circulation, vol. 109, no. 9, pp. 1089-1094, 2004.
View at: Publisher Site | PubMed
[6] Calista M
Harbaugh, Michael N Terjimanian, Jay S Lee, et al. “Abdominal aortic
calcification and surgical outcomes in patients with no known cardiovascular
risk factors.” Ann Surg, vol. 257, no. 4, pp. 774-781, 2013. View at: Publisher Site | PubMed
[7] Justin B
Echouffo-Tcheugui, Matthew Allison, Rita R Kalyani, et al. “Abdominal Aortic
Calcification Among Individuals With and Without Diabetes: The Jackson Heart
Study.” Diabetes Care, vol. 40, no. 8, pp. e106-e107, 2017. View at: Publisher Site | PubMed
[8] Joshua R
Lewis, John T Schousboe, Wai H Lim, et al. “Long-Term Atherosclerotic Vascular
Disease Risk and Prognosis in Elderly Women With Abdominal Aortic Calcification
on Lateral Spine Images Captured During Bone Density Testing: A Prospective
Study.” J Bone Miner Res, vol. 33, no. 6, pp. 1001-1010, 2018. View at: Publisher Site | PubMed
[9] Kevin
Leow, Pawel Szulc, John T Schousboe, et al. “Prognostic Value of Abdominal
Aortic Calcification: A Systematic Review and Meta-Analysis of Observational
Studies.” J Am Heart Assoc, vol. 10, no. 2, pp. e017205, 2021. View at: Publisher Site | PubMed
[10]
Daizo Ishii, Shigeyuki Sakamoto, Takahito Okazaki,
et al. “Abdominal Aortic Calcification Volume Is Associated with Wall
Enhancement of Unruptured Intracranial Aneurysm.” World Neurosurg, vol.
167, pp. e122-e126, 2022. View at: Publisher Site | PubMed
[11]
Michael H Criqui, Julie O Denenberg, Robyn L
McClelland, et al. “Abdominal aortic calcium, coronary artery calcium, and
cardiovascular morbidity and mortality in the Multi-Ethnic Study of
Atherosclerosis.” Arterioscler Thromb Vasc Biol, vol. 34, no. 7, pp.
1574-1579, 2014. View at: Publisher Site | PubMed
[12]
Yoshikazu Miwa, Motoo Tsushima, Hisatomi Arima, et
al. “Pulse pressure is an independent predictor for the progression of aortic
wall calcification in patients with controlled hyperlipidemia.” Hypertension,
vol. 43, no. 3, pp. 536-540, 2004. View at: Publisher Site | PubMed
[13]
John T Schousboe, Brent C Taylor, Douglas P Kiel,
et al. “Abdominal aortic calcification detected on lateral spine images from a
bone densitometer predicts incident myocardial infarction or stroke in older
women.” J Bone Miner Res, vol. 23, no. 3, pp. 409-416, 2008. View at: Publisher Site | PubMed
[14]
Maha Almohamad, Elizabeth Krall Kaye, Dania Mofleh,
et al. “The association of sedentary behaviour and physical activity with
periodontal disease in NHANES 2011-2012.” J Clin Periodontol, vol. 49,
no. 8, pp. 758-767, 2022. View at: Publisher Site | PubMed
[15]
Heze Fan, Ying Xiong, Yuzhi Huang, et al. “Coffee
consumption and abdominal aortic calcification among adults with and without
hypertension, diabetes, and cardiovascular diseases.” Nutr Metab Cardiovasc
Dis, vol. 33, no. 10, pp. 1960-1968, 2023. View at: Publisher Site | PubMed
[16]
Jessica Pepe, Daniele Diacinti, Emanuela Fratini,
et al. “High prevalence of abdominal aortic calcification in patients with
primary hyperparathyroidism as evaluated by Kauppila score.” Eur J
Endocrinol, vol. 175, no. 2, pp. 95-100, 2016. View at: Publisher Site | PubMed
[17]
Wei Chen, Ruth Eisenberg, Wenzhu B Mowrey, et al.
“Association between dietary zinc intake and abdominal aortic calcification in
US adults.” Nephrol Dial Transplant, vol. 35, no. 7, pp. 1171-1178,
2020. View at: Publisher Site | PubMed
[18]
Cheng-Hsuan Tsai, Lian-Yu Lin, Yen-Hung Lin, et al.
“Abdominal aorta calcification predicts cardiovascular but not
non-cardiovascular outcome in patients receiving peritoneal dialysis: A
prospective cohort study.” Medicine (Baltimore), vol. 99, no. 37, pp.
e21730, 2020. View at: Publisher Site | PubMed
[19]
Qingyu Niu, Yang Hong, Cho-Hao Lee, et al.
“Abdominal aortic calcification can predict all-cause mortality and CV events
in dialysis patients: A systematic review and meta-analysis.” PLoS One,
vol. 13, no. 9, pp. e0204526, 2018. View at: Publisher Site | PubMed
[20]
Yosuke Tatami, Yoshinari Yasuda, Susumu Suzuki, et
al. “Impact of abdominal aortic calcification on long-term cardiovascular
outcomes in patients with chronic kidney disease.” Atherosclerosis, vol.
243, no.2, pp. 349-355, 2015. View at: Publisher Site | PubMed
[21]
Masaki Ohya, Haruhisa Otani, Keigo Kimura, et al.
“Vascular calcification estimated by aortic calcification area index is a
significant predictive parameter of cardiovascular mortality in hemodialysis
patients.” Clin Exp Nephrol, vol. 15, no. 6, pp. 877-883, 2011. View at:
Publisher Site | PubMed
[22] Chi Wang, Yu Yuan, Mengyi Zheng, et al. “Association of Age of Onset of Hypertension With Cardiovascular Diseases and Mortality.” J Am Coll Cardiol, vol. 75, no. 23, pp. 2921-2930, 2020. View at: Publisher Site | PubMed
[23] In-Jeong Cho, Hyuk-Jae Chang, Hyung-Bok Park, et al. “Aortic calcification is associated with arterial stiffening, left ventricular hypertrophy, and diastolic dysfunction in elderly male patients with hypertension.” J Hypertens, vol. 33, no. 8, pp. 1633-1641, 2015. View at: Publisher Site | PubMed