Materials Innovations
Full Html
Vol 1 Issue 2
Synthesis, Characterization and Applications of Plant Based Silver for Effective Removal of Chromium(VI) from Contaminated Water
Pages: 56-63
Doi:
Doi URL: http://doi.org/10.54738/MI.2021.1203
Amara Dar ?? 1 , Hira Ashfaq 2 , Lubna Sherin 2 , Muhammad Salman 1 , Jamil Anwar 1
1 School of Chemistry, University of Punjab, Lahore, 54000, Pakistan
2 COMSATS University Islamabad, Lahore Campus , Lahore, 54000, Pakistan
Use of plant materials in the synthesis of plant nanocomposites gives rise to ecofriendly methods that desist from the addition of toxic chemicals into the environment. The present study is focused on the synthesis of silver (Ag) nanocomposites using powdered material of different medicinally important reported plants and the investigation of their water decontamination potential. Heterophragma adenophylla (Ha) capsules and Syzygium cumini (Sc) seed powders were used for the synthesis of silver nanocomposites. The synthesized nanocomposites were characterized using X ray diffraction pattern (XRD) and Fourier transform infrared spectroscopy (FT-IR). The calculated nanosizes of Ag-Sc and Ag-Ha composites were 4.6 nm and 21.81 nm respectively. FT-IR further confirms the presence of functional groups that can provide sites for the nanoparticles to bind with. Furthermore, the synthesized nanocomposites were used in the treatment of waste water by conducting batch mode adsorption study, for the removal of chromium (VI). Various parameters like time of contact, adsorbent dose and pH were optimized for the effective removal of the metal. Equilibrium modeling revealed that Langmuir adsorption model best fitted with the removal of chromium using silver based Sc-nanocomposites (qmax = 8.550). Pseudo second order kinetics model (R2 = 0.999 and 1.00 for Ag-Ha and Ag-Sc, respectively) explained the time dependent removal of chromium.
Keywords
Syzygium cumini seeds, Heterophragma adenophylla, Nanocomposites
In last few years nanotechnology is budding rapidly because of the variety of applications of nanomaterials due to unique properties that owe to their nano sizes 1. The field includes the synthesis of nanomaterials, characterization, and their potential applications. For years wet chemical processes have been used for the manufacturing of nanomaterials that involve the use of toxic and flammable chemicals and may lead to the synthesis of toxic byproducts 2. Nanomaterials have a direct or indirect impact on human life as the nanomaterials are present in the objects of daily use like sunscreens, toothpastes, coatings of ceramic materials that are used in making sanitary wares, medicine coatings and in food products.3 Nobel metal nanomaterials are widely used in products that directly come in contact with human body. This factor leads to the requirement of designing ecofriendly procedures that don’t involve the use of toxic chemicals.4, 5 For the synthesis of nanomaterials, a number of ecofriendly and cost effective biosynthetic methods have been introduced which include the use of microorganisms like beneficial bacterial species6 or fungal moieties7, 8 and extracts of different medicinally important plants9, 10, 11 that have gained more interest than complex chemical processes 11. A lot of studies has been carried out on the use of plant extracts in nanosynthesis.9, 2, 5, 10, 12
Syzygium Cumini (Jamun Fruit) has higher content of antioxidants, vitamins, tannin and anthocyanins13, 14 and antimicrobial and antioxidant activities of jamun seeds are efficient. Apart from these, jamun seeds are valuable in anticancer skin treatments, gastrointestinal problems antidiabetic, carioprotective, immunodulatory, neuro psychopharmacological and hypolipidemic property. The noble metal nanoparticles especially the silver nanoparticles (AgNPs) offers charismatic properties of dye removal 15, inhibitor to various microorganisms 16, effective against multi-drug resistant bacteria 16, 17, low toxicity 12, antioxidant 17, anti-inflammatory and a long range of medical applications18.
Water contamination with heavy metals has reached on the alarming level due to geological reasons and anthropogenic activities. As a result of which, heavy metals are getting accumulated in edible items and have entered in food chain. Electroplating, paints and pigments, metal processing, steel fabrication and canning industry are the sources of chromium contamination in water which leads to the toxic effects of epigastric pain, nausea, vomiting, severe diarrhoea, lung tumors, carcinogenic, mutagenic, teratogenic. Different techniques that can be used for heavy metal removal from water are adsorption, chemical precipitation, using natural zeolites chemical coagulation, flocculation, ion exchange, membrane process and ultra-filtration and electrochemical methods. The use of biosorbents as adsorbents is a cost effective way to remove heavy metals in low concentrations. In the present work, nanocomposites of silver are synthesized using syzygium cumini seed powder and are used as biosorbents in the removal of chromium. Synthesized nanocomposites were analyzed using X-ray diffraction analysis pattern and Fourier transform infrared spectroscopy and decontamination studies were carried out using Atomic absorption spectroscopy.
Syzygium cumini (Sc) fruit was purchased from the local market and pulp was removed. Seeds were washed and dried and crushed using mortar and pestle. Crushed pieces were then oven dried and further grinded to pass through 80 mesh size (American society for testing and materials).
Heterophragma adenophylla (Ha) capsules were collected from the gardens of University of the Punjab, Quaid-e-Azam Campus, Lahore. The material was washed thoroughly with water and dried. The dried capsules were cut into small pieces and put in oven at 70 ?C for further drying. Using mortar and pestle the dried capsule were crushed to pass through 80 mesh size.
Fine powder 10 g of Sc seeds and Ha capsule were added in a beaker separately along with 1g of silver nitrate, followed by the addition of 10 g of oleic acid. All the contents were mixed well using glass stirrer. Then the mixture was heated on a burner for 14-16 minutes with continuous stirring to ensure the proper mixing of ingredients while reacting. After that the mixture was cooled at room temperature and then washed with CCl4 for 3 to 4 times and filtered. The sample was air dried at room temperature. The synthesized nanocomposites were labeled Ag-Sc and Ag-Ha and stored properly in air tight glass sample bottles.
Removal of chromium (VI) was studied by optimizing the factors like, time of contact, adsorbent dose, pH and initial solution concentration to sort out the suitable conditions for adsorption. Batch experiments were carried out in 250 ml conical flasks. Effect of one factor at a time was manipulated keeping the others constant. In order to check the effect of adsorbent dose the amount of nanocomposites was varied from 0.2-1.0g. For verifying the effect of pH, the solution pH was changed from 4-8 using digital pH meter (pH/mV/TEMP meter P25).
Isothermal models were used to evaluate the equilibrium data for removing chromium using nanocomposites in the range of 5-30 ppm. Pseudo first and second order kinetics model were applied for the evaluation of rate of adsorption of chromium at time of contact ranging 10-70 min. After batch experiment under certain conditions the removal of chromium was studied using AAS. Adsorption capacity was calculated using the following equation;
1 qe=Co-Cem*V
Where, Co (mg/L) is initial concentration, Ce (mg/L) is final concentration at equilibrium, m (g) and V(L) of the solution under study, respectively.
Synthesized nanocomposites were characterized by using various techniques as; XRD and FT-IR.
Figure 1 shows the XRD pattern of Ag-Sc. The diffraction intensities were studied from 5° to 80° at 2? angles. Four diffraction peaks were appeared in XRD pattern at 38.34o, 44.52o, 64.68o and 77.39o corresponding to Bragg reflections (111), (200), (220) and (311) cubic planes of Ag are observed and compared with COD (Crystallography Open Database), silver file No. 96-110-0137. AgNCs with Sc seed powder showed 2-theta values of 38.34o, 44.52o, 64.68o and 77.39o with particle size 3.83, 3.93, 5.56 and 5.07 nm respectively, calculated by Scherrer equation. An average calculated particle size of Ag-Sc nanocomposite is 4.6 nm.

Figure 1: XRD spectra of Ag-Sc
Figure 2 shows the XRD pattern of Ag-Ha. The diffraction intensities were studied from 30° to 80° at 2? angles. Four diffraction peaks were appeared in XRD pattern at 38.53o, 43.66o, 64.91o and 77.61o corresponding to Bragg reflections (111), (200), (220) and (311) cubic planes of Ag are observed and compared with COD (Crystallography Open Database), silver file No. 96-110-0137. Ag-Ha showed 2-theta values of 38.53o, 43.66o, 64.91o and 77.61o with particle size 11.28, 30.63, 30.27 and 15.08 nm respectively, calculated by Scherrer equation. An average calculated particle size of Ag-Ha nanocomposite is 21.81 nm.

Figure 2: XRD spectra of Ag-Ha
FT-IR spectra of both raw seed powder of Syzygium cumini (Sc) and Ag nanocomposite with Sc seed powder (Ag-Sc) was compared. The Sc showed a strong and broad peak at 3269.96 cm-1 which depicts –OH stretching frequency and describes the presence of alcoholic group. The peak is shifted to 3252.91 cm-1 in the spectra of Ag- Sc. Peak shift from 1714.94 cm-1 in Sc spectra to 1711.34 cm-1 in Ag- Sc refers to the C=O stretching frequency which depicts the presence of carboxylic group. Medium peak shift from 1337.38 cm-1 in Sc spectra to 1317.27 cm-1 in Ag- Sc refers to the –OH bending frequency which depicts the presence of phenol. Presence of a medium peak at 1204.75 cm-1 in Sc spectra which shifts to 1210.78 cm-1 in Ag- Sc refers to the C-N stretching frequency which depicts the presence of amine. The presence of C=O functional group along with C-N may infer the presence of amide group as proteins are also the part of Sc seed. It is well known that protein can bind to Ag nanoparticles through free amino groups in the proteins and therefore stabilization of Ag nanoparticles by surface bound proteins is a possibility19. All the functional groups that are shown in spectra have the potential to carry silver nanoparticles on them.
The FT-IR spectra of both raw capsule powder Heterophargma adenophyla (Ha) and Ag nanocomposite with Ha capsule powder was compared. The presence of carboxylic acid is predicted by C=O stretching frequency (3300-2500 cm-1) and peak shift from 3272.81 cm-1 in HaC spectra to 3289.10 cm-1. Broad peak at 2921.15 cm-1 in Ha represents N-H stretching (amine salts) which shifts to 2923.33 cm-1 (a little sharp) in Ag-Ha spectra. Peak in Ha at 1731.78 cm-1 represents C=O stretching (aldehyde) shifts to 1714.78 cm-1 in Ag-Ha spectra represents C=O stretching (cyclohexanones/ cyclopentanones). The S=O stretching (sulfones) is shown by peak at 1317.84 cm-1 in Ha which shifts to 1318.26 cm-1 (sharp peak) in Ag-Ha. Alkyl aryl ethers are represented by C-O stretching (1275-1200 cm-1) at 1237.51 in Ha which shifts to 1233.58 cm-1 in Ag-Ha. Fluoro compounds are also indicated by the strong peaks at 1017.33 cm-1 in Ha shifting to 1020.35 cm-1 (C-F stretching at 1400-1000 cm-1). The presence of free alcohols is shown by O-H stretching at 3596.70 cm-1 in Ha shifting to 3597.39 cm-1. The presence of these active groups in FT-IR spectra and the peak shifts represents that these groups can provide the substrate to which Ag nanoparticles can bind.
Effect of time of contact was studied by varying time from 10-70 minutes, using 0.2 g of the adsorbent dose for both synthesized nanocomposites. It was revealed that in case of Ag-Ha equilibrium was established after 60 minutes with the maximum removal efficiency of 80.13%. Whereas, in case of Ag-Sc, it took 40 minutes for equilibrium to be established. After nearly all the adsorption sites were covered no further increase in the adsorption of chromium was noticed as shown in Figure 3

Figure 3: % Removal efficiency versus time of contact (min)
Ag-Ha and Ag-Sc were used to study the effect of adsorbent dose for the removal of Cr. This parameter was studied by taking 0.2-1.0 g of each of the composite separately in 50 ml solution of chromium with concentration of 25 ppm. Increased surface area of nano-composites provided more adsorption sites and effectively trapped the chromium from aqueous medium. At optimized conditions of time, when parameter of adsorbent dose was carried out maximum removal efficiency for Ag-Ha and Ag-Sc was obtained at 0.8 g. It was revealed that while increasing the adsorbent dose more and more chromium was attached to the adsorption sites and after the equilibrium was established no further increase was observed as shown in Figure 4.

Figure 4: % Removal efficiency versus adsorbent dose (g)
By varying the pH of the solution, increases the availability of adsorption sites on the surface of nanocomposites. It may activate different functional groups present on the surface of the nanocomposites material. These activated functional groups provide the adsorption sites for the attachment of chromium ions from the solution to these sites resulting in better removal of these species from aqueous medium. Effect of pH was studied by varying pH from acidic to basic medium (4-8), as shown in Figure 5. It was found that maximum removal efficiency for Ag-Ha and Ag-Sc was obtained in acidic medium i.e 85.68% and 86.65% at pH 4 respectively as shown in Figure 3. In acidic conditions Cr (VI), exists as an oxy-anion, Cr2O7 -2, HCrO4 -2, CrO4 -2. On the other hand Cr(III) ions behave as a cation Cr(OH)+2, Cr(OH)+, Cr3(OH)+5 with an overall positive charge20 at pH 4 the removal efficiency of Cr using nanocomposites was found to be maximum. That might be attributed to the availability of suitable sites for the removal of chromium from solution.
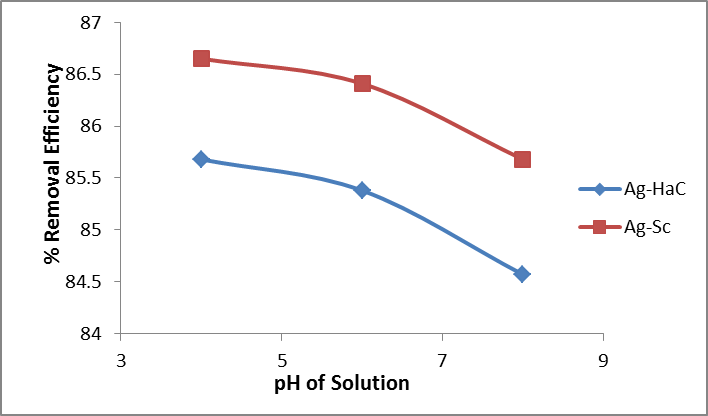
Figure 5: % Removal efficiency versus pH of solution
Adsorption isotherm is helpful to understand the adsorption mechanism before larger scale execution of the process.21 Adsorption equilibrium was studied using the isotherms i.e. Langmuir, Freundlich and Temkin. Linear approach has been opted to elucidate the adsorption mechanism of the data.
Langmuir model describes the monolayer adsorption of chromium onto the adsorbent surface which in present case is nanocomposites.22 Furthermore, the maximum adsorption capacity of the material under study can also be calculated from Langmuir adsorption isotherm model. Correlation coefficient values R2 of the data gave better fit with this model for the removal of chromium using nanocomposites. Out of the two used, Ag-Sc removed chromium more efficiently following the Langmuir adsorption isotherm. The maximum value of Qmax was observed in case of Ag-Sc, which showed its best removal efficiency among the selected samples. Further the value of RL in Langmuir Isotherm model showed it is a favourable adsorption using both types of nanocomposites.
Langmuir isotherm was plotted using equation;
2 1q= 1bqmCe+ 1qm
Where q (mg/g) is the quantity of metal ion adsorbed, Ce (ppm) is the remaining metal ion concentration after adsorption, qm (mg/g) and b (L/g) are Langmuir isotherm parameters. The value of q was calculated by the equation;
3 q=Co- Cem*V
Langmuir parameter (b) is used for determining a dimensionless separation factor constant RL by the equation;
4 RL= 1(1+bCo)
Its value is the indication of favorability of biosorption process if it lies between 0 and 1.
Table 1: isothermal parameters for the removal of chromium using nanocomposites
|
Sample |
R 2 |
Q max |
b (L/g) |
R L |
R 2 |
n |
K f (mg/g) |
R 2 |
B T (K /mol) |
K T (mg/g) |
|
Ag-Ha |
0.9169 |
4.006 |
1.663 |
0.0567 |
0.8893 |
2.359 |
2.181 |
0.8531 |
2.295 |
10.684 |
|
Ag-Sc |
0.9235 |
8.550 |
0.179 |
0.3584 |
0.8833 |
1.433 |
1.366 |
0.8706 |
1.440 |
2.303 |
Freundlich adsorption isotherm model elucidate the multilayer adsorption pattern on the surface of adsorbent material. Heterogeneous surface for adsorption of chromium on nanocomposites will be observed.22 Value of ‘n’ for chromium removal by both nanocomposites material is 1.433 (Ag-Sc) and 2.53 (Ag-Ha) respectively, indicating the feasibility of heterogeneous adsorption pattern following Freundlich isotherm. Greater value of Kf(Freundlich constant) showed that Cr adsorb best on the nanocomposites surface. The value of “n” described the extent of adsorption of Cr on nanocomposites. For Ag-Ha, the value of Freundlich adsorption coefficient is in range of 2-12 which showed that multilayer adsorption pattern exists in case of Ag-Ha than Ag-Sc. Freundlich isotherm was plotted using equation;
5 logq=logKF+ 1nlogCe
Where KF and n are Freundlich model constants and their values can be calculated from regression analysis of linear plot of log q versus log Ce. The value of n describes the following;
Table 2: Value of "n"
|
Value of “n” |
Quality of adsorption |
|
2-10 |
Good biosorption |
|
1-2 |
Moderate biosorption |
|
Less than 1 |
Poor biosorption |
In case of temkin adsorption isotherm model Heat of adsorption of the adsorbing species in the layers falls linearly with surface coverage because of adsorbent-adsorbate interaction. Data revealed that Cr adsorb on the surface of Ag-Sc and Ag-Ha through physiosorption because BT < 8. In all the cases, these nanocomposites can be regained because of weak interactions. Isothermal parameter for above all discussed isothermal models is reported in table 1. Temkin model was plotted using following equation;
6 q=BTlnCe+ BTlnKT
7 BT = RT/b
where T (K) is absolute temperature, R (8.314 J/mol) is universal gas constant, KT (L/mg)is the equilibrium binding constant and BT is related with heat of adsorption. Temkin constants are obtained by regression analysis of linear plots of q versus lnCe.
Pseudo first order kinetics model is based on the assumption that the adsorption rate is directly proportional to the number of available sites
Mathematical forms of pseudo first and second order reactions are given in equation;
8 ln (qe - qt) = lnqe - k1t
9 tqt= 1k2qe2+ tqe
Using linear equations adsorption of chromium onto nanocomposite surface was studied using equation 8 and 9. It was applied to equilibrium data drawn from the time factor and parameters were calculated and mentioned in table 2. Pseudo second order model is based on the assumption that the adsorption rate is directly proportional to the square of number of binding sites present on the surface of adsorbent.23 Equilibrium data drawn from the experiment was shown in table 2.
The adsorption study for the removal of chromium using silver nanocomposites followed pseudo second order kinetics as the metal ion solution was in excess as compared to the adsorbent dose. The parameters for both pseudo first order and pseudo second order reaction was calculated. It showed that the value of R2 pseudo second order kinetics is more close to unity so the present study favoured pseudo second order kinetic model (table 3).
Table 3: Pseudo First Order Kinetic Model Parameters
|
Sr.no. |
Sample |
Pseudo First order kinetics |
Pseudo second order kinetics |
||||
|
R2 |
qe (mg/g) calculated |
K1 (min-1) |
R2 |
qe (mg/g) calculated |
K2 (min-1) |
||
|
1 |
Ag-Ha |
0.9899 |
0.001 |
0.0783 |
0.9995 |
8.0313 |
0.148 |
|
2 |
Ag-Sc |
0.9615 |
69.238 |
0.0234 |
1.00 |
3.275 |
0.5860 |
The study concluded that using plant powders composite with Ag nanoparticles have shown better water decontamination potential as compared to simple plant powders. The results of atomic adsorption spectroscopy show that these samples can be used as biosorbents. Optimized condition of adsorbent dose for Ag-Ha, and Ag-Sc is 0.8 g, time of contact for Ag-Ha is 60 minutes, and Ag-Sc is 40 minutes and pH for Ag-Ha is 4 whereas for Ag-Sc, it is 6. Isothermal studies using different models reveals that Langmuir isotherm fits best with the experimental data. It describe that the adsorption is favourable. In Freundlich isotherm, the value of “n” describes the extent of adsorption of Cr on nanocomposites. For Ag-Ha, the value of “n” is in range of 2-12 which showed that there is good adsorption and in case of Ag-Sc the adsorption is moderate as the value of “n” is below 2. Temkin isotherm, reveals that Cr adsorb on the surface of Ag-Sc and Ag-Ha through physiosorption because BT < 8. In all the cases, the biosorbent can be regained because of weak interactions. Kinetic modelling shows that the value of R2 in pseudo second order kinetics is more close to unity so the present study follows pseudo second order kinetic model. These nanocomposites proved good for the removal of chromium from water. Plant based material have lessen the usage of chemicals in the synthesis of nanoparticles. In the meanwhile, nanocomposites in corporation with plant based adsorbent are eco-friendly and inexpensive which leads towards the application of green chemistry in the environment.24
Roco, M. C. & Bainbridge, W.S. . 2005. Societal implications of nanoscience and nanotechnology: Maximizing human benefit. Journal of Nanoparticle Research 7(1):1–13.
Jain, D, Daima, H, Kachhwala, S & Kothari, S . 2009. Synthesis of Plant-Mediated Silver Nanoparticles using Papaya Fruit Extract and Evaluation of their Anti Microbial Activities. Digest Journal of Nanomaterials and Biostructures 4:557–563.
Hoet, M, Brüske-Hohlfeld, I & Salata, O . 2004. Nanoparticles - known and unknown health risks. Journal of Nanobiotechnology 2:12.
Song, Jae Yong, Jang, Hyeon-Kyeong & Kim, Beom Soo . 2009. Biological synthesis of gold nanoparticles using Magnolia kobus and Diopyros kaki leaf extracts. Process Biochemistry 44(10):1133–1138.
Banerjee, J & N T . 2011. Biosynthesis of silver nanoparticles from Syzygium cumini (L.) seed extract and evaluation of their in vitro antioxidant activities. Digest Journal of Nanomaterials and Biostructures6:961–968.
Joerger, R., Klaus, T. & Granqvist, C. G. . 2000. Biologically Produced Silver-Carbon Composite Materials for Optically Functional Thin-Film Coatings. Advanced Materials 12(6):407–409.
Shankar, S.S., Ahmad, A. & Sastry, M. . 2003. Geranium Leaf Assisted Biosynthesis of Silver Nanoparticles. Biotechnology Progress 19(6):1627–1631.
Khan, Azhar U., Malik, Nazia, Khan, Masudulla, Cho, Moo Hwan & Khan, Mohammad Mansoob . 2018. Fungi-assisted silver nanoparticle synthesis and their applications. Bioprocess and Biosystems Engineering41(1):1–20.
Mittal, Amit Kumar, Bhaumik, Jayeeta, Kumar, Sanjay & Banerjee, Uttam Chand . 2014. Biosynthesis of silver nanoparticles: Elucidation of prospective mechanism and therapeutic potential. Journal of Colloid and Interface Science 415:39–47.
Pirtarighat, Saba, Ghannadnia, Maryam & Baghshahi, Saeid . 2019. Green synthesis of silver nanoparticles using the plant extract of Salvia spinosa grown in vitro and their antibacterial activity assessment. Journal of Nanostructure in Chemistry 9(1):1–9.
Logeswari, Peter, Silambarasan, Sivagnanam & Abraham, Jayanthi . 2015. Synthesis of silver nanoparticles using plants extract and analysis of their antimicrobial property. Journal of Saudi Chemical Society19(3):311–317.
Saiqa Ikram, Shakeel Ahmed . 2015. Silver Nanoparticles: One Pot Green Synthesis Using Terminalia arjuna Extract for Biological Application. Journal of Nanomedicine & Nanotechnology 06(04).
Chandrasekaran, M & Venkatesalu, V . 2004. Antibacterial and antifungal activity of Syzygium jambolanum seeds. Journal of Ethnopharmacology 91(1):105–108.
Ghosh, Payel, Pradhan, Rama, Mishra, Sabyasachi, Singh, Avinash & Kar, Abhijit . 2017. Physicochemical and Nutritional Characterization of Jamun (Syzygium Cuminii) Current Research in Nutrition and Food Science Journal. Enviro Research Publishers 5:25–35 https://dx.doi.org/10.12944/crnfsj.5.1.04
N, Khatoon & M, Sardar . 2017. Efficient Removal of Toxic Textile Dyes using Silver Nanocomposites. Journal of Nanosciences: Current Research 02(03):1000113.
Raheman, Farkanda, Deshmukh, Shivaji, Ingle, Avinash, Gade, Aniket & Rai, Mahendra . 2011. Silver Nanoparticles: Novel Antimicrobial Agent Synthesized from an Endophytic Fungus Pestalotia sp. Isolated from Leaves of Syzygium cumini (L) Nano Biomedicine and Engineering 3(3):174–178.
Reddy, N. Jayachandra, Nagoor Vali, D., Rani, M. & Rani, S. Sudha . 2014. Evaluation of antioxidant, antibacterial and cytotoxic effects of green synthesized silver nanoparticles by Piper longum fruit. Materials Science and Engineering: C 34:115–122.
Prabhu, Sukumaran & Poulose, Eldho K . 2012. Silver nanoparticles: mechanism of antimicrobial action, synthesis, medical applications, and toxicity effects. International Nano Letters 2(1):32.
Logeswari, P, Silambarasan, S & Abraham, J . 2013. Ecofriendly synthesis of silver nanoparticles from commercially available plant powders and their antibacterial properties. Scientia Iranica 20(3):1049–1054.
Gode, Fethiye & Pehlivan, Erol . 2005. Adsorption of Cr(III) ions by Turkish brown coals. Fuel Processing Technology 86(8):875–884.
Amode, Jeminat O., Santos, Jose H., Md. Alam, Zahangir, Mirza, Aminul H. & Mei, Chan C. . 2016. Adsorption of methylene blue from aqueous solution using untreated and treated (Metroxylon spp.) waste adsorbent: equilibrium and kinetics studies. International Journal of Industrial Chemistry 7(3):333–345.
Khurram, Asif Masaud, Farooq, Umar, Athar, Muhammad Makshoof & Salman, Muhammad . 2019. Biosorption of Cd(II) ions from its aqueous solutions using powdered branches of Trifolium resupinatum: equilibrium and kinetics. Green Chemistry Letters and Reviews 12(3):217–224.
Salman, Muhammad, Athar, Makshoof, Farooq, Umar, Rauf, Sadaf & Habiba, Umy . 2014. A new approach to modification of an agro-based raw material for Pb(II) adsorption. Korean Journal of Chemical Engineering 31(3):467–474.
Sharma, S. & Bhattacharya, A. . 2017. Drinking water contamination and treatment techniques. Applied Water Science 7(3):1043–1067.
Keywords: Batch mode, Syzygium cumini seeds, Heterophragma adenophylla, Nanocomposites
Materials Innovations (MI) is an interdisciplinary journal devoted to significant experimental and theoretical findings on the synthesis, structure, charachterization, processing and applications of materials. Materials Innovations is dedicated to publishing peer reviewed novel, cutting edge reports of broad interest to the materials science community.