the Creative Commons Attribution 4.0 License.
the Creative Commons Attribution 4.0 License.
 | 17 Nov 2021
Ground-penetrating radar signature of Quaternary faulting: a study from the Mt. Pollino region, southern Apennines, Italy
Cristina Pauselli
Harry M. Jol
Francesco Brozzetti
With the aim of unveiling evidence of Late Quaternary faulting, a series of ground-penetrating radar (GPR) profiles were acquired across the southern portion of the Fosso della Valle–Campotenese normal fault (VCT), located at the Campotenese continental basin (Mt. Pollino region) in the southern Apennines active extensional belt (Italy). A set of 49 GPR profiles, traced nearly perpendicular to this normal fault, was acquired using 300 and 500 MHz antennas and carefully processed through a customized workflow. The data interpretation allowed us to reconstruct a pseudo-3D model depicting the boundary between the Mesozoic bedrock and the sedimentary fill of the basin, which were in close proximity to the fault. Once the GPR signature of faulting was reviewed and defined, we interpret near-surface alluvial and colluvial sediments dislocated by a set of conjugate (W- and E-dipping) discontinuities that penetrate inside the underlying Triassic dolostones. Close to the contact between the continental deposits and the bedrock, some buried scarps which offset wedge-shaped deposits are interpreted as coseismic ruptures, subsequently sealed by later deposits. Our pseudo-3D GPR dataset represented a good trade-off between a dense 3D-GPR volume and conventional 2D data, which normally requires a higher degree of subjectivity during the interpretation. We have thus reconstructed a reliable subsurface fault pattern, discriminating master faults and a series of secondary splays. This contribution better characterizes active Quaternary faults in an area which falls within the Pollino seismic gap and is considered prone to severe surface faulting. Our results encourage further research at the study site, whilst we also recommend our workflow for similar regions characterized by high seismic hazard and scarcity of near-surface geophysical data.
- Article
(27643 KB) - Full-text XML
- BibTeX
- EndNote


A “seismic gap” is an area surrounded by regions struck by large earthquakes in historical or recent times. Such earthquake-free areas are characterized by the presence of seismogenic faults, whose past activity or possible quiescence is inferred on the basis of morpho-structural and/or paleoseismological data. The “seismic gaps” (McCann et al., 1979) show an apparent lack of historical seismicity but are candidate regions for the occurrence of large earthquakes in the near future (Mogi, 1979; Plafker and Galloway, 1989; Cinti et al., 1997; Galadini and Galli, 2003). A recent example of a seismic gap “filled” by strong earthquakes is the Mt. Vettore area (central Apennines) during the 2016–2017 seismic sequence (Chiaraluce et al., 2017; Barchi et al., 2021 and references therein). Following the extensive coseismic ruptures mainly generated by the Mw = 6.5 “Norcia” mainshock (Villani et al., 2018; Brozzetti et al., 2019; Testa et al., 2019), this area is currently an ideal laboratory for many conventional and innovative geoscience disciplines and applications (e.g., Xu et al., 2017; Porreca et al., 2018; Brozzetti et al., 2020; Cirillo, 2020; Ferrario et al., 2018; Ercoli et al., 2020; Michele et al., 2020; Porreca et al., 2020; Ferrarini et al., 2021; Pucci et al., 2021; Sapia et al., 2021; Villani et al., 2021). In fact, although the area is characterized by a complex alignment of normal faults, no important earthquakes were reported over the past ∼ 1500 years before this seismic crisis (Cinti et al., 2019; Galli et al., 2019, 2020). Former geological and geomorphological studies suggested the possible occurrence of Quaternary faulting (Calamita et al., 1992; Brozzetti and Lavecchia, 1994; Barchi et al., 2000), which was successively confirmed by paleoseismological (Galadini and Galli, 2003) and GPR surveying (Ercoli et al., 2013a, 2014). These studies revealed the occurrence of strong paleo-earthquakes and suggested that the Mt. Vettore master fault was “silent” but prone to causing future seismic events. However, invasive trenching due to complex logistics, environmental restrictions, high costs, and the need for authorizations cannot be applied systematically in many locations. Thus, Quaternary faults and associated basins characterized by an unsatisfactory definition of the seismotectonic framework have to be investigated with geophysical techniques. For all the above noted reasons, and since the Mt. Vettore case may represent an analogue of similar seismic gaps, the southernmost Apennines were studied through a dedicated research programme (Agreement INGV-DPC 2012–2013 and 2014–2015, Project S1 – Base-knowledge improvement for assessing the seismogenic potential of Italy, Brozzetti et al., 2015; Pauselli et al., 2015) aiming to improve the knowledge base of seismogenic structures. In the research, focused also on the Calabrian region (southern Italy) during the 2012–2015 period, structural geology, geophysical, and paleoseismological data were successfully acquired on the Mt. Pollino and Castrovillari fault systems (northern Calabria), providing evidence of Late Quaternary activity (Ercoli et al., 2013b; Cinti et al., 2015a; Ercoli et al., 2015; Brozzetti et al., 2017b). This area, which is considered one of the most important seismic gaps in southern Italy, extends from the Mercure basin to the north until Campotenese basin and Castrovillari plain to the south, all characterized by Late Quaternary continental syn-tectonic sedimentation (Fig. 1a–c).

Figure 1Location maps of the study site (DTM sources: TINITALY by Tarquini et al., 2012, and by Regione Calabria – http://geoportale.regione.calabria.it/opendata, last access: 11 June 2021, under license IODL 2.0. – https://www.dati.gov.it/iodl/2.0/, last access: 11 June 2021): (a) image illustrating the southern Italian peninsula with the regional faults pattern and the historical strong earthquakes (Rovida et al., 2020); (b) map showing the studied region with local faults (modified after Brozzetti et al., 2017a), and epicenters (stars) and focal mechanisms of the mainshocks of the 2012–2014 seismic activity (Scognamiglio et al., 2006); (c) location of the GPR survey area within the Campotenese Quaternary basin crossing the Fosso della Valle–Campotenese (VCT) fault.
The paleoseismological trenching and radiocarbon dating document in the region the occurrence of paleo-earthquakes with 6.5<Mw<7.0 and a recurrence time interval of ∼ 1200 years (Cinti et al., 1997, 2002, 2015a, b; Michetti et al., 1997, 2000). But this high magnitude interval contrasts with the historical seismicity records, reporting a single significant Mw 5.2 event that occurred in 1693 (Tertulliani and Cucci, 2014). In the last three decades instrumental seismicity recorded only two moderate seismic activities climaxed in the Mw 5.6 Mercure (9 September 1998) and Mw 5.2 Mormanno (25 October 2012) earthquakes. The latter occurred during a long-lasting seismic activity spanning the period 2010–2014, which included more than 6000 events of Mw>1 and activated at least three individual seismogenic sources (Passarelli et al., 2015; Brozzetti et al., 2017a, Fig. 1b). The gap between the low energy release, observed during the instrumented seismic sequences, and the high seismic potential estimated for the Quaternary faults raised the question of whether even stronger earthquakes had shaken and could shake the area in the future. A recent and detailed parameterization of the Fosso della Valle–Campotenese fault (VCT in Fig. 1c) based on geo-structural and geomorphological mapping (Brozzetti et al., 2017a) as well as on seismological evidence (Totaro et al., 2014, 2015; Cirillo et al., 2021), assesses a surface length of 15 km and a depth of at least ∼ 10 km: the potential rupture area is estimated as likely to produce Mw>6.0 earthquakes. As testified by earthquakes of the last century, such magnitudes in the Apennines extensional belt generally produce coseismic surface faulting (e.g., Oddone, 1915; Pantosti and Valensise, 1990; Boncio et al., 2010; Brozzetti et al., 2019). However, Quaternary faulting for the VCT structure is currently unclear, but geological and morpho-structural data suggest this fault has played an important role in determining the geometry and the recent sedimentary evolution of the basin.
The Campotenese basin and its VCT boundary fault is an example that summarizes the aforementioned issues: (1) lack of availability of paleoseismological data as the basin is entirely located within the Mt. Pollino National Park, thus requiring prior authorization from authorities; (2) lack of availability of publicly accessible geophysical data; (3) no fresh recent surface displacements within the Holocene deposits having been observed along its trace. For all these reasons, the VCT represents an ideal case study on which to test our working method.
We have conducted an explorative GPR field campaign across a VCT sector, suggested by discontinuous and smooth geomorphic scarps, as a screening tool for the definition of its possible Quaternary displacement history. The objectives of the paper are to (i) review and describe geophysical characteristics associated with a peculiar GPR signature of faulting, and propose a reference methodological workflow; (ii) specifically check the efficiency of GPR prospecting to locate the VCT fault and to depict its subsurface pattern and spatial continuity at shallow depth; (iii) provide new data to eventually relate the occurrence of Mw>6.0 seismic events; (iv) pave the way for other local geophysical studies and identify interesting sites for future ground-truthing and/or paleoseismological trenching; (v) to be directly applicable to and have an impact on the planning of future mitigation strategies for the reduction of surface faulting risk in the nearby urbanized areas.
The Campotenese continental basin is located in the northernmost Calabria region southwest of the Mt. Pollino calcareous massif (southern Italy, Fig. 1). The bedrock of the basin consists of shallow water dolostones and limestones, Late Triassic to Middle Miocene in age, belonging to the Verbicaro tectonic unit (Ogniben, 1969; Amodio Morelli et al., 1976). It is generally referred as to the western edge of the “Apenninic Platform”, a thick (>4 km) carbonate shelf that underwent compression during the Middle–Late Miocene times and was translated over an eastern basinal domain (Lagronegro–Molise basin; Patacca and Scandone, 2007; Vezzani et al., 2010, and references therein). From the bottom to the top, the bedrock succession includes late Triassic dolostones, Cretaceous limestones, and Paleocenic–Lower Miocenic calcarenites cross-cut by the pillow lava basalts belonging to Liguride units of the northern sector of the Calabrian arc (Quitzow, 1935; Grandjaquet and Grandjaquet, 1962; Amodio Morelli et al., 1976; Ghisetti and Vezzani, 1983; Iannace et al., 2004, 2005 and 2007; Liberi et al., 2006; Filice et al., 2013, 2015; Tangari et al., 2018).
The origin of the Campotenese basin, however, is related to a set of NW–SE-striking extensional faults which, during the Middle–Late Pleistocene, displaced the contractional tectonic pile, favoring the deposition of alluvial and lacustrine sediments in a subsiding intra-mountain depression (Servizio Geologico d'Italia, 1970). This set of conjugate SW- and NE-dipping normal faults represents the local expression of the Quaternary extensional belt that develops all along the Italian peninsula, nearly parallel to the axial zone of the Apennines, from northern Tuscany to the Calabrian Arc (Brozzetti, 2011). North of Campotenese (Lucania and southern Campania), the Apennine extensional belt includes several continental basins and their boundary faults, such as the Irpinia, Vallo di Diano, Tanagro, Melandro–Pergola, and Val d'Agri (Ascione et al., 1992; Maschio et al., 2005; Amicucci et al., 2008; Villani and Pierdominici, 2010; Brozzetti, 2011; Filice and Seeber, 2019; Bello et al., 2021). To the south, it continues with the Crati graben that dissects the northern sector of the Calabrian Arc (Tortorici et al., 1995; Brozzetti et al., 2012, 2017b).
On the regional scale, the Quaternary normal fault array controls the release of major seismicity, as suggested by the distribution of supra-crustal instrumental earthquakes (INGV, 2020; ISIDe, 2007), and of the strongest historical events (Fig. 1a, Tertulliani and Cucci, 2014; Rovida et al., 2020). The recent seismic activity as well as paleo-seismological investigations claim that most of the faults bounding the Quaternary basins are seismogenic and therefore enable, in some cases, major past earthquakes to be associated with specific structures (e.g., Pantosti and Valensise, 1990; Cello et al., 2003; Spina et al., 2009; Brozzetti et al., 2009; Villani and Pierdominici, 2010). These same studies highlight that the kinematics of the Quaternary faults and the focal mechanisms of the major earthquakes are mutually consistent and are mainly compatible with an SW–NE direction of extension (RCMT and TDMT databases by Pondrelli, 2006, and Scogliamiglio et al., 2006). Other authors have recognized oblique normal–lateral fault kinematics in the surrounding regions (e.g., Rossano and Sybaris faults, Galadini et al., 2001; Cinti et al., 2015b).
The fault investigated in this work has been pointed out in more detail by Brozzetti et al. (2017a) in the frame of a larger study focussed on the Quaternary and active faults at the Calabrian–Lucanian boundary (Fig. 1a). In the region, three main sets of normal faults, with prevailing dip-slip kinematics, have been mapped: a western one, consisting of E- to NNE-dipping faults (red lines in Fig. 1b), and two other main sets of W- to SW-dipping fault segments (dark-blue and blue lines in Fig. 1b). The Rotonda–Campotenese set (ROCS) is a right-stepping en échelon master fault developed for a total length of 15 km with an average N160E strike (blue, yellow rimmed lines in Fig. 1b). ROCS is composed of two fault segments: (i) the westernmost Fosso della Valle–Campotenese fault (VCT), which extends from the southern border of the Mercure basin to the SW boundary of the Campotenese basin, and (ii) the Rotonda–Sambucoso fault (RSB), which branches out from the VCT segment in the central part of the ROCS. In the northern sector, the two segments are averagely spaced ∼ 2.5 km at the surface and linked at a depth of ∼9–10 km (Cirillo et al., 2021), cross-cutting the middle-Pleistocene ∼ E–W-striking Cozzo Vardo–Cozzo Nisco fault (CVN, light-blue line in Fig. 1b). Along the east side of the Campotenese basin, the VCT is generally buried by Holocene deposits, but its location can be inferred based on stratigraphic observations and geomorphic features, such as sharp ridge fronts, linear scarps, and slope breaks. The VCT controls the distribution and thickness of the clastic fill basin (Middle Pleistocene–Holocene in age, according to Schiattarella et al., 1994) that reaches the maximum thickness (∼30 m) in the western sector (VCT hanging wall; see borehole stratigraphy at http://sgi2.isprambiente.it/mapviewer/, last access: 11 June 2021). The spatial relationships, at surface and depth, between the Quaternary fault segments and the hypocenters of the re-located 2010–2014 seismic events (Totaro et al., 2015; Brozzetti et al., 2017a; Napolitano et al., 2020, 2021; Pastori et al., 2021) suggest that the VCT is a good candidate as a seismogenic source for the Mw 5.2 (25 October 2012) Mormanno earthquake, as well as for strong paleo-events.
Ground-penetrating radar (GPR) is a high-resolution geophysical method able to provide detailed images of the shallow sub-surface. This methodology is based on the recording of EM reflections, with operative frequencies for geoscience applications generally between 10 and 1000 MHz, depending on the transmitting and receiving antennae. The GPR reflections rise from dielectric permittivity contrasts between the subsurface targets and the surrounding media, which in geological and archeological applications typically correspond to geo-lithological changes or water content variations (Jol, 2009). In low-conductivity materials (“low-loss”), the maximum investigation depth is generally within a few tens of meters (Davis and Annan, 1989). The latter is, however, also controlled by the electrical conductivity, which for high values causes radar signal attenuation (Annan, 2001). The reflections are recorded as a function of the two-way-travel time (TWT) propagation and displayed as a 1D GPR trace. Several GPR traces displayed along a transect build up a radar profile or “radargram”, that is the 2D representation of the GPR reflections, more commonly identified as the conventional GPR output. A GPR dataset may also be provided as a 3D volume, which has been common for 25+ years in research applications and has recently become more widespread due to a wider diffusion of commercial GPR instruments equipped with arrays of antennae. The GPR is used in many research and applied fields, such as geological, sedimentological, geomorphic, and hydrogeological applications (Bristow and Jol, 2003; Jol, 2009), and also in archeological and engineering studies (Conyers, 2016; Daniels, 2004; Goodman and Piro, 2013; Utsi, 2017). In an active tectonic context, several 2D and 3D GPR studies have already imaged buried tectonic structures. These studies have shown geophysical images of faulting, supporting and/or extending observations on outcrops, boreholes, and trench data and contributed to base knowledge of seismogenic structures as well as to the seismic hazard assessment of several regions around the world. Among the pioneers, we can mention Benson (1995), Smith and Jol (1995), Busby and Merritt (1999), Cai et al. (1996), and Liner and Liner (1997), and in the successive 20 years, other 2D GPR studies were achieved across several faults worldwide (Audru et al., 2001; Demanet et al., 2001; Overgaard and Jakobsen, 2001; Bano et al., 2002; Liberty et al., 2003; Reiss et al., 2003; Slater and Niemi, 2003; Malik et al., 2007; Wallace et al., 2010; Yalciner et al., 2013; Imposa et al., 2015; Anchuela et al., 2016; Nobes et al., 2016; Matos et al., 2017; Pousse-Beltran et al., 2018; Zajc et al., 2018; Zhang et al., 2019 and Shaikh et al., 2020). In Italy, only a few GPR studies are currently available across normal faults (e.g., Salvi et al., 2003; Jewell and Bristow, 2006; Pauselli et al., 2010; Roberts et al., 2010; Ercoli et al., 2013a, 2014; Bubeck et al., 2015; Cinti et al., 2015). Over time, 2D GPR acquisitions were flanked by an increasing number of pseudo-3D or full-3D GPR studies (Grasmueck et al., 2005). Grasmueck (1996) traced the future path of three-dimensional GPR applications, providing a dense 3D GPR volume to image fractures in a Swiss quarry. The study opened the possibility of three-dimensional GPR imaging of subsurface geological structures. Successive studies extended the approach to characterize active faults in different tectonic regimes combining 2D and pseudo-3D GPR surveys (e.g., Gross et al., 2002, 2003, 2004; Green et al., 2003; Tronicke et al., 2006; McClymont et al., 2008, 2009, 2010; Vanneste et al., 2008; Christie et al., 2009; Carpentier et al., 2012a, b; Malik et al., 2012; Brandes et al., 2018). A review of the near-surface GPR faulting studies suggests some reflection characteristics as possible indicators for the detection of subsurface fractures and faults (e.g., Smith and Jol, 1995; Liner and Liner, 1997; Reiss et al., 2003; Gross et al., 2004; McClymont et al., 2008, 2010 and Bubeck et al., 2015). Among these, sharp lateral reflectivity variations, interruptions of the reflections, and the presence of hyperbolic diffractions are considered convincing evidence, as shown also by numerical simulations (Ercoli et al., 2013a; Bricheva et al., 2021). In addition, we have accounted for additional GPR indicators identified for Quaternary faulting in similar environments (Ercoli et al., 2013a, b; 2014; 2015), which are linked to the geometry of stratigraphic deposits across fault zones: (i) reflections of abrupt truncating and offsetting along sub-vertical discontinuities (especially in the case of a normal fault); (ii) reflection packages thickening as they approach the fault strands; (iii) abrupt lateral dip variation of the reflections; (iv) peculiar reflection package geometries, with contorted reflection patterns resembling “colluvial wedges”, which McCalpin (2009) defines as deposit due to “subsidence and sedimentation of the hanging wall and erosion of the morphological scarp in the footwall”; (v) localized strong GPR signal attenuation due to the presence of conductive media within the main fault zone.
Based on the research and criteria reviewed above, we carried out a near-surface interpretation of faulting based on the co-existence of most of these features along several adjacent analyzed GPR profiles. These conditions strengthen the interpretation of each profile and aid in highlighting the spatial continuity of the interpreted structures over linear distances of at least many tens, or hundreds, of meters.
3.1 GPR and GNSS survey
Three different geophysical field campaigns were carried out during 2014–2015, and a dataset of 49 GPR profiles was acquired in the southern sector of the ROCS across the VCT fault segment (Fig. 1b–c). This GPR dataset covered a buffer zone of ∼ 400 m and ∼ 200 m respectively along and across the fault strike (area of ∼8 Ha), for a total linear length of the GPR profiles of about 4100 m collected using a common offset (CO) configuration (Fig. 2).
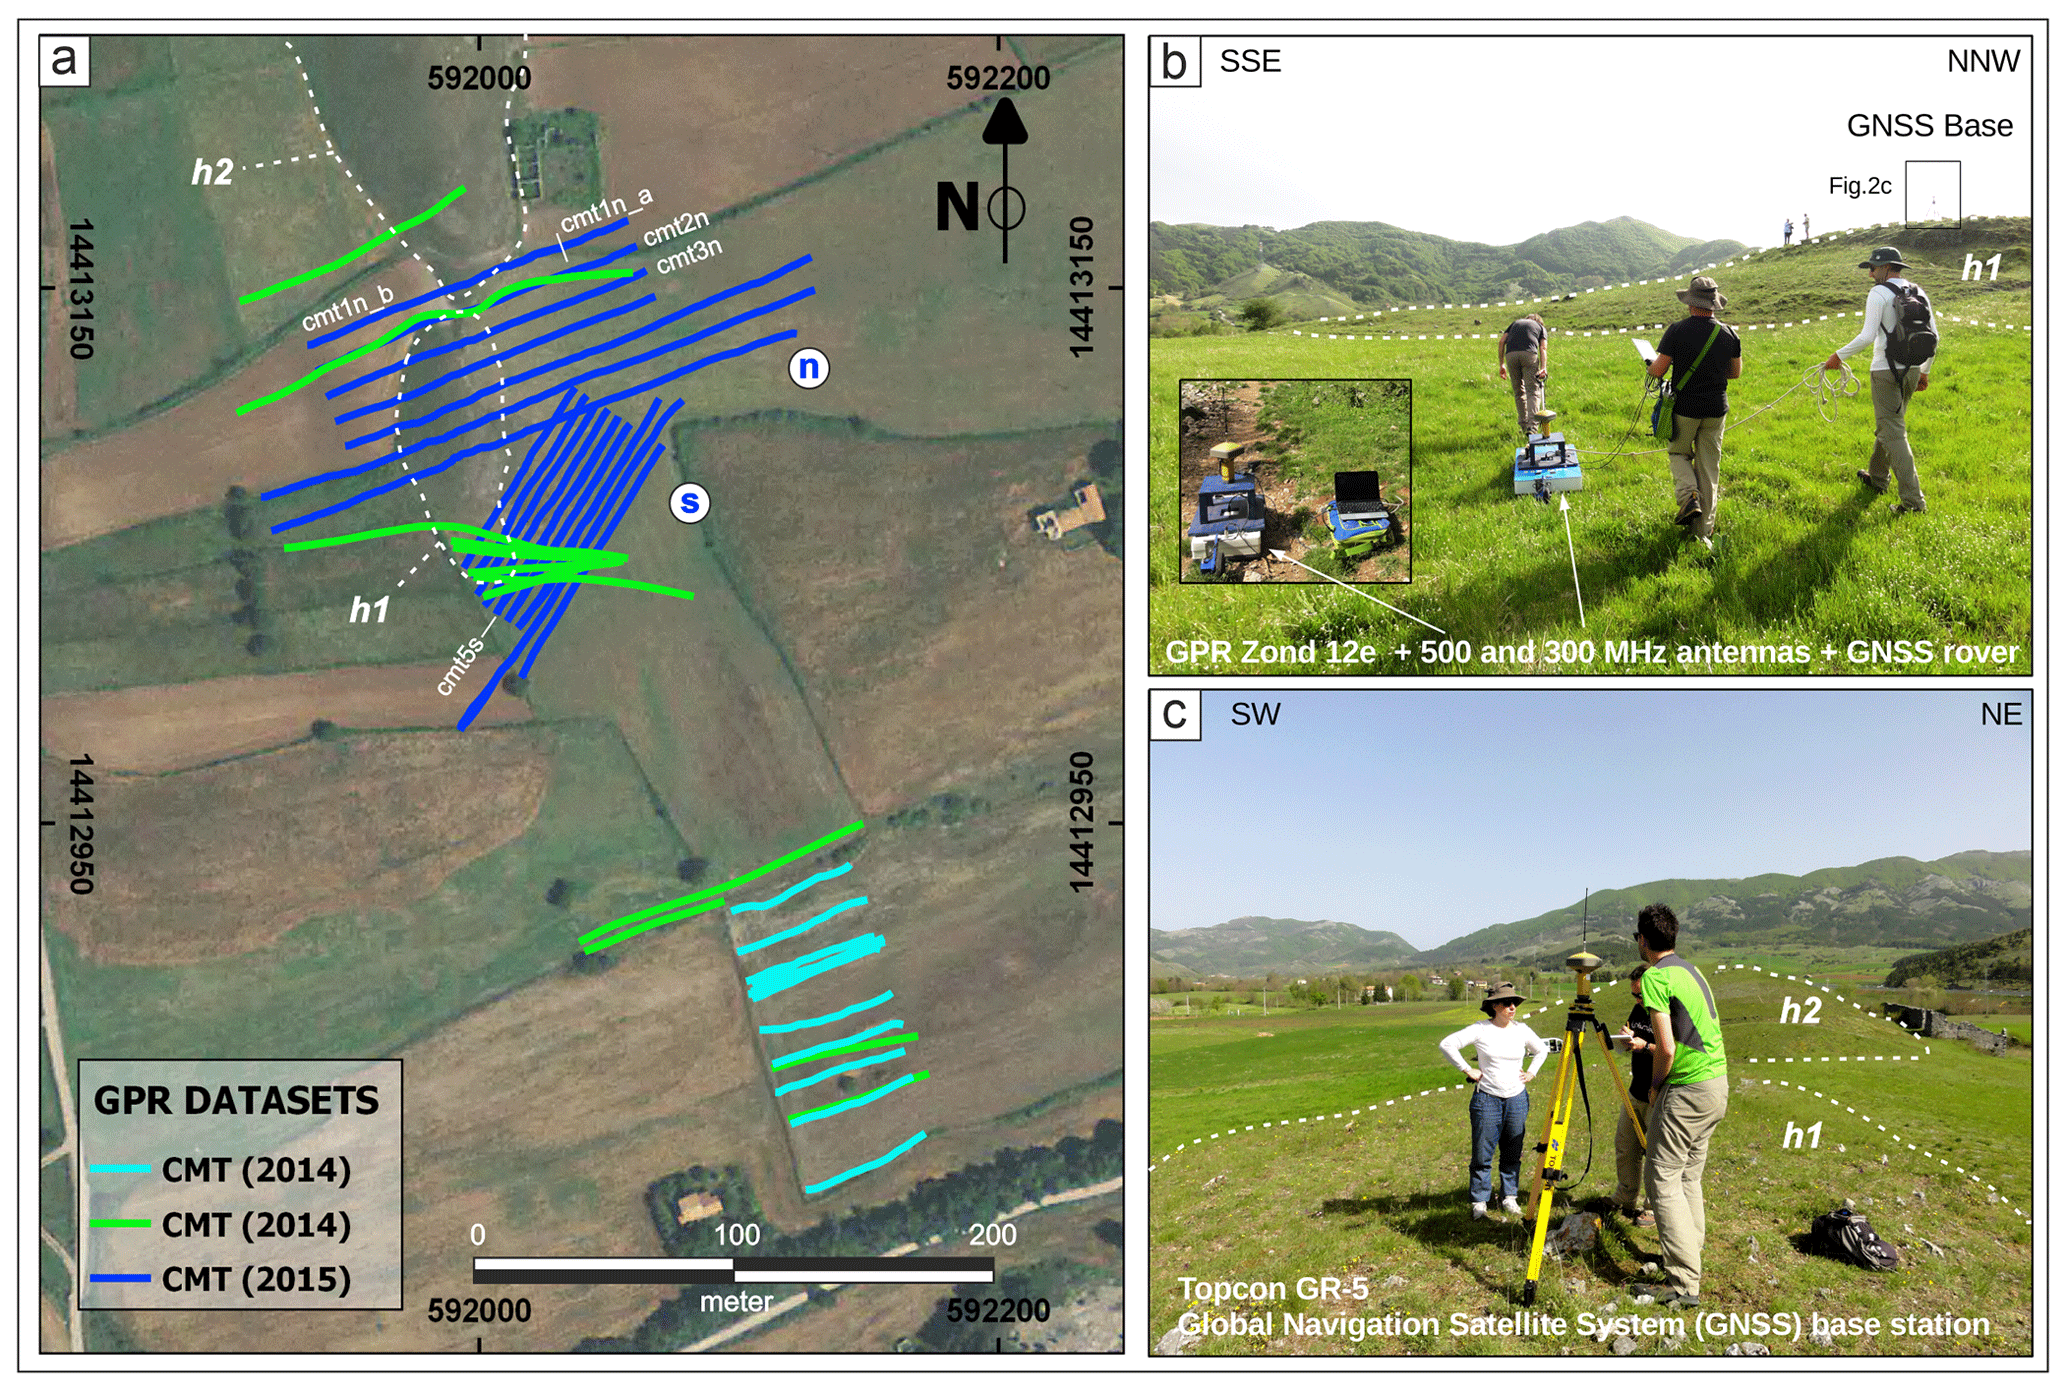
Figure 2GPR acquisition campaigns: (a) GPR profiles collected at the study site Campotenese (“cmt”, where “n” and “s” stand for north and south, “h1” and “h2” indicate the two dolostone hills outcropping in the basin) during the three field visits (aerial image source: Regione Calabria – http://geoportale.regione.calabria.it/opendata, last access: 11 June 2021, under license IODL 2.0. – https://www.dati.gov.it/iodl/2.0/, last access: 11 June 2021); (b) acquisition phase using the 300 and 500 MHz antennae (in the insert) and GNSS receivers used for accurate data positioning; (c) GNSS base station set up during the fieldwork.
We used a Zond 12e GPR system equipped with 300 and 500 MHz antennae. The lower-frequency antennae was ultimately preferred and considered the best trade-off between maximum resolution and achievable signal penetration (in our case ∼ 4 m) concerning the surveyed materials and wanted subsurface structures. The GPR was equipped with an odometer wheel to measure the radar profiles' length and with a Topcon GR-5 Global Navigation Satellite System (GNSS) receiver to achieve accurate positioning of GPR traces and profile. Considering the scarcity of obstacles across the survey site and the good satellite coverage, we opted for network real-time kinematic positioning (NRTK, connected to the NETGEO network), measuring coordinates and elevations with centimeter accuracy and storing them directly within the SEG-Y GPR files.
Three datasets were acquired after preliminary fieldwork and collection of geological-structural data at the surface, which allowed us to infer the possible location of the fault trace. The average NE–SW direction of the GPR lines was initially planned with the primary purpose of intersecting the VCT fault roughly perpendicularly to its SW–NE strike, as reported in the literature and visible from surface evidence. This solution theoretically allows a more reliable interpretation of the investigated structure by reducing the effect of the apparent dip direction and dip angle of both stratifications and faults.
The acquisitions carried out in 2014, first resulted in 12 SW–NE GPR profiles collected in the southern sector of the basin (CMT light-blue lines in Fig. 2a), which was a flat land characterized by Quaternary alluvium. The second acquisition encompassed four additional radar profiles collected in the same area, and another nine radar profiles progressively moving to the north, which were collected in the central sector with slightly different and converging orientations (CMT green lines Fig. 2a). This solution was pursued for two main reasons: (1) to avoid directly surveying the outcropping dolostone, only partially crossed with two northernmost profiles, and thus focussing only on the sedimentary cover, representing our target for possible Quaternary faulting; (2) to optimize, through a preliminary GPR data interpretation, the future acquisition schemes by figuring out the dip direction of the buried geologic structures of interest. In fact, similarly to the interpretation of reflection seismic profiles, the “apparent dip” of reflections in bidimensional radar profiles should be considered to achieve a reliable 3D conceptual model.
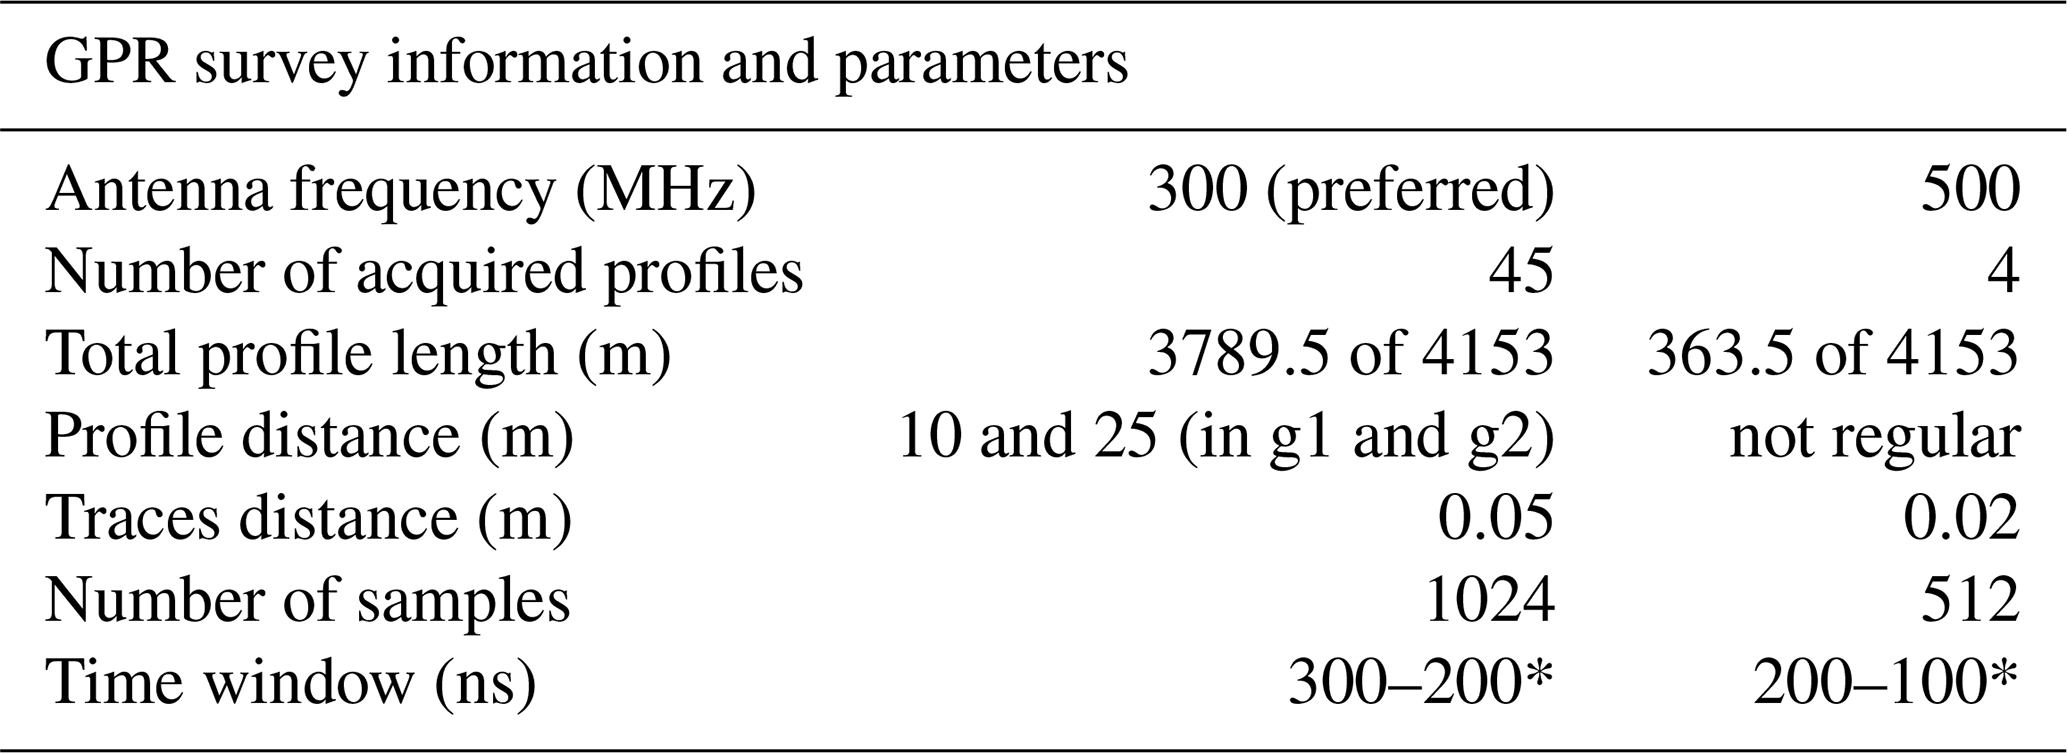
In order to intercept several possible buried faults and fault-related structures as well as to fully image the local structural setting, the successive 2015 acquisition crossed part of the Triassic dolostones ridge with longer GPR profiles. The GPR profiles collected during the second 2014 campaign (close to h1 and h2) already revealed a considerable difference in GPR reflectivity between the unconsolidated deposits and layered and fractured Mesozoic lithotypes (Gafarov et al., 2018). Therefore, two new datasets of 24 parallel GPR radar profiles (CMT dark-blue sets of lines in Fig. 2a, north “n” and south “s”) were extended in NNE–SSW and NE–SW directions, respectively, crossing h1 for several tens of meters (max profile length ∼ 220 m) throughout the basin. The GPR profiles were recorded using a trace step of 0.05 m and a profile inter-distance of 25 m for dataset “n” and 10 m for dataset “s”, respectively. A detailed summary of the acquisition parameters used for the GPR surveys is reported in Table 1. For these two datasets, the profile spacing and positioning are more regular and accurate, thanks to preparatory transects planning using a GIS project. Thus, we later staked out their initial and final positions during the fieldwork through the differential Global Navigation Satellite System (GNSS). The results of the accurate GPR trace positioning achieved during the GNSS campaigns were also used for GPR data processing, visualization, and interpretation.
Table 1Main information and GPR parameters used during the data collection (* the time window was adapted depending on the surveyed area).
3.2 GPR data processing and results
The processing sequence was customized after testing several workflows and parameters. We aimed to remove random and coherent (e.g., ringing) noise and enhance the data quality to better visualize the geometry of the buried reflections and their discontinuity in signal amplitude and phase. The first step was an accurate quality control (QC) of the profile coordinates and topographic profiles. Despite the generally favorable environmental conditions (e.g., good satellite coverage, no forested areas) of the site for a GNSS survey, some measurements occasionally suffered a degradation of positional accuracy (e.g., temporary scarce satellite coverage or poor communication via Network Transport of RTCM via Internet Protocol – Ntrip). For some traces therefore the coordinates and elevation field records that were outliers (Fig. 3a) were corrected using various strategies (e.g., replacement, interpolation, or smoothing, Fig. 3b).
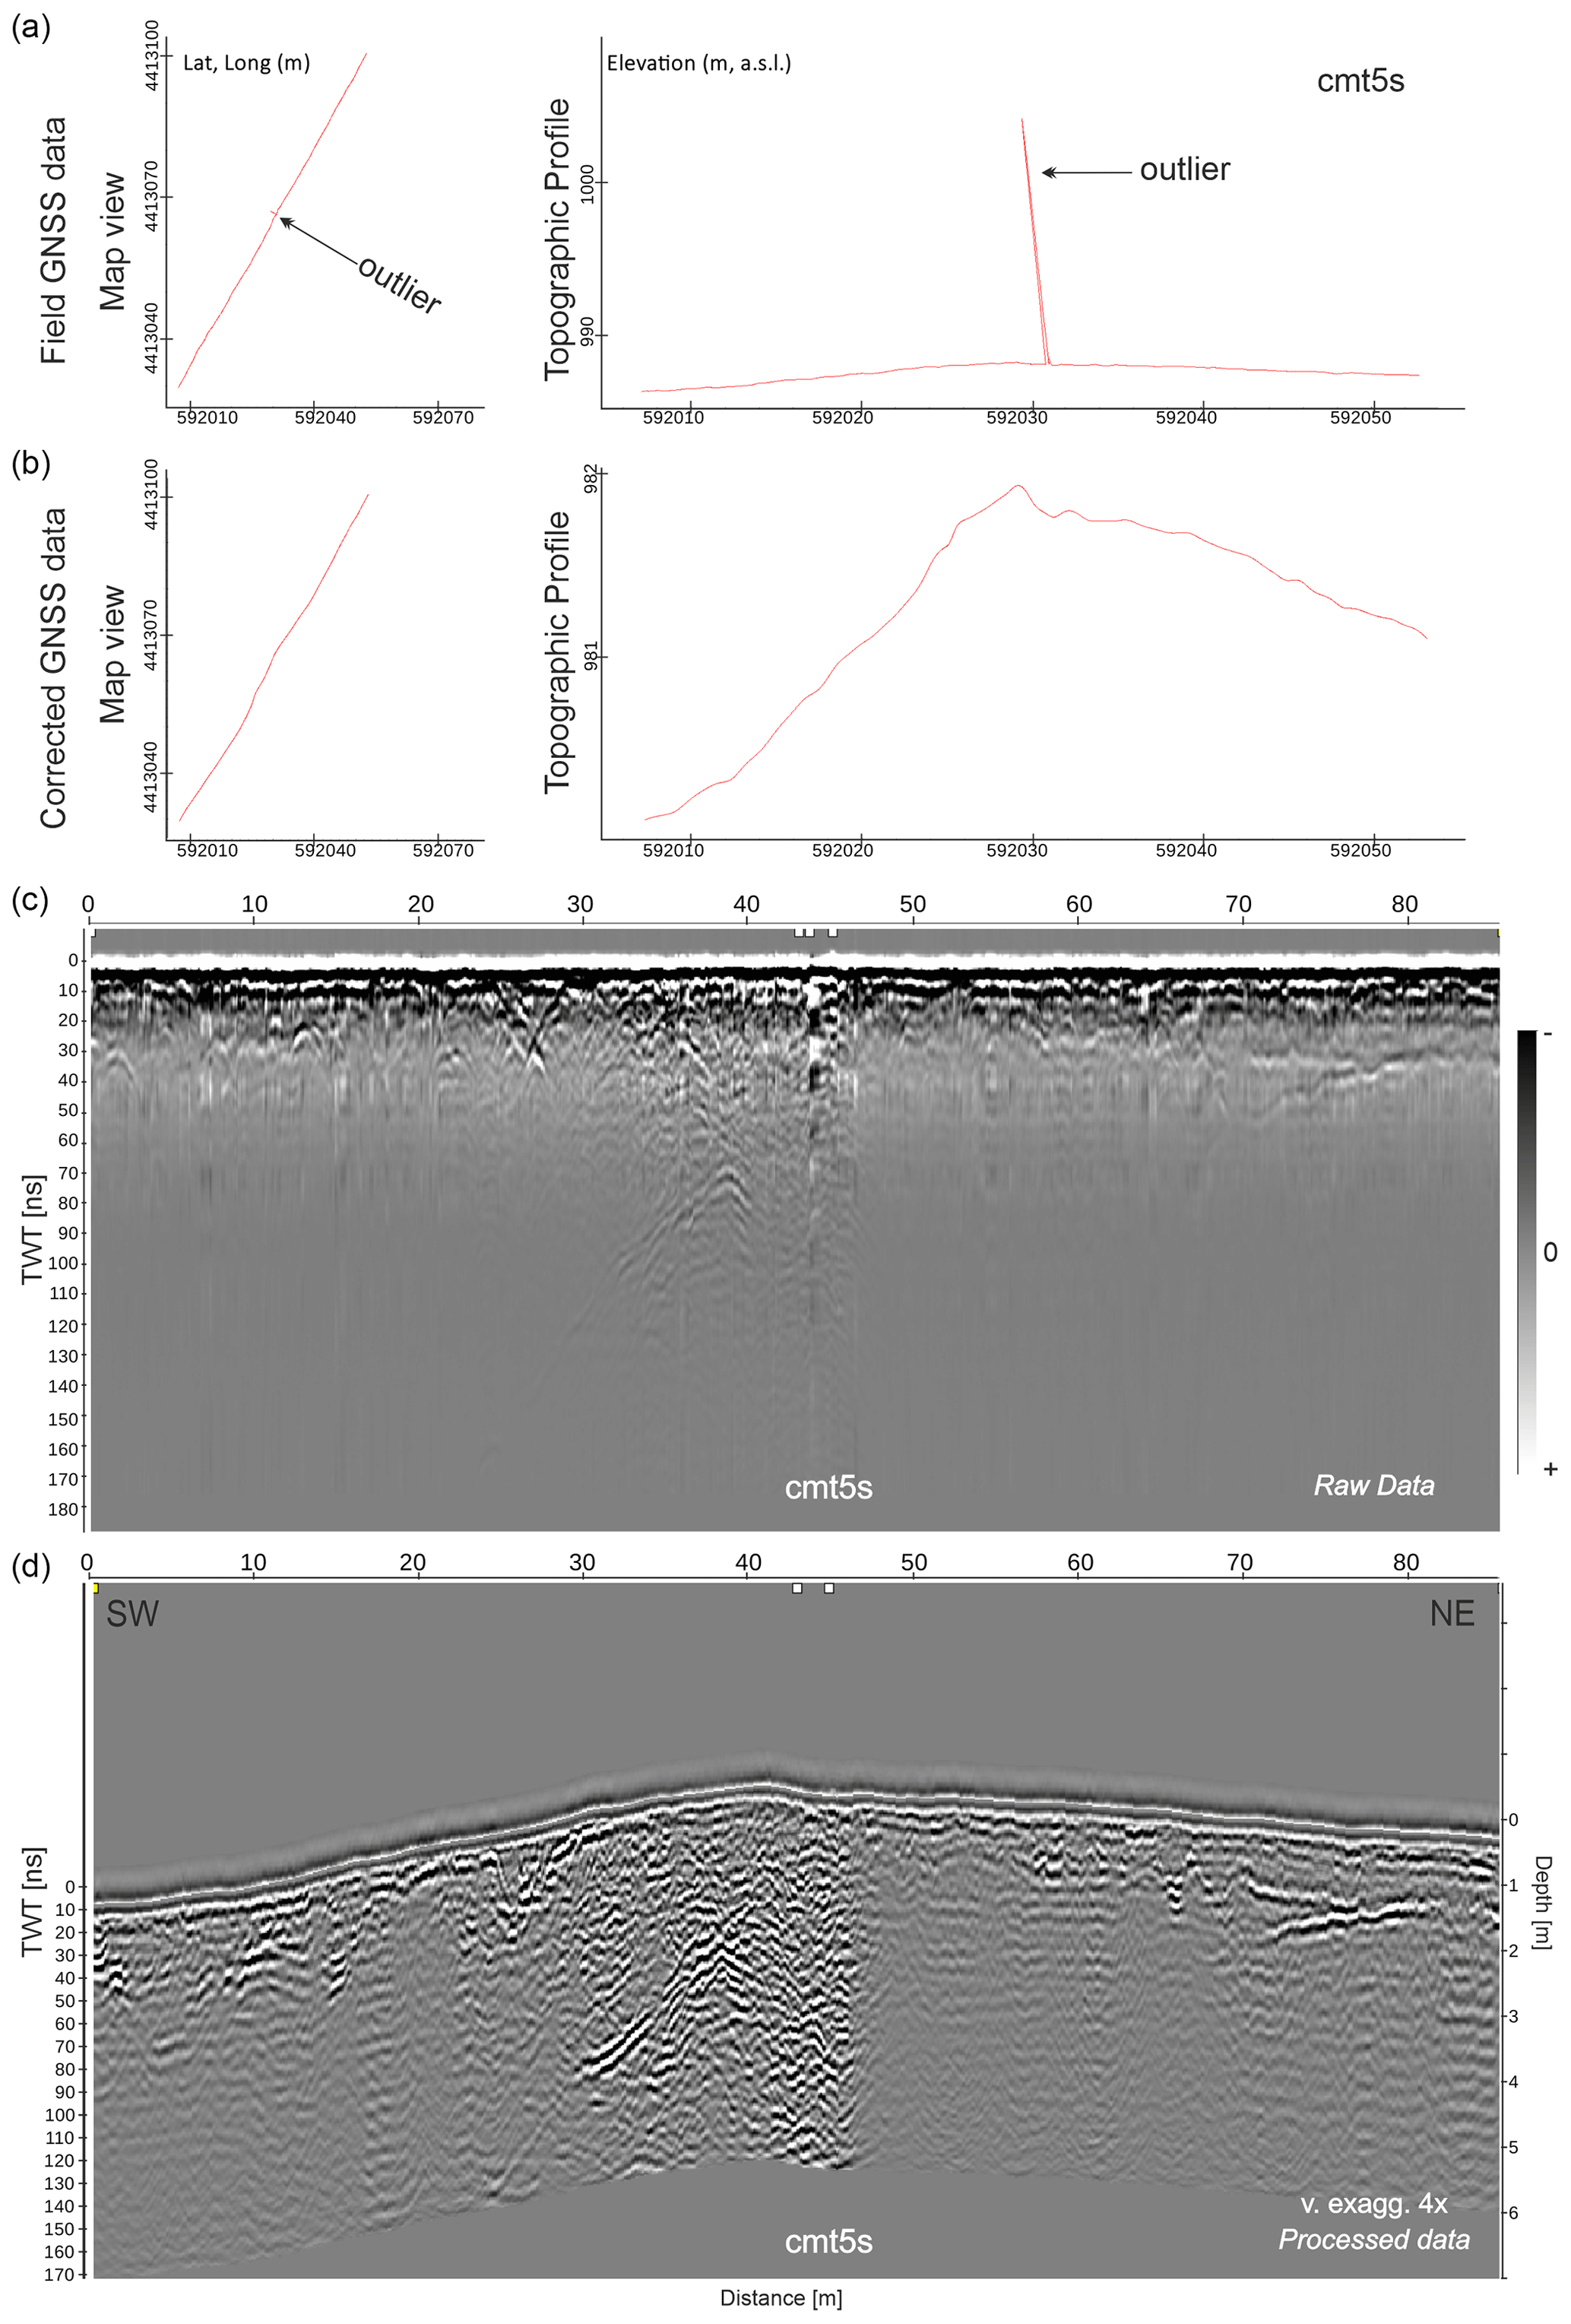
Figure 3Topographic correction of GPR profiles: (a) example of accuracy degradation of GNSS data, displaying an outlier both in map view and in topographic profile, in which the positioning error is considerable; (b) GNSS coordinates and topographic profile after the correction; (c) raw GPR section displaying high reflectivity in the central sector; (d) example of full processed profile with topography displaying various reflection patterns encompassing dipping reflections and diffractions. Vertical exaggeration is 4.
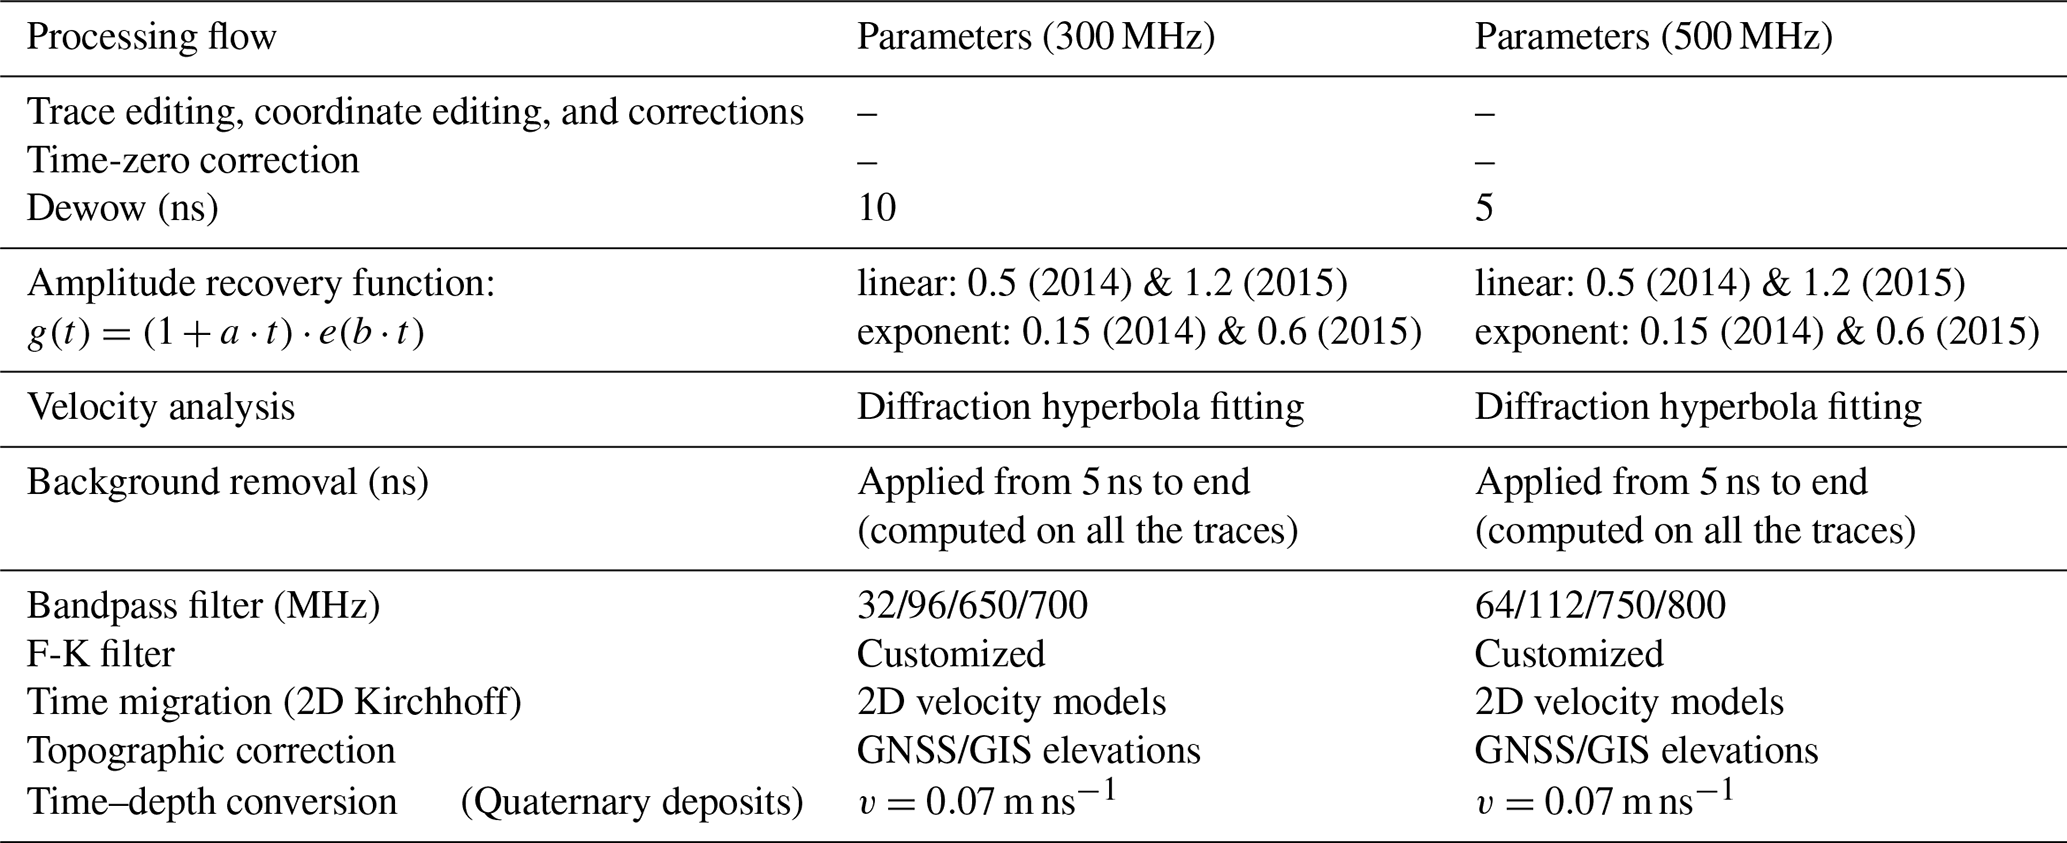
We have also compared our measurements with topographic transects extracted from 10 m and 5 m resolution digital terrain models (DTMs) by Tarquini et al. (2012) and by Regione Calabria. Later on, we finally used a 1 m resolution DTM (Geoportale Nazionale, 2018; lidar data provided by Italian Ministero dell'Ambiente e della Tutela del Territorio e del Mare – MATTM) to double-check whether, despite the different scales of observation, the topographic profiles were comparable. Although the meter resolution of the DTM is unable to represent centimeter topographic variations, the comparison confirmed an excellent match of the topographic profiles at a meter scale, so that the DTM data were integrated to correct the GNSS-measured topography when the accuracy of GNSS recordings was excessively degraded. With the topographic profiles corrected, the raw GPR data (Fig. 3c, illustrating the profile cmt5s) were initially processed with the Prism software (Radar System, Inc., http://www.radsys.lv/en/index/, last access: 11 June 2021) using a basic processing sequence, to analyze the main characteristics of data and optimize a customized processing flow. The processing sequence was later improved through ReflexW software (https://www.sandmeier-geo.de/reflexw.html, last access: 11 June 2021; see Table 2 for details on the processing algorithms and parameters). The workflow included a time-zero correction, dewow, amplitude recovery, velocity analysis, background removal, bandpass filtering, F-K filtering, 2D time migration, topographic correction, and time-to-depth conversion. The amplitude recovery was operated through a “gain function” including a linear and an exponential coefficient to enhance the amplitude (reflectivity) contrasts as well as preserving the horizontal and vertical amplitude variations already visible in the raw data (Fig. 3a). This amplitude recovery function was used across all the profiles with slight customization depending on the datasets (details in Table 2). The entire processing flow was applied to all the available radar profiles, again with occasional filtering adaptations aiming to remove local pervasive signal ringing (e.g., due to low antennae–ground coupling). Particular care was dedicated to the migration process, whose algorithm was decided after extensive tests on several radar profiles to select the best migration strategy.
Table 2Customized flow and details of the parameters used during the processing of the GPR dataset.
In fact, a very different reflectivity and maximum depth of penetration are visible in the data: it is more than 150 ns in the central sector, decreasing to 70–80 ns in the rest of the radar profiles (Fig. 3c): this fact suggests sharp lateral variations of subsurface media (Figs. 3d) and, possibly, of the velocity field. Thus, we have first tested a 1D time migration algorithm (Kirchhoff) by performing a migration velocity scan (MVS) analysis (Forte and Pipan, 2017) and inspecting the success of diffraction hyperbola collapse after migration. We have varied constant values of EM velocity, from a minimum of 0.06 up to 0.12 m ns−1, with steps of 0.01 m ns−1, to evaluate considerable variation in dielectric properties of surveyed media. The MVS is characterized by a higher velocity for the central sector of the GPR profiles which displays high reflectivity: Fig. 4 illustrates an example of the migration results obtained on the profile cmt1n_a, by using three constant values of average velocity. The profile in Fig. 4a shows the unmigrated version characterized by numerous hyperbolic and half-hyperbolic diffractions originated by single scatter points and wavy reflections (white arrows). In Fig. 4b we display the first test using v=0.07 m ns−1, showing overall good results, with slight under-migration at a few points mainly located within the shallower sediments (light-blue arrows). The hyperbolic diffractions are also nicely collapsed using higher velocity (v=0.09 m ns−1) as shown in Fig. 4c (dark-blue arrows), even if some imaging problems affect deeper reflections. The last migration scan test (v=0.11 m ns−1) displays a good result only in few profile sectors (dark-blue arrows), particularly localized within the sectors with high reflectivity, displaying an improved lateral reflection continuity. The rest of the radar profiles show generally poor imaging, particularly in the area characterized by strong attenuation, where the wavy reflection is over-migrated (red arrows indicating migration smiles, Fig. 4d).
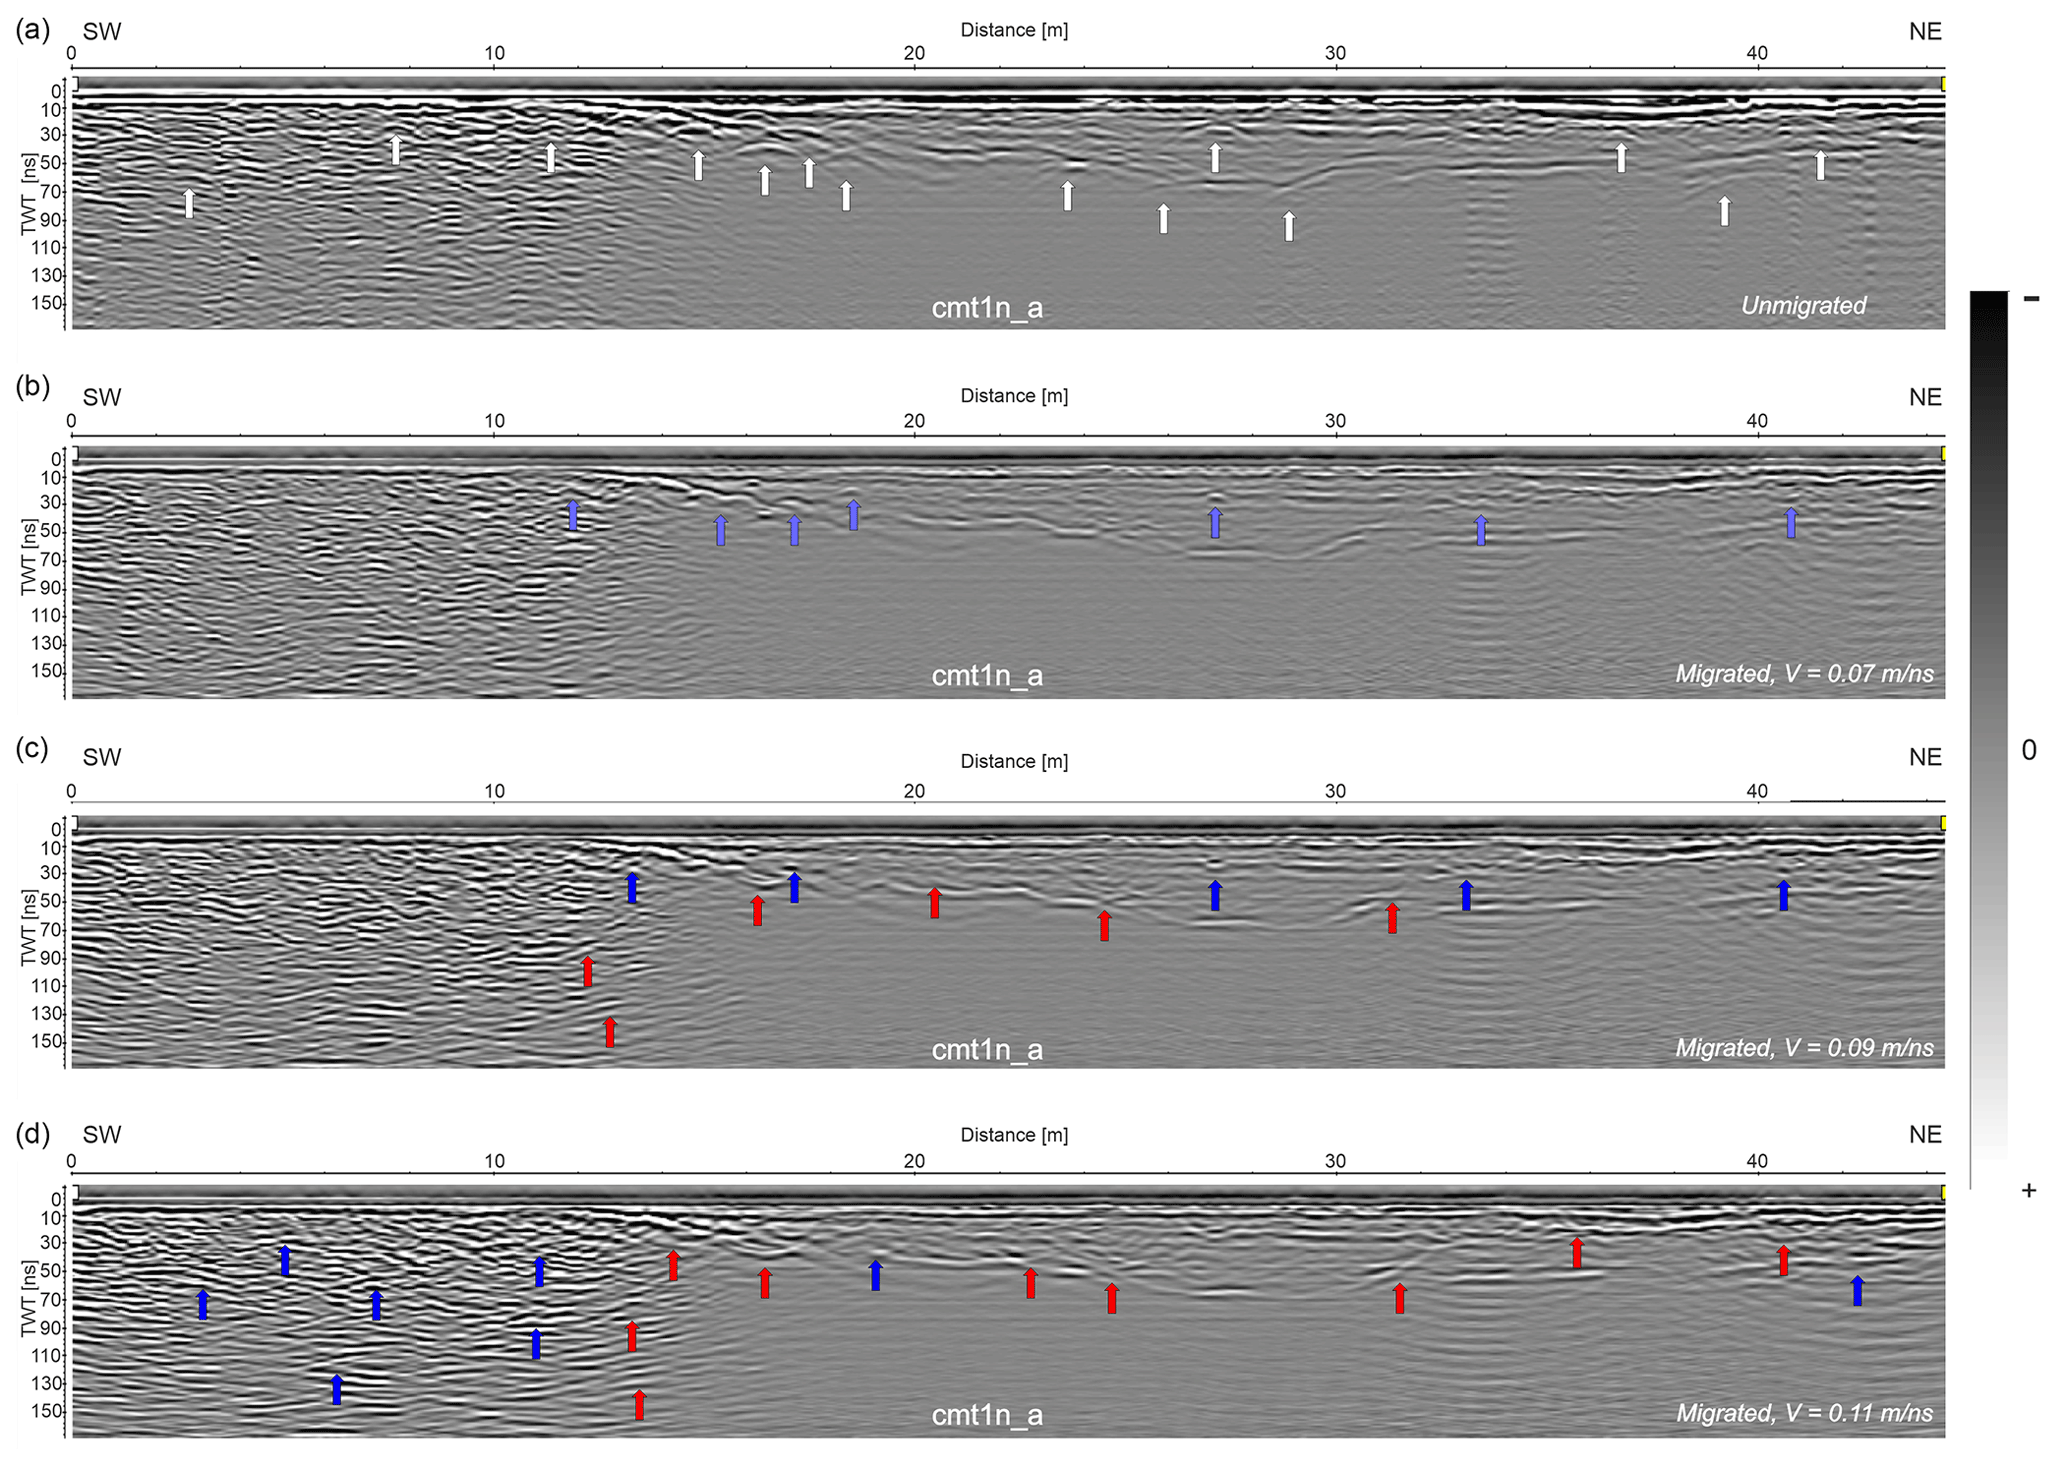
Figure 4Migration tests performed during the GPR data processing: (a) unmigrated 2D GPR profile, 300 MHz antennae, displaying hyperbolic diffractions (white arrows); (b) migrated profile using a constant velocity v=0.07 m ns−1, light-blue arrows indicate good diffractions collapse; (c) migration output obtained with a constant velocity v=0.09 m ns−1, with dark-blue arrows suggesting good migration results (migration artifacts are shown by red arrows); (d) migration results using a constant velocity v=0.11 m ns−1, with dark-blue arrows highlighting good hyperbolas collapse, particularly within the high reflective unit; red arrows highlight clear migration smiles.
The workflow therefore suggests a challenging imaging task due to velocity variation happening not only at depth but also laterally across the different media. This sharp change of reflectivity and velocity at a distance of about 13–14 m (Fig. 4d) represents a complex problem for the efficiency of 1D migration algorithms conventionally used for GPR imaging. Such considerations have lead to testing a 2D migration algorithm, by creating and using a 2D velocity model obtained for each radar profile through a hyperbolic diffraction fitting tool (Fig. 5a). Single velocity points have been fitted for each area displaying hyperbolic diffractions, while in the remaining parts of the radar profiles we have arbitrarily included presumed velocity adaptation only to obtain a regular grid of points to spatially interpolate the 2D models. The 2D migrated radar profiles, in comparison to the 1D approach, resulted in improved imaging of GPR profiles, displaying a more accurate collapse of the hyperbolic diffractions into point sources and an improved relocation of dipping reflections, with a refinement of their geometry and an increase in their continuity. A good-quality imaging result is visible on the central sectors of radar profiles displaying strong reflectivity and reflections with improved continuity, but also many phase breaks and displacements. Despite steep topographic gradients, sharp lateral velocity variation and the reflection heterogeneity might cause imaging issues that need to be treated using more specific workflows (Lehmann and Green, 2000; Heincke et al., 2006; Goodman et al., 2007; Dujardin and Bano, 2013). We believe we have reached a good compromise for our purposes. In our case, a considerable improvement can be seen along the hill slope and flatter areas (profile cmt1n_ a, Fig. 5b) which are of greatest interest for the study aimed at detecting possible earthquake ruptures within the Quaternary deposits. The improved imaging of reflection geometries is therefore fundamental for the interpretation and detection of geophysical signatures of faults.
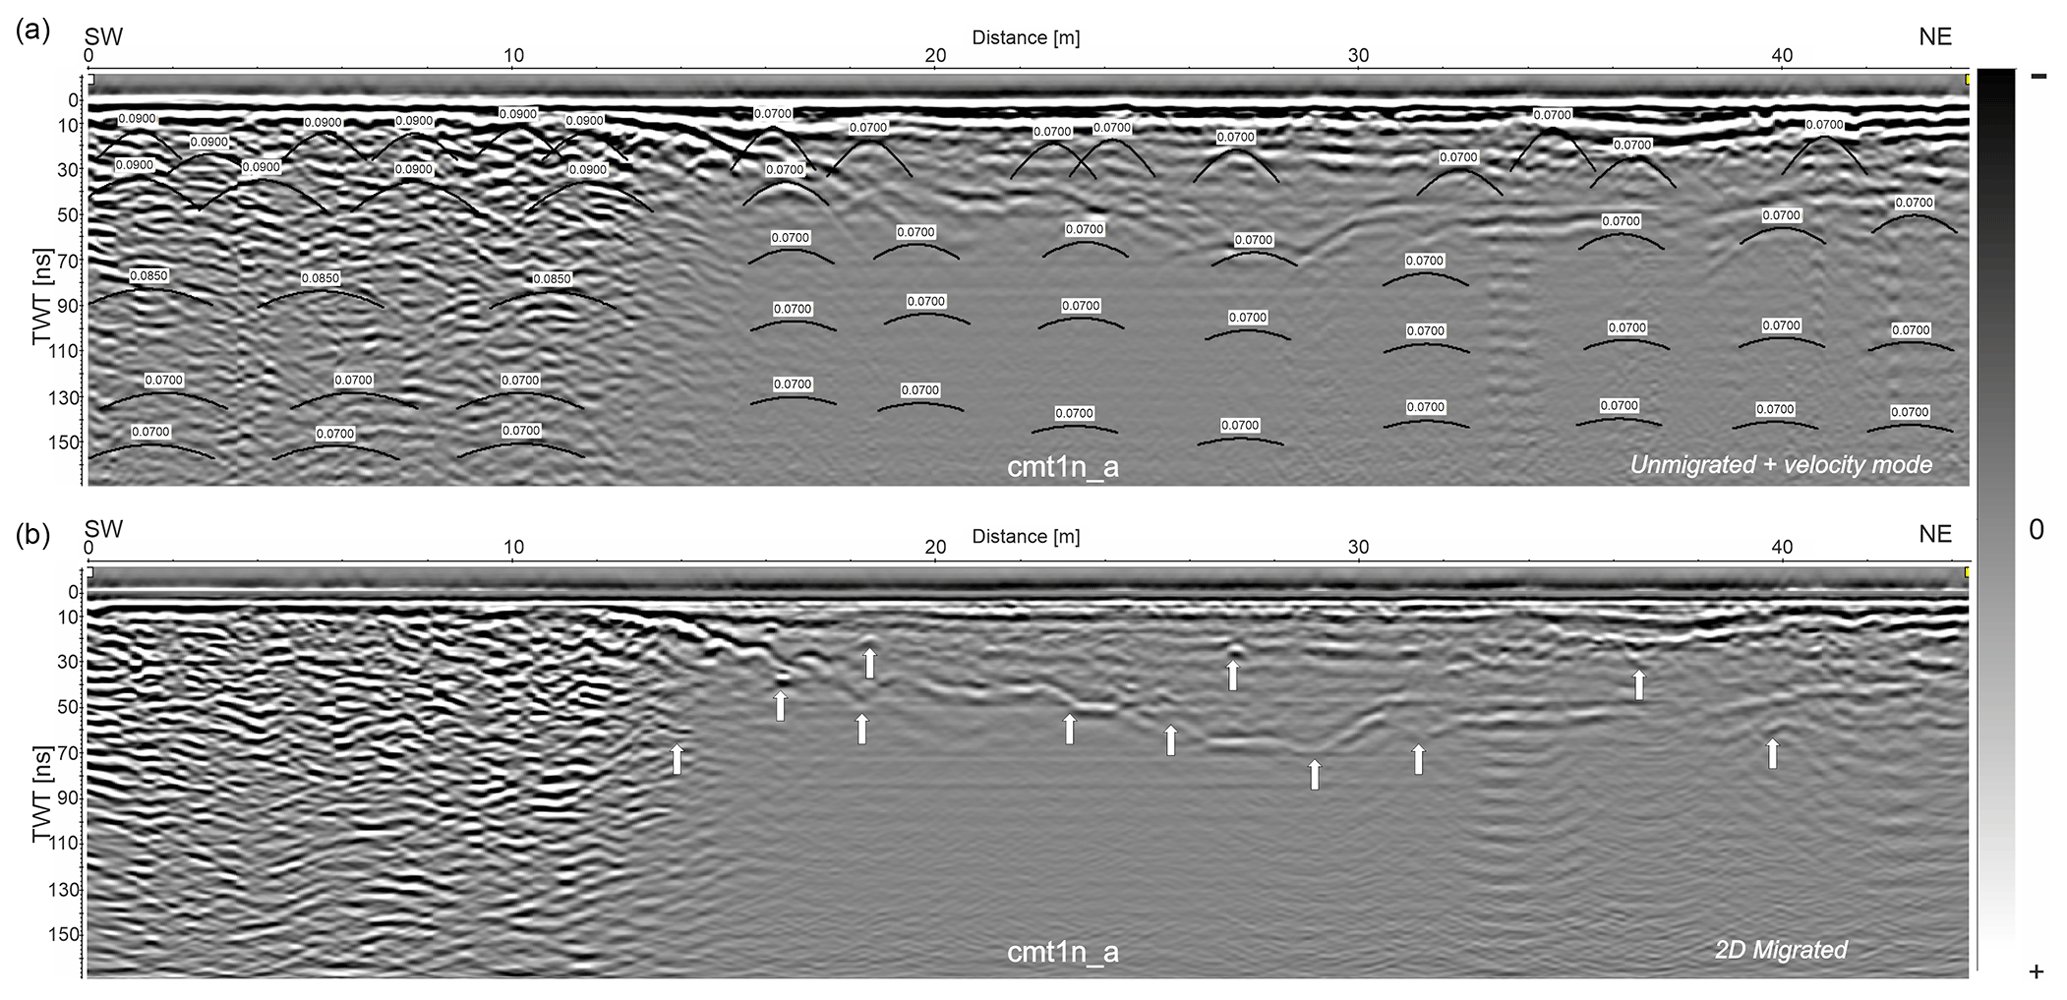
Figure 5Example of 2D time-migration of radar profiles: (a) example of hyperbolic diffractions fitting used for 2D velocity model building; a constant velocity value (0.07 m ns−1) was assumed in deeper no-diffraction areas for interpolation purposes; (b) 2D time-migration results, highlighting the good performance of the process, which collapsed the hyperbolic diffractions (white arrows) and restored reliable reflection geometry.
A successive import of the processed SEG-Y data was performed in the seismic interpretation software OpendTect Pro v.6.4 (academic license courtesy of dGB Earth Science, https://www.dgbes.com, last access: 11 June 2021), which was used first for global QC of processing operations (correctness of topographic correction and datum plane, coordinate accuracy and matching, profile orientation and intersection) and for three-dimensional (3D) visualization of all the profiles (Fig. 6a). The three-dimensional GPR project was subsequently integrated with geological and structural maps, DTMs, and literature schemes (using a common coordinate reference system: WGS84 UTM Zone 33N, EPSG: 32633) in the Move suite software v. 2019.1 (academic license courtesy of Petroleum Experts, https://www.petex.com/products/move-suite/, last access: 11 June 2021) for GPR interpretation and model building. All the E- and W-dipping fault surfaces were created by interpolating the fault sticks picked on displaced reflections and correlated across adjacent radar profiles. In particular, we used the “surface geometry” tool to extract the properties of each single mesh building up the surfaces, and obtaining the “dip” and “dip azimuth” data. Subsequently, such values have been automatically saved in an attribute table, which can then be queried to reconstruct the “synthetic” stereonets.
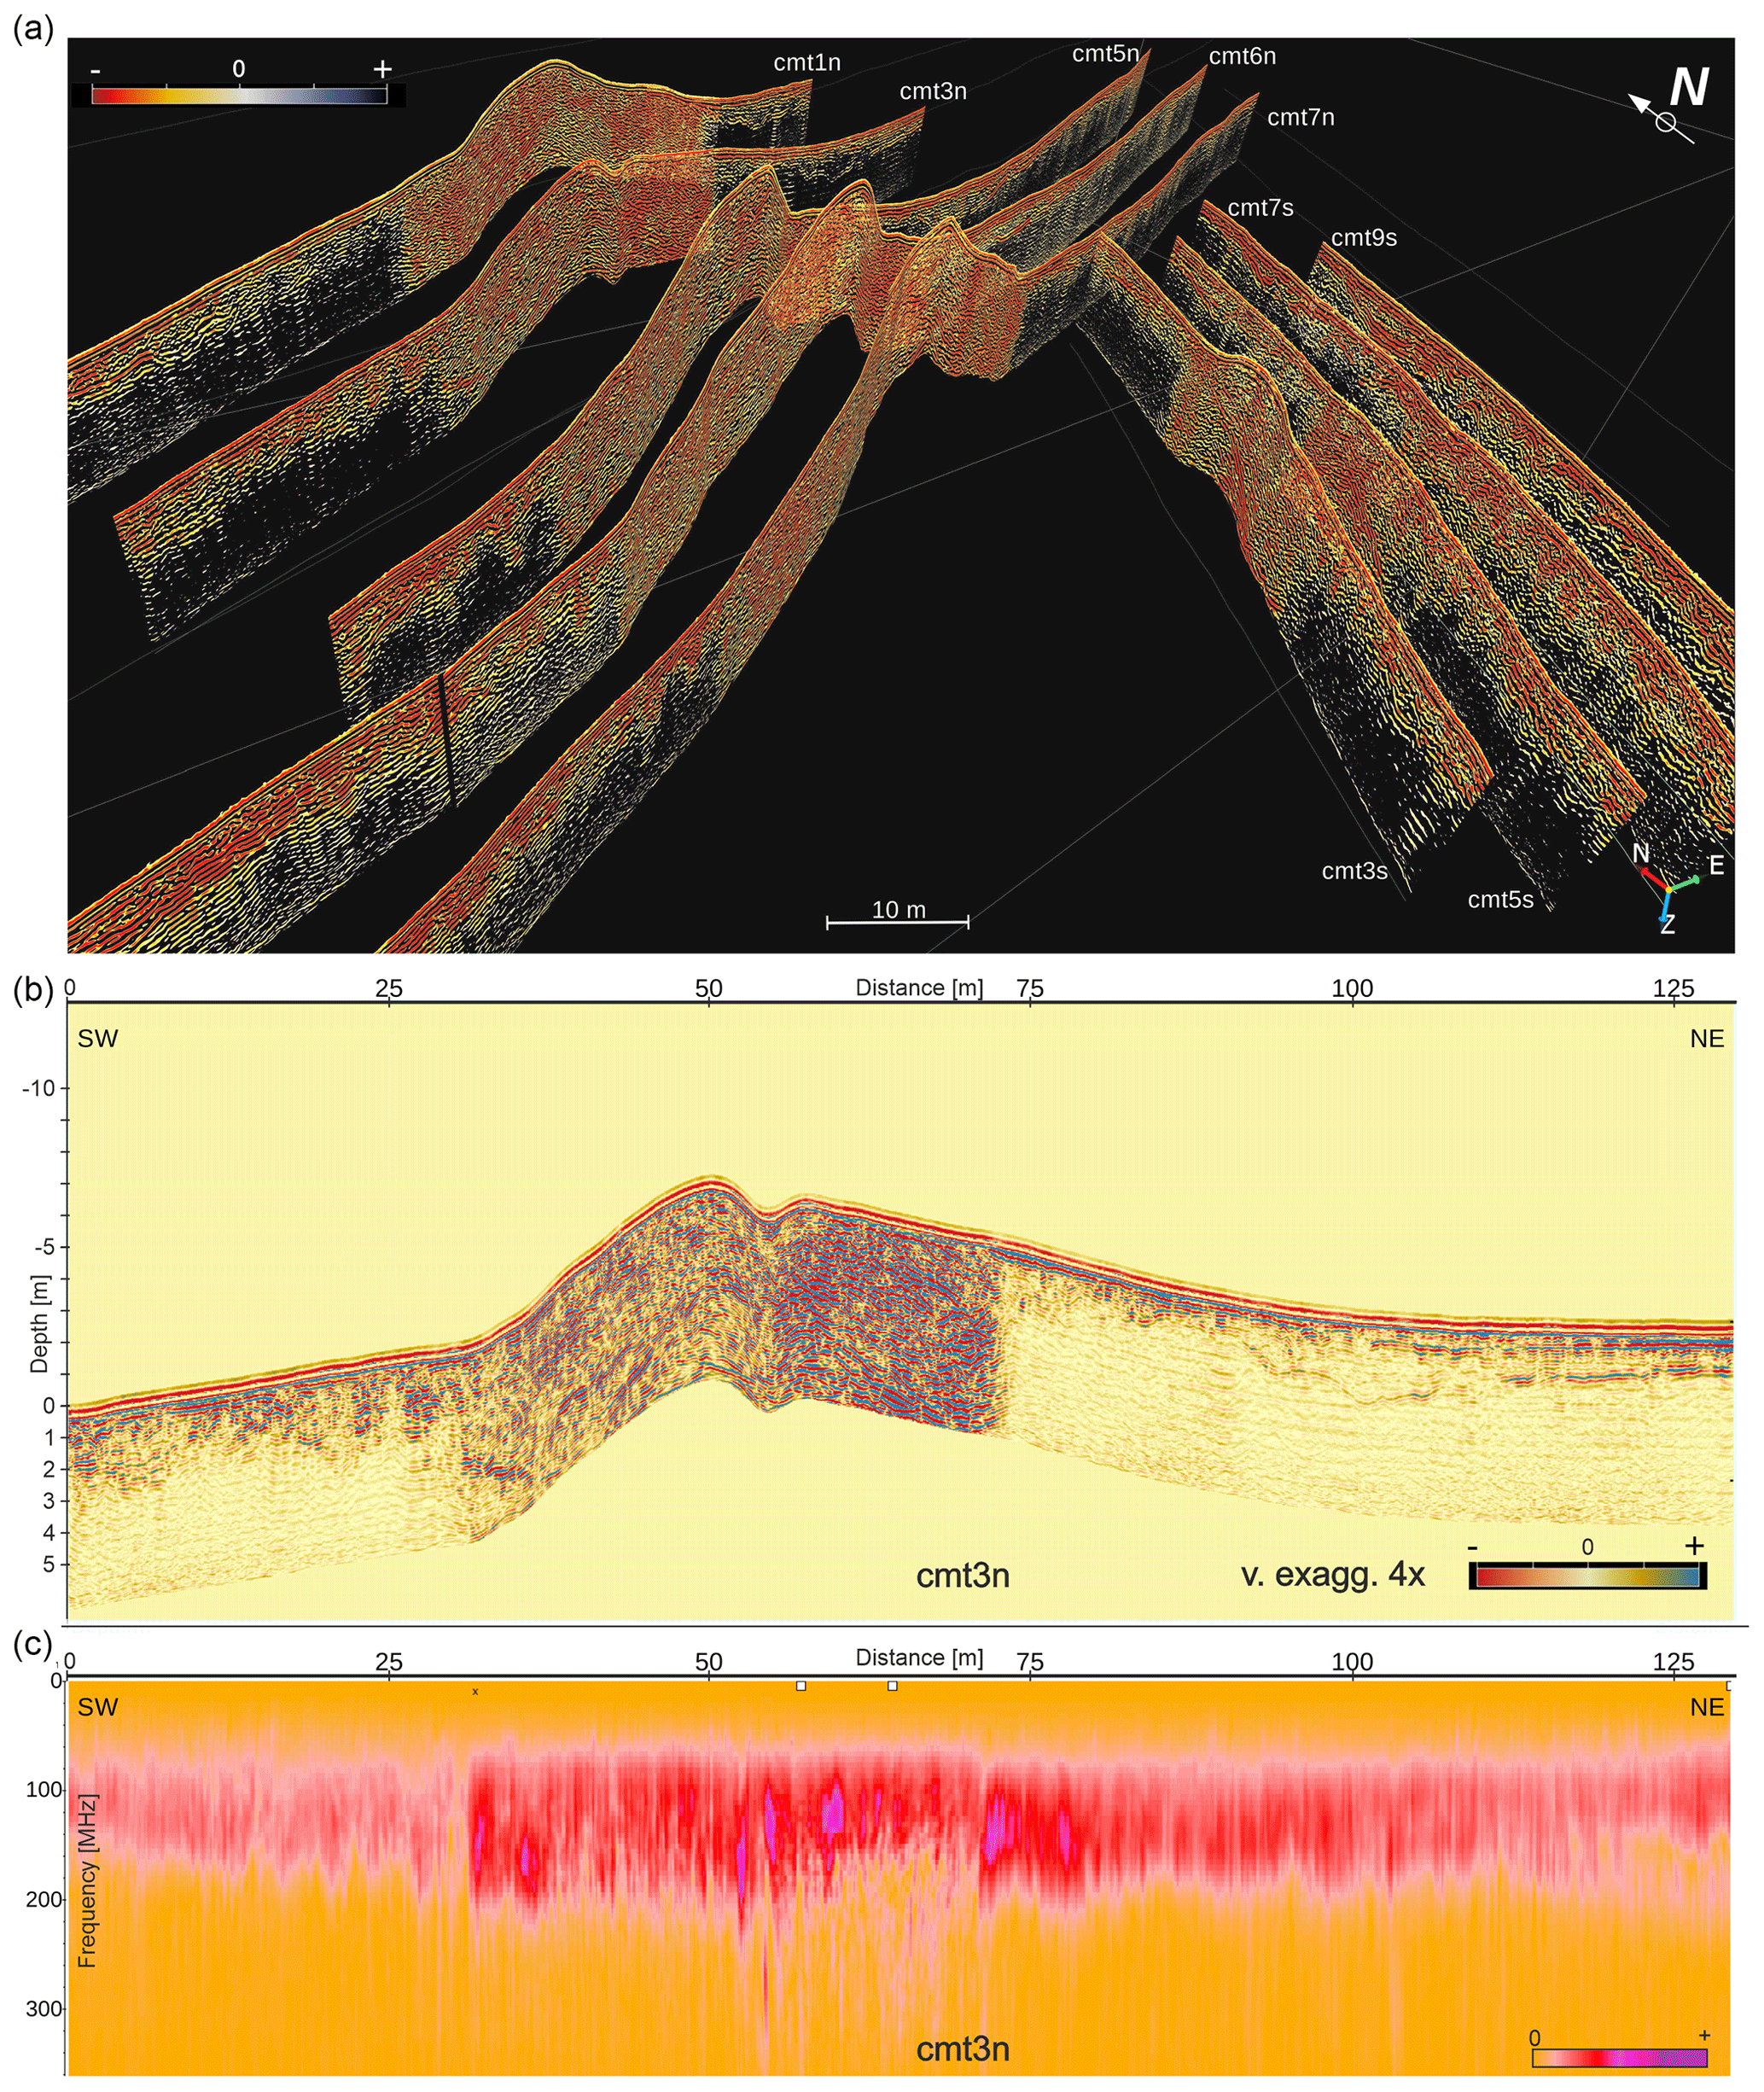
Figure 6GPR data visualization: (a) fence diagram showing the three-dimensional location of some representative GPR profiles in the northern sector of the study site; (b) bidimensional GPR profile (cmt3n; see Fig. 2a for location) displaying the central high reflective sector and dipping reflections across the hill; (c) spatial variation of a 2D amplitude-frequency spectrum linked to variable physical properties of media along the profile cmt3n. Vertical exaggeration is 4.
The 3D MOVE project allowed us to extract 2D and 3D data visualizations to better figure out the relationships between the main reflections identified on the different GPR profiles (Fig. 6a). The workflow aimed to reconstruct and model the three-dimensional surfaces including both horizons and high-angle discontinuities.
A common feature on all the radar profiles is the strong reflectivity visible within their central sectors (e.g., profile cmt3n in Fig. 6b), which are characterized by an irregular and steep slope, particularly within the northern portion of the surveyed area. These sectors show deep GPR signal penetration due to the Triassic dolostones, which outcrop in the central and northern portions of the study area (Figs. 1c and 2a). The quality of the radar reflections and the remarkable depth reached (∼6 m, Fig. 6b) suggest this rock type is an excellent dielectric medium (corresponding to higher-frequency content zone in the 2D spectrum of Fig. 6c). However, its reflection pattern is not spatially homogenous, being characterized by oblique and sub-parallel reflections. The latter are interpretable as dolostone beds of moderate (25–30∘) W and E “apparent” dips on the respective sides of the surveyed dolostone hills. In addition, these reflections are frequently cut and slightly displaced by apparent high-angle (60–65∘) phase discontinuities, highlighted by a dense hyperbolic diffraction pattern (radar profile cmt2n, Fig. 7a), suggesting intense fracturing and little faults displacing the dolostone (Fig. 7b). This radar signature was recorded not only in correspondence of the outcropping carbonate but also in the transition slope areas covered just by a thin soil layer (Fig. 7b, c). In the southern side of h1, an outcrop with thin microbialitic laminae allows one to measure the attitude of the bedding (NNW dip, ∼ 30–35∘ dip angle) as well as two sets of major and minor joints (SW and SE dip and dip angle of ∼ 40–45∘, respectively) fitting with GPR reflections.
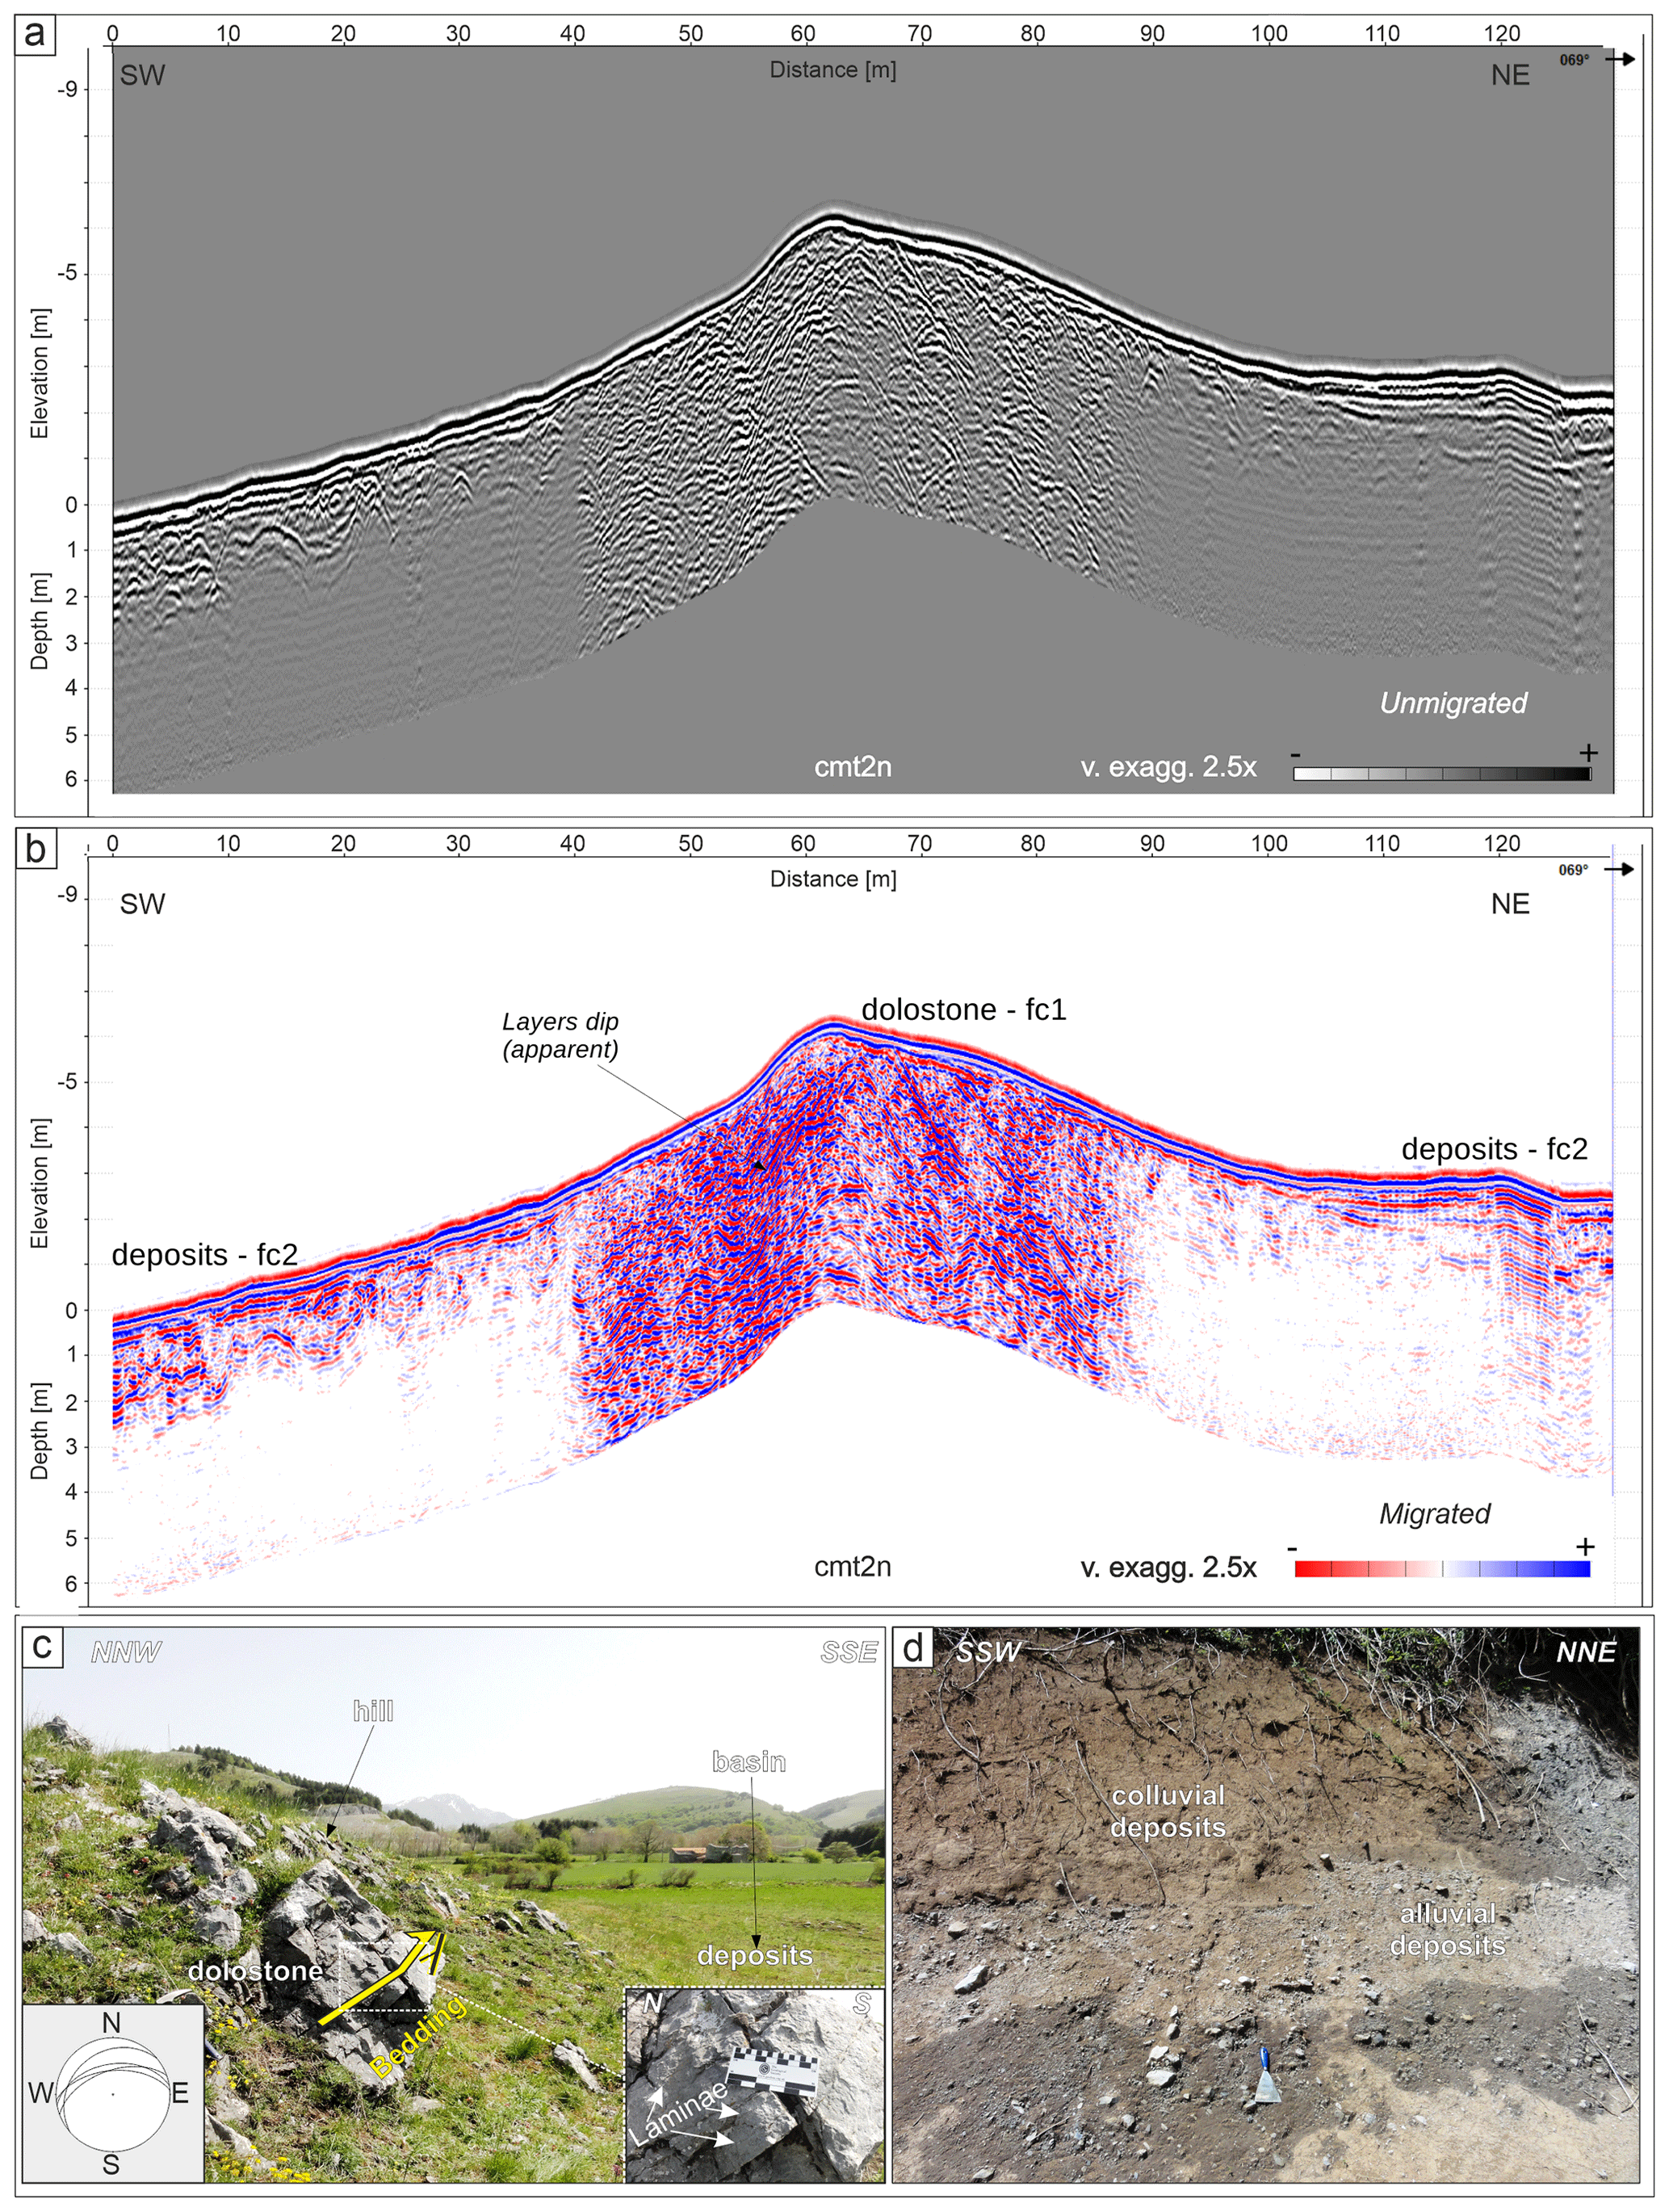
Figure 7Correlation between GPR profiles and outcropping geology at the study site: (a) unmigrated 300 MHz profile (cmt2n; see Fig. 2b for location) displaying numerous hyperbolic diffractions; (b) migrated profile displaying the apparent dip associated with fractured dolostone formation (facies fc1) and Quaternary deposits in the attenuated sectors (GPR facies fc2); (c) Quaternary deposits of the basin (on the background) surrounding the Triassic dolostone formation outcropping on the hill h1. The yellow arrows indicate the bedding, such as the stereonet (left-side inset); the right-side inset shows details of the laminae visible on the site and nearby; (d) an example of Quaternary colluvial and alluvial deposits outcropping nearby the survey site. Vertical exaggeration is 2.5.
Apart from its internal heterogeneities, the GPR signature of the Triassic dolostones can be considered as a well-defined depositional facies (fc1) (Sangree and Widmier, 1979; Huggenberger, 1993; Beres et al., 1999; Bristow and Jol, 2003). A different radar signature fc2 is defined for the profile sectors on the sides of fc1. This second facies is characterized by prominent laterally continuous and sub-parallel reflections in the very shallow depth range (<1 m, just beneath the direct arrivals), stratigraphically sealing underlying reflections 1–3 m deep: the latter are more discontinuous, wavy, and contorted, with moderate to low reflectivity and encompassing sparse diffraction hyperbolas (in unmigrated data, Fig. 7a). This reflection pattern onlaps onto a generally prominent wavy reflection (Fig. 7a, b), which typically marks the transition to strong signal attenuation deeper in the section.
The reflection package belonging to fc2 corresponds to the alluvial and colluvial deposits (Fig. 7b–d), outcropping on the sectors with flat topography, which represent the GPR profile sectors we have carefully inspected to find geophysical evidence of Quaternary faulting. A key layer for this research is the described prominent, wavy reflection, as it can be recognized in many radar profiles. The related interpretation is not straightforward in the absence of direct data (e.g., boreholes and/or paleoseismological trenches) or at least without additional geophysical data. A strong GPR reflection suggests significant variation of the dielectric constant between the two media so that most of the incident energy is reflected back to the receiver at the surface. This wave behavior is potentially explained by several geological models, such as (i) a high dielectric contrast that may be a result of a sharp soil moisture variation (Ercoli et al., 2018); (ii) a sharp erosional, stratigraphic, or tectonic boundary within heterogeneous deposits (Ercoli et al., 2015); or (iii) a contact between two considerably different lithologies, such as unconsolidated deposits laying above a bedrock substrate reflecting back all (or almost all) the incident signal (e.g., Frigeri and Ercoli, 2020). In addition, the possible role of conductive deposits (e.g., high clay content) should not be discounted to explain the occurrence of strong attenuation. Several considerations are at the basis of the GPR data interpretation: (1) the available well logs show the Pleistocene–Holocene alluvium and colluvium layered above the carbonate bedrock at ∼20–30 m depth (Brozzetti et al., 2017a), a greater depth than the strong GPR reflection. However, it should be observed that the area drilled is located ∼2.5 km away on the northwesternmost sector, over the depcenter of the Campotenese basin, whereas the studied GPR site is placed just on its eastern border, in proximity to emerged dolostone hills; (2) only terraced Middle Pleistocene silts and sands (Schiattarella et al., 1994) and slight coatings of Late Pleistocene colluvium (generally <2 m thick) are documented outcropping in the eastern sector of the basin (footwall of VCT fault) (see Fig. 7 in Brozzetti et al., 2017a); (3) the subsurface geometries highlighted by the prominent GPR reflection and underlying reflection pattern suggest a relatively thin layer of sedimentary deposits resting on a fractured substratum. Its top surface is progressively deepening towards the W, thus providing increased space for settling sediments and thus a gradual thickening of deposits is observed from E to W.
In light of the above considerations, we interpret the prominent, wavy GPR reflection as a buried top layer of carbonate (e.g., as observed by Bubeck et al., 2015), in our case represented by the Triassic dolostone formation. The latter is lying at a shallower depth (1–3 m) beneath shallow and poorly consolidated Quaternary deposits, across both sides of the surveyed hills. Thus, after picking such a prominent reflection event on all the radar profiles, the top of the bedrock surface was reconstructed as shown in Fig. 8a (colored surface). In this figure, we also display an overlay of a recent structural map of the basin (modified after Brozzetti et al., 2017a) reporting the area dissected by a set of en échelon fault splays to the west associated with the VTC segment. Thus, analyzing the geophysical characteristics of the prominent, wavy reflection in terms of a structural interpretation, the main peculiar characteristic is the clear “stepped” geometry of some sectors (Figs. 5b, 6b, 7b, 8b), namely breaks in its continuity associated with lateral sharp variations of depth (linked to sediment growth and onlaps). We also notice other geophysical features, which can be observed in the stratigraphy of overlying deposits (fc2): some reflections are semi-continuous to discontinuous (sharp variation in signal amplitude and phase) and display evident lateral variation of the dip angle.

Figure 8GPR data interpretation: (a) three-dimensional image of the surveyed area (see Fig. 1c for location), displaying the dolostone outcrops (grey color). Blue dashed lines are the VCT and RSB faults (Fig. 1b), whilst the light blue is CVN fault. In yellow lines the GPR profiles; the colored surface is the interpreted dolostone top reflection (DTM source: Regione Calabria – http://geoportale.regione.calabria.it/opendata, last access: 11 June 2021, under license IODL 2.0. – https://www.dati.gov.it/iodl/2.0/, last access: 11 June 2021); (b) migrated radar profile with the main interpreted normal faults (blue and red are W- and E-dipping structures, respectively) as well as related sedimentary structures within the Quaternary deposits (unmigrated data in b1 and b2); the inset b3 is a schematic representation illustrating the methodology used for extraction of the GPR fault displacement (D: displacement; T: throw; H: heave). GPR facies fc2 shows semi-continuous and sub-horizontal reflections (Quaternary deposits) onlapping fc1 (Triassic dolostones, black line is the “top”). Circle 1 shows that reflection package thickening and truncation with localized attenuation are likely interpretable as “colluvial-wedge-like” (cw?) features, or deposits from degradation of earthquake fault free-face near the hanging wall (D∼0.6 m). In circle 2 fc2 is shown to be more discontinuous, from subparallel to wavy reflections package downlapping the lower top dolostone; the asymmetric, truncated reflection thickening is bounded by two conjugate normal fault strands (east dip D∼0.5 m, west-dip D=0.4 m) displacing both fc1 and fc2. Circle 3 shows a contorted reflection package with limited continuity, displaying thickening, truncation, and distributed attenuation, suggesting colluvial wedge deposits close to the main fault zone (D∼1.5 m, inset b3). Vertical exaggeration is 2.
These broken reflection packages present truncantions (e.g., Smith and Jol, 1995), displacements, and hyperbolic diffraction events (insets of Fig. 8b1, b2). Such a peculiar GPR signature is therefore compatible with coseismic displacement due to Late Quaternary surface faulting events (Fig. 8b). Contorted reflections across the main discontinuities frequently show localized strong attenuation of the GPR signal (Fig. 8b). The attenuation might be linked to their high dip angle, causing a minor amount of energy to be reflected back to the antenna, but, more likely, due to the presence of conductive fine soils nearby faulted zones (e.g., circle 1 in Fig. 8b). These conditions can be linked to different depositional facies across fault zones (McClymont et al., 2010), e.g., including colluvial wedges (Reiss et al., 2003; Bubeck et al., 2015) or deposits deriving from degradation of fault scarps (detailed interpretation within the caption of Fig. 8b). Using all such stratigraphic evidence and geophysical markers of faulting, we have therefore interpreted and classified synthetic (W-dipping, blue) and antithetic (E-dipping, red) normal faulting events (Fig. 8b). During the interpretation process, the faults were picked using solid lines (fault sticks); when the presence of geophysical markers of faulting were uncertain, a dashed fault segment was initially added, and then their possible connection among nearby GPR profiles was revised a second time.
The interpreted faults present a dip angle between 65–75∘ and variable amount of displacement (D), estimated by correlating the position of the top of the carbonate substratum in the footwall and hanging wall blocks (e.g., scheme summarized in the inset of Fig. 8b3). Considering the GPR profile of Fig. 8 as representative for the studied VCT sector, D is not exceeding ∼1 m for the W-dipping splays within the Quaternary sediments (∼0.5 m for the E-dipping splay). A displacement D of ∼1.5 m was derived across the sharp boundary between the Triassic dolostone and the Quaternary deposits (easternmost fault in Fig. 8b), being interpreted as the main fault. This clear contact is characterized in all profiles by hyperbolic diffractions (in unmigrated data), variable dip angle, abrupt truncations, and sharp lateral variation of the reflectivity suggesting a wide fault zone (Figs. 3 to 9), controlling the above-mentioned Quaternary splays. By interpolating all the fault sticks placed in adjacent profiles, we have created the fault surfaces, which show a good degree of continuity from north to south (Fig. 9). For the studied sector of the VCT, we have reconstructed the tridimensional fault network and the geometry of the associated synsedimentary deposits at a metric scale of observation (Fig. 9).
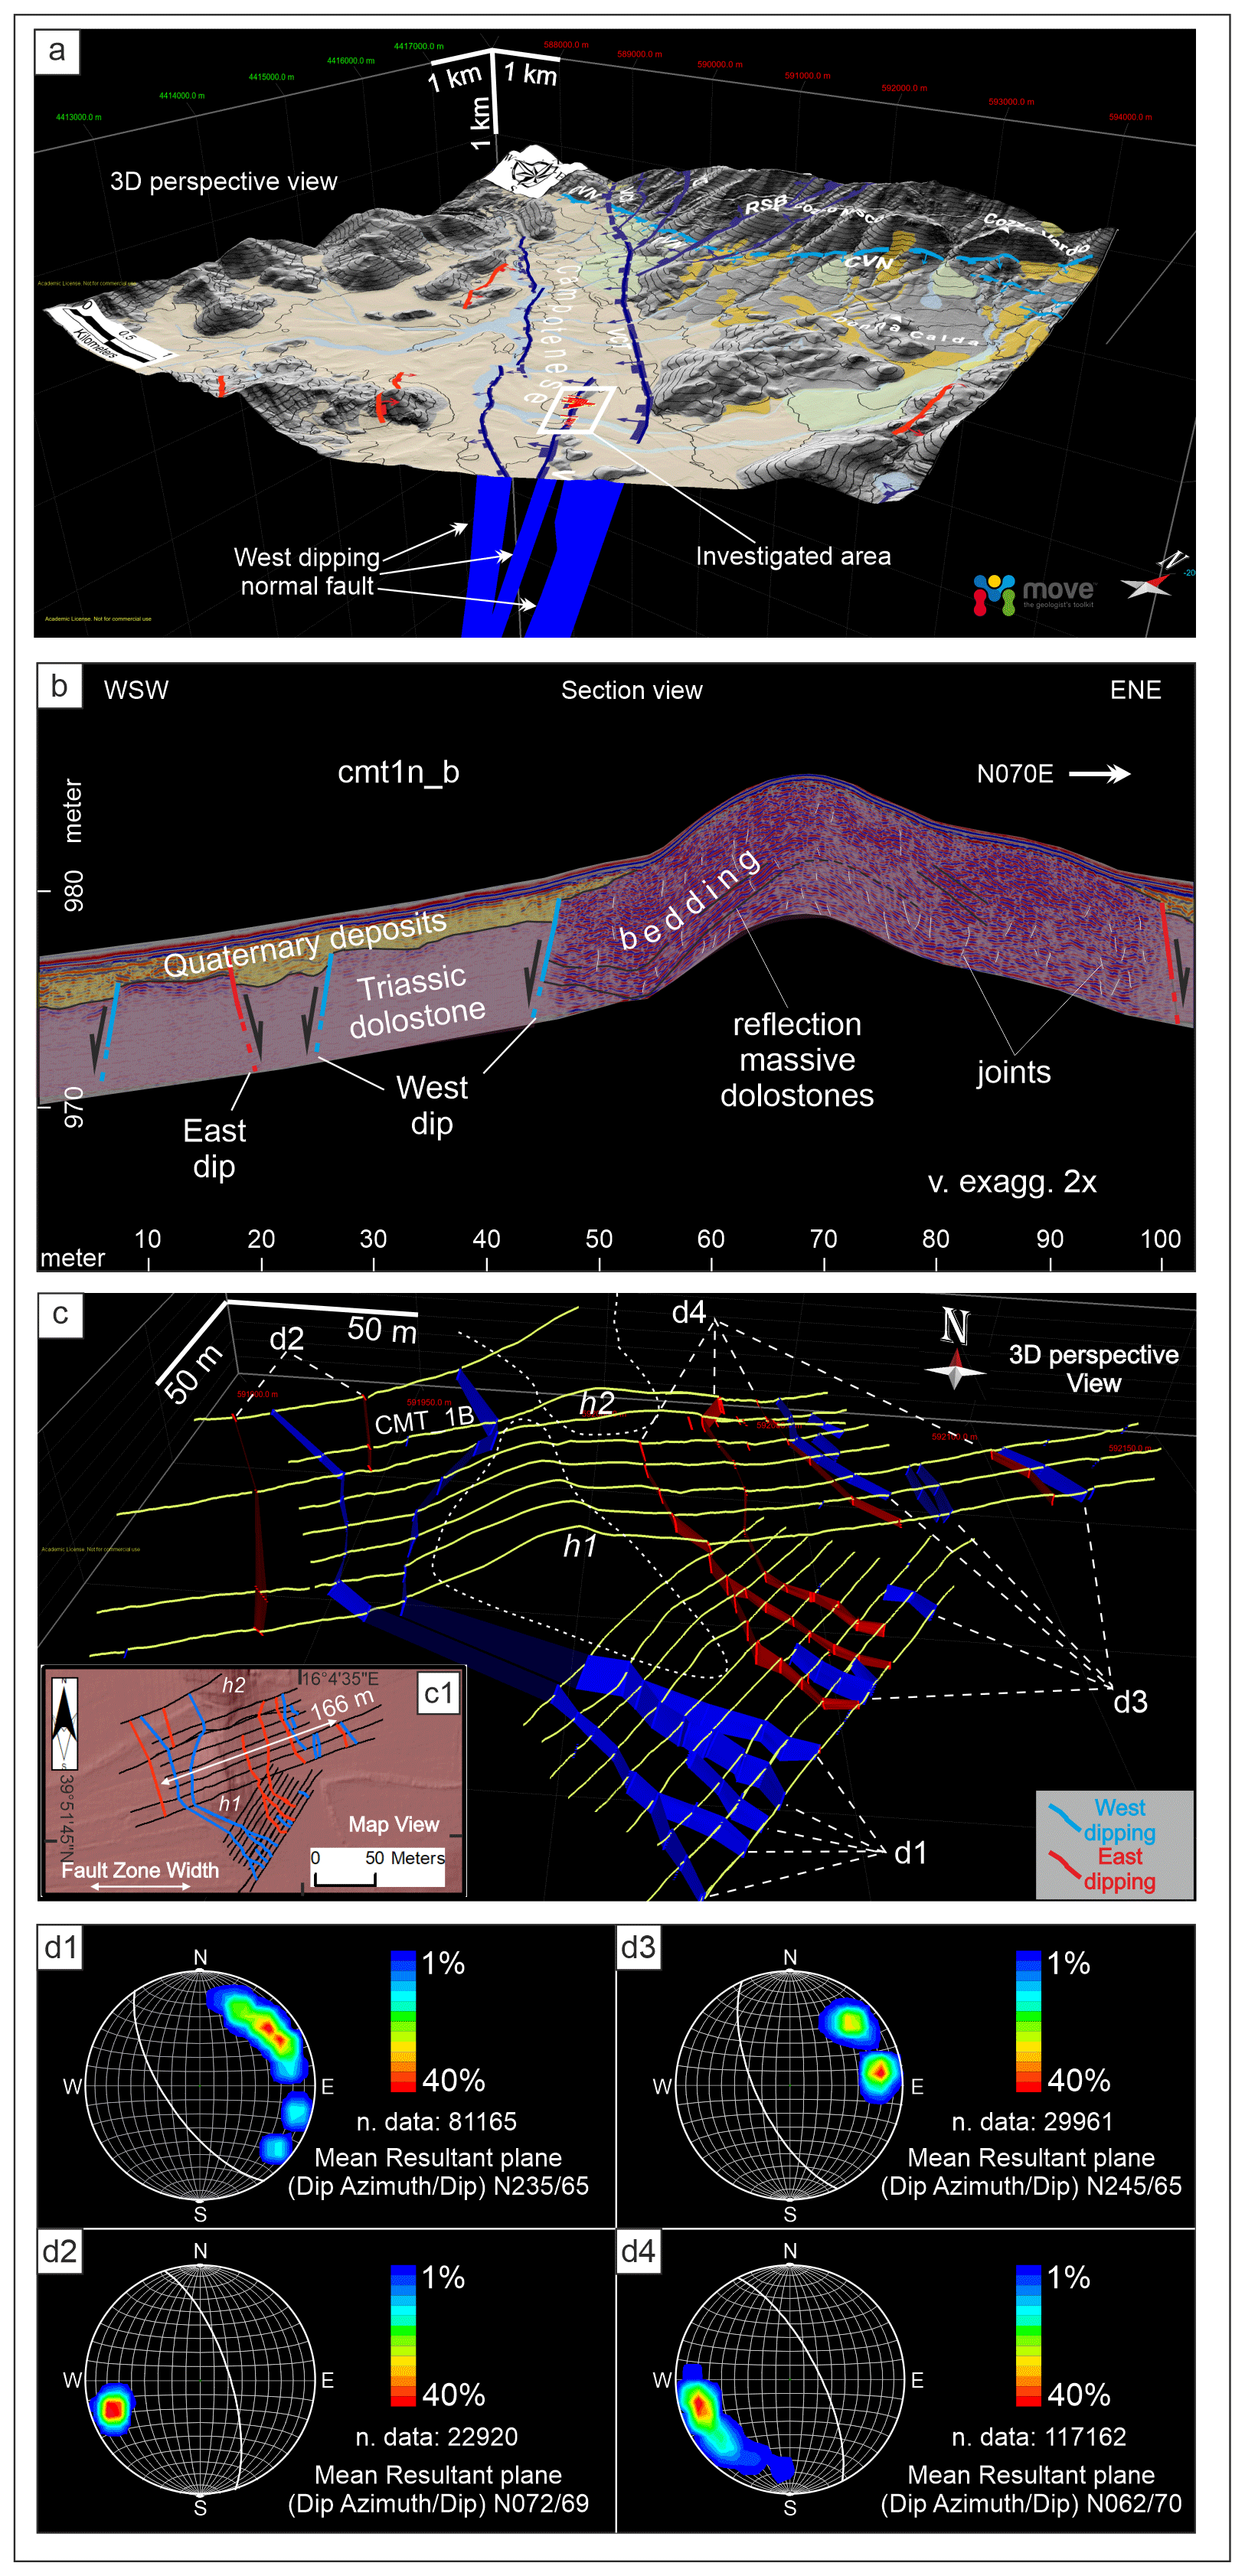
Figure 9Results of the three-dimensional analysis and interpretation performed on the entire GPR dataset: (a) 3D structural model of the Campotenese basin updated after Brozzetti et al. (2017a) (DTM sources: TINITALY by Tarquini et al., 2012, and by Regione Calabria – http://geoportale.regione.calabria.it/opendata, last access: 11 June 2021, under license IODL 2.0. – https://www.dati.gov.it/iodl/2.0/, last access: 11 June 2021); (b) GPR section view (cmt1n-b) with interpretation including synthetic and antithetic fault splays (blue= W to SW dip; red = E to NE dip, respectively); (c) detailed structural scratch of faults obtained by the analysis and correlation of interpreted fault splays across the entire GPR dataset; the inset c1 is a conventional structural map oriented to the north and reporting the same fault sets to highlight the maximum width derived for the fault zone (d) synthetic stereonet plots of the fault planes in (c), reporting the mean dip azimuth and dip angle extracted for the identified four main sets of discontinuities, with a dip azimuth ranging between 235–245 and 062–072∘ N for the W-dipping and E-dipping normal faults, respectively. Vertical exaggeration is 2.
5.1 Inferences from subsurface 3D model
The perspective view of Fig. 9a shows a 3D structural scheme of the main tectonic lineaments at the basin scale displaying a NW–SE fault strike (modified after Brozzetti et al., 2017a) in relation to the GPR investigated area (white rectangle). Our GPR interpretation enriches many of the details of such a former structural scheme across the southern VCT segment. We highlight an en échelon system of two main SW and NE-dipping faults as well as an articulated set of extensional meso-faults within the Quaternary sediments. The high-angle GPR discontinuities identified in the study (e.g., Fig. 9b) show a considerable continuity in the NW–SE direction (accurate 3D structural reconstruction in Fig. 9c), dissecting not only Quaternary alluvial and colluvial deposits (except for the very shallow fc2 layers), but also deeper stratigraphic layers.
The reconstructed faults mark a horst–graben structure, mostly buried within the Campotenese basin, which locally emerges from the Quaternary deposits. In the investigated area it corresponds to a NNW–SSE elongated topographic high (h1 and h2 in Fig. 2a) made by the Triassic dolostone. This horst is bordered toward the W and towards the E by SW- and NE-dipping normal faults, respectively (Fig. 9b, c). In Fig. 9c, the fault set d1, together with its antithetic set d2, shows the maximum displacement and the most evident deformation of the adjacent sub-surface deposits. The variations of thickness of such Quaternary deposits are consistent with the horst and graben configuration. Thinning is observed in correspondence with the raised buried blocks, whereas thickening, wedge-shaped, and chaotic geometries correspond to the lowered blocks. The main fault of set d1 can be considered a conjugate fault of the VCT (Fig. 8b), separated by a right step-over of about 0.5 km from the segment that borders the eastern basin (Figs. 2c, 8a). Thus, the fault-set d3 and d4 located on the eastern part of h1 and h2 can also be hierarchically classified as a network of minor splays embedded in the southern junction zone between the two VCT segments (Fig. 9c).
The three-dimensional model (Fig. 9a, c) highlights that these faults, despite having a typical Apenninic NW–SE trend, are characterized by a complex polymodal pattern of strikes, with alternating N–S to NW–SE direction. Therefore, such a polymodal character which was observed along all the extensional structures of the area (Brozzetti et al., 2017a) is also confirmed at the GPR scale along this VCT sector. A dedicated statistical analysis of the reconstructed fault planes is reported in the stereo plots of Fig. 9d (d1–d3 = W-dipping faults; d2–d4 = E-dipping faults).
5.2 Seismic hazard implications
The combination of geological and seismological data may suggest outcropping Quaternary faults are capable of releasing earthquakes, but the determination of the expected magnitude along these faults might not always be well constrained. An estimate can be made using well-known scale relationships (Wells and Coppersmith, 1994; Wesnousky et al., 2008; Leonard, 2010; Stirling et al., 2013) with knowledge of the geometric parameters (e.g., fault length, area, and depth), which are often difficult to assess. These scale relations can also be applied to Quaternary scarps caused by cumulative coseismic faulting produced by medium–strong earthquakes (generally M>6). Nevertheless, only through paleoseismological analysis, by sampling and dating the stratigraphy at different levels, is it possible to date and distinguish the amount of slip of each seismic event. But in cases like the VCT, the GPR data assume a key value since the key fault parameters were provided when no direct information on the nature of the surveyed deposits and no accurate dating are available. Our GPR interpretation by itself does not allow one to extract any date for a single earthquake, identify a succession of past seismic events, or establish recurrence times (Galli, 2020). However, it suggests a segmentation of the VCT and the presence of buried splays, which appear to have exerted a strong control on the deposition of Late Quaternary sediments. The location of Quaternary ruptures at a shallow depth in the flat land of an intra-mountain basin presently undergoing alluvial and colluvial sedimentation suggests their occurrence might be attributed to the Holocene. Thus, pointing out normal faulting of Holocene deposits would be, in itself, a very important and novel result for the Campotenese area. A Middle–Late Pleistocene age of activity was proposed for the Mercure and Campotenese boundary faults by Schiattarella et al. (1994) and Brozzetti et al. (2017a), with Holocene activity indirectly inferred on the basis of morpho-structural observations. More recently, an earthquake-structure association with the recent 2010–2014 Pollino seismic activity has been reconstructed through cross sections and relocated seismicity in Cirillo et al. (2021).
Our data are promising because the GPR facies interpretation highlights the possible presence of small-scale grabens or half-grabens (maximum estimated fault zone width of ∼ 160–170 m, inset c1 of Fig. 9c) and the likely fault-related deposits (e.g., as observed by Reiss et al., 2003), and Bubeck et al., 2015) at shallow depth. This inference would testify to not only the persistence of extensional deformations up to the Late Quaternary but would even imply the occurrence of episodes of surface faulting. In other words, the Campotenese basin may have been affected in the relatively recent past by medium–strong earthquakes, larger than the 2010–2014 mainshocks. It should be in fact considered that historical events with 6<Mw<7 surrounded the area, being documented a further ∼50 km north (1857 – Mw7.1) and ∼60 km south (1184 – Mw6.7, Fig. 1a) (Rovida et al., 2020). Some paleoseismological earthquakes with inferred magnitude 6.5<Mw<7 are attributed to the Castrovillari fault, located ∼20 km SE and also falling within the Pollino seismic gap (Cinti et al., 1997; Michetti et al., 1997; Cinti et al., 2002, 2015a).
The estimates of the VCT fault length provide an overall value of 15 km (Brozzetti et al., 2017a; Cirillo et al., 2021) which is compatible, in the case of a complete rupture, with the expected magnitudes of Mw=6.5 (Wells and Coppersmith, 1994) and Mw=6.8 (Stirling et al., 2013); these estimates are therefore suggesting this fault is well capable of producing surface breaks. Being the source of the most recent earthquakes (2012 – Mw5.2; 1894 – Mw5.1; 1708 – Mw5.8; and perhaps 1693 – Mw5.2) affecting the study area estimated at ∼8 km depth (Totaro et al., 2015; Brozzetti et al., 2017a; Napolitano et al., 2020, 2021; Sketsiou et al., 2021), the level of seismic energy released by such historical seismic events would likely be not enough to generate the VCT ruptures at surface. Therefore, it sounds reasonable that the hypothesis of past earthquake occurrence, nucleated from the VCT, with a magnitude sufficiently high to cause the buried coseismic ruptures highlighted by our GPR interpretation, which were subsequently erased at surface by footwall erosion and sedimentation at the hanging wall. In addition, because historical catalogs do not show events with Mw>6 (Rovida et al., 2020), a very energetic earthquake could have likely occurred before the period covered by the available seismological catalogs, proving new perspectives on the actual seismic hazard of the area.
Our novel GPR data and dedicated workflow allowed us to obtain a detailed 3D model of the southern sector of the Fosso della Valle–Campotenese fault (VCT) in the continental Campotenese basin, a seismic gap in the Mt. Pollino region (southern Italy). The processing, analysis, assemblage, and interpretation of the 49 GPR profiles was pursued using expertise, techniques, and tools borrowed from seismic reflection industry applications. The non-destructive GPR survey did not require special authorizations and was relatively fast and low cost. The pseudo-3D configuration was an efficient compromise between spatial coverage and duration of the data acquisition (four days of fieldwork). On the other hand, the data processing was non-trivial, requiring about 6 months overall to set up an optimized workflow, due to challenging data characteristics, such as the steep and rugged topography and the sharp lateral variations of dielectrical properties of media (Triassic dolostones vs. Quaternary deposits).
Our structural reconstruction derived by GPR data interpretation shows several sets of sub-vertical discontinuities within the near surface (∼1–4 m depth), which we interpreted as a pattern of extensional surface faulting. Such faults are bounding small local “graben or semi-graben-like” structures, which cut an hypothesized Holocene age clastic cover and underlying Triassic dolostones. We have also identified some chaotic and laterally discontinuous GPR-stratigraphic facies, interpreted as near-fault post-earthquake deposits (i.e., possible colluvial wedges). These shallow structures suggest the possibility that surface faulting due to past strong earthquakes (6<Mw<7) occurred in relatively recent times in the study area. Its traces at the surface were possibly later leveled by the concurrent natural processes of erosion, aggradation, and anthropogenic activities. As our results confirm the presence of seismic potential and thus the possible occurrence of a large earthquake in the future, we wish the primary effect of our study to be one of raising the level of attention regarding the seismic hazard in the Campotenese area, as well as prompting further research. Based on ground truthing, our work may represent a preparatory study for further geophysical surveys (3D GPR and other methods), as well as direct analysis including trenching, drilling, sampling campaigns, and dating (e.g., luminescence, radiocarbon). Although a further multidisciplinary approach would be necessary to achieve a quantitative (i.e., slip rates and recurrence times) assessment of the seismogenic potential of the study area, we firmly promote, particularly where near-surface data are lacking, a widespread use of the presented GPR workflow on other seismic gaps worldwide.
The entire GPR dataset presented in this study is available on request from the corresponding author.
ME and DC contributed equally to this work as first authors. ME, DC, CP, and FB led the fieldwork. ME analyzed and processed the GPR and GNSS data. ME, DC, CP, HMJ, and FB contributed to the paper conceptualization and writing. ME and DC managed all data in the GIS environment and within 3D interpretation programs (OpendTect, Move). DC realized the final 3D structural–geological model through Move software. DC and ME created and prepared all the figures. All authors reviewed and edited all the drafts.
The contact author has declared that neither they nor their co-authors have any competing interests.
Publisher’s note: Copernicus Publications remains neutral with regard to jurisdictional claims in published maps and institutional affiliations.
This article is part of the special issue ”Tools, data and models for 3-D seismotectonics: Italy as a key natural laboratory”. It is a result of the workshop on “Tools, data and models for 3D seismotectonics: the Italian laboratory over time”, Perugia, Italy, 9–10 July 2019.
We sincerely thank Leonardo Speziali, Costanzo Federico, and Roberto Volpe for their support during the field operations, as well as Khayal Gavarof for his massive and valuable collaboration in data organization and processing. We thank QGIS (https://www.qgis.org/it/site/, last access: 11 June 2021) for providing the software with an open-source license, Petroleum Experts (https://www.petex.com/products/move-suite/, last access: 11 June 2021), and dGB (https://www.dgbes.com/, last access: 11 June 2021) for providing the academic licenses MOVE and OpenDtect software. We acknowledge NETGEO for academic access to the NRTK network (http://www.netgeo.it/, last access: 11 June 2021). We would also like to thank the Ministero dell'Ambiente e della Tutela del Territorio e del Mare (MATTM) and the Regione Calabria for providing free access to geospatial data such as DTMs and aerials (Regione Calabria – http://geoportale.regione.calabria.it/opendata, last access: 11 June 2021), under license IODL 2.0. – https://www.dati.gov.it/iodl/2.0/, last access: 11 June 2021). We also sincerely thank the editor Luca de Siena and two anonymous reviewers for their constructive corrections and suggestions which contributed to the improvement of our paper. The paper is the result of collaboration within the framework of the Interuniversity Center for 3D Seismotectonics with territorial applications – CRUST (https://www.crust.unich.it/, last access: 11 June 2021).
The study has benefited from several funding sources including the agreements INGV-DPC 2012–2013 & 2014–2015, Project S1 - Miglioramento delle conoscenze per la definizione del potenziale sismogenetico – Base-knowledge improvement for assessing the seismogenic potential of Italy (coordinator: Andrea Argnani), https://istituto.ingv.it/l-ingv/progetti/progetti-finanziati-dal-dipartimento-di-protezione-civile-1/progetti-e-ur-dpc-2012-2013/s1_progetto.pdf (last access: 11 June 2021) and https://sites.google.com/site/ingvdpcprojects1/home (last access: 11 June 2021). Cristina Pauselli was responsible for UniPG, tasks D30/d2 (2012–2013) and D18/c1.1 (2014–2015), and Francesco Brozzetti was responsible for UniCH, tasks D26/c2 (2012–2013) and D12/b1.2 (2014–2015). These projects were funded by the Italian Presidenza del Consiglio dei Ministri – Dipartimento della Protezione Civile (DPC). The paper does not necessarily represent DPC official opinion and policy. This research was also supported by PRIN 2017(2017KT2MKE) funds from the Italian Ministry of Education, University and Research (principal investigator Giusy Lavecchia).
This paper was edited by Luca De Siena and reviewed by two anonymous referees.
Amicucci, L., Barchi, M. R., Montone, P., and Rubilani, N.: The Vallo di Diano and Auletta extensional basins in the southern Apennines (Italy): a simple model for a complex setting, Terra Nova, 20, 475–482, https://doi.org/10.1111/j.1365-3121.2008.00841.x, 2008.
Amodio Morelli, L., Bonardi, G., Colonna, V., Dietrich, D., Giunta, G., Ippolito, F., Liguori, V., Lorenzoni, S., Paglionico, A., Perrone, V., Piccarreta, G., Russo, M., Scandone, P., Zanettin-Lorenzoni, E., and Zuppetta, A.: L'Arco calabro peloritano nell'orogene appenninico-maghrebide, Mem. Soc. Geol. It., 17, 1–60, 1976.
Anchuela, Ó. P., Lafuente, P., Arlegui, L., Liesa, C. L., and Simon, J. L.: Geophysical characterization of buried active faults: the Concud Fault (Iberian Chain, NE Spain), Int. J. Earth. Sci. (Geol. Rundsch.), 105, 2221–2239, https://doi.org/10.1007/s00531-015-1283-y, 2016.
Annan, A. P.: Ground-penetrating radar workshop notes, Sensors and Software Inc. Mississauga, ON, Canada, 192 pp., 2001.
Ascione, A., Cinque, A., Santangelo, N., and Tozzi, M.: Il Bacino del Vallo di Diano e la tettonica trascorrente plio-quaternaria: nuovi vincoli cronologici e cinematici, Stud. Geol. Camerti, 1992/1, 201–208, 1992a.
Audru, J. C., Bano, M., Begg, J., Berryman, K., Henrys, S., and Niviere, B.: GPR investigations on active faults in urban areas: the Georisc-NZ project in Wellington, New Zealand, Comptes Rendus de l'Academie des Sciences – Series IIA, Earth Planet. Sci., 333, 447–454, https://doi.org/10.1016/S1251-8050(01)01663-9, 2001.
Bano, M., Edel, J.-B., Herquel G., and EPGS class 2001/2002: Geophysical investigation of a recent shallow fault, The Leading Edge, 21, 648–650, https://doi.org/10.1190/1.1497317, 2002.
Barchi, M. R., Lavecchia, G., Galadini, F., Messina P., Michetti, A. M., Peruzza, L., Pizzi, A., Tondi., E., and Vittori, E.: Sintesi delle conoscenze sulle faglie attive in Italia Centrale: parametrizzazione ai fini della caratterizzazione della pericolosità sismica, CNR-GNDT, Projects 5.1.2, 6a2, 5.1.1, Esagrafica, Roma, 2000.
Barchi, M. R., Carboni, F., Michele, M., Ercoli, M., Giorgetti, C., Porreca, M., Azzaro, S., and Chiaraluce, L.: The influence of subsurface geology on the distribution of earthquakes during the 2016–2017 Central Italy seismic sequence, Tectonophysics, 807, 228797, https://doi.org/10.1016/j.tecto.2021.228797, 2021.
Bello, S., de Nardis, R., Scarpa, R., Brozzetti, F., Cirillo, D., Ferrarini, F., di Lieto, B., Arrowsmith, R. J., and Lavecchia, G.: Fault Pattern and Seismotectonic Style of the Campania – Lucania 1980 Earthquake (Mw6.9, Southern Italy): New Multidisciplinary Constraints, Front. Earth Sci., 8, 652, https://doi.org/10.3389/feart.2020.608063, 2021.
Benson, A. K.: Applications of ground penetrating radar in assessing some geological hazards: examples of groundwater contamination, faults, cavities, J. Appl. Geophys., 33, 177–193, https://doi.org/10.1016/0926-9851(95)90040-3, 1995.
Beres, M., Huggenberger, P., Green, A. G., and Horstmeyer, H.: Using two- and three-dimensional georadar methods to characterize glaciofluvial architecture, Sediment. Geol., 129, 1–24, 1999.
Boncio, P., Pizzi, A., Brozzetti, F., Pomposo, G., Lavecchia, G., Di Naccio, D., and Ferrarini, F.: Coseismic ground deformation of the 6 april 2009 L'Aquila earthquake (central Italy, Mw6.3), Geophys. Res. Lett., 37, L06308, https://doi.org/10.1029/2010GL042807, 2010.
Brandes, C., Igel, J., Loewer, M., Tanner, D., C., Lang, J., Müller, K., and Winsemann, J.: Visualisation and analysis of shear-deformation bands in unconsolidated Pleistocene sand using ground-penetrating radar: Implications for paleoseismological studies, Sediment. Geol., 367, 135–145, https://doi.org/10.1016/j.sedgeo.2018.02.005, 2018.
Bricheva, S. S., Dubrovin, I. O., Lunina, O. V., Denisenko, I. A., Matasov, V. M., Turova, I. V., Entin, A. L., Panin, A. V., and Deev, E. V.: Numerical simulation of ground-penetrating radar data for studying the geometry of fault zone, Near Surf. Geophys., 19, 261–277, https://doi.org/10.1002/nsg.12153, 2021.
Bristow, C. S. and Jol, H. M.: GPR in sediments: advice on data collection, basic processing and interpretation, a good practice guide, in: Ground Penetrating Radar in Sediments, edited by: Bristow C. S. and Jol H. M., Geol. Soc. Spec. Publ., 211, 1–7, https://doi.org/10.1144/GSL.SP.2001.211.01.02, 2003.
Brozzetti, F.: The Campania-Lucania extensional fault system (southern Italy): a suggestion for a uniform model of active extension in the Italian Apennines, Tectonics, 30, TC5009, https://doi.org/10.1029/2010TC002794, 2011.
Brozzetti, F. and Lavecchia, G.: Seismicity and related extensional stress field: the case of the Norcia Seismic Zone (Central Italy), Ann. Tectonicae, 8, 36–57, 1994.
Brozzetti, F., Lavecchia, G., Mancini, G., Milana G., and Cardinali, M.: Analysis of the 9 September 1998 Mw5.6 Mercure earthquake sequence (southern Apennines, Italy), a multidisciplinary approach, Tectonophysics, 476, 210–225, https://doi.org/10.1016/j.tecto.2008.12.007, 2009.
Brozzetti, F., Cirillo, D., Liberi, F., Faraca, E., and Piluso, E.: The Crati Valley Extensional System: field and subsurface evidences, Rend. Online Soc. Geol. It., 21, 159–161, 2012.
Brozzetti, F., Cirillo, D., de Nardis, R., Lavecchia, G., and Cardinali, M.: Detailed mapping of active faults in the Calabro-Lucania Region, Report INGV-DPC 2014–2015 project S1 ”Base-knowledge improvement for assessing the seismogenic potential of Italy, available at: https://sites.google.com/site/ingvdpcprojects1/home (last access: 11 June 2021), 2015.
Brozzetti, F., Cirillo, D., de Nardis, R., Cardinali, M., Lavecchia, G., Orecchio, B., Presti D., and Totaro, C.: Newly identified active faults in the Pollino seismic gap, southern Italy, and their seismotectonic significance, J. Struct. Geol., 94, 13–31, https://doi.org/10.1016/j.jsg.2016.10.005, 2017a.
Brozzetti, F., Cirillo, D., Liberi, F., Piluso, E., Faraca, E., De Nardis, R., and Lavecchia, G.: Structural style of Quaternary extension in the Crati Valley (Calabrian Arc): Evidence in support of an east-dipping detachment fault, It. Journ. of Geosci., 136, 434–453, https://doi.org/10.3301/IJG.2017.11, 2017b.
Brozzetti, F., Boncio, P., Cirillo, D., Ferrarini, F., de Nardis, R., Testa, A., Liberi, F., and Lavecchia, G.: High resolution field mapping and analysis of the August–October 2016 coseismic surface faulting (Central Italy Earthquakes): slip distribution, parameterization and comparison with global earthquakes, Tectonics, 38, 417–439, https://doi.org/10.1029/2018TC005305, 2019.
Brozzetti, F., Mondini, A. C., Pauselli, C., Mancinelli, P., Cirillo, D., Guzzetti, F., and Lavecchia, G.: Mainshock anticipated by intra-sequence ground deformations: Insights from multiscale field and SAR interferometric measurements, Geosciences (Switzerland), 10, 186, https://doi.org/10.3390/geosciences10050186, 2020.
Bubeck, A., Wilkinson, M., Roberts, G. P., Cowie, P. A., McCaffrey, K. J. W., Phillips, R., and Sammonds, P.: The tectonic geomorphology of bedrock scarps on active normal faults in the Italian Apennines mapped using combined ground penetrating radar and terrestrial laser scanning, Geomorphology, 237, 38–51, https://doi.org/10.1016/j.geomorph.2014.03.011, 2015.
Busby, J. P. and Merritt, J. W.: Quaternary deformation mapping with ground penetrating radar, J. Appl. Geophys., 41, 75–91, https://doi.org/10.1016/S0926-9851(98)00050-0, 1999.
Cai, J., McMechan, G. A., and Fisher, M. A.: Application of ground penetrating radar to investigation of near-surface fault properties in the San Francisco Bay region, Bull. Seism. Soc. Am., 86, 1459–1470, 1996.
Calamita, F., Pizzi, A., and Roscioni, M.: I fasci di faglie recenti ed attive di M. Vettore – M. Bove e di M. Castello – M. Cardosa (Appennino Umbro-Marchigiano), in: Studi Geologici Camerti; Università di Camerino: Camerino, Italy, 81–95, available at: http://193.204.8.201:8080/jspui/handle/1336/552 (last access: 9 February 2021), 1992.
Carpentier, S. F. A., Green, A. G., Langridge, R., Boschetti, S., Doetsch, J., Abacherli, A. N., Horstmeyer, H., and Finnemore, M.: Flower structures and Riedel shears at a step over zone along the Alpine Fault (New Zealand) inferred from 2-D and 3-D GPR images, J. Geophys. Res., 117, B02406, https://doi.org/10.1029/2011JB008749, 2012a.
Carpentier, S. F. A., Green, A. G., Doetsch, J., Dorn, C., Kaiser, A. E., Campbell, F., Horstmeyer, H., and Finnemore, M.: Recent deformation of Quaternary sediments as inferred from GPR images and shallow P-wave velocity tomograms: Northwest Canterbury Plains, New Zealand, J. Appl. Geophys., 8, 2–15, https://doi.org/10.1016/j.jappgeo.2011.09.007, 2012b.
Cello, G., Tondi, E., Micarelli, L., and Mattioni, L.: Active tectonics and earthquake sources in the epicentral area of the 1857 Basilicata earthquake (southern Italy), J. Geodyn., 36, 37–50, https://doi.org/10.1016/S0264-3707(03)00037-1, 2003.
Chiaraluce, L., Di Stefano, R., Tinti, E., Scognamiglio, L., Michele, M., Casarotti, E., Cattaneo, M., De Gori, P., Chiarabba, C., Monachesi, G., Lombardi, A., Valoroso, L., Latorre, D., and Marzorati, S.: The 2016 Central Italy Seismic Sequence: A First Look at the Mainshocks, Aftershocks, and Source Models, Seismol. Res. Lett., 88, 757–771, https://doi.org/10.1785/0220160221, 2017.
Christie, M., Tsoflias, G. P., Stockli, D. F., and Black, R.: Assessing fault displacement and off-fault deformation in an extensional tectonic setting using 3-D ground-penetrating radar imaging, J. Appl. Geophys., 68, 9–16, https://doi.org/10.1016/j.jappgeo.2008.10.013, 2009.
Cinti, F. R., Cucci, L., Pantosti, D., D'Addezio, G., and Meghraoui, M.: A major seismogenic fault in a “silent area”: the Castrovillari fault (southern Apennines, Italy), Geophys. J. Int., 130, 595–605, 1997.
Cinti, F. R., Moro, M., Pantosti, D., Cucci, L., and D'Addezio, G.: New constraints on the seismic history of the Castrovillari fault in the Pollino gap (Calabria, southern Italy), J. Seismol., 6, 199–217, https://doi.org/10.1023/A:1015693127008, 2002.
Cinti, F. R., Pauselli, C., Livio, F., Ercoli, M., Brunori, C. A., Ferrario, F., Volpe, R., Civico, R., Pantosti, D., Pinzi, S., De Martini, P. M., Ventura, G., Alfonsi, L., Gambillara, R., and Michetti, A. M.: Integrating multidisciplinary, multi-scale geological and geophysical data to image the Castrovillari fault (Northern Calabria, Italy), Geophys. J. Int., 203, 1847–1863, https://doi.org/10.1093/gji/ggv404, 2015a.
Cinti, F. R., Alfonsi, L., D'Alessio, A., Marino, S., and Brunori, C. A.: Faulting and Ancient Earthquakes at Sybaris archaeological site, Ionian Calabria, Southern Italy, Seism. Res. Lett., 86, 245–254, https://doi.org/10.1785/02201401071, 2015b.
Cinti, F. R., De Martini, P. M., Pantosti, D., Baize, S., Smedile, A., Villani, F., Civico, R., Pucci, S., Lombardi, A. M., Sapia, V., Pizzimenti, L., Caciagli, M., and Brunori, C. A.: 22-kyr-long record of surface faulting along the source of the 30 October 2016 earthquake (central Apennines, Italy), from integrated paleoseismic data sets. J. Geophys. Res.-Sol. Ea., 124, 9021–9048, https://doi.org/10.1029/2019JB017757, 2019.
Cirillo, D.: Digital Field Mapping and Drone-Aided Survey for Structural Geological Data Collection and Seismic Hazard Assessment: Case of the 2016 Central Italy Earthquakes, Appl. Sci., 10, 5233, https://doi.org/10.3390/app10155233, 2020.
Cirillo, D., Totaro, C., Lavecchia, G., Orecchio, B., de Nardis, R., Presti, D., Ferrarini, F., Bello, S., and Brozzetti, F.: Structural complexities and tectonic barriers controlling recent seismic activity of the Pollino area (Calabria-Lucania, Southern Italy) – constraints from stress inversion and 3D fault model building, Solid Earth Discuss. [preprint], https://doi.org/10.5194/se-2021-76, in review, 2021.
Conyers, L. B.: Ground-penetrating Radar for Geoarchaeology, Wiley-Blackwell, London, Wiley Online Library, 160 pp., https://doi.org/10.1002/9781118949993, 2016.
Daniels, D. J.: Ground Penetrating Radar: Radar, Sonar and amp; Navigation, Institution of Engineering and Technology, London, IEE Press, 752 pp., https://doi.org/10.1002/0471654507.eme152, 2004.
Davis, J. L. and Annan, A. P.: Ground penetrating radar for high resolution mapping of soil and rock stratigraphy, Geophys. Prospect., 37, 531–551, 1989.
Demanet, F., Renardy, D., Vanneste, K., Jongmans, D., Camelbeeck, T., and Meghraoui, M.: The use of geophysical prospecting for imaging active faults in the Roer Graben, Belgium, Geophysics, 66, 78–89, https://doi.org/10.1190/1.1444925, 2001.
Dujardin, J. R. and Bano, M.: Topographic migration of GPR data: Examples from Chad and Mongolia, C. R. Geosci., 345, 73–80, https://doi.org/10.1016/j.crte.2013.01.003, 2013.
Ercoli, M., Pauselli, C., Frigeri, A., Forte, E., and Federico, C.: “Geophysical paleoseismology” through high resolution GPR data: A case of shallow faulting imaging in Central Italy, J. Appl. Geophys., 90, 27–40, https://doi.org/10.1016/j.jappgeo.2012.12.001, 2013a.
Ercoli, M., Pauselli, C., Forte, E., Frigeri, A., and Federico, C.: The Mt. Pollino Fault (southern Apennines, Italy): GPR signature of Holocenic earthquakes in “silent” area, 7th Int. Work. Adv. Gr. Penetrating Radar, IEEE, 1–6, https://doi.org/10.1109/IWAGPR.2013.6601510, 2013b.
Ercoli, M., Pauselli, C., Frigeri, A., Forte, E., and Federico, C.: 3-D GPR data analysis for high-resolution imaging of shallow subsurface faults: The Mt Vettore case study, Central Apennines, Italy, Geoph. J. Int., 198, 609–621, https://doi.org/10.1093/gji/ggu156, 2014.
Ercoli, M., Pauselli, C., Cinti, F. R., Forte, E., and Volpe, R.: Imaging of an active fault: Comparison between 3D GPR data and outcrops at the Castrovillari fault, Calabria, Italy, Interpretation, 3, SY57–SY66, https://doi.org/10.1190/INT-2014-0234.1, 2015.
Ercoli, M., Di Matteo, L., Pauselli, C., Mancinelli, P., Frapiccini, S., Talegalli, L., and Cannata, A.: Integrated GPR and laboratory water content measures of sandy soils: From laboratory to field scale, Constr. Build. Mater., 159, 734–744, https://doi.org/10.1016/j.conbuildmat.2017.11.082, 2018.
Ercoli, M., Forte, E., Porreca, M., Carbonell, R., Pauselli, C., Minelli, G., and Barchi, M. R.: Using seismic attributes in seismotectonic research: an application to the Norcia Mw = 6.5 earthquake (30 October 2016) in central Italy, Solid Earth, 11, 329–348, https://doi.org/10.5194/se-11-329-2020, 2020.
Ferrarini, F., de Nardis, R., Brozzetti, F., Cirillo, D., Arrowsmith, J. R., and Lavecchia, G.: Multiple Lines of Evidence for a Potentially Seismogenic Fault Along the Central-Apennine (Italy) Active Extensional Belt–An Unexpected Outcome of the MW6.5 Norcia 2016 Earthquake, Front. Earth Sci., 9, 642243, https://doi.org/10.3389/feart.2021.642243, 2021.
Ferrario, M. F. and Livio, F.: Characterizing the distributed faulting during the 30 October 2016, Central Italy earthquake: A reference for fault displacement hazard assessment, Tectonics, 37, 1256–1273, https://doi.org/10.1029/2017TC004935, 2018.
Filice, F. and Seeber, L.: The Culmination of an Oblique Time-Transgressive Arc Continent Collision: The Pollino Massif Between Calabria and the Southern Apennines, Italy, Tectonics, 38, 3261–3280, https://doi.org/10.1029/2017TC004932, 2019.
Filice, F., Liberi, F., Cirillo, D., Pandolfi, L., Marroni, M., and Piluso, E.: Geological map of the central sector of the Catena Costiera (Northern Calabria), Rend. Online Soc. Geol. It., 29, 55–58, 2013.
Filice, F., Liberi, F., Cirillo, D., Pandolfi, L., Marroni, M., and Piluso E.: Geology map of the central area of Catena Costiera: insights into the tectono-metamorphic evolution of the Alpine belt in Northern Calabria, J. Maps, 11, 114–125, https://doi.org/10.1080/17445647.2014.944877, 2015.
Forte, E. and Pipan, M.: Review of multi-offset GPR applications: Data acquisition, processing and analysis, Signal Process., 132, 210–220, https://doi.org/10.1016/j.sigpro.2016.04.011, 2017.
Frigeri, A. and Ercoli, M.: The ScanMars Subsurface Radar Sounding Experiment on AMADEE-18, Astrobiology, 20, 1338–1352, https://doi.org/10.1089/ast.2019.2037, 2020.
Gafarov, K., Ercoli, M., Cirillo, D., Pauselli, C., and Brozzetti, F.: Extending surface geology data through GPR prospections: Quaternary faulting signature from the Campotenese area (Calabria-Italy), 17th International Conference on Ground Penetrating Radar (GPR), Rapperswil, 1–4, https://doi.org/10.1109/ICGPR.2018.8441611, 2018.
Galadini, F. and Galli, P.: Paleoseismology of silent faults in the Central Apennines (Italy): the Mt. Vettore and Laga Mts. Faults, Ann. Geophys.-Italy, 46, 815–836, https://doi.org/10.4401/ag-3457, 2003.
Galadini, F., Meletti, C., and Vittori, E.: Major active faults in Italy: available surficial data, Netherlands J. Geosci., 80, 273–296, 2001.
Galli, P.: Recurrence times of central-southern Apennine faults (Italy): Hints from paleoseismology, Terra Nova, 32, 399–407, https://doi.org/10.1111/ter.12470, 2020.
Galli, P., Galderisi, A., Peronace, E., Giaccio, B., Hajdas, I., Messina, P., Pileggi, D., and Polpletta, F.: The awakening of the dormant Mount Vettore fault (2016 central Italy earthquake, Mw6.6): Paleoseismic clues on its millennial silences, Tectonics, 38, 687–705, https://doi.org/10.1029/2018TC005326, 2019.
Geoportale Nazionale: Lidar data 1 m resolution, Ministero dell'Ambiente e della Tutela del Territorio e del Mare – Creative Commons License (Cc BY-SA 3.0 IT), http://www.pcn.minambiente.it/mattm/ (last access: 11 June 2021), 2018.
Ghisetti, F. and Vezzani, L.: Structural Map of Mt. Pollino (Southern Italy), 1:50 000 Scale, SELCA, Firenze, Italy, 1983.
Goodman, D. and Piro, S.: GPR Remote Sensing, in: Archaeology Springer Science & Business Media, ISBN 978 3 642 31856 6, https://doi.org/10.1007/978-3-642-31857-3, 2013.
Goodman, D., Hongo, H., Higashi, N., Inaoka, H., and Nishimura, Y.: GPR surveying over burial mounds: correcting for topography and the tilt of the GPR antenna, Near Surf. Geophys., 5, 383–388, https://doi.org/10.3997/1873-0604.2007020, 2007.
Grandjaquet, C. L. and Grandjaquet, M. J.: Geologie de la zone de Diamante-Verbicaro (Calabre), Geol. Romana, 1, 297–312, 1962.
Grasmueck, M.: 3-D ground-penetrating radar applied to fracture imaging in gneiss, Geophysics, 61, 1050–1064, https://doi.org/10.1190/1.1444026, 1996.
Grasmueck, M., Weger, R., and Horstmeyer, H.: Full-resolution 3D GPR imaging, Geophysics, 70, K12–K19, 2005.
Green, A. G., Gross, R., Holliger, K., Horstmeyer, H., and Baldwin, J.: Results of 3-D georadar surveying and trenching the San Andreas fault near its northern landward limit, Tectonophysics, 368, 7–23, https://doi.org/10.1016/S0040-1951(03)00147-1, 2003.
Gross, R., Green, A. G., Holliger, K., Horstmeyer, H., and Baldwin, J.: Shallow geometry and displacements on the San Andreas Fault near Point Arena based on trenching and 3-D georadar surveying, Geophys. Res. Lett., 29, 1973, https://doi.org/10.1029/2002GL015534, 2002.
Gross, R., Green, A. G., Horstmeyer, H., Holliger, K., and Baldwin, J.: 3-D georadar images of an active fault: efficient data acquisition, processing and interpretation strategies, Subsurf. Sens. Technol. Appl., 4, 19–40, https://doi.org/10.1023/A:1023059329899, 2003.
Gross, R., Green, A. G., Horstmeyer, H., and Begg, J. H.: Location and geometry of the Wellington Fault (New Zealand) defined by detailed three-dimensional georadar data, J. Geophys. Res., 109, B05401, https://doi.org/10.1029/2003JB002615, 2004.
Heincke, B., Green, A. G., van der Kruk, J., and Willenberg, H.: Semblance-based topographic migration (SBTM): A method for identifying fracture zones in 3D georadar data, Near Surf. Geophys., 4, 79–88, https://doi.org/10.3997/1873-0604.2005034, 2006.
Huggenberger, P.: Radar facies: recognition of facies patterns and heterogeneities within Pleistocene Rhine gravels, NE Switzerland, In Braided Rivers, edited by: Best, J. L. and Bristow, C. S., Geol. Soc. London Spec. Publ., 75, 163–176, 1993.
Iannace, A., D'Errico, M., and Vitale, S.: Carta Geologica dell'area compresa tra Maratea, Castrovillari e Sangineto, in: Analisi Dello Strain Finito in 3D Dell'Unità Pollino-Ciagola (Confine Calabro-lucano, Italia Meridionale), edited by: Vitale, S., and Iannace, A., Studi Geologici Camerti, Nuova Serie, 2, 153–167, ISSN 0392-0631, 2004.
Iannace, A., Garcia Tortosa, F. J., and Vitale, S.: The Triassic metasedimentary successions across the boundary between Southern Apennines and Calabria–Peloritani Arc (Northern Calabria, Italy), Geol. J., 40, 155–171, https://doi.org/10.1002/gj.1001, 2005.
Iannace, A., Vitale, S., D'Errico, M., Mazzoli, S., Di Staso, A., Macaione, E., Messina, A., Reddy, S. M., Somma, R., Zamparelli, V., Zattin, M., and Bonardi, G.: The carbonate tectonic units of northern Calabria (Italy): a record of Apulian palaeomargin evolution and Miocene convergence, continental crust subduction, and exhumation of HP–LT rocks, J. Geol. Soc. Lond., 164, 1165–1186, https://doi.org/10.1144/0016-76492007-017, 2007.
Imposa, S., De Guidi, G., Grassi, S., Scudero, S., Barreca, G., Patti, G., and Boso, D.: Applying geophysical techniques to investigate a segment of a creeping fault in the urban area of San Gregorio di Catania, southern flank of Mt. Etna (Sicily–Italy), J. Appl. Geophys., 123, 153–163, https://doi.org/10.1016/j.jappgeo.2015.10.008, 2015.
INGV – Istituto Nazionale di Geofisica e Vulcanologia: Open Data Portal, Istituto Nazionale di Geofisica e Vulcanologia (INGV) [data set], available at: https://data.ingv.it/en/, (last access: 11 June 2021), February 2020.
ISIDe Working Group, Italian Seismological Instrumental and Parametric Database (ISIDe), Istituto Nazionale di Geofisica e Vulcanologia (INGV) [data set], https://doi.org/10.13127/ISIDE, 2007.
Jewell, C. J. and Bristow, C. S.: GPR studies in the Piano di Pezza area of the Ovindoli-Pezza Fault, Central Apennines, Italy: Extending palaeoseismic trench investigations with high resolution GPR profiling, Near Surf. Geophys., 4, 147–153, https://doi.org/10.3997/1873-0604.2005040, 2006.
Jol, H. M.: Ground Penetrating Radar: Theory and Applications, Elsevier Science, Amsterdam, Netherlands, 544 pp., ISBN 978 0 44453 348 7, 2009.
Lehmann, F. and Green, A. G.: Topographic migration of georadar data: Implications for acquisition and processing, Geophysics, 65, 836–848, https://doi.org/10.1190/1.1444781, 2000.
Liberi, F., Morten, L., and Piluso, E.: Geodynamic significance of the ophiolites within the Calabrian Arc, Island Arc, 15, 26–43, https://doi.org/10.1111/j.1440-1738.2006.00520.x, 2006.
Liberty, L. M., Hemphill-Haley, M. A., and Madin, I. P.: The Portland Hills Fault: uncovering a hidden fault in Portland, Oregon using high resolution geophysical methods, Tectonophysics, 368, 89–103, https://doi.org/10.1016/S0040-1951(03)00152-5, 2003.
Liner, C. L. and Liner, J. L.: Application of GPR to a site investigation involving shallow faults, The Leading Edge, 16, 1649–1651, https://doi.org/10.1190/1.1437545, 1997.
Malik, J. N., Sahoo, A. K., and Shah, A. A.: Ground-penetrating radar investigation along Pinjore Garden Fault: implication toward identification of shallow subsurface deformation along active fault, NW Himalaya, Curr. Sci., 93, 1422–1427, 2007.
Malik, J. N., Kumar, A., Satuluri, S., Puhan, B., and Mohanty, A.: Ground-Penetrating Radar Investigations along Hajipur Fault: Himalayan Frontal Thrust-Attempt to Identify Near Subsurface Displacement, NW Himalaya, India, Int. J. Geophys., 2021, 608269, https://doi.org/10.1155/2012/608269, 2012.
Maschio, L., Ferranti, L., and Burrato, P.: Active extension in Val d'Agri area, southern Apennines, Italy: Implications for the geometry of the seismogenic belt, Geophys. J. Int., 162, 591–609, https://doi.org/10.1111/j.1365-246X.2005.02597.x, 2005.
Matoš, B., Zajc, M., Kordić, B., Tomljenović, B., and Gosar, A.: Quaternary fault activity in the SW Pannonian Basin: GPR surveying in the Bilogora Mt. (NE Croatia), Geol. Q., 61, 18–36, https://doi.org/10.7306/gq.1308, 2017.
McCalpin, J. P.: Paleoseismology, 2nd Edition, International Geophysics Series, 95, Elsevier Publishing, 647 pp., plus additional website content, available at: https://www.elsevier.com/de-de (last access: 11 June 2021), ISBN 978-0-12-373576-8, 2009.
McCann, W. R., Nishenko, S. P., Sykes, I. R., and Krause, J.: Seismic gaps and plate tectonics: seismic potential for major boundaries, Pure Appl. Geophys., 117, 1082–1147, 1979.
McClymont, A. F., Green, A. G., Villamor, P., Horstmeyer, H., Grass, C., and Nobes, D. C.: Characterization of the shallow structures of active fault zones using 3-D GPR data, J. Geophys. Res., 113, B10315, https://doi.org/10.1029/2007JB005402, 2008.
McClymont, A. F., Villamor, P., and Green, A. G.: Fault displacement accumulation and slip rate variability within the Taupo Rift (New Zealand) based on trench and 3-D ground-penetrating radar data, Tectonics, 28, TC4005, https://doi.org/10.1029/2008TC002334, 2009.
McClymont, A. F., Green, A. G., Kaiser, A., Horstmeyer, H., and Langridge, R.: Shallow fault segmentation of the Alpine fault zone, New Zealand revealed from 2- and 3-D GPR surveying, J. Appl. Geophys., 70, 343–354, https://doi.org/10.1016/j.jappgeo.2009.08.003, 2010.
Michele, M., Chiaraluce, L., Di Stefano, R., and Waldhauser, F.: Fine-scale structure of the 2016–2017 Central Italy seismic sequence from data recorded at the Italian National Network, J. Geophys. Res.-Sol. Ea., 125, e2019JB018440, https://doi.org/10.1029/2019JB018440, 2020.
Michetti, A. M., Ferreli, L., Serva, L., and Vittori, E.: Geological evidence for strong historical earthquakes in an ”aseismic” region: The Pollino case (Southern Italy), J. Geodyn., 24, 67–86, https://doi.org/10.1016/S0264-3707(97)00018-5, 1997.
Michetti, A. M., Ferreli, L., Esposito, E., Porfido, S., Blumetti, A. M., Vittori, E., Serva, L., and Roberts, G. P.: Ground Effects during the 9 September 1998, Mw=5.6 Lauria, Earthquake and the Seismic Potential of the seismic Pollino Region in Southern Italy, Seismol. Res. Lett., 71, 31–46, https://doi.org/10.1785/gssrl.71.1.31, 2000.
Mogi K.: Two Kinds of Seismic Gaps, in: Earthquake Prediction and Seismicity Patterns, Contributions to Current Research in Geophysics, edited by: Wyss M., Birkhäuser, Basel, https://doi.org/10.1007/978-3-0348-6430-5_4, 1979.
Napolitano, F., De Siena, L., Gervasi, A., Guerra, I., Scarpa, R., and La Rocca, M.: Scattering and absorption imaging of a highly fractured fluid-filled seismogenetic volume in a region of slow deformation, Geosci. Front., 11, 989–998, https://doi.org/10.1016/j.gsf.2019.09.014, 2020.
Napolitano, F., Galluzzo, D., Gervasi, A., Scarpa, R., and La Rocca, M.: Fault imaging at Mt Pollino (Italy) from relative location of microearthquakes, Geophys. J. Int., 224, 637–648, https://doi.org/10.1093/gji/ggaa407, 2021.
Nobes, D. C., Jol, H. M., and Duffy, B.: Geophysical imaging of disrupted coastal dune stratigraphy and possible mechanisms, Haast, South Westland, New Zealand, New Zeal. J. Geol. Geop., 59, 426–435, https://doi.org/10.1080/00288306.2016.1168455, 2016.
Oddone, E.: Gli elementi fisici del grande terremoto marsicano-fucense del 13 gennaio 1915, Boll. Soc. Sismol. Ital., 19, 71–216, 1915.
Ogniben, L.: Schema introduttivo alla geologia del confine calabro-lucano, Mem. Soc. Geol. It., 8, 453–763, 1969.
Overgaard, T. and Jakobsen, P. R.: Mapping of glaciotectonic deformation in an ice marginal environment with ground penetrating radar, J. Appl. Geophys., 47, 191–197, https://doi.org/10.1016/S0926-9851(01)00064-7, 2001.
Pantosti, D. and Valensise, G.: Faulting mechanism and complexity of the November 23, 1980, Campania-Lucania earthquake, inferred from surface observations, J. Geophys. Res., 95, 15319–15341, https://doi.org/10.1029/JB095iB10p15319, 1990.
Passarelli, L., Hainzl, S., Cesca, S., Maccaferri, F., Mucciarelli, M., Roessler, D., Corbi, F., Dahm, T., and Rivalta, E.: Aseismic transient driving the swarm-like seismic sequence in the Pollino range, Southern Italy, Geophys. J. Int., 201, 1553–1567, https://doi.org/10.1093/gji/ggv111, 2015.
Pastori, M., Margheriti, L., De Gori, P., Govoni, A., Lucente, F. P., Moretti, M., Marchetti, A., Di Giovambattista, R., Anselmi, M., De Luca, P., Nardi, A., Agostinetti, N. P., Latorre, D., Piccinini, D., Passarelli, L., and Chiarabba. C.: The 2011–2014 Pollino Seismic Swarm: Complex Fault Systems Imaged by 1D Refined Location and Shear Wave Splitting Analysis at the Apennines–Calabrian Arc Boundary, Front. Earth Sci., 9, 618293, https://doi.org/10.3389/feart.2021.618293, 2021.
Patacca, E. and Scandone, P.: Geological interpretation of the CROP-04 seismic line (Southern Apennines, Italy), Boll. Soc. Geol. It., Ital. J. Geosci., 7, 297–315, 2007.
Pauselli, C., Federico, C., Frigeri, A., Orosei, R., Barchi, M. R., and Basile, G.: Ground Penetrating Radar investigations to study active faults in the Norcia Basin (Central Italy), J. Appl. Geophys., 72, 39–45, https://doi.org/10.1016/j.jappgeo.2010.06.009, 2010.
Pauselli, C., Ercoli, M. Volpe, R. Federico, C. Mazzocca, M., and Speziali, L.: 2D and 3D GPR images of selected fault planes (Calabro-Lucania border), Report DPC-INGV-S1 Project ”Base-knowledge improvement for assessing the seismogenic potential of Italy”, deliverable D18/c1.1, Agreement INGV-DPC 2014–2015, 49 pp., available at: https://sites.google.com/site/ingvdpcprojects1/documents (last access: 11 June 2021), 2015.
Plafker, G. and Galloway, J. P.: Lessons Learned from the Lorna Prieta, California, Earthquake of October 17, 1989, USGS Numbered Series Circular 1045, 48 pp., https://doi.org/10.3133/cir1045, 1989.
Pondrelli, S., Salimbeni, S., Ekström, G., Morelli, A., Gasperini, P., and Vannucci, P.: The Italian CMT dataset from 1977 to present, Phys. Earth Plan. Int., 159, 286–303, 2006.
Porreca, M., Minelli, G., Ercoli, M., Brobia, A., Mancinelli, P., Cruciani, F., Giorgetti, C., Carboni, F., Mirabella, F., Cavinato, G., Cannata, A., Pauselli, C., and Barchi, M. R.: Seismic reflection profiles and subsurface geology of the area interested by the 2016–2017 earthquake sequence (Central Italy), in: The 2016 Central Italy Seismic Sequence: Insights, implications and lessons learned, Tectonics, 37, 1116–1137, https://doi.org/10.1002/2017TC004915, 2018.
Porreca, M., Fabbrizzi, A., Azzaro, S., Pucci, S., Del Rio, L., Pierantoni, P. P., Giorgetti, C., Roberts, G., and Barchi, M. R.: 3D geological reconstruction of the M. Vettore seismogenic fault system (Central Apennines, Italy): Cross-cutting relationship with the M. Sibillini thrust, J. Struct. Geol., 131, 103938, https://doi.org/10.1016/j.jsg.2019.103938, 2020.
Pousse-Beltran, L., Vassallo, R., Audemard, F., Jouanne, F., Oropeza, J., Garambois, S., and Aray, J.: Earthquake geology of the last millennium along the Boconó Fault, Venezuela, Tectonophysics, 747–748, 40–53, https://doi.org/10.1016/j.tecto.2018.09.010, 2018.
Pucci, S., Pizzimenti, L., Civico, R., Villani, F., Brunori, C. A., and Pantosti, D.: High resolution morphometric analysis of the Cordone del Vettore normal fault scarp (2016 central Italy seismic sequence): Insights into age, earthquake recurrence and throw rates, Geomorphology, 388, pp. 107784, https://doi.org/10.1016/j.geomorph.2021.107784, 2021.
Quitzow, H. W.: Der Deckenbau des Kalabrischen Massivs und seiner Rangebiete, Beitr. geol. Westl. Mediterrangebiete Abh. Ges. Wiss. Göttingen, Math.-Phis. Kl., 3, 63–179, 1935.
Reiss, S., Reicherter, K. R., and Reuther, C. D.: Visualization and characterization of active normal faults and associated sediments by high-resolution GPR Geological Society, London, Special Publications, 211, 247–255, https://doi.org/10.1144/GSL.SP.2001.211.01.20, 2003.
Roberts, G. P., Raithatha, B., Sileo, G., Pizzi, A., Pucci, S., Walker, J. F., Wilkinson, M., McCaffrey, K., Phillips, R. J., Michetti, A. M., Guerrieri, L., Blumetti, A. M., Vittori, E., Cowie, P., Sammonds, P., Galli, P., Boncio, P., Bristow, C., and Walters, R.: Shallow subsurface structure of the 2009 April 6 Mw6.3 L'Aquila earthquake surface rupture at Paganica, investigated with ground-penetrating radar, Geophys. J. Int., 183, 774–790, https://doi.org/10.1111/j.1365-246X.2010.04713.x, 2010.
Rovida, A., Locati, M., Camassi, R., Lolli, B., and Gasperini, P.: The Italian earthquake catalogue CPTI15, B. Earthq. Eng., 18, 2953–2984, https://doi.org/10.1007/s10518-020-00818-y, 2020.
Salvi, S., Cinti, F. R., Colini, L., D'Addezio, G., Doumaz, F., and Pettinelli, E.: Investigation of the active Celano-L'Aquila fault system, Abruzzi (central Apennines, Italy) with combined ground-penetrating radar and palaeoseismic trenching, Geophys. J. Int., 155, 805–818, https://doi.org/10.1111/j.1365-246X.2003.02078.x, 2003.
Sangree, J., B. and Widmier, J. M.: Interpretation of depositional facies from seismic data, Geophysics, 44, 131–60, https://doi.org/10.1190/1.1440957, 1979.
Sapia, V., Villani, F., Fischanger, F., Lupi, M., Baccheschi, P., Pantosti, D., Pucci, S., Civico, R., Sciarra, A., Smedile, A., Romano, V., De Martini, P. M., Murgia, F., Materni, V., Giannattasio, F., Pizzimenti, L., Ricci, T., Brunori, C. A., Coco, I., and Improta, L.: 3-D deep electrical resistivity tomography of the major basin related to the 2016 Mw 6.5 central Italy earthquake fault, Tectonics, 40, e2020TC006628, https://doi.org/10.1029/2020TC006628, 2021.
Schiattarella, M., Torrente, M., and Russo, F.: Analisi strutturale ed osservazioni morfotettoniche nel bacino del Mercure (Confine calabro-lucano), Il Quaternaio, 7, 613–626, 1994.
Scognamiglio, L., Tinti, E., and Quintiliani, M.: Time Domain Moment Tensor (TDMT), Istituto Nazionale di Geofisica e Vulcanologia (INGV) [data set], https://doi.org/10.13127/TDMT, available at: http://terremoti.ingv.it/tdmt (last access: 11 June 2021), 2006.
Servizio Geologico d'Italia: 220 Verbicaro and 221 Castrovillari Sheets of the Carta Geologica D'Italia, 1:100 000 Scale, Rome, 1970.
Shaikh, M. A., Maurya, D. M., Mukherjee, S., Vanik, N. P., Padmalal, A., and Chamyal, L. S.: Tectonic evolution of the intra-uplift Vigodi-Gugriana-Khirasra-Netra Fault System in the seismically active Kachchh rift basin, India: Implications for the western continental margin of the Indian plate, J. Struct. Geol., 140, 104124, https://doi.org/10.1016/j.jsg.2020.104124, 2020.
Sketsiou, P., De Siena, L., Gabrielli, S., and Napolitano, F.: 3-D attenuation image of fluid storage and tectonic interactions across the Pollino fault network, Geophys. J. Int., 226, 536–547, https://doi.org/10.1093/gji/ggab109, 2021.
Slater, L. and Niemi, T. M.: Ground-penetrating radar investigation of active faults along the Dead Sea Transform and implications for seismic hazards within the city of Aqaba, Jordan, Tectonophysics, 368, 33–50, https://doi.org/10.1016/S0040-1951(03)00149-5, 2003.
Smith, D. G. and Jol, H. M.: Wasatch fault (Utah), detected and displacement characterized by ground penetrating radar, Environ. Eng. Geosci., 1, 489–496, 1995.
Spina, V., Galli, P., Tondi, E., and Mazzoli, S.: Fault propagation in a seismic gap area (northern Calabria, Italy): implications for seismic hazard, Tectonophysics, 476, 357–369, 2009.
Stirling, M., Goded, T., Berryman, K., and Litchfield, N.: Selection of Earthquake Scaling Relationships for Seismic-Hazard Analysis, B. Seismol. Soc. Am., 103, 2993–3011, https://doi.org/10.1785/0120130052, 2013.
Tangari, A. C., Scarciglia, F., Piluso, E., Marinangeli, L., and Pompilio, L.: Role of weathering of pillow basalt, pyroclastic input and geomorphic processes on the genesis of the Monte Cerviero upland soils (Calabria, Italy), Catena, 171, 299–315, https://doi.org/10.1016/j.catena.2018.07.015, 2018.
Tarquini, S., Vinci, S., Favalli, M., Doumaz, F., Fornaciai, A., and Nannipieri, L.: Release of a 10-m-resolution DEM for the Italian territory: Comparison with global-coverage DEMs and anaglyph-mode exploration via the web, Computers & Geosciences, 38, 168–170, https://doi.org/10.1016/j.cageo.2011.04.018, 2012.
Tertulliani A. and Cucci, L.: New insights on the strongest historical earthquake in the Pollino region (southern Italy), Seismol. Res. Lett., 85, 743–751, https://doi.org/10.1785/0220130217, 2014.
Testa, A., Boncio, P., Di Donato, M., Mataloni, G., Brozzetti, F., and Cirillo, D.: Mapping the geology of the 2016 Central Italy earthquake fault (Mt. Vettore – Mt. Bove fault, Sibillini Mts.): geological details on the Cupi – Ussita and Mt. Bove – Mt. Porche segments and overall pattern of coseismic surface faulting, Geological Field Trips and Maps, Italian Geological Society and of the Geological Survey of Italy, 11, 1–13, https://doi.org/10.3301/GFT.2019.03, 2019.
Tortorici, L., Monaco, C., Tansi, C., and Cocina, O.: Recent and active tectonics in the Calabrian arc (Southern Italy), Tectonophysics, 243, 37–55, https://doi.org/10.1016/0040-1951(94)00190-K, 1995.
Totaro, C., Koulakov, I., Orecchio, B., and Presti, D.: Detailed crustal structure in the area of the southern Apennines–Calabrian Arc border from local earthquake tomography, J. Geodyn., 82, 87–97, https://doi.org/10.1016/j.jog.2014.07.004, 2014.
Totaro, C., Seeber, L., Waldhauser, F., Steckler, M., Gervasi, A., Guerra, I., Orecchio, B., and Presti, D.: An intense earthquake swarm in the southernmost Apennines: fault architecture from high-resolution hypocenters and focal mechanisms, Bull. Seismol. Soc. Am., 105, 1–6, https://doi.org/10.1785/0120150074, 2015.
Tronicke, J., Villamor, P., and Green, A. G.: Detailed shallow geometry and vertical displacement estimates of the Maleme Fault Zone, New Zealand, using 2D and 3D georadar, Near Surf. Geophys., 4, 155–161, https://doi.org/10.3997/1873-0604.2005041, 2006.
Utzi, E. C.: Ground Penetrating Radar, Elsevier, 209 pp., https://doi.org/10.1016/B978-0-08-102216-0.00001-1, 2017.
Vanneste, K., Verbeeck, K., and Petermans, T.: Pseudo-3-D imaging of a low-slip-rate, active normal fault using shallow geophysical methods: the Geleen fault in the Belgian Mass River valley, Geophysics, 73, B1–B9, https://doi.org/10.1190/1.2816428, 2008.
Vezzani, L., Festa, A., and Ghisetti, F.C.: Geology and tectonic evolution of the Central-Southern Apennines, Italy, Special Paper of the Geological Society of America, 469, 1–58, https://doi.org/10.1130/SPE469, 2010.
Villani, F. and Pierdominici, S.: Late Quaternary tectonics of the Vallo di Diano basin, (Southern Apennines, Italy), Quat. Sci. Rev., 29, 3167–3183, https://doi.org/10.1016/j.quascirev.2010.07.003, 2010.
Villani, F., Pucci, S., Civico, R., De Martini, P. M., Cinti, F. R., and Pantosti, D.: Surface faulting of the 30 October 2016 Mw6.5 central Italy earthquake: Detailed analysis of a complex coseismic rupture, Tectonics, 37, 3378–3410, https://doi.org/10.1029/2018TC005175, 2018.
Villani, F., Maraio, S., Bruno, P. P., Improta, L., Wood, K., Pucci, S., Civico, R., Sapia, V., De Martini, P. M., Brunori, C. A., Doglioni, C., and Pantosti, D.: High-resolution seismic profiling in the hanging wall of the southern fault section ruptured during the 2016 Mw6.5 central Italy earthquake, Tectonics, 40, e2021TC006786, https://doi.org/10.1029/2021TC006786, 2021.
Wallace, S. C., Nobes, D. C., Davis, K. J., Burbank, D. W., and White, A.: Three-dimensional GPR imaging of the Benmore anticline and step-over of the Ostler Fault, South Island, New Zealand, Geophys. J. Int., 180, 465–474, https://doi.org/10.1111/j.1365-246X.2009.04400.x, 2010.
Wells, D. L. and Coppersmith, K. J.: New empirical relationships among magnitude, rupture length, rupture width, rupture area, and surface displacement, Bull. Seismol. Soc. Am., 84, 974–1002, 1994.
Xu, G., Xu, C., Wen, Y., and Jiang, G.: Source Parameters of the 2016–2017 Central Italy Earthquake Sequence from the Sentinel-1, ALOS-2 and GPS Data, Remote Sens., 9, 1182, https://doi.org/10.3390/rs9111182, 2017.
Yalciner, C. C., Altunel, E., Bano, M., Meghraoui, M., Karabacak, V., and Akyuz, H. S.: Application of GPR to normal faults in the Büyük Menderes Graben, Western Turkey, J. Geodyn., 65, 218–227, https://doi.org/10.1016/j.jog.2012.05.011, 2013.
Zajc, M., Celarc, B., and Gosar, A.: GPR Study of a Thrust-Fault in an Active Limestone Quarry, (SW Slovenia), J. Environ. Eng. Geoph., 23, 457–468, https://doi.org/10.2113/JEEG23.4.457, 2018.
Zhang, D., Li, J., Liu, S., and Wang, G.: Multi-frequencies GPR measurements for delineating the shallow subsurface features of the Yushu strike slip fault, Acta Geophysica, 67, 501–515, https://doi.org/10.1007/s11600-019-00271-9, 2019.
memorizedin Quaternary sediments, which are typically studied by paleoseismologists through trenching. Using a ground-penetrating radar (GPR), we unveiled possible buried Quaternary faulting in the Mt. Pollino seismic gap region (southern Italy). We aim to contribute to seismic hazard assessment of an area potentially prone to destructive events as well as promote our workflow in similar contexts around the world.
memorizedin Quaternary...