the Creative Commons Attribution 4.0 License.
the Creative Commons Attribution 4.0 License.
 | 18 Jan 2024
Proposal for a new meteotsunami intensity index
Clare Lewis
Tim Smyth
Jess Neumann
Hannah Cloke
Atmospherically generated coastal waves labelled as meteotsunami are known to cause destruction, injury, and fatality due to their rapid onset and unexpected nature. Unlike other coastal hazards such as tsunami, there exist no standardised means of quantifying this phenomenon, which is crucial to understand shoreline impacts and to enable researchers to establish a shared language and framework for meteotsunami analysis and comparison.
In this study, we present a new five-level Lewis Meteotsunami Intensity Index (LMTI) trialled in the United Kingdom (UK) but designed for global applicability. A comprehensive dataset of meteotsunami events recorded in the UK was utilised, and the index's effectiveness was evaluated, with intensity level and spatial distribution of meteotsunami occurrence derived. Results revealed a predominant occurrence of Level 2 moderate intensity meteotsunami (69 %) in the UK, with distinct hotspots identified in south-western England and Scotland. Further trial implementation of the LMTI in a global capacity revealed its potential adaptability to other meteotsunami-prone regions, facilitating the comparison of events and promoting standardisation of assessment methodologies.
- Article
(1822 KB) - Full-text XML
-
Supplement
(609 KB) - BibTeX
- EndNote


If you live in a coastal zone, you are at risk from being impacted by various hydrometeorological hazards. One such hazard is the meteorological tsunami or meteotsunami. This is a globally occurring shallow-water wave which tends to be initiated by sudden air pressure changes and wind stress from moving atmospheric systems such as convective clouds, cyclones, squalls, thunderstorms, gravity waves, and strong mid-tropospheric winds (Vilibić and Šepić, 2017). The atmospheric disturbance transfers energy into the ocean initiating and amplifying a water wave that then travels towards the coastline where it is further amplified through coastal resonances (Šepić et al., 2012). There are a range of geneses associated with meteotsunami. However, air pressure change has been the traditional dominant factor in the generation and propagation of this phenomenon worldwide. Certain meteotsunami can be driven by strong wind fronts, as exemplified by the “winter type meteotsunamis” in the northern Baltic Sea (Pellikka et al., 2022). Infragravity waves linked to strong mid-tropospheric jets are also correlated with meteotsunami genesis. This is restricted to such locations as the Mediterranean, Chile, and Australia but not so prevalent in the tropics (Zemunik et al., 2022). According to Denamiel et al. (2023) infragravity waves manifest as rapid surface pressure oscillations and low sea level pressure. This reinforces the theory of Pellikka et al. (2022) and Rabinovich (2020), who state that air pressure plays a dominant role in some of the world's strongest meteotsunami. Following on from this and with the data available, we examined the source of each event and chose air pressure as the primary atmospheric component to cover both midlatitudes and equatorial regions, allowing for global standardisation of the index.
Due to the rapid onset and unexpected nature of these waves, they have the potential to pose a considerable threat to coastal communities, infrastructure, and ecosystems (Sibley et al., 2016). This has been apparent throughout recent history with an increase in the number of meteotsunami being experienced around the world. Such extreme events include Vela Luka (Croatia, 1978), where a 6 m wave caused USD 7 million damage; at Nagasaki (Japan, 1979), where an event killed three people; Dayton Beach (Florida, 1992), where a single 3 m wave injured 75 people and caused damaged to dozens of cars; and the Persian Gulf (2017), where a squall line initiated a 2.5 m wave, leaving 22 injured and 5 dead (Gusiakov, 2021).
Understanding the intensity and impact of meteotsunami is crucial for effective coastal hazard management. The development of the Lewis Meteotsunami Intensity Index (LMTI) involved an extensive review of existing global meteotsunami scales and indices, in which it was found that there is an absence of a working methodology. There was an initial suggestion at an intensity scale for meteotsunami as presented in an editorial by Vilibić et al. (2021). However, as acknowledged by the author this scale was limited to the events and papers presented in the special edition and was designed to represent a feature that might be used for cataloguing meteotsunami. There is no detailed methodology available for this index; the scoring appears to be based upon wave height, injuries, and fatalities. While fatalities can indicate the severity of an event, they are influenced by a range of factors. Using fatality as a sole aspect would mean that a meteotsunami arriving on the shores of a highly populated area would indeed have more of an impact than an event occurring in a less populated area. It assumes that an event is only of high intensity if it has an anthropogenic impact.
Due to the absence of a working intensity index, we subsequently reviewed tsunami scales and indices, as these have a similarity to meteotsunami in wave types and impacts. The review revealed two types of indices used for defining and quantifying tsunami:
-
A magnitude scale relates to the physical quantities and parameters of the hazard including the source of the event and/or the wave height (Iida et al., 1967). These scales tend to be logarithmic, and this allows for the compression of a wide range of values into a smaller range. This makes it easier to compare and visualise data that span several orders of magnitude. However, it can make it difficult to translate the results to a non-academic community. Magnitude scales tend to compare only the wave size and not its strength.
-
An intensity scale assesses the impacts of an event, including expected damage, based on observations (Papadopoulos and Imamura, 2001). It is easier to interpret and compare than other scales and can incorporate the human element without instrumentation. However, its reliance on descriptive evidence can lead to subjective results.
In this paper, we present a novel approach to assessing meteotsunami intensity by introducing a new five-level meteotsunami intensity index named the Lewis Meteotsunami Intensity Index (LMTI). We provide an overview of the development process and implementation of this index, focussing on its application in the UK as a case study with a view to further global applicability.
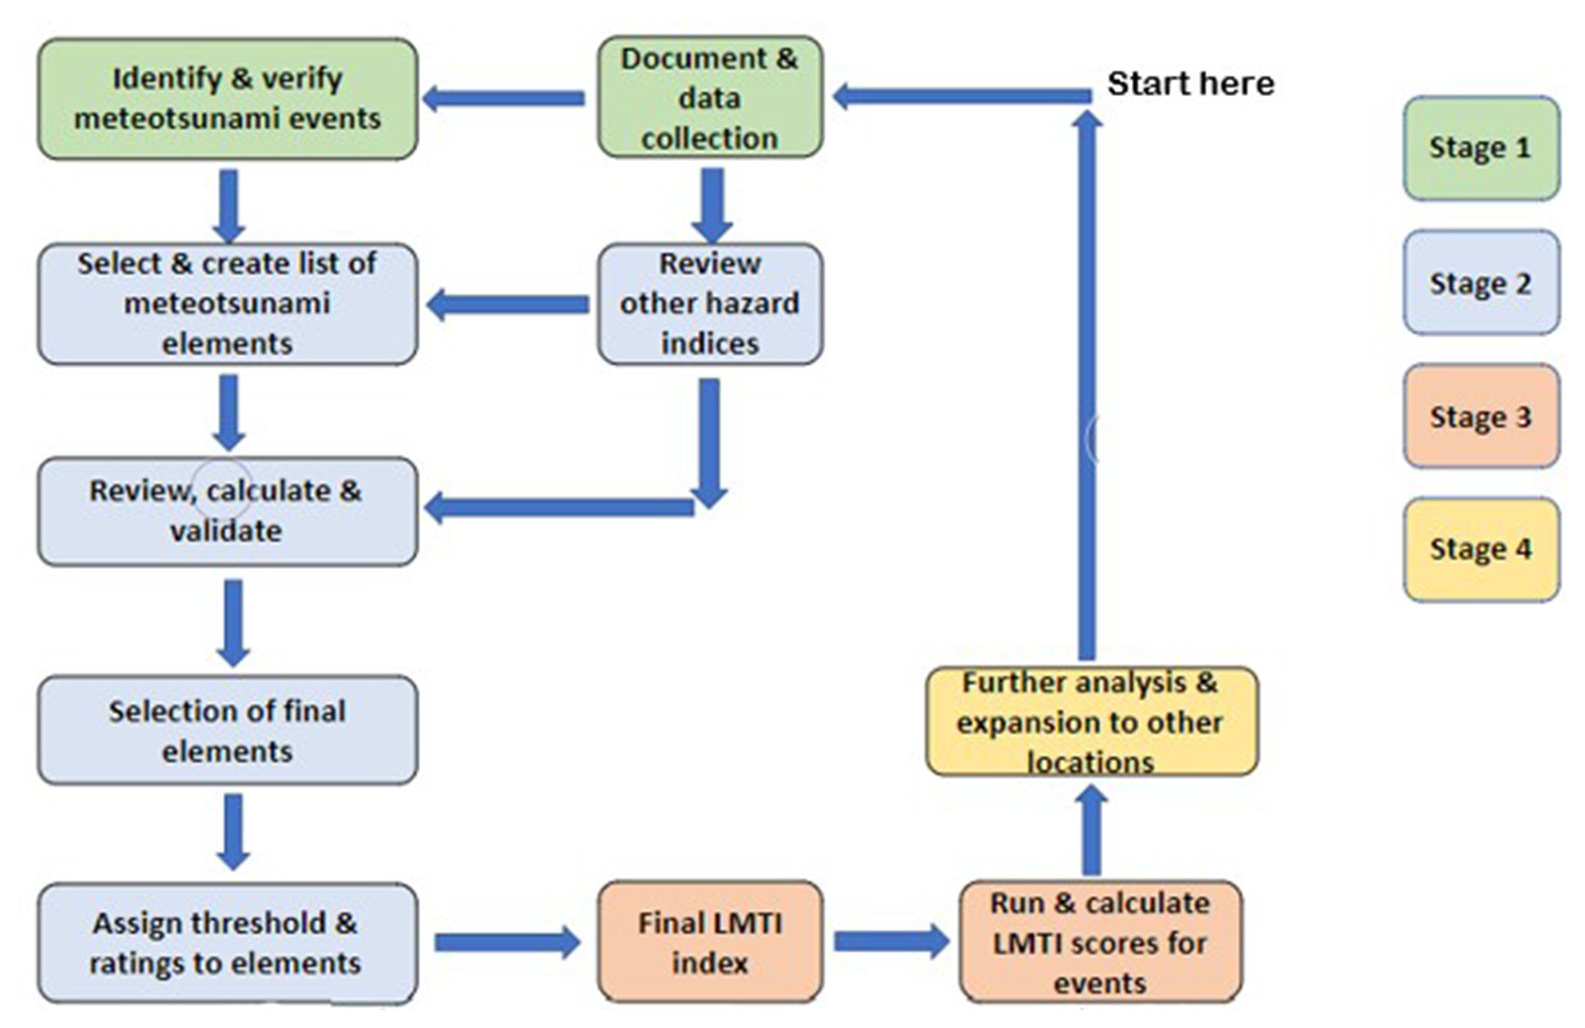
Creating the LMTI involved four stages (Fig. 1).
2.1 Stage 1: catalogue of events
Trials for the LMTI were conducted in the UK, where there is a long history of events dating back to at least 1750 CE (Haslett and Bryant, 2009). Six main sources of UK meteotsunami events were utilised: Lewis et al. (2023a), Williams et al. (2021), Thompson et al. (2020), Long (2015), Haslett and Bryant (2009), and Dawson et al. (2000), all providing a comprehensive and coherent historical record. The collected data were analysed, with the meteotsunami identified and categorised according to a reliability and verification system adopted from Gusiakov (2021). Identified events were allocated a reliability score from 1 to 4 depending on the amount of evidence and data available across the sources (i.e., the number of components completed in the index), where 1 = doubtful (1 to 3 components), 2 = questionable (eyewitness report, 3 to 6 components), 3 = probable (newspaper report, 6 to 9 components), and 4 = definite (technical report, 9 to 12 components). Older events which are usually fragmented make it difficult to establish an informed judgement, so these were subsequently allocated a reliability score of 1; events with insufficient information remained unclassified and were considered highly uncertain.
2.2 Stage 2: meteotsunami components and values
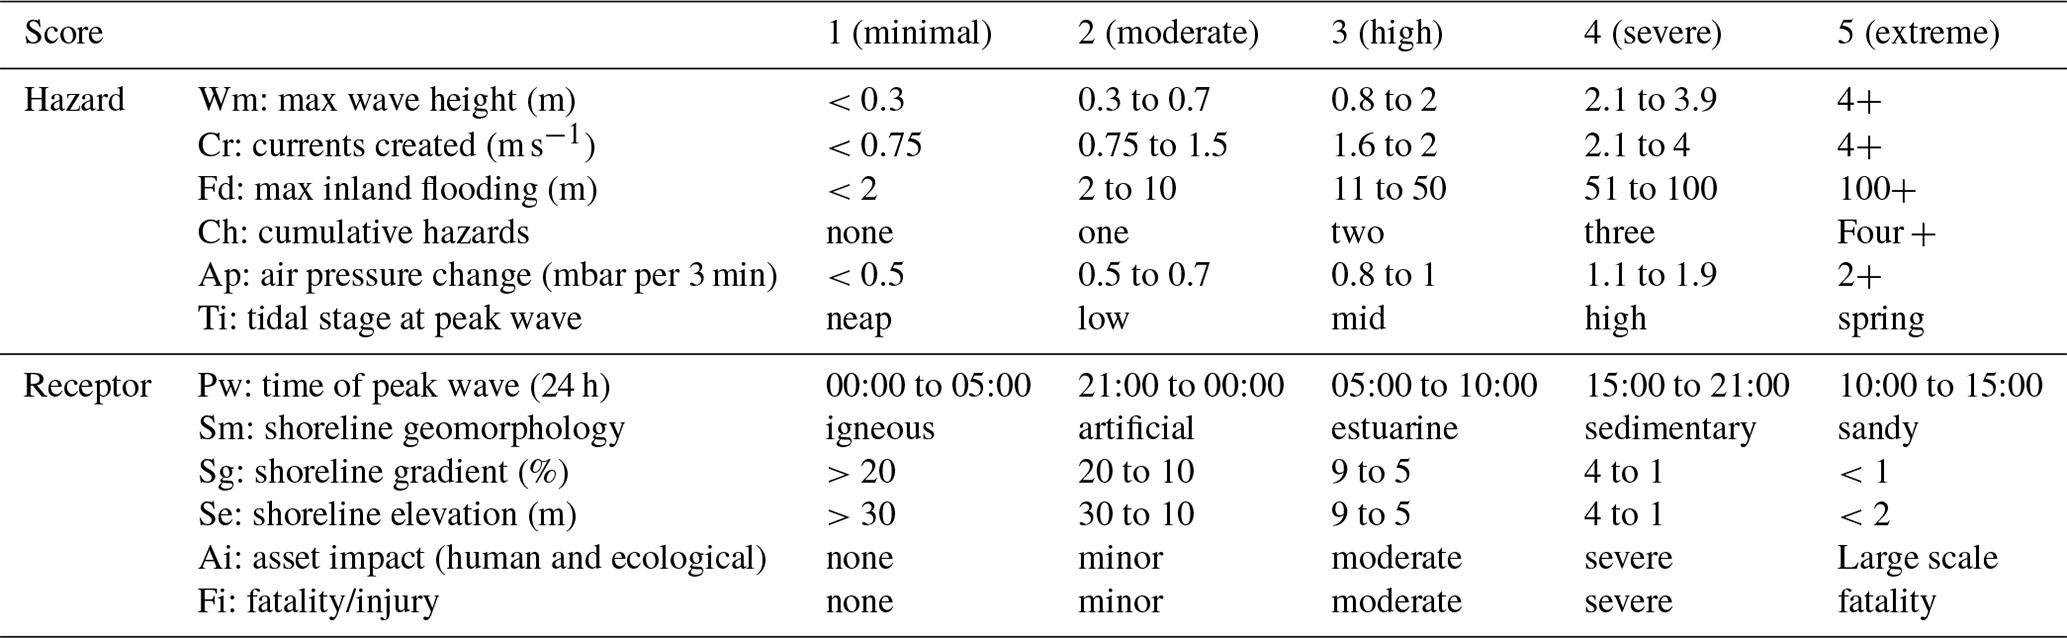
The proposed LMTI considers 12 various components of meteotsunami and receptor site characteristics, based upon descriptions of previous global events, current thresholds used by researchers, and the characteristics of other related hazard indices (Table 1). This multifaceted approach allows for the LMTI to capture the complex dynamics of meteotsunami events and facilitate a single score which can be matched with a description on the LMTI table (Table 1). The LMTI adopts this layout to allow for an intensity evaluation based upon hazard only or receptor site only. By incorporating both parts this allows for analysis of a low height wave impacting a highly vulnerable coastline. Each component has a different threshold weighting leading to the allocation of a score from 1 to 5. These threshold weightings are calculated based on event data and other related hazard indices.
Table 1Hazard and receptor components with associated thresholds as used in the LMTI.
2.2.1 Physical hazard characteristics
Maximum wave height (Mw)
The vertical distance between wave trough and crest (m) at the shoreline is the most frequently used element when discussing tsunami and meteotsunami (Williams et al., 2021; Gusiakov, 2021) as wave height is the easiest form of data to observe. The greater the wave height, the greater the volume of water impacting people and structures along the shoreline. A wave height threshold of 0.30 m or less was selected as the baseline for Level 1 (minimal intensity), which was decided by analysing average wave heights of global and UK events, where 0.3 m was found to be the threshold for potential damage (Lynett et al., 2014).
Currents (Cr)
The velocity (m s−1) of the water's movement is produced by the meteotsunami wave as it inundates the shoreline. The faster the current, the more the displacement of people, animals, and debris. The values for LMTI are based upon those laid out in Lynett et al. (2014) for tsunami waves, which is calculated taking into account not only past event data from buoys and boats but also from experienced eyewitness accounts and videos.
Maximum inland intrusion of seawater (Fd)
The inland extent (m) of seawater flow is past the high-tide mark. The further inland the water reaches, the higher the risk to assets. However, this can be restricted by local topography, which is addressed in Sect. 2. This component can contribute to the impact of an event through flooding and as such is frequently used in coastal flooding indices (Rocha et al., 2020). Including this component in the index allows for comparisons of events and provides a comprehensive and quantifiable measure of the potential damage and impact. This provides information for decision makers to assess the role of local topography in the extent of flooding impact.
Additional or compound hazards (Ch)
Considerations of other hazards linked to the source system and their potential to elevate the overall level of risk are considered in this component. One point is accumulated for each additional hazard that occurs parallel to the meteotsunami event. Existing tsunami indices do not include this component as it is deemed an external factor. However, we feel that due to the interactive nature of meteotsunami with other hazards, it is imperative that it be considered. The risk from meteotsunami is not just restricted to elevated water level and velocity. If coupled with hazards, such storm surge, seiching, and precipitation water levels may become elevated. High winds, mudflows, and lightning can produce compound issues. This element also covers wind dynamics such as intense gusts, windstorm,s and abrupt changes in direction, which can also generate significant wave energy.
Air pressure change (Ap)
The rate of change in the localised air pressure (mbar) occurs within a 3 min period. This is included as a key component in the initiation of a meteotsunami via the inverse barometer effect and has been found to be present in many of the world's strongest meteotsunami. The sharper the air pressure changes, the greater the potential for water displacement; 1 mbar change equals 1 cm change in static water level. The thresholds for this component have been derived from the data recorded from global events, which range from 0.5 to 1.5 mbar in approx. 3 min. This air pressure change creates a connection with the mechanisms in the open sea, which can significantly affect the amplification or attenuation of meteotsunami waves. By using air pressure as a component researchers can identify commonalities and differences between regions in relation to one of the principle forcing mechanisms.
Tidal regime (Ti)
The tidal stage at the time and location of maximum wave impact at the shoreline. This can be either neap, spring, low, mid, or high. Coastal areas experiencing a spring or high tide are characterised as being highly vulnerable with the impacts being exacerbated by an already elevated water level. Whilst the authors acknowledge the importance of tidal range in coastal dynamics within this category, after a provisional analysis of tidal ranges in locations prone to different intensity meteotsunami, we could not find a direct correlation. However, it was found that coastal infrastructure in certain regions such as the Mediterranean is adapted to the local tidal range, and as such the effects of meteotsunami are modulated by this. In microtidal areas whilst the wave energy is lower it tends to be more concentrated, and in macrotidal areas where the wave energy is a lot stronger the impact tends to be dissipated over a larger area.
2.2.2 Receptor site characteristics
Time of arrival of maximum wave at the shoreline (Pw)
The time of day at the location of maximum wave activity is subdivided into approximately 3 h slots. This element is imperative to assessing the risk to human life. The highest scoring category (5 = extreme) equates to the most likely time of day where people, assets, and commercial activity will be present along the shoreline.
Shoreline geomorphology (Sm)
This includes the composition of the dominant shoreline material type. The five classes are scored accordingly based on the erosion capability of water, relative resistance, and the ability of the material to diffuse wave power and alter the flow characteristics. The five classes of shoreline material range from the fastest and least resistant material of a sandy beach (5 points), bedrock and gravel shores (4 points), estuarine and vegetated zones (3 points), artificial frontage such as concrete seawalls (2 points), and finally to hard igneous rocks (1 point). Scoring for this component is adapted from Masselink et al. (2020) and Gornitz (1991). For this component, geomorphic classes were defined based on a visual interpretation of the shoreline material in the immediate area of inundation using high-resolution satellite imagery (Google Earth).
Shoreline gradient (Sg)
The steepness of the coastal zone (∘) is linked to the susceptibility of the area to inundation and flooding by meteotsunami waves. This component can inform decision makers on mitigation factors that may need to be implemented. The thresholds created for this index are adopted from the vulnerability index of Gornitz (1991), which is an already accepted and implemented methodology for assessing coastal hazards and risk. The gentler the slope, the greater the loss of land to seawater and the higher the vulnerability. This is defined as the ratio of altitude change to the horizontal distance between any two points in the coastal hinterland behind the initial elevation and is calculated using Google Earth as a distance finder and then by applying the following calculation in Eq. (1):
where Hsl represents height above sea level in metres of the selected feature point. Pd is the straight point distance from 0 m a.s.l. (above sea level) to a point of interest such as a hospital, school, or park.
Shoreline elevation (Se)
Average height (m) is above sea level of the area in the immediate vicinity of the shoreline. The thresholds are again based on the vulnerability index of Gornitz (1991), where the elevation zone within 5 m of the shoreline faces the highest probability of inundation. The higher the elevation values, the less vulnerable the area is to inundation, as elevation provides more resistance to water flow. This can be calculated by using an online elevation finder (https://www.freemaptools.com/, last access: 15 January 2024) and is the average of six random elevation points within a 1000 m zone of the mean high-water spring (MHWS) level enabling measurement during all tidal stages. In considering the possibility of redundancy amongst “Sg” and “Se” components, a cursory assessment was carried out using the well-established variance inflation factor (VIF). A VIF value of 1.162 was yielded. This indicates that the two components are not correlated. If the VIF value were higher and closer to “5”, this would suggest that the index may have redundant components or overlapping information.
Asset impact (Ai)
This is one of two qualitative components present in the index, and it represents the level of flooding and disruption experienced on infrastructure, historical, ecological, agricultural, livestock, and property at the location. Scoring ranges from no impacts to minor (short term inconvenience and disruption), moderate (repairable), to severe (structural damage with interruption of critical infrastructure), to extreme (long-term damage where assets are lost and written off).
Fatality and/or injury (Fi)
This is the second qualitative component and accounts for the number of individual fatalities and general injury to persons in the affected area as a direct result of the event. If we measured meteotsunami intensity solely in terms of loss of life, this would be an inaccurate approach as it does not consider the hazard but rather just one aspect of its impact. This component and the one preceding it were included to assess the level of asset damage and to allow for long-term trend analysis. If fatality levels at a certain location start to drop after the implementation of a warning system, this will indicate that the system has been effective. With this component “minor” relates to only cuts and bruises experienced, “moderate” relates to broken bones and non-permanent trauma, “severe” is permanent damage to a limb or organ, and “extreme” is fatality.
2.2.3 LMTI intensity levels
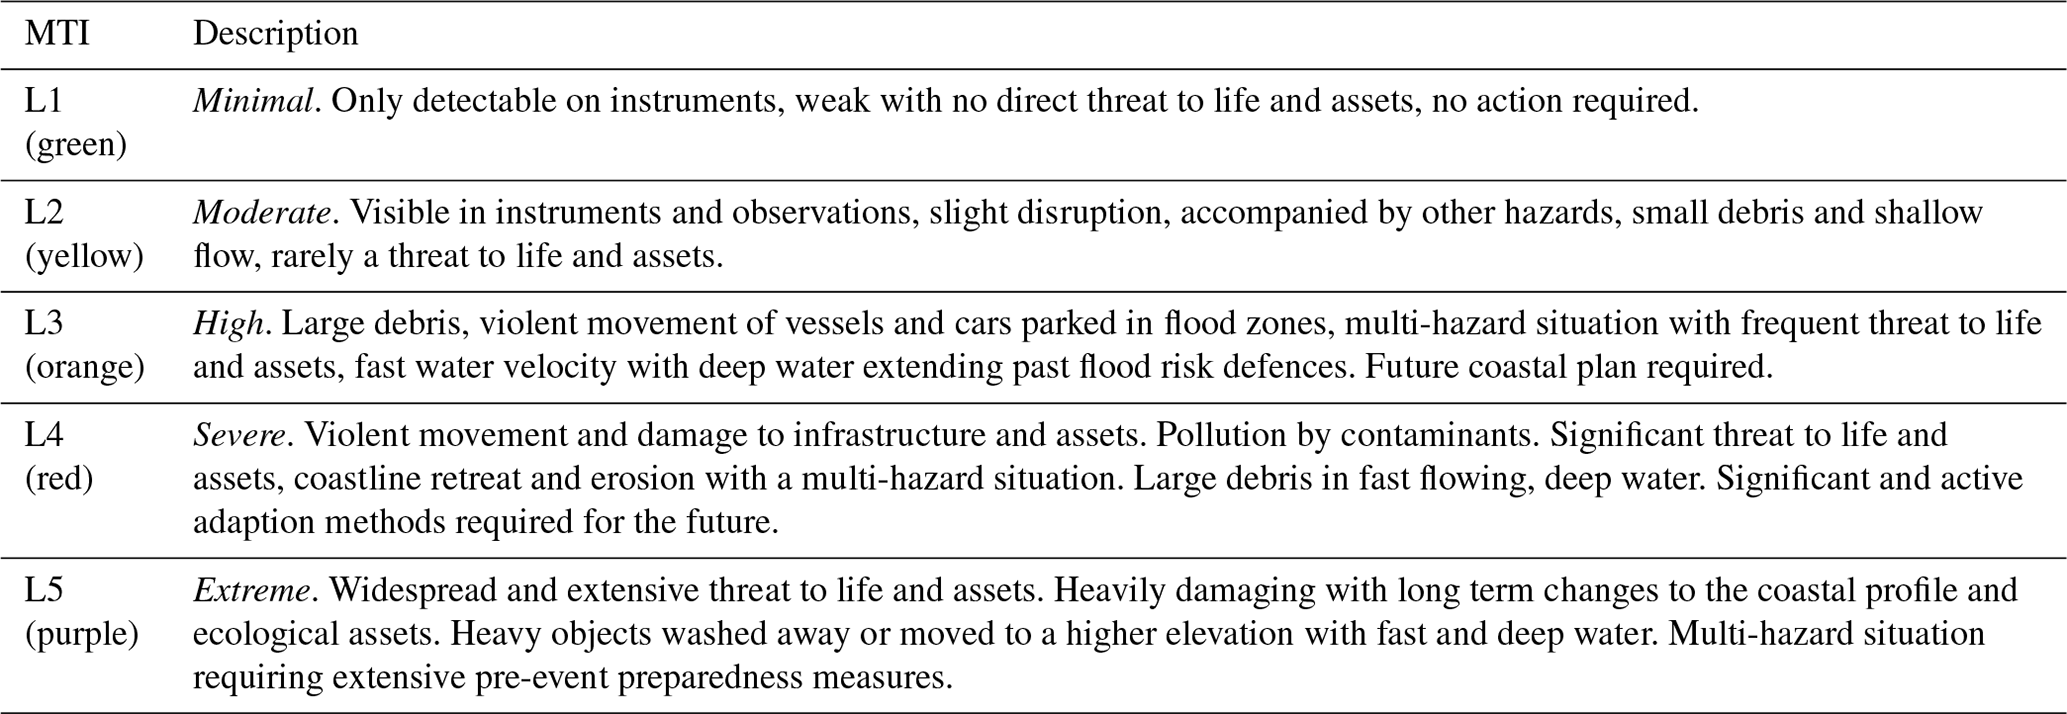
Once the thresholds were determined it was possible to then propose a five-stage index. This system incorporates a scoring regime to represent the level of contribution or weighting from each component towards the overall hazard. For this reason, each component is scored separately on a level of 1 to 5, with 1 contributing least and 5 contributing most strongly. This method allows for standardisation of the index and for each component that is measured in different units to be combined. Papadopoulos and Imamura (2001) proposed a 12-level scale to measure tsunami. However, we have reduced and simplified the LMTI scale to 5 levels, as meteotsunami, being smaller in scale and more localised in impact than tsunami, do not need such a detailed breakdown.
The final meteotsunami intensity values exhibited in Table 2 contain brief descriptions highlighting the characteristics of each intensity level, which have been devised from the characteristics of historical global meteotsunami events and are based around the events ability to be measured, its impacts, and post-event actions. The five levels are portrayed in a colour-coded format as this is an effective way of communication as people tend to perceive risk better through colours, graphics, and visuals (Engeset et al., 2022).
2.3 Stage 3: categorising events based on intensity: how to calculate LMTI
-
An event must be identified and verified as a meteotsunami (see Lewis et al., 2023a).
-
The 12 components are systematically allocated a score of 1 to 5 dependent on the distinct weightings of the threshold values as displayed in Table 1.
The component scores from each of the two subsections are added together and divided by the number of component cells containing data. If a component is not present at certain locations, then the numerical score of “zero” is placed in the calculation and this does not affect the overall intensity score.
-
Scores for the two subsections are then combined to give a single score by using the following conceptual calculation in Eq. (2):
where LMTI (meteotsunami intensity) is a function of 12 potential components, where z is component and N is the number of components.
-
The final LMTI score will be a number between 1 and 5 as shown in Table 2 and will give a standardised description of the level of intensity for that event. The higher the intensity score, the higher the level of risk.
In the calculation of the index, the scores are expressed with decimal places as shown in Table S1 for example, LMTI 1.3 or LMTI 3.4. This enables a fine resolution for quantifying and comparing intensity and impact for research purposes. The presentation of the final intensity score is represented as a whole number, where the index is typically rounded to the nearest integer, for example, LMTI 1 or LMTI 3. This simplified representation provides a clear categorisation to present to the public, stakeholders, and decision makers.
We demonstrate the practical application of the LMTI in this paper by applying the index to the combined lists of UK meteotsunami events (Lewis et al., 2023a; Williams et al., 2021; Thompson et al., 2020; Long, 2015; Haslett and Bryant, 2009; Dawson et al., 2000). The full dataset of UK results can be found in Table S1 in the Supplement: supplementary information and on an interactive map available at https://www.google.com/maps/d/edit?mid=1RiSeW-DIPSylIVOLv_8-T8Gy_e0To08&usp=sharing (last access: 15 January 2024).
To further demonstrate the LMTI's practicality and to lay the groundwork for its global application, a selection of 30 worldwide events as sourced from Vilibić et al. (2021) and Pattiaratchi and Wijeratne (2015) had the index applied to them to extrapolate intensity scores (Table S2). The LMTI in this format offers a valuable tool for researchers, enabling comparative analyses between different regions and facilitating a better understanding of meteotsunami dynamics in a global capacity.
3.1 UK meteotsunami intensity
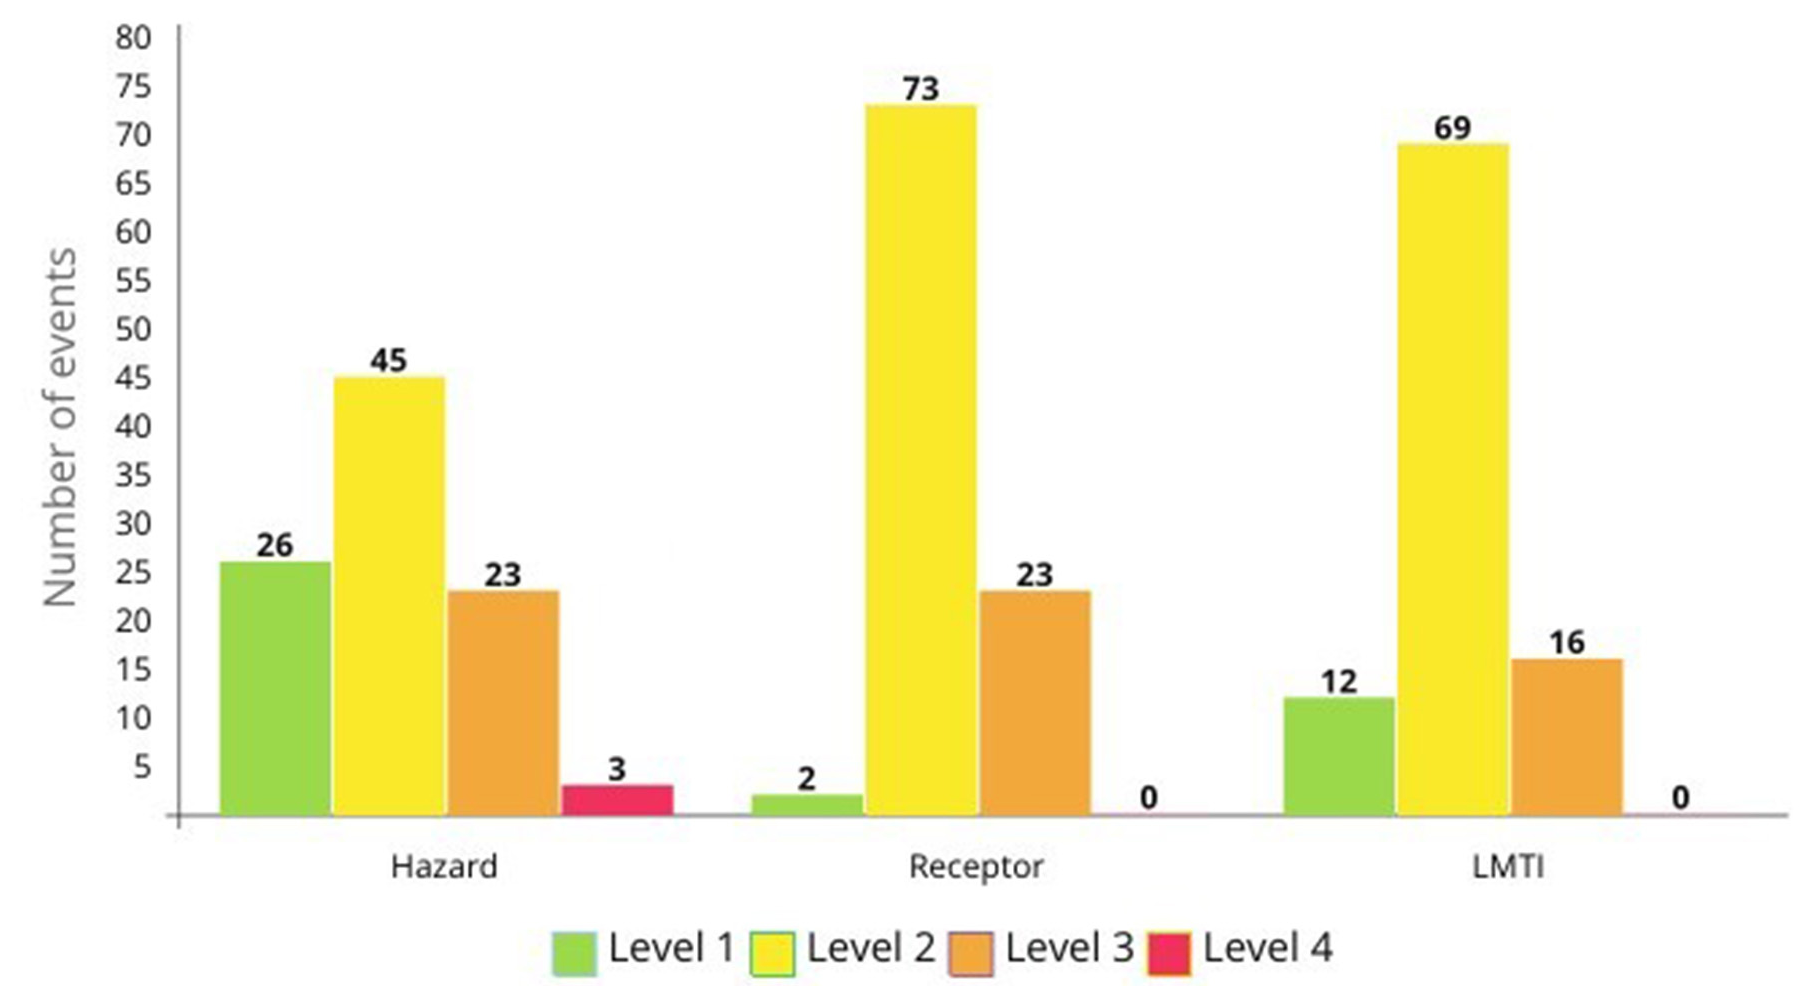
The trial run of the LMTI provided valuable insights into UK meteotsunami events. A total of 100 events were analysed. Amongst these events, Level 2 meteotsunami accounted for 69 % of the occurrences (Fig. 2). This finding suggests that the UK is prone to moderate-intensity meteotsunami. Level 1 (minimal) meteotsunami represented 12 % of events, in particular between 2009 and 2015. Level 3 (high) meteotsunami accounted for 16 % of the events especially between 1883 and 1932. Finally, the results revealed a small number of severe intensity events (Level 4) which appeared in the hazard subsection, with all three events occurring in the winter months and along the Bristol Channel.
The results highlighted in Supplementary 1 show that the number of unreliable meteotsunami (those classified as 1 = doubtful and 2 = questionable) decreases over time, with none recorded after 1968. A total of 67 % of the events were classified as definite meteotsunami having been attributed a high reliability score of 4. This enhanced reliability is apparent in the record starting in 2008, which is an indication of the abundance of data with increasing instrumentation.
The distribution of meteotsunami hotspots was also identified through the application. The southwest region of England exhibited a concentration of all levels of intensity type events, with the Bristol Channel exhibiting the only Level 4 type events. The south of England and north of Scotland also demonstrated notable meteotsunami activity, in particular Level 2 (moderate) intensity events (Fig. 3). These hotspots highlight the regions most at risk from meteotsunami occurrence and provide a valuable insight for future coastal management.
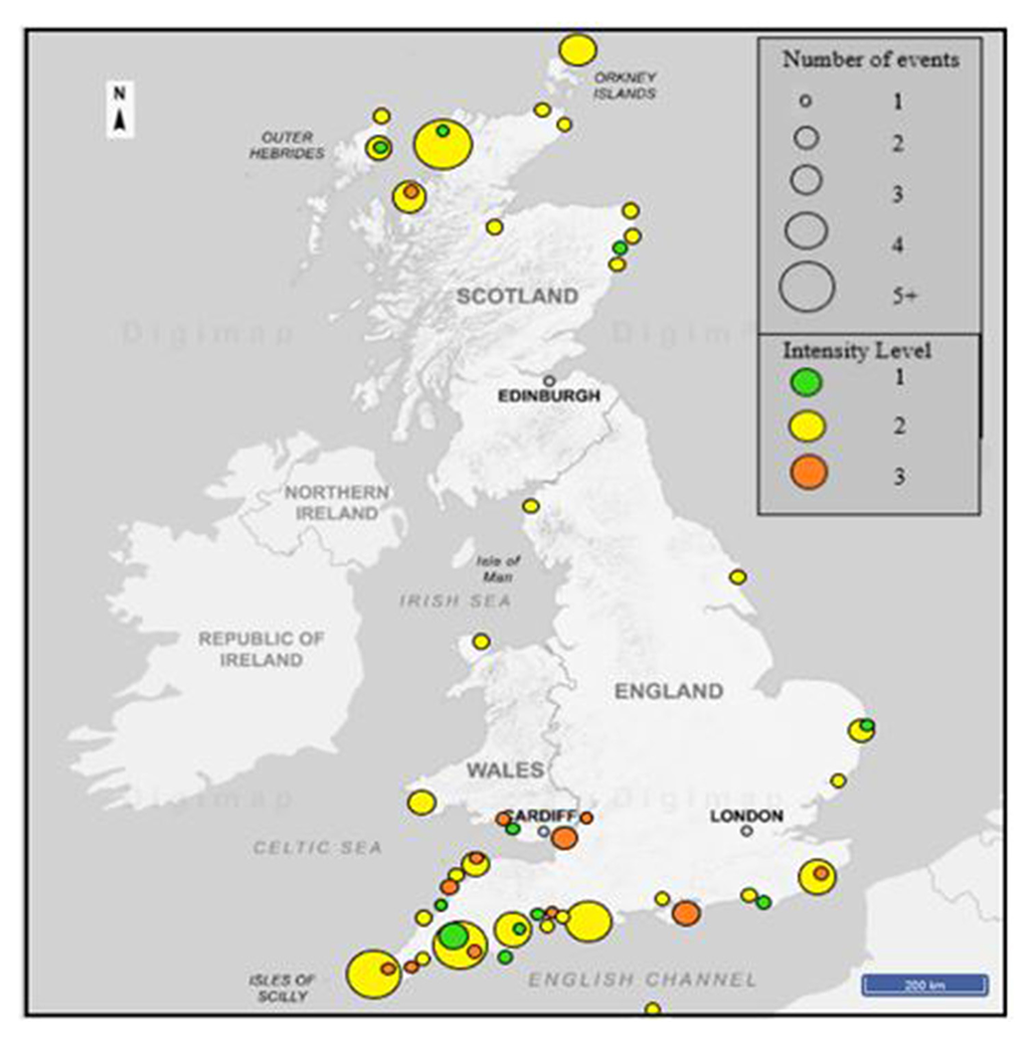
Figure 3Geographical distribution of UK meteotsunami, with the number of events and the final LMTI intensity level shown at each location. Full results are in Table S1. Base map © Crown copyright and database rights 2022 Ordnance Survey (100025252).
3.2 Global expansion of the index
The findings from the trial implementation of the LMTI in a global context demonstrated that the index has the potential for adoption into other coastal regions prone to meteotsunami. Results for events such as Vela Luka (Croatia) in 1978, Nagasaki (Japan) in 1979, and Ciutadella (Menorca) in 2006 all scored as expected with a Level 3 on the scale in line with the observed data. The event in 2017 in Dayyer (Persian Gulf) scored a Level 4; this was particularly deadly as it occurred in an area that was not accustomed to experiencing extreme wave events, and so consequently the infrastructure and population were not prepared. It occurred at 08:00 LT (local time), a few hours after a thunderstorm and it was calm, so people were starting their day unaware of any issue. On the LMTI a Level 3 and 4 equates to high intensity, where large debris is deposited from high-velocity water flow and there is a threat to life and assets (Table 2). On the opposite end of the intensity scale at Level 1, corresponding to minimal intensity events which are only detectable on instruments and with no impact to life or assets, we find events such as Pellinki (Finland) in 2010. If we compare these results to the intensity scale proposed by Vilibić et al. (2021), we find a correlation. According to Vilibić et al. (2021) Vela Luka, Croatia (1978), Ciutadella, Menorca (2006), and Pantano do Sul, Brazil (2009) were all allocated an intensity Level 4. LMTI scored these events at 3.8, 3.6, and 3.5 respectively. Cassino beach (Brazil) in 2014, Zandvoort (the Netherlands) in 2017, and Mali Losinj (Croatia) in 2007 were allocated a Level 3 according to Vilibic̈ et al. (2021). LMTI scored these events at 3.2, 3.1, and 3 respectively. Arraial do Cabo (Brazil) in 2002 and Lagos (Portugal) in 2010 were both allocated 2 by Vilibić et al. (2021). LMTI scored these events at 2.2 and 2 respectively. Finally, the Persian Gulf event of 2017 was allocated a Level 5, and LMTI scored it at 4.3.
Validation was a critical step in assessing the accuracy and applicability of the index. This procedure involved ensuring that the index accurately reflected the observed and recorded data for the event that it was quantifying. For example, there was the well-documented and well-researched event at Vela Luka (Croatia) on 21 June 1978, where in the early evening the bay experienced a 6 m water level change with accompanying strong currents which inundated 650 m inland. The impact was large-scale damage and loss of assets as well as contamination of the bay, with belongings and chemicals washed out by the retreat of the water. Fortunately, due to the quick thinking of residents there were no fatalities and minimal injuries (Vučetić et al., 2009). The LMTI allocated a Level 3.8 to this event (Level 3 bordering on Level 4), which is described in Table 2 as “violent movement and damage to infrastructure and assets. Pollution by contaminants. Fast flowing velocity with deep water exceeding past flood risk defences”. The LMTI result and description accurately reflect the data for this event.
To demonstrate validation at the lower end of the index and a different geographical location, the event at Arraial do Cabo (Brazil) on 7 September 2002 is given as an example. At 12:00 UTC and low tide, a series of unusual sea level oscillations at the maximum height of 0.7 m occurred in the harbour. They were initiated by a sharp air pressure change (5 mbar h−1) associated with an offshore weather system. Even though water velocity was strong, no damage to assets or injury/loss of life was reported (Candella and de Araujo, 2021). The LMTI allocated this event a Level 2.2, which as described in Table 2 is an event that is “visible in instruments and observations, causing slight disruption, with small debris and rarely a threat to life and assets”. The intensity level and description reflect the observed data for this event. However, even though the LMTI's ability to assess meteotsunami intensity was validated and demonstrated through this trial run, as the sample size is so small this will require further testing to ensure complete confidence.
Level 5 events are expected to be of a rare occurrence in the current climate. If one were to occur it would be distinguishable from the other levels by the extensive and long-term destruction of assets and loss of life that it would enforce on the shoreline.
4.1 The LMTI and UK meteotsunami
Upon successful implementation of the LMTI in the UK, results have shown that meteotsunami have tended to be of moderate intensity with an overall Level 2. Table 2 describes a Level 2 type event as representing visibly on instruments but rarely a threat to life. Coastal communities will experience a slight disruption including flooding, the movement of small-sized debris, and shallow-water flow, which will usually be accompanied by other hazards such as precipitation and lightning. The identification of south-western England and Scotland as hotspots underscores the importance of the ability to run comparisons between regions and events, allowing researchers to track changes in meteotsunami frequency, intensity, and spatial distribution over time. This hotspot tendency is most likely due to the dominant weather direction coming in from the west, off the Atlantic Ocean, and from strong convective storms building over Spain and France during the summertime.
The rareness of the combination of atmospheric, marine, and topographical factors required for meteotsunami propagation is why Level 4 (severe) events are small in quantity and observed at a limited number of locations. The strongest intensity meteotsunami tend to appear in funnel-shaped bays and harbours with a wide shelf, which is necessary for Proudman resonance to occur and for the transfer energy from the atmosphere to the water. The western English Channel is sufficiently wide and deep, with a shoaling coastline for meteotsunami to become well developed. The noticeable run of Level 3 and Level 4 hazard events that occurred between 1883 and 1932 also coincided with a series of severe storms. The runs of Level 1 hazard events between 2009 and 2015 are again due to a series of severe storms, but in this instance, we can extrapolate a more accurate picture due to the emergence of more refined quantitative data.
It is likely that the data for higher intensity meteotsunami events such as a Level 3 would have a more extensive historical record compared to lower-level events such as a Level 1. This pattern can be attributed to the fact that major events tend to have a more significant impact and are therefore more likely to be documented. The index has become more “complete” over recent years due to advancements in measurement and monitoring and an increase in the level of scientific interest and awareness.
4.2 Application of the LMTI
Motivated by the absence of a formalised way of quantifying meteotsunami intensity, in this paper we have presented the new LMTI, which will allow for comparative analysis between regions prone to meteotsunami, and it is offering a standardised communication media to eliminate any confusion and inconsistency. Having started from a zero position the authors have based the LMTI on the already widely accepted and used Papadopoulos and Imamura (2001) tsunami index and the ITIS-2012 tsunami index (Lekkas et al., 2013). Both indices are heavily reliant on qualitative perceptions based around the impact on people and places. The latter, however, does incorporate quantitative data on the physical characteristics in the form of wave height, run-up, and the number of fatalities. Neither index accounts for variables such as resonance or local geomorphology.
The traditional concept of an intensity scale measures the effects of hazards but not its strength (Gusiakov, 2009). The LMTI has evolved this concept to incorporate the physical components of the hazard. This allows for further investigation into not just why certain areas are more prone but also into the dynamics of the meteotsunami at the shoreline. The index is different from other hazard indices as it does not require sophisticated technology and it allows for the analysis of both the hazard and the receptor site to provide a more holistic view of meteotsunami risk. Understanding how these events have behaved and evolved historically can be a precursor to establishing future trends and highlight issues to promote forward thinking in terms of coastal planning. One of the primary strengths of the LMTI lies in its adaptability and potential for global application. As the field of meteotsunami forecasting and warning progresses, the LMTI will no doubt play an important role in assisting in this process. While the index was developed and trialled in the UK due to its long history of events, records, and data availability, its underlying principles and methodology can be applied to other meteotsunami-prone regions worldwide.
4.3 Constraints and limitations
While the expected results from the LMTI implementation are encouraging, there are certain limitations that should be considered. The availability and quality of historical data may vary across regions, with events missing and the severity of other events being underrepresented due to incomplete datasets. This may potentially affect the applicability in certain areas. Addressing this limitation requires efforts to enhance data collection and establish robust monitoring networks.
The index contains two thresholds that rely on qualitative descriptors, and many of the historical accounts used may have been subjective in nature, especially with documents such as pamphlets and newspapers tending to misreport, exaggerate, or invent characteristics to boost sales. Results have revealed that the further back in time you go, the less available and reliable the accounts become. However, as time progresses this will be remedied with improved quantitative data collection methods.
Finally, sea level, shoreline slope, and elevation in historical times would have been different from present day, and the geometric and topographic nuances of an area can have effects on the propagation of waves. As adjustment of this is beyond the scope of this study; we must assume a static shoreline position based up on current data. Despite the limitations, the index proves to be a useful indication of meteotsunami intensity, and these limitations should not be an issue in moving forward as data become more available and at a higher frequency.
4.4 Further work
Successful implementation of the LMTI in the UK has yielded results that can be used to champion the need for higher-frequency data sampling on tide gauges and for the consideration of the inclusion of meteotsunami into coastal management regimes. As this paper introduces the first evolution of the LMTI, we can offer potential strategies for calibrating and improving the index, in particular for use in a more global context. Primarily, the incorporation of more data from recent observed events and more global events will improve the calibration and reliability. The present evolution of the LMTI requires instantaneous air pressure readings to indicate sudden changes. However, as wave height is proportional to integrated air pressure over time, it may be more appropriate to alter this component to incorporate air pressure over time.
Expanding the index to include resonances such as Proudman, Greenspan, and harbour Q factor may provide valuable information about the potential amplification or dampening effects within a particular location. However, whilst this offers a valuable insight, its practical implementation would require advanced numerical modelling techniques with reliable and detailed data on bathymetry, morphology, and atmospheric conditions. These data may not be available for all affected locations, and by adding complex resonances this could potentially hinder the practicality and usability of the index, making it harder to interpret and less accessible to decision makers.
After a review of the field of research for meteotsunami, it was revealed that there was an absence of a standardised format for quantifying this phenomenon. In this paper, we have introduced a novel meteotsunami intensity index (LMTI), the first of its kind that mixes both quantitative data on the hazard with the effects on the shoreline. The successful implementation of the LMTI in the UK signifies an advance in meteotsunami research with results revealing a 69 % prominence of Level 2 (moderate intensity with slight disruption and a rare threat to life) type events occurring and the presence of distinct geographical hotspots in south-western England and Scotland.
Additionally, we successfully assessed the applicability and adaptability of the LMTI in a global context. As further trials and refinements are carried out, the LMTI has the potential to become a widely accepted standard, contributing to coastal planning and early warning systems worldwide.
The datasets used in this study were derived from open-access journal articles. Datasets used are found in the references section: Dawson et al. (2000), Haslett and Bryant (2009), Lewis et al. (2023a), Long (2015), Pattiaratchi and Wijeratne (2015), Thompson et al. (2020), Vilibic et al. (2021), and Williams et al. (2021).
The supplementary UK map related to this article is available online at https://www.google.com/maps/d/viewer?mid=1RiSeW-DIPSylIVOLv_8-T8Gy_e0To08&ll=58.047774381064756.1343982954656155&z=5 (Lewis et al., 2023b).
The supplement related to this article is available online at: https://doi.org/10.5194/nhess-24-121-2024-supplement.
CL developed the concept, designed, and executed the study and prepared the original draft. TS, JN, and HC supervised the project, provided advice, and reviewed and edited the manuscript.
The contact author has declared that none of the authors has any competing interests.
Publisher's note: Copernicus Publications remains neutral with regard to jurisdictional claims made in the text, published maps, institutional affiliations, or any other geographical representation in this paper. While Copernicus Publications makes every effort to include appropriate place names, the final responsibility lies with the authors.
This article is part of the special issue “Hydro-meteorological extremes and hazards: vulnerability, risk, impacts, and mitigation”. It is a result of the European Geosciences Union General Assembly 2022, Vienna, Austria, 23–27 May 2022.
This paper was edited by Francesco Marra and reviewed by Ivica Vilibić and one anonymous referee.
Candella, R. N. and de Araujo, C. E. S.: Meteotsunamis in Brazil: an overview of known occurrences from 1977 to 2020, Nat. Hazards, 106, 1563–1579, https://doi.org/10.1007/s11069-020-04331-y, 2021.
Dawson, A. G., Musson, R. M. W., Foster, I. D. L., and Brunsden, D.: Abnormal historic sea-surface fluctuations, SW England, Mar. Geol., 170, 59–68, https://doi.org/10.1016/S0025-3227(00)00065-7, 2000.
Denamiel, C., Belušic, D., Zemunik, P., and Vilibić, I.: Climate projections of meteotsunami hazards, Front. Mar. Sci., 10, 1167863, https://doi.org/10.3389/fmars.2023.1167863, 2023.
Engeset, R., Pfuhl, G., Orten, C., Hendrikx, J., and Hetland, A.: Colours and maps for communicating natural hazards to users with and without colour vision deficiency, Int. J. Disast. Risk Reduct., 76, 103034, https://doi.org/10.1016/j.ijdrr.2022.103034, 2022.
Gornitz, V.: Global coastal hazards from future sea level rise, Palaeogeogr. Palaeocl. Palaeoecol., 89, 379–398, https://doi.org/10.1016/0031-0182(91)90173-O, 1991.
Gusiakov, V.: Meteotsunamis at global scale: problems of event identification, parameterization, and cataloguing, Nat. Hazards, 106, 1105–1123, https://doi.org/10.1007/s11069-020-04230-2, 2021.
Haslett, S. K. and Bryant, E. A.: Meteorological Tsunamis in Southern Britain: An Historical Review, Geogr. Rev., 99, 146–163, https://doi.org/10.1111/j.1931-0846.2009.tb00424.x, 2009.
Iida, K., Cox, D. C., and Pararas-Carayannis, G.: Preliminary Catalog of Tsunamis Occurring in the Pacific Ocean, Data Rep. 5, HIG-67-10, Hawaii Inst. of Geophys., Univ. of Hawaii, http://www.soest.hawaii.edu/Library/Tsunami Reports/Iida_et_al.pdf (last access: 15 January 2024), 1967.
Lekkas, E., Andreadakis, E., Kostaki, I., and Kapourani, E.: A Proposal for a New Integrated Tsunami Intensity Scale (ITIS-2012), Bull. Seismol. Soc. Am., 103, 1493–1502, https://doi.org/10.1785/0120120099, 2013.
Lewis, C., Smyth, T., Williams, D., Neumann, J., and Cloke, H.: Meteotsunami in the United Kingdom: the hidden hazard, Nat. Hazards Earth Syst. Sci., 23, 2531–2546, https://doi.org/10.5194/nhess-23-2531-2023, 2023a.
Lewis, C., Smyth, T., Neumann, J., and Cloke, H.: UK meteotsunami events: Intensity index, Google maps [video supplement], https://www.google.com/maps/d/viewer?mid=1RiSeW-DIPSylIVOLv_8-T8Gy_e0To08&ll=58.047774381064756.1343982954656155&z=5 (last access: 15 January 2024), 2023b.
Long, D.: A catalogue of tsunamis reported in the UK, British Geological Association 1R/15/043, British Geological Association, https://nora.nerc.ac.uk/id/eprint/502969/1/CR07077N.pdf (last access: 15 January 2024), 2015.
Lynett, P. J., Borrero, J., Son, S., Wilson, R., and Miller, K.: Assessment of the tsunami induced current hazard, Geophys. Res. Lett., 41, 2048–2055, https://doi.org/10.1002/2013GL058680, 2014.
Masselink, G., Russell, P., Rennie, A., Brookes, S., and Spencer, T.: Impacts of climate change on coastal geomorphology and coastal erosion relevant to the coastal and marine environment around the UK, MCCIP Science Review, 158–189, https://doi.org/10.14465/2020.arc08.cgm, 2020.
Papadopoulos, G. and Imamura, F.: Proposal for a new tsunami intensity scale, in: ITS proceedings, session 5, number 5-1, 7–10 August 2001, Seattle, USA, 569–577, 2001.
Pattiaratchi, C. B. and Wijeratne, E. M. S.: Are meteotsunamis an underrated hazard?, Philos. T. Roy. Soci., 373, 281–303, https://doi.org/10.1007/s11069-014-1263-8, 2015.
Pellikka, H., Šepić, J., Lehtonen, I., and Vilibić, I.: Meteotsunamis in the northern Baltic Sea and their relation to synoptic patterns, Weather Clim. Ext., 38, 100527, https://doi.org/10.1016/j.wace.2022.100527, 2022.
Rabinovich, A. B.: Twenty-Seven Years of Progress in the Science of Meteorological Tsunamis Following the 1992 Daytona Beach Event, Pure Appl. Geophys., 177, 1193–1230, https://doi.org/10.1007/s00024-019-02349-3, 2020.
Rocha, C., Antunes, C., and Catita, C.: Coastal Vulnerability Assessment Due to Sea Level Rise: The Case Study of the Atlantic Coast of Mainland Portugal, Water, 12, 360, https://doi.org/10.3390/w12020360, 2020.
Šepić, J., Vilibić, I., and Mahović, N.: Northern Adriatic meteorological tsunamis: observations, link to the atmosphere, and predictability, J. Geophys. Res.-Oceans, 117, C02002, https://doi.org/10.1029/2011JC007608, 2012.
Sibley, A., Cox, D., Long, D., Tappin, D. R., and Horsburgh, K. J.: Meteorologically generated tsunami like waves in the North Sea on 1 July 2015 and 28 May 2008, Weather, 71, 68–74, https://doi.org/10.1002/wea.2696, 2016.
Thompson, J., Renzi, E., Sibley, A., and Tappin, D.: UK meteotsunamis: a revision and update on events and their frequency, Weather, 75, 281–287, https://doi.org/10.1002/wea.3741, 2020.
Vilibić, I. and Šepić, J.: Global mapping of non-seismic sea level oscillations at tsunami timescales, Sci. Rep., 7, 40818, https://doi.org/10.1038/srep40818, 2017.
Vilibić, I., Rabinovich, A. B. and Anderson, E. J.: Special issue on the global perspective on meteotsunami science: editorial, Nat. Hazards, 106, 1087–1104, https://doi.org/10.1007/s11069-021-04679-9, 2021.
Vučetić, A., Vilibić, I., Tinti, S., and Maramai, A.: The Great Adriatic flood of 21 June 1978 revisited: An overview of the reports, Phys. Chem. Earth Pt. A/B/C, 34, 894–903, https://doi.org/10.1016/j.pce.2009.08.005, 2009.
Williams, D. A., Schultz, D. M., Horsburgh, K. J., and Hughes, C. W.: An 8-yr meteotsunami climatology across northwest Europe: 2010–2017, J. Phys. Oceanogr., 51, 1145–1160, https://doi.org/10.1175/JPO-D-20-0175.1, 2021.
Zemunik, P., Denamiel, C., Williams, J., and Vilibić, I.: High-frequency sea-level analysis: global correlations to synoptic atmospheric patterns, Weather Clim. Ext., 38, 100516, https://doi.org/10.1016/j.wace.2022.100516, 2022.