the Creative Commons Attribution 4.0 License.
the Creative Commons Attribution 4.0 License.
 | 03 Apr 2024
Does a convection-permitting regional climate model bring new perspectives on the projection of Mediterranean floods?
Nils Poncet
Philippe Lucas-Picher
Yves Tramblay
Guillaume Thirel
Humberto Vergara
Jonathan Gourley
Antoinette Alias
Floods are the primary natural hazard in the French Mediterranean area, causing damages and fatalities every year. These floods are triggered by heavy precipitation events (HPEs) characterized by limited temporal and spatial extents. A new generation of regional climate models at the kilometer scale have been developed, allowing an explicit representation of deep convection and improved simulations of local-scale phenomena such as HPEs. Convection-permitting regional climate models (CPMs) have been scarcely used in hydrological impact studies, and future projections of Mediterranean floods remain uncertain with regional climate models (RCMs). In this paper, we use the CNRM-AROME CPM (2.5 km) and its driving CNRM-ALADIN RCM (12 km) at the hourly timescale to simulate floods over the Gardon d'Anduze catchment located in the French Mediterranean region. Climate simulations are bias-corrected with the CDF-t method. Two hydrological models, a lumped and conceptual model (GR5H) and a process-based distributed model (CREST), forced with historical and future climate simulations from the CPM and from the RCM, have been used. The CPM model confirms its ability to better reproduce extreme hourly rainfall compared to the RCM. This added value is propagated on flood simulation with a better reproduction of flood peaks. Future projections are consistent between the hydrological models but differ between the two climate models. Using the CNRM-ALADIN RCM, the magnitude of all floods is projected to increase. With the CNRM-AROME CPM, a threshold effect is found: the magnitude of the largest floods is expected to intensify, while the magnitude of the less severe floods is expected to decrease. In addition, different flood event characteristics indicate that floods are expected to become flashier in a warmer climate, with shorter lag time between rainfall and runoff peak and a smaller contribution of base flow, regardless of the model. This study is a first step for impact studies driven by CPMs over the Mediterranean.
- Article
(4952 KB) - Full-text XML
- BibTeX
- EndNote


Every year, the French Mediterranean region faces intense flash floods during the fall season, causing important damages and casualties. Even if only small to medium catchments are concerned, flash floods are amongst the most destructive hazards in the French Mediterranean region (Boudou et al., 2016; Vinet et al., 2022). These hydrological events are triggered by heavy precipitation events (HPEs) that can bring up to half of the annual rainfall in a few hours to days (Delrieu et al., 2005; Nuissier et al., 2011; Ricard et al., 2012). Initiated by the complex interaction between moisture fluxes from the Mediterranean Sea to the atmosphere, synoptic-scale processes and topography, HPEs are complex and challenging to simulate and forecast with precision (Khodayar et al., 2018; Caillaud et al., 2021; Caumont et al., 2021). Due to their strong societal and economic impacts, being able to model HPEs and their resulting flash floods in current and future climate is an important societal concern.
For several decades, faster computational capabilities and improved understanding of atmospheric processes have enhanced the confidence towards climate model simulations at global and regional scales (Rummukainen, 2010; Giorgi, 2019). Using a limited area, regional climate models (RCMs) can reach spatial resolutions down to 10 km by dynamically downscaling global climate model (GCM) simulations (Giorgi and Gutowski, 2015). The increase in climate model spatial resolutions with time brought a more accurate description of the topography and an improved simulation of physical processes, improving the simulation of regional meteorological phenomena such as extreme rainfall events (Giorgi, 2019). Due to their higher spatial resolutions, RCMs allow the study of climate change impacts at the regional scale (Maurer et al., 2007; Teutschbein and Seibert, 2010). Namely, numerous studies have used RCM simulations as inputs for hydrological models to simulate discharge and floods in Europe (Kay et al., 2006; Dankers and Feyen, 2009; Köplin et al., 2014). Often necessary for hydrological simulations, bias correction methods can substantially affect the projection of floods in a warmer climate (Boé et al., 2007; Rojas et al., 2011; Teutschbein and Seibert, 2012).
RCM projections generally agree on the increase in extreme precipitation in the French Mediterranean region (Tramblay and Somot, 2018; Zittis et al., 2021), confirming the observed trends (Ribes et al., 2019). Despite the positive trends in rainfall extremes over the French Mediterranean region, the link of this signal to floods is not straightforward (Sharma et al., 2018; Tramblay et al., 2019). Hydrological trends depend on multiple factors, such as catchment location, event severity, flood-generating processes and soil moisture conditions (Blöschl et al., 2019; Wasko et al., 2023; Brunner et al., 2021). In the Mediterranean area, the reduction of the soil moisture prior to flood events could counterbalance rainfall extremes and possibly invert the sign of observed flood changes (Tramblay et al., 2023). In terms of future trends, the signal on flood magnitude and frequency thus remains uncertain in the French Mediterranean region. Using daily variables from an RCM ensemble, Alfieri et al. (2015) showed a future decrease in mean annual flows and an increase in flood frequency in this area. Thober et al. (2018) showed no clear signal for high flows and flood magnitudes in the French Mediterranean. On the contrary, Lemaitre-Basset et al. (2021) reported a projected increase in flood severity in a catchment in southern France.
Under a Mediterranean climate, precipitation is usually the main driver for runoff production. Floods are therefore mainly triggered by HPEs on small catchments (Amponsah et al., 2018). Despite RCMs' good simulation of climatic conditions, biases remain in the representation of some regional and local phenomena, such as HPEs (Khodayar et al., 2016; Caillaud et al., 2021). Indeed, with resolutions coarser than 10 km, the simulation of convective events with RCMs requires the use of deep convection parameterization schemes, leading to an underestimation of rainfall extremes (Prein et al., 2016; Ban et al., 2021). This poor representation of sub-daily extreme rainfall by RCMs could question the reliability of the flood impact studies over small Mediterranean catchments, perhaps explaining some contradictory results identified in the literature.
During the last decade, a new generation of RCMs has emerged (Kendon et al., 2012). Convection-permitting regional climate models (CPMs) generally have a resolution finer than 5 km. Their resolution is sufficiently fine to allow an explicit representation of deep convective processes (Lucas-Picher et al., 2021) and thus removes the need for deep convection parameterization schemes, which are necessary in RCMs. Most of the studies using CPMs show a clear added value compared to RCMs in the representation of local-scale phenomena such as convective cells and localized intense precipitation (Prein et al., 2015; Coppola et al., 2020; Caillaud et al., 2021; Caldas-Alvarez et al., 2023). In the context of the Coordinated Regional Climate Downscaling Experiment Flagship Pilot Study (CORDEX-FPS) convection initiative, Ban et al. (2021) carried out a multimodel evaluation of CPMs over a central European domain. This study confirmed the added value of different CPMs in the simulation of hourly extreme precipitation.
Even if CPMs are a promising tool to study hydrological impacts, only a few of them have yet been used for this purpose. Results from these preliminary studies do not indicate improvements in discharge simulation and flood modeling using CPMs. Kay et al. (2015) used a CPM output to feed a hydrological model over river basins in Great Britain. Their results indicate no added value using this CPM on discharge modeling, with strong geographical differences. The same conclusion was found by Reszler et al. (2018) using simulations from two CPMs as input for the KAMPUS distributed hydrological model over a continental and mountainous domain (Eastern Alps). Mendoza et al. (2016) compared the impact of climate model spatial resolution in Colorado, showing the ability of CPMs to reproduce observed annual cycles especially in mountainous catchments. In an idealized modeling chain with different climate simulation resolution, Quintero et al. (2021) found that a 4 km grid spacing CPM is the best compromise between computational costs and performance of hydrological modeling. In terms of future projections, and using CPMs as an input of a distributed hydrological model, floods are projected to become more severe, more frequent, more unpredictable and flashier in the USA (Li et al., 2022a, b). In a recent study, Kay (2022) used an ensemble of CPMs to feed a gridded hydrological model, showing a better performance and higher future flow changes in CPMs compared to RCMs. Using a modeling chain driven by a CPM over a tropical area in Africa, Ascott et al. (2023) indicate no significant trend in floods in future projections. Even though the aforementioned studies have pioneered the use of CPMs with hydrological models, they are limited to only one hydrological model, ignoring uncertainty induced by hydrological models discrepancies. To our knowledge, no paper has studied Mediterranean floods using a CPM.
In this study, we would like to assess the added value of a CPM regarding the evolution of floods over a Mediterranean catchment prone to intense floods. For this, we perform an analysis of simulated flood magnitudes and characteristics under a historical scenario and under the RCP8.5 emissions scenario. Two climate datasets, a CPM (CNRM-AROME) and its driving RCM (CNRM-ALADIN), are used as inputs to one lumped, conceptual hydrological model (GR5H) and one distributed, process-based hydrological model (CREST used in EF5). The main aims of this paper are to
-
evaluate the added value of the CPM on the simulation of extreme rainfall at the scale of a small Mediterranean basin;
-
evaluate the capacity of a CPM to reproduce Mediterranean floods using two hydrological models;
-
assess future changes in flood distributions and characteristics between the two models and two climate simulations.
Section 2 describes the area of interest, the data, and the different climate and hydrologic models. The methodology is detailed in Sect. 3. The evaluation of the climate and hydrological models and the projection of floods are presented and discussed in Sect. 4.
2.1 Catchment: Gardon d'Anduze
The study is performed over a 543 km2 Mediterranean catchment, the Gardon d'Anduze, located in the Cévennes region, on the southern slopes of the Massif Central mountain range. The Gardon d'Anduze has a complex topography ranging from 130 m to 1200 m a.s.l. Consequently, it is rather natural, forested and lightly urbanized. Indeed, most of its surface is covered by typical Mediterranean vegetation. The soils are relatively thin, from 10 cm at the top of the hillslopes to 100 cm close to the river bed (Vannier et al., 2014). It is considered a highly reactive Mediterranean catchment, known for experiencing some of the most destructive flash floods in France (Delrieu et al., 2005; Toukourou et al., 2011). The Gardon d'Anduze catchment has been extensively studied due to its location of particular interest in hydrology, especially for flash flood modeling and forecasting (Alfieri et al., 2011; Roux et al., 2011; Moussa, 2010). Figure 1 displays the location of Gardon d'Anduze in France (a) and orography as shown by an 80 m resolution DEM (b) and by the RCM and CPM (c and d).
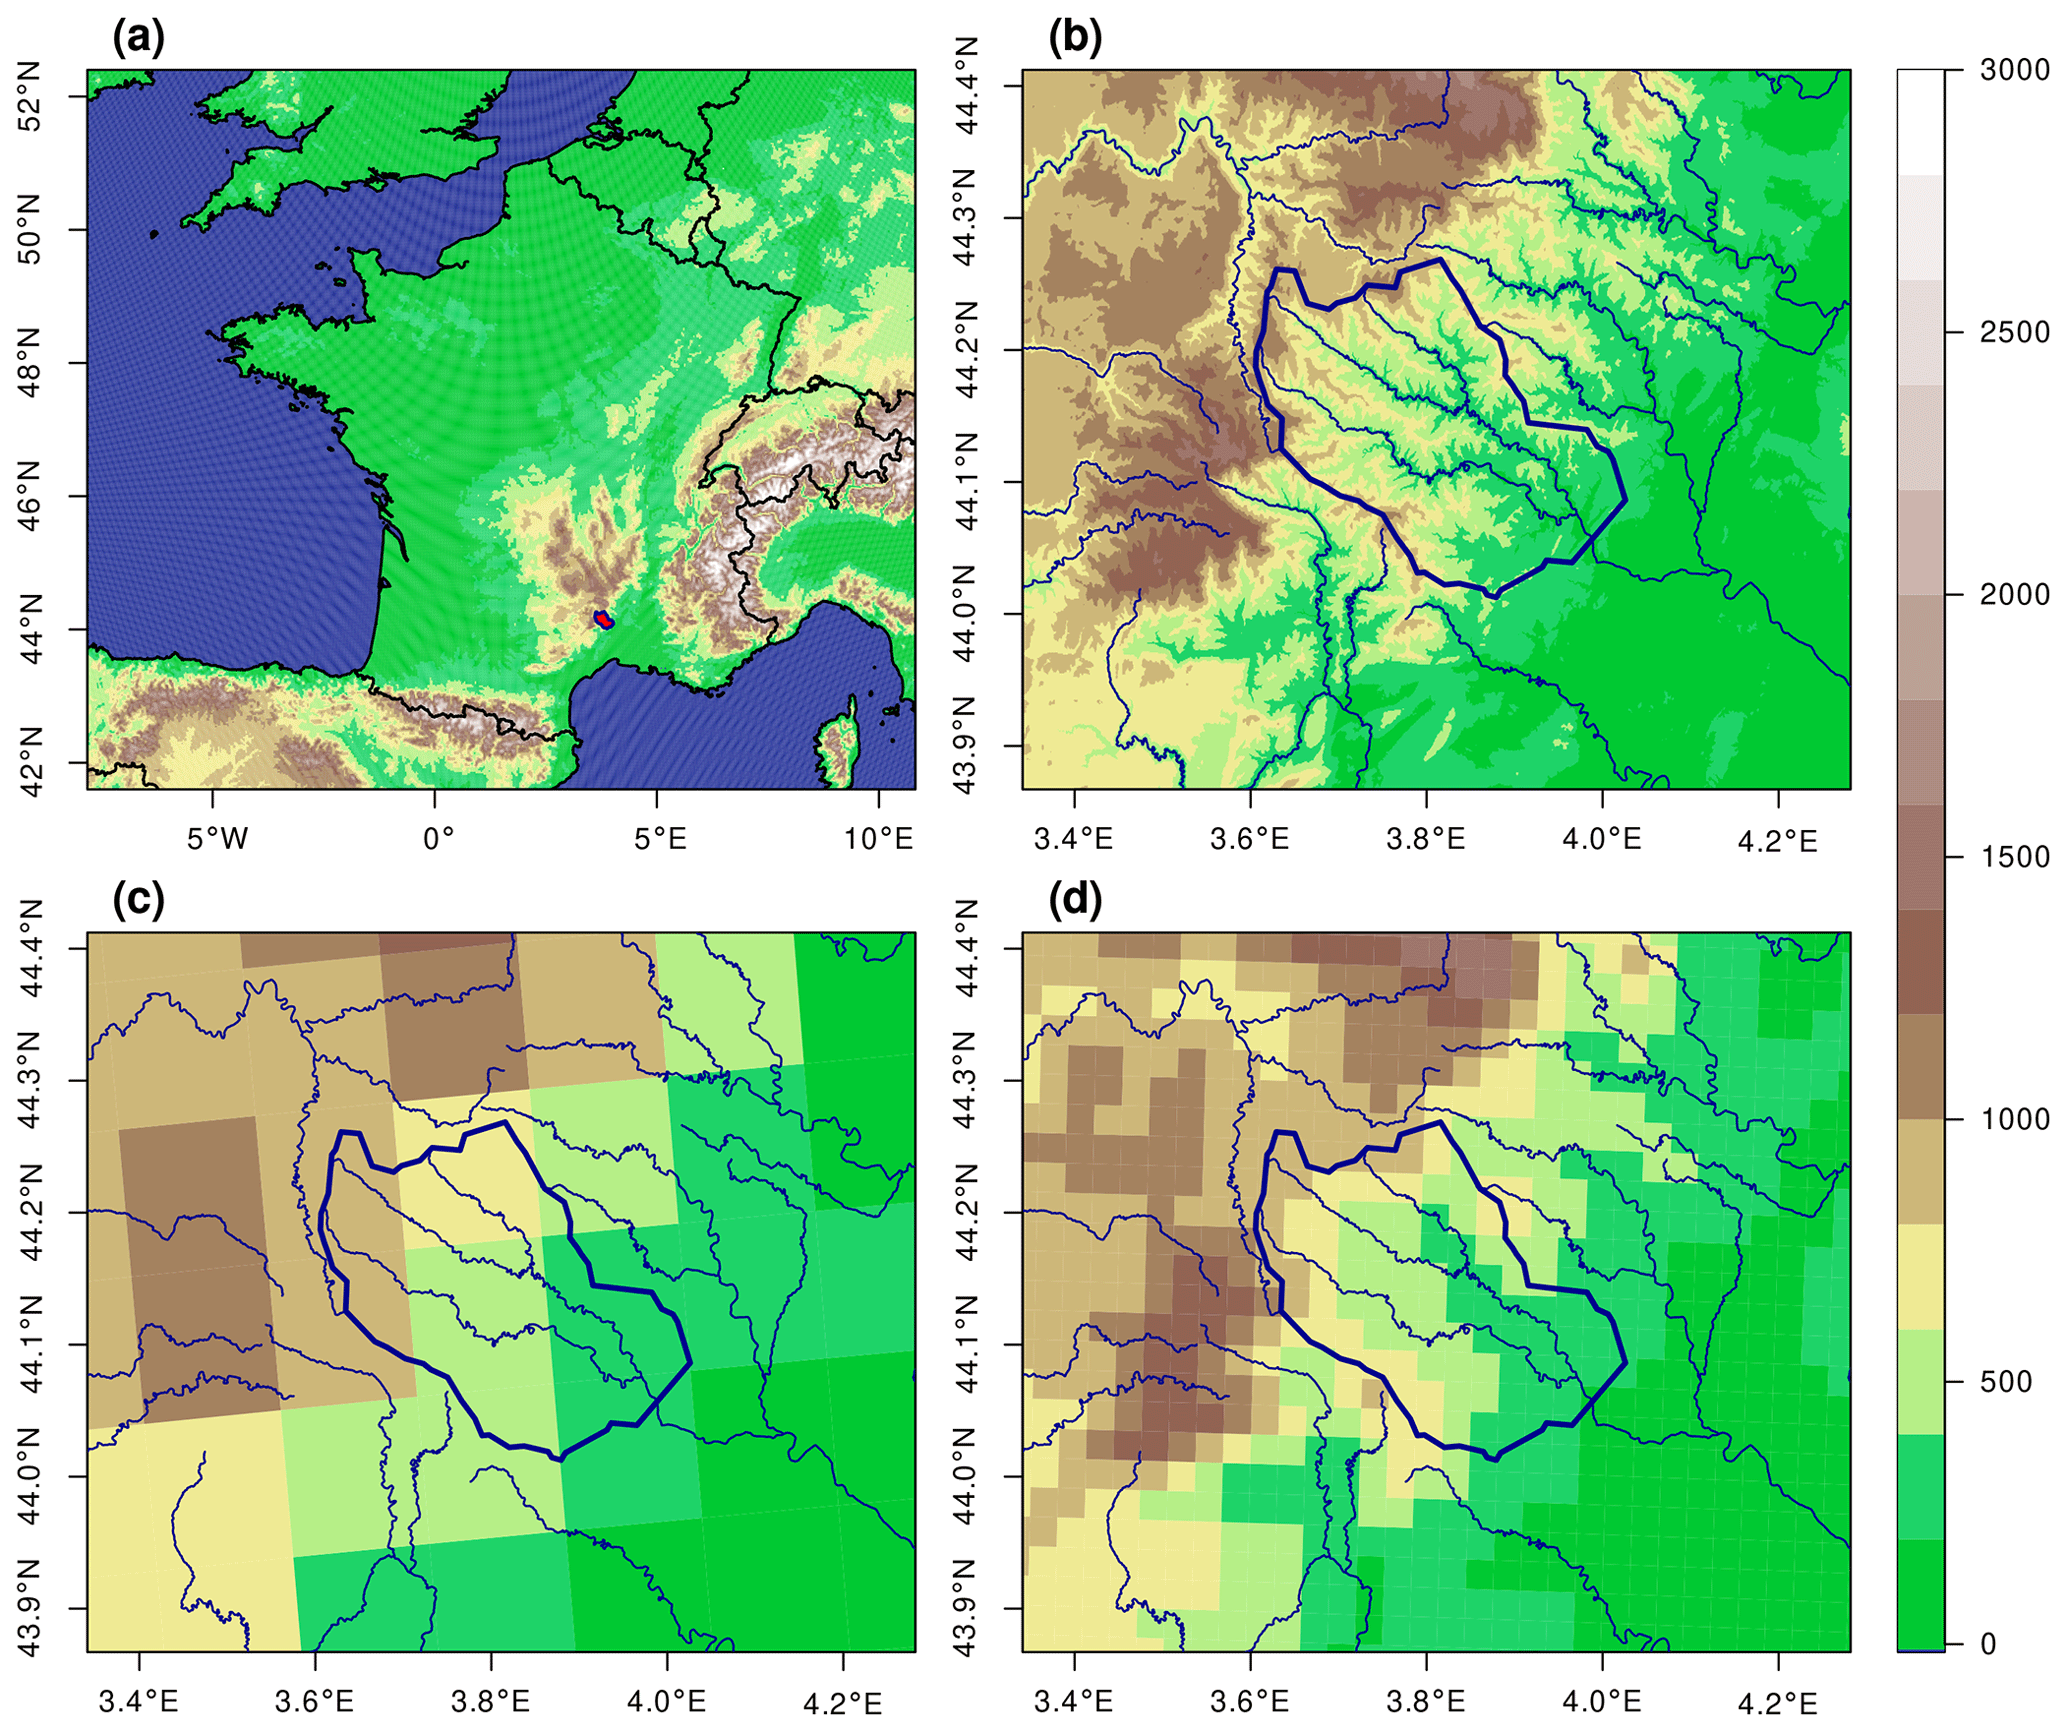
Figure 1Location of the Gardon d'Anduze catchment (in red) over France (a) and orography of this catchment represented by an 80 m DEM (b), by the 12 km CNRM-ALADIN RCM (c) and by the 2.5 km CNRM-AROME CPM (d).
2.2 Climate models
In this study, we use climate simulations from a CPM and its forcing RCM, both developed and released at the Centre National de Recherches Météorologiques (CNRM), in Toulouse, France. Information about these two climate models is summarized in Table 1.
Nabat et al. (2020)Lucas-Picher et al. (2023)Table 1Information about the two climate models and their associated simulations used in this study.
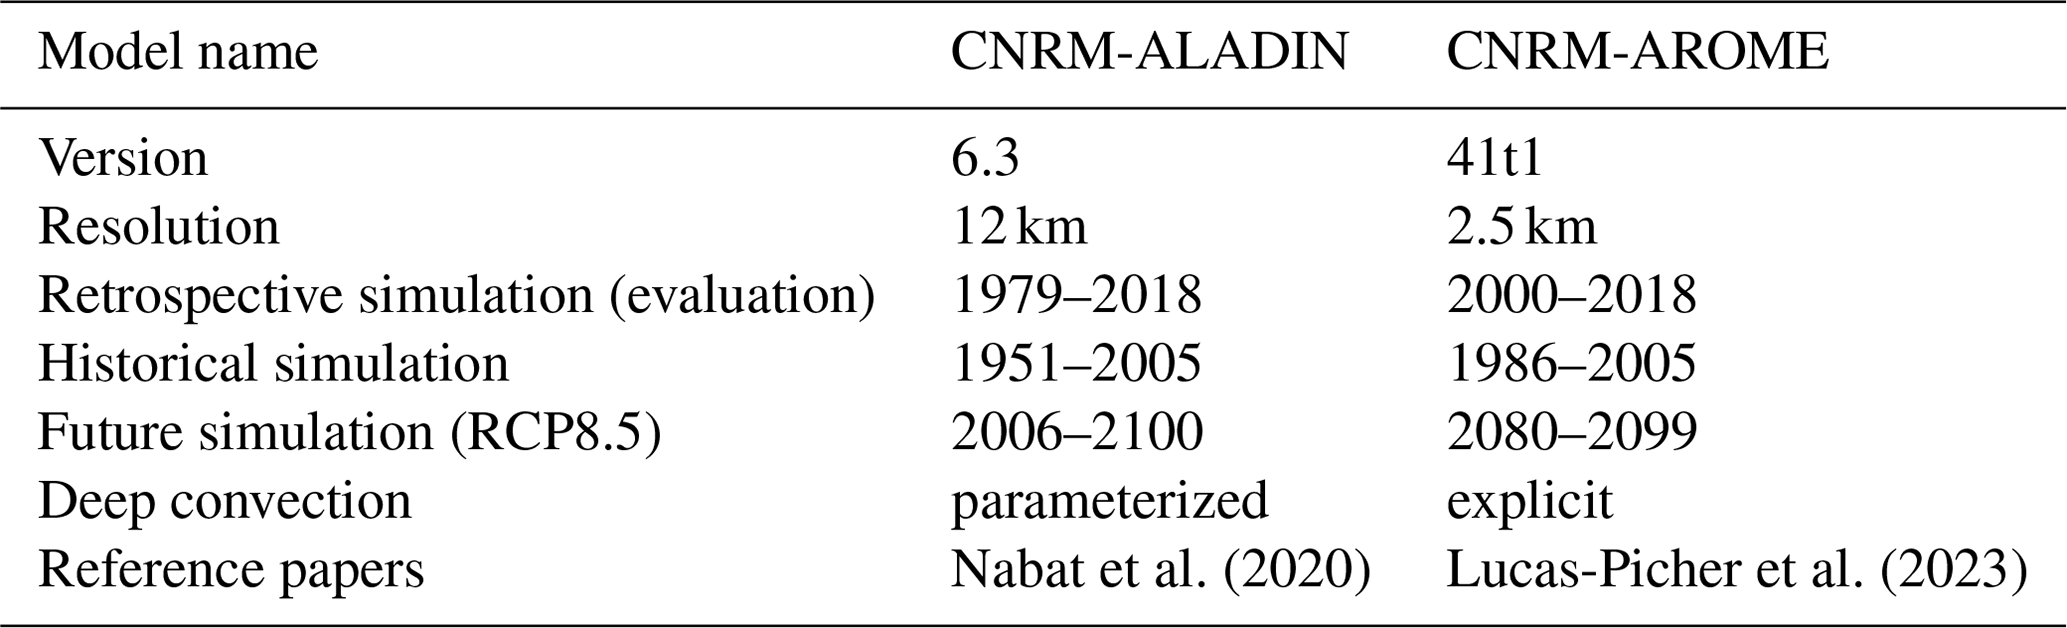
CNRM-ALADIN is a 12 km grid cell RCM that has been run over the continental EUR-11 domain through the EURO-CORDEX initiative. Retrospective simulations are driven by the ERA-Interim global reanalysis dataset (Dee et al., 2011), while historical and future scenarios are forced by the CNRM-CM5 global model (Voldoire et al., 2013). This version is derived from the development of the NWP model ALADIN, thanks to the ACCORD research centers consortium. CNRM-ALADIN has been extensively used in the CORDEX framework over Europe, the Mediterranean, North America and Africa. For more details about the parameterization schemes and configurations of the last version of ALADIN, see Nabat et al. (2020) and Lucas-Picher et al. (2023).
CNRM-AROME is a CPM, which is adapted from cycle 41 of the NWP AROME formerly operating for numerical weather prediction. Simulations used in this study are produced, as part of the EUCP project, over the NW domain, covering France, the UK, the north of Spain and most of Germany with a 2.5 km mesh. Some papers have already evaluated this model, under a former release (Fumière et al., 2020), a different domain and forcing RCM version (Caillaud et al., 2021; Monteiro et al., 2022), or the same version and domain used in this study (Lucas-Picher et al., 2023). All these evaluations have established the added value of CNRM-AROME in the reproduction of extreme rainfall and HPEs compared to CNRM-ALADIN over the domains. To our knowledge, no published study has used CNRM-AROME projections for climate change assessment. In this paper, ALADIN and AROME refer to the version of CNRM-ALADIN and CNRM-AROME described above, respectively.
2.3 Observations
In this study, we compare the hourly simulated data with a high-resolution observed precipitation dataset called COMEPHORE. COMEPHORE is an hourly 1 km resolution gridded product covering Metropolitan France during the 1997–2019 period. COMEPHORE was built by merging weather station rainfall measurements and different radar sources (Laurantin et al., 2012; Caillaud et al., 2021). The dataset used approximately 3000 daily rain gauges and 1200 hourly rain gauges. The number of radars has more than doubled during the first decade of data. In 2019, COMEPHORE was built using data from 29 radars comprising the French radar network (ARAMIS), in addition to radars from the Swiss network and another one on Jersey Island. Even though the quality of the dataset is not temporally and spatially homogeneous and it has a tendency of underestimating some extreme values (Laurantin et al., 2012), COMEPHORE can be considered the best national precipitation product for studying hourly rainfall at high spatial and temporal resolutions. Furthermore, the Gardon d'Anduze river catchment is located in a region of high rain gauges and radar density, raising the confidence in this dataset for a benchmark in this study (Caillaud et al., 2021).
Temperature is the main variable to compute potential evapotranspiration (PET). As a reference, we extracted 3 h temperature measurements from six weather stations in the basin. Temperature was then linearly downscaled to the hourly time step and interpolated over the catchment using an inverse-distance-weighting method. The COMEPHORE rainfall dataset and PET derived from interpolated temperature are the best observation-based estimates in this area and are therefore considered the reference observational datasets in this paper.
Numerous methods exist to compute PET from climatic variables for hydrological modeling perspectives (Oudin et al., 2005). Here, we compute PET using the Hargreaves–Samani (HS) method (Hargreaves and Samani, 1982). We chose a reliable, widespread applied method that requires the minimum amount of climate variables at the daily time step. Daily PET is then disaggregated to the hourly time step using a standard distribution curve as done in Lobligeois (2014). We applied the same methodology for simulated temperature.
2.4 Hydrological models
Two hydrological models with different physical concepts were used in this framework. This choice was made to consider the potential uncertainty related to hydrological modeling that can affect hydrological projections (see, e.g., Lemaitre-Basset et al., 2021, which discusses this issue for the neighboring Hérault catchment).
The GR5H model is a lumped, conceptual rainfall–runoff model that runs hourly (Ficchì et al., 2019). Based on several conceptual reservoirs, such as a soil moisture accounting reservoir, and a unit hydrograph, this model uses catchment-aggregated hourly precipitation and potential evapotranspiration data to simulate hourly discharge. The GR5H model takes into account the interception of rainfall by vegetation, which was proven important for flood events (Ficchì et al., 2019). The GR5H model parameters were calibrated against observed discharge using the Nash and Sutcliffe efficiency (NSE) objective function. This model or close versions belonging to the so-called GR family of hydrological models have been used both for flood simulation (Ficchì et al., 2019; Astagneau et al., 2021) and climate change applications (Chauveau et al., 2013; Lemaitre-Basset et al., 2021). The GR5H model was run using the open-source airGR R package (Coron et al., 2017, 2020), which also provides the parameter calibration algorithm that was used.
The Ensemble Framework For Flash Flood Forecasting (EF5) is a software for distributed water balance modeling (Flamig et al., 2020), including different schemes for runoff production and routing. As part of EF5, we used the Coupled Routing and Excess STorage (CREST) model and the kinematic wave routing scheme, at the hourly time step. CREST is a fully distributed and process-based hydrological model. It can be defined as a hybrid between a conceptual and a physics-based model (Wang et al., 2011). All hydrological processes, such as runoff production, evapotranspiration and sub-grid cell routing are computed at each grid cell. CREST is composed of two excess storage reservoirs, one for interception by the vegetation canopy and one representing a layer of soil. For each cell, runoff and infiltration are separated using a variable infiltration curve. Therefore, this model takes into account the two main runoff production mechanisms: saturation excess and infiltration excess. The subsurface routing is done with a linear reservoir model. Total runoff, composed of surface and sub-surface runoff water, is then routed to the outlet following the orography provided by a digital elevation model (DEM) with the kinematic wave routing scheme. Actual evapotranspiration is determined in the model from PET input and the water content of the cell. The CREST model is composed of 13 parameters: 6 for runoff production and 7 for the routing. Here we will refer to this adaptation of CREST in EF5 simply as CREST for succinctness. The DiffeRential Evolution Adaptive Metropolis (DREAM) scheme is used for automatic calibration to estimate the best parameter set (Vrugt et al., 2009). A complete description of parameters is provided in Flamig et al. (2020). CREST is a model initially developed to respond to the need of forecasting floods at the global scale (Wang et al., 2011) but is perfectly suitable to simulate flash floods (Flamig et al., 2020) through EF5. Indeed, CREST has been used to study extreme hydrological events, for example, to reproduce floods from a major hurricane event (Li et al., 2021) or floods and flash floods in a warmer future (Li et al., 2022b, a). In this study, topographic data from version 1.1 of the HydroSHEDS database are used for CREST. Resolution of the DEM is 15 arcsec; hence, for this latitude it is around 300 m in longitude by 450 m in latitude. Drainage direction maps and flow accumulation maps are then produced using the QGIS software and packages.
The CREST and GR5H hydrological models have been calibrated using the hourly observed discharge from 2002–2018 and using the COMEPHORE hourly rainfall dataset and PET computed from observed air temperatures. For GR5H, all the model parameters have been calibrated. For CREST, most parameters have been fixed (Li et al., 2022a), and the calibration has been performed on a few sensitive parameters. The NSE criteria are used as an objective function for the calibration process. We initialized the models during a 1-year warmup period before the starting date. Both hydrological models have been evaluated using the following metrics (see Sect. 4.2) over the 2002–2018 period:
-
Nash and Sutcliffe efficiency (Nash and Sutcliffe, 1970);
-
KGE (Gupta et al., 2009);
-
bias on mean flows;
-
bias on quantile 99.9;
-
bias on peak over threshold (POT) distributions – we compared the mean of simulated POT distribution to the mean of observed POT distribution.
The same period (2002–2018) is kept to run the hydrological models driven with retrospective climate simulations. For the scenario datasets, using a 1-year warmup period, we computed simulations over two epochs of 19 years for historical (1987–2005) and future (2081–2099) periods.
3.1 Bias correction
Climate simulations and notably precipitation often show significant biases that prevent their direct use in impact studies such as for hydrological impact modeling. Indeed, hydrological models are calibrated over climatic conditions that can differ strongly from the raw historical climate simulations. The use of bias correction methods on climate simulations is an open debate (Addor and Seibert, 2014; Huang et al., 2014; Maraun, 2016). However, correction of biased climate simulations is widely used for hydrological impact studies and future projections (Reszler et al., 2018; Giorgi, 2019; Lucas-Picher et al., 2021).
In order to correct simulated climate data biases, we used an univariate statistical bias correction method. CDF-t is a statistical bias correction method specifically developed for correcting biases of climate variables (Michelangeli et al., 2009). The basis of this method is an extension of a quantile mapping method that allows a change in distribution statistics for corrected variables. Consequently, CDF-t is particularly appropriate to correct future climate datasets in a non-stationary climate (Michelangeli et al., 2009; Vrac et al., 2012), and it is largely used to correct future climate projections for the sake of climate change impact studies. In this study, we applied the CDF-t correction on hourly precipitation and temperature variables. Due to the distinct seasonality of precipitation and a strong spatial variability of precipitation in this catchment, we corrected simulated datasets for each calendar month and over each grid cell separately. To take into account differences in the ratio of wet and dry hours, the Singularity Stochastic Removal (SSR) preprocessing method is applied for precipitation simulations (Vrac et al., 2016). Historical simulations are corrected against the corresponding observed period (2000–2018). With the common period of data between observations and historical AROME simulations being relatively short (8 years), we chose to correct observations and the historical simulation over two asynchronous periods of same length, respectively 2000–2019 and 1986–2005. This correction is then applied over the end-of-century RCP8.5 projections (2080–2099). All these operations are performed through the R package SBCK (Robin, 2022). Raw and bias-corrected hourly precipitation patterns have been compared for some extreme rainfall events, and spatial correlation is little affected by the bias correction (not shown). For the GR5H model, corrected climate outputs are then averaged over the Gardon d'Anduze catchment.
3.2 POT extraction
This study focuses on floods. To extract floods from discharge time series, two approaches are widely adopted: the annual maximum flood (AMF) and a peak over threshold (POT) extraction (Lang et al., 1999). The POT selection method consists of the extraction of all flood peaks exceeding a threshold. Contrary to the AMF method, the POT method preserves the hydrological information especially in Mediterranean catchments where several flash floods can occur every year. Hence, we selected this method for flood extraction in this paper. The POT method requires temporal independence between flood peaks. To ensure this assumption, a declustering algorithm has been developed and applied to evaluate temporal dependencies between POTs, adapted from Lang et al. (1999). The declustering applied herein considers that two floods are independent if there is a minimum duration of 96 h between the two events and if the discharge between different events must drop below 75 % of the minimum value of the flood peaks. Cunnane (1973) found that the POT method minimizes the sampling variance for a threshold producing on average 1.65 flood peaks per year, compared to the AMF. To get a sufficient sample of simulated POT (in particular for ALADIN), we fixed here the discharge threshold to get closer to 2 floods per year for the observed discharge (corresponding to a threshold equal to 265 m3 s−1), after declustering.
3.3 Flood characteristics
For each event, several flood characteristics and their associated rainfall events are also analyzed. These metrics aim to understand future changes in flood mechanisms as projected by climate simulations. For instance, changes in flood peak baseflow can give information on change in antecedent soil moisture. The lag-time and flashiness indexes describe the intensity and speed of the rise of the river flow, a signature of potential catastrophic impacts (flash flood). At the same time, characteristics of the rainfall events (duration, intensity, maximum) in tandem with the flood characteristics help elucidate the driving processes and causes of future changes in the basin's hydrometeorology. Rainfall events associated with each POT (Sect. 3.2) are defined by a sequence of hourly rainfall prior to the flood peak (i) interrupted by no more than 2 dry hours and (ii) yielding at least 30 mm to trigger the hydrological event. These two conditions have been tested for different values with observed datasets and have shown very little sensitivity to defining the flood characteristics. The rainfall thresholds are related to our knowledge of the river basin dynamics and hydrological expertise. Table 2 summarizes metrics names, meaning and computation details.
(Wasko and Guo, 2022)Li et al. (2022b)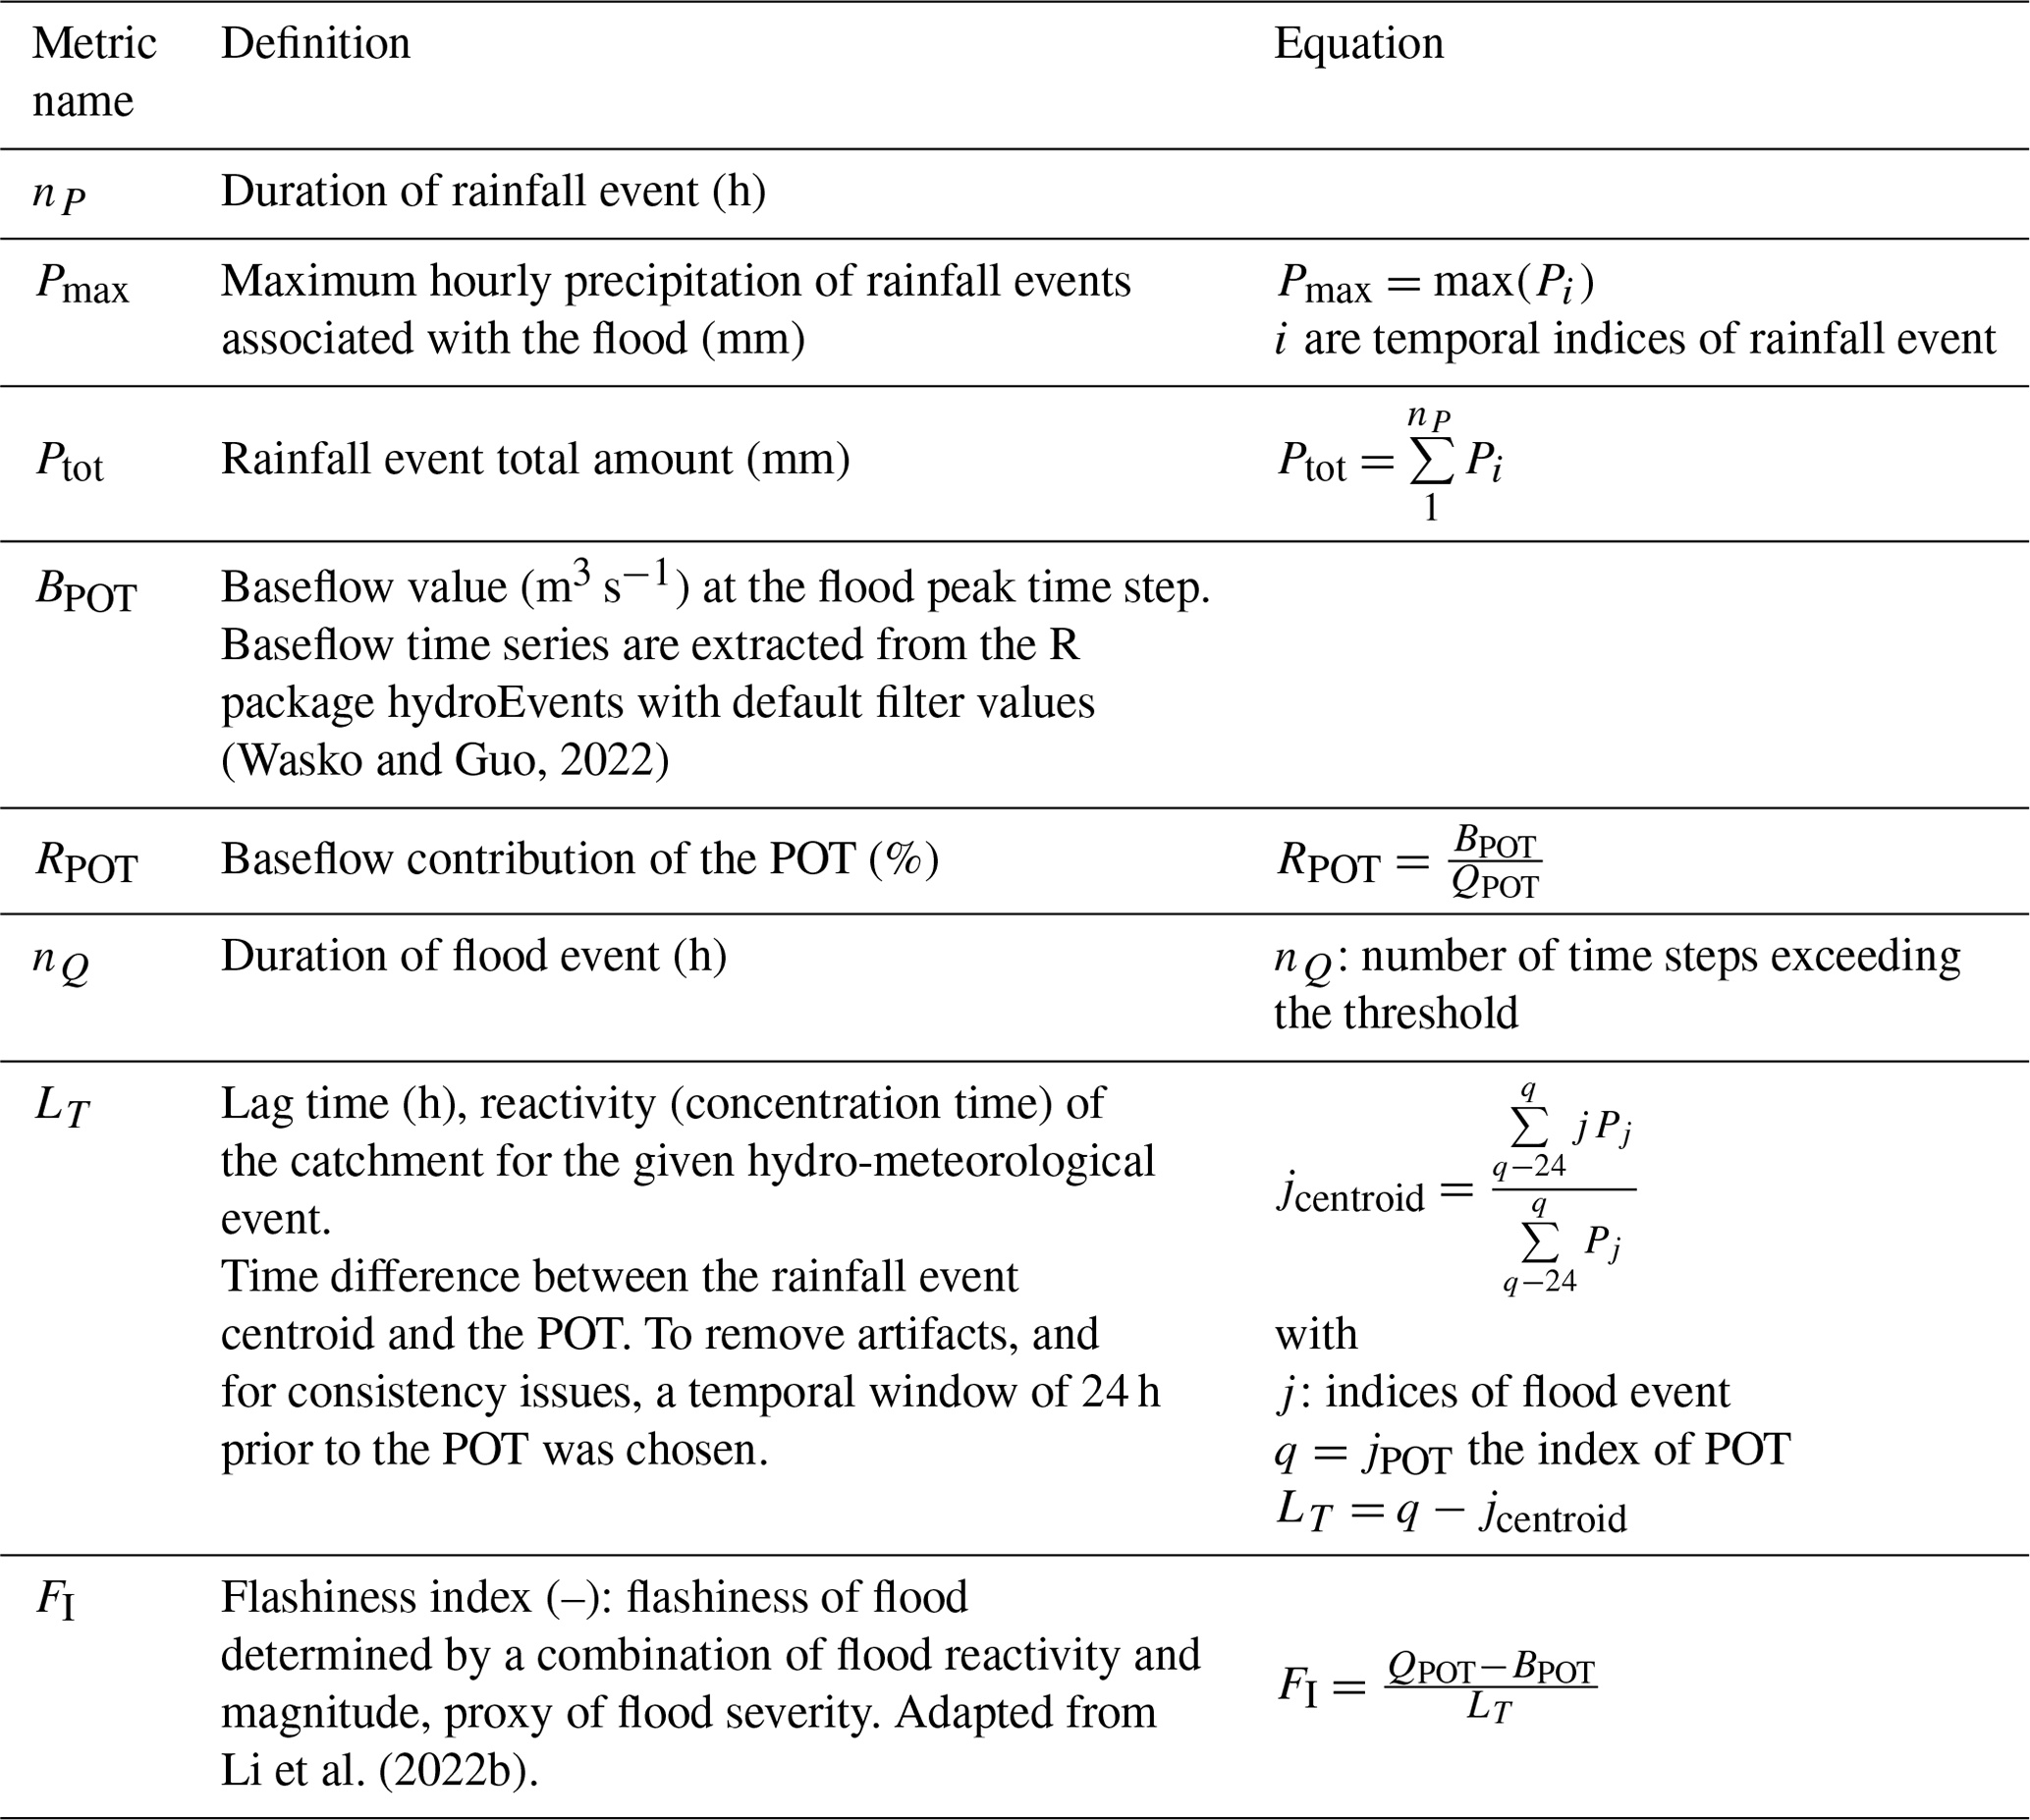
4.1 Added value of CPM at the catchment scale
We first analyze the climate datasets aggregated at the scale of the Gardon d'Anduze catchment. Figure 2 shows the annual cycle for daily minimum (Tmin) and maximum (Tmax) temperature and hourly precipitation before (raw) and after bias correction (BC-CDFT). AROME and ALADIN in retrospective mode (evaluation) show correct annual cycles despite an overestimation of summer temperature both for Tmin and Tmax. Results in this area are in line with the recent evaluation of the ALADIN and AROME climate models (Lucas-Picher et al., 2023). The ALADIN RCM is generally colder than AROME, which can be explained by an effect of resolution. A strong cold bias (3–5 °C) is visible over all seasons for both models in historical scenarios over the period 1986–2005. This cannot be explained by climate variability or by climate change signals between the decades 1986–2005 and 2000–2018. This is a known cold bias of climate models driven by the GCM CNRM-CM5 (Vautard et al., 2021). Annual cycles for Tmin and Tmax for future projections (RCP8.5) are similar to the evaluation period; i.e., climate change signals for temperature are almost of the same magnitude as the cold bias. As expected, this cold bias disappears after bias correction for both AROME and ALADIN historical scenarios. The bias-corrected temperatures under the RCP8.5 scenario strongly increase for all seasons. However, the strongest signal is seen for the summer months.
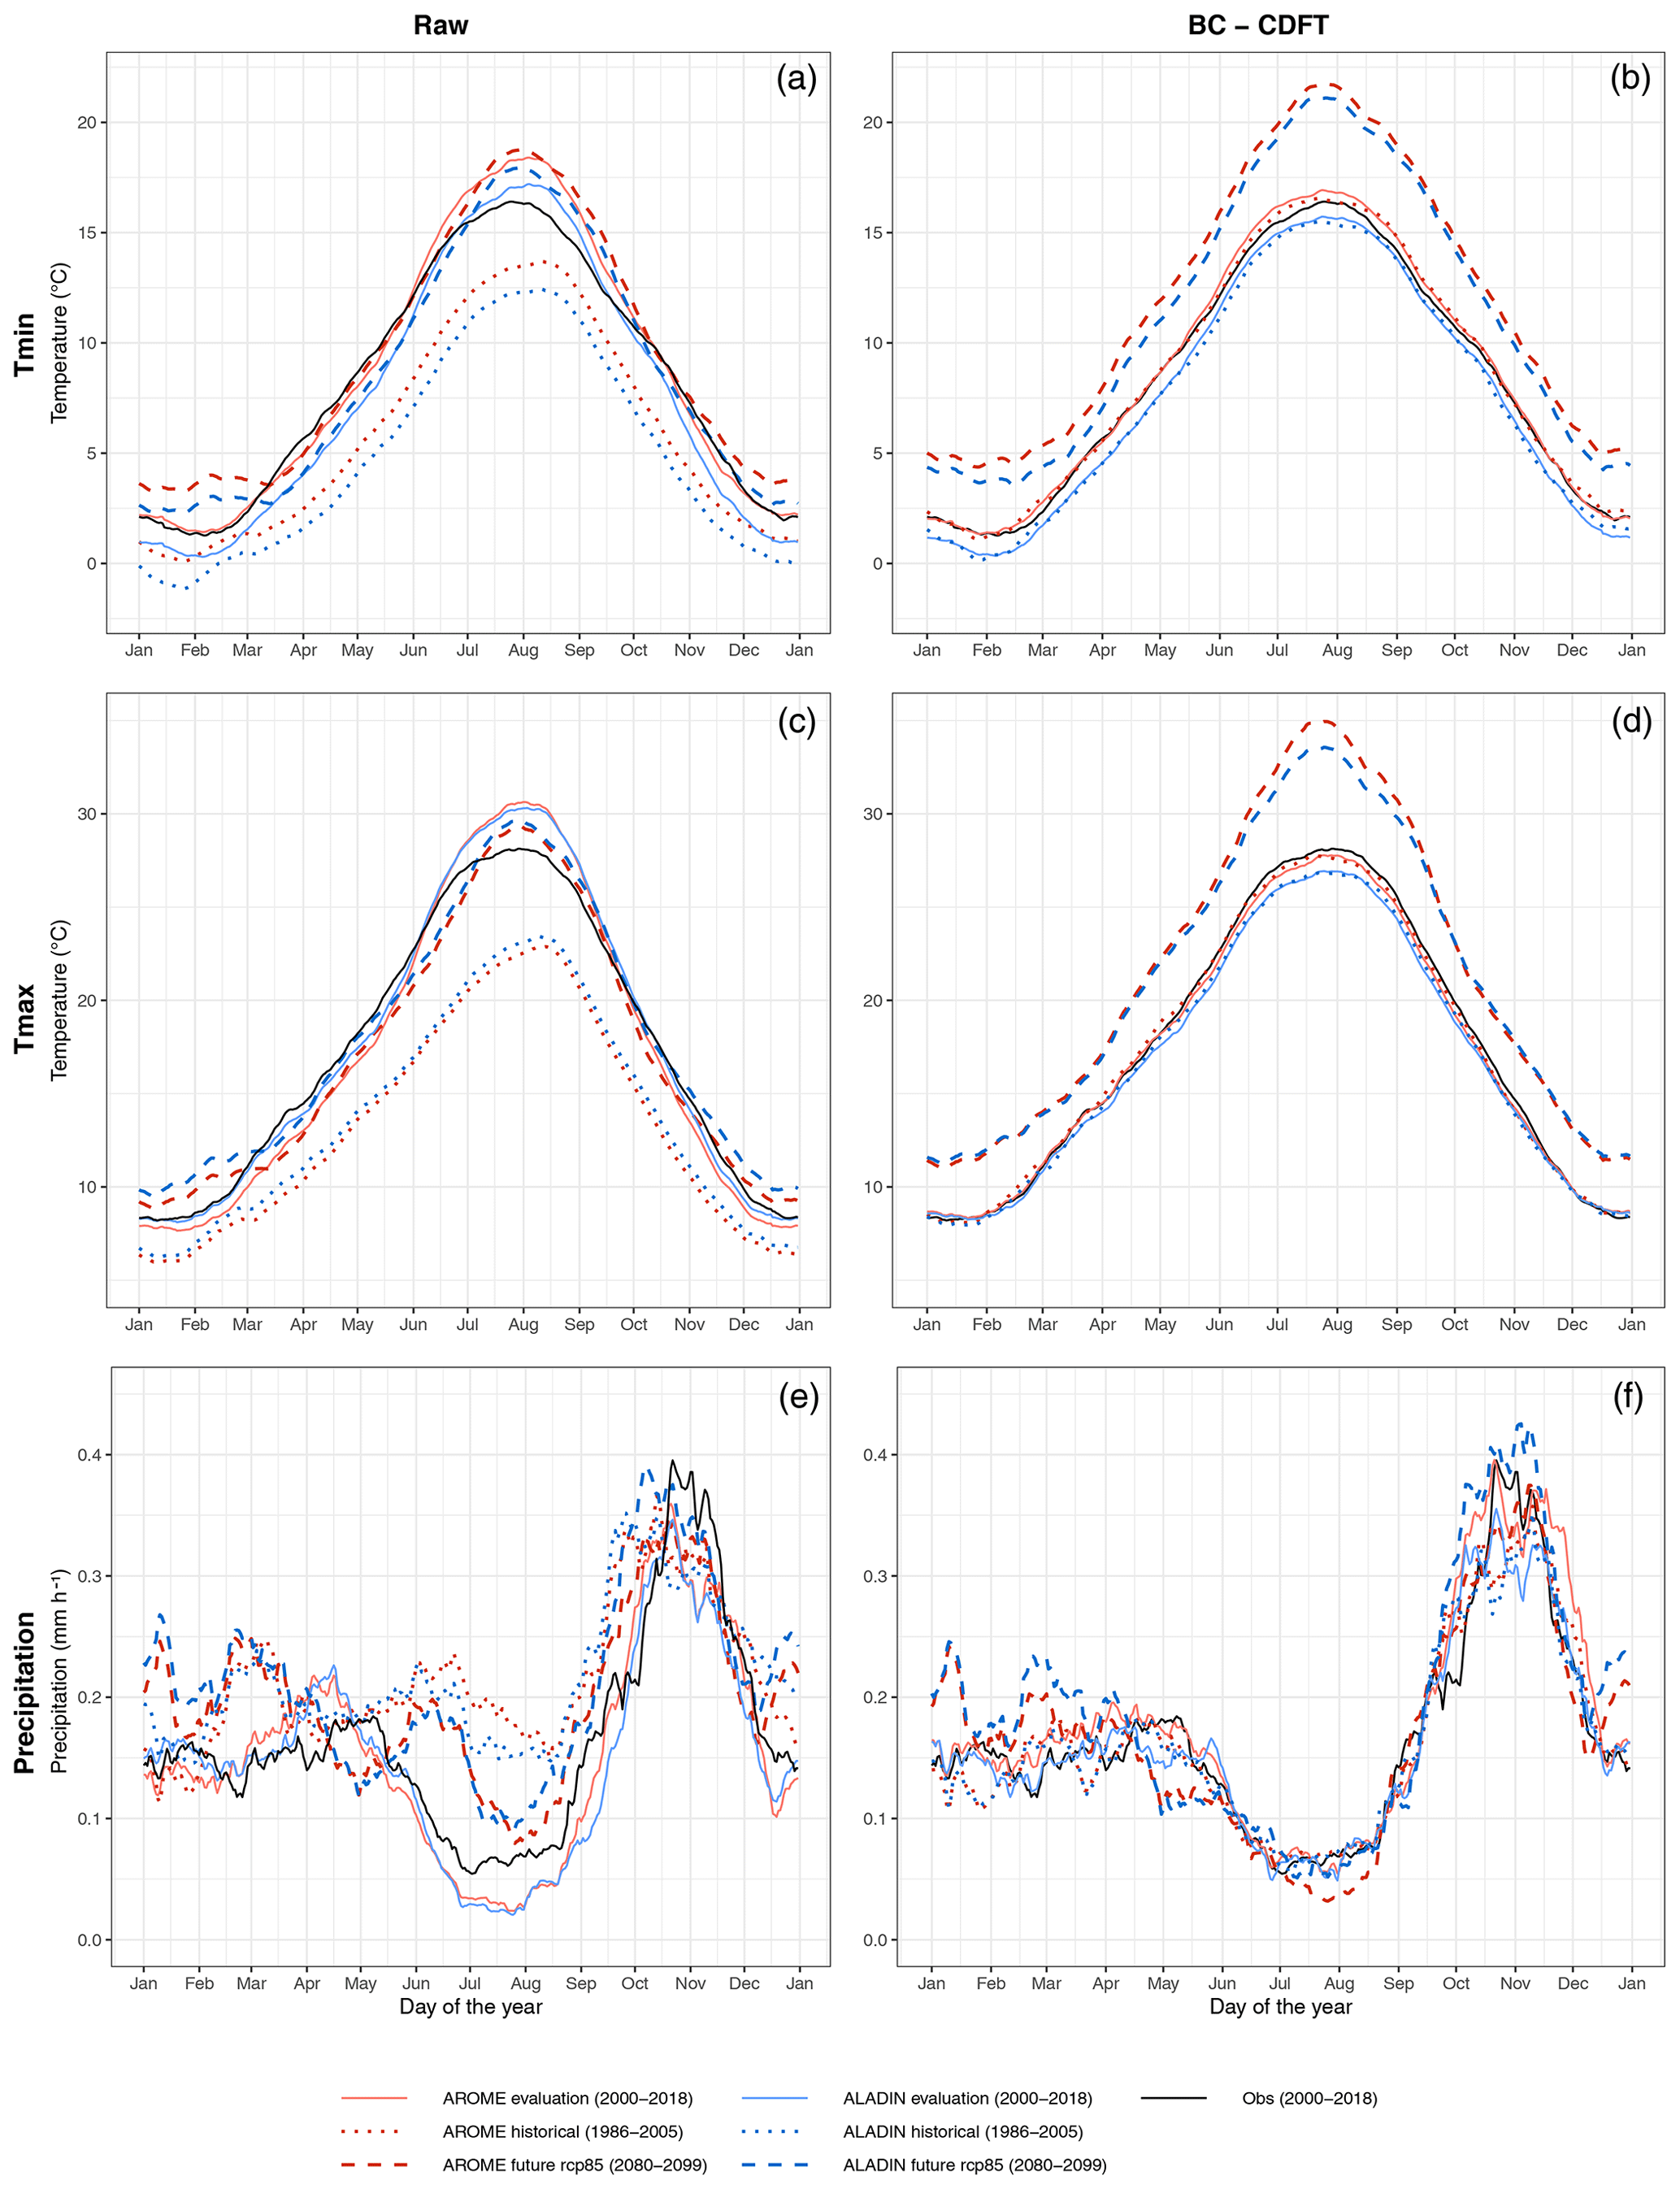
Figure 2Annual cycle of daily-aggregated minimum and maximum 2 m temperature (Tmin and Tmax) and hourly precipitation for raw (a, c, e) and bias-corrected (b, d, f) climate datasets. A 30 d rolling mean has been applied in order to smooth the high-frequency natural variability.
Annual cycles of precipitation are well reproduced for ALADIN and AROME for the evaluation period. Both models are a bit too wet in spring and too dry in summer, but the wet season (October to December) on simulations is clearly distinguishable and identical to COMEPHORE dataset (observations). The wet bias in spring can deeply affect soil moisture state in the hydrological models and therefore probably lead to a change in the behavior of the first floods occurring during the autumn months. The two climate models are able to reproduce the precipitation seasonality. There is no evidence of added value from the CPM on the simulation of the annual cycle of precipitation on this catchment. Results are similar for AROME and ALADIN for historical projections: spring and summer seasons are too wet. This causes a weaker annual cycle of precipitation. The wet fall season, however, is correctly reproduced, but with too early a start and plateau. The CDF-t bias correction method is able to correct the annual cycle of precipitation. The dry season is therefore consistent with the reference. In terms of intensity, ALADIN corrected shows an increase in intensity of the wet season peak (>0.4 mm h−1). We do not find this signal with AROME after correction. There is a dry signal for AROME corrected for the summer months. Results show no signal of wet season lengthening between the historical period and the future RCP8.5 scenario.
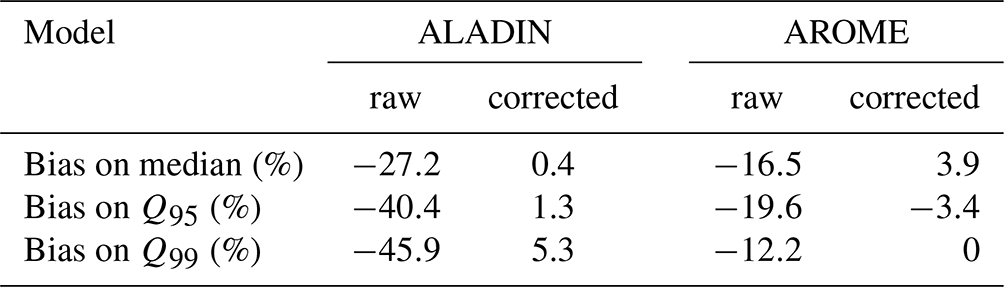
In terms of precipitation distribution, for the evaluation (retrospective) simulations, AROME performs better than ALADIN, especially for the precipitation extremes (Fig. 3, Table 3). The most extreme events (> quantile 99.9) remain underestimated for AROME. Fumière et al. (2020), Caillaud et al. (2021) and Lucas-Picher et al. (2023) have already shown the added value of the AROME CPM compared to its driving RCM, ALADIN, for modeling extreme hourly precipitation. This result confirms these past studies at the scale of a small catchment in the Cévennes region where AROME shows a clear added value (Caillaud et al., 2021).
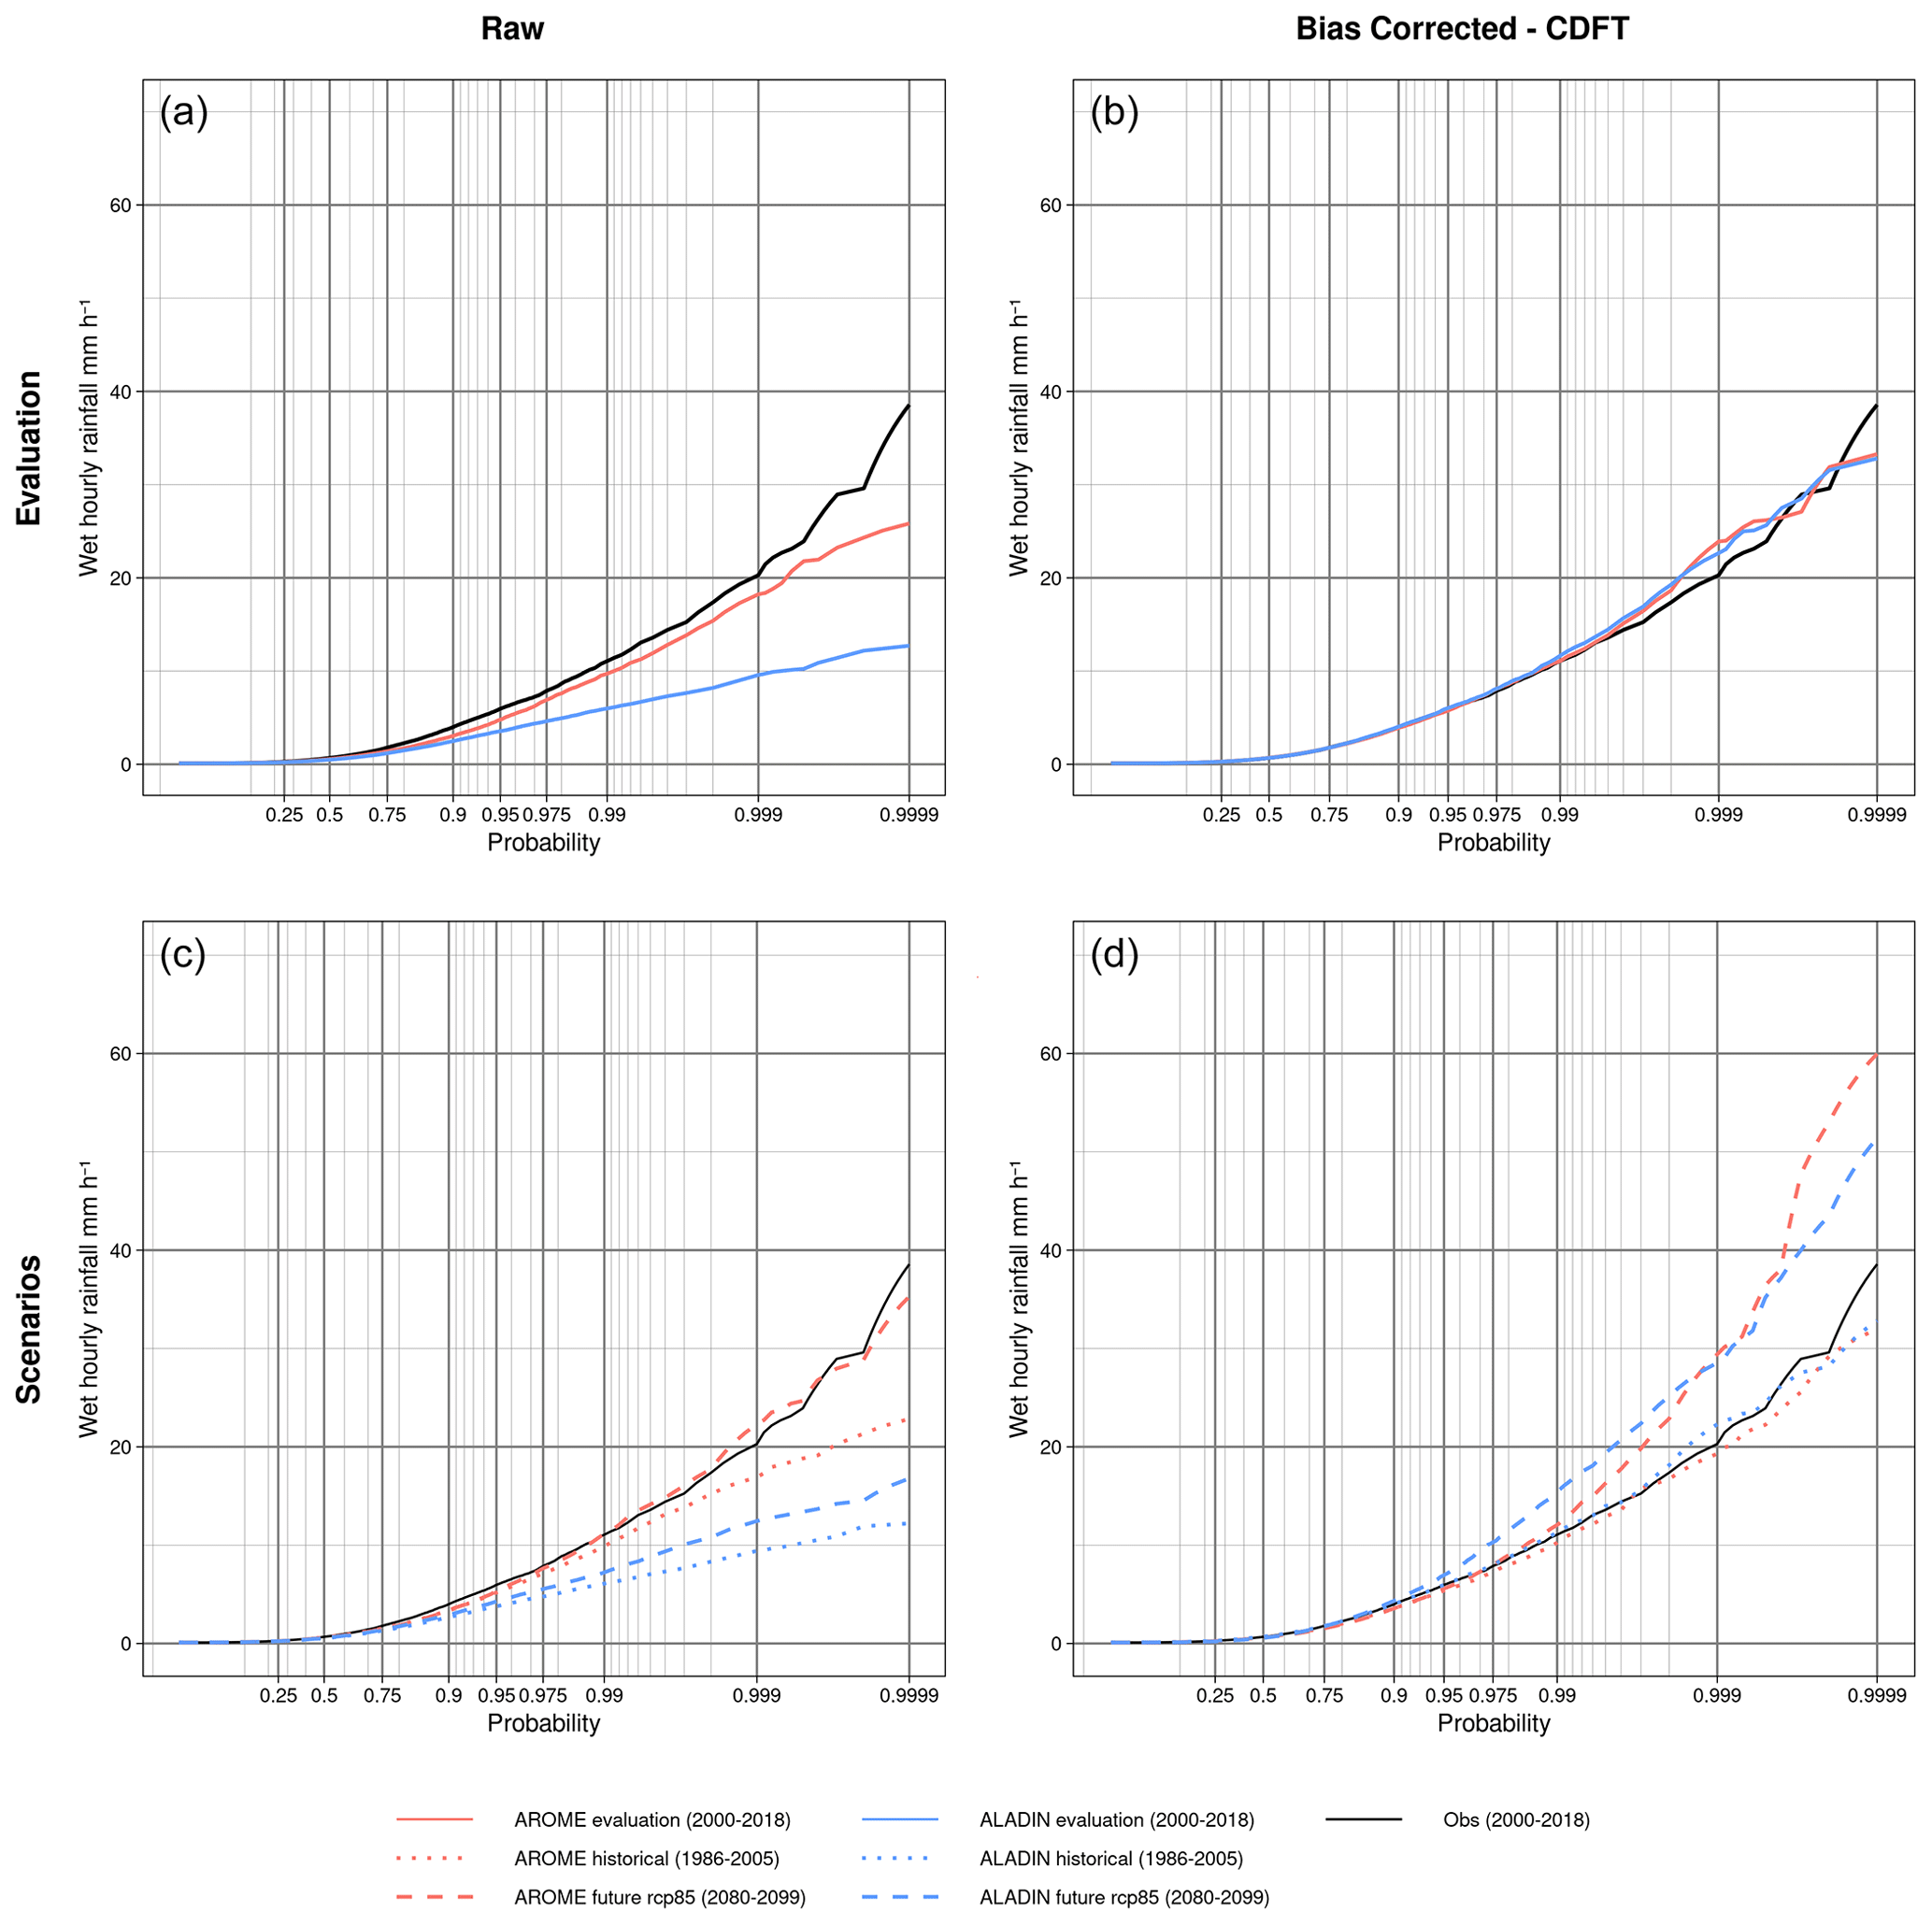
Figure 3Distribution of wet hourly rainfall (>0.1 mm h−1) for raw (a, c) and bias-corrected (b, d) precipitation datasets. Panels (a) and (b) show the retrospective simulations (2000–2018). Panels (c) and (d) depict the historical (1986–2005) and future (2080–2099) simulations under the RCP8.5 scenario. COMEPHORE observed hourly rainfall is appended to all panels (2000–2018). Probabilities under the abscissa axis are shown under a Gumbel transformation.
Table 3Evaluation of raw and corrected simulated precipitation with respect to the COMEPHORE observed dataset.
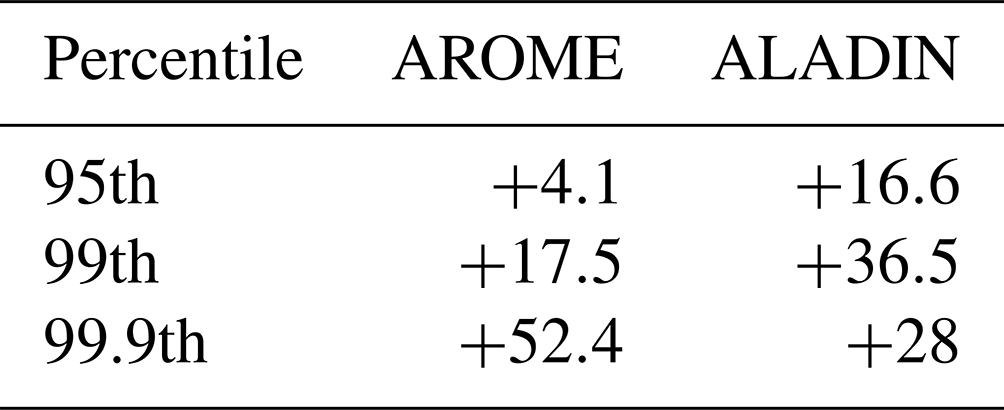
The future ALADIN projected rainfall is lower than that of AROME, for the whole distribution. Extreme projected precipitation for ALADIN is lower than for the historical AROME data, partially due to the persistent bias. However, the projected hourly precipitation shows an increase in extreme hourly rainfall (> 95th percentile) under a warmer climate (RCP8.5 projection) for both models. This signal is stronger for the most extreme hourly rainfall (> 99.9th percentile) and for the AROME simulation. This local-scale result is in agreement with the broader multi-model ensemble study of Pichelli et al. (2021), which compared an ensemble of CPMs and their driving RCMs over 10-year periods (historical and future). They found a consistent signal of hourly rainfall extremes over southern France between CPMs and RCMs for the wet season (fall). For the dry season, a slight decrease in the 99.9th percentile of hourly precipitation of CPMs is shown, consistent with the annual cycle projection of Fig. 2. The large increase in the hourly extreme simulated precipitation is maintained after the bias correction. The signal of the projected precipitation, after bias correction, is largely positive for all probabilities exceeding 95th percentiles for both models. While ALADIN shows a stronger increase for the 95th and 99th percentiles than those of AROME, AROME produces the most positive trend for the most extreme hourly corrected rainfall (see Table 4). Indeed, the most extreme projected hourly rainfall is therefore expected to reach hourly rainfalls that have never been observed at the catchment scale (>40 mm h−1).
Table 4Changes in extreme hourly corrected precipitation (%) under the RCP8.5 scenario relative to historical simulation for AROME and ALADIN.
4.2 Hydrological models evaluation
Table 5 presents a summary of the performance metrics of the hydrological models (GR5H and CREST) calculated over the evaluation period. GR5H reproduces well the observed discharge with KGE and NSE scores higher than 0.75. High flows and mean flows are correctly simulated even if they are slightly underestimated. The CREST performance is lower for all the metrics. It shows an acceptable global efficiency and an overestimation of both mean flows and high flows. Both hydrological models underestimate flood peaks.
Table 5Evaluation of hydrological model simulations against observed discharge (2002–2018). Results for general efficiency scores (NSE: Nash–Sutcliffe efficiency; KGE: Kling–Gupta efficiency) and relative biases on mean flows, high flows (quantile 99.9) and flood peaks (observed flood peak over threshold).
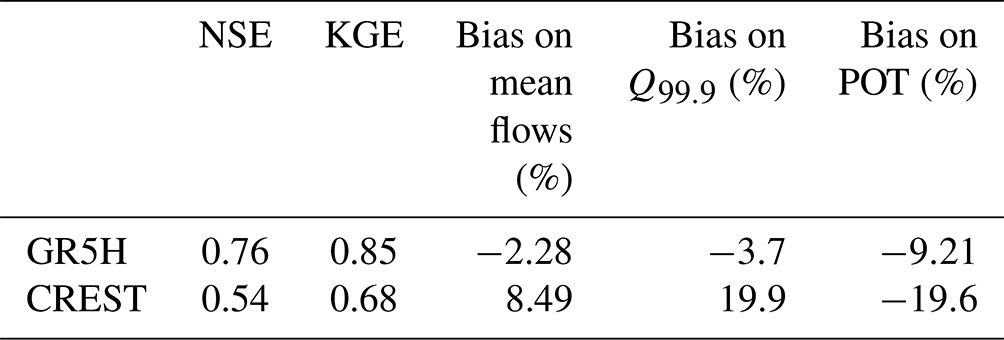
Figure 4 shows the annual cycle of discharge at the outlet of the Gardon d'Anduze catchment. Both models are able to reproduce the annual cycle, in particular the high-flow season caused by HPEs and flood events. As seen on Table 5, CREST tends to produce a more excessive discharge response to rainfall than GR5H. GR5H tends to overestimate low flows for summer months, which is, however, not the focus of the present work. One should keep in mind that the two hydrological models have been calibrated using a different strategy; all parameters of GR5H have been calibrated while most of CREST parameters used a priori estimates, since it is a common strategy for fully distributed physically based models (Clark et al., 2017).
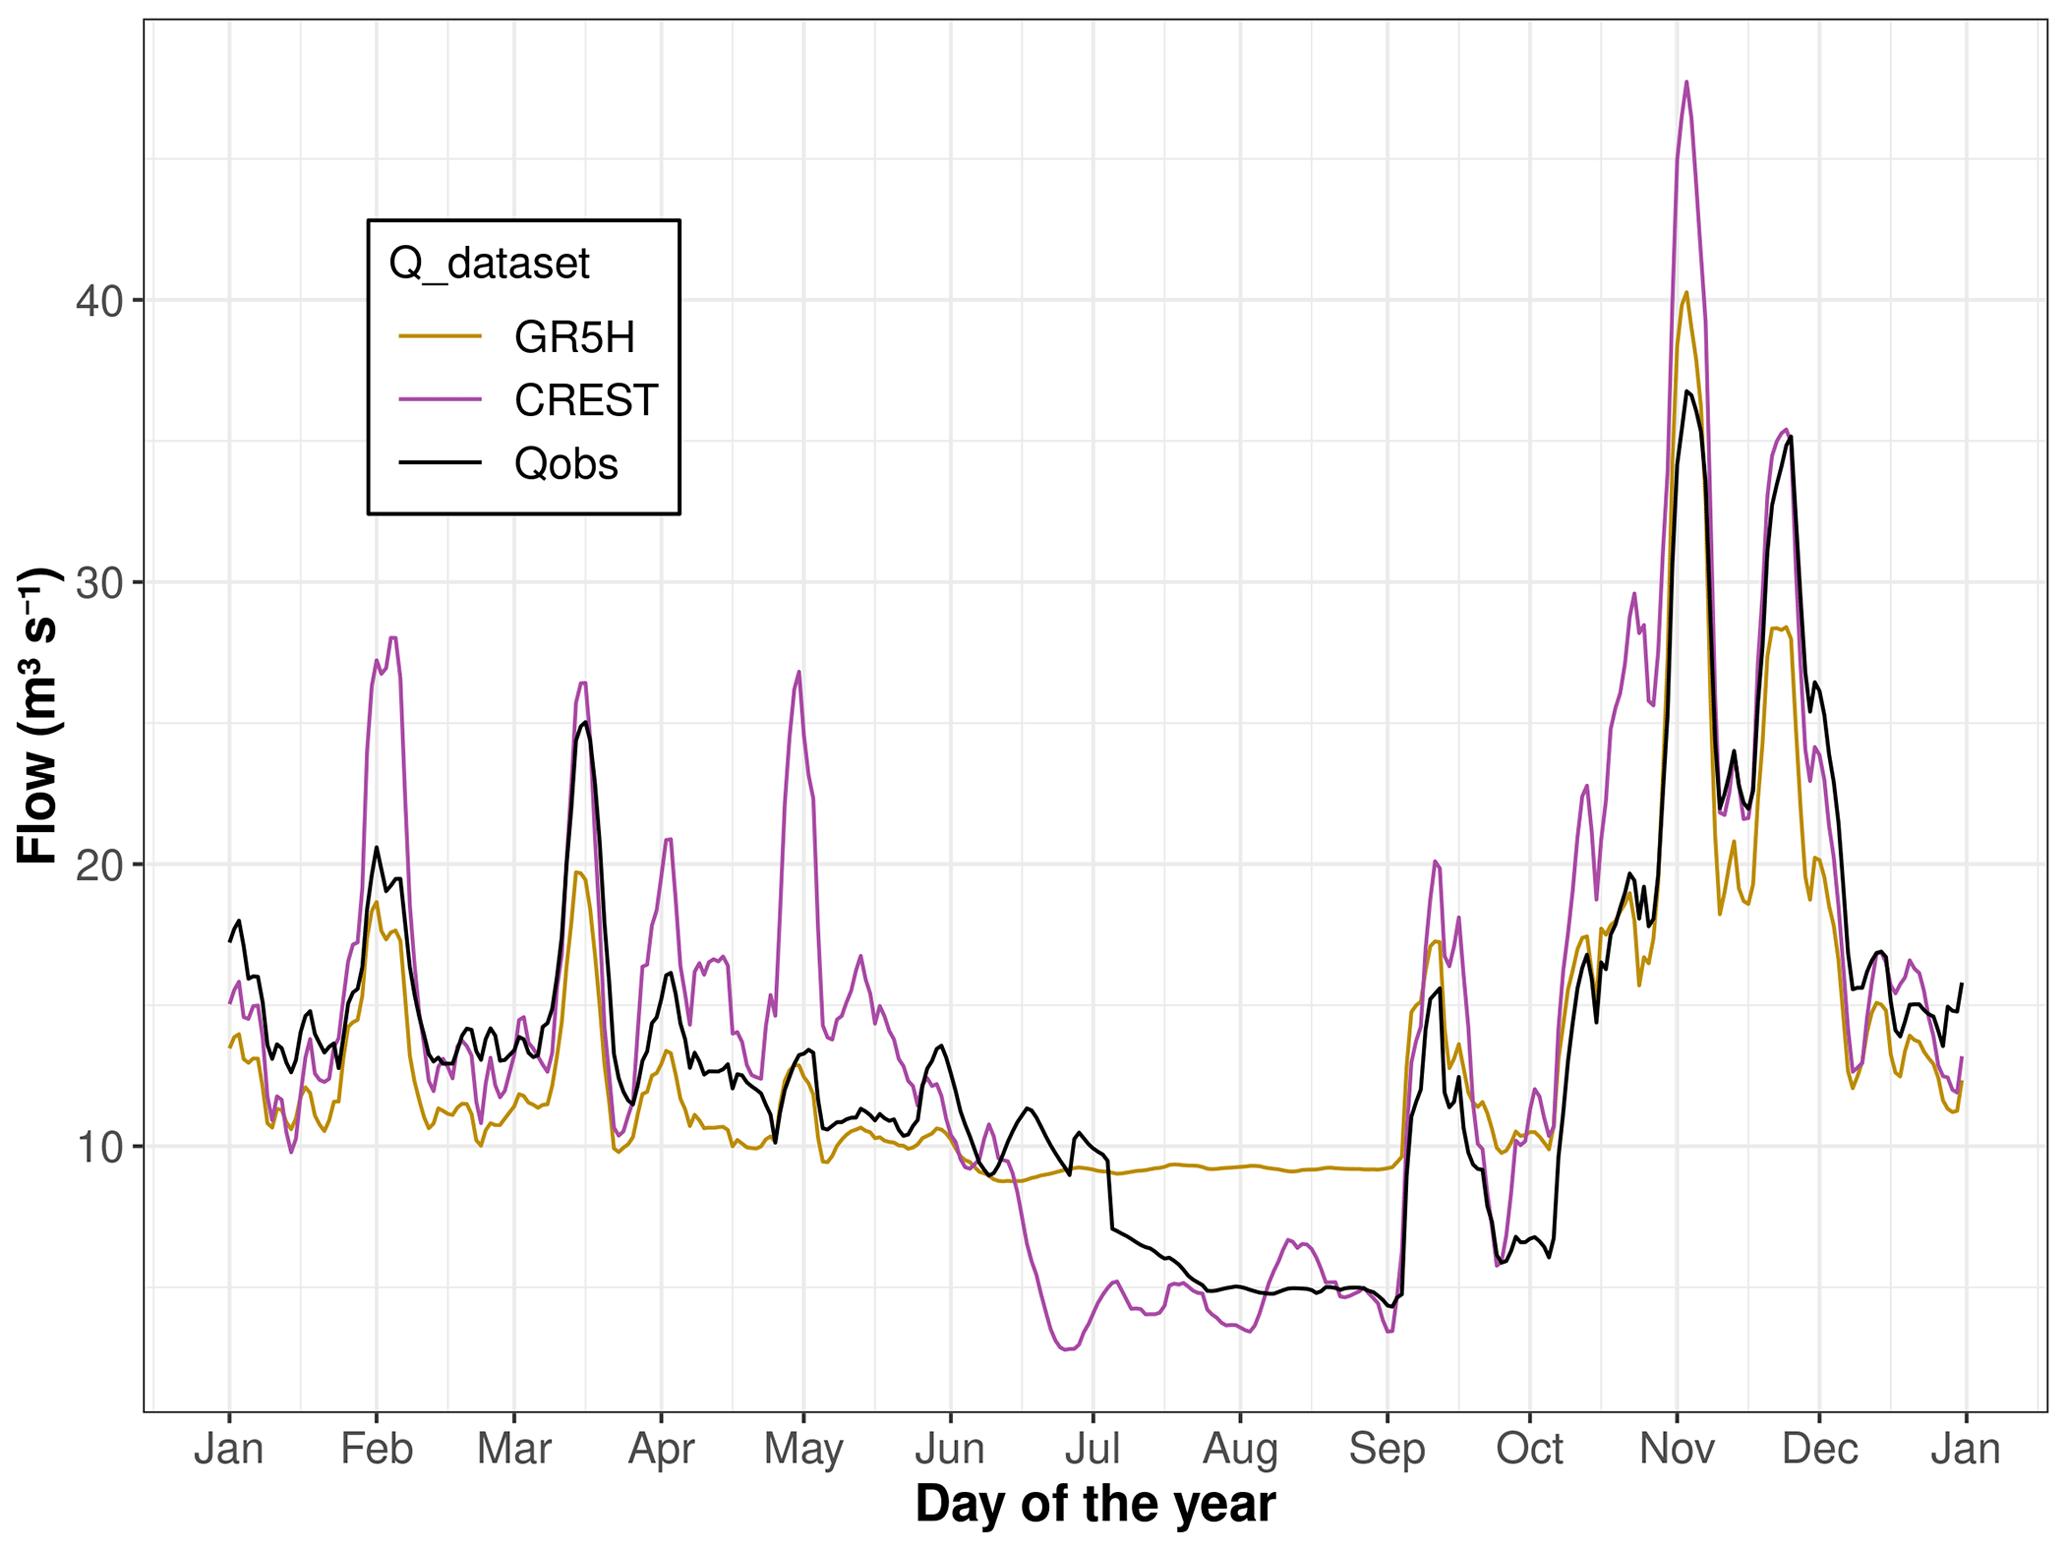
Figure 4Annual cycle of discharge for observation, GR5H and CREST evaluation simulations over the 2002–2018 period. Multiyear regime of 8 d averaged flows at Anduze (Gardon d'Anduze catchment).
These results must be moderated looking at Fig. 5, which shows the cumulative distribution of the observed discharge along with the GR5H and CREST simulated discharge for the evaluation period. The study indeed focuses on the most intense flood events in this catchment, i.e., flood peak above 265 m3 s−1, leading to two floods per year on average. Biases in CREST simulations (Table 5, Fig. 4) are not necessarily reflected in the flood distribution since both models manage to reproduce the observed flood distribution on this small catchment. We can see a slight underestimation of the most intense flood by both hydrological models. The most severe flood corresponds to the major flood event of September 2002, one of the most damaging flash floods recorded in France (Delrieu et al., 2005; Vinet, 2008). Even if the return period of this observed flood exceeds 50 years, this outlier value of the distribution of observed POT has to be carefully interpreted. The peak discharge value of a flood of this magnitude is likely inaccurate because of large uncertainties related to the measurement of the water level, the extrapolation from the rating curve, and possible modifications of river bed topography and flow dynamics (Neppel et al., 2010). However, in terms of flood frequency, the number of POTs differs between the two models. While CREST simulates on average 3.1 floods per year, GR5H is closer to observation with on average 1.5 floods per year.
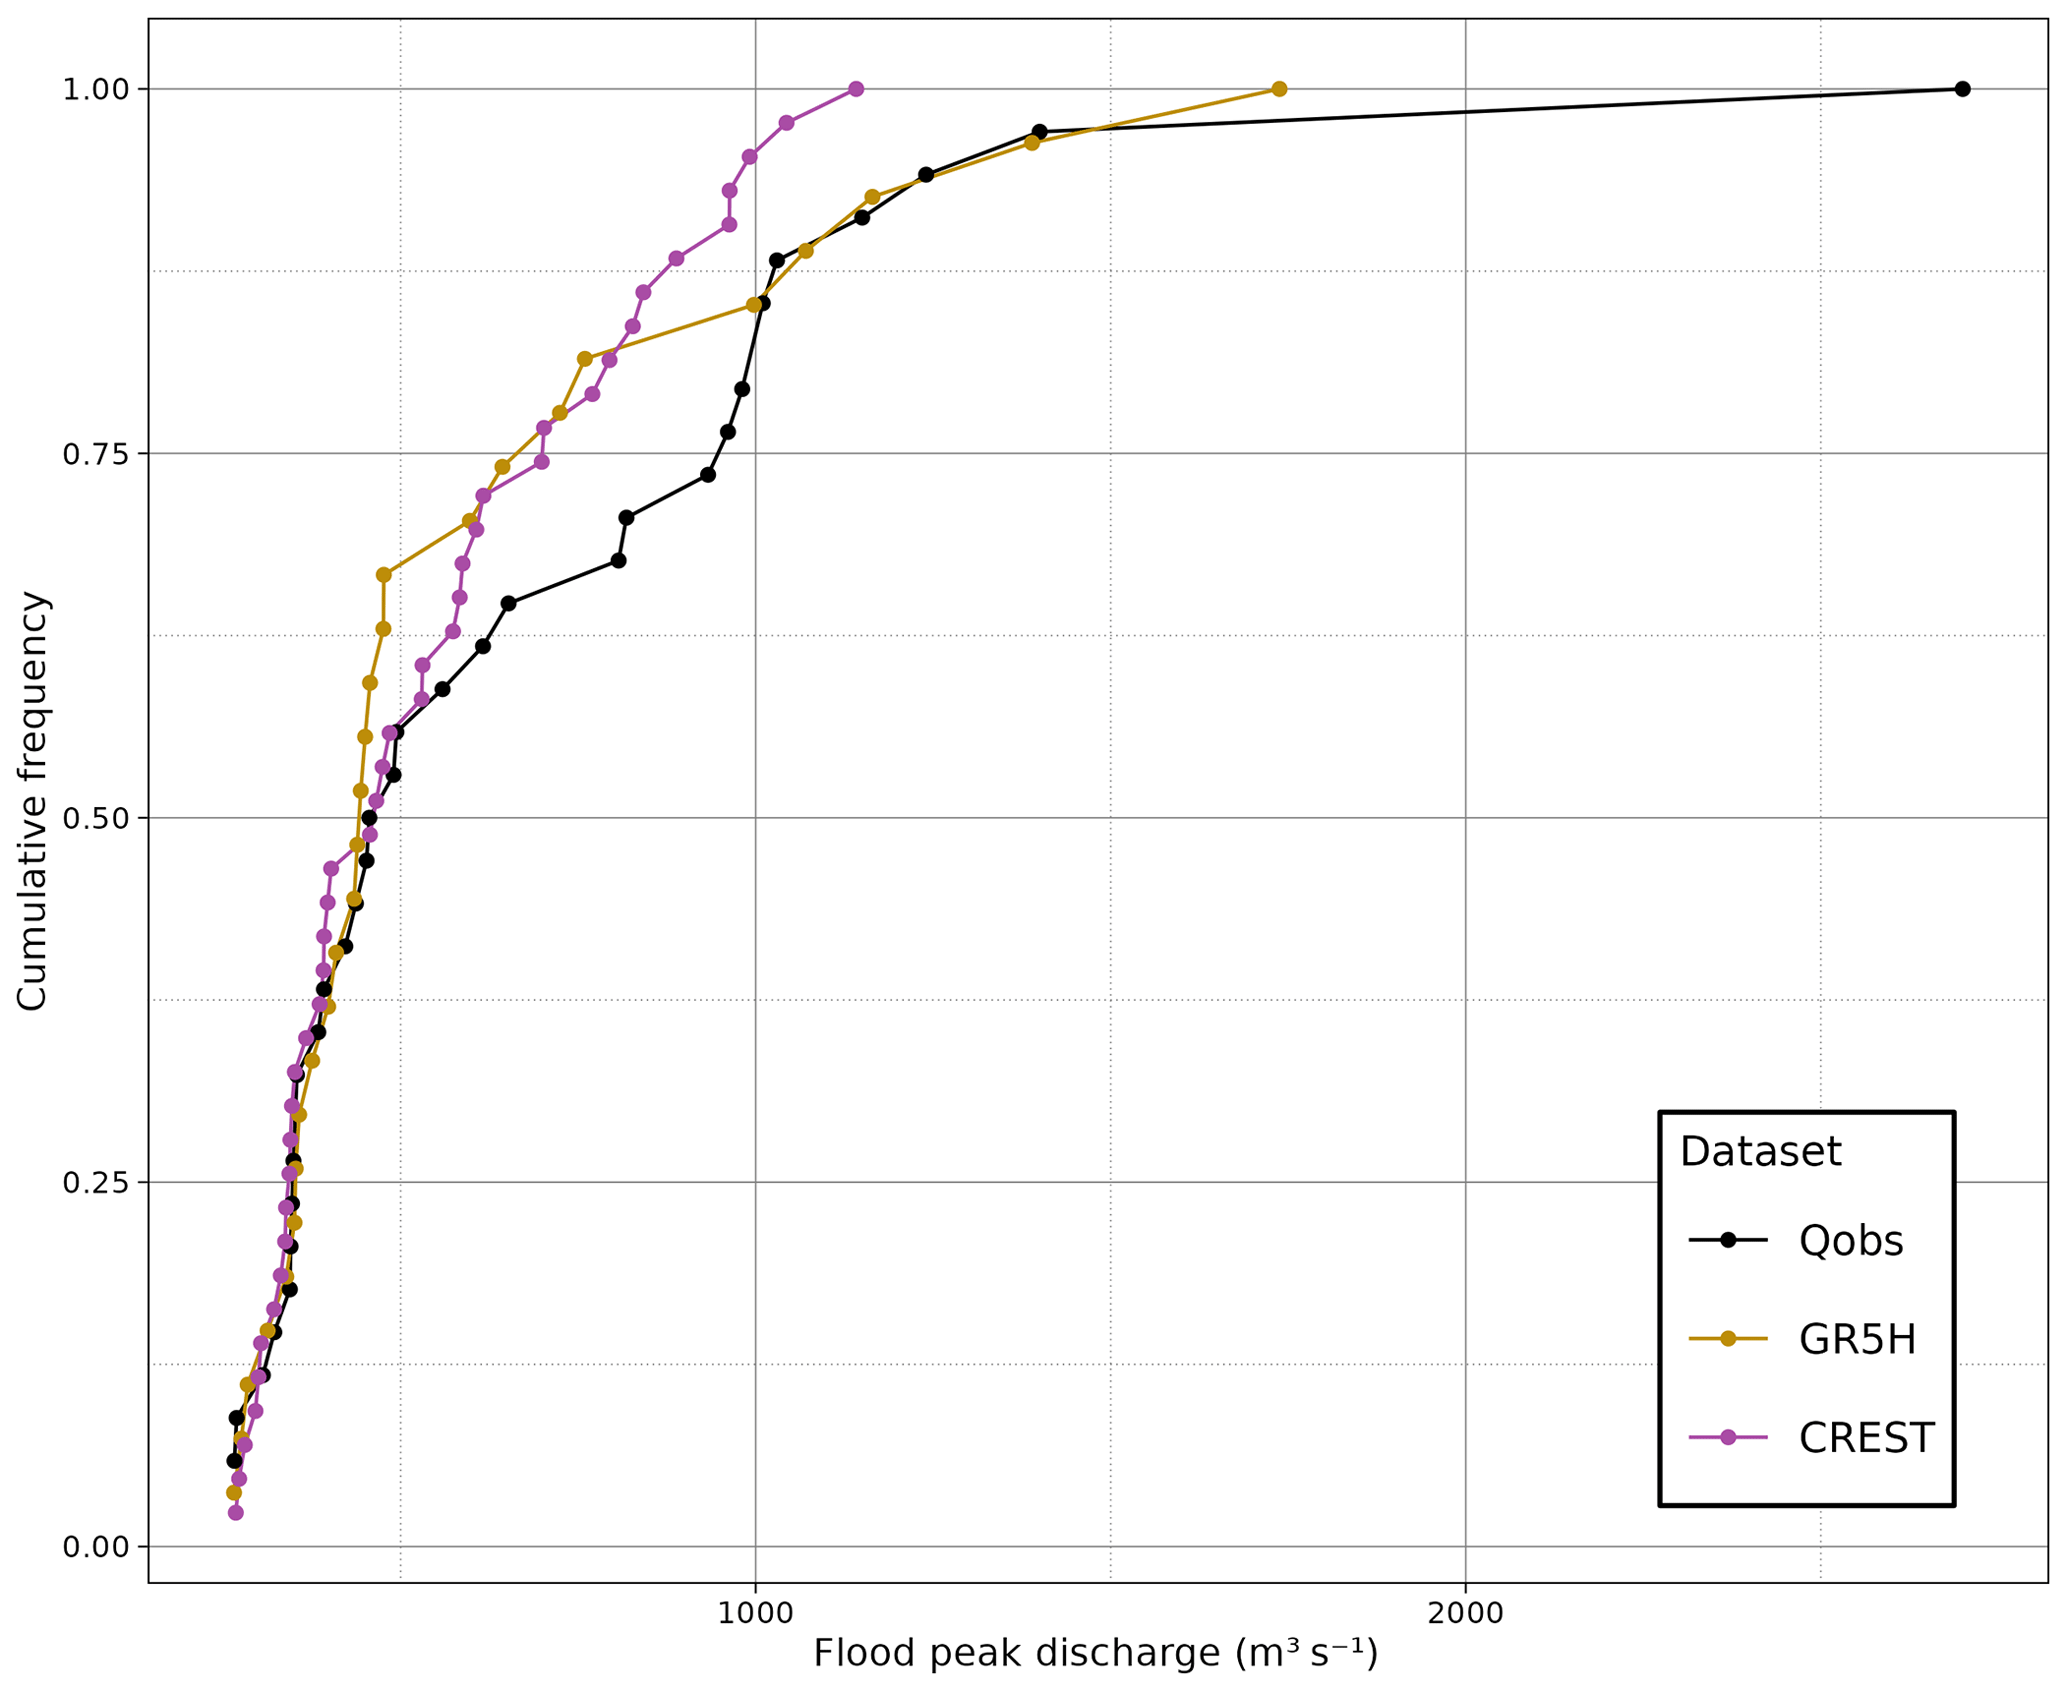
Figure 5Cumulative distribution functions (CDFs) of observed and simulated flood peaks over the evaluation period (2002–2018). Both models have been calibrated and run with observed precipitation (COMEPHORE) and PET derived from the observed temperature. The threshold is a fixed discharge value giving two floods per year from the observed discharge (265 m3 s−1).
4.3 Reproducing floods with the climate datasets
The flood distributions of the AROME- and ALADIN-driven simulations with GR5H and CREST are presented in Fig. 6. The green line on the Fig. 6 represents the hydrological simulations forced by the COMEPHORE observed dataset that has been used for the calibration and could be considered as the reference simulation. The AROME and ALADIN datasets are retrospective simulations (evaluation) with (CDF-t) and without bias correction. We used the same threshold as in Fig. 5, with the discharge value (265 m3 s−1) leading to two observed floods per year after the declustering. Above all, only uncorrected retrospective climate simulations can be used in the scope of assessing the performance of climate models for reproducing floods. Firstly, Fig. 6 shows a large underestimation of POT distributions by CREST and GR5H. The hydrological models forced with the AROME CPM reproduce flood intensity better than when forced with ALADIN. This can be observed by the shape of the distributions, which is almost flat for ALADIN. Then, the ALADIN-driven flood distributions fail to reproduce the observed flood frequency with 0.4 and 0.9 floods per year for GR5H and CREST, respectively, compared to AROME, which simulates an acceptable number of floods (1.2 for GR5H and 2.3 for CREST). Consequently, AROME seems more reliable than ALADIN in simulating floods with both hydrological models. The results shown in Fig. 6 confirm CREST over-reactivity with a higher number of POTs simulated than for GR5H. This model behavior does not impact the flood intensity. Conversely, discharges in the upper half of the flood peak distribution (cumulative frequency > 0.5) are slightly lower for CREST than for GR5H.
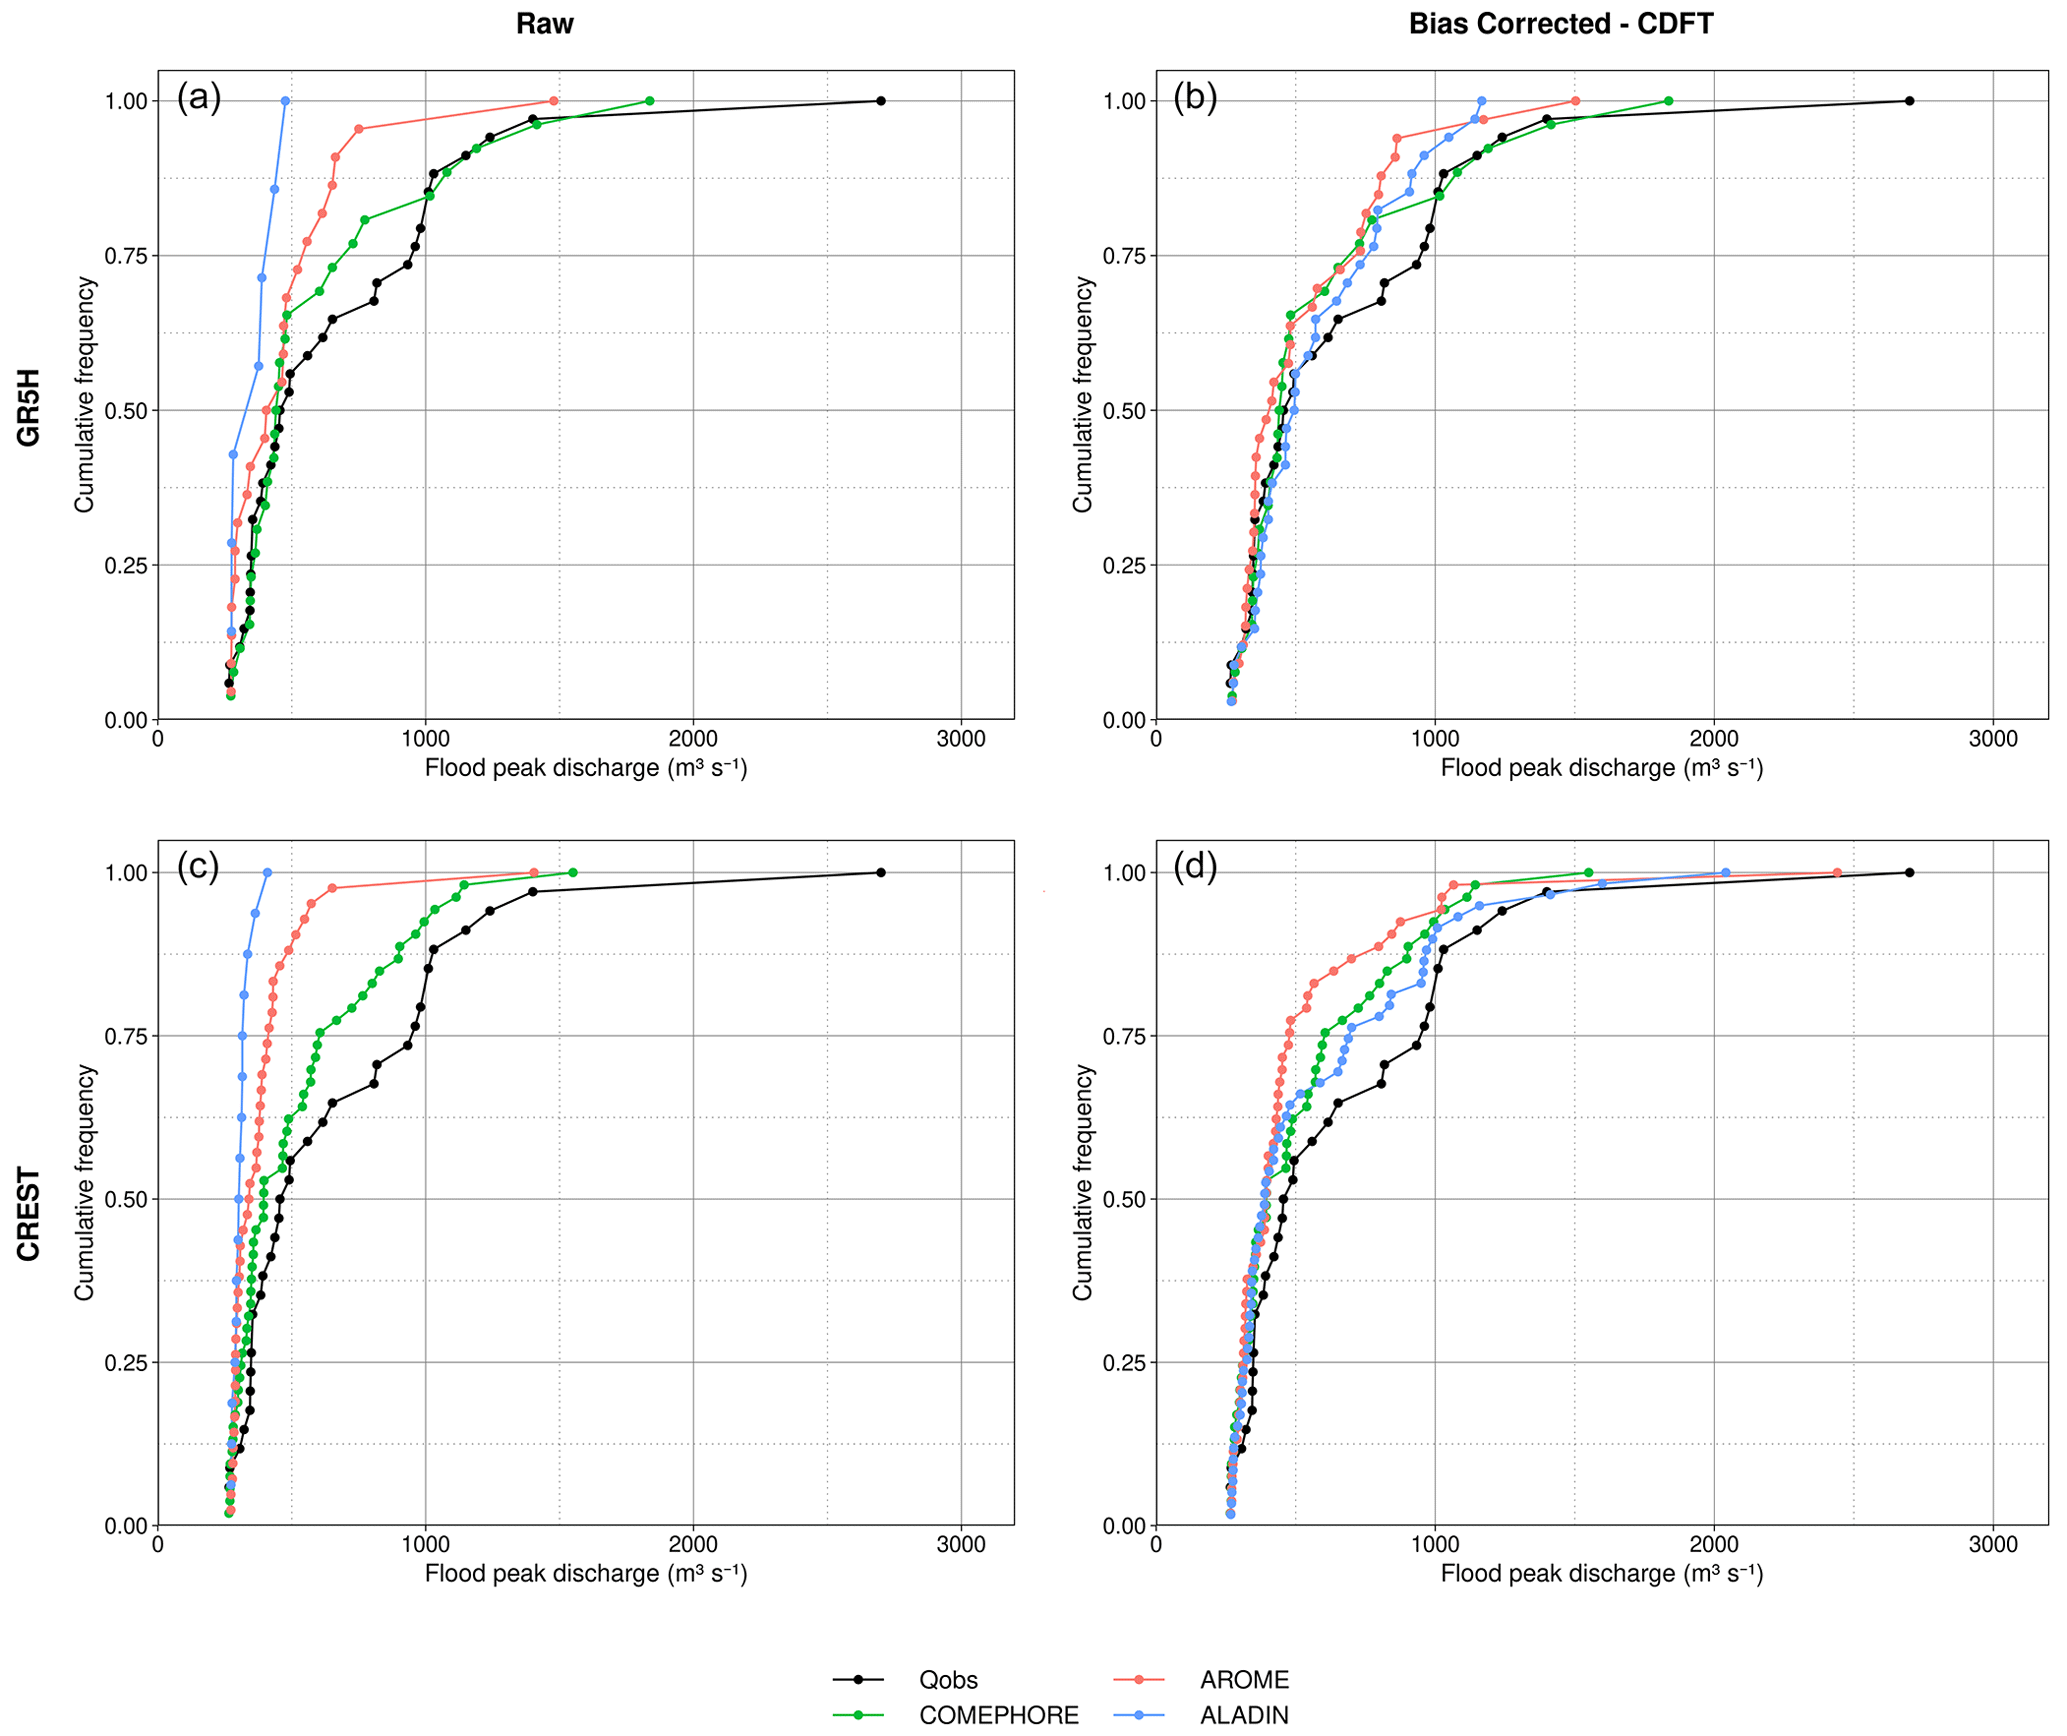
Figure 6POT CDF for GR5H (a, b) and CREST (c, d) forced by the observed and retrospective climate simulations (2001–2018). POT from raw climate datasets is on panels (a) and (c), and bias-corrected climate datasets are on panels (b) and (d). The threshold is the same as in Fig. 5.
After the CDF-t bias correction, all POT distributions are closer to the hydrological simulation forced by the observed data (green curve). All simulated datasets are compared here with the simulated discharge driven by the observed precipitation (green curve). The ALADIN-driven hydrological simulation shows a slightly better POT distribution than the AROME-driven one for both models, even if the most intense flood event (September 2002) is better simulated with AROME. An improvement in flood frequency modeling is noticed after bias correction for all simulations. However, the CREST simulations still have a positive bias for flood frequency, with higher values than the COMEPHORE-driven simulation (2.9 and 3.3 floods per year for AROME and ALADIN, respectively). To summarize, the added value found for the CPM compared to the RCM in extreme precipitation in previous sections seems to be transmitted for flash flood simulation. Bias correction reduces the difference between climate models, with no remnant bias on POT distribution. The choice of the hydrological model therefore does not seem to impact the results between the forcing climate datasets.
4.4 Climate change (flood intensity and frequency)
This section aims to provide an overview of the flood signal suggested by future climate projections and whether this projected evolution is impacted by the different hydrological models and climate models used. We now analyze the flood distributions from the hydrological models forced with the AROME and ALADIN climate simulations under the historical and the future RCP8.5 scenario (Fig. 7). In the first place, the two hydrological models show flood peak discharge weaker for ALADIN than for AROME. CREST simulates higher floods for historical and future projections than GR5H. The shape of the distribution of POT simulated with CREST is less flat than for GR5H distribution, reflecting a behavior similar to a Pareto distribution, hence a tail of the distribution associated with more extreme, i.e., rare events. The number of floods is higher for the CREST-driven hydrological simulations than GR5H ones. These simulations can reach a flood frequency exceeding four floods per year on historical AROME- and ALADIN-driven discharge simulations.
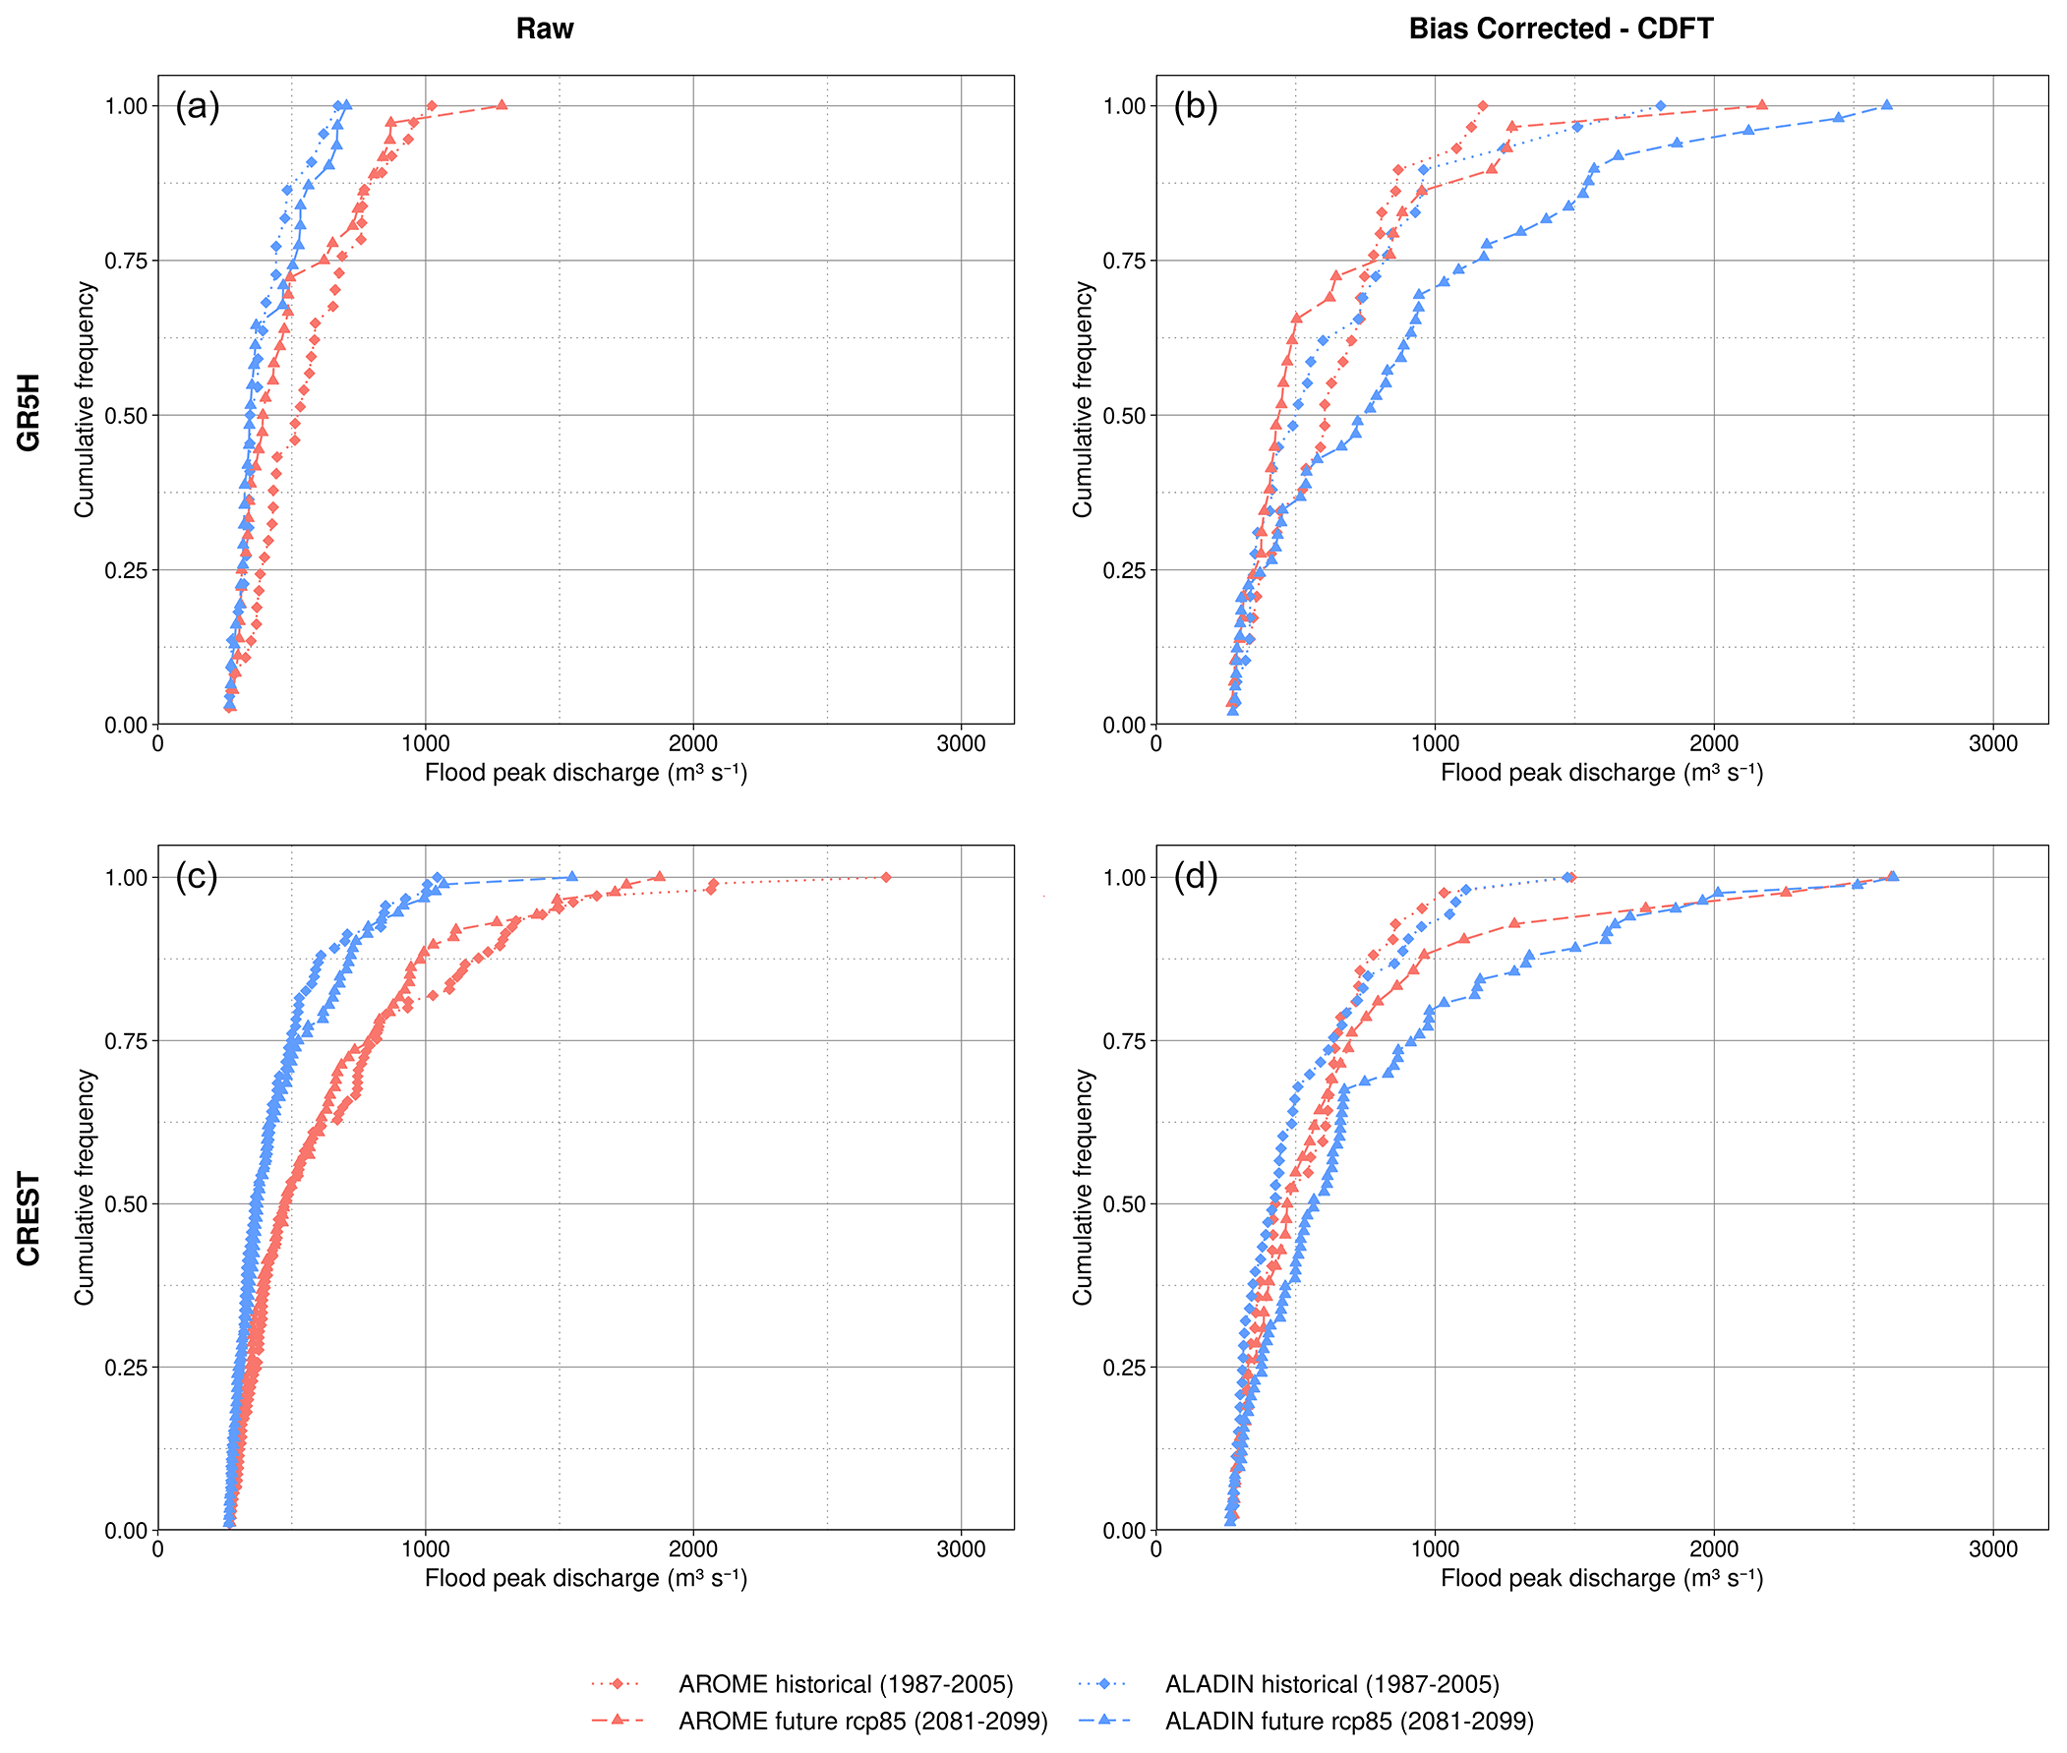
Figure 7POT distributions for GR5H (a, b) and CREST (c, d) forced by historical and future climate simulations. POTs from raw climate datasets are on panels (a) and (c), and those from bias-corrected climate datasets are on panels (b) and (d). The threshold is the same as for Fig. 5.
Flood distributions from the bias-corrected historical and future projections show a good consistency between hydrological models, but higher differences among the climate simulations. Figure 7 highlights a major difference between the AROME CPM and its driving RCM, ALADIN. While the ALADIN-driven simulations indicate for both hydrological models a generalized increase in magnitude of floods, the AROME-driven simulations show a different signal depending on the probability of occurrence. Moderate floods are projected to be weaker in a warmer future when using AROME, but there is a positive increase for the most extreme floods. The threshold related to this change in signal seems to be located between 0.7 and 0.75 for both hydrological models; i.e., 25 % to 30 % of the most extreme floods are projected to be stronger in a future climate. Negative changes for CREST are less pronounced than for GR5H, but on the contrary, positive changes above this threshold are stronger, especially for the most extreme projected flood events.
The different changes in moderate and large floods could be explained by a decrease in future soil moisture, which can compensate for the increase in heavy precipitation for small to moderate floods. This result is in agreement with the studies of Brunner et al. (2021) and Wasko et al. (2023). This is consistent as well with Tramblay et al. (2023) and Bertola et al. (2021), who showed the importance of antecedent soil moisture in modulating changes in floods. This threshold behavior is not present for the ALADIN-driven flood simulations. Indeed, the signal for the ALADIN flood projections is positive for almost all the flood distribution, except for the weakest floods where no clear signal is projected. Both bias-corrected ALADIN and AROME flood projection distributions show a strong increasing signal for the distribution tail. ALADIN-driven simulated floods in a future climate reach higher peak values than AROME when simulated by the GR5H model. For CREST, the distribution tail of future floods for AROME and ALADIN are of the same order of magnitude.
The different behavior between the AROME- and ALADIN-driven flood simulations questions the reliability of low-resolution RCMs for hydrological impact studies related to extreme events. The poor representation of topography along with the parameterization of deep convection for RCMs leads to strong biases on HPE's intensity and temporal distribution. Indeed, extreme rainfall events for ALADIN are generally composed of long-lasting moderate hourly rainfall rather than a more realistic convective precipitation peak. The bias correction method works on each individual hourly time step, but it does not influence the temporal distribution of rainfall events (i.e., hyetograph shape), leading to an over-correction of the HPEs and probably to excessive hydrological reactions (not shown here). This strong bias correction probably prevents ALADIN from adequately simulating future changes on local processes that are highlighted by the AROME CPM. After bias correction, projected changes in flood frequency also depend on the forcing climate simulation. While AROME shows no change in flood frequency, ALADIN simulates a large increase in the number of floods in future climatic conditions. This trend remains consistent among the two hydrological models, with only little differences between CREST and GR5H simulations (Fig. 7).
4.5 Climate change impact on flood characteristics
We analyzed the flood and associated rainfall event characteristics (Fig. 8) simulated by historical and future bias-corrected climate simulations. Every box plot is made of all values of a specific metric relative to all extracted flood events or the associated rainfall events for one dataset. Firstly, most simulated datasets show a negative future signal for the baseflow component of future floods. Only the GR5H model driven by ALADIN shows a little increase in the median, but this signal is not clear because the distribution becomes wider for future baseflows. The same future positive signal can be found on the ratio metric: all datasets yield a negative trend, reflecting an increase in the runoff part of the streamflow during floods. There is no clear signal about the changes in the length of precipitation events (np) and the total precipitation (Ptot) events associated with floods. However, the maximum hourly precipitation of the largest rainfall event preceding the floods is projected to strongly increase. This result is coherent with Sect. 4.1 and confirms that hourly precipitation extremes can yield severe floods in this basin. The most intense increases seem to concern ALADIN-driven simulations with shifts in distribution exceeding 25 % (the median in historical simulations corresponds to the first quartile in the future). These results strengthen the confidence of the hypothesis of the decrease in soil moisture, leading to the threshold effect in AROME-forced simulations. In this study we do not explicitly simulate soil moisture, but the evolution of the baseflow can be considered as a proxy for the changes in soil moisture (Massari et al., 2023). The negative trend in the baseflow compensates for the increase in precipitation extremes until a threshold is reached, when the most intense hourly rainfall exceeds the infiltration capacity.
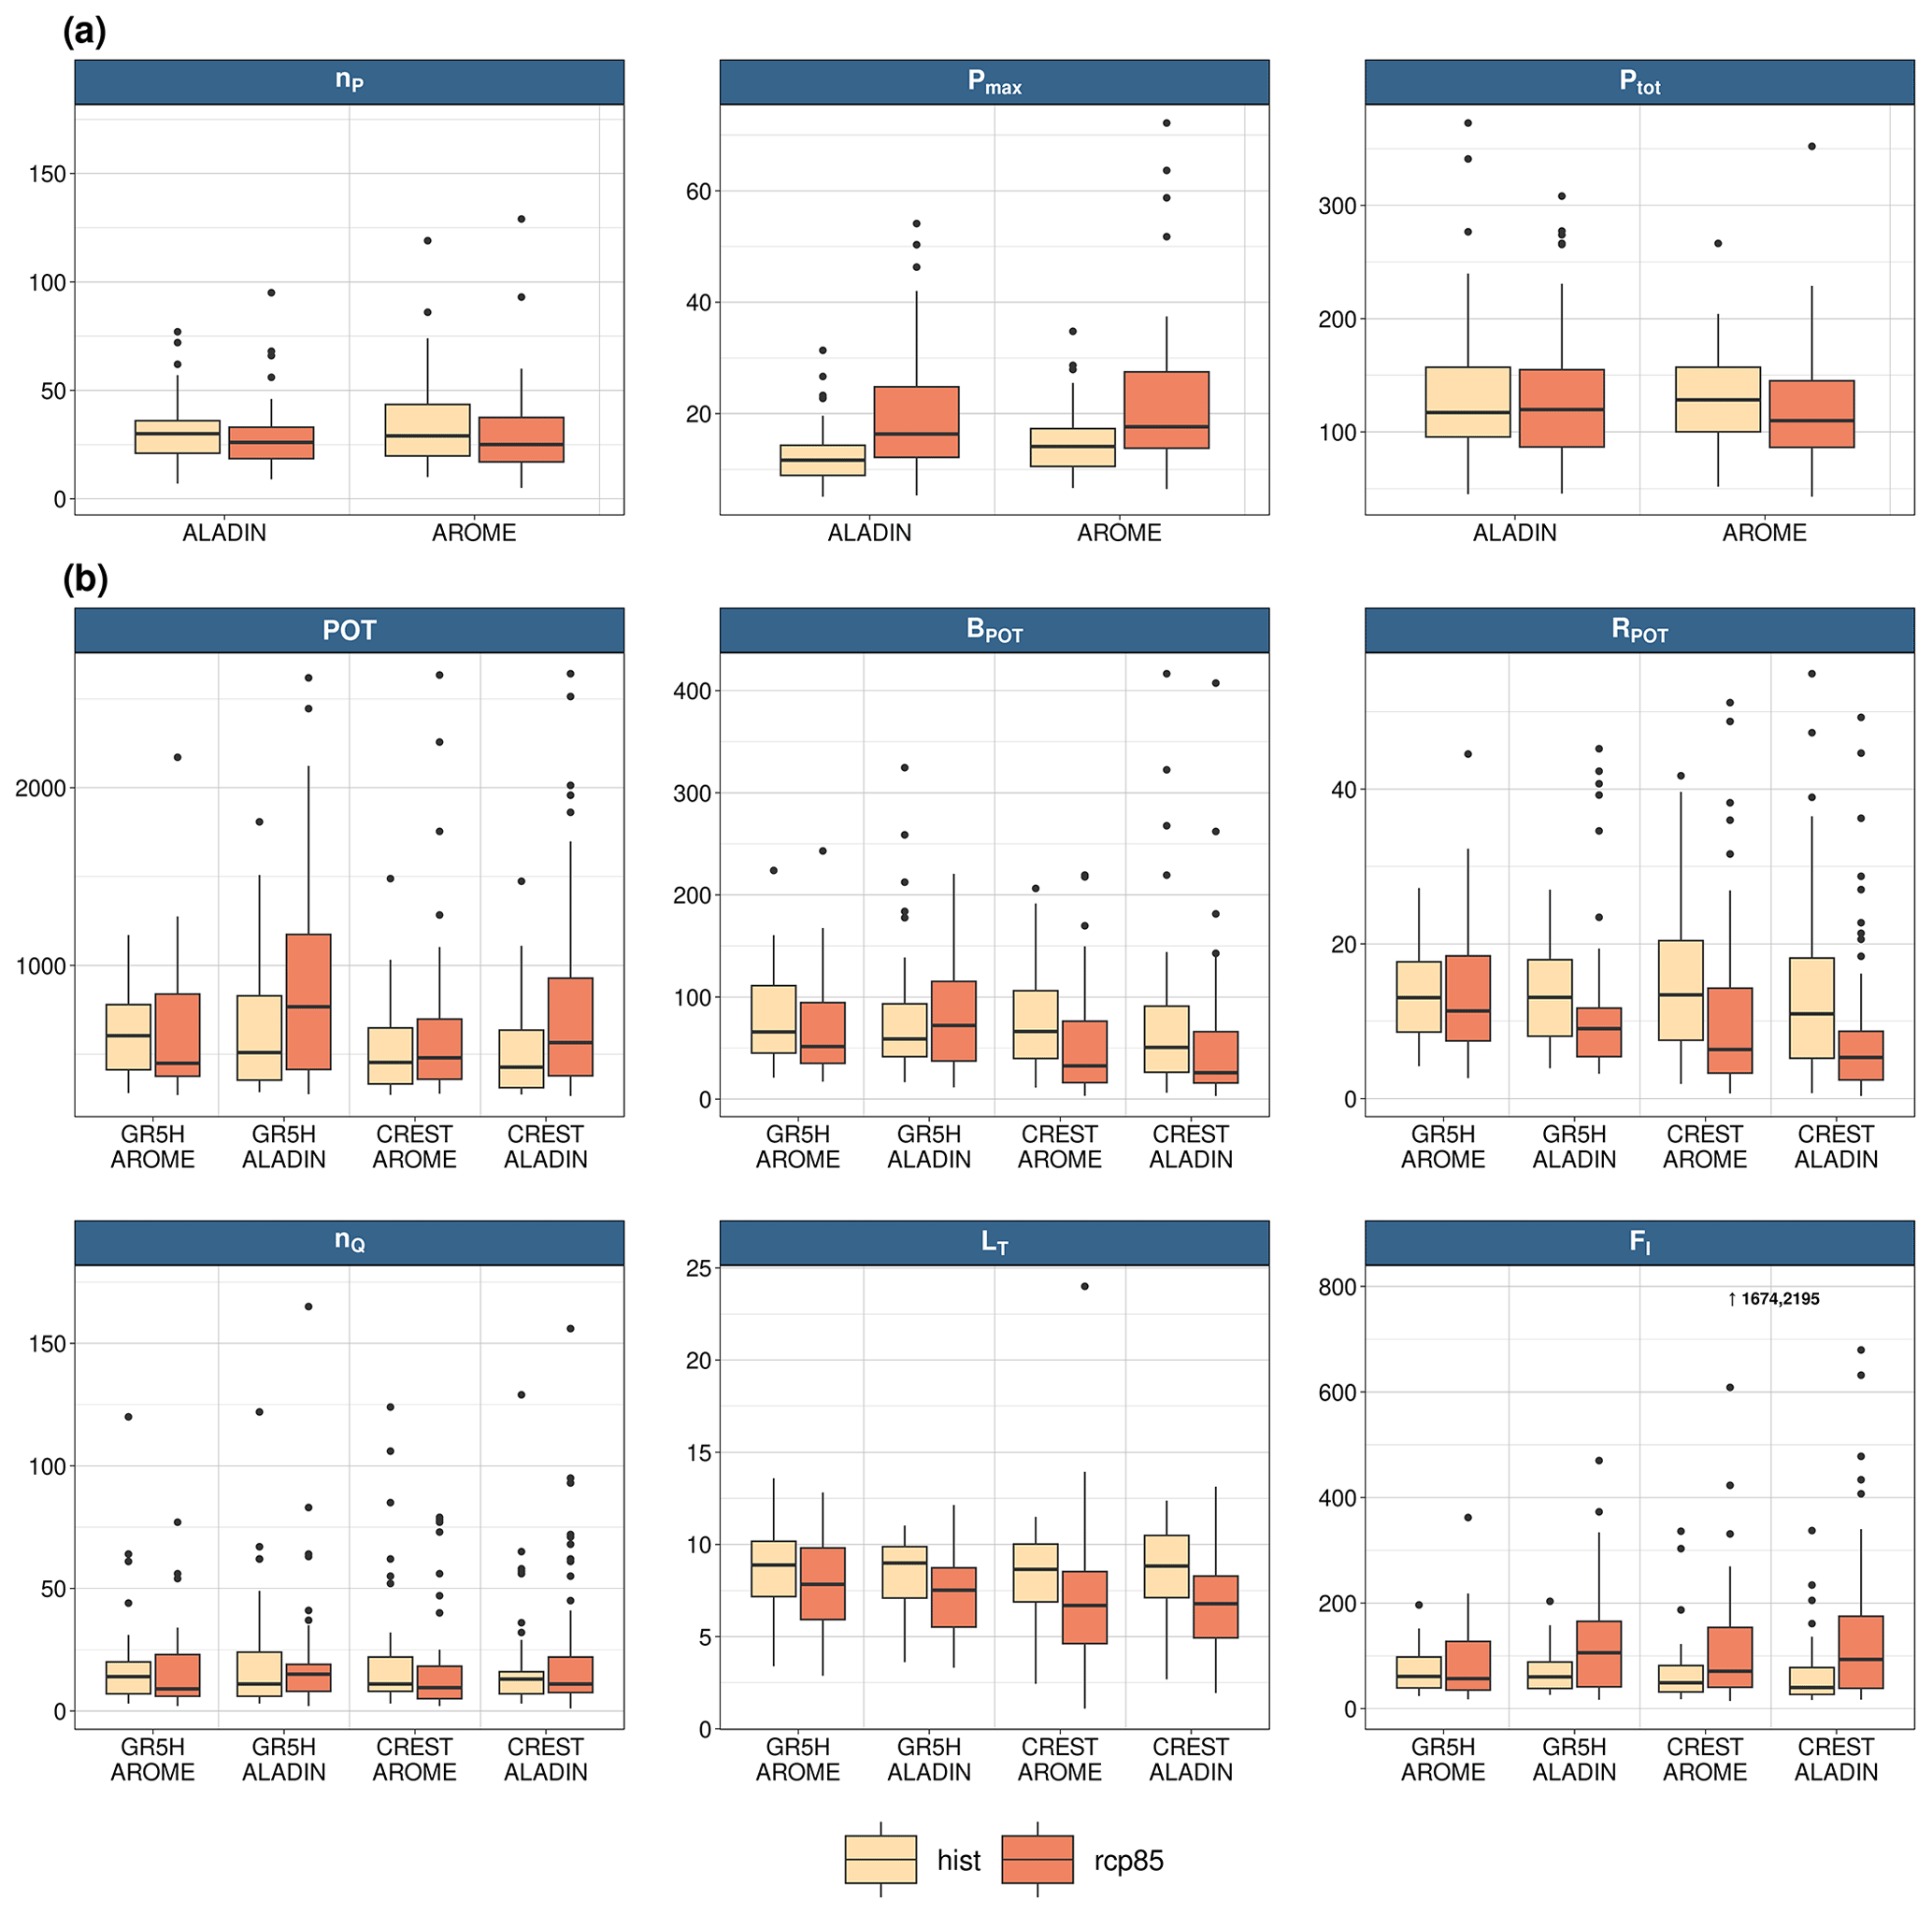
Figure 8Box plots of historical (light orange) and RCP8.5 future (dark orange) flood event characteristics (b) and related rainfall events (a) using the bias-corrected simulations. Each characteristic is detailed in Sect. 3.3.
For the ALADIN-driven simulations, the constant increase in POT (Figs. 7 and 8) is a combination of two processes. Firstly, decreases in baseflow are less pronounced for ALADIN than for AROME, in particular for the GR5H hydrological model, reflecting a smaller infiltration capacity and the prevention of the damping role of soils in a warmer future. Secondly, as explained above, this trend is likely an artifact of the bias correction causing stronger HPEs in a warmer climate. Indeed, this can be highlighted in Fig. 8, where Ptot shows a little increase for the ALADIN-driven simulations and a slight decrease in the medians of the AROME rainfall events. Outliers of Ptot reach the highest values for the ALADIN-driven simulations. The length of future floods (nQ) decreases for all simulations except for GR5H ALADIN, which shows a slight increase in the median and a lower spread for future scenarios. The lag time (LT) is projected to decrease for all simulations. This consistent signal of a shorter period between rainfall centroid and flood peak indicates a projected increase in the flood flashiness in this basin (FI). In more detail, the median of the flashiness index, representing reactivity and intensity of floods, is projected to increase for all simulations. The smallest increase in the flashiness index is shown for GR5H-AROME, while the other simulations show noteworthy positive trends and higher spreads. Some outliers reach extremely high values in the future projections, warning of potentially rare, but very extreme, flood events occurring in the future. This result is in agreement with the study of Li et al. (2022b), who found an increase in flash flood potential over the USA in the high-end emission scenario, notably in southern regions that have a wet convective season such as this Mediterranean catchment. However, the projected changes over this catchment should be interpreted with caution as they come from a single pair of RCM and CPM simulations. With these preliminary results, the different impacts of climate change on flood characteristics highlight the fine-scale benefits of CPM in simulating underlying hydrological processes. The robustness of the climate change impact on flash floods still needs to be confirmed with a comprehensive study that includes an uncertainty assessment.
Given the devastating consequences of Mediterranean floods, it is necessary to project whether the recent increase in precipitation extremes is going to continue in a warmer climate and have impacts on flood severity. Until now, flood projections have been based on regional climate models that cannot accurately simulate precipitation extremes that are yet the main factor causing these floods. In the last 10 years, emerging regional convection-permitting climate models using resolutions of a few kilometers show encouraging results in the simulations of short-duration precipitation extremes, opening the door to enhanced confidence and realism in future flood projections.
This study compared two regional climate model simulations used as inputs of two hydrological models to evaluate the possible climate change impacts on floods in a Mediterranean basin. The AROME convection-permitting climate model (CPM) with a 2.5 km spatial resolution has been compared to the ALADIN model with a 12 km spatial resolution. The evaluation of climate simulations shows similar results for both models regarding the reproduction of the annual cycles of temperature and precipitation. There is no added value of using the CPM for the representation of the seasonality of temperature and precipitation. Historical climate simulations are globally too cold with a wet bias for spring and summer. ALADIN and AROME both projected hotter and drier summers in the future but no drastic changes in the wet season duration and intensity, except a weak increase for ALADIN for the wet season precipitation peak. The added value of the CPM can be clearly seen on rainfall simulation before bias correction, with a much better representation of extremes with AROME compared to ALADIN, with the latter showing a strong underestimation. However, the bias correction reduces the difference between models since they are both corrected to match the observations. Both models project an increase in hourly precipitation under the RCP8.5 scenario. That signal is stronger for events above the 99.9th percentile than more moderate events above the 95th percentile, with a stronger signal for AROME.
Yet, both climate simulations required a bias correction to reproduce the observed discharge and notably flood events. Similar simulations of flood events have been obtained with the two hydrological models considered, a lumped conceptual model, GR5H, and a spatially distributed, process-based model, CREST, with slightly better results with the GR5H model. Very similar future projections have been obtained with the two hydrological models, highlighting the robustness of the results given the two different types of model structures. In terms of floods, the hydrological simulations driven by the climate model outputs showed contrasted discharge projections, with a general increase in the flood hazard using the ALADIN RCM and, on the contrary, an increase only for the largest floods using the AROME CPM. This indicates that the type of climate model can strongly modulate how the increase in extreme rainfall could be translated into changes in flood hazards. The AROME projections are more in line with previous studies indicating no changes, or a decline of small to moderate floods, caused by a dampening effect due to depleted soil moisture and base flow before floods, while the most extreme floods are likely to increase along with the more extreme future rainfall. All simulations also suggest an increase in the flashiness behavior of the basin, with decreased lag times between rainfall and runoff and a larger direct runoff contribution to floods, that could make the flood warning and flood mitigation strategies more difficult in this basin and beyond.
The results of the present study have been obtained with a rather complex, but standard, modeling chain, linking climate models, bias correction and hydrological models. While there are inherent uncertainties in the different steps of the methodology applied herein, the relevance of the results is reinforced since the two hydrological models provided similar conclusions using the same bias correction method, thus highlighting the differences stemming from the climate simulations. However, there is a clear need to strengthen the conclusions by using a larger ensemble of CPM that is becoming increasingly available for impact studies (Pichelli et al., 2021). Similarly, to reach regionally relevant conclusions and notably to derive adaptation strategies for future flood risks, there is also a need to analyze a broader ensemble of simulated floods on different catchments and to evaluate how their different areas and properties could modulate floods in a changing climate.
The CREST/EF5 software is available at http://ef5.ou.edu/ (FLASH, 2024), the airGR package is available at https://doi.org/10.15454/EX11NA (Coron et al., 2020) and the SBCK R package is available at https://github.com/yrobink/SBCK (Robin, 2022).
Hourly river discharge data could be accessed at https://hydro.eaufrance.fr/ (HydroPortail, 2024), and COMEPHORE radar rainfall is available on request from https://radarsmf.aeris-data.fr/ (AERIS, 2024). The AROME and ALADIN hourly simulations are available from the corresponding author upon reasonable request.
NP designed the climate and hydrological experiments and wrote the initial draft. PLP, YT and GT designed the experiments and revised the initial draft. JG and HV contributed to the setup of CREST and revised the manuscript. AA contributed to the data management and revised the manuscript.
The contact author has declared that none of the authors has any competing interests.
Publisher's note: Copernicus Publications remains neutral with regard to jurisdictional claims made in the text, published maps, institutional affiliations, or any other geographical representation in this paper. While Copernicus Publications makes every effort to include appropriate place names, the final responsibility lies with the authors.
Thanks are given to the CNRM MOSCA team for their technical help, in particular to Erwan Brisson, Cecile Caillaud and Edith Cortez.
This work is a contribution to the project KM-IMPACTS funded by the Make Our Planet Great Again initiative that is supported by the French National Research Agency under the future investment program ANR-18-MPGA-0005. This work was also supported by the EUCP project (European Union's Horizon 2020 program, grant agreement no. 776613). This study has received funding from Agence Nationale de la Recherche – France 2030 as part of the PEPR TRACCS program under grant number ANR-22-EXTR-0011 (LOCALISING).
This paper was edited by Maria-Carmen Llasat and reviewed by two anonymous referees.
Addor, N. and Seibert, J.: Bias correction for hydrological impact studies – beyond the daily perspective: Invited Commentary, Hydrol. Process., 28, 4823–4828, https://doi.org/10.1002/hyp.10238, 2014. a
AERIS: Home Page, https://radarsmf.aeris-data.fr/ (last access: 21 March 2024), 2024. a
Alfieri, L., Smith, P. J., Thielen-del Pozo, J., and Beven, K. J.: A staggered approach to flash flood forecasting – case study in the Cévennes region, Adv. Geosci., 29, 13–20, https://doi.org/10.5194/adgeo-29-13-2011, 2011. a
Alfieri, L., Burek, P., Feyen, L., and Forzieri, G.: Global warming increases the frequency of river floods in Europe, Hydrol. Earth Syst. Sci., 19, 2247–2260, https://doi.org/10.5194/hess-19-2247-2015, 2015. a
Amponsah, W., Ayral, P.-A., Boudevillain, B., Bouvier, C., Braud, I., Brunet, P., Delrieu, G., Didon-Lescot, J.-F., Gaume, E., Lebouc, L., Marchi, L., Marra, F., Morin, E., Nord, G., Payrastre, O., Zoccatelli, D., and Borga, M.: Integrated high-resolution dataset of high-intensity European and Mediterranean flash floods, Earth Syst. Sci. Data, 10, 1783–1794, https://doi.org/10.5194/essd-10-1783-2018, 2018. a
Ascott, M. J., Christelis, V., Lapworth, D. J., Macdonald, D. M. J., Tindimugaya, C., Iragena, A., Finney, D., Fitzpatrick, R., Marsham, J. H., and Rowell, D. P.: On the application of rainfall projections from a convection-permitting climate model to lumped catchment models, J. Hydrol., 617, 129097, https://doi.org/10.1016/j.jhydrol.2023.129097, 2023. a
Astagneau, P. C., Bourgin, F., Andréassian, V., and Perrin, C.: When does a parsimonious model fail to simulate floods? Learning from the seasonality of model bias, Hydrolog. Sci. J., 66, 1288–1305, https://doi.org/10.1080/02626667.2021.1923720, 2021. a
Ban, N., Caillaud, C., Coppola, E., Pichelli, E., Sobolowski, S., Adinolfi, M., Ahrens, B., Alias, A., Anders, I., Bastin, S., Belšić, D., Berthou, S., Brisson, E., Cardoso, R. M., Chan, S. C., Christensen, O. B., Fernández, J., Fita, L., Frisius, T., Gašparac, G., Giorgi, F., Goergen, K., Haugen, J. E., Hodnebrog, Ø., Kartsios, S., Katragkou, E., Kendon, E. J., Keuler, K., Lavin-Gullon, A., Lenderink, G., Leutwyler, D., Lorenz, T., Maraun, D., Mercogliano, P., Milovac, J., Panitz, H.-J., Raffa, M., Remedio, A. R., Schär, C., Soares, P. M. M., Srnec, L., Steensen, B. M., Stocchi, P., Tölle, M. H., Truhetz, H., Vergara-Temprado, J., de Vries, H., Warrach-Sagi, K., Wulfmeyer, V., and Zander, M. J.: The first multi-model ensemble of regional climate simulations at kilometer-scale resolution, part I: evaluation of precipitation, Clim. Dynam., 57, 275–302, https://doi.org/10.1007/s00382-021-05708-w, 2021. a, b
Bertola, M., Viglione, A., Vorogushyn, S., Lun, D., Merz, B., and Blöschl, G.: Do small and large floods have the same drivers of change? A regional attribution analysis in Europe, Hydrol. Earth Syst. Sci., 25, 1347–1364, https://doi.org/10.5194/hess-25-1347-2021, 2021. a
Blöschl, G., Hall, J., Viglione, A., Perdigão, R. A. P., Parajka, J., Merz, B., Lun, D., Arheimer, B., Aronica, G. T., Bilibashi, A., Boháč, M., Bonacci, O., Borga, M., Čanjevac, I., Castellarin, A., Chirico, G. B., Claps, P., Frolova, N., Ganora, D., Gorbachova, L., Gül, A., Hannaford, J., Harrigan, S., Kireeva, M., Kiss, A., Kjeldsen, T. R., Kohnová, S., Koskela, J. J., Ledvinka, O., Macdonald, N., Mavrova-Guirguinova, M., Mediero, L., Merz, R., Molnar, P., Montanari, A., Murphy, C., Osuch, M., Ovcharuk, V., Radevski, I., Salinas, J. L., Sauquet, E., Šraj, M., Szolgay, J., Volpi, E., Wilson, D., Zaimi, K., and vZivković, N.: Changing climate both increases and decreases European river floods, Nature, 573, 108–111, https://doi.org/10.1038/s41586-019-1495-6, 2019. a
Boé, J., Terray, L., Habets, F., and Martin, E.: Statistical and dynamical downscaling of the Seine basin climate for hydro-meteorological studies, Int. J. Climatol., 27, 1643–1655, https://doi.org/10.1002/joc.1602, 2007. a
Boudou, M., Lang, M., Vinet, F., and Cœur, D.: Comparative hazard analysis of processes leading to remarkable flash floods (France, 1930–1999), J. Hydrol., 541, 533–552, https://doi.org/10.1016/j.jhydrol.2016.05.032, 2016. a
Brunner, M. I., Swain, D. L., Wood, R. R., Willkofer, F., Done, J. M., Gilleland, E., and Ludwig, R.: An extremeness threshold determines the regional response of floods to changes in rainfall extremes, Commun. Earth Environment, 2, 173, https://doi.org/10.1038/s43247-021-00248-x, 2021. a, b
Caillaud, C., Somot, S., Alias, A., Bernard-Bouissières, I., Fumière, Q., Laurantin, O., Seity, Y., and Ducrocq, V.: Modelling Mediterranean heavy precipitation events at climate scale: an object-oriented evaluation of the CNRM-AROME convection-permitting regional climate model, Clim. Dynam., 56, 1717–1752, https://doi.org/10.1007/s00382-020-05558-y, 2021. a, b, c, d, e, f, g, h
Caldas-Alvarez, A., Feldmann, H., Lucio-Eceiza, E., and Pinto, J. G.: Convection-parameterized and convection-permitting modelling of heavy precipitation in decadal simulations of the greater Alpine region with COSMO-CLM, Weather Clim. Dynam., 4, 543–565, https://doi.org/10.5194/wcd-4-543-2023, 2023. a
Caumont, O., Mandement, M., Bouttier, F., Eeckman, J., Lebeaupin Brossier, C., Lovat, A., Nuissier, O., and Laurantin, O.: The heavy precipitation event of 14–15 October 2018 in the Aude catchment: a meteorological study based on operational numerical weather prediction systems and standard and personal observations, Nat. Hazards Earth Syst. Sci., 21, 1135–1157, https://doi.org/10.5194/nhess-21-1135-2021, 2021. a
Chauveau, M., Chazot, S., Perrin, C., Bourgin, P.-Y., Sauquet, E., Vidal, J.-P., Rouchy, N., Martin, E., David, J., Norotte, T., Maugis, P., and De Lacaze, X.: Quels impacts des changements climatiques sur les eaux de surface en France à l'horizon 2070?, La Houille Blanche, 99, 5–15, https://doi.org/10.1051/lhb/2013027, 2013. a
Clark, R. A., Flamig, Z. L., Vergara, H., Hong, Y., Gourley, J. J., Mandl, D. J., Frye, S., Handy, M., and Patterson, M.: Hydrological Modeling and Capacity Building in the Republic of Namibia, B. Am. Meteorol. Soc., 98, 1697–1715, https://doi.org/10.1175/BAMS-D-15-00130.1, 2017. a
Coppola, E., Sobolowski, S., Pichelli, E., Raffaele, F., Ahrens, B., Anders, I., Ban, N., Bastin, S., Belda, M., Belusic, D., Caldas-Alvarez, A., Cardoso, R. M., Davolio, S., Dobler, A., Fernandez, J., Fita, L., Fumiere, Q., Giorgi, F., Goergen, K., Güttler, I., Halenka, T., Heinzeller, D., Hodnebrog, Ø., Jacob, D., Kartsios, S., Katragkou, E., Kendon, E., Khodayar, S., Kunstmann, H., Knist, S., Lavín-Gullón, A., Lind, P., Lorenz, T., Maraun, D., Marelle, L., van Meijgaard, E., Milovac, J., Myhre, G., Panitz, H.-J., Piazza, M., Raffa, M., Raub, T., Rockel, B., Schär, C., Sieck, K., Soares, P. M. M., Somot, S., Srnec, L., Stocchi, P., Tölle, M. H., Truhetz, H., Vautard, R., de Vries, H., and Warrach-Sagi, K.: A first-of-its-kind multi-model convection permitting ensemble for investigating convective phenomena over Europe and the Mediterranean, Clim. Dynam., 55, 3–34, https://doi.org/10.1007/s00382-018-4521-8, 2020. a
Coron, L., Thirel, G., Delaigue, O., Perrin, C., and Andréassian, V.: The suite of lumped GR hydrological models in an R package, Environ. Model. Softw., 94, 166–171, https://doi.org/10.1016/j.envsoft.2017.05.002, 2017. a
Coron, L., Delaigue, O., Thirel, G., Dorchies, D., Perrin, C., and Michel, C.: airGR: Suite of GR Hydrological Models for Precipitation-Runoff Modelling, R package version 1.7.4, HYCAR [code], https://doi.org/10.15454/EX11NA, 2020. a, b
Cunnane, C.: A particular comparison of annual maxima and partial duration series methods of flood frequency prediction, J. Hydrol., 18, 257–271, https://doi.org/10.1016/0022-1694(73)90051-6, 1973. a
Dankers, R. and Feyen, L.: Flood hazard in Europe in an ensemble of regional climate scenarios, J. Geophys. Res.-Atmos., 114, D16108, https://doi.org/10.1029/2008JD011523, 2009. a
Dee, D. P., Uppala, S. M., Simmons, A. J., Berrisford, P., Poli, P., Kobayashi, S., Andrae, U., Balmaseda, M. A., Balsamo, G., Bauer, P., Bechtold, P., Beljaars, A. C. M., van de Berg, L., Bidlot, J., Bormann, N., Delsol, C., Dragani, R., Fuentes, M., Geer, A. J., Haimberger, L., Healy, S. B., Hersbach, H., Hólm, E. V., Isaksen, L., Kållberg, P., Köhler, M., Matricardi, M., McNally, A. P., Monge-Sanz, B. M., Morcrette, J.-J., Park, B.-K., Peubey, C., de Rosnay, P., Tavolato, C., Thépaut, J.-N., and Vitart, F.: The ERA-Interim reanalysis: configuration and performance of the data assimilation system, Q. J. Roy. Meteorol. Soc., 137, 553–597, https://doi.org/10.1002/qj.828, 2011. a
Delrieu, G., Nicol, J., Yates, E., Kirstetter, P.-E., Creutin, J.-D., Anquetin, S., Obled, C., Saulnier, G.-M., Ducrocq, V., Gaume, E., Payrastre, O., Andrieu, H., Ayral, P.-A., Bouvier, C., Neppel, L., Livet, M., Lang, M., du Châtelet, J. P., Walpersdorf, A., and Wobrock, W.: The Catastrophic Flash-Flood Event of 8–9 September 2002 in the Gard Region, France: A First Case Study for the Cévennes–Vivarais Mediterranean Hydrometeorological Observatory, J. Hydrometeorol., 6, 34–52, https://doi.org/10.1175/JHM-400.1, 2005. a, b, c
Ficchì, A., Perrin, C., and Andréassian, V.: Hydrological modelling at multiple sub-daily time steps: Model improvement via flux-matching, J. Hydrol., 575, 1308–1327, https://doi.org/10.1016/j.jhydrol.2019.05.084, 2019. a, b, c
Flamig, Z. L., Vergara, H., and Gourley, J. J.: The Ensemble Framework For Flash Flood Forecasting (EF5) v1.2: description and case study, Geosci. Model Dev., 13, 4943–4958, https://doi.org/10.5194/gmd-13-4943-2020, 2020. a, b, c
FLASH: 20240321/1300, http://ef5.ou.edu/ (last access: 21 March 2024), 2024. a
Fumière, Q., Déqué, M., Nuissier, O., Somot, S., Alias, A., Caillaud, C., Laurantin, O., and Seity, Y.: Extreme rainfall in Mediterranean France during the fall: added value of the CNRM-AROME Convection-Permitting Regional Climate Model, Clim. Dynam., 55, 77–91, https://doi.org/10.1007/s00382-019-04898-8, 2020. a, b
Giorgi, F.: Thirty Years of Regional Climate Modeling: Where Are We and Where Are We Going next?, J. Geophys. Res.-Atmos., 124, 5696–5723, https://doi.org/10.1029/2018JD030094, 2019. a, b, c
Giorgi, F. and Gutowski, W. J.: Regional Dynamical Downscaling and the CORDEX Initiative, Annu. Rev. Environ. Resour., 40, 467–490, https://doi.org/10.1146/annurev-environ-102014-021217, 2015. a
Gupta, H. V., Kling, H., Yilmaz, K. K., and Martinez, G. F.: Decomposition of the mean squared error and NSE performance criteria: Implications for improving hydrological modelling, J. Hydrol., 377, 80–91, https://doi.org/10.1016/j.jhydrol.2009.08.003, 2009. a
Hargreaves, G. H. and Samani, Z. A.: Estimating Potential Evapotranspiration, J. Irrig. Drain. Div., 108, 225–230, https://doi.org/10.1061/JRCEA4.0001390, 1982. a
Huang, S., Krysanova, V., and Hattermann, F. F.: Does bias correction increase reliability of flood projections under climate change? A case study of large rivers in Germany, Int. J. Climatol., 34, 3780–3800, https://doi.org/10.1002/joc.3945, 2014. a
HydroPortail: Accédez gratuitement aux données publiques quantitatives relatives à l'écoulement des cours d'eau, https://hydro.eaufrance.fr/ (last access: 21 March 2024), 2024. a
Kay, A.: Differences in hydrological impacts using regional climate model and nested convection-permitting model data, Climatic Change, 173, 11, https://doi.org/10.1007/s10584-022-03405-z, 2022. a
Kay, A. L., Reynard, N. S., and Jones, R. G.: RCM rainfall for UK flood frequency estimation. I. Method and validation, J. Hydrol., 318, 151–162, https://doi.org/10.1016/j.jhydrol.2005.06.012, 2006. a
Kay, A. L., Rudd, A. C., Davies, H. N., Kendon, E. J., and Jones, R. G.: Use of very high resolution climate model data for hydrological modelling: baseline performance and future flood changes, Climatic Change, 133, 193–208, https://doi.org/10.1007/s10584-015-1455-6, 2015. a
Kendon, E. J., Roberts, N. M., Senior, C. A., and Roberts, M. J.: Realism of Rainfall in a Very High-Resolution Regional Climate Model, J. Climate, 25, 5791–5806, https://doi.org/10.1175/JCLI-D-11-00562.1, 2012. a
Khodayar, S., Fosser, G., Berthou, S., Davolio, S., Drobinski, P., Ducrocq, V., Ferretti, R., Nuret, M., Pichelli, E., Richard, E., and Bock, O.: A seamless weather–climate multi-model intercomparison on the representation of a high impact weather event in the western Mediterranean: HyMeX IOP12, Q. J. Roy. Meteorol. Soc., 142, 433–452, https://doi.org/10.1002/qj.2700, 2016. a
Khodayar, S., Kalthoff, N., and Kottmeier, C.: Atmospheric conditions associated with heavy precipitation events in comparison to seasonal means in the western mediterranean region, Clim. Dynam., 51, 951–967, https://doi.org/10.1007/s00382-016-3058-y, 2018. a
Köplin, N., Schädler, B., Viviroli, D., and Weingartner, R.: Seasonality and magnitude of floods in Switzerland under future climate change, Hydrol. Process., 28, 2567–2578, https://doi.org/10.1002/hyp.9757, 2014. a
Lang, M., Ouarda, T., and Bobée, B.: Towards operational guidelines for over-threshold modeling, J. Hydrol., 225, 103–117, https://doi.org/10.1016/S0022-1694(99)00167-5, 1999. a, b
Laurantin, O., Tabary, P., Dupuy, P., L'Henaff, G., Merlier, C., and Soubeyroux, J.-M.: A 10-year (1997–2006) reanalysis of quantitative precipitation estimation over France, in: vol. 1000, 7th European conference on radar in meteorology and hydrology, http://www.meteo.fr/cic/meetings/2012/ERAD/extended_abs/QPE_199_ext_abs.pdf (last access: 14 November 2023), 2012. a, b
Lemaitre-Basset, T., Collet, L., Thirel, G., Parajka, J., Evin, G., and Hingray, B.: Climate change impact and uncertainty analysis on hydrological extremes in a French Mediterranean catchment, Hydrolog. Sci. J., 66, 888–903, https://doi.org/10.1080/02626667.2021.1895437, 2021. a, b, c
Li, Z., Chen, M., Gao, S., Luo, X., Gourley, J. J., Kirstetter, P., Yang, T., Kolar, R., McGovern, A., Wen, Y., Rao, B., Yami, T., and Hong, Y.: CREST-iMAP v1.0: A fully coupled hydrologic-hydraulic modeling framework dedicated to flood inundation mapping and prediction, Environ. Model. Softw., 141, 105051, https://doi.org/10.1016/j.envsoft.2021.105051, 2021. a
Li, Z., Gao, S., Chen, M., Gourley, J. J., and Hong, Y.: Spatiotemporal Characteristics of US Floods: Current Status and Forecast Under a Future Warmer Climate, Earth's Future, 10, e2022EF002700, https://doi.org/10.1029/2022EF002700, 2022a. a, b, c
Li, Z., Gao, S., Chen, M., Gourley, J. J., Liu, C., Prein, A. F., and Hong, Y.: The conterminous United States are projected to become more prone to flash floods in a high-end emissions scenario, Commun. Earth Environ., 3, 86, https://doi.org/10.1038/s43247-022-00409-6, 2022b. a, b, c, d
Lobligeois, F.: Mieux connaitre la distribution spatiale des pluies améliore-t-il la modélisation des crues? Diagnostic sur 181 bassins versants français, p. 313, https://pastel.hal.science/tel-01134990 (last access: 21 March 2024), 2014. a
Lucas-Picher, P., Argüeso, D., Brisson, E., Tramblay, Y., Berg, P., Lemonsu, A., Kotlarski, S., and Caillaud, C.: Convection-permitting modeling with regional climate models: Latest developments and next steps, WIREs Clim. Change, 12, e731, https://doi.org/10.1002/wcc.731, 2021. a, b
Lucas-Picher, P., Brisson, E., Caillaud, C., Alias, A., Nabat, P., Lemonsu, A., Poncet, N., Cortés Hernandez, V. E., Michau, Y., Doury, A., Monteiro, D., and Somot, S.: Evaluation of the convection-permitting regional climate model CNRM-AROME41t1 over Northwestern Europe, Clim. Dynam., https://doi.org/10.1007/s00382-022-06637-y, in press, 2023. a, b, c, d, e
Maraun, D.: Bias Correcting Climate Change Simulations – a Critical Review, Curr. Clim. Change Rep., 2, 211–220, https://doi.org/10.1007/s40641-016-0050-x, 2016. a
Massari, C., Pellet, Vi., Tramblay, Y., Crow, W. T., Gründemann, G. J., Hascoetf, T., Penna, D., Modanesi, S., Brocca, L., Camici, S., and Marra, F.: On the relation between antecedent basin conditions and runoff coefficient for European floods, J. Hydrol., 625, 130012, https://doi.org/10.1016/j.jhydrol.2023.130012, 2023. a
Maurer, E. P., Brekke, L., Pruitt, T., and Duffy, P. B.: Fine-resolution climate projections enhance regional climate change impact studies, Eos Trans. Am. Geophys.Union, 88, 504–504, https://doi.org/10.1029/2007EO470006, 2007. a
Mendoza, P. A., Mizukami, N., Ikeda, K., Clark, M. P., Gutmann, E. D., Arnold, J. R., Brekke, L. D., and Rajagopalan, B.: Effects of different regional climate model resolution and forcing scales on projected hydrologic changes, J. Hydrol., 1003–1019, https://doi.org/10.1016/j.jhydrol.2016.08.010, 2016. a
Michelangeli, P.-A., Vrac, M., and Loukos, H.: Probabilistic downscaling approaches: Application to wind cumulative distribution functions, Geophys. Res. Lett., 36, L11708, https://doi.org/10.1029/2009GL038401, 2009. a, b
Monteiro, Di., Caillaud, C., Samacoïts, R., Lafaysse, M., and Morin, S.: Potential and limitations of convection‐permitting CNRM-AROME climate modelling in the French Alps, Int. J. Climatol., 42, 7162–7185, https://doi.org/10.1002/joc.7637, 2022. a
Moussa, R.: When monstrosity can be beautiful while normality can be ugly: assessing the performance of event-based flood models, Hydrolog. Sci. J., 55, 1074–1084, https://doi.org/10.1080/02626667.2010.505893, 2010. a
Nabat, P., Somot, S., Cassou, C., Mallet, M., Michou, M., Bouniol, D., Decharme, B., Drugé, T., Roehrig, R., and Saint-Martin, D.: Modulation of radiative aerosols effects by atmospheric circulation over the Euro-Mediterranean region, Atmos. Chem. Phys., 20, 8315–8349, https://doi.org/10.5194/acp-20-8315-2020, 2020. a, b
Nash, J. and Sutcliffe, J.: River flow forecasting through conceptual models part I – A discussion of principles, J. Hydrol., 10, 282–290, https://doi.org/10.1016/0022-1694(70)90255-6, 1970. a
Neppel, L., Renard, B., Lang, M., Ayral, P.-A., Coeur, D., Gaume, E., Jacob, N., Payrastre, O., Pobanz, K., and Vinet, F.: Flood frequency analysis using historical data: accounting for random and systematic errors, Hydrolog. Scie. J. – Journal des Sciences Hydrologiques, 55, 192–208, 2010. a
Nuissier, O., Joly, B., Joly, A., Ducrocq, V., and Arbogast, P.: A statistical downscaling to identify the large-scale circulation patterns associated with heavy precipitation events over southern France, Q. J. Roy. Meteorol. Soci., 137, 1812–1827, https://doi.org/10.1002/qj.866,, 2011. a
Oudin, L., Hervieu, F., Michel, C., Perrin, C., Andréassian, V., Anctil, F., and Loumagne, C.: Which potential evapotranspiration input for a lumped rainfall–runoff model?, J. Hydrol., 303, 290–306, https://doi.org/10.1016/j.jhydrol.2004.08.026, 2005. a
Pichelli, E., Coppola, E., Sobolowski, S., Ban, N., Giorgi, F., Stocchi, P., Alias, A., Belušić, D., Berthou, S., Caillaud, C., Cardoso, R. M., Chan, S., Christensen, O. B., Dobler, A., de Vries, H., Goergen, K., Kendon, E. J., Keuler, K., Lenderink, G., Lorenz, T., Mishra, A. N., Panitz, H.-J., Schär, C., Soares, P. M. M., Truhetz, H., and Vergara-Temprado, J.: The first multi-model ensemble of regional climate simulations at kilometer-scale resolution part 2: historical and future simulations of precipitation, Clim. Dynam., 56, 3581–3602, https://doi.org/10.1007/s00382-021-05657-4, 2021. a, b
Prein, A. F., Langhans, W., Fosser, G., Ferrone, A., Ban, N., Goergen, K., Keller, M., Tölle, M., Gutjahr, O., Feser, F., Brisson, E., Kollet, S., Schmidli, J., Lipzig, N. P. M., and Leung, R.: A review on regional convection‐permitting climate modeling: Demonstrations, prospects, and challenges, Rev. Geophys., 53, 323–361, https://doi.org/10.1002/2014RG000475, 2015. a
Prein, A. F., Gobiet, A., Truhetz, H., Keuler, K., Goergen, K., Teichmann, C., Fox Maule, C., van Meijgaard, E., Déqué, M., Nikulin, G., Vautard, R., Colette, A., Kjellström, E., and Jacob, D.: Precipitation in the EURO-CORDEX 0.11° and 0.44° simulations: high resolution, high benefits?, Clim. Dynam., 46, 383–412, https://doi.org/10.1007/s00382-015-2589-y, 2016. a
Quintero, F., Villarini, G., Prein, A. F., Krajewski, W. F., and Zhang, W.: On the Role of Atmospheric Simulations Horizontal Grid Spacing for Flood Modeling, ResearchSquare, https://www.researchsquare.com/article/rs-821389/v1 (last access: 7 November 2021), 2021. a
Reszler, C., Switanek, M. B., and Truhetz, H.: Convection-permitting regional climate simulations for representing floods in small- and medium-sized catchments in the Eastern Alps, Nat. Hazards Earth Syst. Sci., 18, 2653–2674, https://doi.org/10.5194/nhess-18-2653-2018, 2018. a, b
Ribes, A., Thao, S., Vautard, R., Dubuisson, B., Somot, S., Colin, J., Planton, S., and Soubeyroux, J.-M.: Observed increase in extreme daily rainfall in the French Mediterranean, Clim. Dynam., 52, 1095–1114, https://doi.org/10.1007/s00382-018-4179-2, 2019. a
Ricard, D., Ducrocq, V., and Auger, L.: A Climatology of the Mesoscale Environment Associated with Heavily Precipitating Events over a Northwestern Mediterranean Area, J. Appl. Meteorol. Clim., 51, 468–488, https://doi.org/10.1175/JAMC-D-11-017.1, 2012. a
Robin, Y.: SBCK: Statistical Bias Correction Kit, R package version 0.5.0, GitHub [code], https://github.com/yrobink/SBCK (last access: 22 May 2023), 2022. a, b
Rojas, R., Feyen, L., Dosio, A., and Bavera, D.: Improving pan-European hydrological simulation of extreme events through statistical bias correction of RCM-driven climate simulations, Hydrol. Earth Syst. Sci., 15, 2599–2620, https://doi.org/10.5194/hess-15-2599-2011, 2011. a
Roux, H., Labat, D., Garambois, P.-A., Maubourguet, M.-M., Chorda, J., and Dartus, D.: A physically-based parsimonious hydrological model for flash floods in Mediterranean catchments, Nat. Hazards Earth Syst. Sci., 11, 2567–2582, https://doi.org/10.5194/nhess-11-2567-2011, 2011. a
Rummukainen, M.: State-of-the-art with regional climate models, WIREs Clim. Change, 1, 82–96, https://doi.org/10.1002/wcc.8, 2010. a
Sharma, A., Wasko, C., and Lettenmaier, D. P.: If Precipitation Extremes Are Increasing, Why Aren't Floods?, Water Resour. Res., 54, 8545–8551, https://doi.org/10.1029/2018WR023749, 2018. a
Teutschbein, C. and Seibert, J.: Regional Climate Models for Hydrological Impact Studies at the Catchment Scale: A Review of Recent Modeling Strategies, Geogr. Compass, 4, 834–860, https://doi.org/10.1111/j.1749-8198.2010.00357.x, 2010. a
Teutschbein, C. and Seibert, J.: Bias correction of regional climate model simulations for hydrological climate-change impact studies: Review and evaluation of different methods, J. Hydrol., 456-457, 12–29, https://doi.org/10.1016/j.jhydrol.2012.05.052, 2012. a
Thober, S., Kumar, R., Wanders, N., Marx, A., Pan, M., Rakovec, O., Samaniego, L., Sheffield, J., Wood, E. F., and Zink, M.: Multi-model ensemble projections of European river floods and high flows at 1.5, 2, and 3 degrees global warming, Environ. Res. Lett., 13, 014003, https://doi.org/10.1088/1748-9326/aa9e35, 2018. a
Toukourou, M., Johannet, A., Dreyfus, G., and Ayral, P.-A.: Rainfall-runoff modeling of flash floods in the absence of rainfall forecasts: the case of “Cévenol flash floods”, Appl. Intel., 35, 178–189, https://doi.org/10.1007/s10489-010-0210-y, 2011. a
Tramblay, Y. and Somot, S.: Future evolution of extreme precipitation in the Mediterranean, Climatic Change, 151, 289–302, https://doi.org/10.1007/s10584-018-2300-5, 2018. a
Tramblay, Y., Mimeau, L., Neppel, L., Vinet, F., and Sauquet, E.: Detection and attribution of flood trends in Mediterranean basins, Hydrol. Earth Syst. Sci., 23, 4419–4431, https://doi.org/10.5194/hess-23-4419-2019, 2019. a
Tramblay, Y., Arnaud, P., Artigue, G., Lang, M., Paquet, E., Neppel, L., and Sauquet, E.: Changes in Mediterranean flood processes and seasonality, Hydrol. Earh Syst. Sci., 27, 2973–2987, https://doi.org/10.5194/hess-27-2973-2023, 2023, a, b
Vannier, O., Braud, I., and Anquetin, S.: Regional estimation of catchment-scale soil properties by means of streamflow recession analysis for use in distributed hydrological models, Hydrol. Process., 28, 6276–6291, https://doi.org/10.1002/hyp.10101, 2014. a
Vautard, R., Kadygrov, N., Iles, C., Boberg, F., Buonomo, E., Bülow, K., Coppola, E., Corre, L., van Meijgaard, E., Nogherotto, R., Sandstad, M., Schwingshackl, C., Somot, S., Aalbers, E., Christensen, O. B., Ciarlo, J. M., Demory, M.-E., Giorgi, F., Jacob, D., Jones, R. G., Keuler, K., Kjellström, E., Lenderink, G., Levavasseur, G., Nikulin, G., Sillmann, J., Solidoro, C., Sørland, S. L., Steger, C., Teichmann, C., Warrach-Sagi, K., and Wulfmeyer, V.: Evaluation of the Large EURO-CORDEX Regional Climate Model Ensemble, J. Geophys. Res.-Atmos., 126, e2019JD032344, https://doi.org/10.1029/2019JD032344, 2021. a
Vinet, F.: Geographical analysis of damage due to flash floods in southern France: The cases of 12–13 November 1999 and 8–9 September 2002, Appl. Geogr., 28, 323–336, https://doi.org/10.1016/j.apgeog.2008.02.007, 2008. a
Vinet, F., Cherel, J.-P., Weiss, K., Lewandowski, M., and Boissier, L.: Flood related mortality in the French Mediterranean region (1980–2020), Hydrosci. J., 108, 2097022, https://doi.org/10.1080/27678490.2022.2097022, 2022. a
Voldoire, A., Sanchez-Gomez, E., Salas y Mélia, D., Decharme, B., Cassou, C., Sénési, S., Valcke, S., Beau, I., Alias, A., Chevallier, M., Déqué, M., Deshayes, J., Douville, H., Fernandez, E., Madec, G., Maisonnave, E., Moine, M.-P., Planton, S., Saint-Martin, D., Szopa, S., Tyteca, S., Alkama, R., Belamari, S., Braun, A., Coquart, L., and Chauvin, F.: The CNRM-CM5.1 global climate model: description and basic evaluation, Clim. Dynam., 40, 2091–2121, https://doi.org/10.1007/s00382-011-1259-y, 2013. a
Vrac, M., Drobinski, P., Merlo, A., Herrmann, M., Lavaysse, C., Li, L., and Somot, S.: Dynamical and statistical downscaling of the French Mediterranean climate: uncertainty assessment, Nat. Hazards Earth Syst. Sci., 12, 2769–2784, https://doi.org/10.5194/nhess-12-2769-2012, 2012. a
Vrac, M., Noël, T., and Vautard, R.: Bias correction of precipitation through Singularity Stochastic Removal: Because occurrences matter, J. Geophys. Res.-Atmos., 121, 5237–5258, https://doi.org/10.1002/2015JD024511, 2016. a
Vrugt, J. A., ter Braak, C. J., Diks, C. G., Robinson, B. A., Hyman, J. M., and Higdon, D.: Accelerating Markov Chain Monte Carlo Simulation by Differential Evolution with Self-Adaptive Randomized Subspace Sampling, Int. J. Nonlin. Sci. Numer. Simul., 10, 273–290, https://doi.org/10.1515/IJNSNS.2009.10.3.273, 2009. a
Wang, J., Hong, Y., Li, L., Gourley, J. J., Khan, S. I., Yilmaz, K. K., Adler, R. F., Policelli, F. S., Habib, S., Irwn, D., Limaye, A. S., Korme, T., and Okello, L.: The coupled routing and excess storage (CREST) distributed hydrological model, Hydrolog. Sci. J., 56, 84–98, https://doi.org/10.1080/02626667.2010.543087, 2011. a, b
Wasko, C. and Guo, D.: Understanding event runoff coefficient variability across Australia using the hydroEvents R package, Hydrol. Process., 36, e14563, https://doi.org/10.1002/hyp.14563, 2022. a
Wasko, C., Guo, D., Ho, M., Nathan, R., and Vogel, E.: Diverging projections for flood and rainfall frequency curves, J. Hydrol., 620, 129403, https://doi.org/10.1016/j.jhydrol.2023.129403, 2023. a, b
Zittis, G., Bruggeman, A., and Lelieveld, J.: Revisiting future extreme precipitation trends in the Mediterranean, Weather Clim. Extrem., 34, 100380, https://doi.org/10.1016/j.wace.2021.100380, 2021. a