the Creative Commons Attribution 4.0 License.
the Creative Commons Attribution 4.0 License.
 | 07 May 2018
Technical note: Space–time analysis of rainfall extremes in Italy: clues from a reconciled dataset
Andrea Libertino
Daniele Ganora
Pierluigi Claps
Like other Mediterranean areas, Italy is prone to the development of events with significant rainfall intensity, lasting for several hours. The main triggering mechanisms of these events are quite well known, but the aim of developing rainstorm hazard maps compatible with their actual probability of occurrence is still far from being reached. A systematic frequency analysis of these occasional highly intense events would require a complete countrywide dataset of sub-daily rainfall records, but this kind of information was still lacking for the Italian territory. In this work several sources of data are gathered, for assembling the first comprehensive and updated dataset of extreme rainfall of short duration in Italy. The resulting dataset, referred to as the Italian Rainfall Extreme Dataset (I-RED), includes the annual maximum rainfalls recorded in 1 to 24 consecutive hours from more than 4500 stations across the country, spanning the period between 1916 and 2014. A detailed description of the spatial and temporal coverage of the I-RED is presented, together with an exploratory statistical analysis aimed at providing preliminary information on the climatology of extreme rainfall at the national scale. Due to some legal restrictions, the database can be provided only under certain conditions. Taking into account the potentialities emerging from the analysis, a description of the ongoing and planned future work activities on the database is provided.
- Article
(1547 KB) -
Supplement
(3694 KB) - BibTeX
- EndNote


Italy can boast of a role at the highest level in the development of meteorological observations (Brunetti et al., 2006), with 6 meteorological stations operating since the 18th century (Bologna, Milano, Roma, Padova, Palermo and Torino), and 15 stations with observation starting in the first half of the 19th century. The first attempts of performing a systematic collection of monthly rainfall data go back to as early as 1880 when the National Office for Meteorology and Climate was founded. The National Hydrographic Service (SIN) and the National Hydrographic and Mareographic Service (SIMN) collected annual maxima values for 1, 3, 6, 12 and 24 h durations in the Hydrological Yearbooks from 1917 to early 2000s (the final publication year depends on the local agencies of the SIMN). The D.Lgs 112/1998 dismantled the SIMN, transferring its tasks to the 19 administrative regions and the 2 autonomous provinces of Trento and Bolzano. These authorities were designated as local Operational Centres and Regional Environmental Agencies to deal with hydro-meteorological monitoring and civil protection issues.
In spite of the huge heritage of data, only a small fraction of the Italian rainfall data is available in a computer-readable format. Moreover, the dismantlement of the National Service led to a lack of updates for the national database of extreme rainfall that is still stuck, for some regions, at the beginning of the 1990s. This has led to a very fragmented framework: updated rainstorm hazard assessments are actually only available for some regions and only at the regional scale (see, e.g. Uboldi et al., 2014; Libertino et al., 2017). Various regional studies present different methodologies and are sometimes based on very different data densities and record lengths (e.g. Claps et al., 2016), but few updated analyses on short-duration rainfall in a regional framework are available (e.g. Rudari et al., 2005; Allamano et al., 2009).
In view of the assembling of the first comprehensive dataset of extreme rainfall of short duration in Italy several major sources of data have been analysed. The resulting dataset, referred to as the Italian Rainfall Extremes Database (I-RED), includes data from more than 4500 stations across the country, spanning the period between 1916 and 2014, and refers to annual maximum rainfall recorded in 1 to 24 consecutive hours (exact durations available are 1, 3, 6, 12 and 24 h).
The following sections describes the sources of the data, the work carried out for the merging of the database and the operations that are still required for making it suitable for nationwide robust rainfall frequency analyses. A preliminary analysis of the extreme rainfall regime at the national scale is also presented.
2.1 Data sources
As a follow-up of the activities of the Italian National Group for the Prevention of the Hydrogeological Disasters (GNDCI) a comprehensive nationwide hydrological information system has been set up, within the “CUBIST project”, funded by the Italian Ministry of Education and Research within the funding PRIN 2005 (Italian Research Projects of National Relevance). The database includes about 6000 pluviographs and pluviometers, 700 temperature stations and about 400 river basins (Claps et al., 2008) and is available at http://www.cubist.polito.it; (last access: 26 October 2017). In detail, the database includes rainfall data from 1900 to 2001 (depending on the region) and constitutes the first important attempt to make the large Italian hydrological heritage freely available in a computer-readable format. The annual maxima data for different durations included in the CUBIST dataset are extracted with a sliding-windows process from manual tipping-bucket rain gauge data, equipped with a recording system that writes on diagram paper. Further information on the characteristics of the stations can be found in Acquaotta et al. (2016). The number of data per year is not constant across the analysed period, as it has increased in time as more stations have been installed in recent years. Data availability decreases in the period of the Second World War, as many records were missed in that period. After 1980, with the progressive dismissal of the SIMN and the development of the local hydrographic authorities, data availability decreases rapidly until 2001, when the rain gauges still under the SIMN were taken over by the local operational centres.
After the late 1980s, indeed, the local environmental agencies started to support the SIMN in its work. Gradually, the 21 regional hydrological services took over the networks and the tasks of the national one. In this period most of the old manual tipping-bucket rain gauges have been substituted with automatic stations, similar to the one described in Acquaotta et al. (2016) for the Piedmont region. Each hydrological service adopted its own rules for the publication of the collected data and, even if the Italian law adopted an open-source policy for the public data for non-commercial uses (under D.Lgs.82/2005, D.Lgs.36/2006, D.M.10/11/2011, L.221/2012, D.Lgs.179/2012 and L.114/2014), an updated database of the annual rainfall maxima for sub-daily duration at the national scale is still lacking. For the scope of this research, the different agencies have been contacted, and the regional annual maxima datasets for sub-daily durations were requested. The regions of Italy are shown in Fig. 1 together with the type of data provided, which will be described in the following section. Table 1 lists the names of the local authorities and the regional codes, aimed at identifying them in the database. The public availability of the original dataset is also reported.
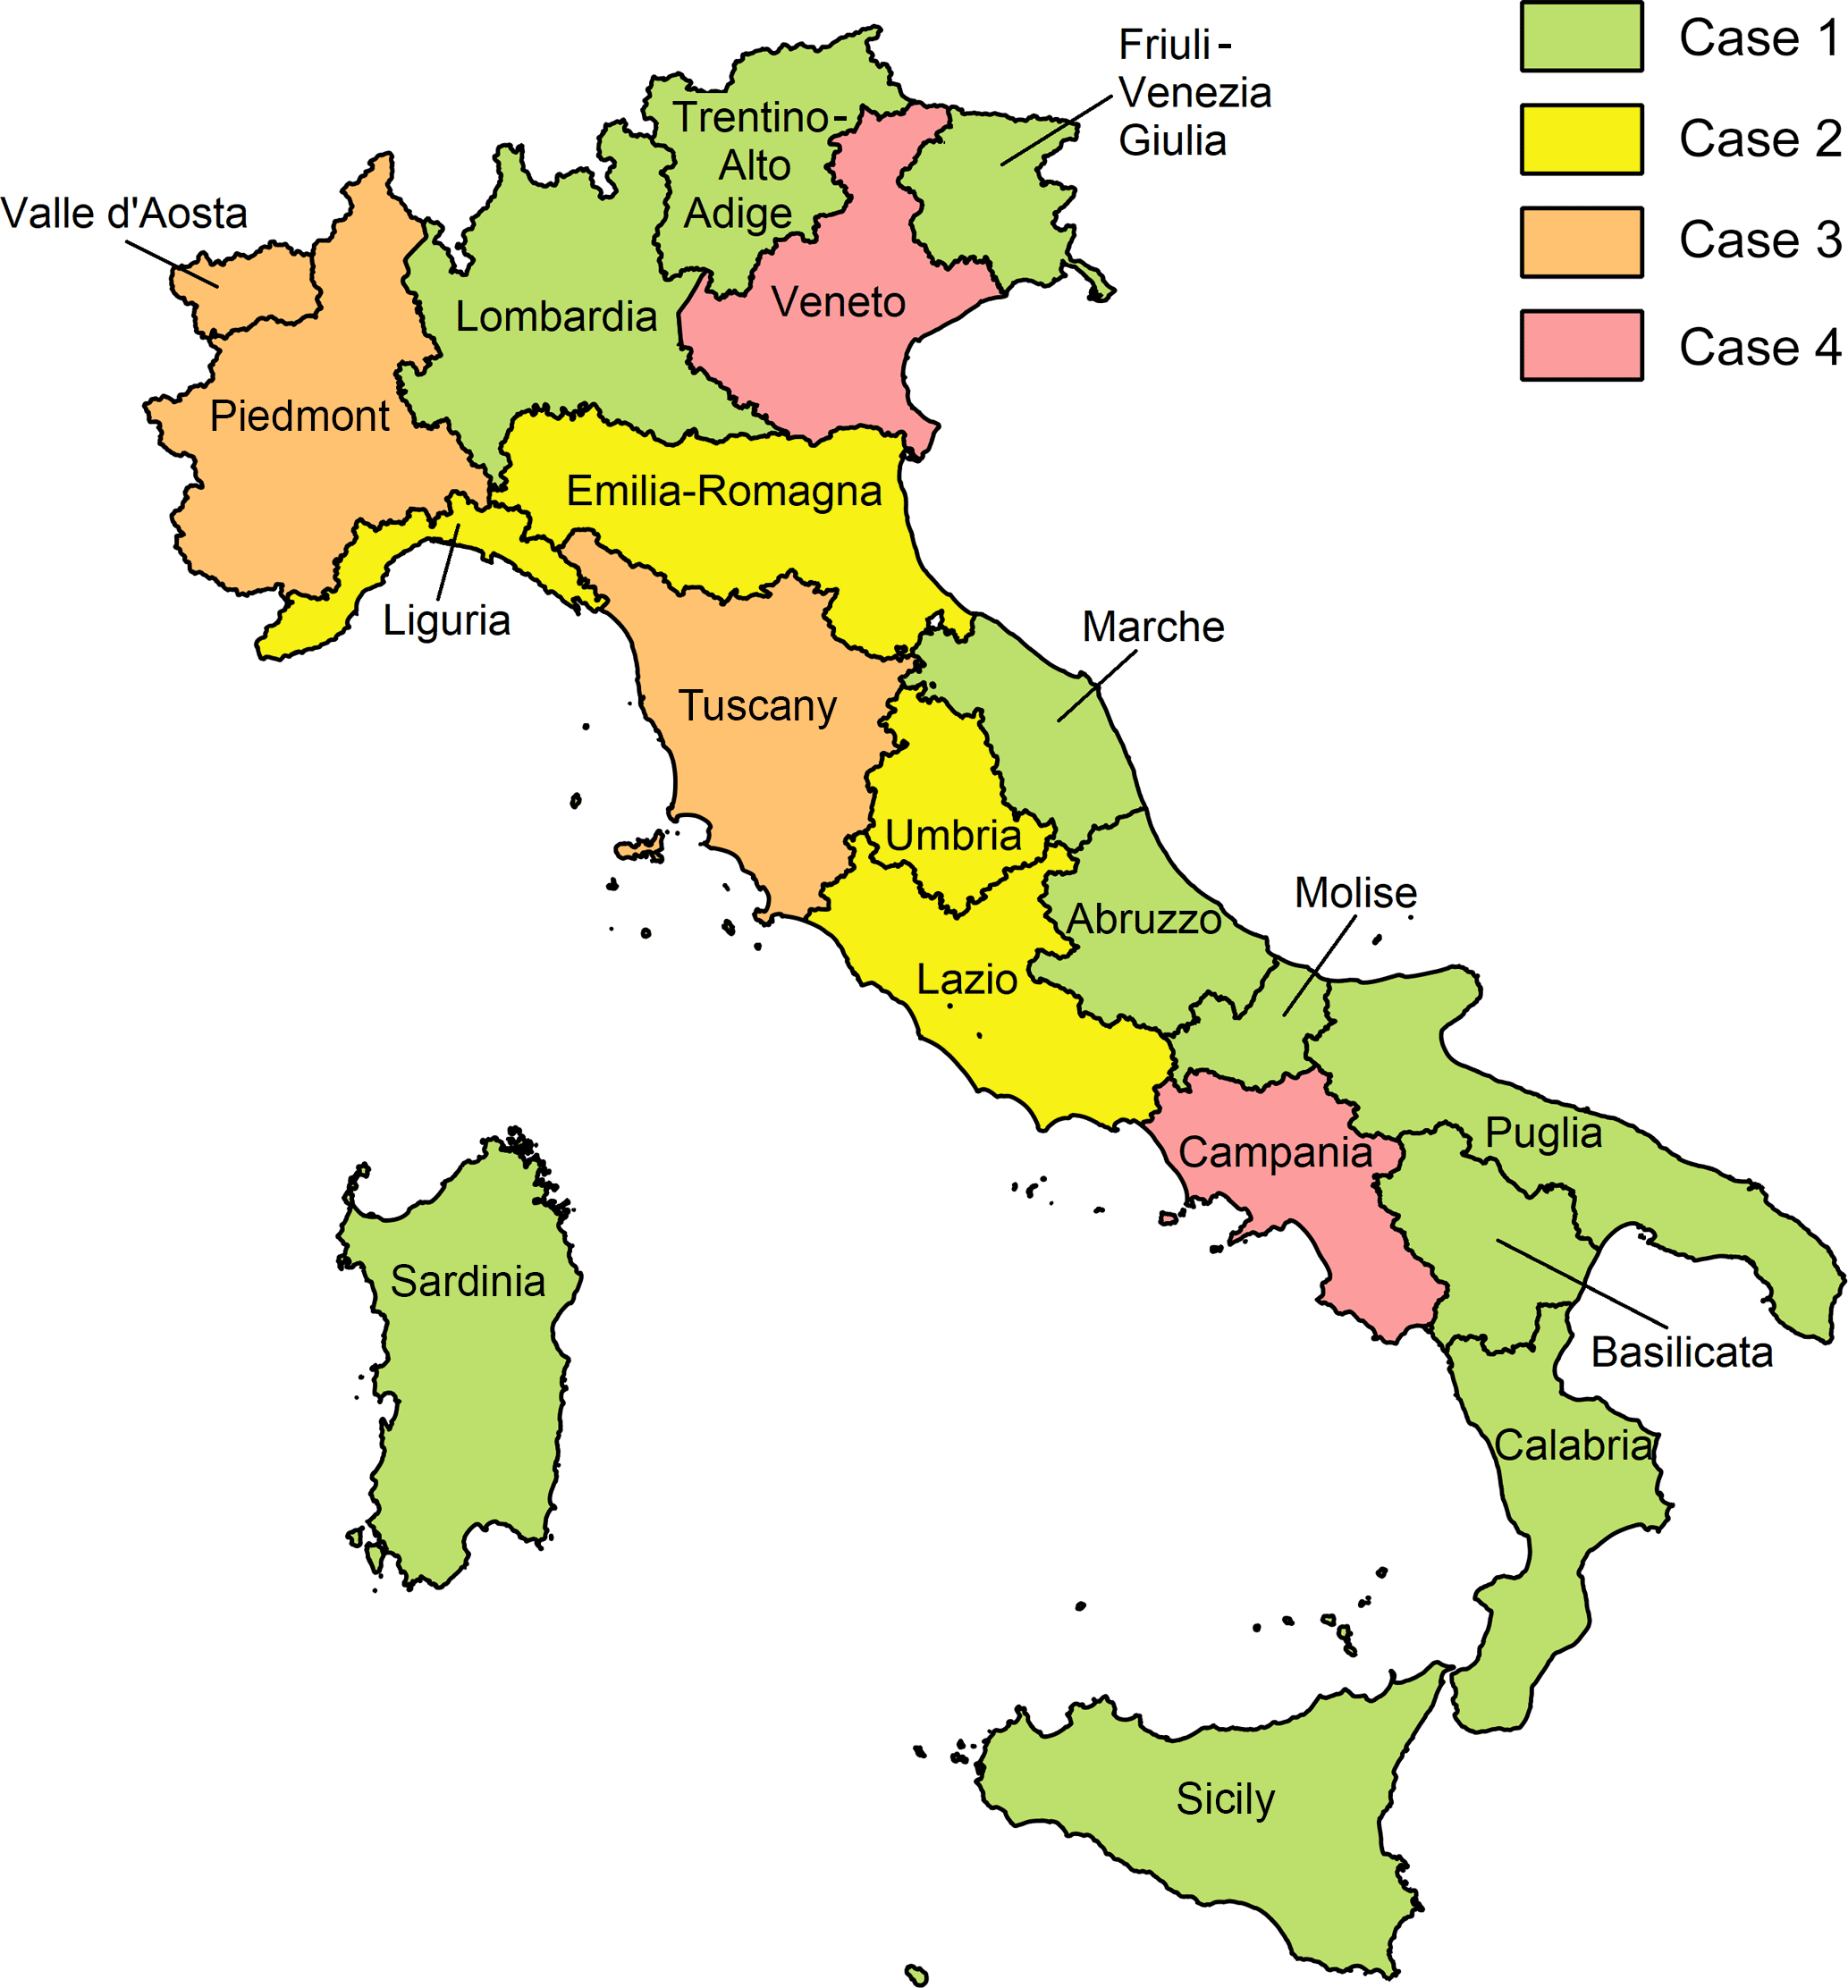
Figure 1Names of the Italian regions and type of datasets provided by the regional authorities. The cases refer to the bullet list of Sect. 2.2.
Table 1Regions of Italy with the assigned code and the related local Operational Center with references to the availability of digitized data.
1 Manfreda, S., Sole, A. and De Costanzo, G.:
Le precipitazioni estreme in Basilicata, Editrice Universo Sud, 2015.
2 ARPACAL: Centro Funzionale Multirischi,
http://www.cfd.calabria.it/, (last access: 1 August 2016).
3 ARPAL: Consultazione Dati Meteoclimatici,
http://www.cartografiarl.regione.liguria.it/SiraQualMeteo/Fruizione.asp, (last
access: 1 August 2016).
4 ARPA Lombardia: Progetto Strada, http://idro.arpalombardia.it/pmapper-4.0/map.phtml, (last
access: 1 August 2016).
5 Protezione Civile Regione Marche: Annali Idrologici Regione Marche,
http://console.protezionecivile.marche.it, (last
access: 1 August 2016).
6 ARPA Piemonte: Banca dati meteorologica,
http://www.regione.piemonte.it/ambiente/aria/rilev/ariaday/annali/meteorologici, (last
access: 1 August 2016).
7 Protezione Civile Puglia: Annali Idrologici – Parte I,
http://www.protezionecivile.puglia.it/centro-funzionale/analisielaborazione-dati, (last
access: 1 August 2016).
8 SIR Toscana: Settore Idrologico Regionale, http://www.sir.toscana.it/, (last
access: 1 August 2016).
9 Centro Funzionale di Protezione Civile Provincia Autonoma di Trento:
Meteotrentino, http://www.meteotrentino.it/, (last
access: 1 August 2016).
10 the autonomous provinces of Trento and Bolzano–Alto Adige, together, constitute the region Trentino-Alto Adige (CD: 22).
2.2 Cleaning and merging operations
Merging and harmonizing the different datasets is a quite long and difficult operation, that is still ongoing. The different operational centres provided different types of datasets, with different temporal coverages and spatial reference systems. Duplicate stations are often present in the databases of neighbouring regions.
The first steps of this work have been carried out at the regional scale. For each region all the data falling inside the regional boundaries have been considered. These data, according to the setting of the databases of the local operational centres, could belong to one of these three categories:
-
data from the CUBIST database for the 1900–2001 period already available from the former national service
-
data provided by the regional authority
-
data provided by the regional authorities of the neighbouring regions that extend beyond their regional borders.
Observations dating from before 1916 have been discarded, as they are considered not significant and too unevenly distributed. Considering that most of the provided data have been validated from the related authorities, they are considered reliable and, at first, included directly in the I-RED. For information on the validation procedures, please refer to the Appendix Appendix A and to Barbero S. et al. (2017). In the presence of inconsistencies between the type (b) and type (c) data, preliminary manual merging was carried out. The sources of the inconsistencies could be various, according to the evolution of the monitoring systems of the different regions, and these inconsistencies are often due to the joint management of interregional basins. The different regional authorities often have adopted different codes and/or names for the same station, the first step has been thus to identify the presence of duplicate stations with the same or a similar name covering different time intervals. Sometimes, even for the same station, neighbouring regions can provide different data for the same years. This can be, for example, due to the fact that sometimes regions share rainfall data before their validation and official publication. If the same station was found in the database of more neighbouring regions, the first attempt of merging the series together was carried out by analysing the data recorded year by year. If the merging was not feasible, higher priority was given to the data provided by the authority of the considered region (that is usually also the owner of the network). This allowed the presence of duplicate series in the I-RED to be avoided.
Once the type (b) and type (c) datasets were merged for each region,, the resulting dataset has to be merged with the type (a) dataset. This operation has been quite complex, as the overlapping period between the different dataset was different for each region and because most of the authorities did not track the change in the name and code of the stations. The different procedures performed, according to the type of the dataset that the region has provided (as reported in Fig. 1) can be summarized as follows:
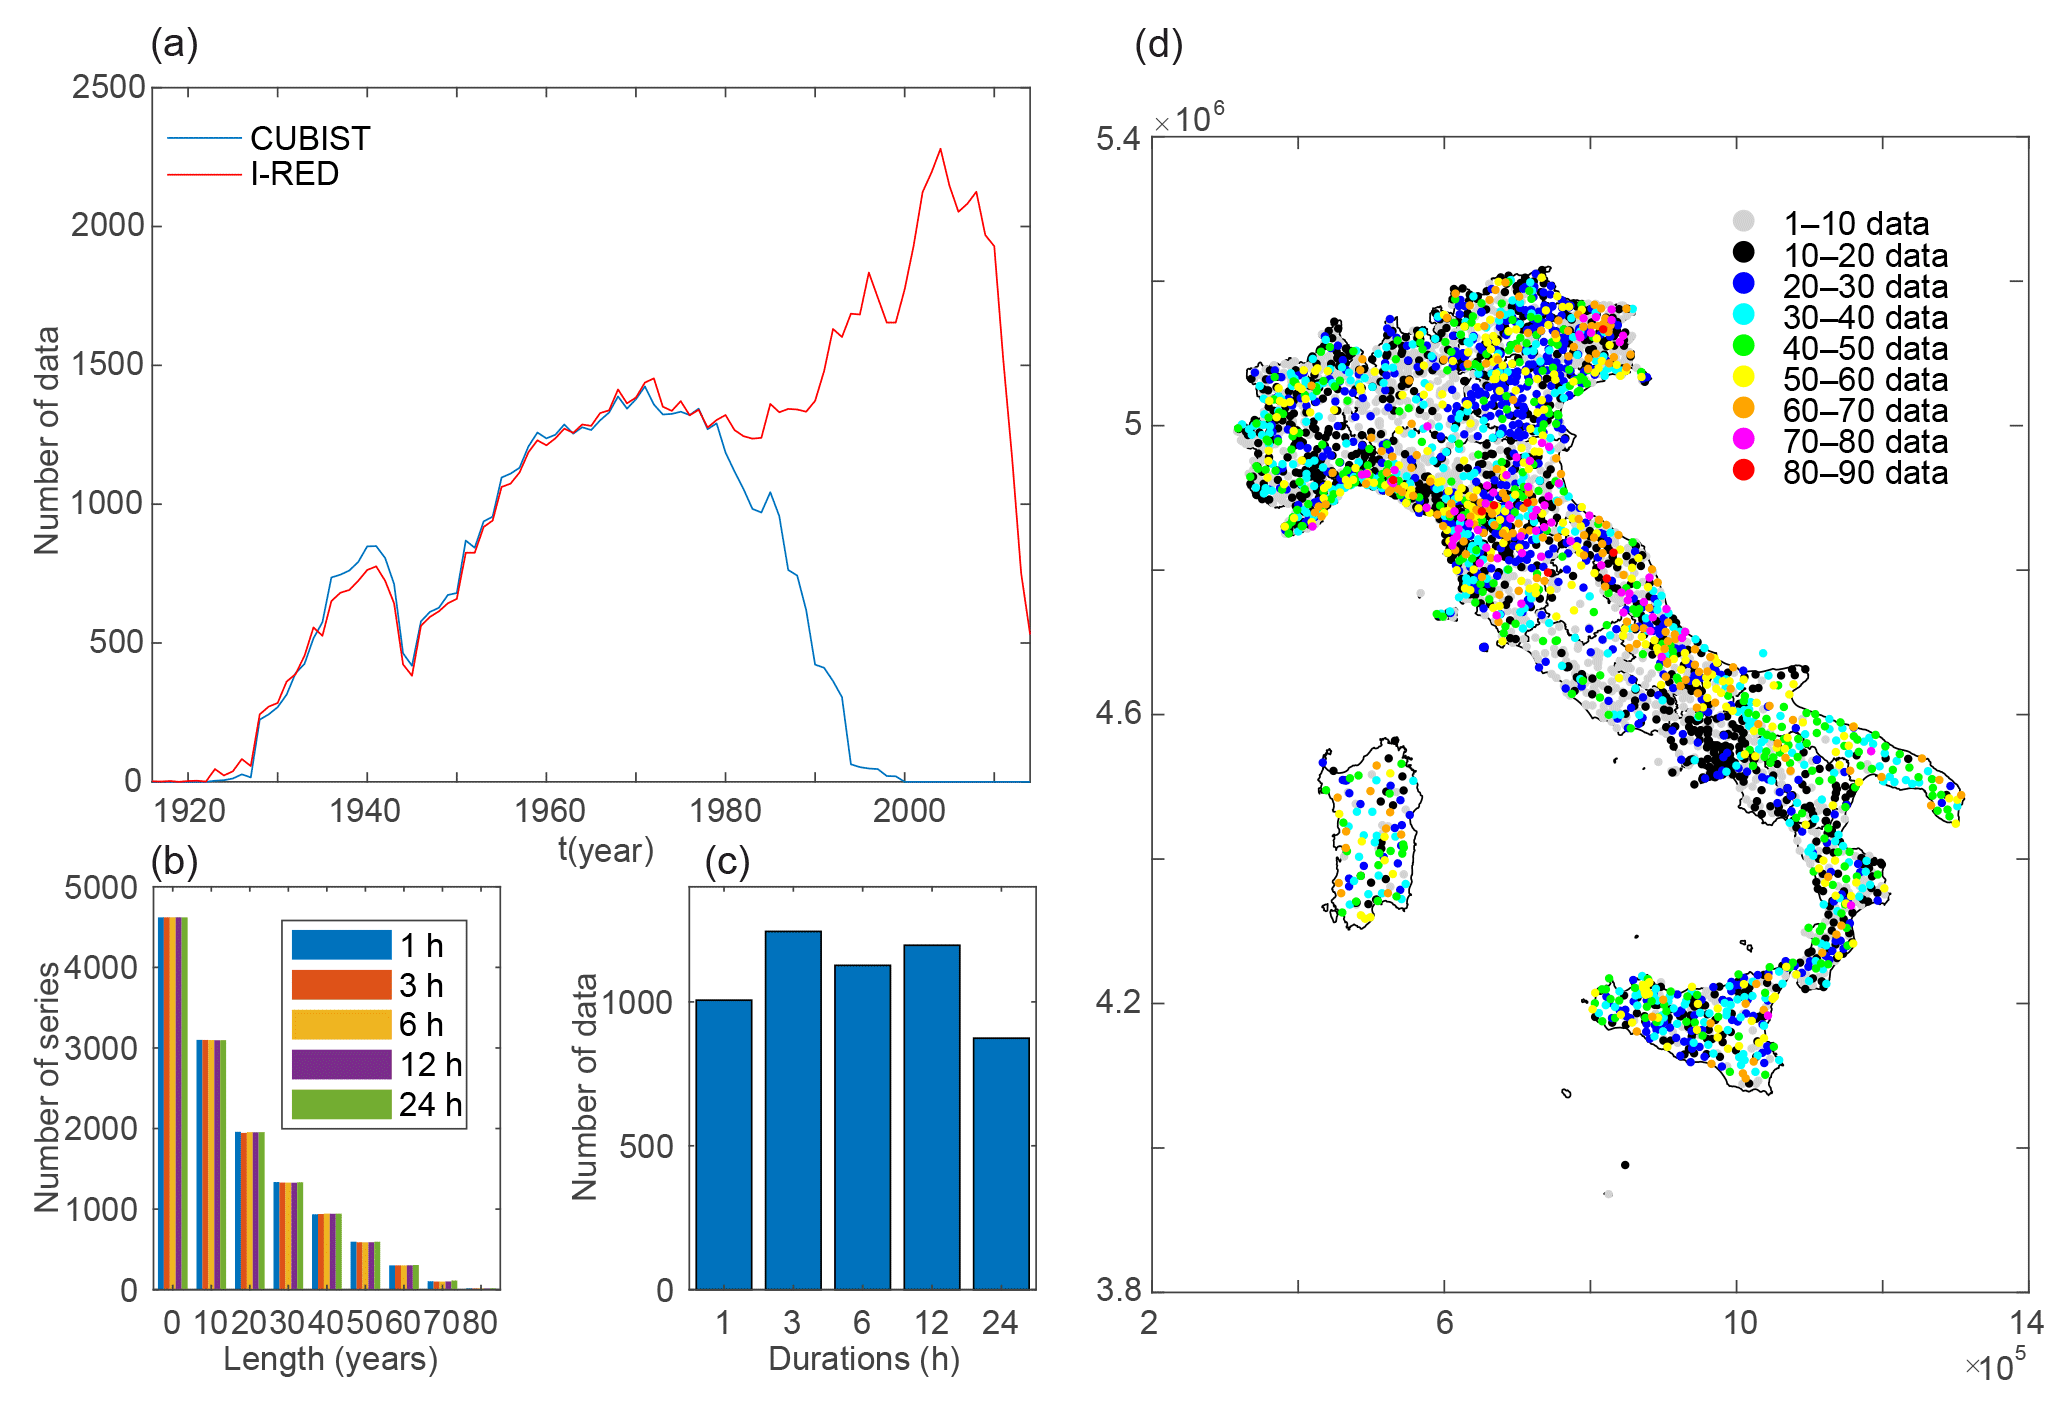
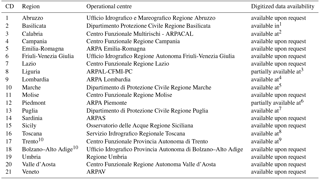
Figure 2(a) Data availability per year in the I-RED and CUBIST databases (the smallest value across the five considered durations is reported per year). (b) Number of series longer than fixed threshold values in the I-RED databases per duration (null values are ignored). (c) Number of null values per duration. (d) Length of the series in the I-RED database represented in space: the colour refers to the minimum length among the five available durations. If more stations overlap due to the resolution of the picture, the one with the longer series appears on the top.
-
Regions that digitized the whole SIMN database for their areal domain and provide a complete merged database. The provided data were inserted in the I-RED without editing and without considering the CUBIST series. Only for the Abruzzo and Molise regions some preliminary refinement was needed, as the two regions were divided in 1963, and the databases of the two regions partially overlap. The stations were then divided according to the actual regional boundaries and the duplicate series removed.
-
Regions that provided datasets including data from their actual regional network partially merged with subsets of digitized data from the SIMN Hydrological Yearbooks. As not all the SIMN datasets were digitized from the local authorities, the dataset lacked part of the stations included in the CUBIST database. To maximize the available information, data from the regional databases and the CUBIST one were manually analysed and merged, in order to avoid duplicate values. Stations with the same name and similar coordinates were merged together in the presence of a 2-year consistent overlapping period. In the presence of inconsistencies between the values recorded by the two stations in the overlapping period, they were treated as different stations and renamed. If it was not possible to remove any doubt, the stations were considered as separate entities. For the Liguria region, the information in ARPAL (2013) was used to overcome the lack of information on the continuity of the series.
-
Regions that provided two different datasets: one containing the whole digitized data from the SIMN stations and another containing the digitized data from their actual networks. The data of the two databases were merged together, the overlapping period manually analysed to avoid overlapping, and the CUBIST database ignored. The operation was made possible by the collaboration of ARPA Piemonte, for Piedmont and Valle d'Aosta, and of the Università degli Studi di Firenze, for Tuscany.
-
Regions that provided only the data recorded from the network they actually manage. All the information concerning the SIMN stations was lacking. The provided dataset was therefore merged with the whole CUBIST database for the considered regions. Duplicate values were excluded when manually analysing the overlapping period, if present.
With the application of the above described rules, 20 complete regional datasets have been obtained. The regional datasets were finally merged together to generate the I-RED. After the merging phase some reliability check has been performed, in order to detect any problematic or incorrect information. These include the identification and removal of the duplicate data or stations, and reliability checks on the larger values of the dataset, comparing them to the absolute record-breaking events for all the durations (see Libertino, 2017), aimed at detecting inconsistencies in rainfall series. If any suspect value was found, its year of occurrence was compared, when referring to recent years, with the data from event reports or newspapers. If the data refers to a SIMN station, the Hydrological Yearbooks were consulted. If no evidence was found, the related authority was contacted. Most of the operations need human supervision, and thorough verification work. If it is not possible to remove any doubt the suspect value is discarded.
Due to the complexity of the check operations, further efforts and collaborations with the regional authorities are still ongoing to increase the consistency of the database. Nevertheless, to date (October 2017) the I-RED includes more than 4500 stations nationwide and constitutes the largest updated dataset of annual maxima for Italy.
Considering that most of the regional authorities supervise the use and widespread dissemination of their datasets in order to prevent improper use, a detailed description on how to access the I-RED is reported in the Data Availability section.
In the following, the spatio-temporal distribution of the assembled data will be described.
The number of data available per year in the I-RED is reported in Fig. 2a, compared with that of the CUBIST database. As every station is related to a unique value of annual maxima for a given duration, the presence of a measurement implies the presence of a station. The number of available stations increases with time, and drastically grows after the dismissal of the SIMN and the development of the local agencies. The decrease after 2010 can be attributed to the fact that not all the regions have published the data for the most recent years.
The smaller size of the I-RED compared the CUBIST database in some years can be due to the following:
-
The presence, before 1945, in the CUBIST database of data from territories lost by Italy after World War II (e.g. Istria) or from neighbouring countries, not included in the I-RED;
-
The fact that some regional agencies could have decided for different reasons not to include data or stations from the SIMN in their datasets. Considering that these data are only contained in the CUBIST dataset, for the regions where the procedures (1) and (3) described in Section 2.2 are applied, they are not included in the I-RED.
Considering the limited significance of the information loss, further efforts for including these data will be planned only in a future stage of the development of the database.
For a descriptive analysis of the rainfall data, all the assembled time series are classified according to their length. Results are shown in Fig. 2b. Considering the short life of the rain gauges installed by the regional operational centres, a large percentage of the series is shorter than 20 years but the contribution of the CUBIST database allows for a significant amount of longer series. The series with more than 80 years of data for the 1, 3, 6, 12, 24 h durations are 16, 14, 15, 14 and 17 respectively. In general, all the durations report a similar behaviour, despite some differences in the distribution of the null values as shown in Fig. 2c. The reasons that lead to missing data only for certain durations can be various and related to either the measuring, the recording or the storage of the data (e.g. missed reading of the record from the operator, data classified as not-valid in the validation phase).
The spatial distribution of the stations is shown in Fig. 2d. The colour scale refers to the number of the available data per series. The minimum number across the five durations is considered. One can clearly distinguish that, even if the whole national territory is represented, the density of the stations widely changes across the nation. To show the relevance of the non-uniformity, a gridded domain with a mesh size of 50 km is introduced. Figure 3 shows the total number of data per cell, i.e., in the sum across the whole period of the annual number of stations with available data falling in the cell. If data consistency changes for the different durations, the shortest one is considered. The non-uniformity of the network density clearly emerges, with some cells presenting almost 10 times the number of data of other cells. The most densely gauged cells can be found in the north-west of the country, in particular in the Liguria region, in northern Tuscany and in the north-east.
A preliminary descriptive analysis of the characteristics of extreme rainfalls at the national scale has been carried out on the newly developed I-RED database. Series with a minimum length of 20 years of data have been considered in this analysis. This length constraint leads to a subset of 1974 series available for the analysis, out of the original 4686. For each duration, the median of the series is depicted in Fig. 4. The median is used as a robust estimator of the central tendency of a series, less sensitive than the mean to the presence of outliers. As common methods of fitting distributions (e.g. product moments or L-moments) use mean values for representing the central tendency, maps of the mean for the different durations are attached in the Supplement.
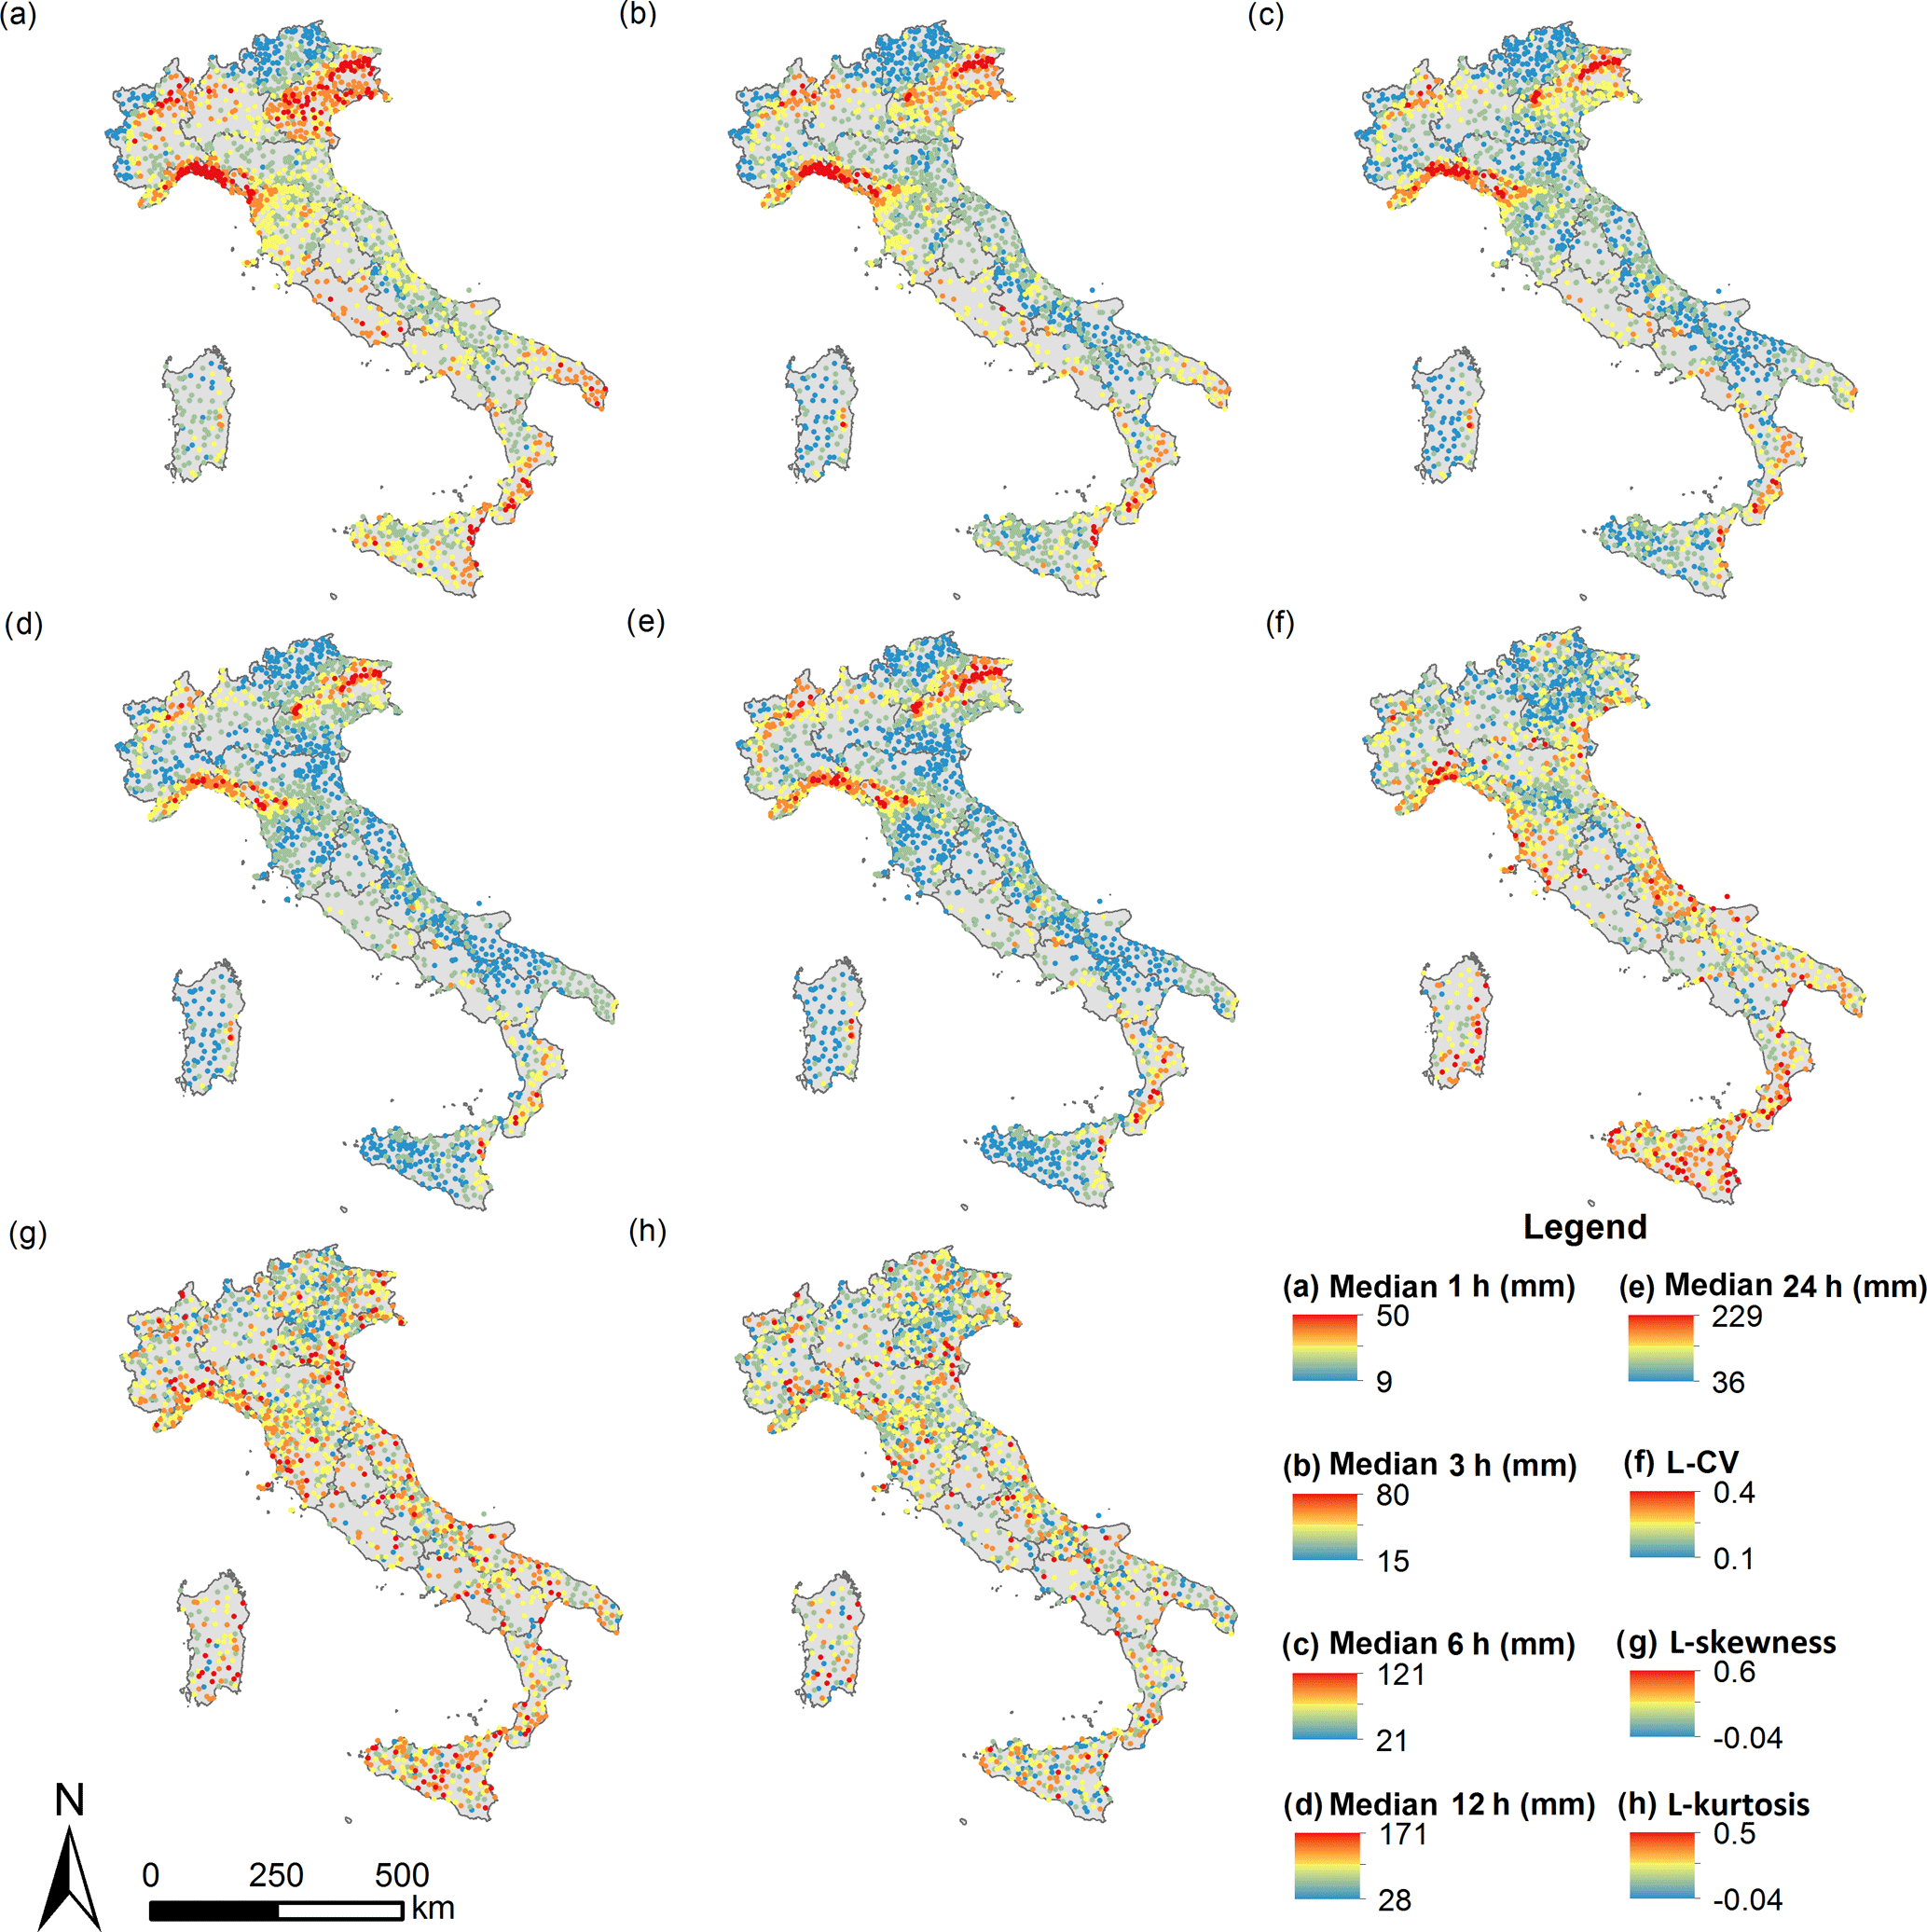
Figure 4Median values of the I-RED series from 1 (a) to 24 h (e). Average statistics for the five durations considered: (f) L-CV, (g) L-skewness and (h) L-kurtosis. Series with more than 20 data are considered.
Some geographical areas are characterized by clusters of large median values and these clusters appear consistent across the different durations. Furthermore, at the country-wide scale we observe that the coefficient of variation of the medians increases for increasing durations, suggesting a wider range of variability of the corresponding median values.
For each series, the sample L-moments (Hosking and Wallis, 1997) have then been computed to describe the shape of the empirical distribution of the records. The mean L-moment ratios among the different durations give information respectively on the dispersion (L-CV), skewness (L-skewness) and “peakedness” (L-kurtosis) of the empirical distributions. All the above statistics are mapped in Fig. 4. Considering that the L-moment ratios show similar behaviour for the considered durations, we decided for simplicity to include only the average ones in the paper. The maps for the different durations are reported in the Supplement. Figure 4f shows that the coastal areas and the islands are generally characterized by a higher variability in the annual maxima series, presenting larger L-CV values. The northern part of the peninsula, even if characterized by large median values, shows lower L-CV, which is typical of areas with large average rainfall values. It is harder to identify a precise spatial pattern in the distribution of the skewness and kurtosis values (Fig. 4g and h). Coastal and island areas seem to generally show larger skewness values, confirming the influence of the Mediterranean Sea on the climate of these areas. All the aforementioned maps have been also interpolated for visualization purposes with ordinary kriging; detailed results are reported in the Supplement.
The significance of the developed dataset also allows preliminary exploration of the rainfall events sometimes referred to as “black swans” (Blöschl et al., 2015), showing extraordinary intensities even when compared with the population of annual maxima. In Italy, many of these events have been studied as individual extraordinary events (e.g. Rebora et al., 2013; Fiori et al., 2014), due to the large recorded intensities and to their severe consequences, but the fragmented configurations of the national database have prevented a systematic treatment of this population of “extremes of the extremes” (Snorrason et al., 2002). A preliminary investigation on the occurrence of very extreme events at the national scale has been performed and summarized in Fig. 5a, which shows the spatial distribution of the record-breaking rainfall events for the considered durations from 1935 to 2015. A record-breaking event is defined as the annual value that exceeds all the previous ones. At this stage, only nationwide records are considered, pulling up all the data together year by year. Record-breaking rainfall amounts can provide a picture of the spatio-temporal distribution of the major weather anomalies in the country. Analysing record-breaking events has some advantages from both an operational and a statistical point of view. Due to the significant amounts recorded, these events can be easily verified by combining different sources of information, and, moreover, this kind of analysis does not require any assumption on the underlying probability distribution (Coumou et al., 2013). The spatial distribution of the events seems to suggest a clustering of these phenomena in some areas of the country: the eastern part of Liguria and northern part of Tuscany and the extreme south of Calabria. Localized events also occurred in Campania, Sicily and Sardinia. All of these areas are generally characterized by complex orography in the proximity of the coastline: a framework that can promote the development of particularly intense phenomena (Furcolo et al., 2015). On-site systematic analysis of the record-breaking events, which are expected to provide useful information for characterizing the extreme rainfall regime in the country (Lehmann et al., 2015), is now possible thanks to the consistency of the new I-RED database. Figure 5b shows the record-breaking evolution over time (for each duration); the occurrence of a new records is represented by an increasing step in the line. Figure 5c reports the same records, whose values are normalized by the 1935 values.
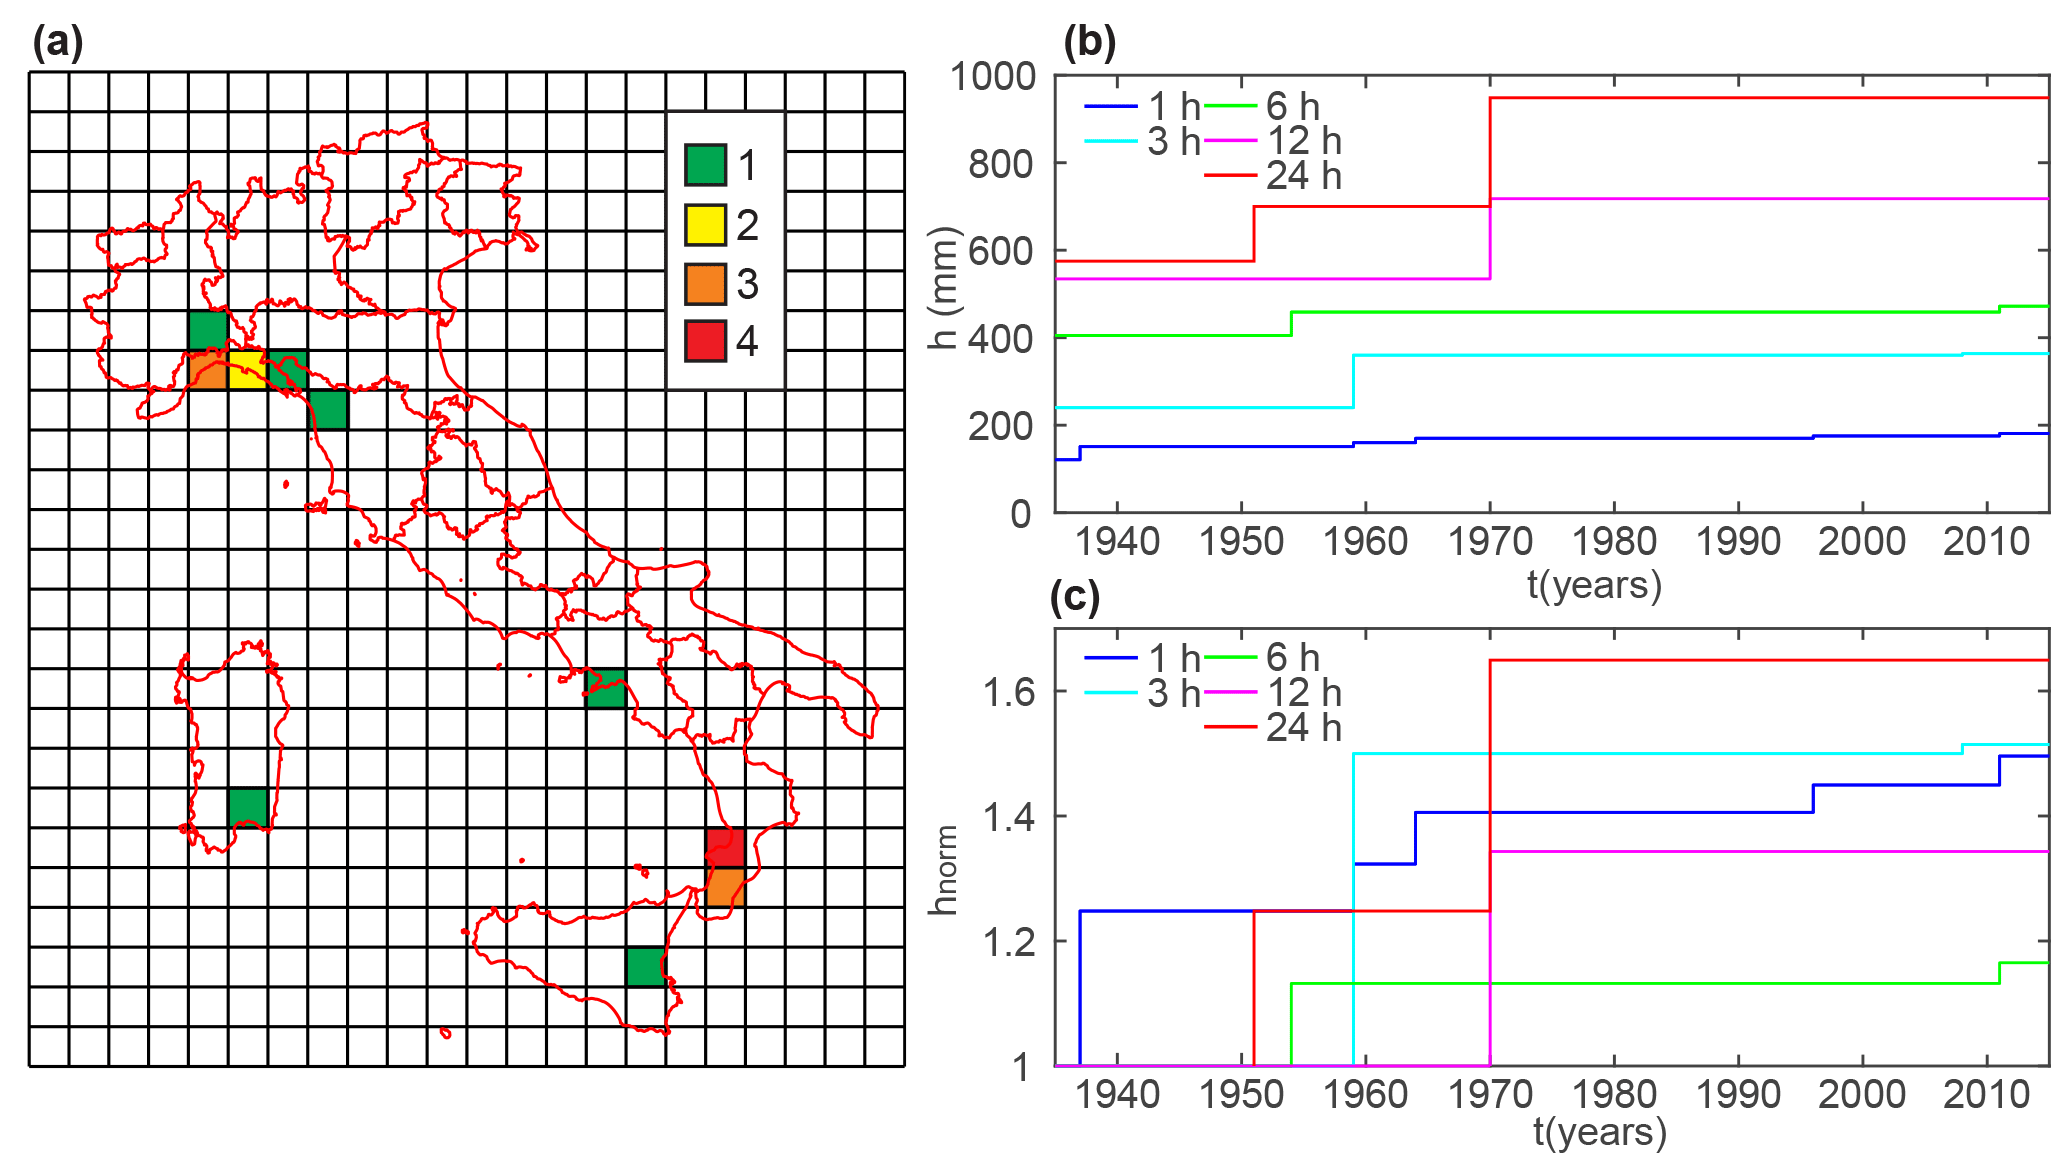
Figure 5(a) Number of record-breaking events per cell over a 50 km grid. Record-breaking rainfall depths for the five considered durations from 1935 to 2015 (b) in absolute values and (c) normalized against the 1935 values.
The first comprehensive dataset of extreme rainfall in Italy, called I-RED, has been presented here. It is a significant source of information, able to provide unprecedented knowledge on the characteristics of heavy precipitation in Italy and on the possible rainfall regime changes in the last century. Further efforts will be addressed to increase the spatial data homogeneity and coverage in time, by including the data of the most recent years and, eventually, by contacting the local authorities for requesting assistance in the merging of the series. The final aim is to make the update of the database systematic and unsupervised. This can be done by strengthening the collaboration with the data providers, in the framework of joined projects, as did the one that led to the development of the ArCIS (Pavan et al., 2013) dataset, collecting updated rainfall and temperature data from a group of regional authorities in northern Italy. Collaborations with other projects, focused on different spatial or temporal scales, will be also explored in order to automatically and efficiently analyse the consistency of the I-RED dataset and to integrate it with the existing ones. A possible target is the SCIA dataset (Desiato et al., 2007) referring to the 24 h and daily scale. Joined projects with international institutions will be evaluated and endorsed in order to make available the I-RED database in larger frameworks for trans-boundary exchange of precipitation data. In the meantime the I-RED will be used for exploring the different outcomes provided by this preliminary analysis, e.g. assessing the influence of the spatial distribution of the stations on the observation of record-breaking extreme events, evaluating the presence of trends in the temporal distribution of the “black swans” and analysing the statistical predictability of these kind of events on such a wide and complex domain.
The original data can be requested to the authorities reported in Table 1. Some of the agreements signed with the data providers, aimed at monitoring the correct use of the data, restrict their use to the aims of the authors' project. Due to these legal restrictions, the full or partial access to the I-RED can be provided to the following:
-
research individuals or groups in the framework of the authors' project;
-
research individuals or groups not collaborating with the authors' project, upon evidence of permission received by the involved regional agencies, reported in Table 1.
For further details and queries, please contact the corresponding author.
Extracted and translated in English from Barbero S. et al. (2017).
A1 Quality control
[…] The attribution of a certain level of quality to the measured data passes through the process of validation of the data themselves, which consists of analysing all the data collected in terms of completeness, reasonableness and eliminating erroneous values. Data validation (validity check) is only one of the quality control (QC) operational procedures consisting of a set of procedures and rules to ensure that a measurement system achieves and maintains the specific quality level initially established. The periodic calibration of the instruments, the periodic inspection of the sites and the preventive maintenance also belong to the QC process. The QC can be applied both in real time (real-time quality control) and in delayed time, according to the needs of sharing, using and storing data nationally and internationally (e.g. World Meteorological Organization, 1993, 2010a, b). Moreover, the QC must be integrated into effective and well-coordinated quality management (QM). The QM is, in fact, is expressed through the joint application of quality assurance (QA) and of the QC (World Meteorological Organization, 2014). The QA is the set of planned and systematics activities applied within a quality management system to provide the level of confidence with which the quality requirements are met. Basically, the QC is a system of activities to provide a quality product while the QA is a system of activity designed to verify that the quality control system is functioning properly. The main objectives of the QM are the identification, quantification and reduction of errors. Errors can be made for both technical reasons (i.e. due to the methods and technologies used) and procedural reasons (i.e. linked to unclear or ineffective management or to the lack of adequate preparation of the operators). Furthermore, errors can be made during detection (e.g. the sensor does not read correctly), when the observation is transcribed (transposition of digits, shifting of dates, etc.) and during data transmission and storage (computer errors, errors of digitization, etc.). Many of these errors can be prevented by an appropriate QA, others must be identified and corrected through the QC procedures.
A2 Levels of the validity check
The first level of data validation is performed on the raw data (or gross data), i.e. the data at the original temporal resolution with which they are transmitted or detected at the measuring station and consists of the application of basic procedures for verifying the validity of the data. These checks aim at indicating malfunctions, instability or interference. In the case of data coming from automatic measuring stations the validity checks are applied to the “meteorological message” coming from the station in the transcoding phase of the message that for the transmission must comply with certain rules. The checks carried out will therefore be related to the expected formats within a given message, to the date and time stamps, to the location of measuring station, to the codes of stations and sensors and to the presence of duplicate elements. This category of checks includes syntax controls (e.g. alphabetic characters appearing in a text that should be numeric) which, if incorrect, can mine the transcoding process; logical controls that refer to both the intrinsic characteristics of the magnitude (e.g. World Meteorological Organization, 1993) and to the limits imposed by technical characteristics of the instrument used, in terms of measuring range (e.g. for a rain gauge: 0–300 mm h−1), resolution (e.g. for a rain gauge: 0.1 or 0.2 mm) and limits in the operating temperatures (e.g. 0–70 ∘C for an unheated or −30–70 ∘C for a heated rain gauge). The first level of controls can have three types of outcomes: control passed, suspected data or control not passed. In the first two cases the data is then subjected to subsequent checks; in the third the data is considered incorrect and discarded. The first-level controls are performed on the elementary data, i.e. the data to the temporal aggregation derived from the measurement station. At this stage it is appropriate also carry out internal consistency checks. These are checks that are based on the comparison between synchronous values of different variables somehow related (e.g. by physical laws), so as to highlight any inconsistencies between the data. The second level of data validation consists of a series of “consistency” checks:
-
Time consistency checks. They are based on the verification of a maximum and minimum level of variability of data over time and they have the purpose of identifying any anomalies between temporally contiguous data or with respect to the values that have historically occurred at a given site. Concerning the allowed minimum variability, consistency verification procedures ascertaining the presence of persistence of measured values in the series, consisting in the lasting over time of the same or a similar value.
-
Cross-checks with other quantities recorded at the same station. They are based on the control of the considered data with reference to other related quantities measured at the same site, e.g. temperature comparison with solar radiation.
-
Spatial consistency checks. They are based on the hypothesis of gradual variability of the observed quantity in space and therefore on the existence of a sort of spatial correlation between the contemporaneous measures carried out in neighbouring stations. However, when dealing with rainfall, the hypothesis of gradual variability is less acceptable when smaller temporal aggregations are considered.
-
Climatological checks. They are based on comparing the quantity under examination with some parameters derived from the whole historical series (e.g. tests based on the comparison with percentiles calculated on specific time intervals). The data are validated, at first, using automatic procedures. However, for the evaluation of the so-called “suspicious” data, a manual revision by qualified personnel is required to decide for every case to validate the suspect data, reject it as not valid or fix it if possible.
The supplement related to this article is available online at: https://doi.org/10.5194/hess-22-2705-2018-supplement.
The authors declare that they have no conflict of interest.
The authors thank Enrica Caporali and Valentina Chiarello for their
assistance in preparing and screening the Tuscany regional dataset, Stefano
Macchia for his contribution in collecting and cleaning the data and the
insightful comments of Alberto Montanari, three anonymous reviewers and the
handling editor that allowed the quality of the
original manuscript to be significantly improved. Data providers reported in Table 1 are
acknowledged.
Edited by: Matjaz Mikos
Reviewed by: Alberto Montanari and three anonymous referees
Acquaotta, F., Fratianni, S., and Venema, V.: Assessment of parallel precipitation measurements networks in Piedmont, Italy, Int. J. Climatol., 36, 3963–3974, 2016. a, b
Allamano, P., Claps, P., Laio, F., and Thea, C.: A data-based assessment of the dependence of short-duration precipitation on elevation, Phys. Chem. Earth, 34, 635–641, 2009. a
ARPAL: Atlante Climatico della Liguria, Final report, Regione Liguria, available at: https://www.arpal.gov.it/contenuti_statici//clima/atlante/Atlante_climatico_della_Liguria.pdf Genova, IT, 2013. a
Barbero, S., Zaccagnino, M., Mariani, S., Lastoria, B., Braca, G., Bussettini, M., Casaioli, M., Marsico, L., Rotundo, R., Pavan, V., Ricciardi., G., Zenoni, E., Cicogna, A., Micheletti., S., Cazzuli., O., Di Priolo, S., Ranci, M., Rondanini, C., Bianco, G., Egiatti, G., Montanini, P., Saccardo, I., Campione, E., Pupillo, S., Iocca, F., Lazzeri, M., Tedeschini, M., Marzano, V., Schena, P., Licciardello, A., Manzella, F., Brunier, F., Ratto, S.: Linee guida per il controllo di validità dei dati idro-meteorologici (Guidelines for the quality check of hydrometeorological data), Resources in Italian, 156, ISPRA – Manuali e Linee Guida, Roma, 2017. a, b
Blöschl, G., Gaál, L., Hall, J., Kiss, A., Komma, J., Nester, T., Parajka, J., Perdigão, R. A. P., Plavcová, L., Rogger, M., Salinas, J. L., and Viglione, A.: Increasing river floods: fiction or reality?, Wiley Interdiscip. Rev. Cogn. Sci, 2, 329–344, https://doi.org/10.1002/wat2.1079, 2015. a
Brunetti, M., Maugeri, M., Monti, F., and Nanni, T.: Temperature and precipitation variability in Italy in the last two centuries from homogenised instrumental time series, Int. J. Climatol., 26, 345–381, 2006. a
Claps, P., Barberis, C., Agostino, M. D., Gallo, E., Laguardia, G., Laio, F., Miotto, F., Plebani, F., Vezzù, G., Viglione, A., and Zanetta, M.: Development of an Information System of the Italian basins for the CUBIST project, in: EGU General Assembly 2008, 2008. a
Claps, P., Caporali, E., Chiarello, V., R., D., De Luca, D., Giuzio, L., Libertino, A., Lo Conti, F., Manfreda, S., Noto, V., and Versace, P.: Stima operativa delle piogge estreme sul territorio nazionale: nuovi metodi e possibili sinergie, in: Atti del XXXV Convegno Nazionale di Idraulica e Costruzioni Idrauliche, 2016. a
Coumou, D., Robinson, A., and Rahmstorf, S.: Global increase in record-breaking monthly-mean temperatures, Clim. Change, 118, 771–782, 2013. a
Desiato, F., Lena, F., and Toreti, A.: SCIA: a system for a better knowledge of the Italian climate, B. Geofis. Teor. Appl., 48, 351–358, 2007. a
Fiori, E., Comellas, A., Molini, L., Rebora, N., Siccardi, F., Gochis, D., Tanelli, S., and Parodi, A.: Analysis and hindcast simulations of an extreme rainfall event in the Mediterranean area: The Genoa 2011 case, Atmos. Res., 138, 13–29, https://doi.org/10.1016/j.atmosres.2013.10.007, 2014. a
Furcolo, P., Pelosi, A., and Rossi, F.: Statistical identification of orographic effects in the regional analysis of extreme rainfall, Hydrol. Proc., 30, 1342–1353, 2015. a
Hosking, J. R. M. and Wallis, J. R.: Regional frequency analysis: an approach based on L-moments, Cambridge University Press, 1997. a
Lehmann, J., Coumou, D., and Frieler, K.: Increased record-breaking precipitation events under global warming, Clim. Change, 132, 501–515, 2015. a
Libertino, A.: Advances in the space-time analysis of rainfall extremes, Ph.D. thesis, Politecnico di Torino, 2017. a
Libertino, A., Allamano, P., Laio, F., and Claps, P.: Regional-scale analysis of extreme precipitation from short and fragmented records, Adv. Water Res., 112, 147–159, https://doi.org/10.1016/j.advwatres.2017.12.015, 2017. a
Pavan, V., Antolini, G., Agrillo, G., Auteri, L., Barbiero, R., Bonati, V., Brunier, F., Cacciamani, C., Cazzuli, O., Cicogna, A., De Luigi, C., Maraldo, L., Marigo, G., Millini, R., Panettieri, E., Ratto, S., Ronchi, C., Saibanti, S., Sulis, A., Tomei, F., Tomozeiu, R., Torlai, I., and Villani, G.: TS5 The ARCIS project, Ital. J. Agrometeorol., 2, 51–55, 2013. a
Rebora, N., Molini, L., Casella, E., Comellas, A., Fiori, E., Pignone, F., Siccardi, F., Silvestro, F., Tanelli, S., and Parodi, A.: Extreme rainfall in the mediterranean: what can we learn from observations?, J. Hydrometeorol., 14, 906–922, 2013. a
Rudari, R., Entekhabi, D., and Roth, G.: Large-scale atmospheric patterns associated with mesoscale features leading to extreme precipitation events in Northwestern Italy, Adv. Water Res., 28, 601–614, 2005. a
Snorrason, A., Finnsdóttir, H. P., and Moss, M. E.: The extremes of the extremes: extraordinary floods, ISBN=978-1-901502-66-4, IAHS publication, no. 271, Wallingford, International Association of Hydrological Sciences, 2002. a
Uboldi, F., Sulis, A. N., Lussana, C., Cislaghi, M., and Russo, M.: A spatial bootstrap technique for parameter estimation of rainfall annual maxima distribution, Hydrol. Earth Syst. Sci., 18, 981–995, https://doi.org/10.5194/hess-18-981-2014, 2014. a
World Meteorological Organization: Guide on the Global Data-processing System, 305, WMO, 1993. a, b
World Meteorological Organization: Manual on the Global Data-processing System, 485,1, WMO, 2010a. a
World Meteorological Organization: Manual on Global Observing System, 544,1, WMO, 2010b. a
World Meteorological Organization: Guide to Meteorological Instruments and Methods of Observation, 8, WMO, 2014. a
- Abstract
- Introduction
- Merging the I-RED Dataset
- Main features of the I-RED database
- Descriptive statistical analysis of rainstorms in Italy
- Conclusions
- Data availability
- Appendix A: Guidelines for the quality check of hydro-meteorological data
- Competing interests
- Acknowledgements
- References
- Supplement