the Creative Commons Attribution 4.0 License.
the Creative Commons Attribution 4.0 License.
 | 14 Feb 2024
Towards the definition of a solar forcing dataset for CMIP7
Thierry Dudok de Wit
Ilaria Ermolli
Margit Haberreiter
Doug Kinnison
Daniel Marsh
Hilde Nesse
Annika Seppälä
Miriam Sinnhuber
Ilya Usoskin
The solar forcing prepared for Phase 6 of the Coupled Model Intercomparison Project (CMIP6) has been used extensively in climate model experiments and has been tested in various intercomparison studies. Recently, an International Space Science Institute (ISSI) working group has been established to revisit the solar forcing recommendations, based on the lessons learned from CMIP6, and to assess new datasets that have become available, in order to define a road map for building a revised and extended historical solar forcing dataset for the upcoming Phase 7 of CMIP. This paper identifies the possible improvements required and outlines a strategy to address them in the planned new solar forcing dataset. Proposed major changes include the adoption of the new Total and Spectral Solar Irradiance Sensor (TSIS-1) solar reference spectrum for solar spectral irradiance and an improved description of top-of-the-atmosphere energetic electron fluxes, as well as their reconstruction back to 1850 by means of geomagnetic proxy data. In addition, there is an urgent need to consider the proposed updates in the ozone forcing dataset in order to ensure a self-consistent solar forcing in coupled models without interactive chemistry. Regarding future solar forcing, we propose consideration of stochastic ensemble forcing scenarios, ideally in concert with other natural forcings, in order to allow for realistic projections of natural forcing uncertainties.
- Article
(631 KB) - Full-text XML
- BibTeX
- EndNote


Back in 2017, solar forcing recommendations for Phase 6 of the Coupled Model Intercomparison Project (CMIP6) were provided that covered, for the first time, all relevant solar irradiance and energetic particle precipitation (EPP) contributions (Matthes et al., 2017, hereinafter referred to as M17). Since that time, new datasets have become available, both for the solar spectral irradiance and for energetic particle fluxes in the middle and upper atmosphere. These new datasets, if adopted, would introduce changes in the radiative forcing of climate, either directly or via their influence on atmospheric composition. The next round of CMIP is imminent, and modeling groups around the world are ensuring that their models can reproduce reasonable climate states for preindustrial conditions as well as being able to reproduce the historical temperature record. Therefore, it is essential that the forcing datasets be revised in a timely manner. CMIP6 brought several major improvements over prior rounds. For the first time, it provided a recommendation for solar particle forcing and a comprehensive solar spectral irradiance dataset covering the full solar spectrum, including the extreme-UV band (10–121 nm). These datasets included a historical period with daily data from 1850 to 2015 and two different scenarios running up to 2300. However, the analysis of climate model simulations that did use the M17 datasets also revealed some issues. For example, small changes in the shape of the solar reference spectrum (see Fig. 7 of M17) induced non-negligible changes in stratospheric heating rates of up to 0.4 K d−1 and required careful tuning of the models. The impending CMIP7 activity provides a unique opportunity to revisit these results and propose improved solar forcings.
The purpose of this perspective paper is to outline a road map and timeline for revising the historical solar forcing datasets to be used in CMIP7, based on the lessons learned from CMIP6. This paper aims to (1) include the latest scientific advances made in the reconstruction of solar forcing and in the understanding of climate response while also (2) addressing the issues that were raised during CMIP6 and (3) facilitating the practical implementation of these datasets, both in terms of their production and their exploitation by end users. An important aspect of this work is the need for community feedback, as this will eventually help us translate these suggestions into recommendations for CMIP7.
Note that the development and documentation of updated and expanded climate forcings for CMIP7, including the solar forcing discussed here, are coordinated by the CMIP7 Climate Forcing Task Team (https://wcrp-cmip.org/cmip7-task-teams/forcings/, last access: 1 February 2024), established by the Working Group on Coupled Modelling infrastructure and CMIP panels of the World Climate Research Programme's Earth System Modelling and Observations (ESMO) project.
In CMIP6, solar radiative forcing consisted of total solar irradiance (TSI), the spectrally resolved irradiance or solar spectral irradiance (SSI), and the F10.7 index for use as a proxy for solar forcing of the ionosphere/thermosphere. The spectral coverage of the SSI was 10 nm to 100 µm, with a spectral resolution that gradually increased from 1 to 50 nm. A new value of 1360.8±0.5 W m−2 for the average TSI during solar minimum had also been recommended. The same approach is also planned for CMIP7, with identical specifications.
There are, however, two aspects to the reconstruction of solar radiative forcing which call for reconsideration: (1) the definition of the reference spectrum for the quiet Sun and (2) the definition of the variability that comes on top of it. Although TSI variability is only around 0.1 % over the solar cycle, SSI variability in the UV band and at shorter wavelengths is significantly larger.
2.1 A new solar reference spectrum
The CMIP6 SSI forcing dataset that was recommended by M17 is an average of two time series from two SSI reconstruction models: Naval Research Laboratory Solar Spectral Irradiance Version 2 (NRLSSI2; Coddington et al., 2016) and Spectral And Total Irradiance REconstruction (SATIRE; Yeo et al., 2014). Both models rely on a constant, so-called quiet-Sun reference spectrum on top of which comes the solar variability. NRLSSI2 uses a composite of quiet-Sun spectra, namely, the Whole Heliosphere Interval (WHI) spectrum (Woods et al., 2009) below 300 nm, the spectrum from the first Atmospheric Laboratory of Applications and Science (ATLAS-1) space shuttle mission (Thuillier et al., 1998) between 300 and 1000 nm, the spectrum from NASA's Solar Radiation and Climate Experiment (SORCE) Spectral Irradiance Monitor (SIM) instrument (Harder et al., 2005) between 1000 and 2400 nm (also used by WHI), and Kurucz's synthetic solar model atmosphere beyond that range (Kurucz, 1991). SATIRE uses the WHI spectrum in the 115–2400 nm range, extended at longer wavelengths by Kurucz's atmosphere model. Ultimately, the CMIP6 quiet-Sun spectrum is the average of both reconstruction models and, therefore, mixes two somewhat different background spectra.
Over recent years, a number of additional solar reference spectra based on observations have become available. First, there is the SOLAR-ISS reference spectrum by Meftah et al. (2018), which is based on the SOLAR/SOLSPEC observations (Thuillier et al., 2009) combined with the synthetic spectrum by Kurucz (1991). Second, there is the quiet-Sun reference spectrum using the observational SSI composite by Haberreiter et al. (2017) for the annual mean of 2008 combined with the synthetic calculations using the COde for Solar Irradiance (COSI; Haberreiter et al., 2008, 2021). Third, Coddington et al. (2021) provide a hybrid reference spectrum which is based on the latest observations from the Total and Spectral Solar Irradiance Sensor (TSIS-1) Spectral Irradiance Monitor (TSIS-SIM; Richard et al., 2020) onboard the International Space Station (ISS). According to Richard et al. (2020), the absolute uncertainty of the TSIS-1 SIM instrument is 0.2 %–0.5 %. This value is better than the absolute uncertainty of the WHI or the ATLAS-1 spectra (typically > 3 % in the visible range). Version 2 of the TSIS-1 reference spectrum, which is an incremental update, has recently been published (Coddington et al., 2023).
A major difference between the TSIS-1 spectrum and the quiet-Sun spectrum in CMIP6 is a distinct spectral shape, with the TSIS-1 spectrum showing an irradiance that is 1 %–5 % higher in the visible band and 1 %–2 % lower in the near-IR wavelength range (between 1000 and 2000 nm), after re-normalization to the same value of the TSI. This difference is illustrated in Fig. 1, which compares the irradiance with that of TSIS-1 for specific spectral bands.
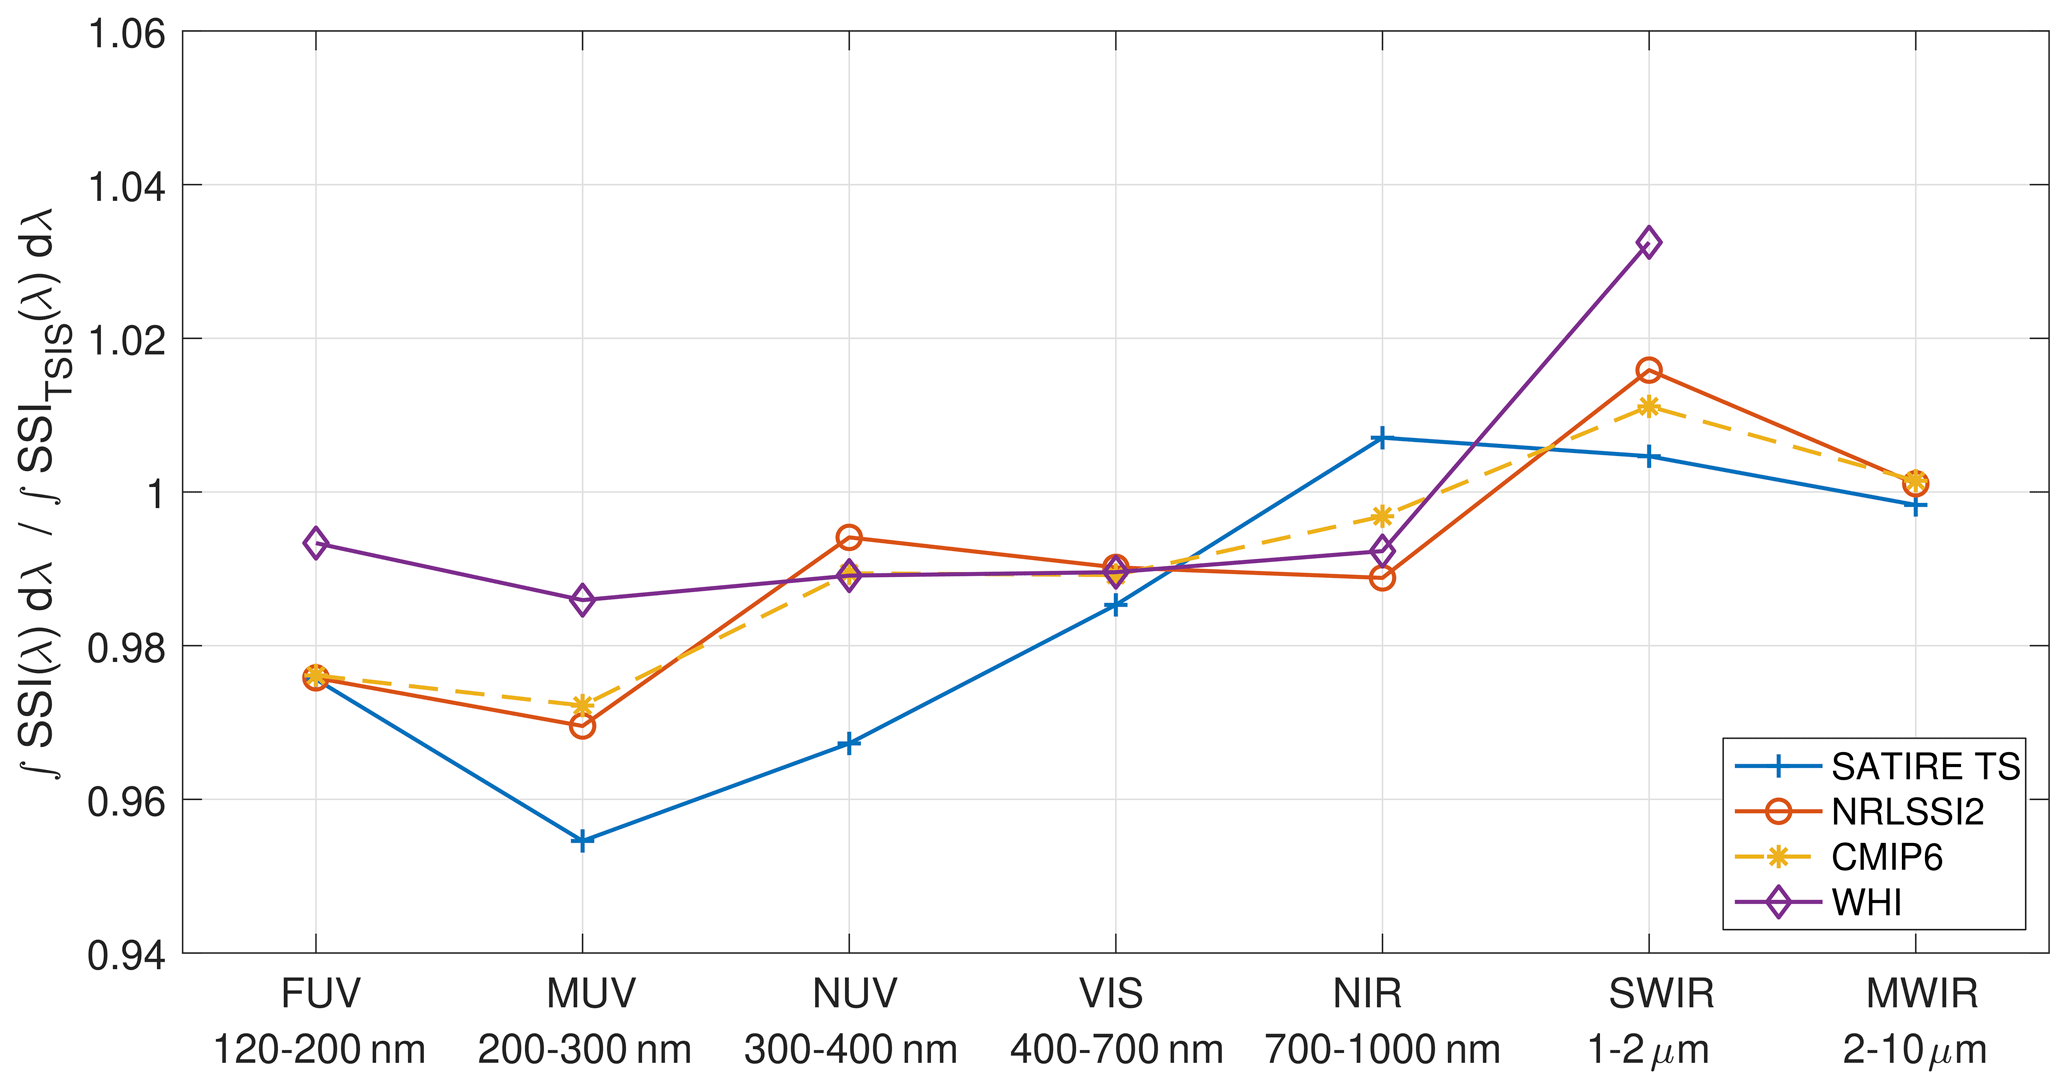
Figure 1Ratio between the irradiance (in specific spectral bands) from SATIRE, NRLSSI2, CMIP6 and WHI and that of the TSIS-1 spectrum. For CMIP6, SATIRE and NRLSSI, the reference spectrum is estimated as the mean value of the SSI for three time intervals between 25 March and 16 April 2008, which are the same as the those used for estimating the WHI reference spectrum. The spectral bands are the far-UV (FUV), middle-UV (MUV), near-UV (NUV), visible (VIS), near-infrared (NIR), short-wavelength infrared (SWIR) and middle-wavelength-infrared (MWIR) bands, respectively.
Such differences have direct implications on the climate response. For example, Jing et al. (2021) investigated the impact of the new TSIS-1 solar spectral irradiances, compared with earlier data, in NCAR CESM2 coupled climate model simulations. They found that the energy shifts between the visible and the near-infrared parts of the spectrum can trigger surface albedo feedbacks, resulting in significant differences between modeled high-latitude surface temperature and sea ice coverage.
Despite its different spectral shape, we consider the TSIS-1 reference spectrum (version 2) to be the most reasonable choice for future climate simulations. Indeed, the spectrum is based on the latest measurements with significantly increased accuracy compared with prior similar measurements, and it has undergone a detailed validation. In addition,the Committee on Earth Observation Satellites (CEOS) Working Group on Calibration and Validation (WGCV) recommended (in March 2022) that it be used as the new reference spectrum (https://calvalportal.ceos.org/tsis-1-hsrs, last access: 1 February 2024).
Finally, let us stress that the choice of the reference spectrum in the NRLSSI2 and SATIRE models is decoupled from the temporal variability in the spectral irradiance. The two are defined independently and are then added together.
2.2 A consistent representation of solar irradiance variability
The main challenge in making a historical solar radiative forcing dataset is the need to reconstruct SSI/TSI from proxy data for periods prior to their direct observation. Observations of the time-resolved solar spectrum from the extreme-UV to the near-IR are available for the period from 2003 onward, whereas direct TSI observations started in 1978 (Ermolli et al., 2013).
Nowadays many reconstructions of TSI and SSI coexist. For instance, SATIRE derives the SSI/TSI from synthetic intensity spectra; it uses full-disk-resolved filtergrams and magnetograms taken at visible wavelengths after 1974 as well as solar proxies such as sunspot observations before that date. NRLSSI2 is more data driven, as it uses measured spectra to adjust SSI variability via solar proxies. These are (since 1982) the University of Bremen Mg II measurement composite data and the areas and locations of sunspots as reported by the United States Air Force (USAF) Solar Observing Optical Network (SOON) sites. For sunspot region information prior to 1982, Greenwich Observatory observations are used.
Besides the NRLSSI2 and SATIRE reconstructions, there are additional SSI reconstructions available. It should be noted that all reconstruction approaches, including NRLSSI2 and SATIRE, are based on the assumption that the irradiance variations are caused by the changing magnetic features on the surface of the Sun, but they differ with respect to the implementation of those changes. Egorova et al. (2018) use the Code for the High spectral ResolutiOn recoNstructiOn of Solar irradiance (CHRONOS). CHRONOS is an update of the reconstruction approach by Shapiro et al. (2011) that includes a revised method to derive the varying contributions of the quiet Sun, faculae, sunspot umbra and sunspot penumbra, and the combined spectra. Different versions of the CHRONOS reconstruction exist that are based on different input parameters to derive the long-term evolution of the quiet-Sun irradiance; for a comparison with NRLSSI and SATIRE, the reader is referred to Yeo et al. (2020a, Fig. 1b). For discussion of further irradiance reconstruction models, we refer the reader to the reviews by authors such as Ermolli et al. (2013) and Chatzistergos et al. (2023).
In CMIP6, we selected the only two models that could reconstruct solar irradiance over the whole period considered and that had been studied in detail. These were SATIRE and NRLSSI2. Both use various solar inputs (e.g., magnetograms and sunspot number) but differ with respect to the way that these translate into SSI/TSI variability. These differences, along with the use of different versions of proxy datasets, have led to systematic discrepancies in solar cycle amplitudes and secular trends. These have been the subject of much debate, but no consensus on the most appropriate model for climate simulations has been reached by the community to date. Both models come with uncertainty estimates; however, because they are based on different metrics, these estimates cannot be meaningfully compared in a quantitative way. For these reasons, for CMIP6, it was decided that the two reconstructions should be averaged without favoring either model. In contrast, for CMIP5, only the NRLSSI (Lean, 2000) model was used.
While the averaging applied for CMIP6 was considered to be the most sensible choice, given the available information, it has also received criticism. One problem arises from the different reference spectra that are used by both models (see Sect. 2.1), the averaging of which leads to yet another spectrum of the composite. Another objection comes from the different trends that arise during the space era (after the 1980s): SATIRE produces a stronger downward trend in the SSI observed at solar minimum compared with NRLSSI2 and with the most recent measured TSI.
For CMIP7, the objective is to revisit these choices in the light of recent developments made by both model teams and to find a pragmatic solution that would provide the best solar input for climate models.
In the meantime, no community consensus has been reached regarding the relative accuracy of the models. Both are continuously being improved and the agreement between them tends to improve (Lean et al., 2020). Solar surface magnetism has been confirmed to be the main driver of SSI variations (Yeo et al., 2017); therefore, growing attention has been given to its role, which is crucial for constraining the SSI/TSI during periods of very low solar activity, such as during the Maunder Minimum (Yeo et al., 2020b; Krivova et al., 2021; Wang and Lean, 2021). New data sources are gradually becoming available, such as full-disk-resolved solar images taken in the Ca II K line since 1892, that provide new insight into the long-term evolution of surface magnetism (Chatzistergos et al., 2022). At this stage, these new data are still mostly used for validation purposes.
Another aspect to be considered for CMIP7 is the consistency of the recommended solar forcing with that to be used for paleoclimatic reconstructions in Phase 5 of the Paleoclimate Modelling Intercomparison Project (PMIP5). At the time of writing, the latter is not yet known. The recommended solar forcing for PMIP4 was based on SATIRE-M (Jungclaus et al., 2017), which was not fully consistent with the forcing used for CMIP6.
Another issue is the production of the SSI/TSI dataset for future scenarios. As for CMIP6, we are planning to provide a set of forcing scenarios with daily values up to 2300. These will be produced from one single solar input (the sunspot number or the group number), similarly to the way historical reconstructions of the SSI/TSI are made for the period before solar images or magnetograms became available. For internal consistency, it would be preferable to use the same solar proxies as well as the same version in both models. Unfortunately, different versions of the sunspot number record coexist (Clette et al., 2023), which has led to small but significant differences in historical solar forcing (Kopp et al., 2016). Finally, there are practical considerations, such as the process for building historical and future forcings, which should be flexible enough to allow for operationalization and regular updates, with a short latency.
What is the best solar irradiance forcing dataset for CMIP7? Considering the absence of a community consensus on the models and the lack of comparable uncertainty estimates, the most reasonable choice would be to again average the latest versions of the two SSI/TSI models, namely, SATIRE (including its recent improvements) and NRLSSI3 (or possibly NRLSSI4, which is in preparation). However, to avoid some of the problems that were encountered in CMIP6, a meaningful average requires that both models use the same reference spectrum (see the suggestion made in Sect. 2.1) and are driven by the same solar proxies, namely, either sunspot number or group number. Furthermore, a consistent treatment of TSI/SSI variability in the CMIP7 historical and PMIP time periods should be considered.
Energetic particle forcing for CMIP6 was provided in terms of atmospheric ionization rates for magnetospheric medium-energy electrons (MEEs), solar energetic particles (SEPs) and galactic cosmic rays (GCRs) as well as geomagnetic proxies (i.e., the Ap and Kp indexes). In addition, to capture the effects of polar winter descent of EPP- generated NOx (EPP-NOx) in chemistry climate models (CCMs) that have an upper lid in the mesosphere (i.e., below the EPP source region), recommendations for the implementation of an odd-nitrogen upper-boundary condition were provided.
Recent intercomparison studies have shown a systematic underestimation of the CMIP6 MEE ionization rates compared with other datasets (Nesse Tyssøy et al., 2019; Clilverd et al., 2020; Mironova et al., 2019; Nesse Tyssøy et al., 2022), leading to a significant underestimation of the atmospheric response in the middle and upper mesosphere (Pettit et al., 2019; Szeląg et al., 2022). This has been attributed to a deficient description of the top-of-the-atmosphere particle fluxes and to the Ap-based reconstruction approach which does not account for the dynamics of precipitation during geomagnetic storms. Moreover, the CMIP MEE precipitations are developed based on averaged flux responses which might dampen the overall precipitating flux variability both on daily and decadal scales. These three aspects should be considered in the preparation of the solar forcing for CMIP7 and are discussed in more detail in Sect. 3.1 and 3.2. Aside from this, only minor updates with respect to M17, discussed in Sect. 3.3, are proposed for CMIP7 energetic particle forcing.
3.1 Improved estimates of the top-of-the-atmosphere MEE fluxes
Mid-energy electron precipitation fluxes are derived from the Medium Energy Proton and Electron Detector (MEPED)/Polar Orbiting Environmental Satellites (POES) instruments, which provide observations in three energy bins (≥ 30, ≥ 100 and ≥ 300 keV) and at two perpendicular viewing angles (Evans and Greer, 2000). For CMIP6, electron fluxes were extracted using data from only the 0∘ telescope (van de Kamp et al., 2016). The low bias of the fluxes used in CMIP6 has been primarily attributed to an underestimation of the loss cone when using only the 0∘ telescope. Datasets based on an estimate of the loss cone combining the 0 and 90∘ telescopes and using daily observations provide higher fluxes (Nesse Tyssøy et al., 2019; Nesse Tyssøy et al., 2022) and lead to a stronger atmospheric response (Sinnhuber et al., 2022; Pettit et al., 2021). Therefore, for CMIP7, improvement of the estimates of precipitating fluxes by using data from both telescopes is proposed, e.g., based on the approach of Nesse Tyssøy et al. (2016) on the new homogeneous composite developed by Asikainen and Ruopsa (2019) and Asikainen (2019), which will enable the estimate of precipitating fluxes over the full observation period from 1979 to present day in the energy range from 30 to 1000 keV. The long observation period covering multiple solar cycles allows for a better foundation and validation of the MEE parameterization.
3.2 Refined reconstruction of MEE fluxes
As a response to the underestimation of the MEE fluxes in M17, updated particle flux observations as outlined in the previous section should be used to construct an updated precipitation model. Consistent with M17, we propose following the theoretical framework of van de Kamp et al. (2016) for parameterizing the fluxes on L-shells in terms of geomagnetic index, but we recommend doing this based on estimated electron fluxes using data from both MEPED/POES telescopes (see above). At this stage, no need for including the magnetic local time (MLT) dependency in the fluxes (van de Kamp et al., 2018) has been identified (Verronen et al., 2020).
Further developments to overcome the current deficiencies in the atmospheric impact could come from the following: (1) using an alternative geomagnetic index to Ap (e.g., the aa index could be used directly to reconstruct the long-term dataset); (2) incorporating a lagged or an accumulated response to better represent the temporal evolution of geomagnetic storms; and (3) using a piecewise energy spectra power law for extracting spectra in the range from 30 to 1000 keV, rather than the single power law approach in M17. The motivation of the latter arises from seeking improvements for the fluxes in the high-energy tail of the spectrum, which were likely underestimated in M17. Separation of the spectral fits by energy range could then further allow for a delayed impact (∼ 2 d delay) of high-energy electrons, in a manner consistent with what is seen in observations (Nesse Tyssøy et al., 2021; Salice et al., 2023). Finally, if the validation reveals that the dependent variable (aa or Ap) has a wide range of possible flux responses where an average representation would dampen the overall precipitating flux variability, implementing a stochastic solar-cycle-dependent element should be considered.
3.3 Further minor updates
We also propose the following minor updates:
-
The atmospheric ionization rates from MEE precipitation in M17 were calculated using the formulation of Fang et al. (2010), which is accurate over the energies up to 1 MeV but does not consider the secondary bremsstrahlung peak at lower altitudes. A new parameterization for this calculation has been formulated by Xu et al. (2021) for the high-energy tail from 100 to 1000 keV considering bremsstrahlung and could be used to replace (or extend) the Fang et al. (2010) parameterizations. However, the impact of including this on the atmospheric composition is likely small.
-
Since M17, we are aware of no studies that have highlighted significant deficiencies in the specification of solar energetic particle (SEP) fluxes. SEP fluxes are derived from Geostationary Operational Environmental Satellite (GOES) observations in the energy range from a few megaelectronvolts (MeV) to 100 MeV, and they are extrapolated to 300 MeV. This yields good results in the upper stratosphere and mesosphere above 35–40 km, the altitude region most affected by solar proton events (e.g., Jackman et al., 2001; Funke et al., 2011). However, in rare events with a harder spectrum, this can lead to an underestimation of the SEP impact below this altitude (Jia et al., 2020). Therefore, the energy range should be extended from 100 MeV (used in M17) to 400 MeV using a recent recalibration of the GOES detectors (Raukunen et al., 2022). This would account for the previously missing contribution of SEPs to stratospheric chemistry in the vertical range of ∼ 20–40 km. Ionization rates associated with the lower-energy part of the energetic particle spectrum can still be calculated as in M17 using the analytical approach by Jackman et al. (1980). This approach, however, cannot be applied to high-energy (> 100 MeV) protons which initiate the atmospheric nucleonic cascade and can penetrate to the lower atmosphere. For that, we propose an approach based on the ionization yield functions precomputed with a physics-based model, based on Monte Carlo simulations of the atmospheric cascade, CRAC:CRII (Usoskin and Kovaltsov, 2006; Usoskin et al., 2010, 2011; Väisänen et al., 2023). The long-term dataset covering the historical period from 1850 to 1962 can be reconstructed in the same stochastic manner as in M17.
-
We propose treating galactic cosmic rays (GCRs) in a similar way to M17, i.e., by means of the force-field approximation parameterized via the modulation potential Φ. However, Φ should be obtained from the ground-based neutron monitor dataset that begins in 1951 (Usoskin et al., 2005, 2017) and is continuously updated at https://cosmicrays.oulu.fi/phi/phi.html (last access: 1 February 2024). For the historical period before 1951, the Φ time series can be based upon the solar open-flux model of Krivova et al. (2021).
-
Geomagnetic shielding affects the spatial distribution of atmospheric ionization by GCRs, SEPs and magnetospheric electrons. For CMIP7, the approach implemented by M17 using the International Geomagnetic Reference Field (IGRF) model truncated to the eccentric tilted dipole component (the first eight Gaussian coefficients) is proposed, which is known to adequately represent the realistic field for the cosmic-ray shielding at the global scale (Nevalainen et al., 2013). The newest version of the IGRF, the 13th-generation model (Alken et al., 2021), is recommended for use.
-
The main impact of energetic particle precipitation on the composition, independent of the particle source, is the formation of NOx (N, NO) and HOx (H, OH) by atmospheric ionization. This is implemented in CCMs using simple parameterizations that were first outlined by Porter et al. (1976) and Solomon et al. (1981) or by including the complex D-region ion chemistry (e.g., Verronen et al., 2016). The simple parameterization approach has been recommended for CMIP6 (M17). It yields overly low NOx formation in the lower thermosphere (Nieder et al., 2014) but has been shown to perform well throughout the middle atmosphere below ∼ 80 km altitude in many studies. An altitude parameterization of the NOx formation similar to that for HOx could be constructed based on Nieder et al. (2014), although this would only have significant implications for models extending higher than 1 Pa.
-
For those CCMs with an upper lid in the mesosphere, an odd-nitrogen upper-boundary condition (UBC) is required, accounting for EPP production higher up. M17 recommended the use of the UBC model described in Funke et al. (2016), which is based on Michelson Interferometer for Passive Atmospheric Sounding (MIPAS) observations taken during the 2002–2012 period. It is planned to maintain the same approach for CMIP7; however, an extended validation of the UBC model with more recent NO observations (and a possible update, if required) should be considered. In addition, the use of the aa index instead of the Ap index (similar to that for the MEE reconstruction) to drive the UBC model should be explored.
One of the requests made after the delivery of the CMIP6 dataset was the production of uncertainties, especially regarding the solar irradiance dataset. Although the SATIRE and NRLSSI2 irradiance models come with some uncertainty estimates, turning these into complete uncertainties (at all wavelengths, for all times) that can be meaningfully compared is difficult. In addition, such uncertainties should also distinguish long-term stability and short-term errors, which are usually referred to as precision.
For the SOLID irradiance dataset (Haberreiter et al., 2017), these two types of uncertainties were estimated directly from the data, thereby providing a homogeneous ensemble that enabled a comparison of the different models. A similar approach should be feasible for CMIP7 for determining short-term errors. However, the estimation of the long-term stability is much more challenging. Different approaches will be explored to determine whether they can be provided at all.
An updated CMIP7 SSI input for climate models with interactive chemistry is expected to result in ozone changes over the 11-year solar cycle similar to those produced by the CCMs in CMIP6 (e.g., Maycock et al., 2018). Ozone changes between solar maxima and minima (i.e., per 130 SFU, solar flux units, where 1 SFU = 10−22 ) were approximately 2 % in the tropical mid-stratosphere. For CMIP7, the historical SSI forcing will be extended through 2022, which will be important for near-real-time studies of both chemistry and climate impacts. Moreover, the planned transition to a new solar reference spectrum (see Sect. 2.1) implies significant changes in the spectral shape, potentially resulting in a modified climatological ozone field in the upper stratosphere and mesosphere.
Further, the CMIP6 ozone forcing dataset lacked a realistic representation of polar EPP-induced ozone impacts. This dataset was produced as a weighted composite of two CCMs, whereby one CCM (with a stronger weight in the upper stratosphere and mesosphere) did not consider EPP, while the other CCM underestimated the EPP-induced NOy perturbation in the polar stratosphere (Szeląg et al., 2022), which resulted in an underestimate of the polar ozone loss and subsequent feedback on temperature and dynamics. This study suggested that part of this discrepancy in NOy was due to an underestimation of EPP NOx from the MEE forcing dataset. As discussed above, the MEE forcing for the CMIP7 EPP NOx may be 2–10 times larger (see Sect. 3.2). This will significantly increase the impact of particle precipitation on stratospheric ozone, at least in the upper stratosphere, making the consideration of EPP-induced variability in the ozone forcing dataset even more relevant. It would also result in better agreement with observational estimates of the EPP impact on ozone, which indicate a 15 % ozone reduction on average and solar cycle variations of about the same magnitude (Damiani et al., 2016).
As for CMIP6, ozone datasets using CMIP7 forcings for coupled climate models with noninteractive chemistry will be supplied from models with interactive chemistry. The solar forcing influence should be just one part of the overall ozone variability that needs to be updated consistently (e.g., together with volcanic forcing and equivalent effective stratospheric chlorine). This effort will be coordinated by the CMIP7 Climate Forcing Task Team.
The release of a preliminary historical solar forcing dataset (beta version) is already planned for early 2024, in order to facilitate early model tuning efforts and ozone forcing generation as well as a thorough validation of the dataset before its final release. The latter is planned for early 2025, after consideration of community feedback on the preliminary version of the historical forcing and inclusion of future scenarios. A more general overview of the timeline for the generation of all CMIP7 forcings is provided by Durack et al. (2023).
The definition of a strategy for the generation of future solar forcing scenarios is still pending. This issue deserves further discussion in order to reach a community consensus on how to deal with projected natural forcing uncertainties. CMIP5 climate projections were based on a stationary-Sun scenario (i.e., repetition of solar cycle 23). In CMIP6, this was replaced by a more plausible scenario for future solar activity, exhibiting variability at all timescales (daily to centennial) in accordance with the Sun's past behavior. The motivation for this decision relied on the sensitivity of the response of a nonlinear (climate) system to the magnitude of the forcing variability. However, given the difficulty of predicting solar activity even one cycle ahead, it is clear that both approaches are subject to significant uncertainties. Even if some quasi-harmonic components of the solar forcing (those related to the Schwabe cycle with a periodicity of approximately 11 years) may provide some degree of predictability, other components, such as sporadic solar proton events, exhibit a predominantly stochastic behavior. Associated uncertainties may interfere with the emergence of anthropogenic signals. For instance, the date of ozone hole recovery may be under- or overestimated due to interannual to decadal variability in composition resulting from solar variability. This issue becomes even more important for the volcanic forcing, where it is unlikely that sporadic sulfate injections yield a modeled atmosphere with the same variability as one where a multi-decadal mean sulfate distribution is specified.
What is the best solution for specifying future natural forcing? None of the approaches chosen so far (steady-state vs. a single transient scenario) constitute an optimal solution. Only the use of stochastic ensemble forcing scenarios would ensure a realistic quantification of the impact of natural forcing uncertainties, and thus ultimately increase confidence in climate projections. Regarding the future solar forcing, such an ensemble could be constructed from a set of plausible evolutions of the solar activity level, i.e., considering different solar cycle lengths, amplitudes and distribution of impulsive events, like solar proton events. However, this approach would come at a cost in terms of computational resources. In summary, a debate on the strategy used to accounting for future natural forcing uncertainties needs to be initiated in a broader community and should not be limited to solar forcing alone.
No software packages were used in this article. Figure 1 was produced by the authors using data available from M17 for CMIP6, Yeo et al. (2014) for SATIRE, Coddington et al. (2016) for NRLSSI2 (https://lasp.colorado.edu/lisird/data/nrl2_ssi_P1D, last access: 12 February 2024), Coddington et al. (2023) for TSIS-1 (https://lasp.colorado.edu/lisird/data/tsis1_hsrs_binned_fs, last access: 10 February 2024), and Woods et al. (2009) for WHI (https://lasp.colorado.edu/lisird/data/whi_ref_spectra, last access: 10 February 2024). The CMIP6 solar forcing dataset discussed in this work can be obtained from the input4MIPs repository (https://doi.org/10.22033/ESGF/input4MIPs.1122, Matthes et al., 2017b).
This paper was initiated and coordinated by BF, TDdW, MH and DM. BF wrote Sects. 1, 6 and 7 and contributed to Sect. 3. TDdW wrote Sects. 2 and 4. IE and MH contributed to Sect. 2. DK wrote Sect. 5. DM contributed to Sects. 1 and 3. HN, AS, MS and IU wrote Sect. 3. All authors contributed to the editing of the manuscript.
The contact author has declared that none of the authors has any competing interests.
Publisher's note: Copernicus Publications remains neutral with regard to jurisdictional claims made in the text, published maps, institutional affiliations, or any other geographical representation in this paper. While Copernicus Publications makes every effort to include appropriate place names, the final responsibility lies with the authors.
The authors are grateful for the International Space Science Institute for supporting the Solar Forcings for CMIP7 working group. They also gratefully acknowledge valuable discussions and inputs from the following people: Timo Asikainen, Stefan Bender, Mark Clilverd, Odele Coddington, Serena Criscuoli, Natalie Krivova, Judith Lean, Joshua Pettit, Erik Richard, Craig Rodger, Max van de Kamp, Pekka Verronen and Jan Maik Wissing. Thierry Dudok de Wit acknowledges support from CNES. Margit Haberreiter acknowledges support from the Karbacher Fonds. The National Center for Atmospheric Research is a major facility sponsored by the National Science Foundation under Cooperative Agreement No. 1852977. This work was initiated within the framework of the WCRP/SPARC SOLARIS–HEPPA activity.
This research has been supported by the Agencia Estatal de Investigación (grant no. PID2019-110689RB-I00/AEI/10.13039/501100011033). Ilya Usoskin received partial support from the Research Council of Finland (grant no. 354280).
We acknowledge support of the publication fee by the CSIC Open Access Publication Support Initiative through its Unit of Information Resources for Research (URICI).
This paper was edited by Tatiana Egorova and Paul Ullrich and reviewed by Tom Woods and two anonymous referees.
Alken, P., Thébault, E., Beggan, C. D., Amit, H., Aubert, J., Baerenzung, J., Bondar, T. N., Brown, W. J., Califf, S., Chambodut, A., Chulliat, A., Cox, G. A., Finlay, C. C., Fournier, A., Gillet, N., Grayver, A., Hammer, M. D., Holschneider, M., Huder, L., Hulot, G., Jager, T., Kloss, C., Korte, M., Kuang, W., Kuvshinov, A., Langlais, B., Léger, J. M., Lesur, V., Livermore, P. W., Lowes, F. J., Macmillan, S., Magnes, W., Mandea, M., Marsal, S., Matzka, J., Metman, M. C., Minami, T., Morschhauser, A., Mound, J. E., Nair, M., Nakano, S., Olsen, N., Pavón-Carrasco, F. J., Petrov, V. G., Ropp, G., Rother, M., Sabaka, T. J., Sanchez, S., Saturnino, D., Schnepf, N. R., Shen, X., Stolle, C., Tangborn, A., Tøffner-Clausen, L., Toh, H., Torta, J. M., Varner, J., Vervelidou, F., Vigneron, P., Wardinski, I., Wicht, J., Woods, A., Yang, Y., Zeren, Z., and Zhou, B.: International Geomagnetic Reference Field: the thirteenth generation, Earth Planet. Space, 73, 49, https://doi.org/10.1186/s40623-020-01288-x, 2021. a
Asikainen, T.: New Homogeneous Composite Of Energetic Electron Fluxes From POES: 2. Intercalibration of SEM-1 and SEM-2, J. Geophys. Res.-Space, 124, 5761–5782, https://doi.org/10.1029/2019JA026699, 2019. a
Asikainen, T. and Ruopsa, M.: New Homogeneous Composite of Energetic Electron Fluxes From POES Satellites: 1. Correction for Background Noise and Orbital Drift, J. Geophys. Res.-Space, 124, 1203–1221, https://doi.org/10.1029/2018JA026214, 2019. a
Chatzistergos, T., Krivova, N. A., and Ermolli, I.: Full-disc Ca ii K observations – A window to past solar magnetism, Front. Astron. Space Sci., 9, 1038949, https://doi.org/10.3389/fspas.2022.1038949, 2022. a
Chatzistergos, T., Krivova, N. A., and Yeo, K. L.: Long-term changes in solar activity and irradiance, J. Atmos. Sol.-Terr. Phys., 252, 106150, https://doi.org/10.1016/j.jastp.2023.106150, 2023. a
Clette, F., Lefèvre, L., Chatzistergos, T., Hayakawa, H., Carrasco, V. M. S., Arlt, R., Cliver, E. W., Dudok de Wit, T., Friedli, T. K., Karachik, N., Kopp, G., Lockwood, M., Mathieu, S., Muñoz-Jaramillo, A., Owens, M., Pesnell, D., Pevtsov, A., Svalgaard, L., Usoskin, I. G., van Driel-Gesztelyi, L., and Vaquero, J. M.: Recalibration of the Sunspot-Number: Status Report, Sol. Phys., 298, 44, https://doi.org/10.1007/s11207-023-02136-3, 2023. a
Clilverd, M. A., Rodger, C. J., van de Kamp, M., and Verronen, P. T.: Electron Precipitation From the Outer Radiation Belt During the St. Patrick's Day Storm 2015: Observations, Modeling, and Validation, J. Geophys. Res.-Space, 125, e27725, https://doi.org/10.1029/2019JA027725, 2020. a
Coddington, O., Lean, J. L., Pilewskie, P., Snow, M., and Lindholm, D.: A Solar Irradiance Climate Data Record, B. Am. Meteorol. Soc., 97, 1265, https://doi.org/10.1175/BAMS-D-14-00265.1, 2016. a, b
Coddington, O. M., Richard, E. C., Harber, D., Pilewskie, P., Woods, T. N., Chance, K., Liu, X., and Sun, K.: The TSIS-1 Hybrid Solar Reference Spectrum, Geophys. Res. Lett., 48, e91709, https://doi.org/10.1029/2020GL091709, 2021. a
Coddington, O. M., Richard, E. C., Harber, D., Pilewskie, P., Woods, T. N., Snow, M., Chance, K., Liu, X., and Sun, K.: Version 2 of the TSIS-1 Hybrid Solar Reference Spectrum and Extension to the Full Spectrum, Earth Space Sci., 10, e2022EA002637, https://doi.org/10.1029/2022EA002637, 2023. a, b
Damiani, A., Funke, B., López-Puertas, M., Santee, M. L., Cordero, R. R., Laurenza, M., and Watanabe, S.: Energetic particle precipitation: a major driver of the ozone budget in the Antarctic upper stratosphere, Geophys. Res. Lett., 43, 2016GL068279, https://doi.org/10.1002/2016GL068279, 2016. a
Durack, P., Naik, V., Aubry, T., Chini, L., Fasullo, J., Fiedler, S., Funke, B., Graven, H., Hegglin, M., Lutron, T., MacIntosh, C., Nicholls, Z., Plummer, D., Riahi, K., Smith, S., van Marle, M., Ziehn, T., and O'Rourke, E.: CMIP forcing datasets update timeline, Zenodo [data set], https://doi.org/10.5281/zenodo.8328527, 2023. a
Egorova, T., Schmutz, W., Rozanov, E., Shapiro, A. I., Usoskin, I., Beer, J., Tagirov, R. V., and Peter, T.: Revised historical solar irradiance forcing, A&A, 615, A85, https://doi.org/10.1051/0004-6361/201731199, 2018. a
Ermolli, I., Matthes, K., Dudok de Wit, T., Krivova, N. A., Tourpali, K., Weber, M., Unruh, Y. C., Gray, L., Langematz, U., Pilewskie, P., Rozanov, E., Schmutz, W., Shapiro, A., Solanki, S. K., and Woods, T. N.: Recent variability of the solar spectral irradiance and its impact on climate modelling, Atmos. Chem. Phys., 13, 3945–3977, https://doi.org/10.5194/acp-13-3945-2013, 2013. a, b
Evans, D. and Greer, M.: Polar Orbiting Environmental Satellite Space Environment Monitor – 2: Instrument Descriptions and Archive Data Documentation, NOAA Technical Memorandum OAR version 1.4 SEC-93, Oceanic and Atmospheric Research Laboratories, Space Environment Center, Boulder, Colorado, https://repository.library.noaa.gov/view/noaa/19636 (last access: 10 February 2024), 2000. a
Fang, X., Randall, C. E., Lummerzheim, D., Wang, W., Lu, G., Solomon, S. C., and Frahm, R. A.: Parameterization of monoenergetic electron impact ionization, Geophys. Res. Lett., 37, L22106, https://doi.org/10.1029/2010GL045406, 2010. a, b
Funke, B., Baumgaertner, A., Calisto, M., Egorova, T., Jackman, C. H., Kieser, J., Krivolutsky, A., López-Puertas, M., Marsh, D. R., Reddmann, T., Rozanov, E., Salmi, S.-M., Sinnhuber, M., Stiller, G. P., Verronen, P. T., Versick, S., von Clarmann, T., Vyushkova, T. Y., Wieters, N., and Wissing, J. M.: Composition changes after the “Halloween” solar proton event: the High Energy Particle Precipitation in the Atmosphere (HEPPA) model versus MIPAS data intercomparison study, Atmos. Chem. Phys., 11, 9089–9139, https://doi.org/10.5194/acp-11-9089-2011, 2011. a
Funke, B., López-Puertas, M., Stiller, G. P., Versick, S., and von Clarmann, T.: A semi-empirical model for mesospheric and stratospheric NOy produced by energetic particle precipitation, Atmos. Chem. Phys., 16, 8667–8693, https://doi.org/10.5194/acp-16-8667-2016, 2016. a
Haberreiter, M., Schmutz, W., and Hubeny, I.: NLTE model calculations for the solar atmosphere with an iterative treatment of opacity distribution functions, A&A, 492, 833–840, https://doi.org/10.1051/0004-6361:200809503, 2008. a
Haberreiter, M., Schöll, M., Dudok de Wit, T., Kretzschmar, M., Misios, S., Tourpali, K., and Schmutz, W.: A new observational solar irradiance composite, J. Geophys. Res.-Space, 122, 5910–5930, https://doi.org/10.1002/2016JA023492, 2017. a, b
Haberreiter, M., Criscuoli, S., Rempel, M., and Pereira, T. M. D.: Solar atmosphere radiative transfer model comparison based on 3D MHD simulations, A&A, 653, A161, https://doi.org/10.1051/0004-6361/202039237, 2021. a
Harder, J., Lawrence, G., Fontenla, J., Rottman, G., and Woods, T.: The Spectral Irradiance Monitor: Scientific Requirements, Instrument Design, and Operation Modes, Sol. Phys., 230, 141–167, https://doi.org/10.1007/s11207-005-5007-5, 2005. a
Jackman, C. H., Frederick, J. E., and Stolarski, R. S.: Production of odd nitrogen in the stratosphere and mesosphere – An intercomparison of source strengths, J. Geophys. Res., 85, 7495–7505, https://doi.org/10.1029/JC085iC12p07495, 1980. a
Jackman, C. H., McPeters, R. D., Labow, G. J., and Fleming, E. L.: Northern hemisphere atmospheric effects due to the July 2000 solar proton event, Geophys. Res. Lett., 28, 2883–2886, 2001. a
Jia, J., Kero, A., Kalakoski, N., Szeląg, M. E., and Verronen, P. T.: Is there a direct solar proton impact on lower-stratospheric ozone?, Atmos. Chem. Phys., 20, 14969–14982, https://doi.org/10.5194/acp-20-14969-2020, 2020. a
Jing, X., Huang, X., Chen, X., Wu, D. L., Pilewskie, P., Coddington, O., and Richard, E.: Direct Influence of Solar Spectral Irradiance on the High-Latitude Surface Climate, J. Climate, 34, 4145–4158, https://doi.org/10.1175/JCLI-D-20-0743.1, 2021. a
Jungclaus, J. H., Bard, E., Baroni, M., Braconnot, P., Cao, J., Chini, L. P., Egorova, T., Evans, M., González-Rouco, J. F., Goosse, H., Hurtt, G. C., Joos, F., Kaplan, J. O., Khodri, M., Klein Goldewijk, K., Krivova, N., LeGrande, A. N., Lorenz, S. J., Luterbacher, J., Man, W., Maycock, A. C., Meinshausen, M., Moberg, A., Muscheler, R., Nehrbass-Ahles, C., Otto-Bliesner, B. I., Phipps, S. J., Pongratz, J., Rozanov, E., Schmidt, G. A., Schmidt, H., Schmutz, W., Schurer, A., Shapiro, A. I., Sigl, M., Smerdon, J. E., Solanki, S. K., Timmreck, C., Toohey, M., Usoskin, I. G., Wagner, S., Wu, C.-J., Yeo, K. L., Zanchettin, D., Zhang, Q., and Zorita, E.: The PMIP4 contribution to CMIP6 – Part 3: The last millennium, scientific objective, and experimental design for the PMIP4 past1000 simulations, Geosci. Model Dev., 10, 4005–4033, https://doi.org/10.5194/gmd-10-4005-2017, 2017. a
Kopp, G., Krivova, N., Wu, C. J., and Lean, J.: The Impact of the Revised Sunspot Record on Solar Irradiance Reconstructions, Sol. Phys., 291, 2951–2965, https://doi.org/10.1007/s11207-016-0853-x, 2016. a
Krivova, N. A., Solanki, S. K., Hofer, B., Wu, C. J., Usoskin, I. G., and Cameron, R.: Modelling the evolution of the Sun's open and total magnetic flux, aap, 650, A70, https://doi.org/10.1051/0004-6361/202140504, 2021. a, b
Kurucz, R. L.: The solar spectrum, in: Solar Interior and Atmosphere, edited by: Cox, A. N., Livingston, W. C., and Matthews, M. S., University of Arizona Press, 663–669, ISBN-10 0816512299, ISBN-13 978-0816512294, 1991. a, b
Lean, J. L.: Short Term, Direct Indices of Solar Variability, Space Sci. Rev., 94, 39–51, 2000. a
Lean, J. L., Coddington, O., Marchenko, S. V., Machol, J., DeLand, M. T., and Kopp, G.: Solar Irradiance Variability: Modeling the Measurements, Earth Space Sci., 7, 00645, https://doi.org/10.1029/2019EA000645, 2020. a
Matthes, K., Funke, B., Andersson, M. E., Barnard, L., Beer, J., Charbonneau, P., Clilverd, M. A., Dudok de Wit, T., Haberreiter, M., Hendry, A., Jackman, C. H., Kretzschmar, M., Kruschke, T., Kunze, M., Langematz, U., Marsh, D. R., Maycock, A. C., Misios, S., Rodger, C. J., Scaife, A. A., Seppälä, A., Shangguan, M., Sinnhuber, M., Tourpali, K., Usoskin, I., van de Kamp, M., Verronen, P. T., and Versick, S.: Solar forcing for CMIP6 (v3.2), Geosci. Model Dev., 10, 2247–2302, https://doi.org/10.5194/gmd-10-2247-2017, 2017a. a
Matthes, K., Funke, B., Kruschke, T., and Wahl, S.: input4MIPs.SOLARIS-HEPPA.solar.CMIP.SOLARIS-HEPPA-3-2, Version YYYYMMDD[1], Earth System Grid Federation [data set], https://doi.org/10.22033/ESGF/input4MIPs.1122, 2017b. a
Maycock, A. C., Matthes, K., Tegtmeier, S., Schmidt, H., Thiéblemont, R., Hood, L., Akiyoshi, H., Bekki, S., Deushi, M., Jöckel, P., Kirner, O., Kunze, M., Marchand, M., Marsh, D. R., Michou, M., Plummer, D., Revell, L. E., Rozanov, E., Stenke, A., Yamashita, Y., and Yoshida, K.: The representation of solar cycle signals in stratospheric ozone – Part 2: Analysis of global models, Atmos. Chem. Phys., 18, 11323–11343, https://doi.org/10.5194/acp-18-11323-2018, 2018. a
Meftah, M., Damé, L., Bolsée, D., Hauchecorne, A., Pereira, N., Sluse, D., Cessateur, G., Irbah, A., Bureau, J., Weber, M., Bramstedt, K., Hilbig, T., Thiéblemont, R., Marchand, M., Lefèvre, F., Sarkissian, A., and Bekki, S.: SOLAR-ISS: A new reference spectrum based on SOLAR/SOLSPEC observations, A&A, 611, A1, https://doi.org/10.1051/0004-6361/201731316, 2018. a
Mironova, I. A., Artamonov, A. A., Bazilevskaya, G. A., Rozanov, E. V., Kovaltsov, G. A., Makhmutov, V. S., Mishev, A. L., and Karagodin, A. V.: Ionization of the Polar Atmosphere by Energetic Electron Precipitation Retrieved From Balloon Measurements, Geophys. Res. Lett., 46, 990–996, https://doi.org/10.1029/2018GL079421, 2019. a
Nesse Tyssøy, H., Sinnhuber, M., Asikainen, T., Bender, S., Clilverd, M. A., Funke, B., van de Kamp, M., Pettit, J. M., Randall, C. E., Reddmann, T., Rodger, C. J., Rozanov, E., Smith-Johnsen, C., Sukhodolov, T., Verronen, P. T., Wissing, J. M., and Yakovchuk, O.: HEPPA III Intercomparison Experiment on Electron Precipitation Impacts: 1. Estimated Ionization Rates During a Geomagnetic Active Period in April 2010, Journal of Geophysical Research: Space Physics, 127, e2021JA029 128, https://doi.org/10.1029/2021JA029128, 2022. a, b
Nesse Tyssøy, H., Sandanger, M. I., Ødegaard, L.-K. G., Stadsnes, J., Aasnes, A., and Zawedde, A. E.: Energetic electron precipitation into the middle atmosphere – Constructing the loss cone fluxes from MEPED POES, J. Geophys. Res.-Space, 121, 5693–5707, https://doi.org/10.1002/2016JA022752, 2016. a
Nesse Tyssøy, H., Haderlein, A., Sandanger, M. I., and Stadsnes, J.: Intercomparison of the POES/MEPED Loss Cone Electron Fluxes With the CMIP6 Parametrization, J. Geophys. Res.-Space, 124, 628–642, https://doi.org/10.1029/2018JA025745, 2019. a, b
Nesse Tyssøy, H., Partamies, N., Babu, E. M., Smith-Johnsen, C., and Salice, J. A.: The Predictive Capabilities of the Auroral Electrojet Index for Medium Energy Electron Precipitation, Front. Astron. Space Sci., 8, 714146, https://doi.org/10.3389/fspas.2021.714146, 2021. a
Nevalainen, J., Usoskin, I. G., and Mishev, A.: Eccentric dipole approximation of the geomagnetic field: Application to cosmic ray computations, Adv. Space Res., 52, 22–29, https://doi.org/10.1016/j.asr.2013.02.020, 2013. a
Nieder, H., Winkler, H., Marsh, D. R., and Sinnhuber, M.: NOx production due to energetic particle precipitation in the MLT region: Results from ion chemistry model studies, J. Geophys. Res.-Space, 119, 2137–2148, https://doi.org/10.1002/2013JA019044, 2014. a, b
Pettit, J., Randall, C., Peck, E., Marsh, D., van de Kamp, M., Fang, X., Harvey, V., Rodger, C., and Funke, B.: Atmospheric Effects of >30-keV Energetic Electron Precipitation in the Southern Hemisphere Winter During 2003, J. Geophys. Res.-Space, 124, 8138–8153, https://doi.org/10.1029/2019ja026868, 2019. a
Pettit, J. M., Randall, C. E., Peck, E. D., and Harvey, V. L.: A New MEPED-Based Precipitating Electron Data Set, J. Geophys. Res.-Space, 126, e2021JA029667, https://doi.org/10.1029/2021JA029667, 2021. a
Porter, H. S., Jackman, C. H., and Green, A. E. S.: Efficiences for the production of atomic nitrogen and oxygen by relativistic proton impact in air, J. Chem. Phys., 65, 154–167, 1976. a
Raukunen, O., Usoskin, I., Koldobskiy, S., Kovaltsov, G., and Vainio, R.: Annual integral solar proton fluences for 1984–2019, Astron. Astrophys., 660, A65, https://doi.org/10.1051/0004-6361/202243736, 2022. a
Richard, E., Harber, D., Coddington, O., Drake, G., Rutkowski, J., Triplett, M., Pilewskie, P., and Woods, T.: SI-traceable Spectral Irradiance Radiometric Characterization and Absolute Calibration of the TSIS-1 Spectral Irradiance Monitor (SIM), Remote Sens., 12, 1818, https://doi.org/10.3390/rs12111818, 2020. a, b
Salice, J. A., Nesse, H., Babu, E. M., Smith-Johnsen, C., and Richardson, I. G.: Exploring the Predictability of the High-Energy Tail of MEE Precipitation Based on Solar Wind Properties, J. Geophys. Res.-Space, 128, e2022JA031194, https://doi.org/10.1029/2022JA031194, 2023. a
Shapiro, A. I., Schmutz, W., Rozanov, E., Schoell, M., Haberreiter, M., Shapiro, A. V., and Nyeki, S.: A new approach to the long-term reconstruction of the solar irradiance leads to large historical solar forcing, A&A, 529, A67, https://doi.org/10.1051/0004-6361/201016173, 2011. a
Sinnhuber, M., Nesse Tyssøy, H., Asikainen, T., Bender, S., Funke, B., Hendrickx, K., Pettit, J. M., Reddmann, T., Rozanov, E., Schmidt, H., Smith-Johnsen, C., Sukhodolov, T., Szeląg, M. E., van de Kamp, M., Verronen, P. T., Wissing, J. M., and Yakovchuk, O. S.: Heppa III Intercomparison Experiment on Electron Precipitation Impacts: 2. Model-Measurement Intercomparison of Nitric Oxide (NO) During a Geomagnetic Storm in April 2010, J. Geophys. Res.-Space, 127, e2021JA029466, https://doi.org/10.1029/2021JA029466, 2022. a
Solomon, S., Rusch, D., Gérard, J., Reid, G., and Crutzen, P.: The effect of particle precipitation events on the neutral and ion chemistry of the middle atmosphere: II. Odd hydrogen, Planet. Space Sci., 29, 885–893, https://doi.org/10.1016/0032-0633(81)90078-7, 1981. a
Szeląg, M. E., Marsh, D. R., Verronen, P. T., Seppälä, A., and Kalakoski, N.: Ozone Impact from Solar Energetic Particles Cools the Polar Stratosphere, Nat. Comm., 13, 6883, https://doi.org/10.1038/s41467-022-34666-y, 2022. a, b
Thuillier, G., Hersé, M., Simon, P. C., Labs, D., Mandel, H., Gillotay, D., and Foujols, T.: The Visible Solar Spectral Irradiance from 350 to 850 nm As Measured by the SOLSPEC Spectrometer During the ATLAS I Mission, Sol. Phys., 177, 41–61, https://doi.org/10.1023/A:1004953215589, 1998. a
Thuillier, G., Foujols, T., Bolsée, D., Gillotay, D., Hersé, M., Peetermans, W., Decuyper, W., Mandel, H., Sperfeld, P., Pape, S., Taubert, D. R., and Hartmann, J.: SOLAR/SOLSPEC: Scientific Objectives, Instrument Performance and Its Absolute Calibration Using a Blackbody as Primary Standard Source, Sol. Phys., 257, 185–213, https://doi.org/10.1007/s11207-009-9361-6, 2009. a
Usoskin, I. G. and Kovaltsov, G. A.: Cosmic ray induced ionization in the atmosphere: Full modeling and practical applications, J. Geophys. Res., 111, D21206, https://doi.org/10.1029/2006JD007150, 2006. a
Usoskin, I. G., Alanko-Huotari, K., Kovaltsov, G. A., and Mursula, K.: Heliospheric modulation of cosmic rays: Monthly reconstruction for 1951–2004, J. Geophys. Res., 110, A12108, https://doi.org/10.1029/2005JA011250, 2005. a
Usoskin, I. G., Kovaltsov, G. A., and Mironova, I. A.: Cosmic ray induced ionization model CRAC:CRII: An extension to the upper atmosphere, J. Geophys. Res., 115, D10302, https://doi.org/10.1029/2009JD013142, 2010. a
Usoskin, I. G., Kovaltsov, G. A., Mironova, I. A., Tylka, A. J., and Dietrich, W. F.: Ionization effect of solar particle GLE events in low and middle atmosphere, Atmos. Chem. Phys., 11, 1979–1988, https://doi.org/10.5194/acp-11-1979-2011, 2011. a
Usoskin, I. G., Gil, A., Kovaltsov, G. A., Mishev, A. L., and Mikhailov, V. V.: Heliospheric modulation of cosmic rays during the neutron monitor era: Calibration using PAMELA data for 2006–2010, J. Geophys. Res.-Space, 122, 3875–3887, https://doi.org/10.1002/2016JA023819, 2017. a
van de Kamp, M., Seppälä, A., Clilverd, M. A., Rodger, C. J., Verronen, P. T., and Whittaker, I. C.: A Model Providing Long-term Datasets of Energetic Electron Precipitation during Geomagnetic Storms, J. Geophys. Res.-Atmos., 121, 12520–12540, https://doi.org/10.1002/2015JD024212, 2016. a, b
van de Kamp, M., Rodger, C. J., Seppälä, A., Clilverd, M. A., and Verronen, P. T.: An Updated Model Providing Long-term Data Sets of Energetic Electron Precipitation, Including Zonal Dependence, J. Geophys. Res.-Atmos., 149, 9891–9915, https://doi.org/10.1029/2017JD028253, 2018. a
Verronen, P. T., Andersson, M. E., Marsh, D. R., Kovács, T., and Plane, J. M. C.: WACCM-D – Whole Atmosphere Community Climate Model with D-region ion chemistry, J. Adv. Model. Earth Sy., 8, 954–975, https://doi.org/10.1002/2015MS000592, 2016. a
Verronen, P. T., Marsh, D. R., Szeląg, M. E., and Kalakoski, N.: Magnetic-local-time dependency of radiation belt electron precipitation: impact on ozone in the polar middle atmosphere, Ann. Geophys., 38, 833–844, https://doi.org/10.5194/angeo-38-833-2020, 2020. a
Väisänen, P., Usoskin, I., Kähkönen, R., Koldobskiy, S., and Mursula, K.: Revised Reconstruction of the Heliospheric Modulation Potential for 1964–2022, J. Geophys. Res.-Space, 128, e2023JA031352, https://doi.org/10.1029/2023JA031352, 2023. a
Wang, Y. M. and Lean, J. L.: A New Reconstruction of the Sun's Magnetic Field and Total Irradiance since 1700, Astrophys. J., 920, 100, https://doi.org/10.3847/1538-4357/ac1740, 2021. a
Woods, T. N., Chamberlin, P. C., Harder, J. W., Hock, R. A., Snow, M., Eparvier, F. G., Fontenla, J., McClintock, W. E., and Richard, E. C.: Solar Irradiance Reference Spectra (SIRS) for the 2008 Whole Heliosphere Interval (WHI), Geophys. Res. Lett., 36, L01101, https://doi.org/10.1029/2008GL036373, 2009. a, b
Xu, W., Marshall, R. A., and Tobiska, W. K.: A Method for Calculating Atmospheric Radiation Produced by Relativistic Electron Precipitation, Space Weather, 19, e2021SW002735, https://doi.org/10.1029/2021SW002735, 2021. a
Yeo, K. L., Krivova, N. A., Solanki, S. K., and Glassmeier, K. H.: Reconstruction of total and spectral solar irradiance from 1974 to 2013 based on KPVT, SoHO/MDI, and SDO/HMI observations, A&A, 570, A85, https://doi.org/10.1051/0004-6361/201423628, 2014. a, b
Yeo, K. L., Solanki, S. K., Norris, C. M., Beeck, B., Unruh, Y. C., and Krivova, N. A.: Solar Irradiance Variability is Caused by the Magnetic Activity on the Solar Surface, Phys. Rev. Lett., 119, 091102, https://doi.org/10.1103/PhysRevLett.119.091102, 2017. a
Yeo, K. L., Solanki, S. K., and Krivova, N. A.: How faculae and network relate to sunspots, and the implications for solar and stellar brightness variations, Astron. Astrophys., 639, A139, https://doi.org/10.1051/0004-6361/202037739, 2020a. a
Yeo, K. L., Solanki, S. K., Krivova, N. A., Rempel, M., Anusha, L. S., Shapiro, A. I., Tagirov, R. V., and Witzke, V.: The Dimmest State of the Sun, Geophys. Res. Lett., 47, e90243, https://doi.org/10.1029/2020GL090243, 2020b. a
- Abstract
- Introduction
- Solar radiative forcing
- Energetic particle forcing
- Uncertainty quantification
- Consistency of ozone forcing datasets with solar input
- Release timeline
- Looking forward
- Code and data availability
- Author contributions
- Competing interests
- Disclaimer
- Acknowledgements
- Financial support
- Review statement
- References