the Creative Commons Attribution 4.0 License.
the Creative Commons Attribution 4.0 License.
 | 09 Oct 2023
Building a bimodal landscape: bedrock lithology and bed thickness controls on the morphology of Last Chance Canyon, New Mexico, USA
Sam Anderson
Nicole Gasparini
Joel Johnson
We explore how rock properties and channel morphology vary with rock type in Last Chance Canyon, Guadalupe Mountains, New Mexico, USA. The rocks here are composed of horizontally to near-horizontally interbedded carbonate and sandstone. This study focuses on first- and second-order channel sections, where the streams have a lower channel steepness index (ksn) upstream and transition to higher ksn values downstream. We hypothesize that differences in bed thickness and rock strength influence ksn values, both locally by influencing bulk bedrock strength and also nonlocally through the production of coarse sediment. We collected discontinuity intensity data (the length of bedding planes and fractures per unit area), Schmidt hammer rebound measurements, and measured the largest boulder at every 12.2 m elevation contour to test this hypothesis. Bedrock and boulder mineralogy were determined using a lab-based carbonate dissolution method. High-resolution orthomosaics and digital surface models (DSMs) were generated from drone and ground-based photogrammetry. The orthomosaics were used to map channel sections with exposed bedrock. The United States Geological Survey (USGS) 10 m digital elevation models (DEMs) were used to measure channel slope and hillslope relief. We find that discontinuity intensity is negatively correlated with Schmidt hammer rebound values in sandstone bedrock. Channel steepness tends to be higher where reaches are primarily incising through more thickly bedded carbonate bedrock and lower where more thinly bedded sandstone is exposed. Bedrock properties also influence channel morphology indirectly, through coarse sediment input from adjacent hillslopes. Thickly bedded rock layers on hillslopes erode to contribute larger colluvial sediment to adjacent channels, and these reaches have higher ksn values. Larger and more competent carbonate sediment armors both the carbonate and the more erodible sandstone and reduces steepness contrasts across rock types. We interpret that in the relatively steep, high-level ksn downstream channel sections, the slope is primarily controlled by the coarse alluvial cover. We further posit that the upstream low-level ksn reaches have a base level that is fixed by the steep downstream reaches, resulting in a stable configuration, where channel slopes have adjusted to lithologic differences and/or sediment armor.
- Article
(13425 KB) - Full-text XML
- BibTeX
- EndNote


Many studies have recognized that lithologic contrasts are expressed in topography (e.g., Howard and Dolan, 1981; Duvall et al., 2004; Johnson et al., 2009; Hurst et al., 2013; Johnstone and Hilley, 2015; Harel et al., 2016). For example, Wohl et al. (1994) found that knickpoints in the Nahal Paran river, Israel, formed where relatively resistant chert layers were exposed. River channels may narrow in reaches with harder rocks (e.g., Bursztyn et al., 2015; Montgomery and Gran, 2001) and/or steepen (e.g., DiBiase et al., 2018; Darling and Whipple, 2015). The properties that control bedrock erodibility (such as intact rock strength, fracture density, and bedding dip) influence both the rates of channel adjustment and how the channel and hillslope morphologies evolve through time (e.g., Weissel and Seidl, 1997; Wolpert and Forte, 2021; Chilton and Spotila, 2022).
Erodibility is a model-dependent parameter. For example, the stream power (or shear stress) erosion model can be written as
where K is fluvial erodibility, S is channel slope, E is erosion rate, A is drainage area, and m and n are exponents that can be calibrated to local conditions (e.g., Whipple and Tucker, 1999). This model assumes that erosion rates can be approximated by a power law function of reach slope and drainage area (e.g., Howard, 1994; Stock and Montgomery, 1999). This approximation may be adequate to describe multiple processes (Gasparini and Brandon, 2011). The model is widely applied in tectonic geomorphology to infer relative erosion rates, although the ratio shows that it is equally sensitive to erodibility differences (e.g., Whipple and Tucker, 1999; Wobus et al., 2006). Whipple and Tucker (1999) show that K is a function of not only bedrock properties but also channel geometry, basin hydrology, and sediment load; nonetheless, the dependence of K on bedrock properties arguably remains the largest unknown.
Using the simple and idealized stream power model (Eq. 1), Forte et al. (2016) and Perne et al. (2017) demonstrated that spatial contrasts in bedrock erodibility can result in complex and sometimes counterintuitive relations between local erosion rate, channel slope, and bedrock erodibility. These include local erosion rates being higher in stronger (less erodible) bedrock layers compared to weaker layers, channels evolving to be steeper in weaker bedrock, and a steady-state topographic configuration being unattainable at the spatial scale of erodibility contrasts (when measuring elevations and erosion rates vertically). Perne et al. (2017) showed that local channel topography tends to evolve towards an “erosional continuity” steady state in which layers with contrasting erodibilities have equal erosion rates when measured parallel to lithologic contacts but that the topographic steady state in which erodibility contrasts are expressed in landscapes is only strictly possible for vertical contacts. Erodibility contrasts oriented perpendicular to the vertical – i.e., horizontal layers – “exhibit the largest departures from steady-state, and the most complex patterns of landscape evolution” (Forte et al., 2016). An advantage of studying approximately horizontally layered rocks is that the spatial pattern of erodibility contrasts is predictable. Thus, idealized models suggest that strong erodibility contrasts from horizontal rock layers can be expressed in topography in complex but potentially understandable ways.
A fundamental challenge in moving from models to field constraints is that many variables influence rock erodibility. Fluvial erosion processes, including abrasion (impact wear) and hydraulic block plucking, depend on rock properties in different ways and make the relationship between overall erodibility and measurable variables nonunique. For abrasion from impacting grains, the bedrock incision rate should scale inversely with the rock tensile strength (Sklar and Dietrich, 2001; Mueller-Hagmann et al., 2020). Fracture density influences bedrock incision rates and dominant processes, especially block plucking (e.g., Spotila et al., 2015; Dibiase et al., 2018; Scott and Wohl, 2019; Scott and Wohl, 2019; Chilton and Spotila, 2022). It remains unclear how to quantitatively relate different rock properties to erodibility in different settings; semiquantitative relations have been proposed but not widely validated for fluvial settings (e.g., Selby, 1982).
Channel morphology adjusts not only to substrate erodibility but also to transport the imposed abundance and size distribution of sediment (e.g., Hack, 1957). Importantly, in erosional landscapes, the sediment size distribution can reflect bedrock properties, as it derives primarily from hillslope erosion in the upstream watershed (Thaler and Covington, 2016; Shobe et al., 2021b). Mechanistically, abrasion requires sediment transport (tools effect), while incision by most erosion processes is inhibited by alluvial cover (cover effect; Sklar and Dietrich, 2004). Studies have found that the abundance and size distribution of the sediment delivered to a channel reach from upstream and the surrounding hillslopes can steepen reaches beyond what might be predicted from channel bedrock properties alone (e.g., Brocard and van der Beek, 2006; Johnson et al., 2009; Thaler and Covington, 2016; Chilton and Spotila, 2020; Lai et al., 2021; Shobe et al., 2021a). In particular, Thaler and Covington (2016) isolated the role of large and relatively immobile boulders in channel slopes by comparing the reaches incised into the same underlying bedrock but with different numbers and sizes of boulders supplied from a caprock layer present in only some watersheds. Furthermore, Shobe et al. (2021a) developed a steepening ratio that calculates the impact of boulders on channel slope in comparison with a boulder-free reach. Discharge variability has also been shown to matter when attempting to understand cover effects in natural systems, particularly in reaches with boulders, as the bigger the boulder, the larger (and more rare) the flood that can mobilize its larger boulders will be (e.g., Lague et al., 2005; Shobe et al., 2021b; Raming and Whipple, 2022). Importantly, the landscape evolution models used by Forte et al. (2016) and Perne et al. (2017) did not include the sediment load, and it remains unclear how cover effects and boulder supply may influence relations between topography and bedrock properties in natural landscapes. Taken as a whole, the studies above suggest that rock properties impact erosion processes and channel morphology in multiple ways. Strength and the resulting erosion processes are impacted by the density of fractures and the relative dip of the bedding. Fracture density also influences the size distributions of coarse sediment supplied to channel reaches.
The overall objective of this study is to better understand how fluvial network topography in a real erosional landscape is influenced by horizontal rock units, both directly through bed erodibility and indirectly through coarse sediment supplied from hillslopes. We hypothesize that local topography – as quantified through the channel steepness index (ksn; defined below) and local relief – correlates with measurable properties of both bedrock and boulders. The field area has alternating layers of primarily sandstone and primarily carbonate rocks. Our approach was to measure compressive rock strength, fracture density, boulder dimensions, and bedrock exposure along channels from extensive field surveys. We objectively quantified rock mineralogy from field samples. We do not have measurements of erosion rates and so cannot directly calculate erodibility (Eq. 1). However, we interpret that patterns of bedrock-controlled erodibility and boulder distributions in this landscape have resulted in a bimodal topography. Upstream channels and hillslopes have lower channel steepness, gentler hillslopes, and hypothesized higher erodibilities. Downstream channels and hillslopes are steeper, with hypothesized lower erodibilities.
This study focuses on channels with intermittent flow in Last Chance Canyon, which is part of the Guadalupe Mountains (Fig. 1). During the Permian period, a shallow lagoon existed behind a reef complex to the south and deposited what would become the interbedded carbonate and siliciclastic bedrock of Last Chance Canyon (Hill et al., 2000; Phelps et al., 2008; Kerans et al., 2017). The Guadalupe Mountains were uplifted during basin and range extension beginning 27 Myr ago, exposing the previously buried bedrock (Chapin et al., 1994; Ricketts et al., 2014; Hoffman, 2014; Decker et al., 2018).
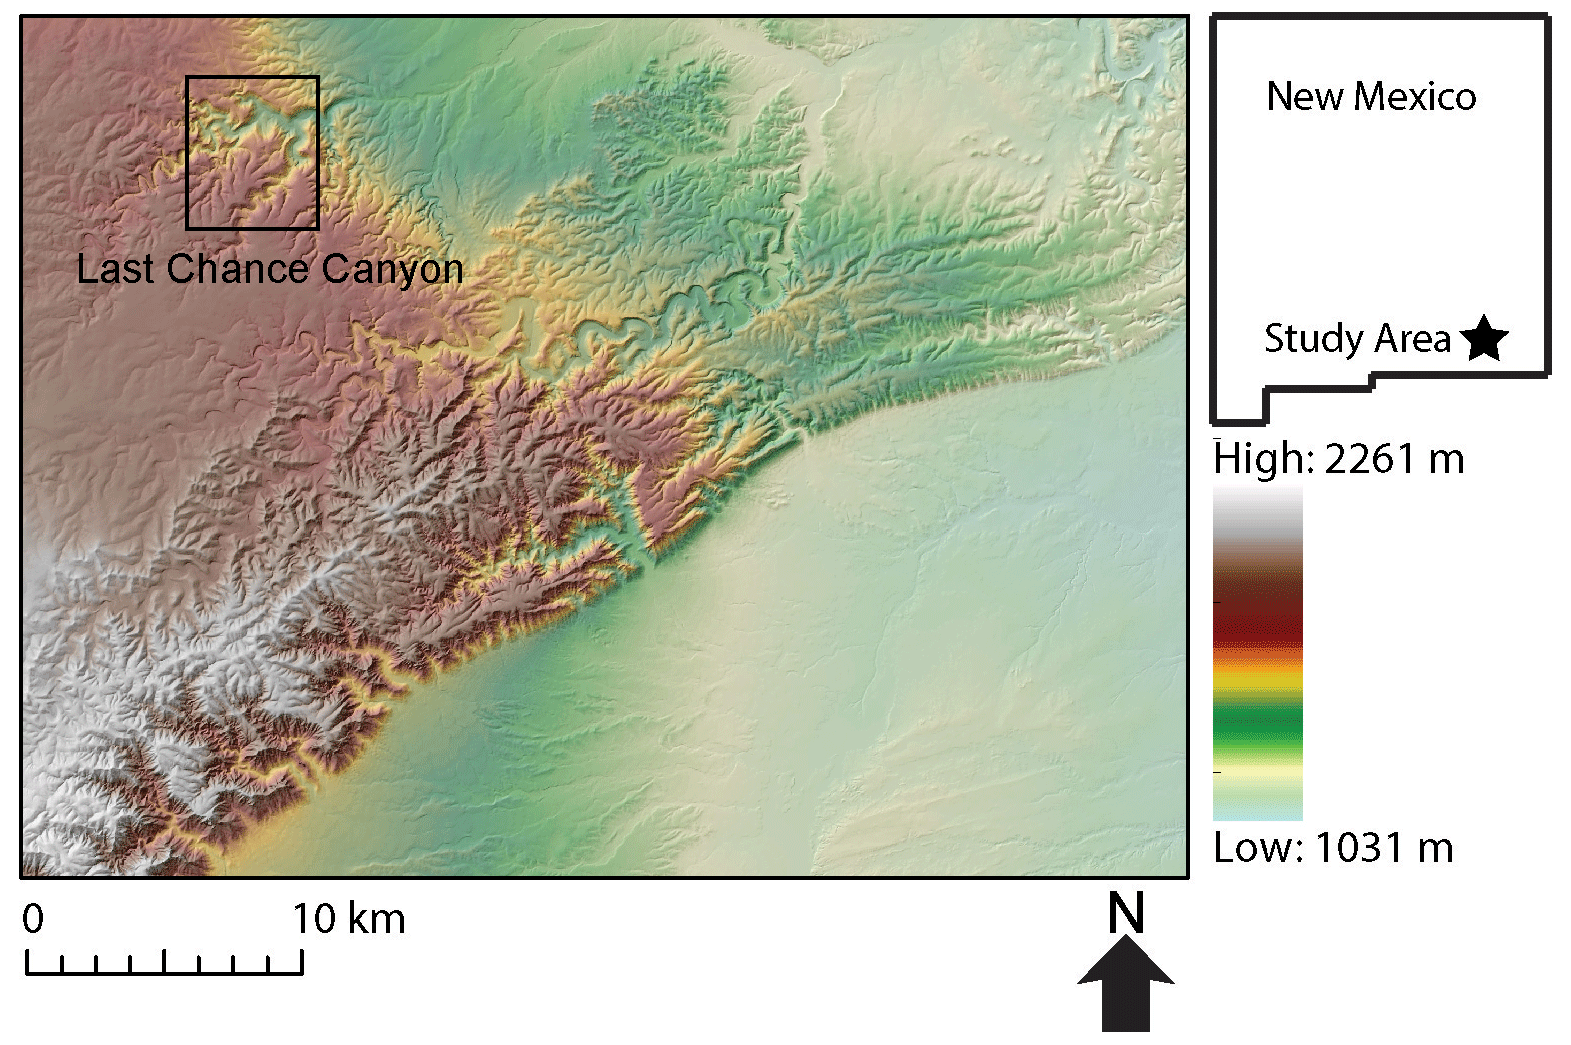
Figure 1Regional topographic map of a section of the Guadalupe Mountains, with location in New Mexico, USA, shown to the right.
Because of its morphology and accessibility, we collected data along tributaries of Last Chance Canyon to identify how changes in bedrock lithology and boulder characteristics correlate with stream channel and landscape morphology. Over the small spatial area and range of vertical elevations of the specific study channels (Fig. 2), climate varies minimally. Mean annual precipitation is ≈ 40–50 cm yr−1 and mean annual temperature ≈ 14–16∘ (PRISM Climate Group, 2023). Last Chance Canyon has horizontal to near-horizontal bedded bedrock and is currently tectonically inactive (Hill, 1987, 2006). Mapped descriptions of stratigraphic units in Last Chance Canyon include both sandstone and carbonate bedrock, with bed thicknesses within mapped units on the order of centimeters to meters (Fig. 2; Scholle et al., 1992; Hill et al., 2000; Phelps et al., 2008), which agrees with what we observed in the field (Fig. 3). This seemingly simple variation in lithology makes Last Chance Canyon an ideal location to explore the effect of varying bedrock properties on stream channel morphology.
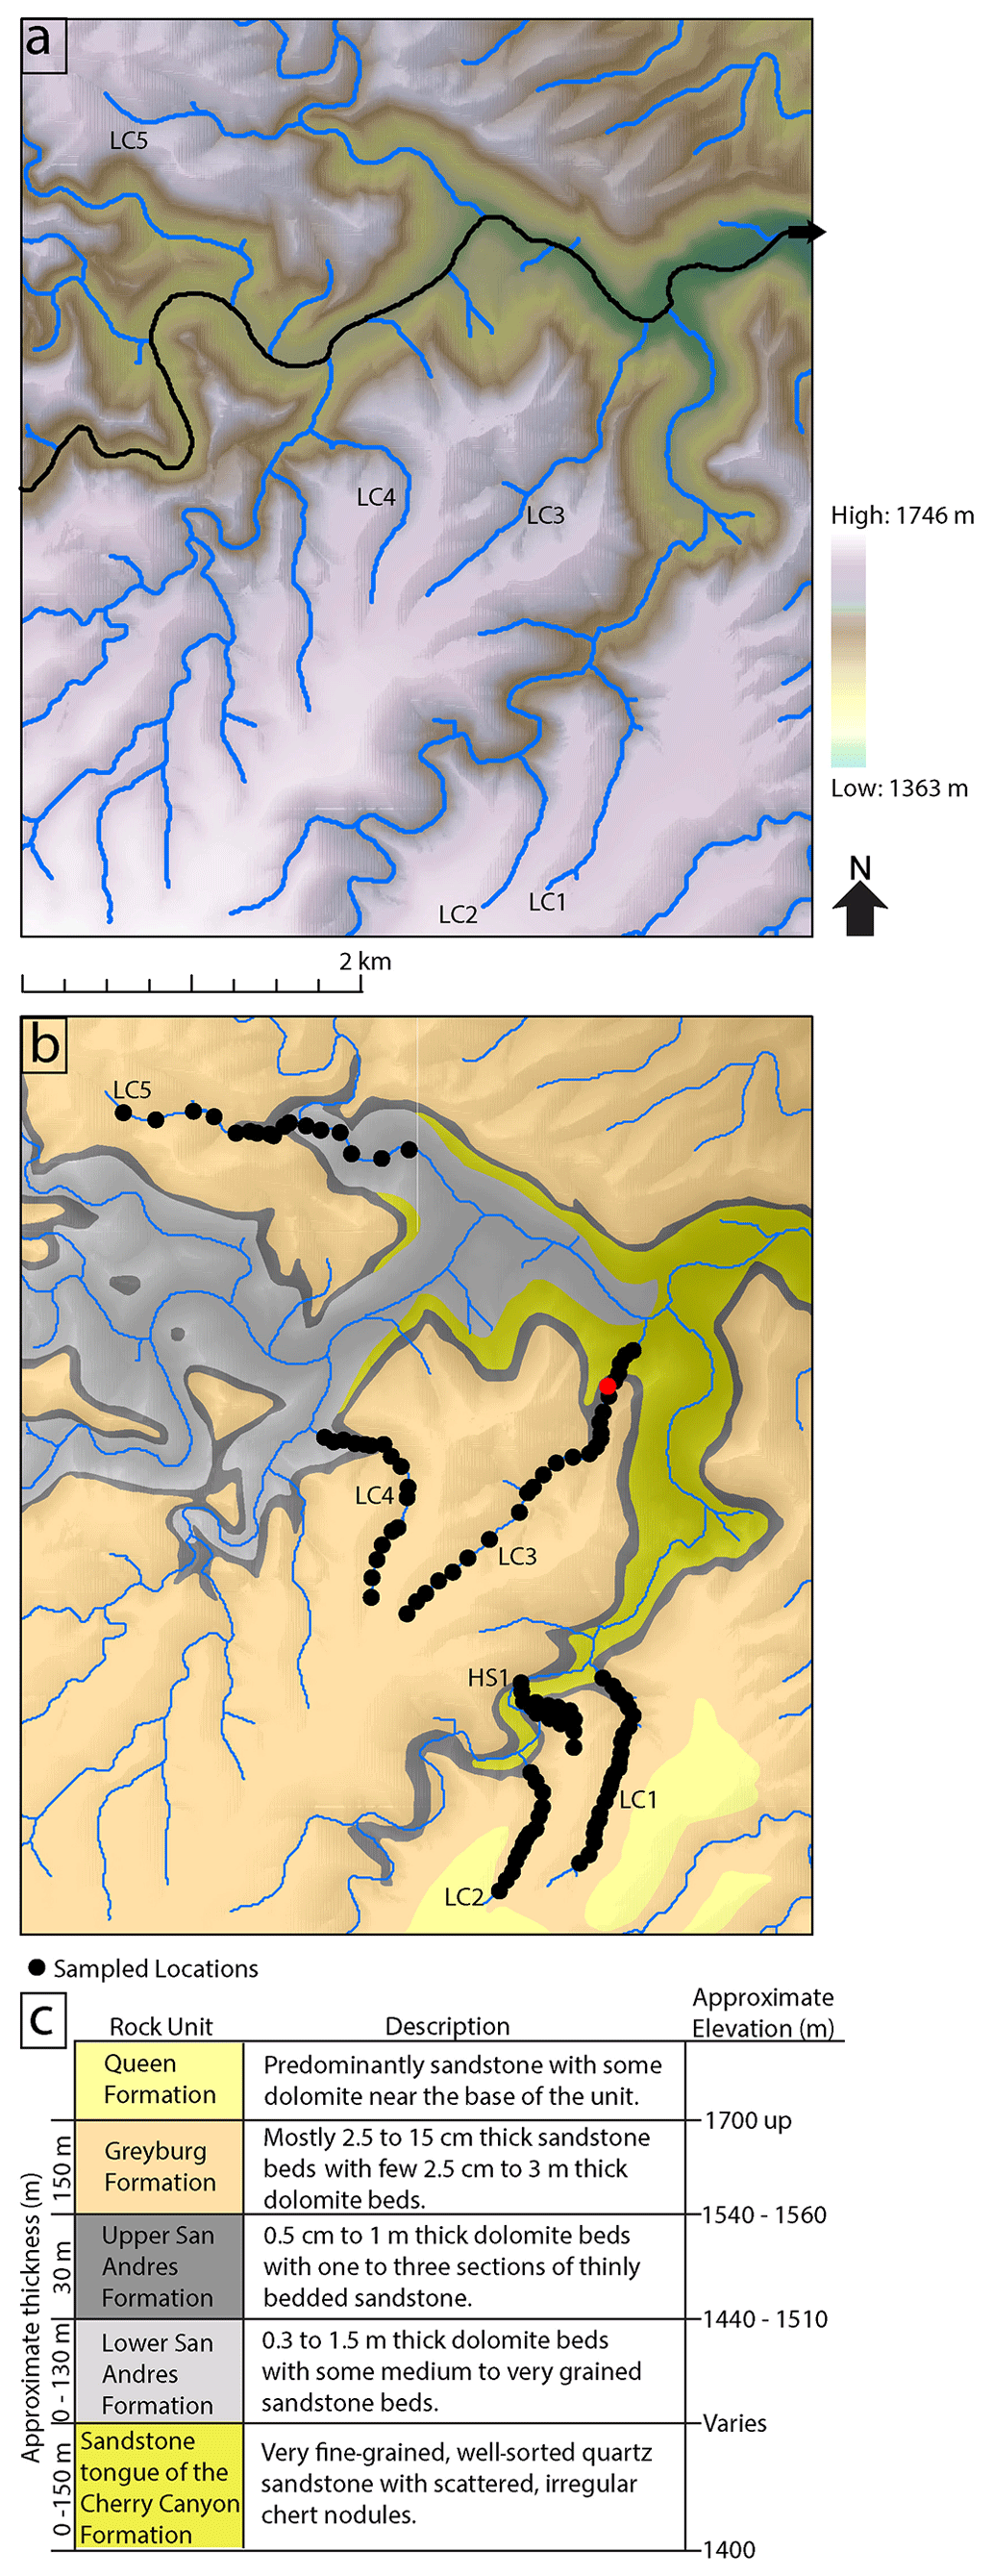
Figure 2(a) Topographic map with elevations superimposed on a hillshade of Last Chance Canyon, with five ephemeral study channels (LC1–LC5) labeled. The main stem channel that all streams flow to is colored black, with an arrow indicating the direction of streamflow. All mapped streamlines begin with a threshold drainage area of 1 km2. (b) Geologic map of the study area, with panel (c) providing a description of mapped lithologies (King, 1948; Boyd, 1958; Hayes, 1964; USGS, 2017). Approximate elevation and thicknesses apply only to the section of Last Chance Canyon displayed here. Dots in panel (b) indicate the locations at which we took measurements (in five tributaries, labeled LC1–LC5, and one hillslope, labeled HS1). The reach marked with a red dot is LC3.2 and is shown in Fig. 4.
Beyond Last Chance Canyon, the Guadalupe Mountains are comprised mostly of horizontal to near-horizontal bedded carbonate and siliciclastic rock (Fig. 2). Rock unit descriptions from published maps are not at the scale needed for us to constrain rock strength variability along channels (NPS, 2007). Higher-order channels further downstream of the survey reaches in Last Chance Canyon are inundated with coarse alluvium and have essentially no exposed bedrock. Therefore, we focus on first- and second-order channels, as defined by Strahler (1957), in Last Chance Canyon because this is where we have collected extensive data and where we are able to measure rock properties in the channel bed. Although some of our observations from Last Chance Canyon likely apply in other locations, mapped rock units have spatial variability in rock properties, and we refrain from making conclusions about other parts of the landscape.
3.1 DEM analysis
We used a 10 m digital elevation model (DEM) of Last Chance Canyon to identify channels of interest to survey and to calculate relevant topographic metrics and slope breaks along longitudinal stream profiles (USGS, 2017). The normalized channel steepness index, ksn, is a measure of the channel gradient normalized for the drainage area (i.e., in principle allowing reach slope to be compared independent of drainage area), as follows:
where θref is a reference concavity (Whipple and Tucker, 1999; Wobus et al., 2006). Based on a calibration to this landscape, we use θref=0.5, giving meters as the units for ksn values. Although ksn is an empirical metric of the fluvial topography (Eq. 2) and not model dependent if the stream power model is assumed to be valid, then combining Eqs. (1) and (2) gives , thus illustrating how this topographic metric potentially informs both erosion rates and erodibilities. The ksn value allows for the comparison of the slope along a single channel or among multiple channels to isolate erosional and/or bedrock erodibility patterns (Kirby and Whipple, 2012). We also calculated χ plots (Perron and Royden, 2013; Willet et al., 2014), which represent a method of transforming the horizontal variable (x) of the longitudinal stream profiles into dimensionless variable χ. Generally speaking, a smoothly concave stream profile without changes in the erodibility or erosion rate along its length will be a straight line on an elevation vs. χ plot, while deviations from linear results may represent changes in the erodibility or erosion rate (Perron and Royden, 2012; Willet et al., 2014). Because channels can adjust to more resistant lithologic units by steepening across them (Duvall et al., 2004; Jansen et al., 2010), we used χ plots and ksn maps to detect changes in the slope that could be due to differences in bedrock erodibility and/or sediment size and cover. TopoToolbox and MATLAB were used to generate longitudinal profiles, ksn maps, and χ (chi) plots of all surveyed channels (Schwanghart and Scherler, 2014).
We also used a DEM to measure channel slope and hillslope relief. Elevations were measured 75 m upstream and 75 m downstream of each reach; the downstream elevation was then subtracted from the upstream elevation, and the value was divided by the length, 150 m, to determine the slope. The 150 m scale of measurement was used to smooth the data, as is commonly done in topographic analysis, because slope data can be noisy and have artifacts (Wobus et al., 2006; Kirby and Whipple, 2012). Relief was measured in ArcGIS using a circular 500 m window around each reach. The radius of the relief window was chosen because ridgetop spacing is ∼ 500 m in the field area. Therefore, our relief values roughly represent the elevation change from valley bottom to ridge top.
3.2 Field surveys
In March and May of 2018 and in February of 2021, we surveyed five channels which we had preselected based on DEM analysis, mapped geology, and accessibility. Our investigation started in lower-order channels at elevations above 1400 m in channels LC3, LC4, and LC5 and in elevations above 1500 m in channels LC1 and LC2 (Fig. 2). We studied reaches of varying length in the five different channels. The United States Geological Survey (USGS) topographic contour maps of the field area use a 40 ft (≈ 12.2 m) contour interval. Following these maps for convenience and to ensure unbiased sampling, at every ≈ 12.2 m contour interval, we surveyed channel reaches for bedrock properties when exposed, measured the largest, assumedly most immobile, boulder in the reach, and took rock samples from each to confirm mineralogy. Previous work suggests that boulders and the coarsest sediment size fractions can significantly influence reach topography, erosion, and transport (e.g., Shobe et al., 2016). The largest boulder was chosen (rather than a particular coarse grain size percentile such as D84) as a balance between the available time for field surveys and statistical accuracy for characterizing coarse sediment. We assume that the largest boulder size is positively correlated with other coarse grain size percentiles when averaged over many surveyed reaches, while acknowledging that this method may introduce a bias due to size selection. For each boulder, we measured the longest (Fig. 3a), intermediate (Fig. 3b), and shortest (Fig. 3c) axes. We multiply these dimensions together to approximate boulder volumes. We also constrain differences in boulder shape using a simple shape factor defined as (the shortest axis divided by the longest axis).
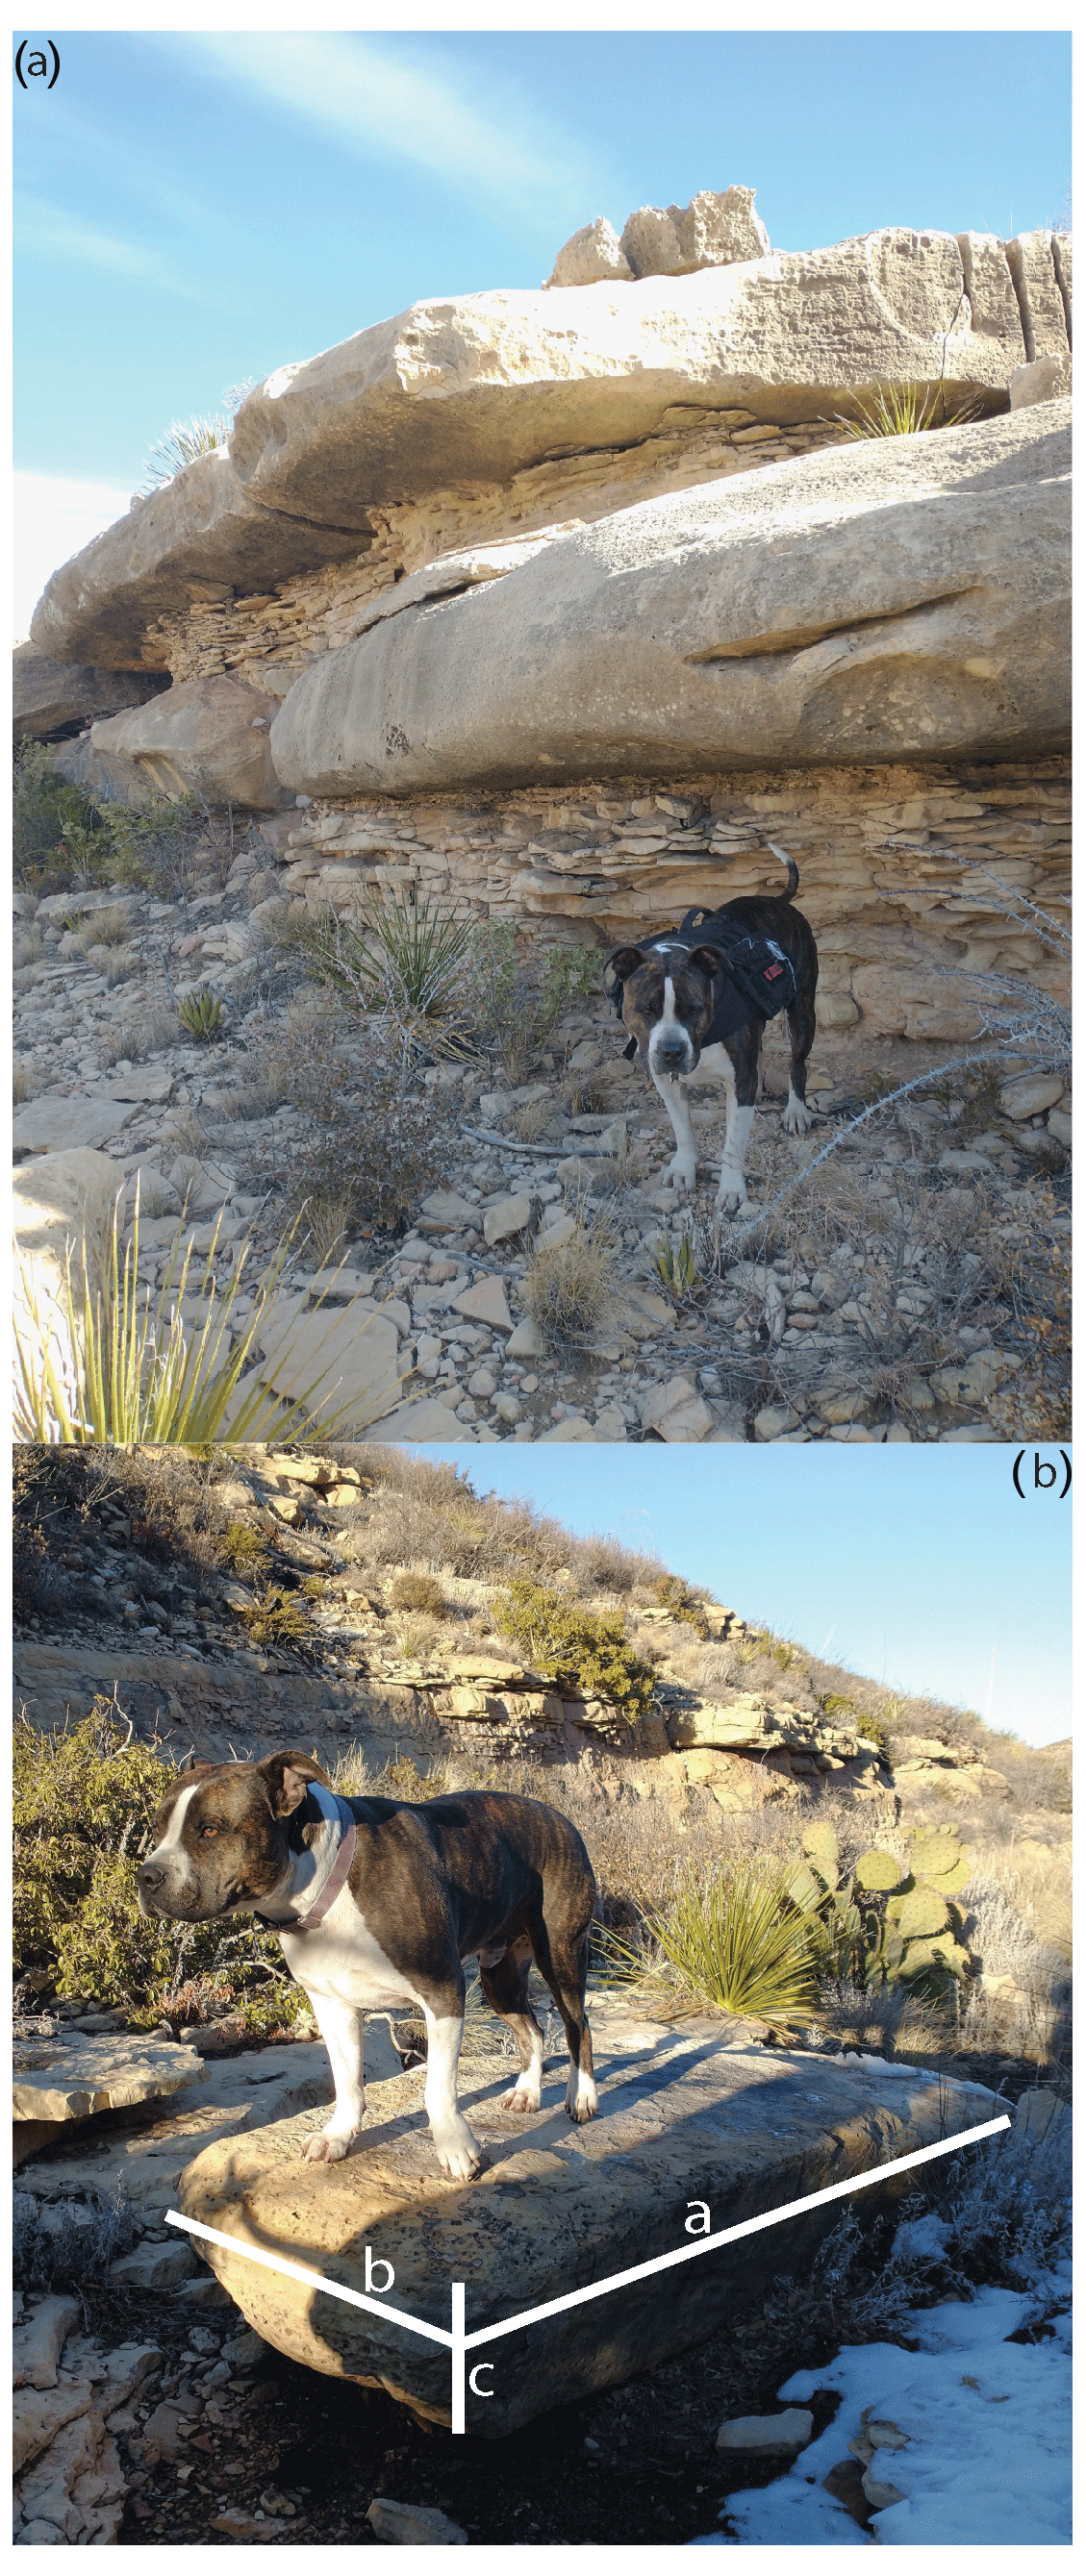
Figure 3Photo demonstrating the differences in (a) bed thicknesses between lithologies and (b) large boulders (with axes labeled in white) sourced from the more thickly bedded dolomitic rock. The dog's height is approximately 75 cm at shoulders.
3.3 Bedrock properties and photogrammetry
We used a Schmidt hammer to take a minimum of 30 rebound values in each reach we surveyed that had exposed bedrock (Niedzielski et al., 2009). Schmidt hammer rebound values scale with compressive strength but are typically reported as unitless numbers between 10 (very weak) and about 70 (very strong; e.g., Bursztyn et al., 2015; Murphy et al., 2016). We discarded Schmidt hammer values of less than 10, which is the minimum value the device can read, as they represent multiple values and make the statistical analysis of the data difficult (Duvall et al., 2004). Schmidt hammer values were recorded at roughly evenly spaced intervals up the thalweg of each channel, regardless of weathering or the presence of fractures. All Schmidt hammer values were taken perpendicular to the bedrock surface. Schmidt hammer values are affected by proximal discontinuities. Because we sampled at evenly spaced intervals in the exposed bedrock and did not avoid discontinuities, our Schmidt hammer values reflect a combination/distribution of local rock elastic properties modulated by discontinuities (Katz et al., 2000). We used two-sample, two-tailed t tests to determine if the rebound values between rock types and between the steep downstream and shallow upstream channel sections were different or similar.
We used a GoPro Hero5 attached to the end of a selfie stick to take wide-angle high-definition (HD) videos of the bottom of 18 different reaches of varying size. We used iMovie software to extract frames (one frame for every second of video). We used Agisoft PhotoScan software (Agisoft PhotoScan Professional, 2018) to generate high-resolution orthomosaics. First, we aligned the frames from the GoPro videos, then built a dense cloud, created a digital surface model (DSM; called a DEM in Agisoft PhotoScan), and finally made an orthomosaic. Discontinuities were visually interpreted and manually traced on the orthomosaic images using Adobe Illustrator software (Fig. 4). Bedding planes are zones of weakness from which bedrock can be plucked, and both bedding planes and fractures were treated as discontinuities (Spotila et al., 2015). Although identifying discontinuities from the images was somewhat subjective, the same person did all these analyses, and so they are likely to be internally consistent. We used FraqPaQ (Healy et al., 2017), a MATLAB software suite, to determine the discontinuity intensity, which is the length of all traced discontinuities divided by the area examined in each reach. The discontinuity intensity is reported in units of meters.
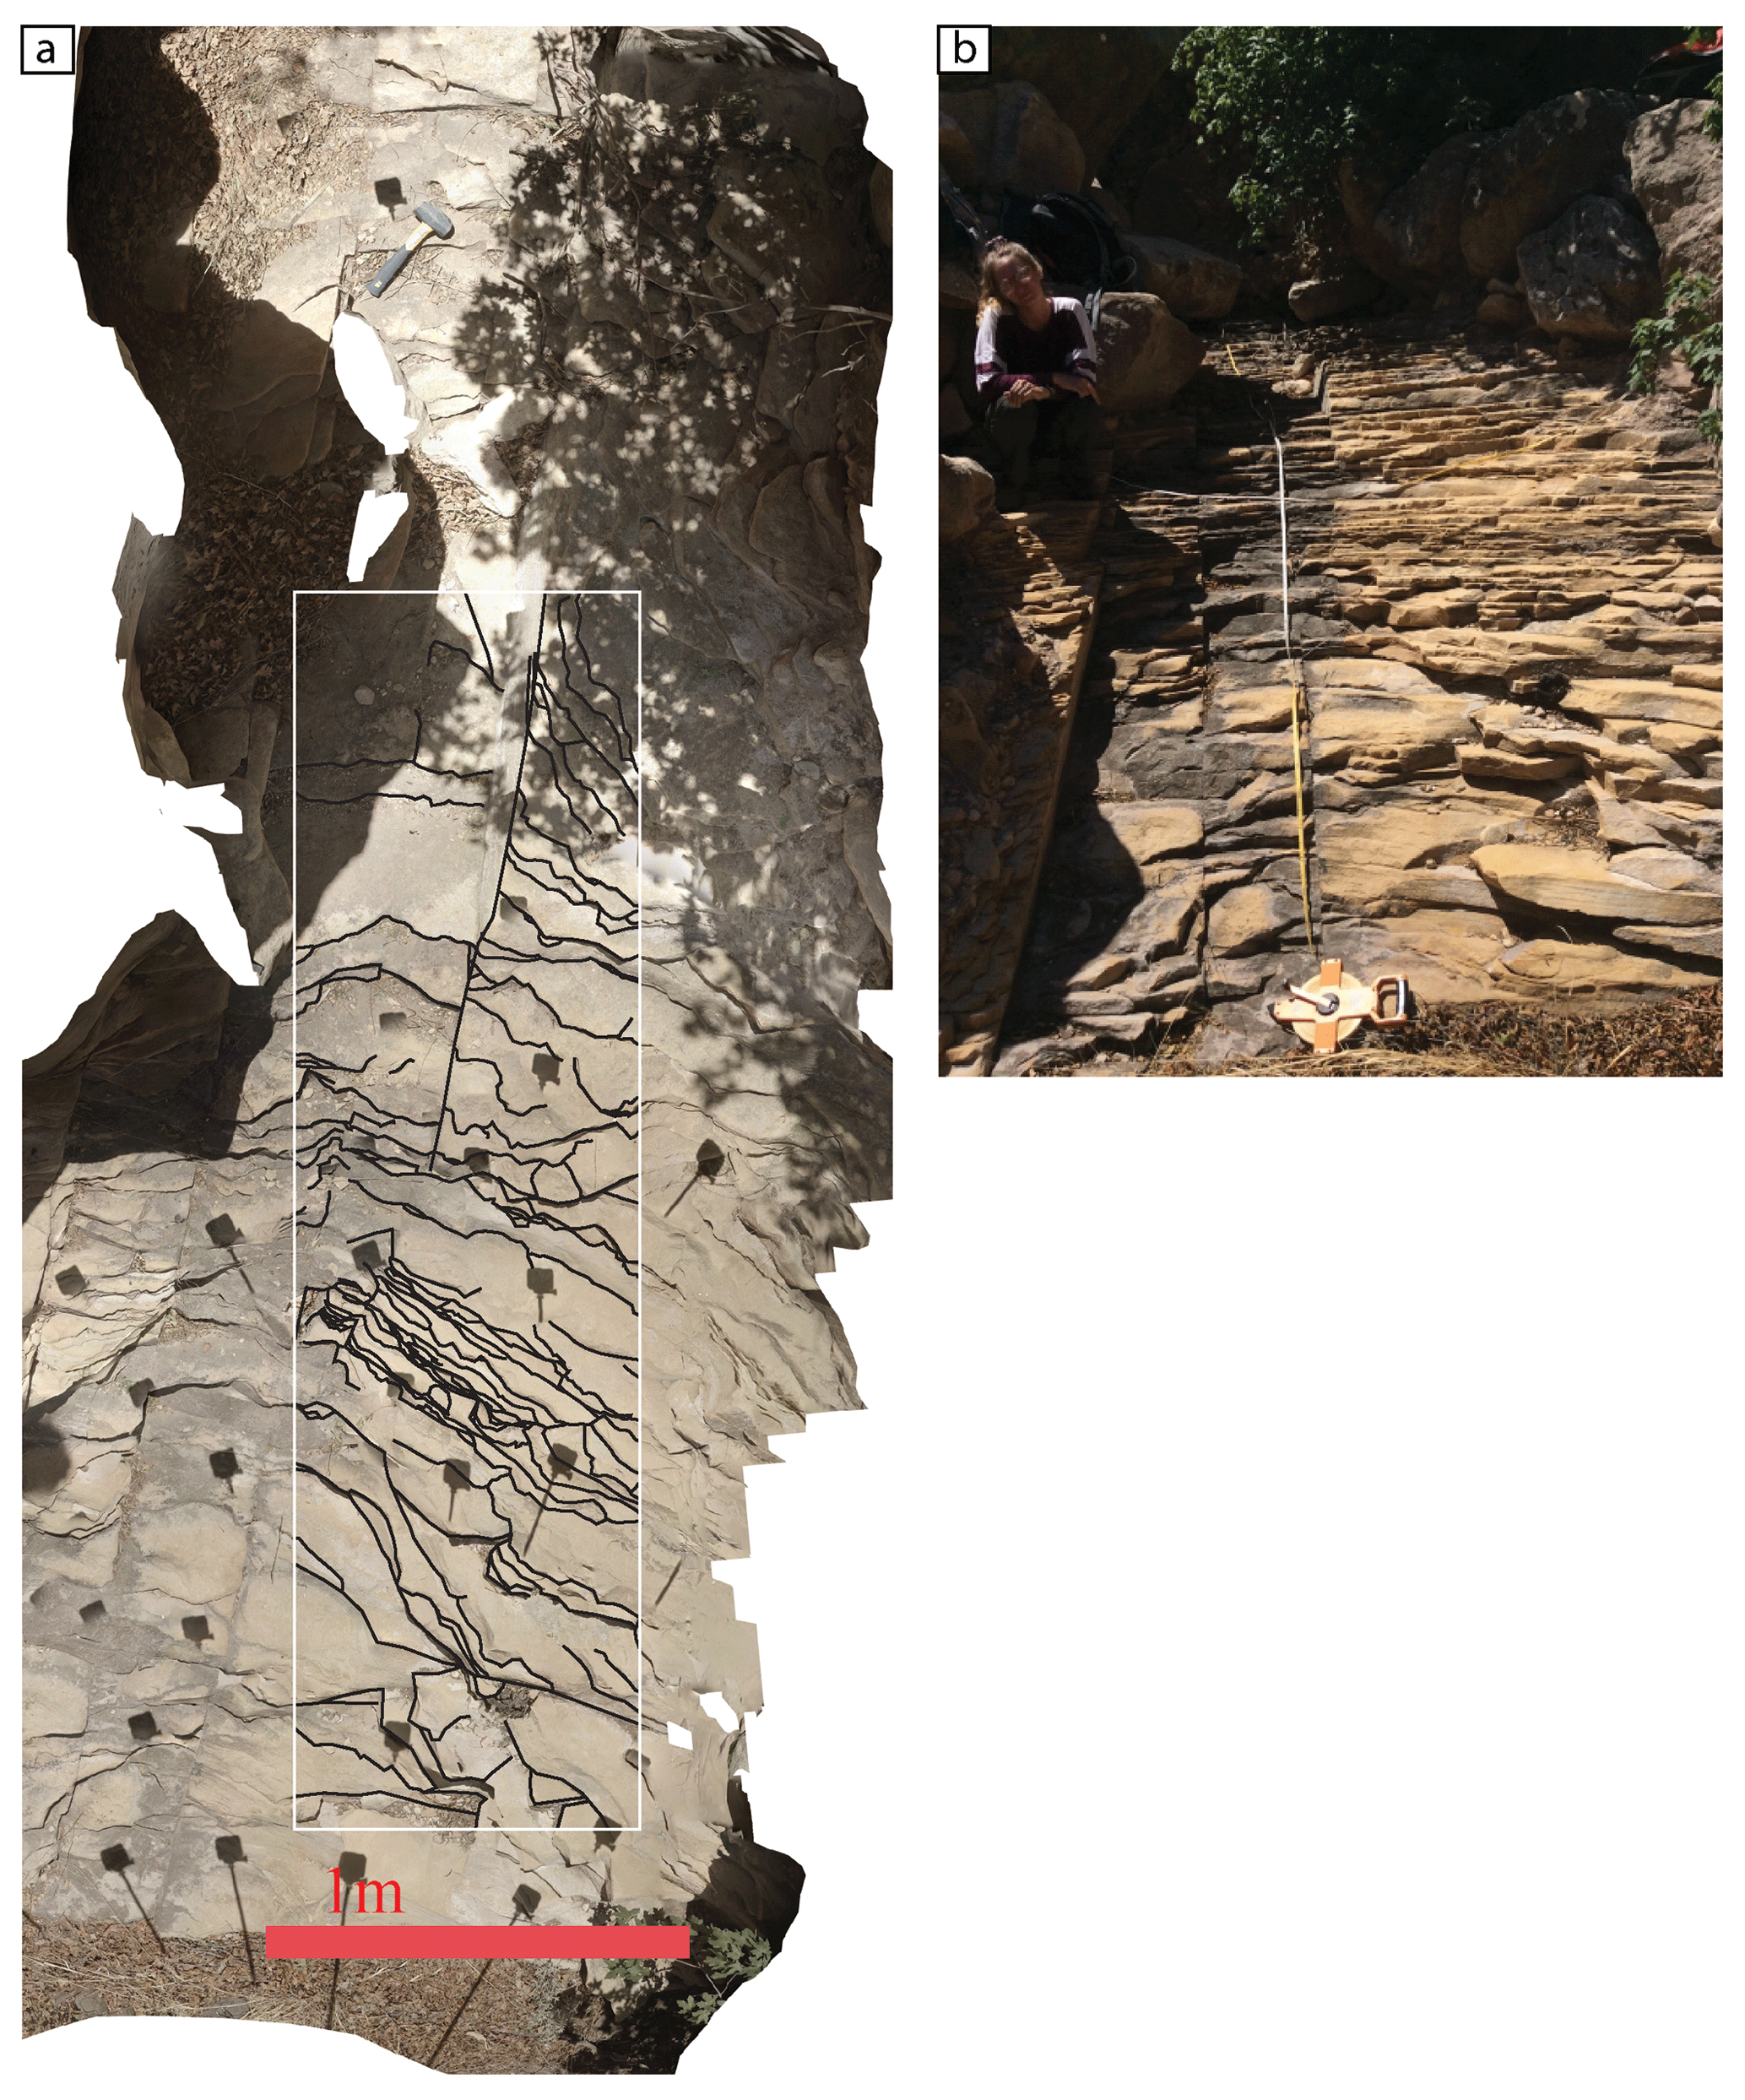
Figure 4(a) An orthomosaic and (b) photo of a sandstone reach LC3.2 (Fig. 2b), with a discontinuity intensity of 13.03 L m−1 in the steep channel section. The shadows in the orthomosaic are from the GoPro and selfie stick used to film the reach. The coordinates are 32.252513 latitude and −104.701289 longitude.
We used a drone, DJI Mavic 2 Pro, to take photos of the five surveyed channels from elevations of approximately 20 m above the five stream channels and 120 m above adjacent hillslopes for three of the five channels. We used Agisoft PhotoScan to generate high-resolution DSMs with 0.027 to 0.28 m resolution (we refer to these as DSMs rather than DEMs because the vegetation is not removed from the DSMs) and orthomosaics of the five channels and three adjacent hillslopes. The methodology we used to create the DSMs and orthomosaics is the same one that we used to create the orthomosaics of the reaches and has been described in the previous paragraph. We used the orthomosaics to quantify the relative proportion of where stream channel beds were exposed bedrock or covered with sediment. Given the sub-decimeter scale of our channel imagery, it was generally clear what was and was not sediment on the channel bed, and we did this mapping by eye. We partitioned the channel reach into lengths that were and were not covered in sediment. This means that we only looked at changes along the channel center line. However, this seemed a reasonable assumption, as the predominant variation in sediment cover was usually down-channel and not across-channel.
3.4 Lithology
At each ≈ 12.2 m elevation contour interval, we collected rock samples from exposed bedrock and from the largest boulder in the stream channel to ensure correct categorization of lithology. The mineralogy of each rock sample was assumed to be representative of the mineralogy of the reach or boulder that it was taken from. Our efforts to determine end-member lithological classifications of sandstone or carbonate in the field were imprecise because individual samples usually contained both carbonate and quartz. To find a quantifiable ratio of the amount of carbonate in each sample, once back in the lab we broke off a very small piece of each rock sample that appeared representative of its composition and ground up this subsample, using a jaw crusher and disk mill. The average size of each subsample that we processed was 1.689 g, with a standard deviation of 0.707 g, and the scale was precise to 0.001 g. The ground subsample was rinsed in water (a minimum of five times), dried in an oven overnight, and then weighed on the following morning. We then dissolved the carbonate minerals by soaking each sample in nitric acid for at least 24 h. The subsample was again rinsed in water (a minimum of five times) and dried overnight. We used a microscope to check that only quartz remained after dissolving each subsample in nitric acid. We then reweighed each subsample to determine the ratio amount of dissolved carbonate minerals. Samples were classified as carbonate if the subsample had more than 50 % carbonate minerals and sandstone if they had more than 60 % quartz (Bell, 2005). Samples which ranged from 50 %–59 % quartz were lithologically unclassified, so that the end-member carbonate and sandstone classes would be more distinct. However, the fact that there was bedrock exposed was still recorded. Only 1 bedrock sample and 2 boulder samples fell in the range of 50 %–59 % quartz, compared to 56 boulder and 56 bedrock samples that were classified. To ensure the validity of this methodology, we replicated this process on six samples by repeating the process with a different subsample from the original rock sample. For one of the samples, we replicated this process five times. All replicate measurements demonstrated similar results (standard deviation of 0.62 % carbonate dissolved and variance of 0.39 % carbonate dissolved).
4.1 Morphometric analysis
Last Chance Canyon tributaries have upstream sections, with relatively shallow channels and lower-gradient hillslopes, and a knickzone downstream, which has steep channels and hillslopes (Fig. 5). χ plots (Fig. 5c and d) and field observations demonstrate that the stream channels transition from steep to shallow at approximately 1640 m for channels 1 and 2 and at approximately 1550 m for channels 3, 4, and 5. At the transition from steep to shallow in channels 1 and 2, the slope of the χ plot changes less than in channels 3, 4, and 5. The average value for slope gradients above 1550 m in elevation is 16.5 (n=145 765; σ= 11.1), above 1640 m in elevation the average slope is 11.5 (n=68 853; σ= 8.8), and from 1400 to 1550 m in elevation the average slope gradient is 24.5 (n=70 438; σ= 11.1).
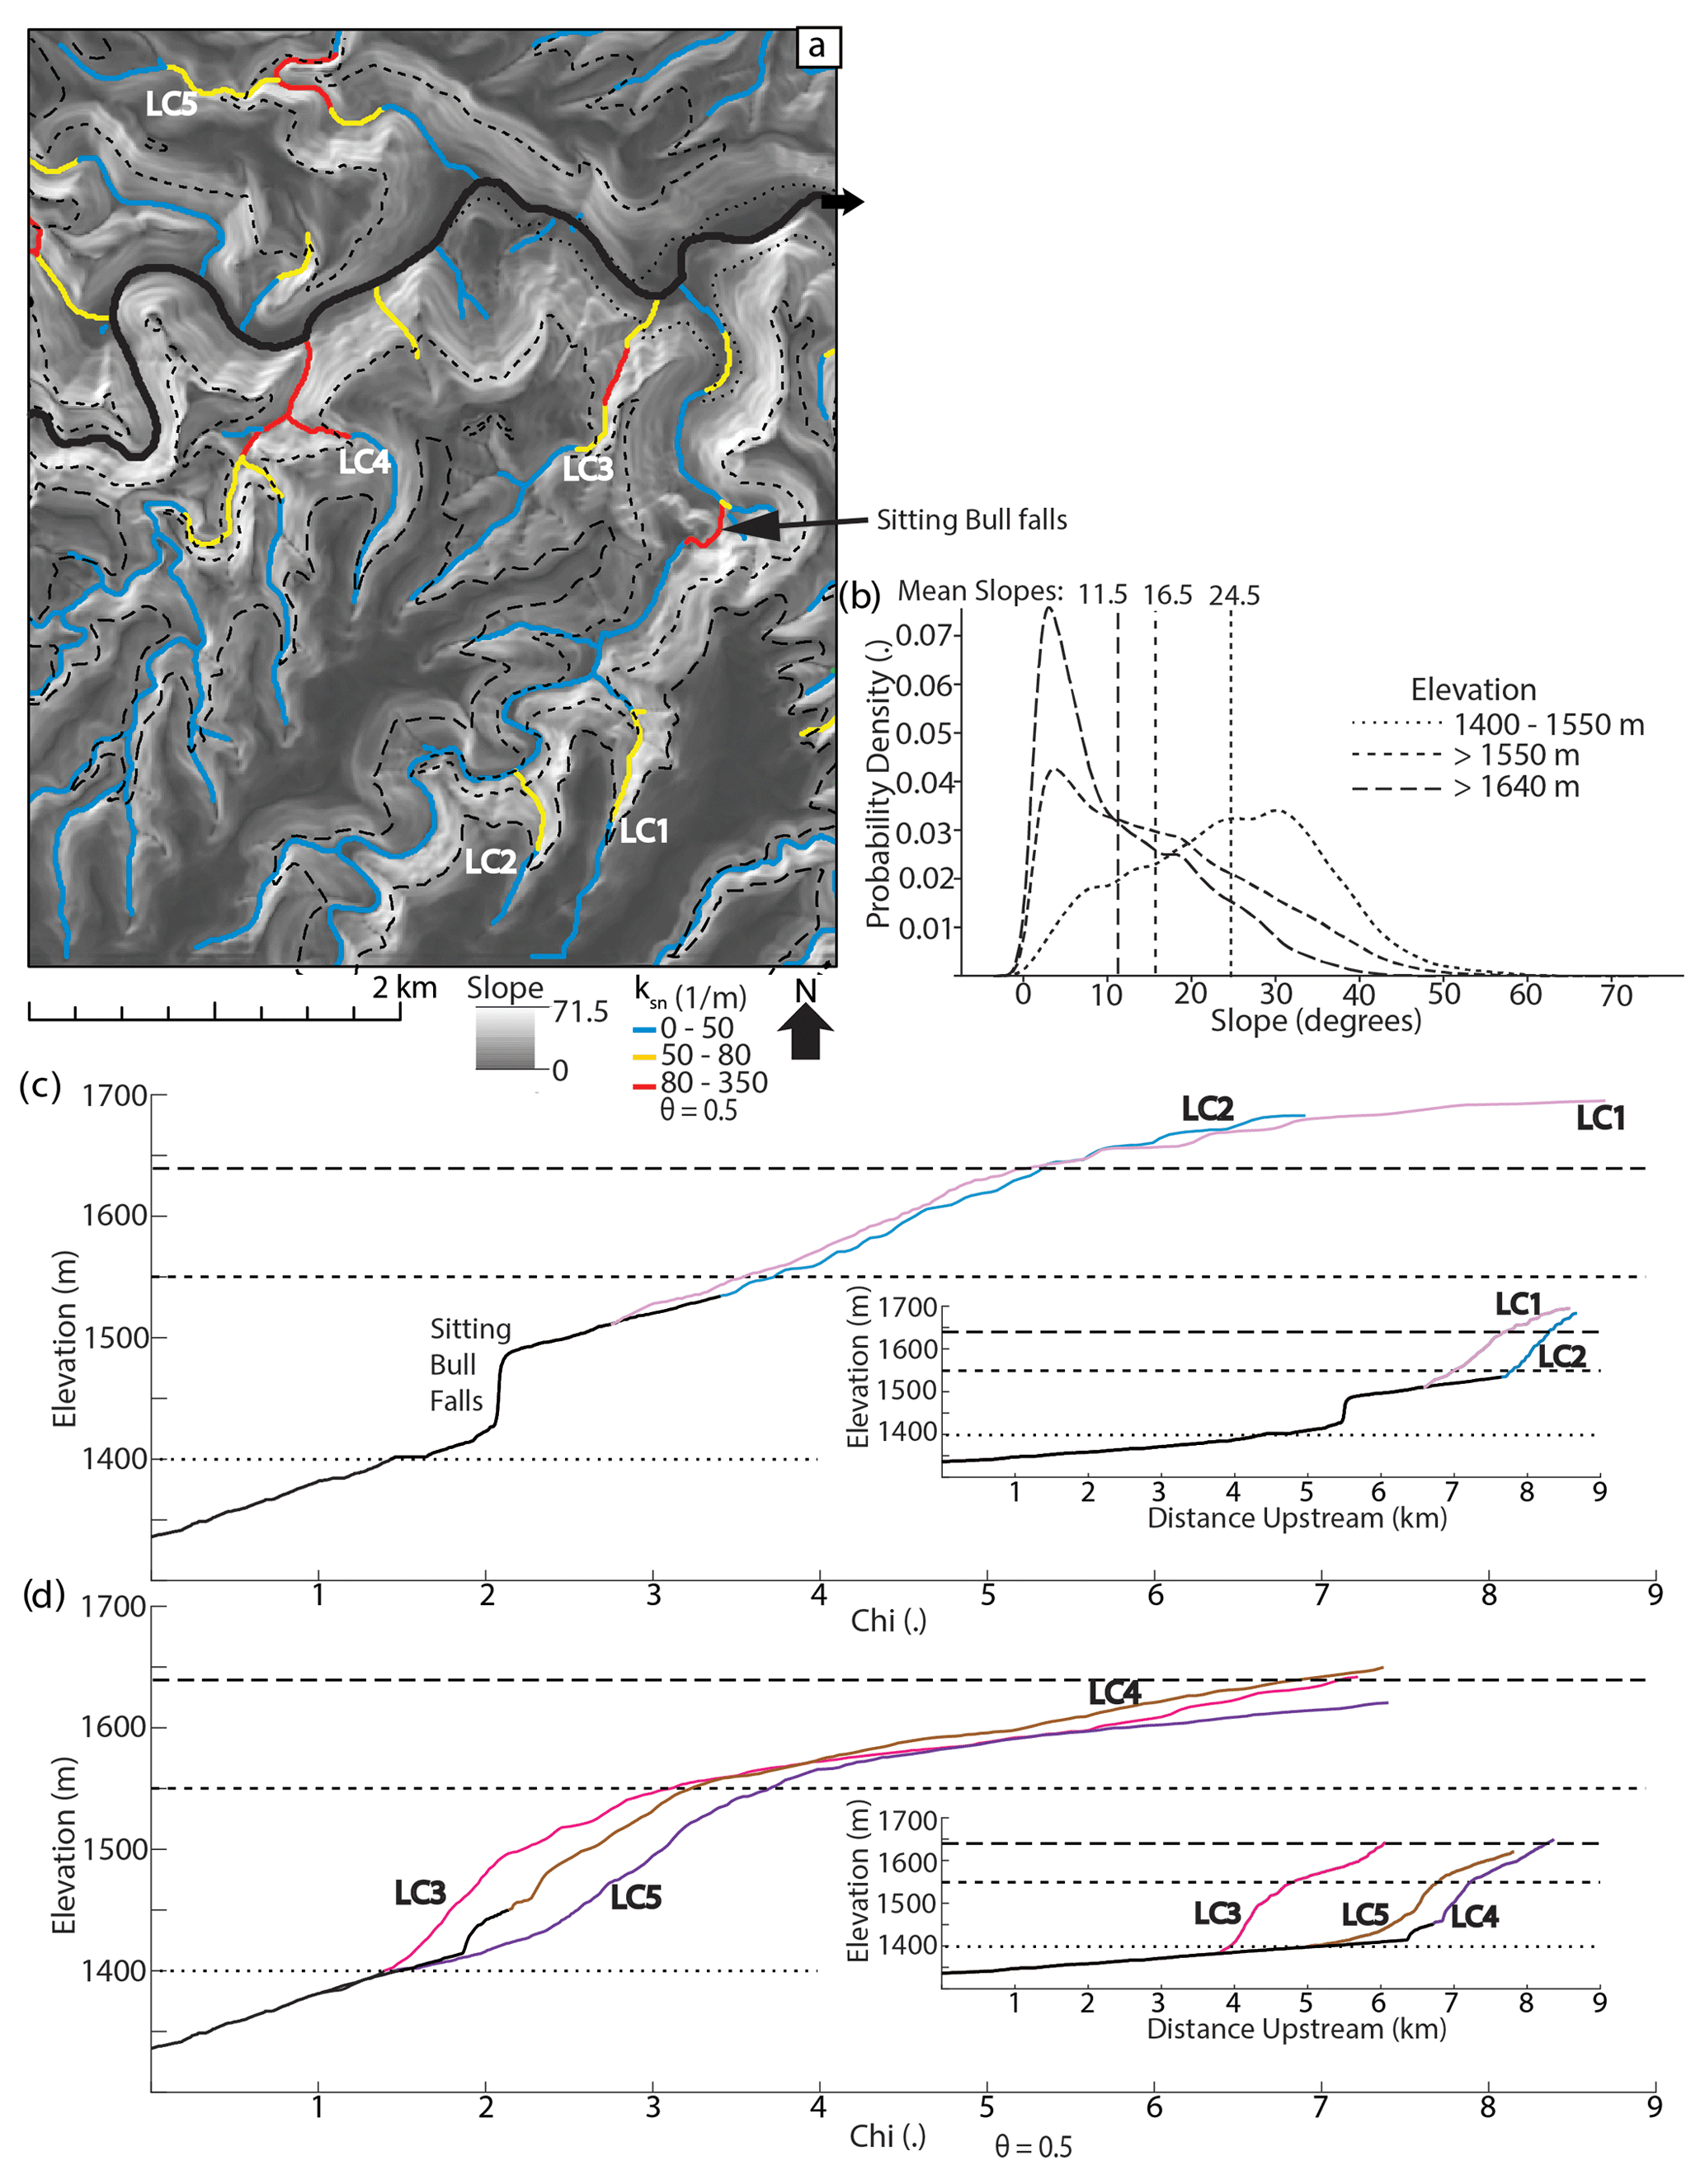
Figure 5(a) Slope map of Last Chance Canyon with channel colored by ksn values. The contour lines correspond to elevations, which are interpreted as approximate inflection points for hill and channel slope (1550 m for LC3, LC4, and LC5 and 1640 m for LC1 and LC2). (b) Kernel density estimates of slope values from the shallow landscape sections, > 1640 m and > 1550 m, and the steep section, 1400 to 1550 m. (c) χ plots of LC1 and LC2 and (d) LC3, LC4, and LC5, with the inset of channel profiles. The downstream portion of the channels that is colored in black in panels (c) and (d) was not surveyed.
We used a t test to verify a bimodal distribution of hillslopes between the shallow section, with elevations above 1550 m in channels 3, 4, and 5 and above 1640 m in channels 1 and 2, and the steep section, with elevations from 1400 to 1550 m. The null hypothesis was that the hillslope values in the steep and shallow sections are the same and/or do not vary between the lower-steepness (upstream) and higher-steepness (downstream) reaches. This would indicate that the landscape form does not change at the elevations we interpreted using the χ plots in Fig. 5. Conversely, if the hillslope values from the different elevation bins are from statistically different populations, then this supports our interpretation that landscape form changes at an elevation of 1550 m in channels 3, 4, and 5 and 1640 m in channels 1 and 2. The t test (t= −155.4; tcritical = 1.96, α= 0.05) demonstrated that slope gradient values from the shallow channel section are different to slope gradient values from the steep channel section.
We do not have erosion rate data for the field channels and so cannot quantitatively constrain the erodibility (Eq. 1). Our overall approach instead is to evaluate whether the existing fluvial morphology in this part of the landscape likely reflects measurable rock properties.
4.2 Bedrock properties
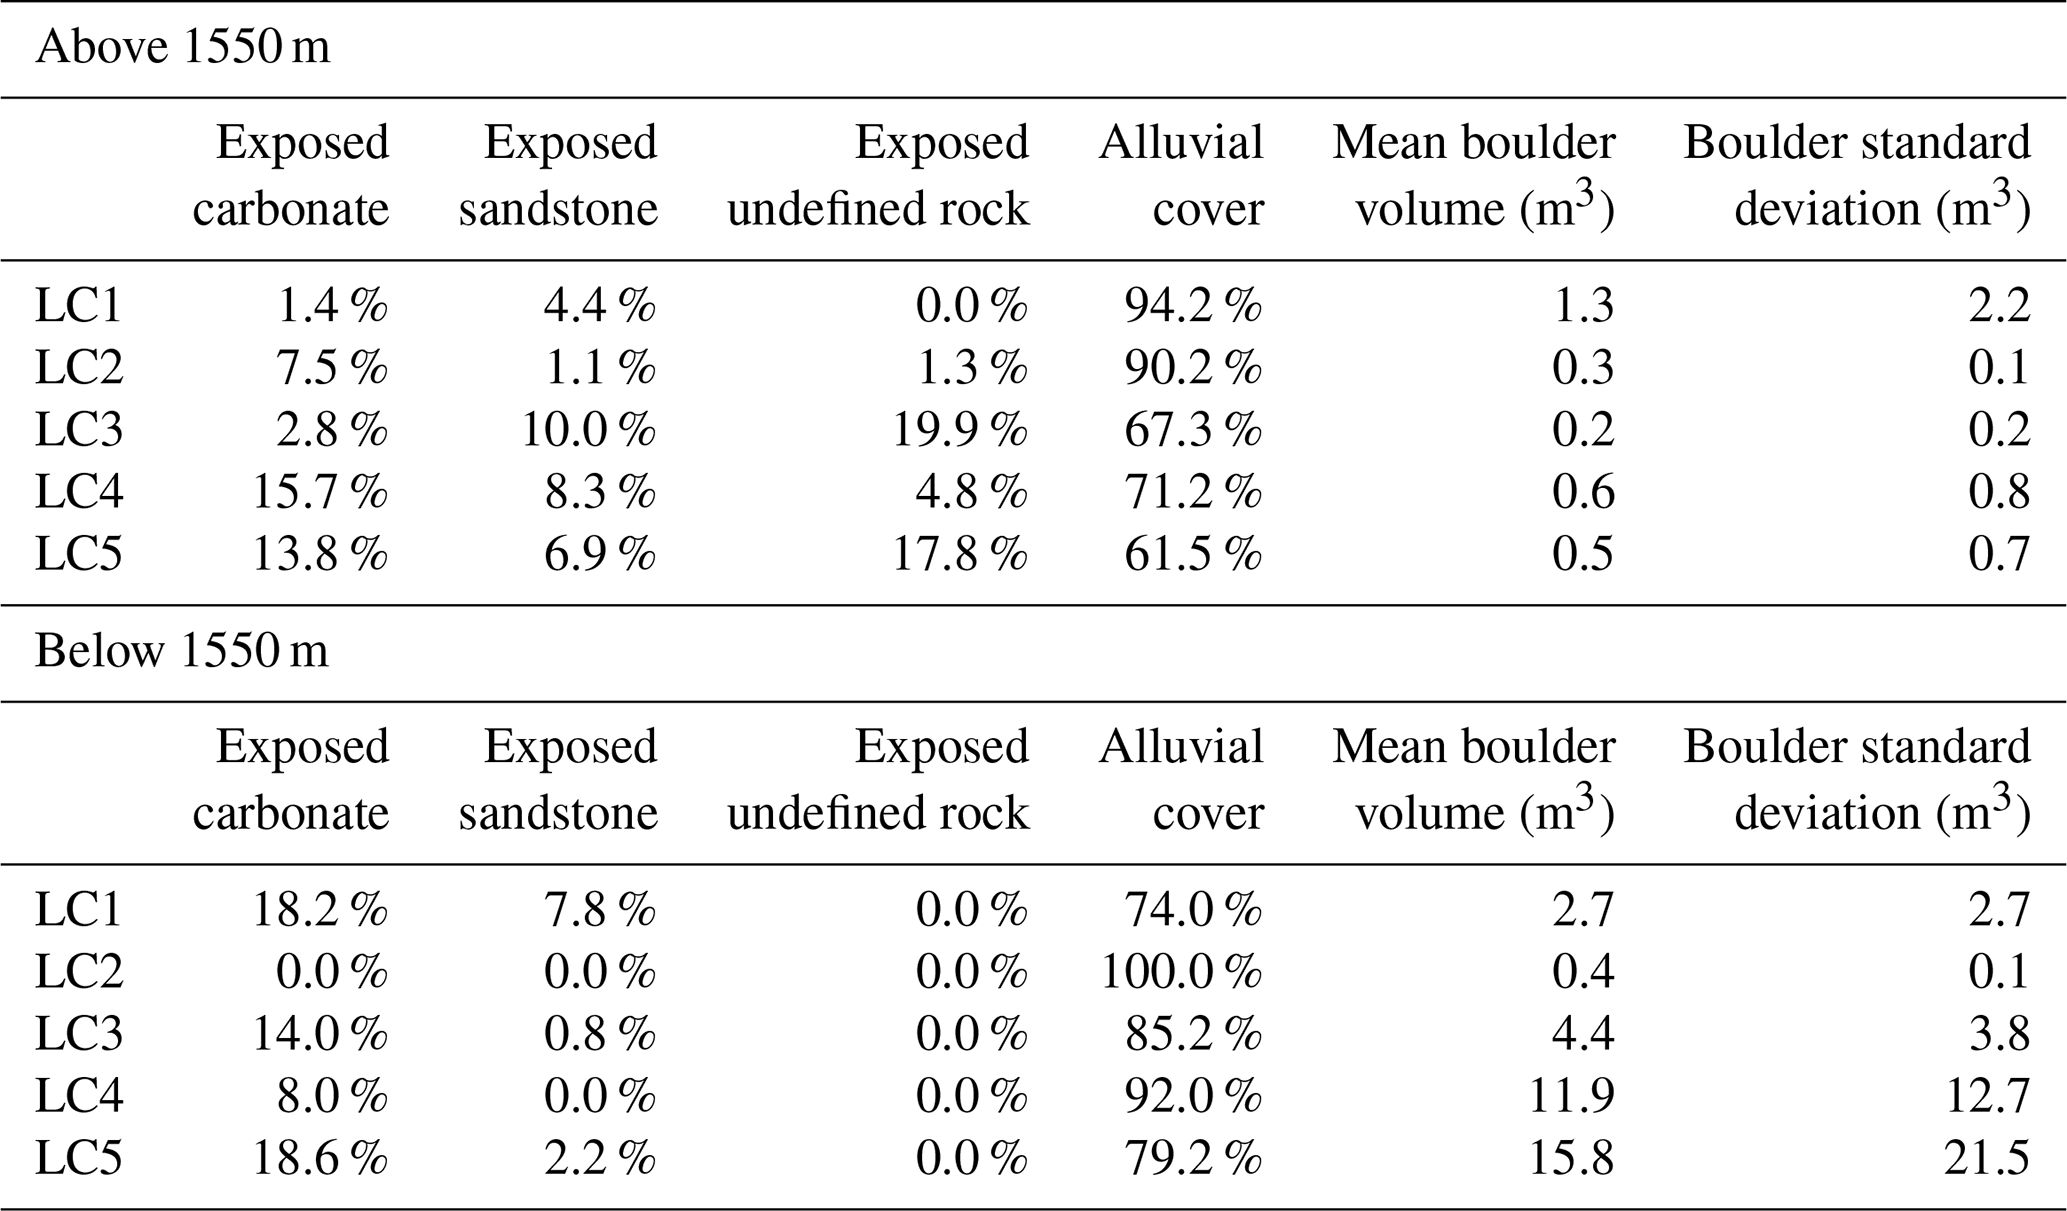
The extent of exposed sandstone and carbonate rock in the five study channels is presented in Table 1. The data are presented for above and below 1550 m elevation, which is the elevation at which the channel steepness index changes in LC3, LC4, and LC5. Due to limits on our field time, there are reaches of exposed bedrock above 1550 m that we were not able to sample, and these are labeled as “undefined rock”. In all the channels, except LC1, there is more alluvial cover downstream of 1550 m than above 1550 m.
Table 1Table describing the channel lithology and sediment cover characteristics in the steep and shallow sections of the five study channels.
Discontinuity intensity and Schmidt hammer values change with slope in the more thinly bedded sandstone rock but not in carbonate rock (Fig. 6). Because the units are horizontally to near-horizontally bedded, steeper stream channels cutting through thinly bedded sandstone rock have more exposed bedding planes than channels with lower slopes. They also have lower Schmidt hammer values (Fig. 6a). However, discontinuity intensity and rebound values are invariant with slope in the thickly bedded carbonate rock.
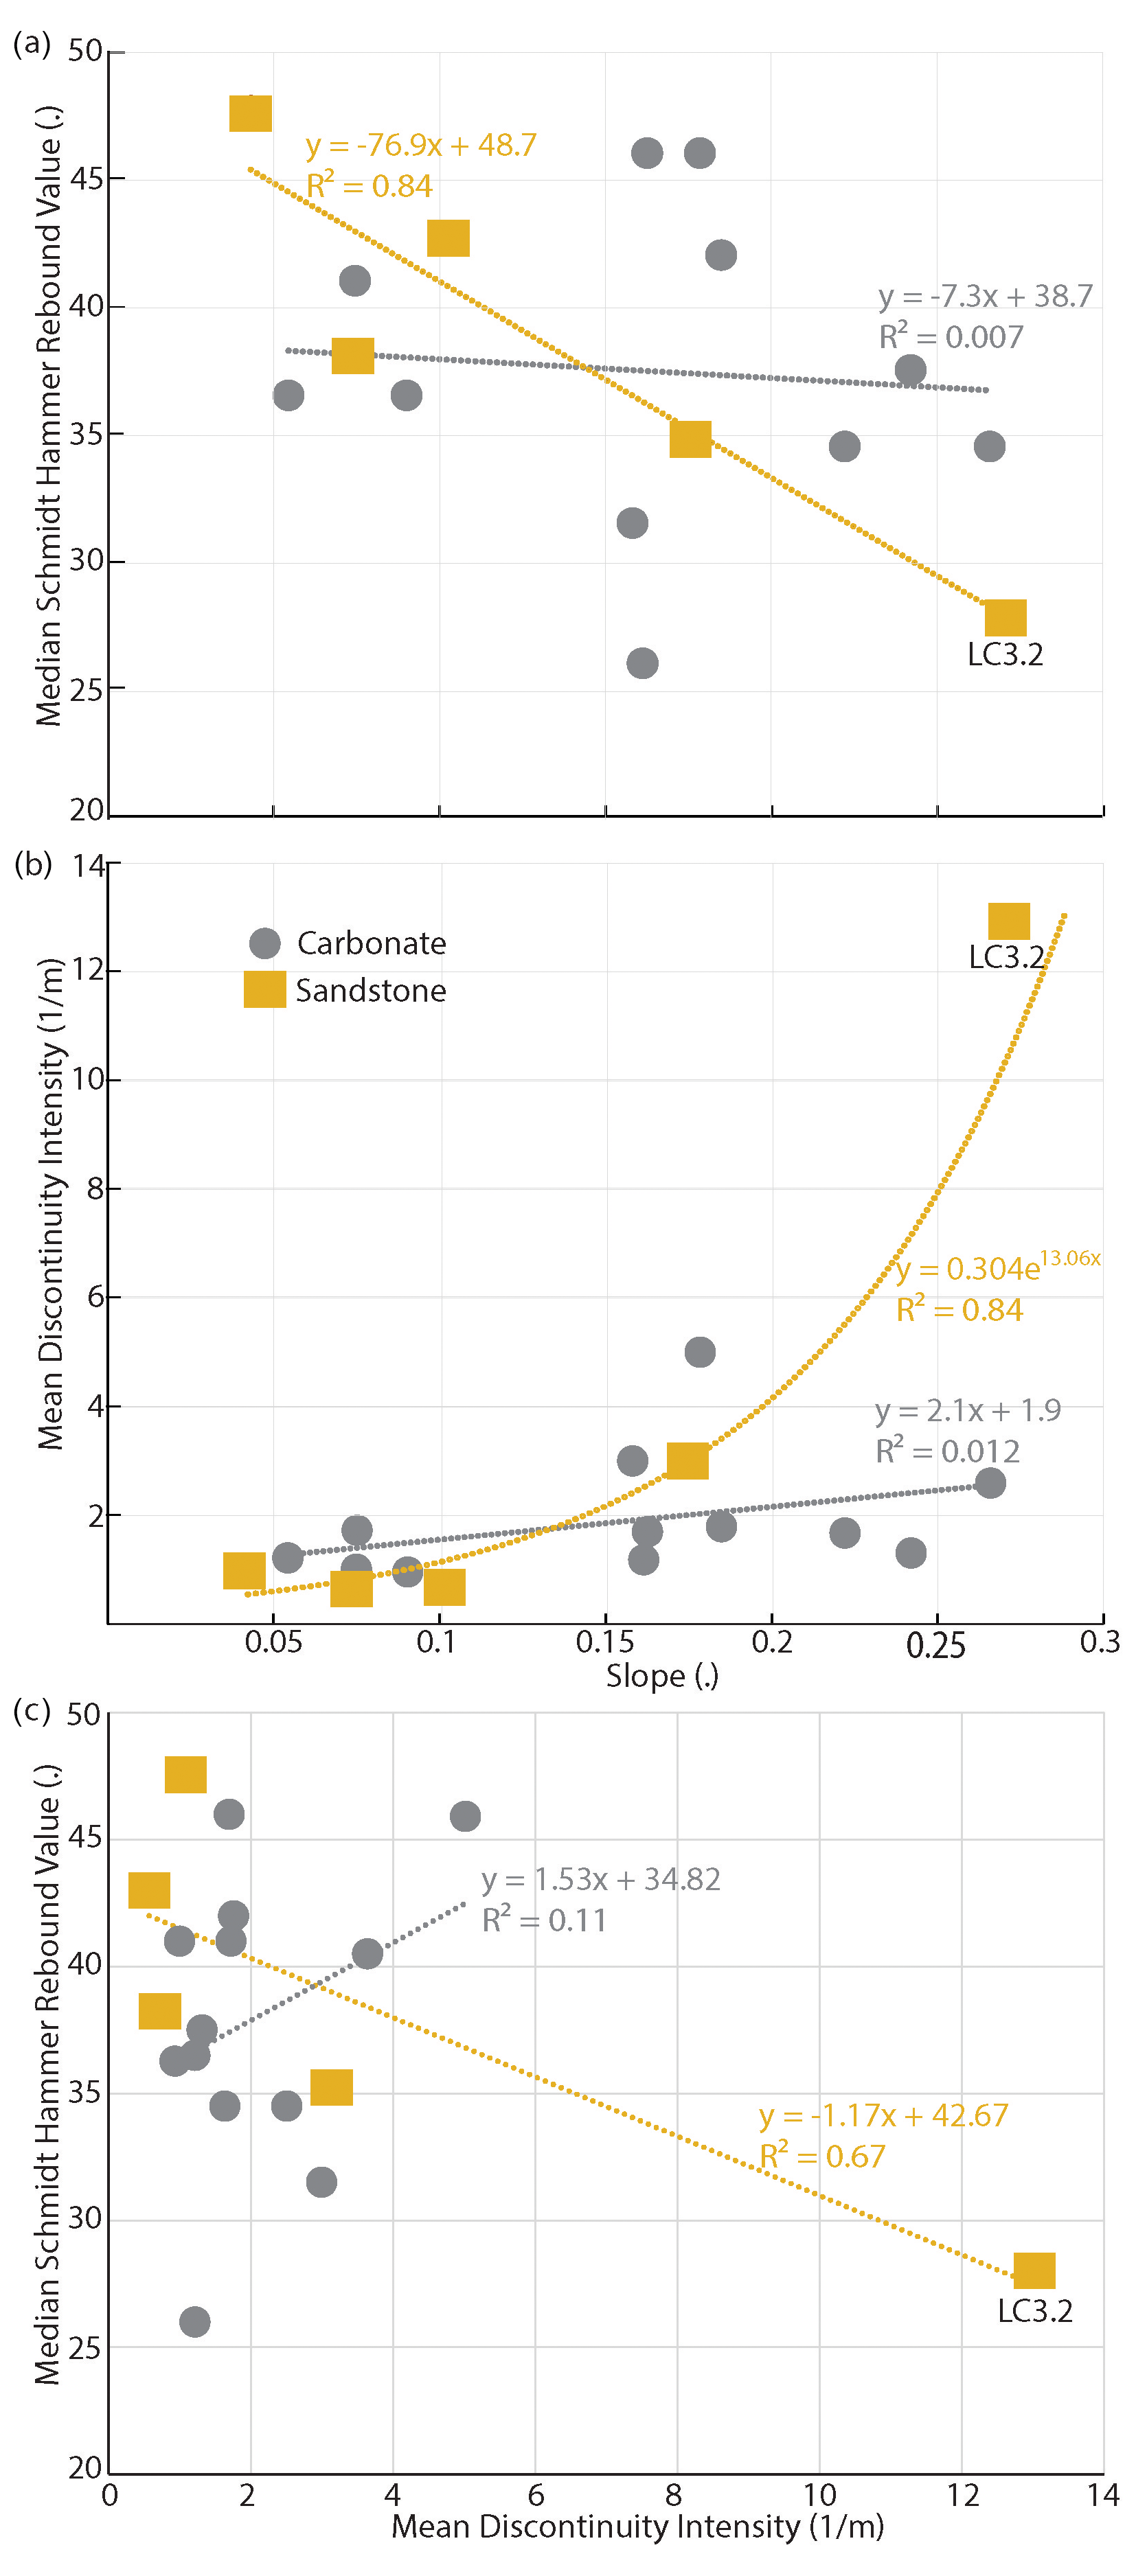
Figure 6(a) Median Schmidt hammer rebound value vs. channel slope (b). Mean discontinuity intensity vs. channel slope. We calculated the slope over a distance of 75 m downstream and 75 m upstream of each reach. (c) Median Schmidt hammer values vs. mean discontinuity intensity. All plots show data for 5 sandstone and 11 carbonate reaches. LC3.2, which was highlighted in Fig. 2 and shown in Fig. 4, is labeled.
The average discontinuity intensity and Schmidt hammer values from the thinly bedded sandstone in the steep channel section, where more bedding planes are exposed than in carbonate reaches, are 7.98 m−1 (n= 2 reaches; standard deviation σ= 5.04) and 31.6 (n= 61; σ= 9.5), respectively. The average discontinuity intensity of the thickly bedded carbonate in the steep channel section is 2.34 m−1 (n= 6; σ= 0.56), and they have an average Schmidt hammer value of 36.1 (n= 240; σ= 10.8). Within the upstream channel sections, the reaches have a shallower slope, with fewer exposed bedding planes per channel distance. In the shallower sandstone reaches, the measured discontinuity intensity is smaller at 0.77 m−1 (n= 3; σ= 0.16), but the average Schmidt hammer values are larger at 41.7 (n= 88; σ= 9.1), when compared with the sandstone in the steeper section. Carbonate reaches in the shallow channel sections have a slightly higher discontinuity intensity of 1.51 m−1 (n= 6; σ= 0.32) and an average Schmidt hammer value of 37.1 (n= 90; σ= 9.3), when compared with the shallow sandstone reaches. In carbonates, the discontinuity intensity and Schmidt hammer values are essentially uncorrelated with channel slope.
Table 2The list of the (a) discontinuity intensity values, (b) mean Schmidt hammer values, and (c) number of Schmidt hammer rebound values for sandstones and carbonates in the steep and shallow channel sections. Parts (a) and (b) include the differences (Delta) between the means of the same rock types or the same channel steepness. In part (b), the delta value in italics indicates that the Schmidt hammer populations are statistically the same, while bold delta values indicate that the populations are statistically different.
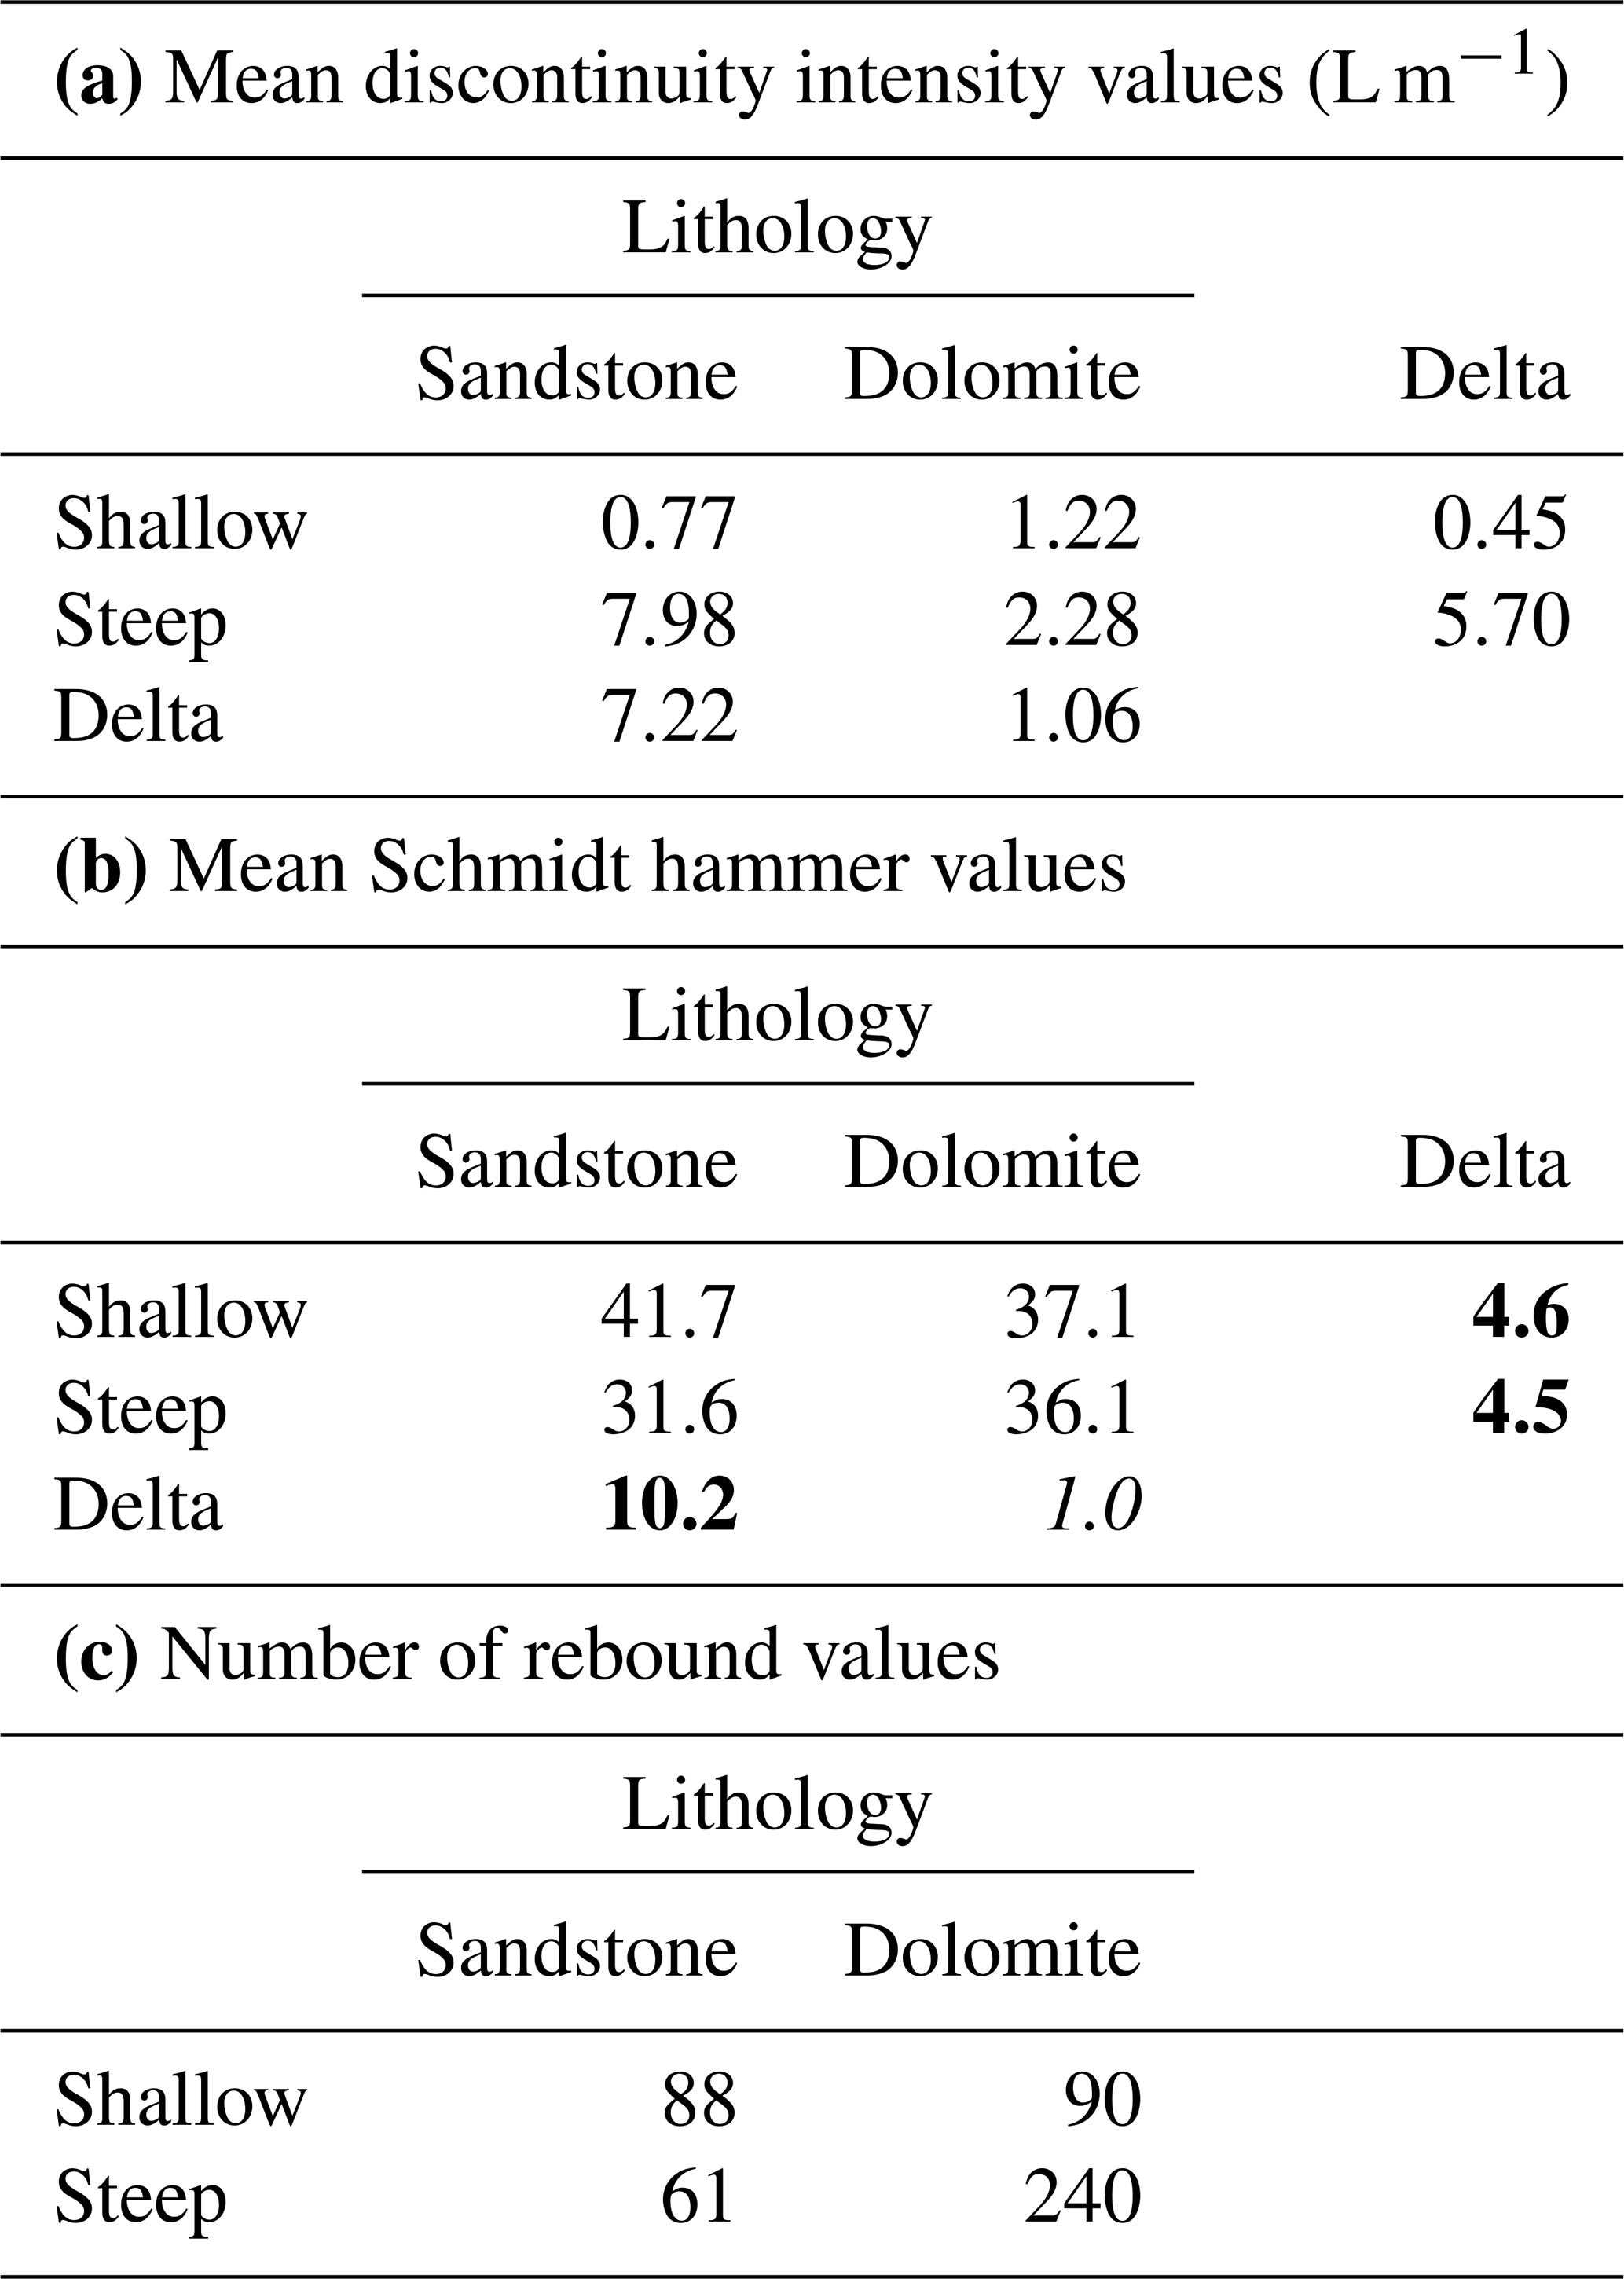
We calculated four separate t tests on Schmidt hammer measurements from the different rock types and channel sections in Last Chance Canyon to determine if they are sampled from different populations. The null hypothesis is that the populations of Schmidt hammer values in the carbonate and sandstone rocks are the same and/or do not vary between the lower-steepness (upstream) and higher-steepness (downstream) reaches. This would indicate that the rock strength of the two different rock types is statistically the same and would support the idea that the erodibility does not vary between rock types or within rock types or with channel steepness. Conversely, if the sampled Schmidt hammer values from different rock types are from statistically different populations, then this supports the idea that the different rock types have different strengths and possibly different erodibilities.
We compared the Schmidt hammer values between carbonate and sandstone reaches in the high (t= 3.0, tcritical = 2.6, and α= 0.05) and low (t= −3.4, tcritical = 2.6, and α= 0.05) ksn values in parts of the channel and found them both to be of different populations. In other words, in the high ksn value reaches of the channel, the sampled Schmidt hammer values from the carbonate and sandstone rocks are from statistically different populations. The same is true in the low ksn value reaches of the channel. The Schmidt hammer values for sandstone reaches in the steep section were found to be statistically different from the Schmidt hammer values from the sandstone in the shallow section (t= −6.6, tcritical = 2.6, and α= 0.05). Schmidt hammer values for carbonate reaches in steep and shallow sections were found to be from the same statistical population (t= −1.1, tcritical = 2.6, and α= 0.05), which was the null hypothesis. This was the only test of the four in which the null hypothesis was accepted and further demonstrates the lack of a strong correlation between channel slope and rock strength in carbonate reaches.
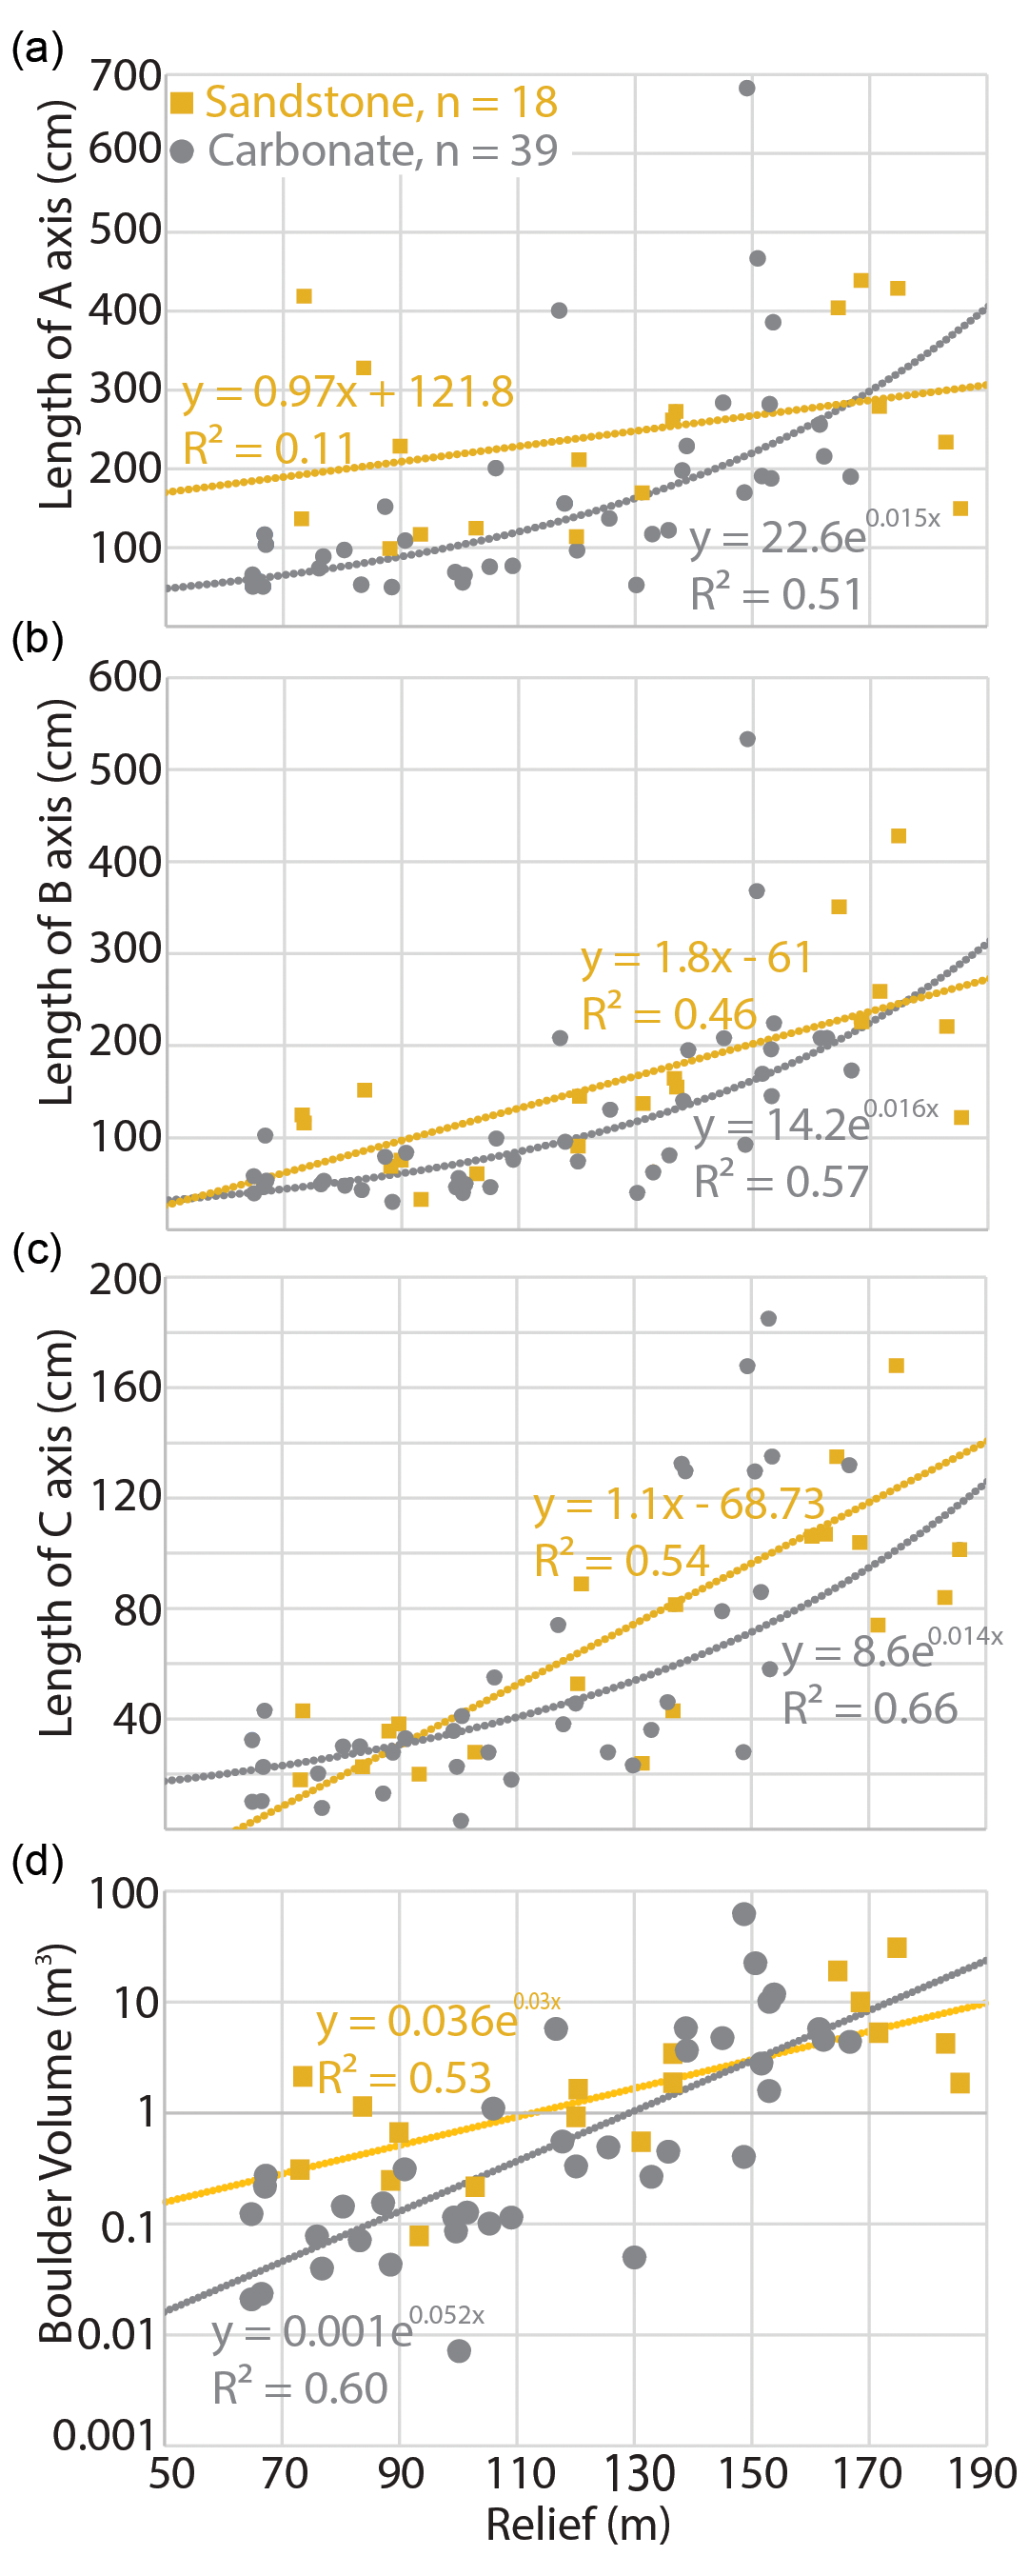
Figure 7Relief (calculated using a 500 m window) vs. the lengths of the a, b, and c axis and boulder volume, calculated by multiplying the a, b, and c axis for all of the boulders we measured in the field.
4.3 Boulder analysis
As the relief (calculated using a 500 m window) increases, the volume of the largest boulder in each reach tends to increase exponentially (Fig. 7). Carbonate boulders tend to show a larger change in volume with relief than sandstone boulders do. Of the boulders we measured, 70 % of the boulders in the high ksn channel section and 64 % of the boulders in the low ksn channel section are carbonate. The boulder shape is also somewhat different between sandstones and carbonates. We used a simple shape factor (i.e., the minimum boulder axis length divided by the maximum axis length) to quantify the differences. Carbonate boulders had an average shape factor of 0.36 (n= 39; σ= 0.17) compared to sandstone boulders, which had an average shape factor of 0.29 (n= 19; σ= 0.18). Although the difference is small, carbonate boulders were on average more equidimensional (short and long axes more similar), while sandstone boulders were more elongated (a greater proportional difference between axes).
The correlation between the a, b, and c axes and the relief is similar for the carbonate boulders we measured (R2>0.5; similar regression exponents from 0.014 to 0.016; Fig. 7). Lower relief corresponds to the upstream reaches. In the sandstone boulders we measured, the c axis correlates best with relief (R2= 0.54; regression slope of 1.1). The length of the b axis shows a slightly weaker relationship with the relief (R2= 0.46; regression slope of 1.8) than the c axis. The length of the a axis (R2= 0.11; regression slope of 0.97) correlates poorly with the relief. We fit an exponential trend line to the carbonate because it empirically gives a higher R2 than a linear regression. Conversely, when we fit a linear trend line to the sandstone boulders, it gave a higher R2 for the c axis. There was minimal difference between the R2 values for exponential and linear fits for the a and b axes of the sandstone boulders.
Bedrock properties vary between lithologies and etch their signal on the landscape morphology (Jansen et al., 2010; Scharf et al., 2013; Bursztyn et al., 2015; Yanites et al., 2017). In Last Chance Canyon, differences in the measured rock properties vary with changes in channel slope and local relief. Here, we introduce three key interpretations from our study.
-
Because discontinuity intensity affects rock strength, we interpret that thickly bedded carbonate bedrock in our study area has high rock strength and low rock erodibility. In contrast, we interpret that the more thinly bedded sandstone rock (in comparison with the carbonate rock) has low rock strength and high rock erodibility.
-
We interpret that sediment input from hillslopes, and not rock properties on the channel bed, can set the rock erodibility when channels are armored with sediment (following previous studies such as Duvall et al., 2004; Johnson et al., 2009; Finnegan et al., 2017; Keen-Zebert et al., 2017).
-
We interpret that steep slopes can be sustained even where the channel bed is relatively weak sandstone because larger and more competent carbonate sediment armors the bed.
Putting these three interpretations together, we hypothesize that despite the change from the low steepness upstream to the high steepness downstream in our study channels, this is a relatively stable morphology in the current situation. We hypothesize that the channel sections with high steepness are not eroding due to the more massive carbonate units and the large, immobile boulders armoring the channel, both of which lead to low channel erodibility. If the channel sections with high steepness are not actively eroding, then this creates a pinned base level for the low-steepness channel sections upstream. This pinned base level leads us to hypothesize that the high erodibility, low-steepness upstream channels are also not eroding, thus creating an overall stable morphology.
5.1 Lithology, discontinuity intensity, and bed slope
The local slope, bedding plane spacing, and fracture density control the discontinuity intensity at the reach scale in Last Chance Canyon. If we assume that all bedding planes and fractures are horizontal, then for a given length of the channel reach, steeper reaches cut across more discontinuities than shallower reaches (Fig. 8). We find that thinly bedded sandstone bedrock at our field site has anisotropic properties. Layers are weaker (as measured by lower Schmidt hammer rebound values and higher discontinuity intensities) when exposed in steep channels and are stronger in reaches with lower slopes that are more parallel to bedding plane orientation (Weissel and Seidl, 1997) (Fig. 6). When sandstone bedrock is eroded down to lower slopes that are sub-parallel to bedding, then the rock strength effectively increases and erodibility decreases, thus slowing further erosion.
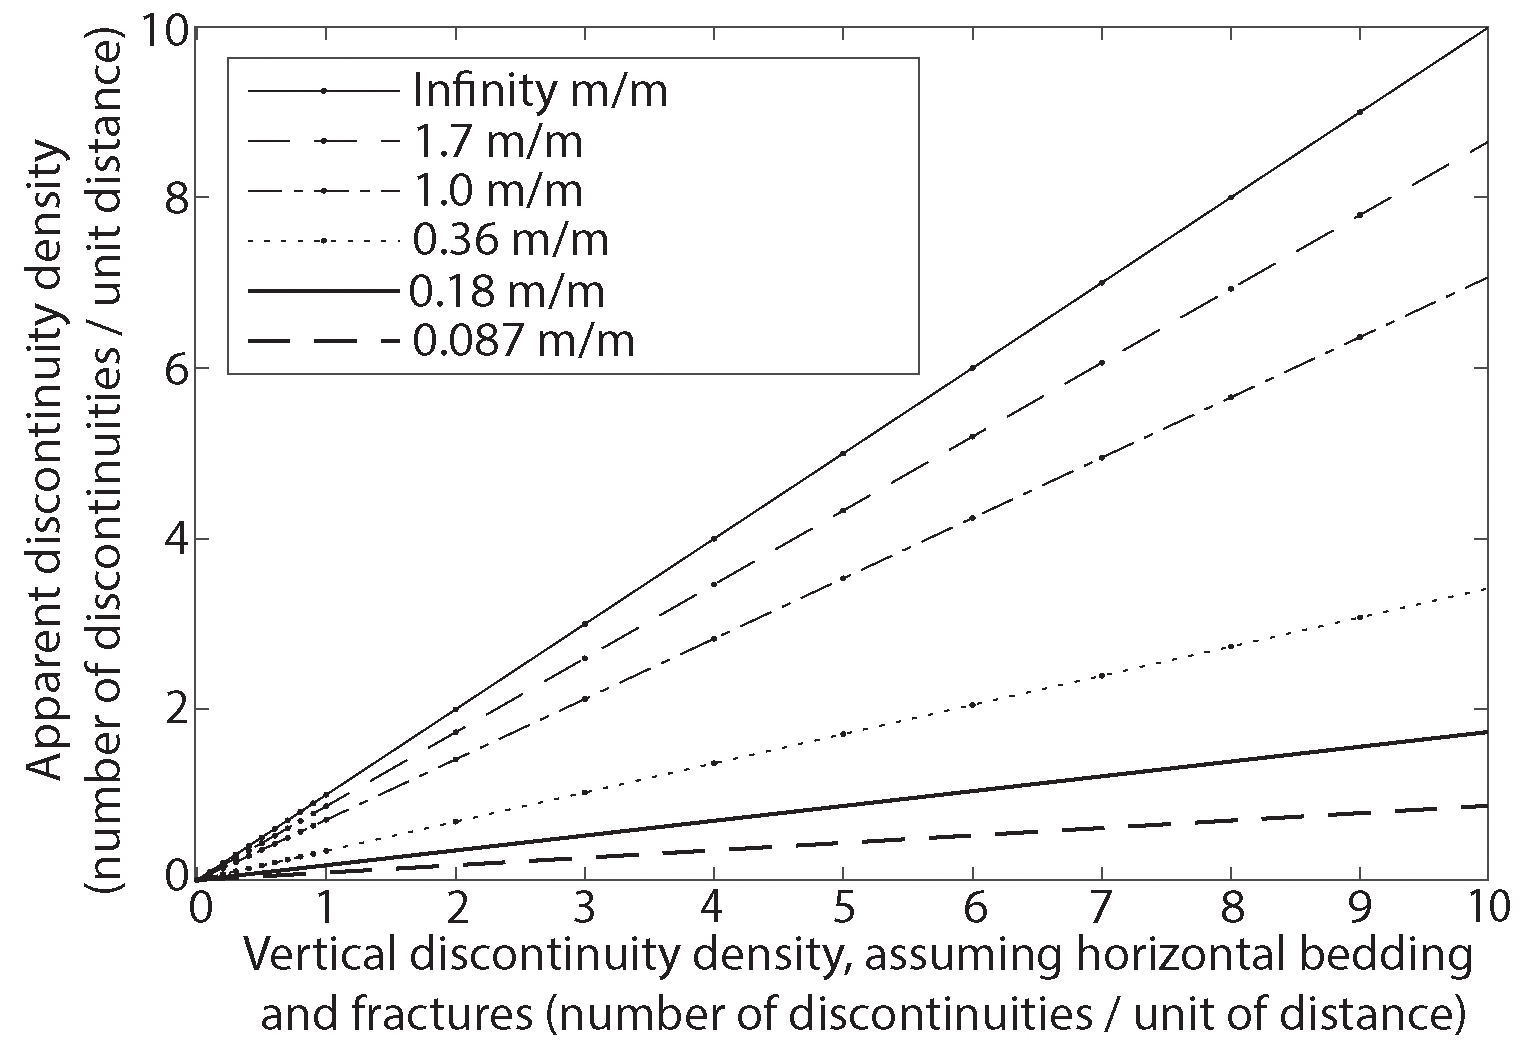
Figure 8Relationship between the measured discontinuity density along the bed (y axis) vs. the discontinuity density if measured on a face perpendicular to the discontinuities (x axis). Different lines represent channels with different slopes. Here the discontinuities are modeled as perfectly horizontal, so a perpendicular face is vertical (or 90∘), or infinity (m m−1).
This apparent reduction in the discontinuity density holds true regardless of the vertical discontinuity spacing (Fig. 8). However, the apparent reduction in the discontinuity intensity has less of an impact on the strength of the carbonate rock because even in the steep channel reaches the discontinuity intensity is low. We think this results in the carbonate rock strength being independent of channel slope at our field site (Fig. 6). Our statistical analysis of the Schmidt hammer values from carbonate bedrock in the shallow upstream and steep downstream channel sections confirmed that they are of the same population.
There is a lack of exposed sandstone rock in channel reaches with a higher slope. We only identified one sandstone reach in a steep downstream channel section. In surveyed channel reaches within the steeper downstream channel sections, we observed 0 % to 7.8 % of the channel to be exposed sandstone and 74 % to 100 % alluvial cover (Fig. 9; Table 1). In all five surveyed channels, the steeper downstream channel sections had more carbonate rock exposed than sandstone bedrock. We believe that our limited observation of the sandstone in the steep channel reaches is because, in comparison to the relatively hard carbonate rock, the relatively weak sandstone rock cannot maintain steep slopes. Where there is siliciclastic bedrock in the steep reaches, we interpret that it is armored by boulders.
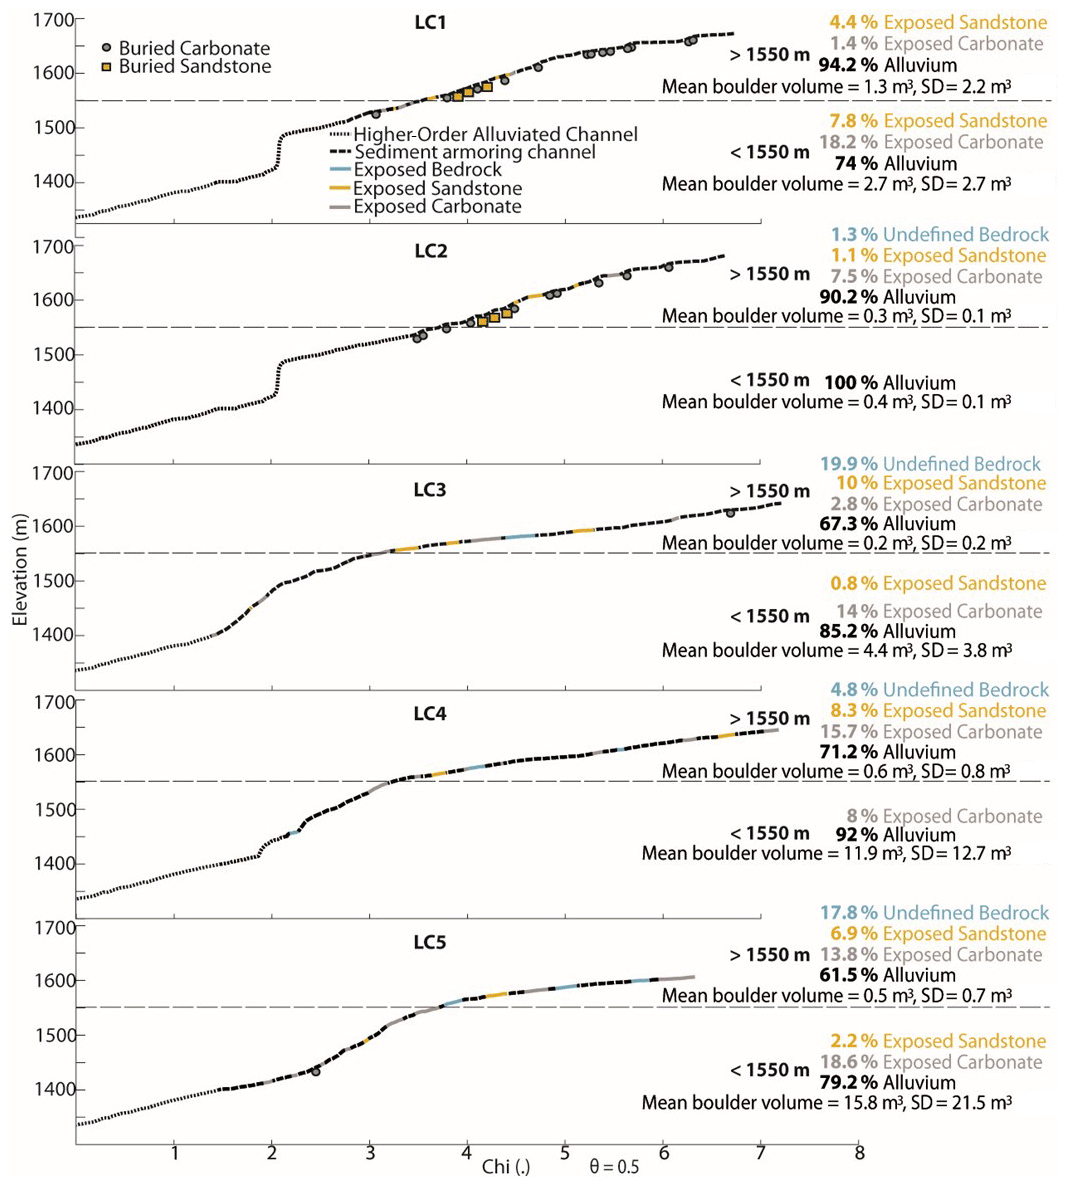
Figure 9χ plots of LC1–LC5 with exposed bedrock or sediment armored sections mapped. Where known, the rock type beneath the sediment is shown by either a gray dot to indicate carbonate or a tan square to indicate sandstone. To the left of each channel, the relevant statistics for each channel are displayed from 1400–1550 m and above 1550 m. Average boulder volumes, which we measured in the field, above and below 1550 m elevation are shown, along with the corresponding standard deviations. Higher-order alluviated channels are locations outside of our study area.
In summary, the landscape seemingly reflects the tendency of sandstone rock to erode to low slopes, creating a bimodal landscape. In the shallow upstream channel section, there are more thinly bedded siliciclastic units exposed. In contrast, the steep channel section is mostly made up of thickly bedded carbonate rock or is inundated with sediment, resulting in a lower erodibility channel.
5.2 Lithology and coarse sediment production
More thickly bedded and higher-relief hillslopes contribute larger-sized and more geomorphically relevant boulders from the hillslopes to the channel (Neely et al., 2020; Fig. 7). The steep channel sections of Last Chance Canyon are incised into relatively narrow canyons when compared with the upstream, low-steepness portions of the landscape. Hillslope-derived sediment from the thickly bedded units in the canyon wall armors the channel bed in the steep reaches. We think that these boulder deposits allow the relatively weak sandstone channel reaches to steepen through boulder deposition, as has been shown elsewhere (Shobe et al., 2016; Thaler and Covington, 2016; Chilton and Spotila, 2020). We assume that there are carbonate reaches that are also armored in sediment. However, where bedrock is exposed in the steep channels, it is predominantly carbonate rocks, which are harder and presumably less erodible than the sandstone reaches (see the subsection above). Within these steep channel sections which are inundated with sediment, we interpret that the channel slope is somewhat independent of the bedrock properties and instead depends on the amount, size, and competency of sediment armor sourced from proximal hillslopes. In other words, we think that the larger sediment armoring the steep reaches effectively decreases the erodibility of these reaches.
Bed thickness and fracture patterns control the initial size of the sediment supplied by hillslopes to channels (Sklar et al., 2017; Verdian et al., 2021; Shobe et al., 2021). In Last Chance Canyon, the maximum length of one axis of a boulder entering a channel from proximal hillslopes is controlled by the distance between bedding planes and fractures. In carbonate bedrock, the distance between bedding planes tends to be longer than in the sandstone bedrock. Where hillslope relief increases, bedrock units are thicker, and the length of the a, b, and c axes increases for the carbonate boulders (Fig. 7). (We do not have measurements of discontinuity intensity from the hillslopes. Our observations were that steep hillslopes were primarily composed of massive carbonate.) In sandstone boulders, the c axis correlates with hillslope relief; the b axis length also correlates with relief, but to a lesser extent; and the a axis length does not demonstrate any relationship with relief. Because sandstone bedrock is more thinly bedded, the c axis (shortest) will tend to reflect the distance between bedding planes from the source rock.
The carbonate boulders are more equidimensional and have a higher average shape factor of 0.36 in comparison with the sandstone boulders which have an average shape factor of 0.29. Although small, this difference in shape factor may reflect how the distance between bedding planes affects the sediment shape. Because a sediment grain tends to break across its shortest axis, the more elongated sandstone boulders are less competent than carbonate boulders (Allan, 1997). Abrasion also reduces the boulder size and may decrease the size of elongate boulders more rapidly (e.g., Miller et al., 2014). Also, this could be why there were fewer sandstone than carbonate boulders. Of the 58 boulders we measured, 70 % in the steep channel section and 64 % in the shallow channel section were carbonate. Because carbonate bedrock is thickly bedded, boulders sourced from this bedrock tend to be larger. Furthermore, because the carbonate boulders are more equidimensional, they likely stay larger for longer than sandstone boulders.
5.3 Are Last Chance Canyon channels adjusted to reflect rock properties?
We interpret that erosion in the steep reaches of our study channels is inhibited due to the presence of thick and resistant bedrock and large boulders that we interpret to be immobile. The downstream portions of our study channels are both steeper and have higher-steepness indices than the upstream channel lengths (Figs. 5 and 9), and high-steepness indices are thought to correlate with high-erosion rates and/or less erodible rocks (Hilley and Arrowsmith, 2008). Although we do not have measurements of erosion rate in Last Chance Canyon, we make the link between channel steepness and erodibility by assuming all channel reaches have a similar low-erosion rate. In other parts of the Guadalupe Mountains, west of Last Chance Canyon, erosion rates do not vary systematically with the rock type or with the slope (Tranel and Happel, 2020). We suggest that the spatial variations in erodibility, rather than spatial variations in erosion rates, control channel steepness in our study channels.
We further hypothesize that the upstream channel sections also have low-erosion rates but for a different reason. These channel reaches have lower slope and lower channel steepness indices (Figs. 5 and 9). The upstream channel reaches are less armored and have more sandstone exposed in the channel than their downstream reaches. These observations suggest that these upstream reaches are likely more erodible. Past erosion has reduced channel slopes, leading to lower channel steepness.
The distinct upstream low-steepness channel and downstream high-steepness channel are not consistent in all of our study channels. χ plots for channels LC3, LC4, and LC5 demonstrate two well-defined channel sections, where in the higher-elevation, lower-relief, and lower-slope section above 1550 m, there is more exposed bedrock, more exposed sandstone, less alluvium, and smaller boulders armoring the channel (Fig. 9). In contrast, LC1 and LC2 lack the obvious transition from downstream steep section to upstream shallow section observed in LC3, LC4, and LC5. We interpret that the less notable change in upstream steepness in LC1 and LC2 is due to the armoring of sandstone rock units and relative abundance (in comparison with LC3, LC4, and LC5) of alluvium above 1550 m elevation. Lithology measurements from proximal hillslopes in LC1 and LC2 indicate that just above 1550 m elevation, there are sandstone units in the channel, as there are in LC3, LC4, and LC5, but they are buried by alluvium in LC1 and LC2 (Fig. 9; Table 1). We note that the transition to a lower steepness occurs at a higher elevation in LC1 and LC2, at about 1640 m (Fig. 5), and it may be less distinct in comparison with LC3, LC4, and LC5. We do not know why there is more extensive armoring in LC1 and LC2 in comparison with LC3, LC4, and LC5. One possibility for this armor is the outcropping of the queen formation on the hillslopes above LC1 and LC2 but not above LC3, LC4, and LC5 (Fig. 2). Regardless of the reason, the fact that LC1 and LC2 remain steep even when the channel bed is sandstone supports our idea that sediment cover can hide the properties of the local bedrock and impact channel morphology.
Through landscape evolution modeling using the stream power model (Eq. 1), Forte et al. (2016) showed that where more erodible rocks upstream are underlain by less erodible rocks downstream, the upstream reaches can have an effectively pinned base level, such that channel steepnesses evolve to reflect the contrast in rock properties. Our overall interpretation of the Last Chance Canyon landscape is consistent with bedrock properties exerting this type of control. We also note that Perne et al. (2017) demonstrated that if topography is adjusted to bedrock erodibility in horizontally layered rocks, then erosion rates should only be consistent if measured parallel to the layering. We interpret the Last Chance Canyon landform to approximate a steady-state geometry but relative to the horizontal bedding over time (Perne and Covington, 2017). Our bedrock property data also illustrate the challenges in directly linking measurable rock properties to bedrock channel reach erodibility. However, our data also suggest that coarse sediment – rarely mobile boulders which reflect nearby bedrock eroding from hillslopes but not the local channel bed itself – are a key mechanism by which lithologic contrasts are expressed in this landscape. Future work could explore how boulder transport may move and disperse zones of lithologic control downstream of boulder source areas. Regardless, we interpret that the bimodal topography in Last Chance Canyon – with low- to high-steepness channels and less steep to steeper hillslopes – has evolved to reflect the rock properties of the two dominant lithologies, both locally and nonlocally.
5.4 The Guadalupe Mountains beyond Last Chance Canyon
Our ability to hypothesize about the impact of rock properties on landscape morphology in Last Chance Canyon required extensive observations and field and lab measurements. Even in our small study area of 8 km2, the morphology of channels LC1 and LC2 varies from LC3, LC4, and LC5 above 1550 m. Our measurements of sediment cover and buried rock type allowed us to hypothesize why these channels are different, despite incising into the same stratigraphic units. This led to a consistent process interpretation, despite different landscape morphologies.
South of Last Chance Canyon, in the main escarpment of the Guadalupe Mountains where channels drain to the southeast (Fig. 1), the reef complex led to more massive carbonate deposits. Those deposits now form prominent peaks, such as El Capitan, in the southernmost part of the Guadalupe Mountains. The longevity of these peaks and the strength of the deposits that form them suggest that the reef complex deposits are less erodible than the surrounding deposits. Given the complex local and nonlocal role of rock properties in channel morphology and the different rock units that outcrop beyond Last Chance Canyon, we are hesitant to project our interpretations of how rock properties impact channel morphology to the greater Guadalupe Mountains. However, we think that the methods laid out in this paper, along with the modeling frameworks of how rock erodibility contrasts impact channel evolution (Forte et al., 2016; Perne et al., 2017), present a guide for deconvolving the complex role of rock properties in channel morphology in the broader Guadalupe Mountains and beyond.
We present several observations about the effects of rock properties on bedrock channel steepness in tributaries of Last Chance Canyon. We suggest that discontinuity intensity influences channel steepness. Streams steepen across carbonate units that have thicker beds and lower discontinuity intensities in comparison with the sandstone in this area. Conversely, channel steepness is lower in channel reaches incised into thinly bedded sandstone units with higher discontinuity intensity.
The extent of sediment cover and the size of boulders in the channel also impact channel morphology. More thickly bedded carbonate bedrock on the hillslopes contributes larger alluvium to the channel. This coarse carbonate sediment armors both the more and less thickly bedded bedrock and smooths the channel slope across reaches with different lithologies and discontinuity intensities. In Last Chance Canyon, channel sections that contain larger carbonate alluvium amounts are generally steeper, even if the channel bed is siliciclastic with high discontinuity intensity.
Finally, we interpret that the study reaches have evolved to a relatively stable morphology adjusted to bedrock erodibility and local coarse sediment supply. The more erodible shallow channel reaches at the top of Last Chance Canyon have a base level that is pinned by the steep, and less erodible, channel downstream. Any downcutting of the steep channel reaches downstream will likely result in corresponding lowering in the lower slope and more erodible reaches upstream, maintaining a similar channel profile through time.
Data are available at https://doi.org/10.5281/zenodo.8370596 (Anderson, 2023).
SA wrote the original draft, curated the data, worked with software, and validated the work. SA, NG, and JJ helped with the conceptualization, formal analysis, funding acquisition, investigation, methodology, project administration, resources, supervision, visualization, and review and editing of the paper.
The contact author has declared that none of the authors has any competing interests.
Publisher’s note: Copernicus Publications remains neutral with regard to jurisdictional claims in published maps and institutional affiliations.
We would like to thank Olivia Boraiko, Nicole Herman, Autumn Murray, and Grace Guryan for their assistance with field work.
We would like to thank Brent Goehring for assistance with developing our methodology and for letting us use his lab.
We would like to thank Adeline Henderson, Claire Hudson, and Joseph William Firkaly-Paciera III for helping us with data analysis.
We would like to thank Conor Kolk, Kaiti Fink, and Holly Haseleu for their support.
We would like to thank Abdul Waheb, Sabrina Martinez, Laurent Roberge, Sergio Villamarin, Adam Forte, Matt Covington, Erin Lynch, and Sam Fragua for the helpful conversations about science and/or about Last Chance Canyon.
We acknowledge funding support from the National Science Foundation that made this research possible through the GEO-EAR-GLD awards (grant no. 1918459 for Nicole Gasparini; grant no. 1918351 for Joel Johnson). We also recognized funding support from Tulane Newcomb College Institute.
This research has been supported by the Division of Earth Sciences (grant no. 1918459) and the National Science Foundation (grant nos. 1918459 and 1918351).
This paper was edited by Jens Turowski and reviewed by two anonymous referees.
Agisoft PhotoScan Professional: (Version 1.4.5) (Software), Agisoft [code], http://www.agisoft.com/downloads/installer, 2018.
Allen, J. R.: Morphodynamics of Holocene salt marshes: a review sketch from the Atlantic and Southern North Sea coasts of Europe, Quaternary Sci. Rev., 16, 939–975, 1997.
Anderson, S.: y05emite-sam/data_from_last_chance_canyon: data, Zenodo [data set], https://doi.org/10.5281/zenodo.8370596, 2023.
Bell, F. G.: Engineering Geology and Construction, Elsevier, https://books.google.com.tr/books?hl=en&lr=&id=m1uSzpaD_V8C&oi=fnd&pg=PR9&dq=Bell,+F.+G.+sandstone++60+%25+quartz&ots=rpJxkVWXYu&sig=xQSq7yojrPLD8zqwt3Ai50_7Dn0&redir_esc=y#v=onepage&q&f=false (last access: 5 October 2023), 2005.
Brocard, G. Y. and van der Beek, P. A.: Influence of incision rate, rock strength, and bedload supply on bedrock river gradients and valley-flat widths: Field-based evidence and calibrations from western Alpine rivers (southeast France), in: Tectonics, Climate, and Landscape Evol., edited by: Willett, S. D., Hovius, N., Brandon, M. T., and Fisher, D., GSA Special Paper 398, 101–126, https://doi.org/10.1130/2006.2398(07), 2006.
Bursztyn, N., Pederson, J. L., Tressler, C., Mackley, R. D., and Mitchell, K. J.: Rock strength along a fluvial transect of the Colorado Plateau – quantifying a fundamental control on geomorphology, EPS Letters, 429, 90–100, https://doi.org/10.1016/j.epsl.2015.07.042, 2015.
Chapin, C. E., Cather, S. M., and Keller, G. R.: Tectonic setting of the axial basins of the northern and central Rio Grande rift, Special Papers – GSA, 5–5, https://books.google.co.ke/books?hl=en&lr=&id=ybECAQAAQBAJ&oi=fnd&pg=PA5&dq=Tectonic+setting+10+of+the+axial+basins+of+the+northern+and+central+Rio+Grande+rift&ots=Ru1VGg1uOX&sig=7CoXBM4ueT81r8y1x-zFxvqAnYk&redir_esc=y#v=onepage&q=Tectonic%20setting%2010%20of%20the%20axial%20basins%20of%20the%20northern%20and%20central%20Rio%20Grande%20rift&f=false (last access: 5 October 2023), 1994.
Chilton, K. D. and Spotila, J. A.: Preservation of Valley and Ridge topography via delivery of resistant, ridge-sourced boulders to hillslopes and channels, Southern Appalachian Mountains, USA, Geomorphology, 365, 107263, https://doi.org/10.1016/j.geomorph.2020.107263, 2020.
Chilton, K. D. and Spotila, J. A.: Uncovering the Controls on Fluvial Bedrock Erodibility and Knickpoint Expression: A High-Resolution Comparison of Bedrock Properties Between Knickpoints and Non-Knickpoint Reaches, J. Geophys. Res.-Earth, 127, e2021JF006511, https://doi.org/10.1029/2021JF006511, 2022.
Darling, A. and Whipple, K.: Geomorphic constraints on the age of the western Grand Canyon, Geosphere, 11, 958–976, https://doi.org/10.1130/GES01131.1, 2015.
Decker, D. D., Polyak, V. J., Asmerom, Y., and Lachniet, M. S.: U–Pb dating of cave spar: a new shallow crust landscape evolution tool, Tectonics, 37, 208–223, 2018.
DiBiase, R. A., Rossi, M. W., and Neely, A. B.: Fracture density and grain size controls on the relief structure of bedrock landscapes, Geology, 46, 399–402, https://doi.org/10.1130/G40006.1, 2018.
Duvall, A., Kirby, E., and Burbank, D.: Tectonic and lithologic controls on bedrock channel profiles and processes in coastal California, J. Geophys. Res.-Earth, 109, F03002, https://doi.org/10.1029/2003JF000086, 2004.
Forte, A. M., Yanites, B. J., and Whipple, K. X.: Complexities of landscape evolution during incision through layered stratigraphy with contrasts in rock strength, Earth Surf. Proc. Land., 41, 1736–1757, https://doi.org/10.1002/esp.3947, 2016.
Finnegan, N. J., Klier, R. A., Johnstone, S., Pfeiffer, A. M., and Johnson, K.: Field evidence for the control of grain size and sediment supply on steady-state bedrock river channel slopes in a tectonically active setting, Earth Surf. Proc. Land., 42, 2338–2349, 2017.
Gasparini, N. M. and Brandon, M. T.: A generalized power law approximation for fluvial incision of bedrock channels, J. Geophys. Res.-Earth, 116, F02020, https://doi.org/10.1029/2009JF001655, 2011.
Hack, J. T.: Studies of longitudinal stream profiles in Virginia and Maryland, US Government Printing Office, Vol. 294, US Government Printing Office, https://books.google.co.ke/books?hl=en&lr=&id=BMHMKaKYdl0C&oi=fnd&pg=PA47&dq=:+Studies+of+longitudinal+stream+profiles+in+Virginia+and+Maryland,&ots=waYis_Thas&sig=a-ZBqu9_qeGLiBY2pJ1e89TmhDU&redir_esc=y#v=onepage&q=%3A%20Studies%20of%20longitudinal%20stream%20profiles%20in%20Virginia%20and%20Maryland%2C&f=false (last access: 29 September 2023), 1957.
Harel, M.-A., Mudd, S. M., and Attal, M.: Global analysis of the stream power law parameters based on worldwide 10Be denudation rates, Geomorphology, 268, 184–196, https://doi.org/10.1016/j.geomorph.2016.05.035, 2016.
Healy, D.,. Rizzo, R. E., Cornwell, D. G., Farrell, N. J. C., Watkins, H., Timms, N. E., Gomez-Rivas, E., and Smith, M.: FracPaQ: A MATLABTM toolbox for the quantification of fracture patterns, J. Struct. Geol., 95, 1–16, 2017.
Hill, C. A.: Geology of Carlsbad Cavern and other caves in the Guadalupe Mountains, New Mexico and Texas, New Mexico Bur. Mines Min. Resour. Bull., 117, 1–150, 1987.
Hill, C. A.: Geology of the Guadalupe Mountains: An overview of recent ideas, Caves and karst of southeastern New Mexico: Guidebook, 57th Field Conference, New Mexico Geological Society, Guidebook, 57th Field Conference, Albuquerque, 145–150, https://nmgs.nmt.edu/publications/guidebooks/downloads/57/57_p0145_p0150.pdf (last access: 5 October 2023), 2006.
Hill, C. A.: Overview of the geologic history of cave development in the Guadalupe Mountains, New Mexico, J. Cave Karst Stud., 62, 60–71, 2000.
Hilley, G. E. and Arrowsmith, J. R.: Geomorphic response to uplift along the Dragon's Back pressure ridge, Carrizo Plain, California, Geology, 36, 367–370, 2008.
Hoffman, L. L.: Spatial variability of erosion patterns along the eastern margin of the Rio Grande Rift, Illinois State University, https://ir.library.illinoisstate.edu/cgi/viewcontent.cgi?article=1184&context=etd (last access: 5 October 2023), 2014.
Howard, A. and Dolan, R.: Geomorphology of the Colorado River in the Grand Canyon, J. Geol., 89, 269–298, 1981.
Howard, A. D.: A detachment-limited model of drainage basin evolution, Water Resour. Res., 30, 2261–2285, 1994.
Hurst, M. D., Mudd, S. M., Yoo, K., Attal, M., and Walcott, R.: Influence of lithology on hillslope morphology and response to tectonic forcing in the northern Sierra Nevada of California, J. Geophys. Res.-Earth, 118, 832–851, 2013.
Jansen, J. D., Codilean, A. T., Bishop, P., and Hoey, T. B.: Scale dependence of lithological control on topography: Bedrock channel geometry and catchment morphometry in western Scotland, J. Geol., 118, 223–246, 2010.
Johnson, J. P. L., Whipple, K. X., Sklar, L. S., and Hanks, T. C.: Transport slopes, sediment cover, and bedrock channel incision in the Henry Mountains, Utah, J. Geophys. Res.-Earth, 114, F02014, https://doi.org/10.1029/2007JF000862, 2009.
Johnstone, S. A. and Hilley, G. E.: Lithologic control on the form of soil-mantled hillslopes, Geology, 43, 83–86, 2015.
Katz, O., Reches, Z., and Roegiers, J.-C.: Evaluation of mechanical rock properties using a Schmidt Hammer, Int. J. Rock Mech. Min., 37, 723–728, 2000.
Keen-Zebert, A., Hudson, M. R., Shepherd, S. L., and Thaler, E. A.: The effect of lithology on valley width, terrace distribution, and bedload provenance in a tectonically stable catchment with flat-lying stratigraphy, Earth Surf. Proc. Land., 42, 1573–1587, 2017.
Kerans, C., Zahm, C., Garcia-Fresca, B., and Harris, P. M.: Guadalupe Mountains, West Texas and New Mexico: Key excursions, AAPG Bull., 101, 465–474, 2017.
Kirby, E. and Whipple, K. X.: Expression of active tectonics in erosional landscapes, J. Struct. Geol., 44, 54–75, 2012.
Lai, L. S.-H., Roering, J. J., Finnegan, N. J., Dorsey, R. J., and Yen, J.-Y.: Coarse sediment supply sets the slope of bedrock channels in rapidly uplifting terrain: Field and topographic evidence from eastern Taiwan, Earth Surf. Proc. Land., 46, 2671–2689, https://doi.org/10.1002/esp.5200, 2021.
Lague, D., Hovius, N., and Davy, P.: Discharge, discharge variability, and the bedrock channel profile, J. Geophys. Res.-Earth, 110, F04006, https://doi.org/10.1029/2004JF000259, 2005.
Miller, K. L., Szabó, T., Jerolmack, D. J., and Domokos, G.: Quantifying the significance of abrasion and selective transport for downstream fluvial grain size evolution, J. Geophys. Res.-Earth, 119, 2412–2429, https://doi.org/10.1002/2014JF003156, 2014.
Montgomery, D. R. and Gran, K. B.: Downstream variations in the width of bedrock channels, Water Resour. Res., 37, 1841–1846, https://doi.org/10.1029/2000WR900393, 2001.
Mueller-Hagmann, M., Albayrak, I., Auel, C., and Boes, R. M.: Field investigation on 256 hydroabrasion in high-speed sediment-laden flows at sediment bypass tunnels, Water, 12, 469, https://doi.org/10.3390/w12020469, 2020.
Murphy, B., Johnson, J., Gasparini, N., and Sklar, L.: Chemical weathering as a mechanism for the climatic control of bedrock river incision, Nature, 532, 223–227, https://doi.org/10.1038/nature17449, 2016.
National Park Service Resources Inventory Program Lakewood Colorado: Digital geologic map of Guadalupe Mountains National Park and vicinity, Texas (NPS, GRD, GRE, GUMO), https://catalog.data.gov/dataset/digital-geologic-gis-map-of-guadalupe-mountains-national-park-and-vicinity-texas-nps-grd-g (last access: 5 October 2023), 2007.
Niedzielski, T., Migoń, P., and Placek, A.: A minimum sample size required from Schmidt hammer measurements, Earth Surf. Proc. Land., 34, 1713–1725, 2009.
Perne, M., Covington, M. D., Thaler, E. A., and Myre, J. M.: Steady state, erosional continuity, and the topography of landscapes developed in layered rocks, Earth Surf. Dynam., 5, 85–100, https://doi.org/10.5194/esurf-5-85-2017, 2017.
Perron, J. T. and Royden, L.: An integral approach to bedrock river profile analysis, Earth Surf. Proc. Land., 38, 570–576, 2013.
Phelps, R. M., Kerans, C., Scott, S. Z., Janson, X., and Bellian, J. A.: Three-dimensional modelling and sequence stratigraphy of a carbonate ramp-to-shelf transition, Permian Upper San Andres Formation, Sedimentology, 55, 1777–1813, 2008.
PRISM Climate Group: 30-yr Normal Precipitation: Annual, Period 1991–2020, Oregon State University, https://prism.oregonstate.edu (last access: 8 March 2023), 2022.
Raming, L. W. and Whipple, K. X.: When knickzones limit upstream transmission of base-level fall: An example from Kaua'i, Hawai'i, Geology, 50, 1382–1386, 2022.
Ricketts, J. W., Karlstrom, K. E., Priewisch, A., Crossey, L. J., Polyak, V. J., and Asmerom, Y.: Quaternary extension in the Rio Grande rift at elevated strain rates recorded in travertine deposits, central New Mexico, Lithosphere, 6, 3–16, 2014.
Scharf, T. E., Codilean, A. T., De Wit, M., Jansen, J. D., and Kubik, P. W.: Strong rocks sustain ancient postorogenic topography in southern Africa, Geology, 41, 331–334, 2013.
Scholle, P. A., Ulmer, D. S., and Melim, L. A.: Late-stage calcites in the Permian Capitan Formation and its equivalents, Delaware Basin margin, west Texas and New Mexico: evidence for replacement of precursor evaporites, Sedimentology, 39, 207–234, 1992.
Schwanghart, W. and Scherler, D.: Short Communication: TopoToolbox 2 – MATLAB-based software for topographic analysis and modeling in Earth surface sciences, Earth Surf. Dynam., 2, 1–7, https://doi.org/10.5194/esurf-2-1-2014, 2014.
Scott, D. N. and Wohl, E. E.: Bedrock fracture influences on geomorphic process and form across process domains and scales, Earth Surf. Proc. Land., 44, 27–45, https://doi.org/10.1002/esp.4473, 2019.
Selby, M. J.: Rock mass strength and the form of some inselbergs in the central Namib Desert, Earth Surf. Proc. Land., 7, 489–497, 1982.
Shobe, C. M., Tucker, G. E., and Anderson, R. S.: Hillslope-derived blocks retard river incision, Geophys. Res. Lett., 43, 5070–5078, https://doi.org/10.1002/2016GL069262, 2016.
Shobe, C. M., Bennett, G. L., Tucker, G. E., Roback, K., Miller, S. R., and Roering, J. J.: Boulders as a lithologic control on river and landscape response to tectonic forcing at the Mendocino triple junction, GSA Bulletin, 133, 647–662, 2021a.
Shobe, C. M., Turowski, J. M., Nativ, R., Glade, R. C., Bennett, G. L., and Dini, B.: The role of infrequently mobile boulders in modulating landscape evolution and geomorphic hazards, Earth-Sci. Rev., 220, 103717, https://doi.org/10.1016/j.earscirev.2021.103717, 2021b.
Sklar, L. S. and Dietrich, W. E.: Sediment and rock strength controls on river incision into bedrock, Geology, 29, 1087–1090, 2001.
Sklar, L. S. and Dietrich, W. E.: A mechanistic model for river incision into bedrock by saltating bed load, Water Resour. Res., 40, W06301, https://doi.org/10.1029/2003WR002496, 2004.
Sklar, L. S., Riebe, C. S., Marshall, J. A., Genetti, J., Leclere, S., Lukens, C. L., and Merces, V.: The problem of predicting the size distribution of sediment supplied by hillslopes to rivers, Geomorphology, 277, 31–49, 2017.
Spotila, J. A., Moskey, K. A., and Prince, P. S.: Geologic controls on bedrock channel width in large, slowly eroding catchments: Case study of the New River in eastern North America, Geomorphology, 230, 51–63, https://doi.org/10.1016/j.geomorph.2014.11.004, 2015.
Strahler, A. N.: Quantitative analysis of watershed geomorphology, EOS, Transactions American Geophys. Union, 38, 913–920, 1957.
Stock, J. D. and Montgomery, D. R.: Geologic constraints on bedrock river incision using the stream power law, J. Geophys. Res.-Sol. Ea., 104, 4983–4993, 1999.
Thaler, E. A. and Covington, M. D.: The influence of sandstone caprock material on bedrock channel steepness within a tectonically passive setting: Buffalo National River Basin, Arkansas, USA, J. Geophys. Res.-Earth, 121, 1635–1650, https://doi.org/10.1002/2015JF003771, 2016.
Tranel, L. M. and Happel, A. A.: Evaluating escarpment evolution and bedrock erosion rates in the western Guadalupe Mountains, West Texas and New Mexico, Geomorphology, 368, 107335, https://doi.org/10.1016/j.geomorph.2020.107335, 2020.
USGS: 1/3rd arc-second digital elevation models (DEMs), USGS National Map 3DEP downloadable data collection, https://data.usgs.gov/datacatalog/data/USGS:35f9c4d4-b113-4c8d-8691-47c428c29a5b (last access: 5 October 2023), 2017.
Verdian, J. P., Sklar, L. S., Riebe, C. S., and Moore, J. R.: Sediment size on talus slopes correlates with fracture spacing on bedrock cliffs: implications for predicting initial sediment size distributions on hillslopes, Earth Surf. Dynam., 9, 1073–1090, https://doi.org/10.5194/esurf-9-1073-2021, 2021.
Weissel, J. K. and Seidl, M. A.: Influence of rock strength properties on escarpment retreat across passive continental margins, Geology, 25, 631–634, 1997.
Whipple, K. X. and Tucker, G. E.: Dynamics of the stream-power river incision model: Implications for height limits of mountain ranges, landscape response timescales, and research needs, J. Geophys. Res.-Sol. Ea., 104, 17661–17674, https://doi.org/10.1029/1999JB900120, 1999.
Willett, S. D., McCoy, S. W., Perron, J. T., Goren, L., and Chen, C. Y.: Dynamic reorganization of river basins, Science, 343, 1248765, https://doi.org/10.1126/science.1248765, 2014.
Wobus, C., Whipple, K. X., Kirby, E., Snyder, N., Johnson, J., Spyropolou, K., Crosby, B., and Sheehan, D.: Tectonics from topography: Procedures, promise, and pitfalls, in: Tectonics, Climate, and Landscape Evolution, GSA, https://doi.org/10.1130/2006.2398(04), 2006.
Wohl, E. E., Greenbaum, N., Schick, A. P., and Baker, V. R.: Controls on Bedrock Channel Incision Along Nahal Paran, Israel, Earth Surf. Proc. Land., 19, 1–13, https://doi.org/10.1002/esp.3290190102, 1994.
Wolpert, J. A. and Forte, A. M.: Response of transient rock uplift and base level knickpoints to erosional efficiency contrasts in bedrock streams, Earth Surf. Proc. Land., 46, 2092–2109, 2021.
Yanites, B. J., Becker, J. K., Madritsch, H., Schnellmann, M., and Ehlers, T. A.: Lithologic effects on landscape response to base level changes: a modeling study in the context of the Eastern Jura Mountains, Switzerland, J. Geophys. Res.-Earth, 122, 2196–2222, 2017.