the Creative Commons Attribution 4.0 License.
the Creative Commons Attribution 4.0 License.
 | 11 Jan 2024
A high-resolution synthesis dataset for multistressor analyses along the US West Coast
Meghan Zulian
Sara L. Hamilton
Tessa M. Hill
Manuel Delgado
Carina R. Fish
Brian Gaylord
Kristy J. Kroeker
Hannah M. Palmer
Aurora M. Ricart
Eric Sanford
Ana K. Spalding
Melissa Ward
Guadalupe Carrasco
Meredith Elliott
Genece V. Grisby
Evan Harris
Jaime Jahncke
Catherine N. Rocheleau
Sebastian Westerink
Maddie I. Wilmot
Global trends of ocean warming, deoxygenation, and acidification are not easily extrapolated to coastal environments. Local factors, including intricate hydrodynamics, high primary productivity, freshwater inputs, and pollution, can exacerbate or attenuate global trends and produce complex mosaics of physiologically stressful or favorable conditions for organisms. In the California Current System (CCS), coastal oceanographic monitoring programs document some of this complexity; however, data fragmentation and limited data availability constrain our understanding of when and where intersecting stressful temperatures, carbonate system conditions, and reduced oxygen availability manifest. Here, we undertake a large data synthesis to compile, format, and quality-control publicly available oceanographic data from the US West Coast to create an accessible database for coastal CCS climate risk mapping, available from the National Centers for Environmental Information (accession 0277984) at https://doi.org/10.25921/2vve-fh39 (Kennedy et al., 2023). With this synthesis, we combine publicly available observations and data contributed by the author team from synoptic oceanographic cruises, autonomous sensors, and shore samples with relevance to coastal ocean acidification and hypoxia (OAH) risk. This large-scale compilation includes 13.7 million observations from 66 sources and spans 1949 to 2020. Here, we discuss the quality and composition of the synthesized dataset, the spatial and temporal distribution of available data, and examples of potential analyses. This dataset will provide a valuable tool for scientists supporting policy- and management-relevant investigations including assessing regional and local climate risk, evaluating the efficacy and completeness of CCS monitoring efforts, and elucidating spatiotemporal scales of coastal oceanographic variability.
- Article
(2004 KB) - Full-text XML
-
Supplement
(5314 KB) - BibTeX
- EndNote


Anthropogenic carbon dioxide (CO2) emissions are causing dramatic ocean warming, acidification, and deoxygenation (Caldeira and Wickett, 2003; Doney et al., 2009; Doney, 2010; Levitus et al., 2012). Interactions among these stressors can compound the severity of each, often synergistically reducing growth, metabolism, and survival of marine organisms across diverse taxa (e.g., Byrne and Przeslawski, 2013; Gobler and Baumann, 2016). Multiparameter extreme events are increasingly common and destructive (Burger et al., 2022; Breitburg et al., 2015). However, global ocean trends may be masked, modified, or overshadowed in coastal ecosystems by combinations of complex local oceanographic processes, terrestrial runoff, freshwater sources, and high local productivity (Borges and Gypens, 2010; Cai et al., 2011; Fassbender et al., 2011; Frieder et al., 2012; Bauer et al., 2013; Takeshita et al., 2015). Despite thorough documentation of global ocean responses to anthropogenic forcing, understanding more localized conditions in coastal environments, such as the California Current System (CCS), remains an active area of research. Improved understanding of spatiotemporal patterns of warming, deoxygenation, and acidification is key to informing climate resilience and adaptation planning for and by the diverse peoples and ecological communities that depend on the coastal CCS (Field and Francis, 2006; Hodgson et al., 2018; IPCC, 2019; Weisberg et al., 2020; Ward et al., 2022).
The CCS is an upwelling system where seasonal winds transport cold, low-oxygen, high-CO2 waters from depth up to nearshore surface environments (e.g,. Hickey, 1979; Huyer, 1983; Chavez and Messié, 2009). Upwelling intensity varies across small spatial and temporal scales and is typically concentrated in the spring and early summer (Hickey, 1979; Marchesiello et al., 2003; Garciá-Reyes and Largier, 2012; Jacox et al., 2018; Cheresh and Fiechter, 2020). During upwelling, extreme values of seasonal dissolved oxygen (DO) and carbonate chemistry parameters such as pH are naturally close to biologically significant thresholds, making organisms in the CCS particularly vulnerable to ocean acidification and hypoxia (OAH) events (e.g., Chan et al., 2008; Connolly et al., 2010; Feely et al., 2008; Gruber et al., 2012; Low et al., 2021; Kekuewa et al., 2022). Local adaptation to high environmental variability may provide some ecological resilience (e.g., Sanford and Kelly, 2011; Kelly and Hofmann, 2013; Donham et al., 2023), but widespread die-offs are already a feature of some OAH events (e.g., Grantham et al., 2004; Barton et al., 2015). The CCS is also vulnerable to warming and heatwaves (Cavole et al., 2016; Frölicher and Laufkötter, 2018; Rogers-Bennett and Catton, 2019; Sanford et al., 2019; Fumo et al., 2020; Cheung and Frölicher, 2020; Free et al., 2023). When extreme temperatures interact with low pH and low oxygen conditions, they can compound the vulnerability of organisms to environmental stressors (e.g., Kroeker et al., 2013; Swiney et al., 2017; Bednaršek et al., 2019; Howard et al., 2020b; Sunday et al., 2021). The balance between local upwelling intensity, warming-induced stratification, and both oceanic and terrestrial influences creates a spatiotemporal mosaic of coastal ocean conditions which, while previously acknowledged and documented (e.g., Feely et al., 2016a; Chan et al., 2017; Cheresh and Fiechter, 2020), remains incompletely described.
As a result of the connections between upwelling, low oxygen, and acidification events, models predict the CCS's vulnerability to extreme events will increase as climate change progresses (Gruber et al., 2012; Bakun et al., 2015). Relative to a preindustrial baseline, anthropogenic forcing has shallowed the depths of perennially corrosive and hypoxic conditions by more than 50 m (Bograd et al., 2008; Feely et al., 2008; Chan et al., 2008; Gruber et al., 2012). Modeled projections of the CCS suggest that pH levels are declining sufficiently swiftly that by 2035, the range of annual variability may no longer overlap with conditions present in the 2010s, while the calcium carbonate mineral aragonite could be perennially undersaturated at 100 m depth by 2045 (Hauri et al., 2013; Marshall et al., 2017). Meanwhile, nearshore DO content is expected to decline by 10–20 µmol kg−1 by the end of the century (Siedlecki et al., 2021). Upwelling-favorable winds may intensify under future warming (Sydeman et al., 2014; Bakun et al., 2015; Wang et al., 2015), although this effect may be counteracted in some locations by increased stratification of seawater layers (Howard et al., 2020a; Siedlecki et al., 2021) or in areas where wind-driven upwelling is not the dominant process (Garciá-Reyes and Largier, 2010). These competing forces might enhance the disparities between climate hot spots and refugia, underlining the importance of gathering and analyzing climate data with high spatiotemporal resolution.
Despite recognition of the complexity of CCS coastal climate stress, successfully capturing mesoscale, sub-seasonal, and very nearshore patterns of OAH and warming remains challenging. One impediment to unraveling this complexity is the decentralized and non-standardized nature of much OAH monitoring in the CCS, undertaken by governmental, non-profit, and academic centers with varying methodologies and approaches to data accessibility (Taylor-Burns et al., 2020). Further, existing synthesis datasets are not optimized for simultaneous analysis of nearshore warming, deoxygenation, and acidification risks (e.g., Hofmann et al., 2011b; Sharp et al., 2022). For chemical oceanographers and modelers, the Surface Ocean CO2 Atlas (SOCAT; Sabine et al., 2013; Bakker et al., 2016) and Coastal Ocean Data Analysis Product in North America (CODAP-NA; Jiang et al., 2021) are also valuable resources. However, the former includes only surface seawater observations of one principal parameter of the carbonate system, while the latter includes only discrete bottle observations from oceanographic cruises while excluding autonomous sensor observations and shore samples. SOCAT and CODAP-NA are high-quality and extremely well-curated, but the cost of their selectivity is that many available CCS OAH observations are not available through those compilations. In addition, there are a suite of nearshore ocean acidification, hypoxia, and temperature focused data collection efforts that use a variety of sensors and sampling techniques and have not yet been standardized or integrated. A deliberate synthesis of OAH-relevant datasets with standardized formatting and quality control maximizes our ability to explore, map, and resolve coastal climate stress on subregional scales (Bushinsky et al., 2019; Chan et al., 2019). By including both discrete and validated autonomous sensor observations across depths and targeting all carbonate system and OAH-relevant parameters, this synthesis can complement the strengths of tightly focused compilations such as SOCAT (Bakker et al., 2016) and CODAP-NA (Jiang et al., 2021). Additionally, by applying uniform QC standards and formatting to data across the CCS, this compilation builds on the usability, reliability, and spatiotemporal scale of currently available public nearshore compilations (e.g., Ruhl et al., 2021).
Here, we present the Multistressor Observations of Coastal Hypoxia and Acidification (MOCHA) synthesis, the highest resolution OAH-relevant US West Coast dataset to date. MOCHA is a compilation of published nearshore temperature, dissolved oxygen, and carbonate-chemistry-relevant datasets for the CCS and is newly archived and available at the National Centers for Environmental Information (NCEI; https://doi.org/10.25921/2vve-fh39; Kennedy et al., 2023), along with associated metadata and quality assurance in adherence with the FAIR data management principles (Wilkinson et al., 2016). We source published data from within US waters from oceanographic cruises, buoys, moorings, and shore samples as well as previously unpublished observations contributed by the author team and present them in a formatted, quality-controlled, downloadable database for easy access and analysis by scientific teams across disciplines (Fig. 1). While this synthesis is not exhaustive, it highlights real disparities in oceanographic monitoring intensity and provides future investigators the opportunity to compare and integrate their own datasets. This data compilation includes 13.7 million observations from 66 sources and spans 1949–2020. To illustrate some of the synthesis product's potential uses, we further include and discuss several “case examples” that showcase the largest portion of the MOCHA dataset and its complementary strengths to SOCAT and CODAP-NA. However, we note that the compilation includes records at depth and those extending hundreds of kilometers offshore. It is our hope that this synthesis product supports scientific investigations at a wide range of spatial and temporal scales and allows investigators to link between shallow and nearshore or coastal and oceanic environments. We anticipate that this synthesis product will be broadly useful to OAH-focused investigative teams and particularly impactful for coastal scientists investigating policy- and management-relevant projects, such as investigating spatiotemporal variation in marine climate risk from OAH events and warming, evaluating the efficacy and completeness of CCS monitoring efforts, linking oceanographic conditions to coastal social or socio-economic considerations across large geographic ranges (e.g., Ward et al., 2022), evaluating spatial management zones such as aquaculture sites (Clements and Chopin, 2017) and marine protected areas (e.g., Hamilton et al., 2023), and pursuing other questions of interest to coastal communities.
Figure 1All individual locations for temperature (a), dissolved oxygen (b), and pH (c) observations included in this synthesis along the US West Coast. The pH extent fully captures the extent of all other carbonate system parameters. These figures overstate the useful spatial density of these data, as many individual locations have only been sampled once, but highlight the limited scale of available carbonate system observations relative to more commonly assessed parameters like temperature and dissolved oxygen.
2.1 Data sources and types
This project compiled published and publicly available data, as well as previously unpublished data contributed by the author team, including multiparameter OAH-relevant observations from shipboard discrete water samples, in situ autonomous sensors, and shore-collected samples from along the US West Coast. We primarily sourced multiparameter data through existing public data portals, such as NCEI and the Integrated Ocean Observing System (IOOS) portals, but additionally contacted colleagues to request their assistance in locating additional datasets, presented the project at conferences and management meetings to collect community feedback on included datasets, and scanned published literature that likely included relevant datasets. We prioritized datasets that included carbonate system or dissolved oxygen observations in addition to temperature. When available alongside our target parameters, we also incorporated published chlorophyll and nutrient contents. In all cases, we took the published or publicly hosted data as our starting point, rather than asking for unprocessed data from the original investigators, then applied additional quality-control measures described in Sect. 2.4. We have limited this publication to data collected before 2020 and within US waters, but we will continue to incorporate new observations according to the methods outlined below, where possible, and will periodically make updated versions of this synthesis dataset publicly available at NCEI (https://doi.org/10.25921/2vve-fh39; Kennedy et al., 2023) as support becomes available.
The data in this synthesis come from a wide array of observational methods and instruments. We screened carbonate system datasets before incorporating them following the discussions of method reliability summarized in Martz et al. (2015). The carbonate system observational methods adhere to one of the following observation methods: (1) discrete seawater samples, preserved at the time of collection and analyzed in a lab with established standards and techniques (e.g., Dickson, 2010), of pH, total alkalinity (TA), and dissolved inorganic carbon (DIC); (2) pH measurements from ion-sensitive field-effect-transistor-based autonomous sensors (e.g., Honeywell Durafet; Martz et al., 2010) or spectrophotometric sensors (e.g., SAMI-pH; Lai et al., 2018); and (3) pCO2 measurements from autonomous equilibrium-based infrared gas analyzers (e.g., MAPCO2; Sutton et al., 2014) or spectrophotometric methods (e.g., SAMI-CO2; Schar et al., 2009). We did not include pH measured on glass electrode sensors, due to known issues with precision and calibration (Martz et al., 2010). We discarded any dissolved oxygen and carbonate system datasets that lacked accompanying temperature data. While we preferred carbonate system observations that also included salinity measurements, we retained pH and pCO2 data without concurrent salinity measurements if they passed all other QC checks (e.g., Chan et al., 2017; Donham et al., 2023). Data collection methods are available for all parameters except temperature and salinity and have been simplified into four groups: (1) “discrete”, for bottle-collected samples analyzed in a laboratory; (2) “CTD” (conductivity, temperature, and depth), for observations from ship-side profiles with autonomous sensor arrays; (3) “autonomous sensors”, for stationary instruments collecting data at pre-programmed intervals; and (4) “handheld sensors”, for observations collected in the field via a glass-electrode probe. The specific instruments associated with each data source are available in the dataset metadata table in the Supplement and archived at NCEI, accession 0277984 (MOCHA_metadata_table_v2.csv; Kennedy et al., 2023).
2.2 Formatting
After identifying a dataset of interest, we downloaded all available processed data and metadata, including descriptive papers, primary investigator information, project and instrument descriptions, and the original source of the data. Each dataset was assigned a unique identifying number to ensure that every data point could be quickly associated with its parent data source and metadata (Table 1). For all datasets, we retained a copy of the original published data. We manipulated each original dataset into a comma-separated file with minimal alterations – typically limited to eliminating extra header rows and streamlining column names – before transferring datasets into R or Python for further formatting to ensure that all manipulations were trackable.
This synthesis dataset is structured such that each row represents an oceanographic observation from a shared time, depth, location, and data source which may include one or more individual parameter measurements. Parameter measurements are grouped with the parameter collection method, such as “discrete” or “autonomous sensor”, and the data quality flag in adjacent columns. Additionally, all observations are also accompanied by “sample scheme” and “habitat” columns to facilitate easy data filtering. The sample scheme column classifies each dataset as one of four types: “cruise” for ship-collected samples, “mooring” for autonomous instruments attached to buoys, “intertidal/subtidal autonomous sensor” for shore- or diver-accessed autonomous sensors, and “intertidal/subtidal discrete collection” for water samples collected by hand from a dock or the shore. The habitat column identifies observations as “estuarine” if they were collected within semi-restricted lagoons and bays (e.g., Humboldt Bay). All other observations are labeled as “oceanic”. For a full description of included parameters, refer to the submission metadata archived at NCEI (SubmissionForm_carbon_v1_428.csv; Kennedy et al., 2023) and the dataset metadata table in the Supplement.
We retained all directly measured chemical oceanographic observations as we incorporated each dataset, converted observations to standard units if necessary, and mapped them directly to our corresponding synthesis dataset columns. Fortuitously, all pH observations ingested into this compilation were already reported on the total pH scale. When necessary, we converted discrete pH observations reported at 25 ∘C to in situ conditions using accompanying temperature, salinity, pressure, carbonate system, and nutrient contents using the R package seacarb (Gattuso et al., 2023). We used the following constants for these calculations: K1 and K2 from Lueker et al. (2000), Kf from Perez and Fraga (1987), Ks from Dickson (1990), and total boron concentrations from Uppström (1974). We did not retain published data calculated from algorithms or empirical relationships, such as TA calculated from a TA–salinity relationship or pH derived from temperature, salinity, and DO measurements (e.g., Alin et al., 2012). While we note that published data may have been summarized or filtered by the initial investigators, we did not further summarize or filter data before including it in this compilation except for the Ocean Observatories Initiative (OOI) moorings (dataset 66) discussed below.
Table 1Overview of the data sources included in the MOCHA compilation. Potential measured parameters for each dataset include temperature (T), salinity (S), pH, partial pressure of CO2 (pCO2), fugacity of CO2 (fCO2), dissolved inorganic carbon (DIC), total alkalinity (TA), dissolved oxygen (DO), chlorophyll a (Chl), and nutrients (Nuts). Users need to be mindful of the difference between climate-quality and weather-quality datasets and assess the suitability of these datasets for their needs (Newton et al., 2015). The origins of all the included datasets in this compilation are further described in the dataset metadata table available in the Supplement and archived at NCEI (https://dx.doi.org/10.25921/2vve-fh39, dataset_metadata_table_v2.csv, Kennedy et al., 2023). Additional, detailed discussions of the following datasets have been previously published: 5 (Feely et al., 2008), 21–24 and 26 (Feely et al., 2016a), 25 (Bograd et al., 2003), 26 (Davis et al., 2018), 33 (Chan et al., 2017), 49 (Salop and Herrmann, 2019), 50 and 51 (Rosenau et al., 2021b), 56 (Donham et al., 2022b), 66 (Trowbridge et al., 2019), 67 (Bjorkstedt and Peterson, 2015), 68 (Risien et al., 2022a), 69 (Barth et al., 2021), 70 (Baptista et al., 2015), and 71 (Kekuewa et al., 2022).
∗ Previously unpublished data contributed by the authors.
2.3 Dataset 66: Ocean Observatories Initiative (OOI) moorings
The Washington and Oregon OOI mooring data (dataset 66) included millions of observations of temperature, salinity, dissolved oxygen, pH, and pCO2 at sub-minute resolutions. The size of these datasets required us to aggregate the data to daily mean values before incorporation into the larger synthesis dataset. Because many of these OOI data had not been previously quality-controlled, we contacted OOI staff for their guidance on initially filtering the raw data before aggregation. They provided extensive code developed by the sensor manufacturers and OOI staff to identify erroneous pH and DO data from the raw publicly available streams, available at https://github.com/oceanobservatories/ooi-data-explorations/tree/master/python (last access: 12 January 2022), as well as significant protocol guidance that has since been made public (Palevsky et al., 2022). OOI staff also provided access to discrete sample analyses taken at the sensor moorings to further ground-truth measurements. We only retained data for aggregation if it (1) passed through the provided OOI code's automated checks, (2) had discrete samples associated with the beginning and end of that sensor's deployment, (3) had daily mean sensor values for DO and pH on the day of discrete sampling within 20 µmol kg−1 of the discrete sample dissolved oxygen and/or 0.05 pH units, and (4) displayed reasonable DO content and pH values and variance over time, following OOI's suggested protocols for both automated and “human-in-the-loop” quality-control practices (Palevsky et al., 2022). We eliminated all DO data collected prior to 2018 based on advice of OOI staff because the DO sensors prior did not have adequate biofouling control. We then aggregated these data into daily mean values before formatting and quality-controlling them further following the practices described for all other incorporated datasets and described in Sect. 2.4.
2.4 Quality control
After formatting individual datasets, we checked all observations to standardize quality across datasets and to avoid using questionable data in future analyses. This quality standardization did not extend to raising all datasets to a “climate-quality” standard (Newton et al., 2015). Users of these data should be aware of the difference between climate-quality and weather-quality data, as both types of data are included in this synthesis and often coexist within the same datasets. Our quality-assurance/quality- control (QA/QC) methods drew from a combination of the publishing authors' notes, plots of the data, and expert knowledge of the CCS. The majority of our incorporated datasets had been previously published and subjected to at least automated QA/QC processes, but additional “human-in-the-loop” secondary QC was necessary for almost all datasets, particularly those from autonomous sensors (Pavlevsky et al., 2022). Incoming quality-control notes associated with each data source ranged widely, though most datasets that did include quality information followed the Quality Assurance/Quality Control of Real-Time Oceanographic Data (QARTOD) system, which assigns flags based on internal instrument checks, data reasonableness, and collection method (Bushnell, 2018). Given the variability in flagging schemes that incorporated datasets used and the impossibility of accurately assigning detailed QARTOD-style flags to datasets that did not include similarly detailed notes, we opted to create a simpler, three-level quality scheme that could be applied to all datasets. Using available existing QA/QC information and our further quality-control investigations, we categorized each individual parameter measurement as one of three confidence levels: 1 for “plausible and reasonable” data, 2 for data that we had not assessed, and 3 for “low-quality or unreliable” data. We flagged all data the publishing authors had listed as unreliable or suspect with a 3. Regardless of published notes, we assigned all other observations a flag of 2 before further evaluation by our team.
Given the diversity of the datasets and projects this synthesis draws from, we examined each dataset individually using a combination of plots tailored to maximize our ability to identify and evaluate anomalies in that dataset's specific oceanographic and spatiotemporal context. Given that this synthesis primarily sourced published data, we erred towards retaining data as “plausible”, rather than following a more stringent flagging philosophy. We recommend that investigators perform additional QC with the MOCHA dataset targeted towards their project requirements. Common quality-control plotting techniques included property–property plots of temperature, salinity, DO, pH, TA, and DIC against one another; single-parameter time series from sensor and long-running datasets; and map views and oceanographic cross sections of synoptic cruise data. We examined questionable data through as many different views as possible, such as examining apparent outliers in a temperature–salinity property–property plot individually in their respective time series, to ensure that we were not flagging real or plausible observations. When possible, we further evaluated suspicious observations against other datasets collected nearby. We discussed all data-flagging decisions with at least three project members. After this focused quality control, all observations not flagged as “low-quality or unreliable” (3) were upgraded to our “plausible and reliable” flag (1) with the exception of 300 surf zone DO measurements taken from the shore, which were left as “unevaluated” (2) since they do not reflect oceanic conditions. All subsequent mapping and analysis with the observed oceanographic values used only “plausible and reliable” data. For a full example of our formatting and flagging practices, please refer to the Supplement.
2.5 Example subset: daily data
High-resolution (sub-daily observations) autonomous sensors are an important component of this synthesis dataset, but the data they produce come with significant computational costs. Furthermore, variability on the scales of hours or minutes captured by such high-resolution records is less comparable to lower-resolution datasets such as those collected over quarterly or annual synoptic oceanographic cruises. To evaluate the spatiotemporal extent of our data coverage, seasonal patterns, and relationships between observed parameters, we created an aggregated summary dataset of daily mean values for each location, depth, and data source. We dropped all questionable individual parameter measurements (i.e., data flagged with a “3” QA/QC code) before creating this summary dataset to ensure that unreliable data did not influence averages. The daily averaging reduced the number of observations (rows) from 13.7 million to 1.2 million as high-resolution sensor datasets, some of which included multiple observations per hour, were each collapsed into a single row per day. We used this summary dataset in all following example cases that do not explicitly cite “original data”. This aggregated summary dataset is available alongside the full MOCHA compilation at NCEI (aggregated_daily_dataset.csv, Kennedy et al., 2023), and we have included the code necessary to recreate it in our public code repository (https://doi.org/10.5281/zenodo.10408321, Kennedy, 2023).
3.1 Overall data totals
This synthesis dataset includes observations from 66 individual data sources organized across 13.7 million rows (“observations”) and 41 columns and spans 1949–2020. This includes 24.1 million individual parameter measurements, with 13.2 million temperature, 3.6 million salinity, 3.3 million DO, 2.1 million pH, 1.2 million chlorophyll, 561 000 nutrient, 113 000 pCO2, 9300 TA, and 8300 DIC measurements. While we prioritized multiparameter datasets for this effort, our synthesis also includes several temperature-only, high-resolution records to fill specific project needs. The full suite of carbonate system parameters can be directly calculated from 48 000 observations with two reliable carbonate system parameter observations and co-occurring reliable temperature and salinity measurements.
Across sampling schemes, moorings contribute the bulk of the MOCHA observations with 8.9 million rows, followed by intertidal or subtidal autonomous sensors with 3.8 million, oceanographic cruise observations (which include CTD profiles) with 98 000, and finally intertidal and subtidal discrete collections with 24 000. By measurement method, autonomous sensors are the most common, contributing 5 million individual measurements, versus 224 000 individual discrete measurements, 193 000 CTD measurements, and 828 handheld field sensor measurements.
3.2 Aggregated daily data totals
Summarizing the data by day for each dataset, location, and depth provides a clearer picture of the availability of multiparameter data by diminishing the outsized influence of high-resolution temperature sensors. Of the 1.2 million daily averaged observations, just 104 000 are temperature-only. Individual parameter totals are shown in Table 2. Full carbonate system calculations could be performed on 12 000 of the daily observations with measurements of temperature, salinity, and two of the principal carbonate system parameters. As with the disaggregated, full dataset, data totals varied substantially by measurement method and autonomous sensors are still the most common, contributing 643 000 individual daily averaged parameter measurements versus 223 000 discrete, 192 000 CTD, and 816 handheld sensor measurements.
Table 2Overview of dissolved oxygen (DO), pH, dissolved inorganic carbon (DIC), and total alkalinity (TA) observation methods; number of daily observations (grouped by data source, location, and depth); and the overall reliability rates. Autonomous sensors are associated with slightly lower reliability rates due to periods of sensor biofouling or malfunction.
3.3 Flagging and reliability
The amount of original data flagged as unreliable varied substantially by dataset, parameter, and observation method but was typically low (Fig. 2). As the bulk of the data in this synthesis product were previously published and had undergone some preliminary QA/QC prior to our incorporation, high reliability rates were expected. Of the dozens of datasets contributing temperature and salinity observations, only one dataset had a parameter flag rate above 5 %. Flag rates above 10 % were uncommon for all parameters across all datasets and completely absent for TA and DIC observations. For pH and DO, flag rates within datasets were above 10 % for three and eight datasets, respectively. In each case, high rates of “unreliable” data were caused by (1) clear periods of autonomous sensor malfunction, (2) observational methods described by the publishing authors as unreliable, or (3), more rarely, intentionally higher QA/QC standards applied to data which had not been previously screened and published. The vulnerability of autonomous sensors to periods of biofouling or sensor malfunction contributed to higher flag rates relative to other methods, but all four methods were largely reliable (Table 2). Across the entire MOCHA compilation, 99.8 % of temperature, 96.8 % of salinity, 93.1 % of DO, 89.1 % of pH, 99.1 % of DIC, and 98.2 % of TA measurements were considered “reliable or plausible”. Across all individual measurements, 97.3 % are classified as reliable.
Figure 2The rate of unreliable (“flagged”) observations varied by dataset and parameter measured between temperature (T), salinity (S), dissolved oxygen (DO), pH, total alkalinity (TA), and dissolved inorganic carbon (DIC). Maximum unreliable flag rates were generally low, especially for T and S. All datasets that included measurements with >30 % flag rates used measurement methods described by the original publishers as “not quantitative”. Flag rates between 10 % and 30 % were uncommon but reflected occasional periods of fouling or equipment malfunction in high-resolution autonomous sensor datasets or, in rare cases, more stringent standards applied to datasets that had not been previously published and initially quality-controlled.
3.4 Spatiotemporal data distribution
This dataset spans the US West Coast and reflects the spatiotemporal bias of observational records. Observations are more common in nearshore, near-surface environments and exhibit greater sampling effort in recent years. A total of 56 % of daily observations were collected within 50 km of shore and 27 % within 25 m of the surface. Of all daily observations, 86 % were collected after 1990. Carbonate system observations are especially skewed toward recent years, with no measurements of pH, TA, DIC, or pCO2 in this compilation prior to 2006. By contrast, temperature, salinity, and DO records are common after 1980.
The spatiotemporal coverage of our dataset is highly variable, though it generally improves through time. Mapping the density of observations within 50 km of the coastline and 25 m of the surface through time highlights the influence of dense coastal human populations and major research institutions (Fig. 3). By contrast, the region between 38 and 44∘ N is much less densely observed and loses considerable oceanographic monitoring capacity between 2015 and 2020. Temperature and DO measurements have the most extensive coverage but are sparse outside of southern California before 2000. Salinity measurement density hews closely to the DO distribution and, as such, is not shown here. After 2015, carbonate system observations are limited to a few locations with sporadic coverage north of 39∘ N which correspond to pH and pCO2 moorings. Overall, this data compilation demonstrates large spatial and temporal data gaps, which limit our ability to resolve rapid changes in ocean acidification, hypoxia, or warming risk or to contextualize current oceanographic conditions with respect to the recent past.
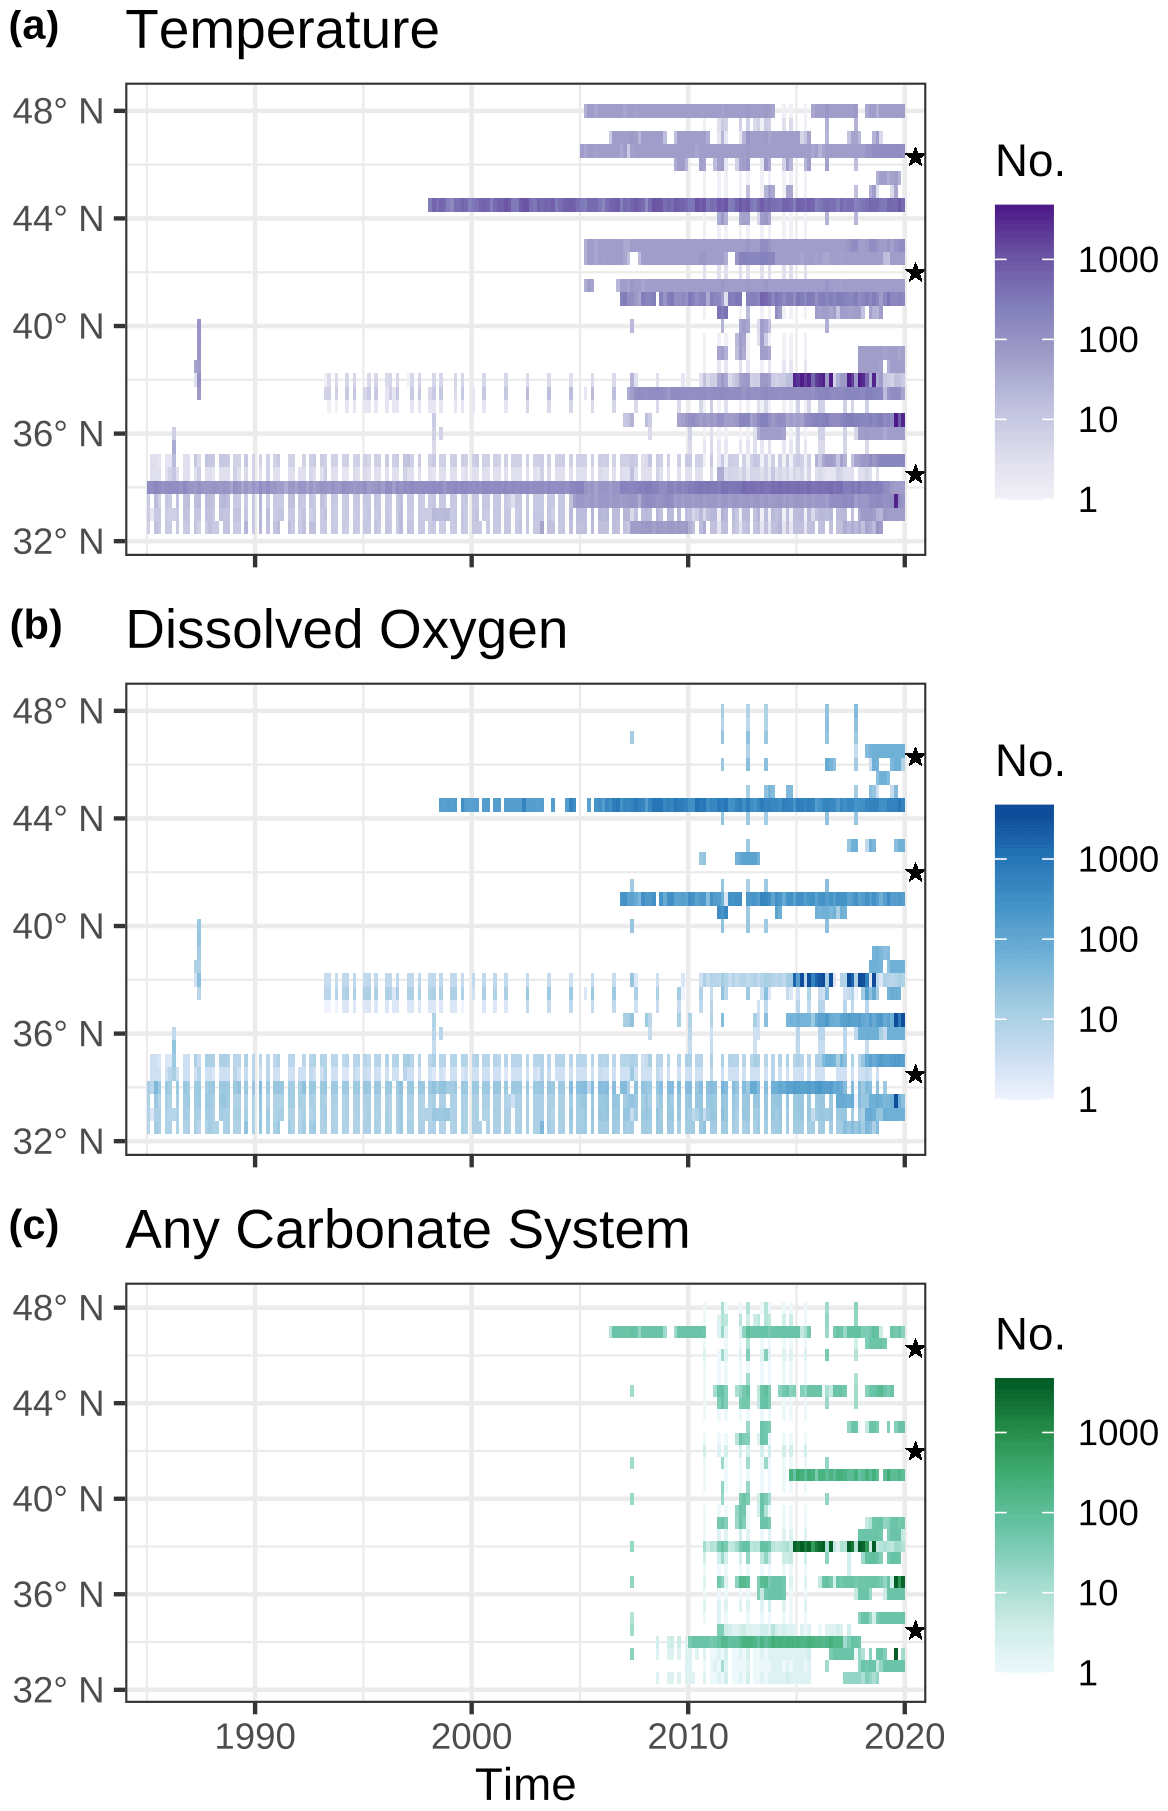
Figure 3The number of measurements within 50 km of the shore and 25 m of the surface for temperature (a), dissolved oxygen (b), and any carbonate system measurements (c) using 2-month, 0.5∘ latitude spatiotemporal blocks. Salinity (not shown) hews closely to the dissolved oxygen distribution. From north to south, stars mark the Washington–Oregon border, the Oregon–California border, and Point Conception (34.5∘ N). Spatial data coverage was best across all parameters between 2010 and 2015, whereas overall observation quantity was highest between 2015 and 2020. Since 2015, dissolved oxygen and carbonate system measurements have become more concentrated into fewer locations along the coast despite increasing awareness of the risks of nearshore acidification and hypoxia events.
The intra-annual distribution of the daily data is more complex than the interannual distribution (Fig. 4). Temperature, salinity, and DO records are common throughout the year but have distinct peaks in abundance in April, May, and July through September. Carbonate system records are patchier temporally. Nearly 50 % of all TA and DIC observations were taken in May or August, with an additional 19 % of observations from September, reflecting the sampling months of the NOAA West Coast Ocean Acidification cruises (Feely et al., 2016a). Between October and April, no single month includes more than 8 % of DIC observations or 5 % of TA observations. pH observations are more evenly distributed throughout the year, with each month hosting 6 %–10.5 % of the observations except August, which hosts 16 %. The concentration of carbonate system observations between May and September is particularly concerning, as the upwelling season in central and southern California starts in earnest in April (García-Reyes and Largier, 2012; Jacox et al., 2018). At least two principal carbonate system parameters must be measured to fully constrain the carbonate system (Dickson, 2010), so the observational record may be missing significant low pH, low DO events from the early upwelling season.
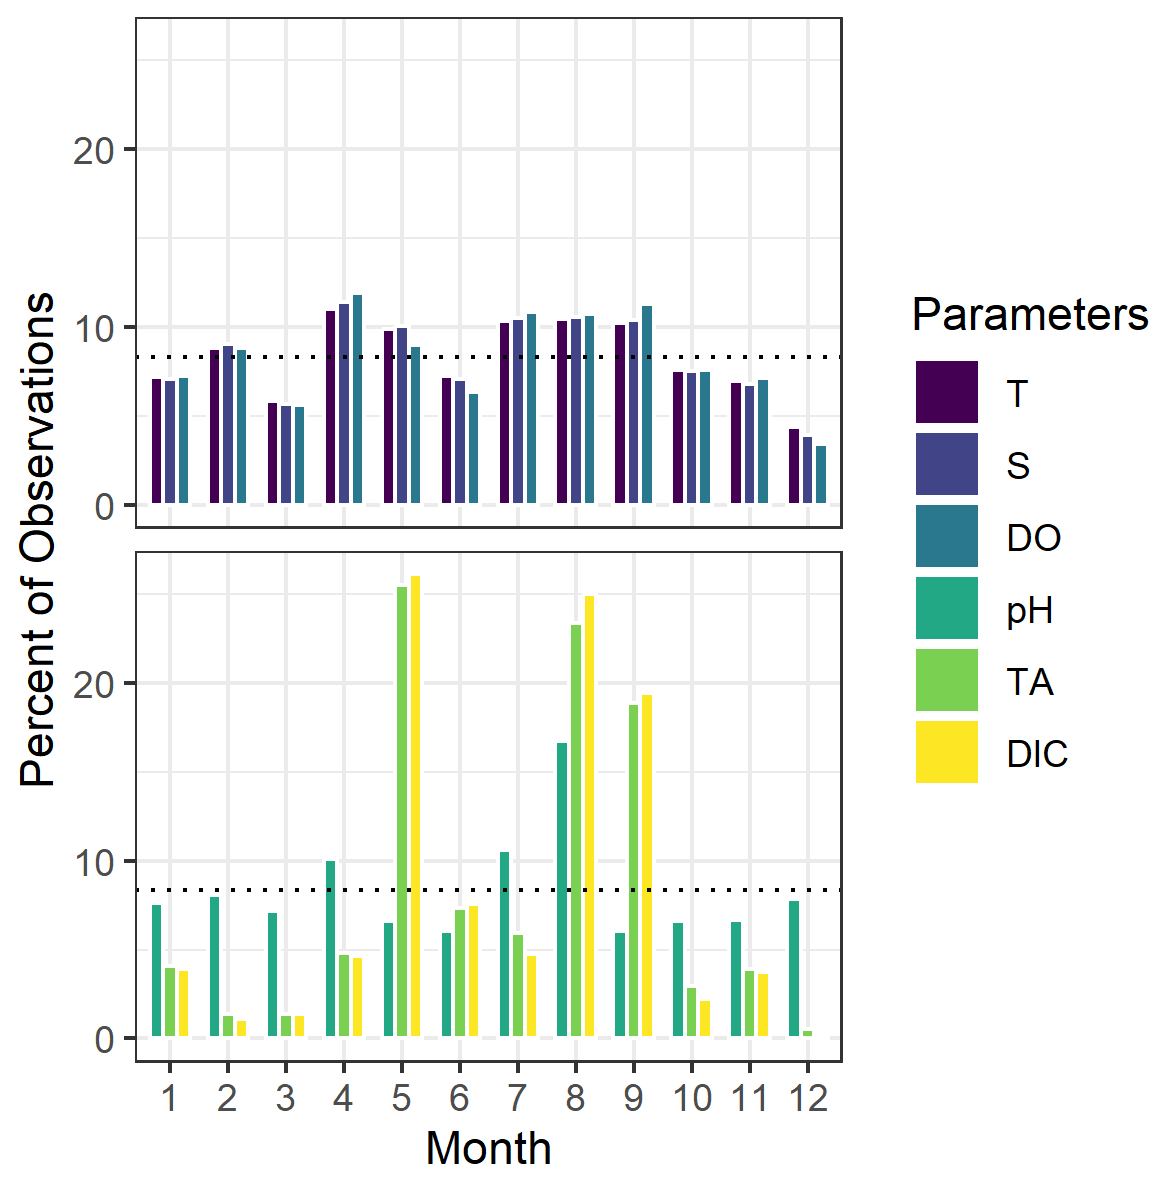
Figure 4The distribution of daily observations by month varies substantially by parameter relative to an equal split (dashed lines). Temperature (T), salinity (S), and dissolved oxygen (DO) observations are fairly evenly distributed across seasons, with notable observational peaks in April, May, July, August, and September. Carbonate system parameters (pH, total alkalinity or TA, and dissolved inorganic carbon or DIC) are more concentrated in the summer months, with nearly all TA and DIC observations occurring in May, August, or September. Of the carbonate system parameters, only pH observations are nearly equitably distributed throughout the year.
3.5 Oceanographic analysis case examples
3.5.1 Monthly climatology
This synthesis dataset supports several avenues of investigation of the relationships between OAH parameters. For example, evaluating the variations in monthly climatology across OAH parameters in waters shoreward of the 100 m depth contour shows intriguing differences between regions (Fig. 5). Temperatures rise in all regions during the spring and summer months, peaking between July and September. In Washington and Oregon, peak upwelling occurs between June and August (Bograd et al., 2009; Jacox et al., 2016), which coincides with the period of highest variability and lowest minima for pH and DO observations captured in this synthesis. In both California regions, separated at Point Conception (34.5∘ N), seasonal surface data are less consistent with the expected upwelling patterns. There, peak upwelling occurs between April and June and is weakest in southern California (Bograd et al., 2009; García-Reyes and Largier, 2012; Jacox et al., 2016). Somewhat unexpectedly, the lowest median DO and pH observations occur between July and September in both California regions rather than during the months of expected peak upwelling. This trend may reflect intermittent upwelling into the warmer summer months or could be capturing high surface respiration as waters warm; conclusive evidence of either phenomenon requires further investigation. Conditions from October through March across all West Coast regions are more sparsely sampled but have less variability, cooler mean temperatures, and higher dissolved oxygen content and pH.
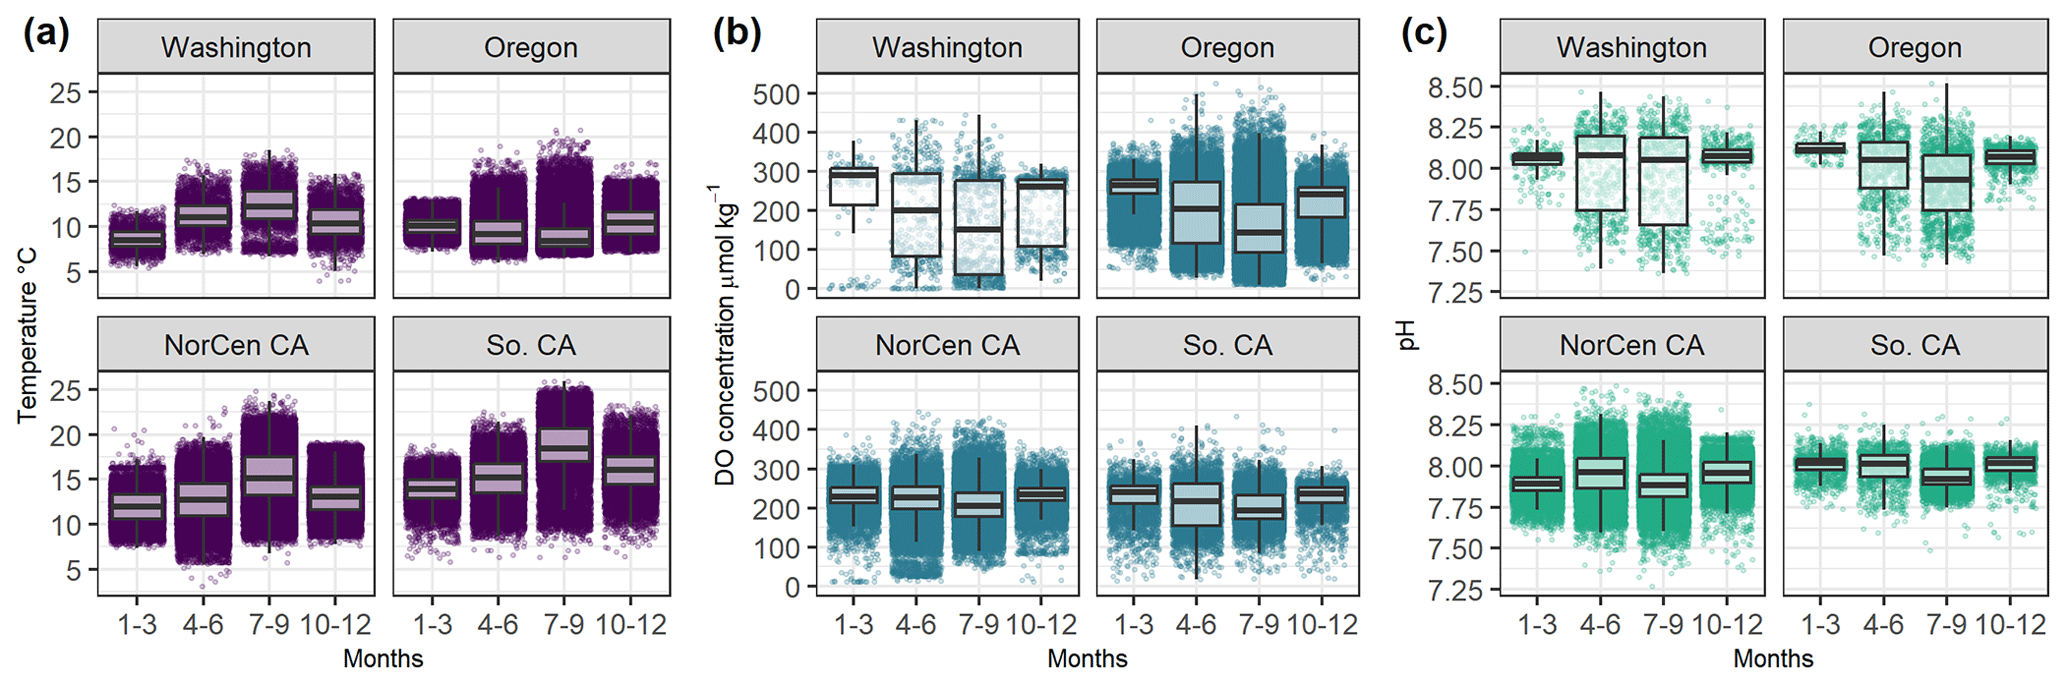
Figure 5Measurements shoreward of the 100 m bathymetric contour of temperature (a), dissolved oxygen (DO) (b), and pH (c) capture intra-annual and regional variation. The lowest median DO and pH conditions are found with the highest temperatures in late summer, rather than during peak upwelling periods (April–June). Here, California is split into two regions: NorCen CA, spanning the northern border to Point Conception (34.5∘ N), and southern California (So. CA), from Point Conception to the southern border. A total of 99 % of the data fall within 30 km of shore, and 65 % fall within 10 km of shore.
3.5.2 Shallow OAH events
Nearshore OAH vulnerability information can be particularly important for effective coastal management (Ekstrom et al., 2015; Woodson et al., 2019). Within state waters (<5 km from the shore) in the surface 50 m, there are thousands of co-occurring observations of pH below 7.8 and DO below commonly applied hypoxia thresholds (Fig. 6; e.g., Vaquer-Sunyer and Duarte, 2008; Hoffman et al., 2011). pH conditions below 7.8 can be stressful for many marine organisms (e.g., Byrne and Przeslawski, 2013; Gobler and Baumann, 2016; Bednaršek et al., 2021; Kroeker et al., 2023) and have been observed 8665 times within 5 km of shore and 50 m of the surface in this data compilation. Of these instances, 65 observations are accompanied by DO contents below the “coastal hypoxia” threshold of 61 µmol kg−1, and 400 observations have DO contents below the “mild hypoxia” threshold of 107 µmol kg−1 (Hofmann et al., 2011a). An additional 220 of these near-surface observations of DO contents below 61 µmol kg−1 in state waters have been recorded without accompanying pH information. No simultaneous surface observations of DO and pH record coastal hypoxic conditions with pH levels above 7.8. The low pH, low oxygen observations are most common off the Oregon coast and are typically associated with low temperature upwelling events, but simultaneous mild to moderately hypoxic and low pH conditions are also found occasionally throughout the coast and at a range of temperatures, especially during late summer in semi-restricted estuaries. The few simultaneous observations of DO content and pH suggest that fewer than 1 % of observations of low pH (pH <7.8) in state waters are accompanied by hypoxic water, whereas shallow hypoxic state waters might always be accompanied by low pH conditions. These relationships underscore the importance of multiparameter OAH observations, the clear need for pH monitoring efforts to catch up with DO monitoring efforts, and the potential for even shallow waters to experience extreme conditions.
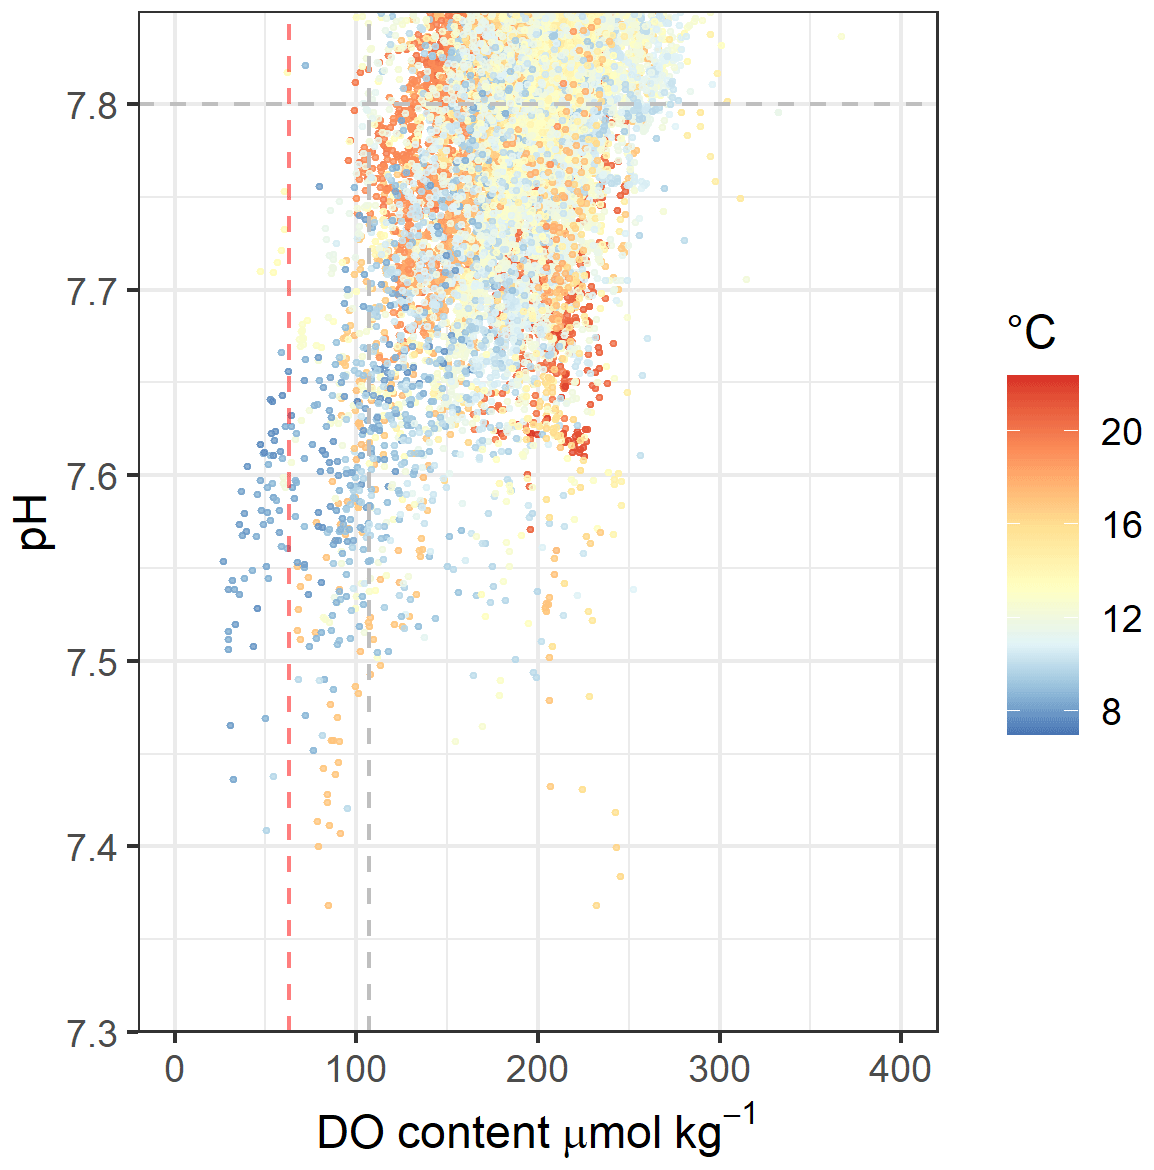
Figure 6Low dissolved oxygen (DO) and pH conditions are frequently present in state waters (within 5 km of the shore) and 50 m of the surface. pH measurements below 7.8 (dashed horizontal grey line) are common but are more rarely accompanied by mildly hypoxic (<107 µmol kg−1 or 3.5 mg L−1 DO, dashed vertical grey line) or hypoxic (<61 µmol kg−1 or 2 mg L−1 DO, dashed vertical red line) conditions. Simultaneous low pH, low DO events are typically associated with low temperatures, whereas low pH conditions alone are present across a wide range of temperatures.
3.5.3 Total alkalinity–salinity relationships
As a final example usage, we used the MOCHA synthesis to explore surface (<25 m depth) TA–salinity relationships along the coast. Developing robust TA–salinity relationships for near-surface, nearshore waters has produced intense interest. Because salinity observations are more readily available in the historical record and relatively cheap to reliably collect, robust TA–salinity relationship or algorithms allow the full carbonate system to be calculated while only directly measuring one principal parameter; however, these relationships and algorithms can be hampered by nearshore variability (e.g., Fassbender et al., 2017; Davis et al., 2018). We examined surface (<25 m depth) discrete TA and salinity observations from within 100 km of the shore along the Washington, Oregon, and California coasts and compared the data collected within 2 km of shore to those collected between 2 and 100 km from the shore (Fig. 7). Our TA–salinity relationships were very similar when using a 50 and 100 km cutoff distance, and we show the more extensive data here for closer comparisons with previous investigators. Our TA–salinity slopes were not significantly different between any Washington and Oregon regions, though we note that in our compilation, Washington and Oregon both have very limited discrete TA data within 2 km of shore, which produced large standard errors in the slope terms (4.5 and 3 µmol kg−1, respectively). Our observed offshore Washington TA–salinity relationship of is more comparable to the Wootton and Pfister (2012) regression, which centered off the Strait of Juan de Fuca, than to that from Fassbender et al. (2017). However, we did not correct for seasonal or watershed biases in this example and focus on a more limited stretch of nearshore waters, which may account for the differences between our calculated relationships and those of Fassbender et al. (2017).
Each of the two California regions, split at Point Conception (34.5∘ N), have TA–salinity regressions that are statistically distinct from each other and from both Pacific Northwest regions. The offshore California slope terms are much larger than in the Pacific Northwest region and significantly larger than the Cullison Gray et al. (2011) salinity coefficient of 50.8, particularly our slope for the northern and central region (57.4±0.9 µmol kg−1). At a salinity of 33.5, these differences produce an increase in estimated TA of 94.3 µmol kg−1 between our calculated northern and central California relationship and the Cullison Gray et al. (2011) relationship, which translates to an increase in estimated aragonite saturation of 0.1 at 12 ∘C and pH = 8.1. The Cullison Gray et al. (2011) relationship was derived from unpublished pCO2 and DIC observations, all taken prior to 2007, so there is limited temporal overlap between our sample sets, and any spatial differences in sample area cannot be assessed. The California nearshore region is well-sampled relative to the Pacific Northwest and displays significant variability, potentially reflecting local differences in bedrock or organic alkalinity contributions. The variability in nearshore TA–salinity relationships will continue to present a challenge for coastal communities and state agencies, underscoring the importance of monitoring multiple parameters of the carbonate system in highly nearshore environments.
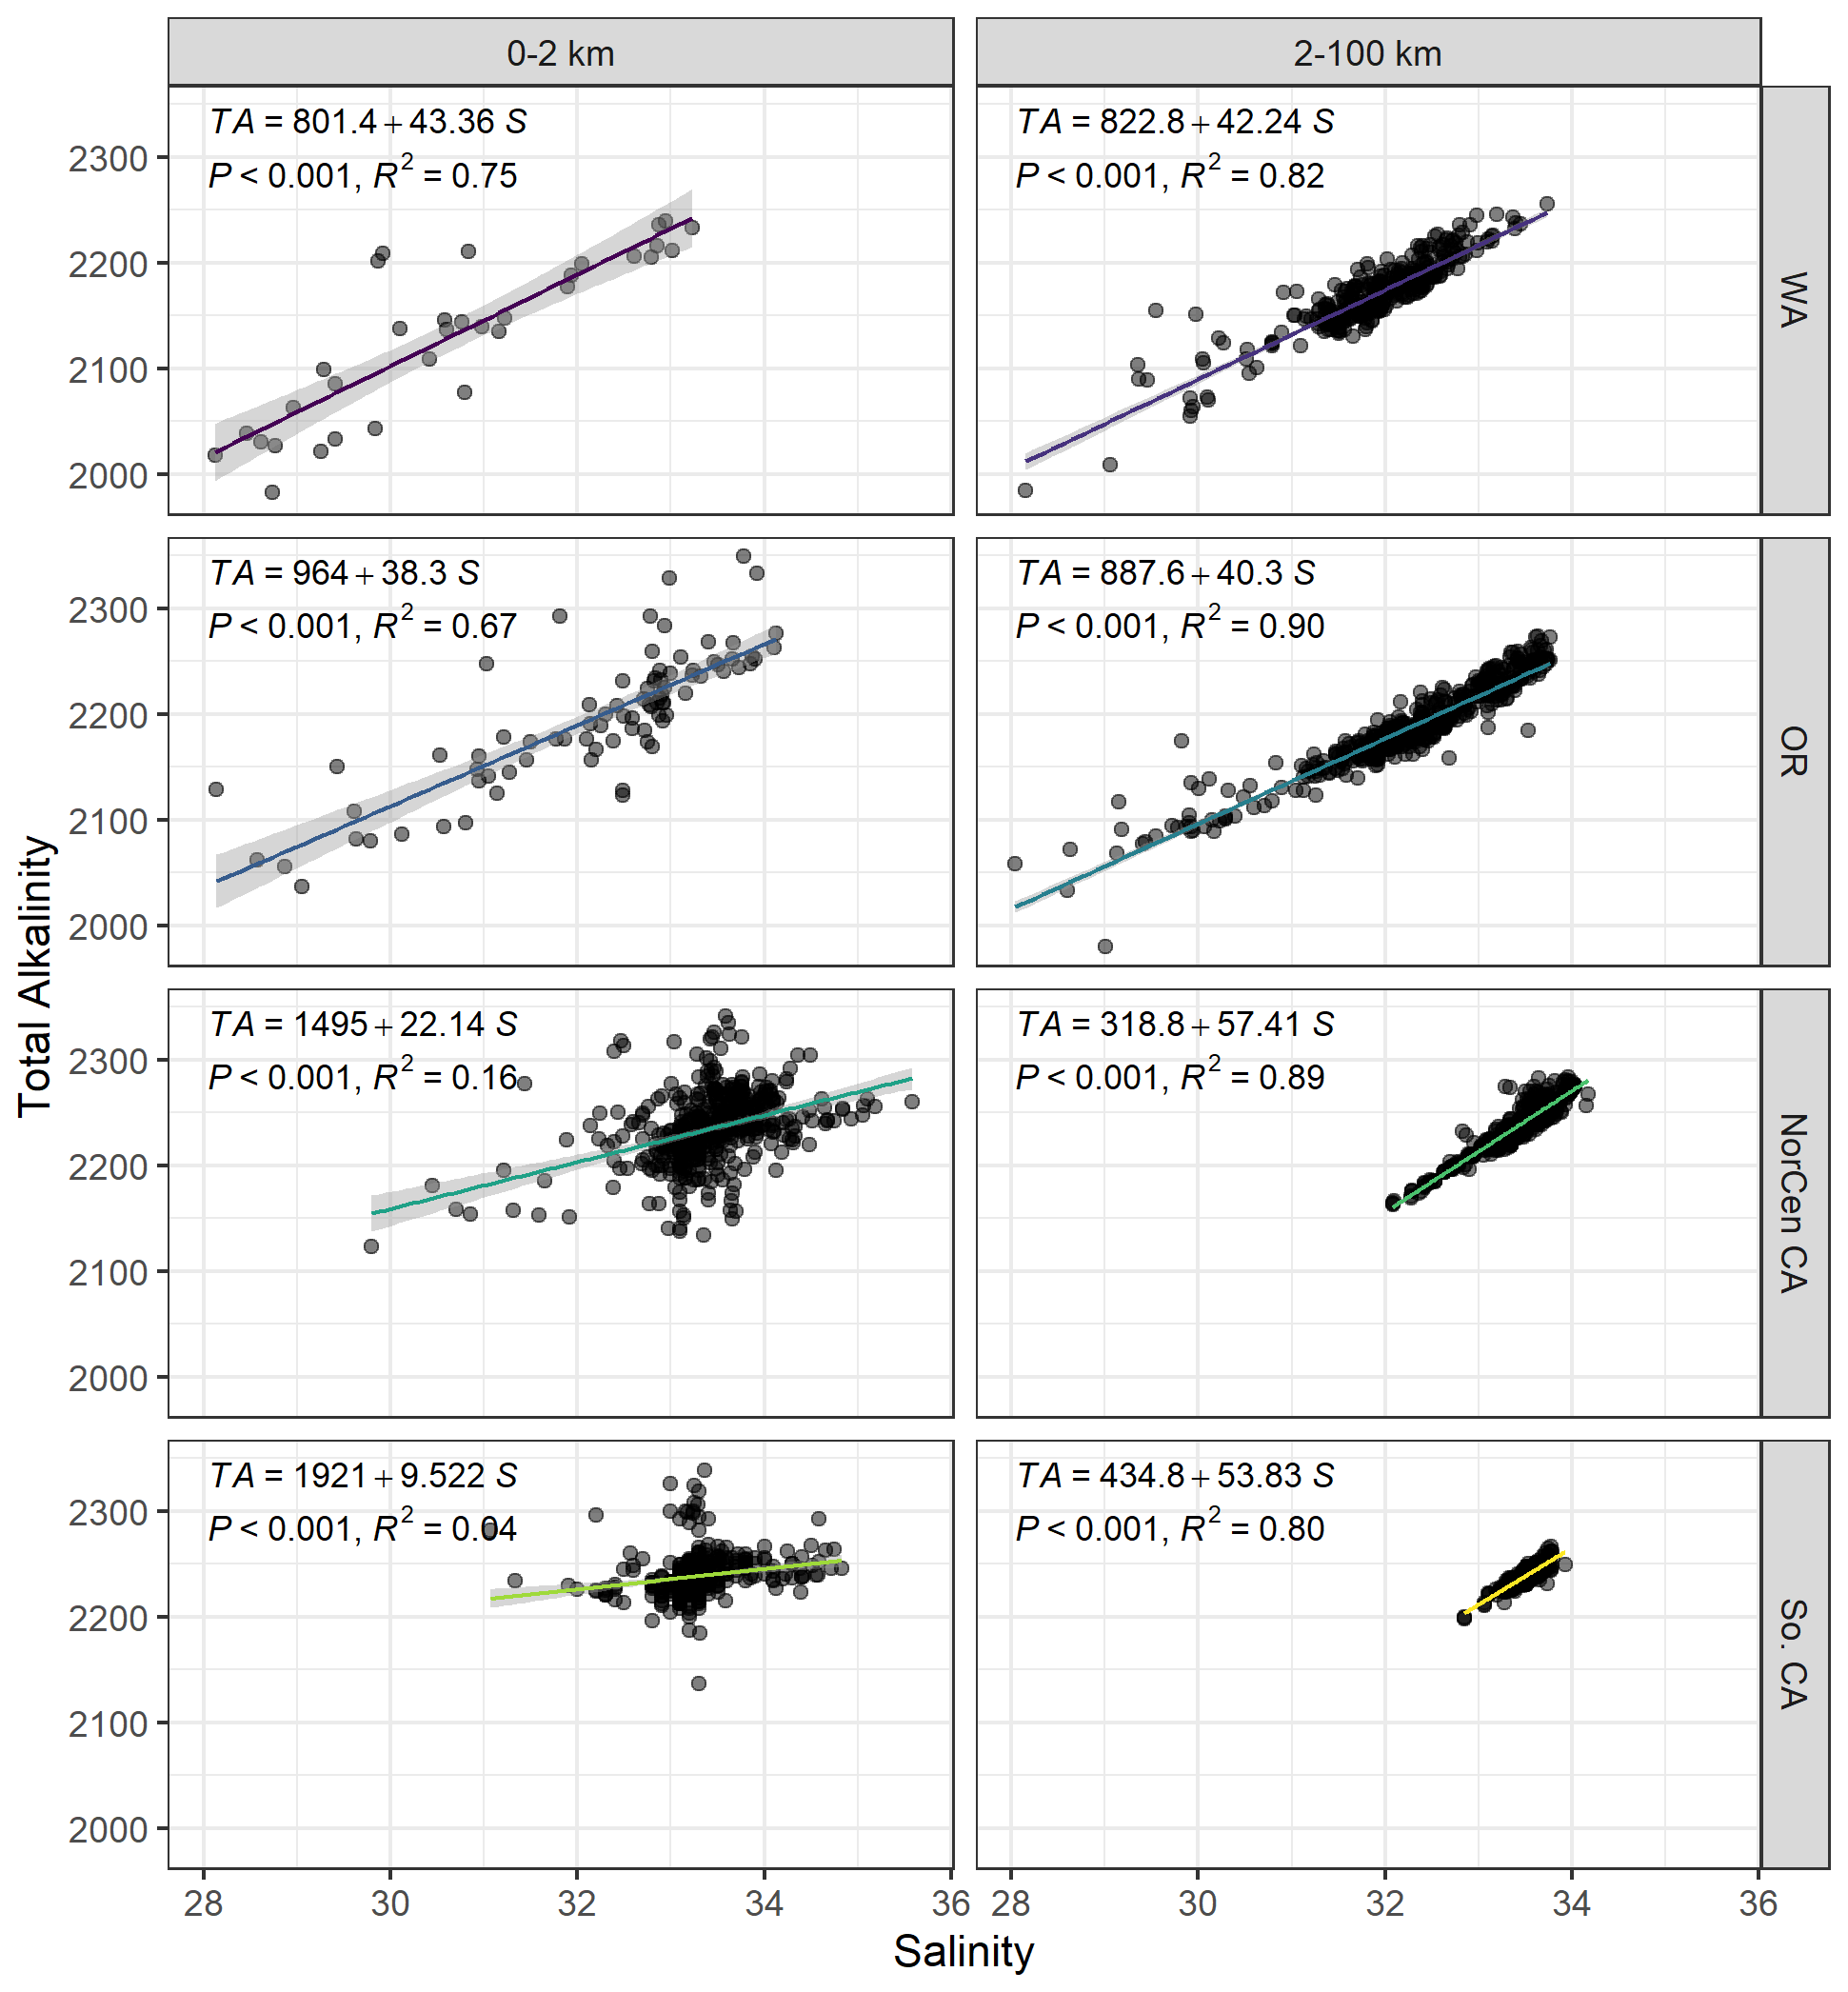
Figure 7Regional near-surface (<25 m) total alkalinity (TA)–salinity relationships from 0–2 km from the shore and 2–100 km offshore in along the US West Coast. As with Fig. 5, the break between northern and southern CA is Point Conception, at 34.5∘ N. These relationships only reflect direct measurements of salinity and TA on discrete samples with salinity >28.
3.6 Dataset limitations
This data compilation reflects reliable, publicly available data and directly contributes to our ability to map coastal temperature, DO, and carbonate system variation; however, this synthesis also encodes the limitations of the current observational record and the differences in data availability, data scales, and data quality. High-resolution autonomous sensors provide excellent temporal resolution for a specific location but are vulnerable to sensor drift, are not often published with clear calibration records, and are rarely deployed in arrays that fully capture the carbonate system as well as temperature and DO variability. Conversely, discrete samples and CTD profiles from synoptic cruises provide extremely high-precision, multiparameter observations with broad spatial resolution but are less relatable to high-resolution sensors or hand-collected observations from the surf zone. Carbonate system observation availability has a strong seasonal and spatial bias, with data concentrated in summer months and along coastal population centers. The MOCHA synthesis pulls these distinct data sources into a single synthesis product, but we do not claim to have fully resolved the inherent difficulties of combining data of differing quantity, resolution, and quality into a unified picture of the nearshore CCS.
Additional data streams that provide both spatial and temporal resolution could help bridge some of the divides between quality, quantity, and spatial extent in this synthesis, and we acknowledge a few such potential data streams here. The temperature and dissolved oxygen records do not include CTD casts from most annual fishery-independent surveys, which could improve spatial resolution at all depths (e.g., Sakuma, 2022). This compilation also excludes some valuable carbonate system data streams, particularly those focused on pCO2 measurements currently available through SOCAT (Sabine et al., 2013; Bakker et al., 2016). Additional potential carbonate system data sources include pH or pCO2 records from autonomous gliders (e.g., Chavez et al., 2017) and pCO2 and DIC records from shore-based monitoring systems (e.g., Burke-o-Lators; Hales et al., 2004; Bandstra et al., 2006). The first would significantly improve the spatial coverage of surface pCO2 and could improve seasonal bias but would not have a significant impact on our ability to resolve the full carbonate system or to consider deeper water. Glider datasets would similarly improve our spatial coverage while providing additional information about water column structure. These could represent a valuable expansion to this synthesis, provided calibration records are also available, and will likely be included in updates to this synthesis product (Bushinsky et al., 2019). Shore-based monitoring systems recently deployed by the West Coast OOIs would be valuable expansions to this synthesis and will also likely be included in an updated product.
The full Multistressor Observations of Coastal Hypoxia and Acidification dataset, parameter metadata, and dataset metadata tables are publicly available for download at NCEI as accession 0277984 at https://doi.org/10.25921/2vve-fh39 (Kennedy et al., 2023). The downloadable content includes the full MOCHA dataset available as a text file, the daily summarized dataset discussed extensively above available as a text file (aggregated_daily_dataset.csv), standard NCEI accession parameter metadata which provide an overview for each variable included in the text files (“SubmissionForm_carbon_v1_428.xlsx”), and a bespoke dataset metadata table describing each included dataset with citations and links to reference papers (MOCHA_dataset_metadata_table_v2.csv). This data package is discoverable via the NOAA Ocean Acidification Portal, NCEI Geoportal (https://www.ncei.noaa.gov/metadata/geoportal/#searchPanel, last access: 30 April 2023) and other online discovery tools. The dataset metadata table is also available in the Supplement.
We request that all users of the MOCHA compilation also fully credit the constituent datasets supporting their work. This helps ensure that the ocean monitoring systems that this and other compilations depend on receive trackable citations and continued funding. We also recommend contacting the original principal investigators to discuss collaboration opportunities and to enthusiastically look for opportunities to further include or credit these data providers. Full citation information, dataset DOIs, and reference papers (where available) for each individual dataset in the MOCHA compilation can be found in the References as well as in the MOCHA_dataset_metadata_table.csv available at NCEI (https://www.ncei.noaa.gov/data/oceans/ncei/ocads/data/0277984/, last access: 15 December 2023).
Code for performing carbonate system calculations with the formatted dataset, creating a summarized dataset aggregated by day and making all included figures, is available on GitHub at https://doi.org/10.5281/zenodo.10408321 (Kennedy, 2023).
The CCS is one of the most intensively monitored marine systems in the world, but our ability to accurately resolve the true complexity of coastal climate stress remains limited by data fragmentation, availability, and quality. As interest has shifted from documentation of the global patterns of acidification and hypoxia to more complex coastal environments, the CCS has seen an explosion in monitoring efforts within 50 km of shore in the last 15 years. This expansion has included an increase in both surface and subsurface monitoring efforts, though within 2 km of shore, monitoring efforts below 5 m depth are still much less common than surface observations. While this situation is improving, the continued relative paucity of subsurface nearshore measurements is of particular concern given that mildly hypoxic (DO <107 µmol kg−1) and corrosive conditions have been documented at depths as shallow as 10 m (Kekuewa et al., 2022).
Surprisingly, the US West Coast had especially continuous spatial and temporal coverage of OAH-relevant parameters between 2012 and the beginning of 2015, before a reduction in coverage that lasted through 2020 (Fig. 5). By coincidence, the reduction in DO and carbonate system monitoring in 2015 coincided with the second half of the marine heatwave known as “the Blob”, which stretched from 2014 through 2016 and was associated with higher surface DO and pH (Bond et al., 2015; Siedlecki et al., 2016; Gentemann et al., 2017). Assessing the interactions of an unprecedented marine heatwave with DO and carbonate system conditions lies at the heart of multistressor risk management; however, our ability to resolve both Blob impacts and its recovery was very limited in northern California and Oregon by the concurrent contraction in oceanographic monitoring. Although the CCS is well monitored compared to many other parts of the world's oceans, our synthesis here highlights that the patchiness of monitoring projects, often driven by inconsistent funding, has an outsized impact on our ability to utilize those data to operationally monitor for climate change.
While increasing interest in coastal OAH monitoring and the availability of autonomous sensors has markedly enhanced CCS data availability, the frequency and footprints of synoptic oceanographic cruises have decreased in the region. Oceanographic cruises provide highly accurate and spatially broad water column measurements that can bridge the gap between the coastal and open-ocean domains and provide regional contexts for local observations. They also provide some of our only observations near remote portions of the coast. However, nearly all routine oceanographic cruises in the CCS have cut back their footprint, sampling frequency, and depth resolution. The southern-California-based CalCOFI cruises extended throughout the CCS during the 1960s, contracted to southern and central California by the 1980s, and now only cover the Southern California Bight while also sampling at significantly fewer depths (Bograd et al., 2003). The loss of CalCOFI cruises in central California has been offset in part by triannual Applied California Current Ecosystem Studies (ACCESS) cruises near San Francisco Bay, though these cruises are limited to the continental shelf between 37.3 and 38.4∘ N. The NOAA West Coast Ocean Acidification (WCOA) cruises took place along the entire CCS five times from 2007 to 2016 but did not occur again until 2021 (Feely et al., 2016a, 2022). The shift towards high-resolution, nearshore monitoring is a significant improvement over a wholesale reduction in oceanographic monitoring, but the concurrent erosion of consistent oceanographic cruises means the ability to resolve large-scale regional patterns is being traded for highly specific understanding of a few select locations.
This synthesis dataset provides one of the largest compilations to date of West Coast nearshore acidification- and deoxygenation-related data. This dataset highlights monitoring gaps but equally provides opportunities for insight into coastal conditions. With the updated spatiotemporal resolution our effort affords, this dataset offers a wealth of opportunities to investigate questions about coastal oceanography and evaluate localized patterns of marine climate stress. We expect the MOCHA synthesis to also be of use for new projects combining temperature and DO records into species metabolic indices (e.g., Howard et al., 2020b), for investigating the frequency and interaction of individual and overlapping ocean acidification and hypoxic events (e.g., Burger et al., 2022), and for developing updated carbonate system algorithms more suited to coastal environments (e.g., Alin et al., 2012; Davis et al., 2018). By archiving this dataset at the National Centers for Environmental Information (https://doi.org/10.25921/2vve-fh39; Kennedy et al., 2023) in an easily manipulated, consistent format that includes relevant metadata and quality assurance, we provide an important tool for scientists across ecological, oceanographic, and social disciplines as well as coastal decision-makers to address the environmental, economic, and cultural needs of coastal communities.
The supplement related to this article is available online at: https://doi.org/10.5194/essd-16-219-2024-supplement.
After the first four contributing authors, additional authors are listed alphabetically in two groups: those who contributed significantly to data acquisition, interpretation, and overall project direction and those who contributed to data curation. All authors read, edited, and approved of the manuscript. EGK wrote original draft and led data curation and quality-control methodology. MZ and SLH provided substantial manuscript reviews, data curation, and methodology insights. TMH led project conceptualization, funding acquisition, and supervision and provided substantial manuscript review. TMH, KJK, JJ, CRF, and ME provided previously unpublished data for inclusion. KJK, AKS, BG, ES, and MIW contributed to funding acquisition and project conceptualization. HMP, MIW, AMR, GVG, CNR, GC, MD, MIW, EH, and SW provided data curation and sourced new datasets for inclusion.
The contact author has declared that none of the authors has any competing interests.
Publisher's note: Copernicus Publications remains neutral with regard to jurisdictional claims made in the text, published maps, institutional affiliations, or any other geographical representation in this paper. While Copernicus Publications makes every effort to include appropriate place names, the final responsibility lies with the authors.
This project received additional funding from the Lenfest Ocean Program (to Tessa M. Hill, Eric Sanford, Brian Gaylord, Kristy J. Kroeker, Ana K. Spalding) and the Packard Foundation (to Tessa M. Hill, Eric Sanford, Brian Gaylord, Kristy J. Kroeker). We value the partnership of the Applied California Current Ecosystem Studies Partnership (ACCESS; http://www.accessoceans.org, last access: 2 October 2023), an ongoing collaboration between Point Blue Conservation Science and Greater Farallones and the Cordell Bank National Marine Sanctuaries to support healthy oceans in north-central California. Brady O'Donnell, Priya Shukla, Lena Capece, Seth Miller, Sarah Merolla, Daphne Bradley, and Danielle Lipski assisted with data collection and management. We thank Rachel Carlson and Alyssa Griffin for sharing their advice, expertise, and feedback at key points in the project. We also thank the UC Davis Data Lab for their assistance with data management and coding.
This research has been supported by the California Ocean Protection Council (grant no. R/OPCOAH-04), the NOAA Ocean Acidification Program (grant no. 2906368), the National Park Service (grant no. P17AC01416), and the National Science Foundation (grant no. 1734999).
This paper was edited by Kaiguang Zhao and reviewed by three anonymous referees.
Alin, S. R., Feely, R. A., Dickson, A. G., Hernández-Ayón, J. M., Juranek, L. W., Ohman, M. D., and Goericke, R.: Robust empirical relationships for estimating the carbonate system in the southern California Current System and application to CalCOFI hydrographic cruise data (2005–2011), J. Geophys. Res.-Oceans, 117, C05033, https://doi.org/10.1029/2011JC007511, 2012.
Alin, S. R., Newton, J., Sutton, A. J., and Mickett, J.: Dissolved inorganic carbon, total alkalinity, phosphate, silicate, and other variables collected from profile and discrete sample observations using CTD, Niskin bottle and other instruments in the northwest coast of the United States near the ChÃ!` BÄf mooring off La Push, Washington from 2011-05-22 to 2014-10-24 (NCEI Accession 0145160), NOAA National Centers for Environmental Information [data set], https://doi.org/10.7289/v5b27sbj, 2016.
Alin, S. R., Feely, R. A., Hales, B., Byrne, R. H., Cochlan, W., Liu, X., and Greely, D.: Dissolved inorganic carbon, total alkalinity, pH on total scale, and other variables collected from profile and discrete sample observations using CTD, Niskin bottle, and other instruments from NOAA Ship Ronald H. Brown in the U.S. West Coast California Current System from 2016-05-08 to 2016-06-06 (NCEI Accession 0169412), NOAA National Centers for Environmental Information [data set], https://doi.org/10.7289/v5v40shg, 2017.
Alin, S. R., Feely, R. A., Newton, J., Trainer, V. L., Adams, N. G., Greeley, D., Curry, B., Herndon, J., and Ostendorf, M. L.: Dissolved inorganic carbon (DIC), total alkalinity (TA), temperature, salinity, oxygen, and nutrient data collected from discrete profile measurements during the National Oceanic and Atmospheric Administration Harmful Algal Blooms (NOAA HABs) program cruise SH1709 (EXPOCODE 3322220170918) in Pacific Northwest marine waters on NOAA Ship Bell M. Shimada from 2017-09-18 to 2017-09-28 (NCEI Accession 0208230), NOAA National Centers for Environmental Information, [data set], https://doi.org/10.25921/3qa5-v720, 2019.
Aylesworth, L., Fields, S. A., Fields, R. T., and Kane, C.: Oceanography Appendix Report, Oregon Department of Fish and Wildlife Marine Resources Program, Newport, OR, https://ecologyreports.oregonmarinereserves.com/Data_Files/6. Across Reserves/Oceanography/Oceanography_Appendix.html (last access: 15 March 2023), 2022.
Bakker, D. C. E., Pfeil, B., Landa, C. S., Metzl, N., O'Brien, K. M., Olsen, A., Smith, K., Cosca, C., Harasawa, S., Jones, S. D., Nakaoka, S., Nojiri, Y., Schuster, U., Steinhoff, T., Sweeney, C., Takahashi, T., Tilbrook, B., Wada, C., Wanninkhof, R., Alin, S. R., Balestrini, C. F., Barbero, L., Bates, N. R., Bianchi, A. A., Bonou, F., Boutin, J., Bozec, Y., Burger, E. F., Cai, W.-J., Castle, R. D., Chen, L., Chierici, M., Currie, K., Evans, W., Featherstone, C., Feely, R. A., Fransson, A., Goyet, C., Greenwood, N., Gregor, L., Hankin, S., Hardman-Mountford, N. J., Harlay, J., Hauck, J., Hoppema, M., Humphreys, M. P., Hunt, C. W., Huss, B., Ibánhez, J. S. P., Johannessen, T., Keeling, R., Kitidis, V., Körtzinger, A., Kozyr, A., Krasakopoulou, E., Kuwata, A., Landschützer, P., Lauvset, S. K., Lefèvre, N., Lo Monaco, C., Manke, A., Mathis, J. T., Merlivat, L., Millero, F. J., Monteiro, P. M. S., Munro, D. R., Murata, A., Newberger, T., Omar, A. M., Ono, T., Paterson, K., Pearce, D., Pierrot, D., Robbins, L. L., Saito, S., Salisbury, J., Schlitzer, R., Schneider, B., Schweitzer, R., Sieger, R., Skjelvan, I., Sullivan, K. F., Sutherland, S. C., Sutton, A. J., Tadokoro, K., Telszewski, M., Tuma, M., van Heuven, S. M. A. C., Vandemark, D., Ward, B., Watson, A. J., and Xu, S.: A multi-decade record of high-quality fCO2 data in version 3 of the Surface Ocean CO2 Atlas (SOCAT), Earth Syst. Sci. Data, 8, 383–413, https://doi.org/10.5194/essd-8-383-2016, 2016.
Bakun, A., Black, B. A., Bograd, S. J., García-Reyes, M., Miller, A. J., Rykaczewski, R. R., and Sydeman, W. J.: Anticipated effects of climate change on coastal upwelling ecosystems, Curr. Clim. Change Rep., 1, 85–93, https://doi.org/10.1007/s40641-015-0008-4, 2015.
Bandstra, L., Hales, B., and Takahashi, T.: High-frequency measurements of total CO2: Method development and first oceanographic observations, Mar. Chem., 100, 24–38, https://doi.org/10.1016/j.marchem.2005.10.009, 2006.
Baptista, A. M., Seaton, C., Wilkin, M. P., Riseman, S. F., Needoba, J. A., Maier, D., Turner, P. J., Kärnä, T., Lopez, J. E., Herfort, L., Megler, V. M., McNeil, C., Crump, B. C., Peterson, T. D., Spitz, Y. H., and Simon, H. M.: Infrastructure for collaborative science and societal applications in the Columbia River estuary, Front. Earth Sci., 9, 659–682, https://doi.org/10.1007/s11707-015-0540-5, 2015.
Barth, J. A., Erofeev, A., and Chan, F.: Oceanographic data across Oregon's marine reserves, Oregon State University, Oregon Department of Fish and Wildlife Marine Resources Program, Newport, OR, 2021.
Barton, A., Waldbusser, G. G., Feely, R. A., Weisberg, S. B., Newton, J. A., Hales, B., Cudd, S., Eudeline, B., Langdon, C. J., Jefferds, I., King, T., Suhrbier, A., and McLaughlin, K.: Impacts of coastal acidification on the Pacific Northwest shellfish industry and adaptation strategies implemented in response, Oceanography, 28, 146–159, 2015.
Bauer, J. E., Cai, W.-J., Raymond, P. A., Bianchi, T. S., Hopkinson, C. S., and Regnier, P. A. G.: The changing carbon cycle of the coastal ocean, Nature, 504, 61–70, https://doi.org/10.1038/nature12857, 2013.
Bednaršek, N., Feely, R. A., Howes, E. L., Hunt, B. P. V., Kessouri, F., León, P., Lischka, S., Maas, A. E., McLaughlin, K., Nezlin, N. P., Sutula, M., and Weisberg, S. B.: Systematic review and meta-analysis toward synthesis of thresholds of ocean acidification impacts on calcifying pteropods and interactions with warming, Front. Mar. Sci., 6, 227, https://doi.org/10.3389/fmars.2019.00227, 2019.
Bednaršek, N., Ambrose, R., Calosi, P., Childers, R. K., Feely, R. A., Litvin, S. Y., Long, W. C., Spicer, J. I., Štrus, J., Taylor, J., Kessouri, F., Roethler, M., Sutula, M., and Weisberg, S. B.: Synthesis of thresholds of ocean acidification impacts on decapods, Front. Mar. Sci., 8, 651102, https://doi.org/10.3389/fmars.2021.651102, 2021.
Bezalel S., Davis, J., Featherston, T., Flores, L., Grosso, C., Hale, T., Shusterman, G., Sutton, R., Weaver, M., Wong, A., and Yee, D.: Regional Monitoring Program for Water Quality in San Francisco Bay (RMP), San Francisco Estuary Institute (SFEI) [data set], https://www.sfei.org/programs/sf-bay-regional-monitoring-program (last access: 20 August 2023), 2021.
Bjorkstedt, E. P.: Trinidad Head Line CTD Hydrogeography, NOAA [data set], https://oceanview.pfeg.noaa.gov/erddap/tabledap/swfscTrinidadCTD.html (last access: 15 September 2023), 2023.
Bjorkstedt, E. P. and Peterson, W. T.: Chapter 8 – Zooplankton Data from High-Frequency Coastal Transects: Enriching the Contributions of Ocean Observing Systems to Ecosystem-Based Management in the Northern California Current, in: Coastal Ocean Observing Systems, edited by: Liu, Y., Kerkering, H., and Weisberg, R. H., Academic Press, 119–142, https://doi.org/10.1016/B978-0-12-802022-7.00008-0, 2015.
Bograd, S. J., Checkley, D. A., and Wooster, W. S.: CalCOFI: a half century of physical, chemical, and biological research in the California Current System, Deep-Sea Res. Pt. II, 50, 2349–2353, https://doi.org/10.1016/S0967-0645(03)00122-X, 2003.
Bograd, S. J., Castro, C. G., Lorenzo, E. D., Palacios, D. M., Bailey, H., Gilly, W., and Chavez, F. P.: Oxygen declines and the shoaling of the hypoxic boundary in the California Current, Geophys. Res. Lett., 35, L12607, https://doi.org/10.1029/2008GL034185, 2008.
Bograd, S. J., Schroeder, I., Sarkar, N., Qiu, X., Sydeman, W. J., and Schwing, F. B.: Phenology of coastal upwelling in the California Current, Geophys. Res. Lett., 36, L12607, https://doi.org/10.1029/2008GL035933, 2009.
Bond, N. A., Cronin, M. F., Freeland, H., and Mantua, N.: Causes and impacts of the 2014 warm anomaly in the NE Pacific, Geophys. Res. Lett., 42, 3414–3420, https://doi.org/10.1002/2015GL063306, 2015.
Borges, A. V. and Gypens, N.: Carbonate chemistry in the coastal zone responds more strongly to eutrophication than ocean acidification, Limnol. Oceanogr., 55, 346–353, https://doi.org/10.4319/lo.2010.55.1.0346, 2010.
Breitburg, D. L., Salisbury, J., Bernhard, J. M., Cai, W.-J., Dupont, S., Doney, S. C., Kroeker, K. J., Levin, L. A., Long, W. C., Milke, L. M., Miller, S. H., Phelan, B., Passow, U., Seibel, B. A., Todgham, A. E., and Tarrant, A. M.: And on top of all that…: Coping with ocean acidification in the midst of many stressors, Oceanography, 28, 48–61, 2015.
Burger, F. A., Terhaar, J., and Frölicher, T. L.: Compound marine heatwaves and ocean acidity extremes, Nat. Commun., 13, 4722, https://doi.org/10.1038/s41467-022-32120-7, 2022.
Bushinsky, S. M., Takeshita, Y., and Williams, N. L.: Observing changes in ocean carbonate chemistry: Our autonomous future, Curr. Clim. Change Rep., 5, 207–220, https://doi.org/10.1007/s40641-019-00129-8, 2019.
Bushnell, M.: Quality Control of Real-Time Water Level Data: The U.S. IOOS® QARTOD Project, Mar. Technol. Soc. J., 52, 13–17, https://doi.org/10.4031/MTSJ.52.2.2, 2018.
Byrne, M. and Przeslawski, R.: Multistressor impacts of warming and acidification of the ocean on marine invertebrates' life histories, Integr. Comp. Biol., 53, 582–596, https://doi.org/10.1093/icb/ict049, 2013.
Cai, W.-J., Hu, X., Huang, W.-J., Murrell, M. C., Lehrter, J. C., Lohrenz, S. E., Chou, W.-C., Zhai, W., Hollibaugh, J. T., Wang, Y., Zhao, P., Guo, X., Gundersen, K., Dai, M., and Gong, G.-C.: Acidification of subsurface coastal waters enhanced by eutrophication, Nat. Geosci., 4, 766–770, https://doi.org/10.1038/ngeo1297, 2011.
Caldeira, K. and Wickett, M. E.: Anthropogenic carbon and ocean pH, Nature, 425, 365–365, https://doi.org/10.1038/425365a, 2003.
California Cooperative Oceanic Fisheries Investigations (CalCOFI), Bottle Database [data set], https://calcofi.org/data/oceanographic-data/bottle-database/ (last access: 1 September 2021), 2020.
California Polytechnic State University, Center for Coastal Marine Sciences: Morro Bay – BS1, CeNCOOS Data Portal [data set], https://data.cencoos.org/#metadata/100050/station (last access: 1 August 2023), 2023.
Carter, M. L., Flick, R. E., Terrill, E., Beckhaus, E. C., Martin, K., Fey, C. L., Walker, P. W., Largier, J. L., and McGowan, J. A.: Shore Stations Program Data Archive: Current and historical coastal ocean temperature and salinity measurements from California stations, UC San Diego Library Digital Collections [data set], https://doi.org/10.6075/J06T0K0M, 2021.
Cavole, L., Demko, A., Diner, R., Giddings, A., Koester, I., Pagniello, C., Paulsen, M.-L., Ramirez-Valdez, A., Schwenck, S., Yen, N., Zill, M., and Franks, P.: Biological impacts of the 2013–2015 warm-water anomaly in the Northeast Pacific: Winners, losers, and the future, Oceanography, 29, 273–285, https://doi.org/10.5670/oceanog.2016.32, 2016.
Chan, F. and Menge, B. A.: SH70 SAMI pCO2 from SH70 mooring 2009-MI_LOCO-Lander, 2010-MI_LOCO-Lander in the SH70 mid-shelf time series station (Strawberry Hill): 44.25N, 124.50W from 2009–2010 (EAGER project), December 2012 ver 04, Biological and Chemical Oceanography Data Management Office (BCO-DMO) [data set], http://lod.bco-dmo.org/id/dataset/3812 (last access: 15 October 2023), 2012.
Chan, F., Barth, J. A., Lubchenco, J., Kirincich, A., Weeks, H., Peterson, W. T., and Menge, B. A.: Emergence of anoxia in the California Current Large Marine Ecosystem, Science, 319, 920–920, https://doi.org/10.1126/science.1149016, 2008.
Chan, F., Barth, J. A., Blanchette, C. A., Byrne, R. H., Chavez, F., Cheriton, O., Feely, R. A., Friederich, G., Gaylord, B., Gouhier, T., Hacker, S., Hill, T., Hofmann, G., McManus, M. A., Menge, B. A., Nielsen, K. J., Russell, A., Sanford, E., Sevadjian, J., and Washburn, L.: Persistent spatial structuring of coastal ocean acidification in the California Current System, Sci. Rep.-UK, 7, 1–7, https://doi.org/10.1038/s41598-017-02777-y, 2017.
Chan, F., Barth, J. A., Kroeker, K. J., Lubchenco, J., and Menge, B. A.: The dynamics and impact of ocean acidification and hypoxia: Insights from sustained investigations in the Northern California Current Large Marine Ecosystem, Oceanography, 32, 62–71, 2019.
Chavez, F., Pennington, J. T., Michisaki, R., Blum, M., Chavez, G., Friederich, J., Jones, B., Herlien, R., Kieft, B., Hobson, B., Ren, A., Ryan, J., Sevadjian, J., Wahl, C., Walz, K., Yamahara, K., Friederich, G., and Messié, M.: Climate variability and change: Response of a coastal ocean ecosystem, Oceanography, 30, 128–145, https://doi.org/10.5670/oceanog.2017.429, 2017.
Chavez, F. P. and Messié, M.: A comparison of Eastern Boundary Upwelling Ecosystems, Prog. Oceanogr., 83, 80–96, https://doi.org/10.1016/j.pocean.2009.07.032, 2009.
Cheresh, J. and Fiechter, J.: Physical and biogeochemical drivers of alongshore pH and oxygen variability in the California Current System, Geophys. Res. Lett., 47, e2020GL089553, https://doi.org/10.1029/2020GL089553, 2020.
Cheung, W. W. L. and Frölicher, T. L.: Marine heatwaves exacerbate climate change impacts for fisheries in the northeast Pacific, Sci. Rep.-UK, 10, 6678, https://doi.org/10.1038/s41598-020-63650-z, 2020.
Clements, J. C. and Chopin, T.: Ocean acidification and marine aquaculture in North America: potential impacts and mitigation strategies, Rev. Aquacult., 9, 326–341, https://doi.org/10.1111/raq.12140, 2017.
Columbia River Intertribal Fish Commission Center for Coastal Margin Observation and Prediction: SATURN Observation Network Endurance Stations: SATURN-02, Columbia River Intertribal Fish Commission Center for Coastal Margin Observation and Prediction [data set], https://cmop.critfc.org/datamart/observation-network/fixed-station/?id=saturn02&tab=inventory#anchor_38 (last access: 22 October 2023), 2023.
Connolly, T. P., Hickey, B. M., Geier, S. L., and Cochlan, W. P.: Processes influencing seasonal hypoxia in the northern California Current System, J. Geophys. Res.-Oceans, 115, C03021, https://doi.org/10.1029/2009JC005283, 2010.
Cullison Gray, S. E., DeGrandpre, M. D., Moore, T. S., Martz, T. R., Friederich, G. E., and Johnson, K. S.: Applications of in situ pH measurements for inorganic carbon calculations, Mar. Chem., 125, 82–90, https://doi.org/10.1016/j.marchem.2011.02.005, 2011.
Davis, C. V., Hewett, K., Hill, T. M., Largier, J. L., Gaylord, B., and Jahncke, J.: Reconstructing aragonite saturation state based on an empirical relationship for Northern California, Estuar. Coast., 41, 2056–2069, https://doi.org/10.1007/s12237-018-0372-0, 2018.
DeGrandpre, M.: pCO2, pH, salinity and temperature data collected off the coast of Oregon, USA by a SAMI-CO2 sensor on the Shelf Break Mooring located below the National Data Buoy Center's meteorological Buoy 46050; 2007–2011 (NH10_ShelfBreak_MLR project), January 2016 ver 12, Biological and Chemical Oceanography Data Management Office (BCO-DMO) [data set], http://lod.bco-dmo.org/id/dataset/632498 (last access: 10 March 2023), 2016.
Dewitt, L.: SFSU EOS YSI Raw data, NOAA [data set], https://oceanview.pfeg.noaa.gov/erddap/tabledap/rtcctdRTCysirt.html (last access: 10 March 2023), 2022.
Dickson, A. G.: Standard potential of the reaction: AgCl(s) + 12H2(g) = Ag(s) + HCl(aq), and and the standard acidity constant of the ion HSO4− in synthetic sea water from 273.15 to 318.15 K, J. Chem. Thermodyn., 22, 113–127, https://doi.org/10.1016/0021-9614(90)90074-Z, 1990.
Dickson, A. G.: Part 1: Seawater carbonate chemistry, in: Guide to Best Practices for Ocean Acidification Research and Data Reporting, edited by: Riesbesell, U., Fabry, V. J., and Hansson, L. (Eds.), Publications Office of the European Union, Luxembourg, 17–40, 2010.
Doney, S. C.: The growing human footprint on coastal and open-ocean biogeochemistry, Science, 328, 1512–1516, https://doi.org/10.1126/science.1185198, 2010.
Doney, S. C., Fabry, V. J., Feely, R. A., and Kleypas, J. A.: Ocean acidification: The other CO2 Problem, Annu. Rev. Mar. Sci., 1, 169–192, https://doi.org/10.1146/annurev.marine.010908.163834, 2009.
Donham, E., Strope, L., Hamilton, S., and Kroeker, K.: Coupled changes in pH, temperature and dissolved oxygen impact the physiology and ecology of herbivorous kelp forest grazers, Dryad [data set], https://doi.org/10.5061/dryad.8sf7m0cq7, 2022a.
Donham, E. M., Strope, L. T., Hamilton, S. L., and Kroeker, K. J.: Coupled changes in pH, temperature, and dissolved oxygen impact the physiology and ecology of herbivorous kelp forest grazers, Glob. Change. Biol., 28, 3023–3039, https://doi.org/10.1111/gcb.16125, 2022b.
Donham, E. M., Flores, I., Hooper, A., O'Brien, E., Vylet, K., Takeshita, Y., Freiwald, J., and Kroeker, K. J.: Population-specific vulnerability to ocean change in a multistressor environment, Sci. Adv., 9, eade2365, https://doi.org/10.1126/sciadv.ade2365, 2023.
Ekstrom, J. A., Suatoni, L., Cooley, S. R., Pendleton, L. H., Waldbusser, G. G., Cinner, J. E., Ritter, J., Langdon, C., van Hooidonk, R., Gledhill, D., Wellman, K., Beck, M. W., Brander, L. M., Rittschof, D., Doherty, C., Edwards, P. E. T., and Portela, R.: Vulnerability and adaptation of US shellfisheries to ocean acidification, Nat. Clim. Change, 5, 207–214, https://doi.org/10.1038/nclimate2508, 2015.
Fassbender, A. J., Sabine, C. L., Feely, R. A., Langdon, C., and Mordy, C. W.: Inorganic carbon dynamics during northern California coastal upwelling, Cont. Shelf Res., 31, 1180–1192, https://doi.org/10.1016/j.csr.2011.04.006, 2011.
Fassbender, A. J., Alin, S. R., Feely, R. A., Sutton, A. J., Newton, J. A., and Byrne, R. H.: Estimating Total Alkalinity in the Washington State Coastal Zone: Complexities and Surprising Utility for Ocean Acidification Research, Estuar. Coast., 40, 404–418, https://doi.org/10.1007/s12237-016-0168-z, 2017.
Feely, R. A. and Sabine, C. L.: Dissolved inorganic carbon, alkalinity, temperature, salinity and other variables collected from discrete sample and profile observations using Alkalinity titrator, CTD and other instruments from WECOMA in the U.S. West Coast California Current System from 2007-05-11 to 2007-06-14 (NCEI Accession 0083685), NOAA National Centers for Environmental Information [data set], https://doi.org/10.3334/cdiac/otg.clivar_nacp_west_coast_cruise _2007, 2013.
Feely, R. A., Sabine, C. L., Hernandez-Ayon, J. M., Ianson, D., and Hales, B.: Evidence for upwelling of corrosive “acidified” water onto the continental shelf, Science, 320, 1490–1492, https://doi.org/10.1126/science.1155676, 2008.
Feely, R. A., Alin, S. R., Hales, B., Johnson, G. C., Byrne, R. H., Peterson, W. T., Liu, X., and Greeley, D.: Dissolved inorganic carbon, total alkalinity, pH on total scale and other variables collected from profile and discrete sample observations on NOAA Ship Fairweather (EXPOCODE 317W20130803) and R/V Point Sur (EXPOCODE 32P020130821) in the U.S. West Coast California Current System during the 2013 West Coast Ocean Acidification Cruise (WCOA2013) from 2013-08-03 to 2013-08-29 (NCEI Accession 0132082), NOAA National Centers for Environmental Information [data set], https://doi.org/10.7289/v5c53hxp, 2015a.
Feely, R. A., Alin, S. R., Hales, B., Johnson, G. C., Juranek, L. W., Byrne, R. H., Peterson, W. T., Goni, M., Liu, X., Greeley, D.: Dissolved inorganic carbon, total alkalinity, pH, temperature, salinity and other variables collected from profile and discrete sample observations using CTD, Niskin bottle, and other instruments from R/V Wecoma in the U.S. West Coast California Current System during the 2011 West Coast Ocean Acidification Cruise (WCOA2011) from 2011-08-12 to 2011-08-30 (NCEI Accession 0123467), NOAA National Centers for Environmental Information [data set], https://doi.org/10.7289/v5jq0xz1, 2015b.
Feely, R. A., Alin, S. R., Carter, B., Bednaršek, N., Hales, B., Chan, F., Hill, T. M., Gaylord, B., Sanford, E., Byrne, R. H., Sabine, C. L., Greeley, D., and Juranek, L.: Chemical and biological impacts of ocean acidification along the west coast of North America, Estuar. Coast. Shelf Sci., 183, 260–270, https://doi.org/10.1016/j.ecss.2016.08.043, 2016a.
Feely, R. A., Alin, S. R., Hales, B., Johnson, G. C., Juranek, L. W., Peterson, W. T., and Greeley, D.: Dissolved inorganic carbon, alkalinity, temperature, salinity and other variables collected from discrete sample and profile observations using Alkalinity titrator, CTD and other instruments from NOAA Ship Bell M. Shimada in the Columbia River estuary – Washington/Oregon, Gulf of the Farallones National Marine Sanctuary and others from 2012-09-04 to 2012-09-17 (NCEI Accession 0157445), NOAA National Centers for Environmental Information [data set], https://doi.org/10.25921/e7m6-gh32, 2016b.
Feely, R. A., Carter, B. R., Greeley, D., McCabe, R. M., and Herndon, J.: Dissolved inorganic carbon (DIC), total alkalinity (TA), pH, temperature, salinity, oxygen, and nutrient data collected from discrete profile measurements during the National Oceanic and Atmospheric Administration Ocean Acidification Program (OAP) program cruise WCOA2021 (EXPOCODE 33RO20210613) in the northeast Pacific marine waters on NOAA Ship Ronald H. Brown from 2021-06-13 to 2021-07-26 (NCEI Accession 0260718). NOAA National Centers for Environmental Information [data set], https://doi.org/10.25921/tzxh-n954, 2022.
Field, J. C. and Francis, R. C.: Considering ecosystem-based fisheries management in the California Current, Mar. Policy, 30, 552–569, https://doi.org/10.1016/j.marpol.2005.07.004, 2006.
Frieder, C. A., Nam, S. H., Martz, T. R., and Levin, L. A.: High temporal and spatial variability of dissolved oxygen and pH in a nearshore California kelp forest, Biogeosciences, 9, 3917–3930, https://doi.org/10.5194/bg-9-3917-2012, 2012.
Free, C. M., Anderson, S. C., Hellmers, E. A., Muhling, B. A., Navarro, M. O., Richerson, K., Rogers, L. A., Satterthwaite, W. H., Thompson, A. R., Burt, J. M., Gaines, S. D., Marshall, K. N., White, J. W., and Bellquist, L. F.: Impact of the 2014–2016 marine heatwave on US and Canada West Coast fisheries: Surprises and lessons from key case studies, Fish. Fish., 24, 652–674, https://doi.org/10.1111/faf.12753, 2023.
Frölicher, T. L. and Laufkötter, C.: Emerging risks from marine heat waves, Nat. Commun., 9, 650, https://doi.org/10.1038/s41467-018-03163-6, 2018.
Fumo, J. T., Carter, M. L., Flick, R. E., Rasmussen, L. L., Rudnick, D. L., and Iacobellis, S. F.: Contextualizing marine heatwaves in the Southern California Bight under anthropogenic climate change, J. Geophys. Res.-Oceans, 125, e2019JC015674, https://doi.org/10.1029/2019JC015674, 2020.
García-Reyes, M. and Largier, J.: Observations of increased wind-driven coastal upwelling off central California, J. Geophys. Res.-Oceans, 115, C040411, https://doi.org/10.1029/2009JC005576, 2010.
García-Reyes, M. and Largier, J. L.: Seasonality of coastal upwelling off central and northern California: New insights, including temporal and spatial variability, J. Geophys. Res.-Oceans, 117, C03028, https://doi.org/10.1029/2011JC007629, 2012.
Gattuso, J.-P., Epitalon, J.-M., Lavigne, H., and Orr, J.: seacarb: Seawater Carbonate Chemistry, R package version 3.2.16, https://CRAN.R-project.org/package=seacarb (last access: 4 January 2024), 2023.
Gentemann, C. L., Fewings, M. R., and García-Reyes, M.: Satellite sea surface temperatures along the West Coast of the United States during the 2014–2016 northeast Pacific marine heat wave, Geophys. Res. Lett., 44, 312–319, https://doi.org/10.1002/2016GL071039, 2017.
Gobler, C. J. and Baumann, H.: Hypoxia and acidification in ocean ecosystems: coupled dynamics and effects on marine life, Biol. Lett., 12, 20150976, https://doi.org/10.1098/rsbl.2015.0976, 2016.
Grantham, B. A., Chan, F., Nielsen, K. J., Fox, D. S., Barth, J. A., Huyer, A., Lubchenco, J., and Menge, B. A.: Upwelling-driven nearshore hypoxia signals ecosystem and oceanographic changes in the northeast Pacific, Nature, 429, 749–754, https://doi.org/10.1038/nature02605, 2004.
Gruber, N., Hauri, C., Lachkar, Z., Loher, D., Frölicher, T. L., and Plattner, G.-K.: Rapid progression of ocean acidification in the California Current System, Science, 337, 220–223, https://doi.org/10.1126/science.1216773, 2012.
Hales, B., Chipman, D., and Takahashi, T.: High-frequency measurement of partial pressure and total concentration of carbon dioxide in seawater using microporous hydrophobic membrane contactors, Limnol. Oceanogr. Methods, 2, 356–364, https://doi.org/10.4319/lom.2004.2.356, 2004.
Hamilton, S. L., Kennedy, E. G., Zulian, M., Hill, T. M., Gaylord, B., Sanford, E., Ricart, A. M., Ward, M., Spalding, A. K., and Kroeker, K.: Variable exposure to multiple climate stressors across the California marine protected area network and policy implications, ICES J. Mar. Sci., 80, 1923–1935, https://doi.org/10.1093/icesjms/fsad120, 2023.
Hauri, C., Gruber, N., Vogt, M., Doney, S. C., Feely, R. A., Lachkar, Z., Leinweber, A., McDonnell, A. M. P., Munnich, M., and Plattner, G.-K.: Spatiotemporal variability and long-term trends of ocean acidification in the California Current System, Biogeosciences, 10, 193–216, https://doi.org/10.5194/bg-10-193-2013, 2013.
Hickey, B. M.: The California current system – hypotheses and facts, Prog. Oceanogr., 8, 191–279, https://doi.org/10.1016/0079-6611(79)90002-8, 1979.
Hodgson, E. E., Kaplan, I. C., Marshall, K. N., Leonard, J., Essington, T. E., Busch, D. S., Fulton, E. A., Harvey, C. J., Hermann, A. J., and McElhany, P.: Consequences of spatially variable ocean acidification in the California Current: Lower pH drives strongest declines in benthic species in southern regions while greatest economic impacts occur in northern regions, Ecol. Modell., 383, 106–117, https://doi.org/10.1016/j.ecolmodel.2018.05.018, 2018.
Hofmann, A. F., Peltzer, E. T., Walz, P. M., and Brewer, P. G.: Hypoxia by degrees: Establishing definitions for a changing ocean, Deep-Sea Res. Pt. I, 58, 1212–1226, https://doi.org/10.1016/j.dsr.2011.09.004, 2011a.
Hofmann, G. E., Smith, J. E., Johnson, K. S., Send, U., Levin, L. A., Micheli, F., Paytan, A., Price, N. N., Peterson, B., Takeshita, Y., Matson, P. G., Crook, E. D., Kroeker, K. J., Gambi, M. C., Rivest, E. B., Frieder, C. A., Yu, P. C., and Martz, T. R.: High-Frequency dynamics of ocean pH: A multi-ecosystem comparison, PLoS ONE, 6, e28983, https://doi.org/10.1371/journal.pone.0028983, 2011b.
Howard, E. M., Frenzel, H., Kessouri, F., Renault, L., Bianchi, D., McWilliams, J. C., and Deutsch, C.: Attributing causes of future climate change in the California Current System with multimodel downscaling, Global Biogeochem. Cy., 34, e2020GB006646, https://doi.org/10.1029/2020GB006646, 2020a.
Howard, E. M., Penn, J. L., Frenzel, H., Seibel, B. A., Bianchi, D., Renault, L., Kessouri, F., Sutula, M. A., McWilliams, J. C., and Deutsch, C.: Climate-driven aerobic habitat loss in the California Current System, Sci. Adv., 6, eaay3188, https://doi.org/10.1126/sciadv.aay3188, 2020b.
Huyer, A.: Coastal upwelling in the California current system, Prog. Oceanogr., 12, 259–284, https://doi.org/10.1016/0079-6611(83)90010-1, 1983.
IPCC: IPCC special report on the ocean and cryosphere in a changing climate, 1st edn., edited by: Pörtner, H.-O., Roberts, D. C., Masson-Delmotte, V., Zhai, P., Tignor, M., Poloczanska, E., Mintenbeck, K., Alegria, A., Nicolai, M., Okem, A., Petzold, J., Rama, B., and Weyer, N. M., Cambridge University Press, Cambridge, UK and New York, NY, USA, 755 pp., https://doi.org/10.1017/9781009157964, 2019.
Jacox, M. G., Hazen, E. L., Zaba, K. D., Rudnick, D. L., Edwards, C. A., Moore, A. M., and Bograd, S. J.: Impacts of the 2015–2016 El Niño on the California Current System: Early assessment and comparison to past events, Geophys. Res. Lett., 43, 7072–7080, https://doi.org/10.1002/2016GL069716, 2016.
Jacox, M. G., Edwards, C. A., Hazen, E. L., and Bograd, S. J.: Coastal upwelling revisited: Ekman, Bakun, and improved upwelling indices for the U.S. West Coast, J. Geophys. Res.-Oceans, 123, 7332–7350, https://doi.org/10.1029/2018JC014187, 2018.
Jiang, L.-Q., Feely, R. A., Wanninkhof, R., Greeley, D., Barbero, L., Alin, S., Carter, B. R., Pierrot, D., Featherstone, C., Hooper, J., Melrose, C., Monacci, N., Sharp, J. D., Shellito, S., Xu, Y.-Y., Kozyr, A., Byrne, R. H., Cai, W.-J., Cross, J., Johnson, G. C., Hales, B., Langdon, C., Mathis, J., Salisbury, J., and Townsend, D. W.: Coastal Ocean Data Analysis Product in North America (CODAP-NA) – an internally consistent data product for discrete inorganic carbon, oxygen, and nutrients on the North American ocean margins, Earth Syst. Sci. Data, 13, 2777–2799, https://doi.org/10.5194/essd-13-2777-2021, 2021.
Kekuewa, S. and Andersson, A.: Monthly cross-shore transects of biogeochemical properties in La Jolla, CA, Biological and Chemical Oceanography Data Management Office (BCO-DMO) [data set], https://doi.org/10.26008/1912/bco-dmo.839175.1, 2022.
Kekuewa, S. A. H., Courtney, T. A., Cyronak, T., and Andersson, A. J.: Seasonal nearshore ocean acidification and deoxygenation in the Southern California Bight, Sci. Rep.-UK, 12, 17969, https://doi.org/10.1038/s41598-022-21831-y, 2022.
Kelly, M. W. and Hofmann, G. E.: Adaptation and the physiology of ocean acidification, Funct. Ecol., 27, 980–990, https://doi.org/10.1111/j.1365-2435.2012.02061.x, 2013.
Kennedy, E.: egkennedy/DSP_public_code: Code to accompany Kennedy et al., 2023 (initial_release), Zenodo [code], https://doi.org/10.5281/zenodo.10408321, 2023.
Kennedy, E. G., Zulian, M., Hamilton, S. L., Hill, T. M., Delgado, M., Fish, C. R., Gaylord, B., Kroeker, K. J., Palmer, H. M., Ricart, A. M., Sanford, E., Spalding, A. K., Ward, M. A., Carrasco, G., Elliott, M., Grisby, G. V., Harris, E., Jahncke, J., Rocheleau, C. N., Westerink, S., and Wilmot, M. I.: Multistressor Observations of Coastal Hypoxia and Acidification (MOCHA) Synthesis (NCEI Accession 0277984), NOAA National Centers for Environmental Information [data set], https://doi.org/10.25921/2vve-fh39, 2023.
Kroeker, K. J., Kordas, R. L., Crim, R., Hendriks, I. E., Ramajo, L., Singh, G. S., Duarte, C. M., and Gattuso, J.-P.: Impacts of ocean acidification on marine organisms: quantifying sensitivities and interaction with warming, Glob. Change Biol., 19, 1884–1896, https://doi.org/10.1111/gcb.12179, 2013.
Kroeker, K. J., Donham, E. M., Vylet, K., Warren, J. K., Cheresh, J., Fiechter, J., Freiwald, J., and Takeshita, Y.: Exposure to extremes in multiple global change drivers: Characterizing pH , dissolved oxygen, and temperature variability in a dynamic, upwelling dominated ecosystem, Limnol. Oceanogr., 68, 1611–1623, https://doi.org/10.1002/lno.12371, 2023.
Kudela, R.: CeNCOOS in situ Water monitoring data at the Santa Cruz municipal wharf, CeNCOOS Data Portal [data set], https://data.cencoos.org/#metadata/48323/station, 2020.
Lai, C.-Z., DeGrandpre, M. D., and Darlington, R. C.: Autonomous optofluidic chemical analyzers for marine applications: Insights from the Submersible Autonomous Moored Instruments (SAMI) for pH and pCO2, Front. Mar. Sci., 4, 438, 2018.
Levitus, S., Antonov, J. I., Boyer, T. P., Baranova, O. K., Garcia, H. E., Locarnini, R. A., Mishonov, A. V., Reagan, J. R., Seidov, D., Yarosh, E. S., and Zweng, M. M.: World ocean heat content and thermosteric sea level change (0–2000 m), 1955–2010, Geophys. Res. Lett., 39, L10603, https://doi.org/10.1029/2012GL051106, 2012.
Low, N. H. N., Micheli, F., Aguilar, J. D., Arce, D. R., Boch, C. A., Bonilla, J. C., Bracamontes, M. Á., De Leo, G., Diaz, E., Enríquez, E., Hernandez, A., Martinez, R., Mendoza, R., Miranda, C., Monismith, S., Ramade, M., Rogers-Bennett, L., Romero, A., Salinas, C., Smith, A. E., Torre, J., Villavicencio, G., and Woodson, C. B.: Variable coastal hypoxia exposure and drivers across the southern California Current, Sci. Rep.-UK, 11, 10929, https://doi.org/10.1038/s41598-021-89928-4, 2021.
Lueker, T. J., Dickson, A. G., and Keeling, C. D.: Ocean pCO2 calculated from dissolved inorganic carbon, alkalinity, and equations for K1 and K2: validation based on laboratory measurements of CO2 in gas and seawater at equilibrium, Mar. Chem., 70, 105–119, https://doi.org/10.1016/S0304-4203(00)00022-0, 2000.
Marchesiello, P., McWilliams, J. C., and Shchepetkin, A.: Equilibrium structure and dynamics of the California Current System, J. Phys. Oceanogr., 33, 753–783, https://doi.org/10.1175/1520-0485(2003)33<753:ESADOT>2.0.CO;2, 2003.
Marshall, K. N., Kaplan, I. C., Hodgson, E. E., Hermann, A., Busch, D. S., McElhany, P., Essington, T. E., Harvey, C. J., and Fulton, E. A.: Risks of ocean acidification in the California Current food web and fisheries: ecosystem model projections, Glob. Change Biol., 23, 1525–1539, https://doi.org/10.1111/gcb.13594, 2017.
Martz, T. R., Connery, J. G., and Johnson, K. S.: Testing the Honeywell Durafet® for seawater pH applications, Limnol. Oceanogr. Methods, 8, 172–184, https://doi.org/10.4319/lom.2010.8.172, 2010.
Martz, T. R., Daly, K. L., Byrne, R. H., Stillman, J. H., and Turk, D.: Technology for ocean acidification research: Needs and availability, Oceanography, 28, 40–47, 2015.
Menge, B. A., Chavez, F., Chan, F., Russell, A. D., Blanchette, C. A., Sanford, E., Friederich, G., McManus, M. A., Raimondi, P. T., Barth, J., Hill, T. M., Nielsen, K. J., Hacker, S. D., Washburn, L., and Gaylord, B.: Moorings temperature and pH from multiple sites in the California Current System starting 2008 (OMEGAS-MaS project, ACIDIC project), May 2015 ver 28, Biological and Chemical Oceanography Data Management Office (BCO-DMO) [data set], http://lod.bco-dmo.org/id/dataset/3650 (last access: 12 October 2023), 2015.
National Data Buoy Center: Historical NDBC Data, National Oceanic and Atmospheric Administration [data set], https://www.ndbc.noaa.gov/historical_data.shtml#ocean (last access: 4 January 2024), 2023.
Newton, J. A., Feely, R. A., Jewett, E. B., Williamson, P., and Mathis, J.: Global Ocean Acidification Observing Network: Requirements and Governance Plan, GOA-ON, 2nd edn., https://www.iaea.org/sites/default/files/18/06/goa-on-second-edition-2015.pdf (last access: 4 January 2023), 2015.
NSF Ocean Observatories Initiative: Coastal Endurance Washington Shelf Surface Mooring from June 2016 to December 2022, Data Explorer [data set], https://dataexplorer.oceanobservatories.org/#ooi/array/CE/subsite/CE07SHSM (last access: 11 October 2023), 2022.
Palevsky, H., Clayton, S., Atamanchuk, D., Battisti, R., Batryn, J., Bourbonnais, A., Briggs, E. M., Carvalho, F., Chase, A. P., Eveleth, R., Fatland, R., Fogaren, K. E., Fram, J. P., Hartman, S. E., Le Bras, I., Manning, C. C. M., Needoba, J. A., Neely, M. B., Oliver, H., Reed, A. C., Rheuban, J. E., Schallenberg, C., Vardaro, M. F., Walsh, I., and Wingard, C.: OOI Biogeochemical Sensor Data Best Practices and User Guide, Version 1.0.0, Ocean Observatories Initiative, Biogeochemical Sensor Data Working Group, https://doi.org/10.25607/OBP-1865, 2022.
Perez, F. F. and Fraga, F.: Association constant of fluoride and hydrogen ions in seawater, Mar. Chem., 21, 161–168, https://doi.org/10.1016/0304-4203(87)90036-3, 1987.
Ricart, A. M., Ward, M., Hill, T. M., Sanford, E., Kroeker, K. J., Takeshita, Y., Merolla, S., Shukla, P., Ninokawa, A. T., Elsmore, K., and Gaylord, B.: Coast-wide evidence of low pH amelioration by seagrass ecosystems, Glob. Change Biol., 27, 2580–2591, https://doi.org/10.1111/gcb.15594, 2021.
Risien, C. M., Fewings, M. R., Fisher, J. L., Peterson, J. O., and Morgan, C. A.: Spatially gridded cross-shelf hydrographic sections and monthly climatologies from shipboard survey data collected along the Newport Hydrographic Line, 1997–2021, Data Brief, 41, 107922, https://doi.org/10.1016/j.dib.2022.107922, 2022a.
Risien, C. M., Fewings, M. R., Fisher, J. L., Peterson, J. O., Morgan, C. A., and Peterson, W.: Spatially gridded cross-shelf hydrographic sections and monthly climatologies from shipboard survey data collected along the Newport Hydrographic Line, 1997–2021 (1.0), Zenodo [data set], https://doi.org/10.5281/zenodo.5814071, 2022b.
Rogers-Bennett, L. and Catton, C. A.: Marine heat wave and multiple stressors tip bull kelp forest to sea urchin barrens, Sci. Rep.-UK, 9, 15050, https://doi.org/10.1038/s41598-019-51114-y, 2019.
Rosenau, N. A., Galavotti, H., Yates, K. K., Bohlen, C., Hunt, C. W., Liebman, M., Brown, C. A., Pacella, S. R., Largier, J. L., Nielsen, K. J., Hu, X., McCutcheon, M. R., Vasslides, J. M., Poach, M., Ford, T., Johnston, K., and Steele, A.: High-resolution coastal acidification monitoring data collected in seven estuaries along the US East Coast, US West Coast and Gulf of Mexico from 2015-04-23 to 2020-07-29 (NCEI Accession 0225225), NOAA National Centers for Environmental Information [data set], https://doi.org/10.25921/xg33-1n83, 2021a.
Rosenau, N. A., Galavotti, H., Yates, K. K., Bohlen, C. C., Hunt, C. W., Liebman, M., Brown, C. A., Pacella, S. R., Largier, J. L., Nielsen, K. J., Hu, X., McCutcheon, M. R., Vasslides, J. M., Poach, M., Ford, T., Johnston, K., and Steele, A.: Integrating high-resolution coastal acidification monitoring data across seven United States estuaries, Front. Mar. Sci., 8, 679913, 2021b.
Ruhl, H. A., Brown, J. A., Harper, A. R., Hazen, E. L., deWitt, L., Daniel, P., DeVogelaere, A., Kudela, R. M., Ryan, J. P., Fischer, A. D., Muller-Karger, F. E., and Chavez, F. P.: Integrating biodiversity and environmental observations: In support of National Marine Sanctuary and Large Marine Ecosystem assessments, Oceanography, 34, 142–155, 2021.
Sabine, C. L., Hankin, S., Koyuk, H., Bakker, D. C. E., Pfeil, B., Olsen, A., Metzl, N., Kozyr, A., Fassbender, A., Manke, A., Malczyk, J., Akl, J., Alin, S. R., Bellerby, R. G. J., Borges, A., Boutin, J., Brown, P. J., Cai, W.-J., Chavez, F. P., Chen, A., Cosca, C., Feely, R. A., González-Dávila, M., Goyet, C., Hardman-Mountford, N., Heinze, C., Hoppema, M., Hunt, C. W., Hydes, D., Ishii, M., Johannessen, T., Key, R. M., Körtzinger, A., Landschützer, P., Lauvset, S. K., Lefèvre, N., Lenton, A., Lourantou, A., Merlivat, L., Midorikawa, T., Mintrop, L., Miyazaki, C., Murata, A., Nakadate, A., Nakano, Y., Nakaoka, S., Nojiri, Y., Omar, A. M., Padin, X. A., Park, G.-H., Paterson, K., Perez, F. F., Pierrot, D., Poisson, A., Ríos, A. F., Salisbury, J., Santana-Casiano, J. M., Sarma, V. V. S. S., Schlitzer, R., Schneider, B., Schuster, U., Sieger, R., Skjelvan, I., Steinhoff, T., Suzuki, T., Takahashi, T., Tedesco, K., Telszewski, M., Thomas, H., Tilbrook, B., Vandemark, D., Veness, T., Watson, A. J., Weiss, R., Wong, C. S., and Yoshikawa-Inoue, H.: Surface Ocean CO2 Atlas (SOCAT) gridded data products, Earth Syst. Sci. Data, 5, 145–153, https://doi.org/10.5194/essd-5-145-2013, 2013.
Sakuma, K.: Project report: Rockfish Recruitment and Ecosystem Assessment (NOAA Ship Reuben Lasker, RL-22-02, 28 April–16 June 2022), NMFS Southwest Fisheries Science Center, Santa Cruz, CA, 2022.
Salop, P. and Herrmann, C.: 2019 RMP Water cruise report, Regional Monitoring Program for Water Quality in San Francisco Bay, San Francisco Estuary Institute, Richmond, CA, 2019.
Sanford, E. and Kelly, M. W.: Local adaptation in marine invertebrates, Annu. Rev. Mar. Sci., 3, 509–535, https://doi.org/10.1146/annurev-marine-120709-142756, 2011.
Sanford, E., Sones, J. L., García-Reyes, M., Goddard, J. H. R., and Largier, J. L.: Widespread shifts in the coastal biota of northern California during the 2014–2016 marine heatwaves, Sci. Rep.-UK, 9, 4216, https://doi.org/10.1038/s41598-019-40784-3, 2019.
Santa Barbara Coastal LTER, Hofmann, G. E. and Washburn, L.: SBC LTER: Ocean: Time-series: Mid-water SeaFET pH and CO2 system chemistry at Alegria(ALE), ongoing since 2011-06-21, Environmental Data Initiative [data set], https://doi.org/10.6073/pasta/1bd1491475ff6afee4be10d054d1ef0b, 2018.
Santa Barbara Coastal LTER, Hofmann, G., and Washburn, L.: SBC LTER: Ocean: Time-series: Mid-water SeaFET pH and CO2 system chemistry with surface and bottom Dissolved Oxygen at Arroyo Quemado Reef(ARQ), 2012–2017 ver 5, Environmental Data Initiative [data set], https://doi.org/10.6073/pasta/6a81dcaaa9931c31dfa59132c7c5f829, 2020a.
Santa Barbara Coastal LTER, Hofmann, G., and Washburn, L.: SBC LTER: Ocean: Time-series: Mid-water SeaFET pH and CO2 system chemistry with surface and bottom Dissolved Oxygen at Mohawk Reef(MKO), 2012–2017 ver 5, Environmental Data Initiative [data set], https://doi.org/10.6073/pasta/23b8070eb65bae7aedc82fae8ee38b9f, 2020b.
Santa Barbara Coastal LTER, Hofmann, G., and Washburn, L.: SBC LTER: Ocean: Time-series: Mid-water SeaFET pH and CO2 system chemistry with surface and bottom Dissolved Oxygen at Santa Barbara Harbor/Stearns Wharf(SBH), 2012–2017 ver 4, Environmental Data Initiative [data set], https://doi.org/10.6073/pasta/6322ad40dfbc0bbc037994490218e28e, 2020c.
Santa Barbara Coastal LTER, Hofmann, G., Blanchette, C., Passow, U., Washburn, L., Lunden, J., Rivest, E., Kapsenberg, L., and Kui, L.: SBC LTER: pH time series: Water-sample pH and CO2 system chemistry, ongoing since 2011, ver 6, Environmental Data Initiative [data set], https://doi.org/10.6073/pasta/8efa600f49c3a171b13d05d70fad1d98, 2022.
Schar, D., Atkinson, M., Johengen, T., Pinchuk, A., Purcell, H., Robertson, C., Smith, G. J., and Tamburri, M.: Performance demonstration statement: Sunburst Sensors SAMI-CO2, Alliance for Coastal Technologies, Chesapeake Biological Laboratory, Solomons, Maryland, USA, 2009.
Send, U., Ohman, M., Lankhorst, M., and Kim, H-J.: Dissolved inorganic carbon, total alkalinity, nutrients, and other variables collected from profile and discrete observations using CTD, Niskin bottle, and other instruments from R/V New Horizon and R/V Robert Gordon Sproul in the U.S. West Coast for calibration and validation of California Current Ecosystem (CCE) Moorings from 2009-12-15 to 2015-04-29 (NCEI Accession 0146024), NOAA National Centers for Environmental Information [data set], https://doi.org/10.7289/v57d2s6c, 2016.
Sharp, J. D., Fassbender, A. J., Carter, B. R., Lavin, P. D., and Sutton, A. J.: A monthly surface pCO2 product for the California Current Large Marine Ecosystem, Earth Syst. Sci. Data, 14, 2081–2108, https://doi.org/10.5194/essd-14-2081-2022, 2022.
Shaughnessy, F: CeNCOOS in situ water monitoring data at Trinidad Head, California [data set], https://data.cencoos.org/#metadata/48097/station (last access: 10 August 2023), 2023.
Siedlecki, S., Bjorkstedt, E., Feely, R., Sutton, A., Cross, J., and Newton, J.: Impact of the Blob on the Northeast Pacific Ocean biogeochemistry and ecosystems, US Clivar Variations, 14, 7–12, 2016.
Siedlecki, S. A., Pilcher, D., Howard, E. M., Deutsch, C., MacCready, P., Norton, E. L., Frenzel, H., Newton, J., Feely, R. A., Alin, S. R., and Klinger, T.: Coastal processes modify projections of some climate-driven stressors in the California Current System, Biogeosciences, 18, 2871–2890, https://doi.org/10.5194/bg-18-2871-2021, 2021.
Sunday, J. M., Howard, E., Siedlecki, S., Pilcher, D. J., Deutsch, C., MacCready, P., Newton, J., and Klinger, T.: Biological sensitivities to high-resolution climate change projections in the California Current marine ecosystem, Glob. Change Biol., 28, 5726–5740, https://doi.org/10.1111/gcb.16317, 2021.
Sutton, A. J., Sabine, C. L., Send, U., Ohman, M., Musielewicz, S., Maenner Jones, S., Dietrich, C., Bott, R., and Osborne, J.: High-resolution ocean and atmosphere pCO2 time-series measurements from Mooring CCE2_121W_34N in the North Pacific Ocean from 2010-01-17 to 2021-06-16 (NCEI Accession 0084099), NOAA National Centers for Environmental Information [data set], https://doi.org/10.3334/cdiac/otg.tsm_cce2_121w_34n, 2012.
Sutton, A. J., Sabine, C. L., Musielewicz, S., Maenner Jones, S., Dietrich, C., Bott, R., and Osborne, J.: High-resolution ocean and atmosphere pCO2 time-series measurements from mooring WA_125W_47N in the North Pacific Ocean (NCEI Accession 0115322), NOAA National Centers for Environmental Information [data set], https://doi.org/10.3334/cdiac/otg.tsm_wa_125w_47n, 2013.
Sutton, A. J., Sabine, C. L., Maenner-Jones, S., Lawrence-Slavas, N., Meinig, C., Feely, R. A., Mathis, J. T., Musielewicz, S., Bott, R., McLain, P. D., Fought, H. J., and Kozyr, A.: A high-frequency atmospheric and seawater pCO2 data set from 14 open-ocean sites using a moored autonomous system, Earth Syst. Sci. Data, 6, 353–366, https://doi.org/10.5194/essd-6-353-2014, 2014.
Sutton, A. J., Sabine, C. L., Hales, B., Musielewicz, S., Maenner Jones, S., Dietrich, C., Bott, R., and Osborne, J.: High-resolution ocean and atmosphere pCO2 time-series measurements from mooring NH10_124W_44N in the North Pacific Ocean (NCEI Accession 0157247), NOAA National Centers for Environmental Information [data set], https://doi.org/10.3334/cdiac/otg.tsm_nh10_124w_44n, 2016a.
Sutton, A. J., Sabine, C. L., Send, U., Ohman, M., Dietrich, C., Maenner Jones, S., Musielewicz, S., Bott, R., and Osborne, J.: High-resolution ocean and atmosphere pCO2 time-series measurements from mooring CCE1_122W_33N in the North Pacific Ocean from 2008-11-11 to 2020-06-11 (NCEI Accession 0144245), NOAA National Centers for Environmental Information [data set], https://doi.org/10.3334/cdiac/otg.tsm_cce1_122w_33n, 2016b.
Sutton, A. J., Hales, B., Musielewicz, S., Maenner Jones, S., Bott, R., and Osborne, J.: High-resolution ocean and atmosphere pCO2 time-series measurements from mooring CB-06_125W_43N in the North Pacific Ocean (NCEI Accession 0190840), NOAA National Centers for Environmental Information [data set], https://doi.org/10.25921/rr8z-se53, 2019.
Swiney, K. M., Long, W. C., Foy, R. J., and Fields, D. M.: Decreased pH and increased temperatures affect young-of-the-year red king crab (Paralithodes camtschaticus), ICES J. Mar. Sci., 74, 1191–1200, https://doi.org/10.1093/icesjms/fsw251, 2017.
Sydeman, W. J., Thompson, S. A., García-Reyes, M., Kahru, M., Peterson, W. T., and Largier, J. L.: Multivariate ocean-climate indicators (MOCI) for the central California Current: Environmental change, 1990–2010, Prog. Oceanogr., 120, 352–369, https://doi.org/10.1016/j.pocean.2013.10.017, 2014.
Takeshita, Y., Frieder, C. A., Martz, T. R., Ballard, J. R., Feely, R. A., Kram, S., Nam, S., Navarro, M. O., Price, N. N., and Smith, J. E.: Including high-frequency variability in coastal ocean acidification projections, Biogeosciences, 12, 5853–5870, https://doi.org/10.5194/bg-12-5853-2015, 2015.
Taylor-Burns, R., Cochran, C., Ferron, K., Harris, M., Thomas, C., Fredston, A., and Kendall, B. E.: Locating gaps in the California Current System ocean acidification monitoring network, Sci. Prog., 103, 0036850420936204, https://doi.org/10.1177/0036850420936204, 2020.
Trowbridge, J., Weller, R., Kelley, D., Dever, E., Plueddemann, A., Barth, J. A., and Kawka, O.: The Ocean Observatories Initiative, Front. Mar. Sci., 6, 74, 2019.
Uppström, L. R.: The boron/chlorinity ratio of deep-sea water from the Pacific Ocean, Deep-Sea Res. Pt. I, 21, 161–162, https://doi.org/10.1016/0011-7471(74)90074-6, 1974.
Vaquer-Sunyer, R. and Duarte, C. M.: Thresholds of hypoxia for marine biodiversity, P. Natl. Acad. Sci. USA, 105, 15452–15457, https://doi.org/10.1073/pnas.0803833105, 2008.
Walter, R.: CeNCOOS in situ water quality monitoring at Morro Bay, CeNCOOS Data Portal [data set], https://data.cencoos.org/#metadata/20679/station (last access: 12 August 2023), 2023.
Wang, D., Gouhier, T. C., Menge, B. A., and Ganguly, A. R.: Intensification and spatial homogenization of coastal upwelling under climate change, Nature, 518, 390–394, https://doi.org/10.1038/nature14235, 2015.
Ward, M., Spalding, A. K., Levine, A., and Wolters, E. A.: California shellfish farmers: Perceptions of changing ocean conditions and strategies for adaptive capacity, Ocean Coast Manag., 225, 106155, https://doi.org/10.1016/j.ocecoaman.2022.106155, 2022.
Weisberg, S., Chan, F., Barry, J., Boehm, A., Noaa, S. B., Cooley, S., Feely, R., Levin, L., Carter, H., Abderrahim, M., and Kimball, J.: Enhancing California's ocean acidification and hypoxia monitoring network: Recommendations to the Ocean Protection Council from the California Ocean Acidification and Hypoxia Science Task Force, California Ocean Science Trust, Sacramento, California, USA, https://www.opc.ca.gov/webmaster/ftp/pdf/agenda_items/20210615/Item4a_Exhibit_B_Enhancing_Californias_Ocean_Acidification_and_Hypoxia_Monitoring_Network.pdf (last access: 4 January 2023), 2020.
Wilkinson, M. D., Dumontier, M., Aalbersberg, Ij. J., Appleton, G., Axton, M., Baak, A., Blomberg, N., Boiten, J.-W., da Silva Santos, L. B., Bourne, P. E., Bouwman, J., Brookes, A. J., Clark, T., Crosas, M., Dillo, I., Dumon, O., Edmunds, S., Evelo, C. T., Finkers, R., Gonzalez-Beltran, A., Gray, A. J. G., Groth, P., Goble, C., Grethe, J. S., Heringa, J., 't Hoen, P. A. C., Hooft, R., Kuhn, T., Kok, R., Kok, J., Lusher, S. J., Martone, M. E., Mons, A., Packer, A. L., Persson, B., Rocca-Serra, P., Roos, M., van Schaik, R., Sansone, S.-A., Schultes, E., Sengstag, T., Slater, T., Strawn, G., Swertz, M. A., Thompson, M., van der Lei, J., van Mulligen, E., Velterop, J., Waagmeester, A., Wittenburg, P., Wolstencroft, K., Zhao, J., and Mons, B.: The FAIR Guiding Principles for scientific data management and stewardship, Sci. Data, 3, 160018, https://doi.org/10.1038/sdata.2016.18, 2016.
Woodson, C. B., Micheli, F., Boch, C., Al-Najjar, M., Espinoza, A., Hernandez, A., Vázquez-Vera, L., Saenz-Arroyo, A., Monismith, S. G., and Torre, J.: Harnessing marine microclimates for climate change adaptation and marine conservation, Conserv. Lett., 12, e12609, https://doi.org/10.1111/conl.12609, 2019.
Wootton, J. T. and Pfister, C. A.: Carbon System Measurements and Potential Climatic Drivers at a Site of Rapidly Declining Ocean pH, PLoS ONE, 7, e53396, https://doi.org/10.1371/journal.pone.0053396, 2012.