the Creative Commons Attribution 4.0 License.
the Creative Commons Attribution 4.0 License.
 | 16 Aug 2023
Role of mean and variability change in changes in European annual and seasonal extreme precipitation events
The frequency of precipitation extremes is set to change in response to a warming climate. Thereby, the change in extreme precipitation event occurrence is influenced by both a shift in the mean and a change in variability. How large the individual contributions are from either of them (mean or variability) to the change in precipitation extremes is largely unknown. This is, however, relevant for a better understanding of how and why climate extremes change. For this study, two sets of forcing experiments from the regional CRCM5 initial-condition large ensemble are used: a set of 50 members with historical and RCP8.5 forcing and a 35-member (700-year) ensemble of pre-industrial natural forcing. The concept of the probability risk ratio is used to partition the change in extreme-event occurrence into contributions from a change in mean climate or a change in variability. The results show that the contributions from a change in variability are in parts equally important to changes in the mean and can even exceed them. The level of contributions shows high spatial variation, which underlines the importance of regional processes for changes in extremes. While over Scandinavia or central Europe the mean influences the increase in extremes more, the increase is driven by changes in variability over France, the Iberian Peninsula, and the Mediterranean. For annual extremes, the differences between the ratios of contribution of mean and variability are smaller, while on seasonal scales the difference in contributions becomes larger. In winter (DJF) the mean contributes more to an increase in extreme events, while in summer (JJA) the change in variability drives the change in extremes. The level of temporal aggregation (3, 24, 72 h) has only a small influence on annual and winterly extremes, while in summer the contribution from variability can increase with longer durations. The level of extremeness for the event definition generally increases the role of variability. These results highlight the need for a better understanding of changes in climate variability to better understand the mechanisms behind changes in climate extremes.
- Article
(8881 KB) -
Supplement
(4069 KB) - BibTeX
- EndNote


Climate extremes (i.e., droughts, heat waves, and floods) are set to change in a warming climate (Böhnisch et al., 2021; Brunner et al., 2021; Suarez-Gutierrez et al., 2020; van der Wiel et al., 2022) and recent devastating extreme events are testing the resilience of society. The rapid attribution of recent extreme events, such as the July 2021 Flood in western Germany (Kreienkamp et al., 2021) or the heat wave in British Columbia in June 2021 (Philip et al., 2022) emphasize an already quantifiable influence of climate change on the severity of these and other extreme events. In observational records significant trends emerge for various extreme metrics (Contractor et al., 2021; Fischer and Knutti, 2016; Fowler et al., 2021; Guerreiro et al., 2018; Westra et al., 2013). The impact of a warming climate on future precipitation extremes is a well-studied research field (Martel et al., 2021) with a consensus that precipitation extremes are increasing in magnitude and frequency over most parts of the world. Over Europe, it is shown that the magnitude of extreme or heavy precipitation is increasing in central and northern Europe in all seasons, while the Mediterranean region can show decreasing trends in summer (Aalbers et al., 2018; Hodnebrog et al., 2019; Poschlod and Ludwig, 2021; Rajczak and Schär, 2017; Rutgersson et al., 2022; Wood and Ludwig, 2020). At subdaily timescales precipitation extremes can increase at higher rates than on daily timescales (Wood and Ludwig, 2020; Fowler et al., 2021). The general assumption is that the magnitude of precipitation extremes is likely to increase under a warming climate due to atmospheric warming and its inherent impact on the hydrological cycle (Allen and Ingram, 2002; Held and Soden, 2006). While global mean precipitation is constrained by the Earth's energy budget and scales at 1 % K−1–3 % K−1 per degree of global surface temperature warming, extremes are not constrained and can scale at the rate of moisture change at around 6 % K−1–7 % K−1 (O'Gorman and Schneider, 2009). Regionally and seasonally it is shown that precipitation extremes can considerably deviate from these global scaling rates by scaling at levels well above the 7 % K−1 Clausius–Clapeyron scaling (Wood and Ludwig, 2020; Lenderink et al., 2017; Poschlod and Ludwig, 2021; Lenderink and van Meijgaard, 2008) or showing negative scaling rates for seasonal extremes in the Mediterranean (Wood and Ludwig, 2020; Bador and Alexander, 2022). The regional and seasonal response of extreme precipitation to global warming is thereby governed by thermodynamic and dynamic drivers (Brogli et al., 2019; Kröner et al., 2017; Pfahl et al., 2017; Norris et al., 2019; de Vries et al., 2022). Besides the change in the magnitude of extreme precipitation, the extreme-event occurrence (i.e., frequency) is also set to change under global warming (Martel et al., 2020; Myhre et al., 2019).
Any changes to the distribution of precipitation, and hence also extreme events at the tail of the distribution, are influenced by both a shift in the mean and a change in variability. Thereby, the changes in the mean and variability can have different driving mechanisms (Pendergrass et al., 2017; van der Wiel and Bintanja, 2021; Bintanja and Selten, 2014; Bintanja et al., 2020). The variability connects the swings between extreme climatic states (Swain et al., 2018), and even when taking an evolving mean climate into account the change in variability influences the occurrence of extremes (Suarez-Gutierrez et al., 2020). Precipitation variability has been shown to increase at a higher rate than mean precipitation with regionally diverse patterns (Pendergrass et al., 2017; Wood et al., 2021). In global climate model simulations, van der Wiel and Bintanja (2021) show that the contributions of climate variability to the change in monthly extreme precipitation is considerable and that the contribution shows strong regional variations. However, to analyze the contributions on the European scale, higher-resolution regional climate simulations are required. Higher-resolution regional climate models yield lower biases and show added value in representing local climate (Prein et al., 2016; Poschlod, 2021).
Extreme events with rare occurrences are the most discernible manifestation of internal climate variability, and more broadly precipitation projections are strongly influenced by the uncertainty of internal climate variability even far into the future (Lehner et al., 2020), especially on regional scales (Lehner et al., 2020; Wood and Ludwig, 2020). Hence, climate simulations from a regional single-model initial-condition large ensemble (SMILE) are used for a more robust sampling of extreme events under pre-industrial, current, and future climate conditions. The benefit of using SMILEs for the robust quantification of extreme-event metrics has been asserted in many studies for numerous types of extremes. For example, the added value of SMILEs for a better quantification of rare flood events (van der Wiel et al., 2019; Brunner et al., 2021; Kelder et al., 2022), the change in magnitude and frequency of precipitation extremes (Aalbers et al., 2018; Hodnebrog et al., 2019; Martel et al., 2020; Poschlod and Ludwig, 2021; Wood and Ludwig, 2020; Thompson et al., 2017), or droughts (Aalbers et al., 2023; Böhnisch et al., 2021; van der Wiel et al., 2022). SMILEs are also beneficial for studying changes in precipitation variability (e.g., Maher et al., 2021b; Pendergrass et al., 2017; Wood et al., 2021), the changes in the driving modes of climate variability (e.g., El Niño–Southern Oscillation (ENSO) or North Atlantic Oscillation (NAO); Maher et al., 2018; McKenna and Maycock, 2021), and the robust quantification of changes in weather patterns (Mittermeier et al., 2019, 2022). An overview of other applications using SMILEs can be found in Deser et al. (2020) and Maher et al. (2021a).
Here, the probability risk ratio framework from van der Wiel and Bintanja (2021) is used in regional large-ensemble climate simulations to partition the changes in extreme annual and seasonal precipitation events into contributions from changes in mean climate and climate variability. It is further analyzed here whether the contributions are influenced by the warming level, season, level of extremeness, or level of temporal aggregation (3–72 h).
2.1 Climate simulations
For this study, two sets of forcing experiments (ALL and PIC) using the Canadian Regional Climate Model version 5 (CRCM5) are presented. The ALL forcing experiment originates from the CRCM5 large ensemble (CRCM5-LE; Leduc et al., 2019). The CRCM5-LE is a regional 50-member initial-condition large ensemble, which was produced by dynamically downscaling the 50-member CanESM2 large ensemble (Canadian Earth System Model version 2 large ensemble; Fyfe et al., 2017; Kirchmeier-Young et al., 2017) with the regional climate model CRCM5 (v.3.3.3.1; Martynov et al., 2013; Šeparović et al., 2013) to the EURO-CORDEX 0.11∘ grid in a one-way nesting setup. All 50 members use combined anthropogenic (CO2 and non-CO2 greenhouse gases (GHGs), aerosols, and land cover) and natural (solar and volcanic influences) forcing (ALL forcings). Historical forcing is applied before 2006, and RCP8.5 (Meinshausen et al., 2011) is used for 2006 until 2100. The differences among the individual CRCM5 members are due to the macro- and micro-initialization in the driving CanESM2-LE and can be interpreted as natural climate variability.
For the PIC forcing experiment, the CRCM5 uses the CanESM2 pre-industrial control simulations (Arora et al., 2011) as its driving data. The pre-industrial simulations represent a climate state in 1850 without anthropogenic global warming at constant atmospheric CO2 levels of 284.7 ppm. From this 1000-year CanESM2 pre-industrial continuous simulation, 35 non-overlapping time slices of each 22-year period were selected and used as boundary conditions for the CRCM5, resulting in 35 pre-industrial control members. From each of the 35 CRCM5 members, the first 2 years were discarded as spinup, resulting in an ensemble of 700 years (35 members × 20 years). The CRCM5 setup used for this pre-industrial ensemble is identical to the setup used in Leduc et al. (2019) for the CRCM5-LE. Both CRCM5 experiments share the same model parameterization of deep convection (Kain and Fritsch, 1990) and shallow convection (Kuo, 1965; Bélair et al., 2005) providing hourly precipitation outputs. At a resolution of 0.11∘, a discrete modeling of convection is not possible and needs to be parameterized within the regional climate model.
The CRCM5-LE precipitation data was evaluated in various studies, showing a good representation of the timing of maximum annual precipitation (Wood and Ludwig, 2020), as well as good agreement for 10-year return levels of 3–24 h annual maxima with observations (Poschlod et al., 2021) over Europe. The CRCM5-LE is further capable of simulating synoptic weather patterns (i.e., Vb cyclones) that are relevant for long-lasting high-impact rainfall events triggering floods in the Alpine region (Mittermeier et al., 2019). Over eastern North America, the CRCM5-LE also yields a good representation of the annual and daily cycle (Innocenti et al., 2019). An analysis of the general biases of the CRCM5 setup can be found in Leduc et al. (2019). Future projections of the annual maximum precipitation in the CRCM5-LE over Europe show similar patterns and magnitudes to the 16-member EC-Earth-RACMO large ensemble (Aalbers et al., 2018; Wood and Ludwig, 2020). The CRCM5-LE also shows a comparable spread of internal variability to other regional SMILEs and a good agreement of interannual variability with observations (von Trentini et al., 2020). The good representation of interannual variability can also be attributed to the driving CanESM2-LE (Wood et al., 2021). The large-scale NAO teleconnections, which are relevant for the interannual to multi-annual variability over Europe, are properly propagated from the driving CanESM2-LE to the CRCM5-LE (Böhnisch et al., 2020). For CanESM2, statistically robust NAO patterns have been evaluated under current climate conditions (Böhnisch et al., 2020).
2.2 Methods
Here, the probability risk ratio framework from van der Wiel and Bintanja (2021) is used in regional large-ensemble climate simulations to partition the changes in extreme annual and seasonal precipitation events into contributions from changes in mean climate and climate variability. The basis for the analysis is annual (seasonal) maximum precipitation, which is defined as the maximum precipitation sum within a season (winter, DJF, or summer, JJA) and year. Precipitation sums are calculated with a rolling window of 3, 24, and 72 h accounting for partial overlaps with preceding or trailing seasons (years) to receive the absolute annual (seasonal) maximum precipitation. Annual (seasonal) maxima are calculated for each ensemble member and grid cell separately.
2.2.1 Event probability
The probability risk ratio is a widely used metric in attribution studies (Kirchmeier-Young et al., 2019a, b; Otto et al., 2018b; Swain et al., 2020) to analyze the change in event probability. It requires event probabilities from two different climate simulations (Fig. 1a), which are defined here as the number of annual (seasonal) maxima exceeding a local event threshold. The event threshold is valid for both simulations and is based on the PIC simulations calculated for each season separately. For the threshold definition, all 700 annual (seasonal) values are pooled and normalized by its mean (see Eq. 1):
where RXnorm is the normalized annual (seasonal) maximum precipitation, RXPIC is the mean annual (seasonal) maximum precipitation in the PIC simulation, and RXi is the value to be normalized. The normalization (Eq. 1) is valid for PIC and ALL simulations by replacing RXi with PIC and ALL values, respectively. A normalization is applied to receive a comparable threshold across the domain and season. Thresholds based on absolute values without a normalization can show high spatial and seasonal variability. After normalization, the standard deviation over all values is calculated and events exceeding 2 times (3 times) the standard deviation are considered for the event probability (Fig. 1a).
Calculations of the threshold and event probabilities are performed for each grid cell separately. To ensure the same sample size in the PIC and ALL simulations, 35 random members have been picked from the full 50-member ALL simulations. The random sampling without replacement has no effect on the results, and different sets of random samples will produce only very small marginal differences.
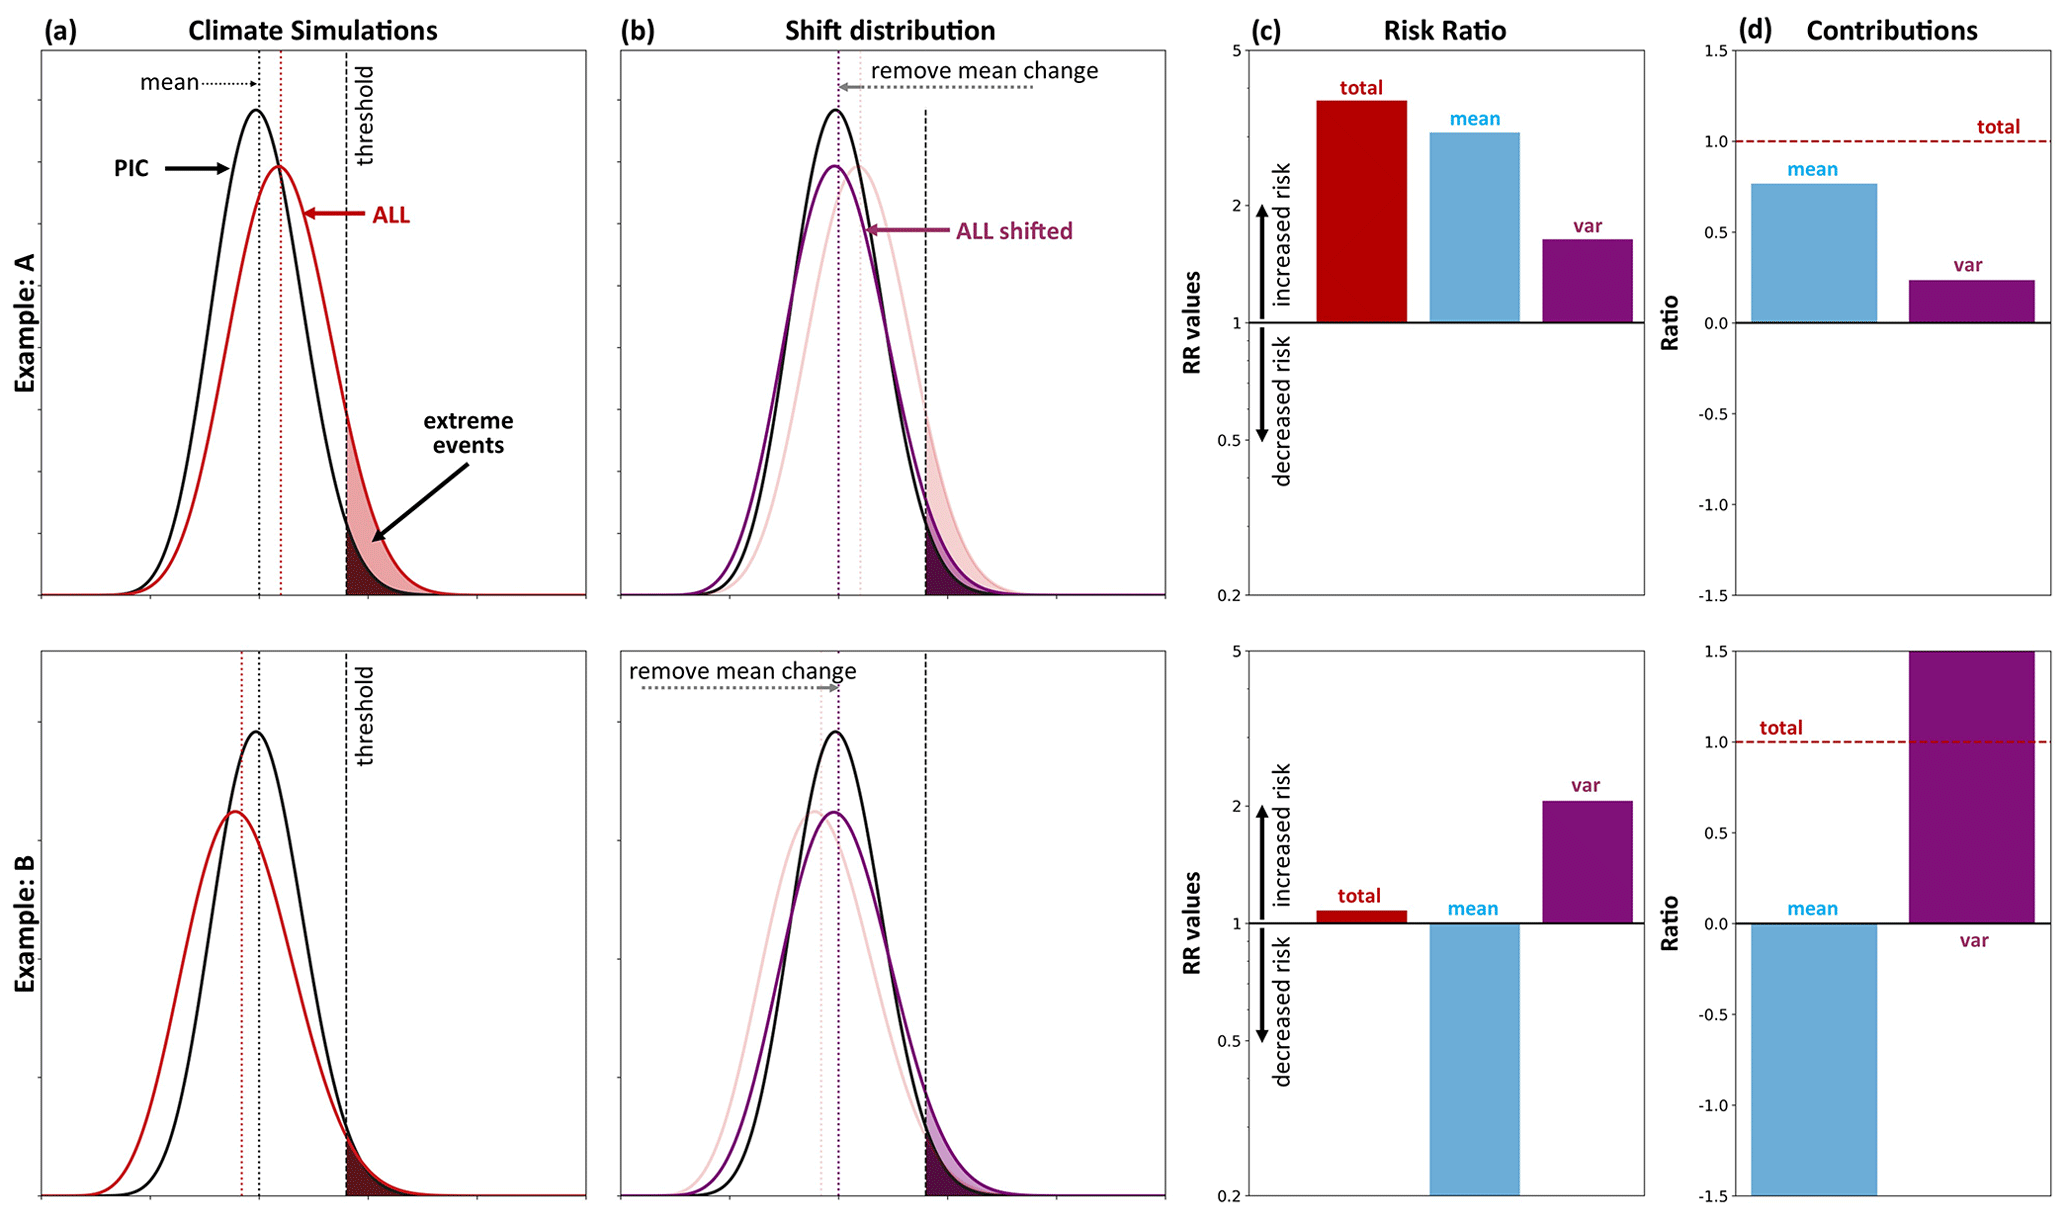
Figure 1Schematic of the probability risk ratio framework for separating contributions from mean and variability (adapted from van der Wiel and Bintanja, 2021). Two examples are given. In example A both mean and variability contribute to an increase in event probability. Example B shows contrasting contributions from mean and variability. Panel (a) shows two different climate simulations (PIC and ALL) for which the PRtotal is calculated based on the number of events exceeding the threshold in both distributions. In panel (b) any change in the mean is removed by shifting the ALL distribution to match the mean in the PIC distributions, and the shifted ALL simulation is then used to determine the PRvar based on the events exceeding the threshold. In panel (c) the PRmean can be determined from an adapted probability risk ratio relationship, giving the PR values for PRtotal, PRmean, and PRvar. In panel (d) the ratio of contribution is determined from the individual contributions from PRmean and PRvar to the PRtotal, which sum up to 1. For more details, see Sect. 2.2.
2.2.2 Probability risk ratios
To assess the change in event probability, the framework of the probability risk ratio is applied. The conventional risk ratio as used in many attribution studies is calculated as follows:
with PR=1 indicating no change in extreme-event probability, PR > 1 indicating an increase in event probability, and PR < 1 indicating a decrease in probability. Here, the event probabilities (PALL, PPIC) are given as the number of extreme events in the ALL and PIC dataset and as described above. The conventional risk ratio framework is extended, as proposed by van der Wiel and Bintanja (2021), to separate the contributions from changes in the mean and changes in variability. The PRTotal is calculated in the classical way by following Eq. (3). The PRTotal includes the contributions from a change in both the mean and variability and therefore concludes the total change. To quantify the role of a change in variability (widening of the distribution), the influence of any change in the mean is first removed by shifting the entire distribution of ALL to match the mean of PIC (Fig. 1b). The shifting is achieved by subtracting the difference in the mean of ALL and PIC. The shifting of the distribution is done prior to the normalization of the ALL precipitation values (i.e., Eq. 1). The number of extreme events is determined in the new distribution and used to calculate the risk ratio PRvar, representing the change in event occurrence due to the change in variability. From the two risk ratios PRTotal and PRvar, the risk ratio for PRmean can be calculated following the new risk ratio relationship:
In this relationship subtracting by 1 is necessary because the reference PR value is 1 (no change). The PR values should be evaluated on a logarithmic scale, where PR of 2 and PR of 0.5 indicate a similar change in magnitude (Fig. 1c).
2.2.3 Contributions from mean and variability
To quantify the relative contributions attributable to the change in the mean (PRmean) and change in variability (PRvar) to the total risk change (PRTotal), a simple ratio of contribution is calculated as proposed by van der Wiel and Bintanja (2021):
which is equivalent for variability (Cvar) by replacing PRmean with PRvar. The two contributions Cmean and Cvar sum up to 1. Thereby, either they can result in the same sign, which means that both mean and variability contribute to an increase (decrease) in the risk ratio (see Example A in Fig. 1d), or they can have opposite signs showing opposing contributions (see Example B in Fig. 1d). For the regional analysis the probability risk ratios (total, mean, and var) are averaged across grid cells falling within the region boundaries (inclusion is based on cell center points) before the ratio of contribution is calculated based on the regionally averaged PR values. Region boundaries are based on the PRUDENCE subregions for Europe (Christensen and Christensen, 2007).
2.2.4 Warming levels
Lastly, the risk ratios and their contributions are analyzed for different global warming levels. The global warming levels are calculated from the driving CanESM2-LE dataset with a rolling window of 20 years with the pi-Control CanESM2 simulation as the reference. The ensemble mean of global mean temperature changes is used to identify the 20-year periods closest to 1, 2, 3, and 4 ∘C warming levels. Thereby, the 1 ∘C warming level is considered the current climate.
3.1 Probability risk ratio and ratio of contribution in annual extremes
3.1.1 Current climate
Compared to a stable pre-industrial climate, the present-day climate (+1 ∘C) in the CRCM5-LE shows a widespread increase in the mean 3-hourly annual maximum (AX3h) precipitation by 4.6 % K−1 over land (Fig. 2a). The regionally averaged scaling rates differ between 3.6 % K−1 and 5.9 % K−1 among the different subregions. The standard deviation (i.e., variability) of the AX3h has increased by 8.9 % K−1 over all land areas within the same time (Fig. 2b). The increase in variability is larger than the change in the mean AX3h in all subregions. The total probability risk ratio (PRtotal) of AX3h events larger than 2σ has also increased slightly by 1.36 averaged over all land areas (Figs. 2e, 4). This total change is influenced by the change in both the mean and variability. When the probability risk ratio is calculated based on the mean and variability separately, then slightly higher risk ratios can be seen for the PRvar (1.2) than for PRmean (1.16) (Fig. 2c–d). The individual ratios of contribution for mean and variability to the total risk ratio show that the increase in the PRtotal can to a large extent be attributed to a change in variability (0.55 when averaged over all land area) and to a slightly lesser extent to a change in the mean (0.45) (Figs. 2f–g, 5). Within all subregions the contribution from variability varies between 0.48 and 0.63. There is no obvious spatial pattern visible for the risk ratio or the ratio of contributions.
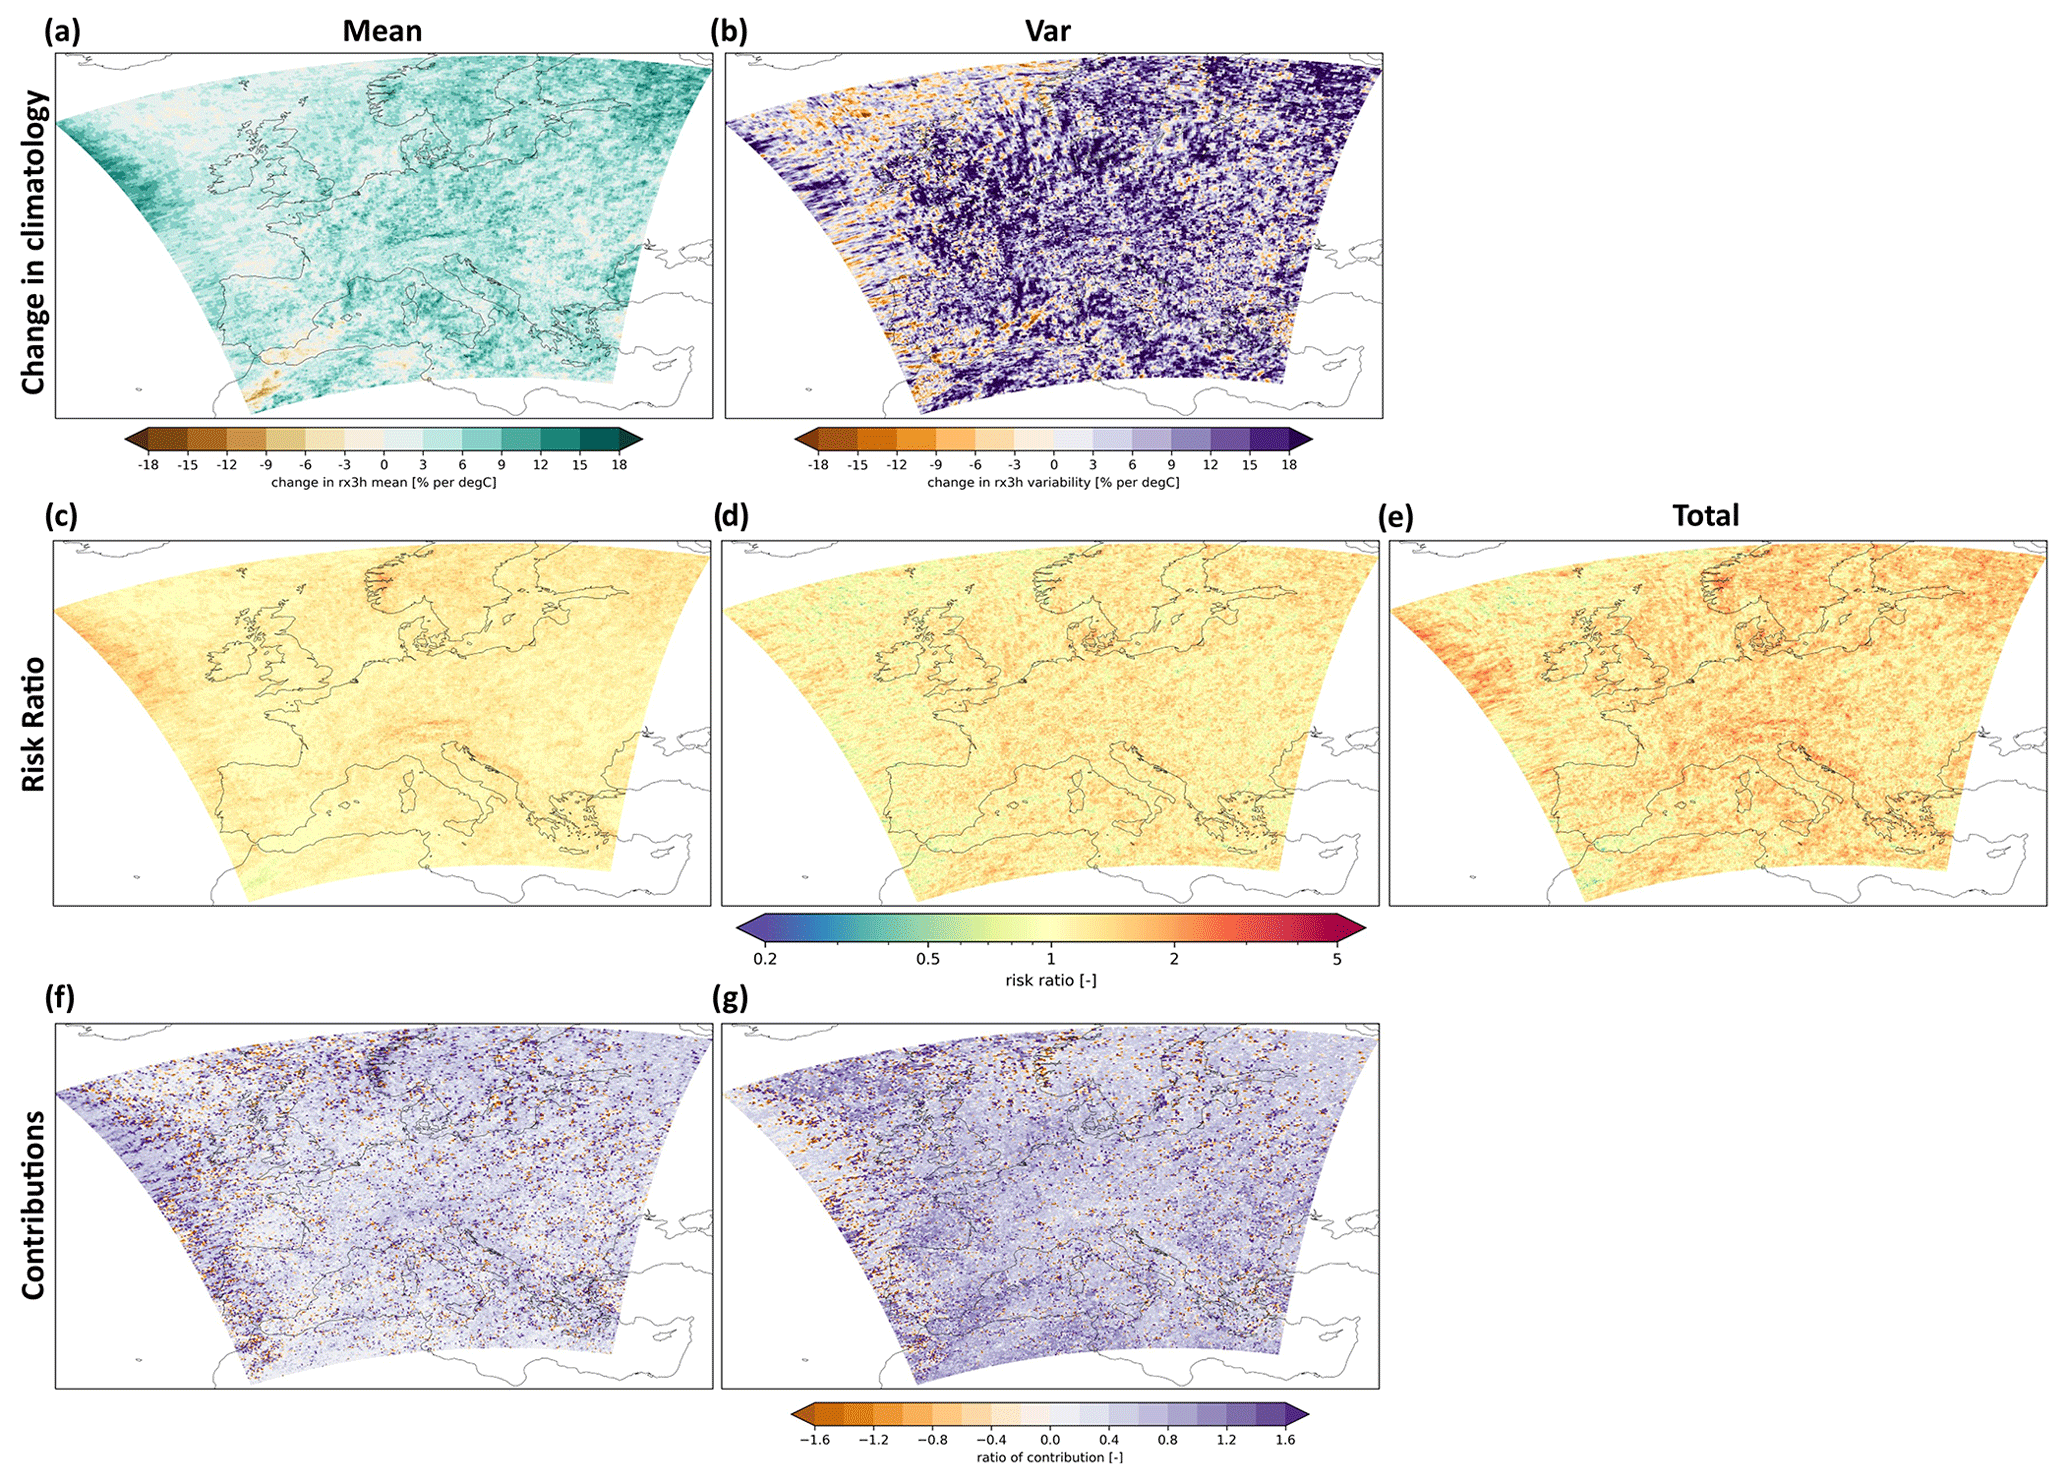
Figure 2Changes in the current climate (+1 ∘C) compared to a stable pre-industrial climate in the CRCM5-LE simulations. (a) Change in the mean annual rx3h. (b) Change in the variability (i.e., standard deviation of annual rx3h). (c) PRmean, (d) PRvar, and (e) PRtotal values for 2σ events. (f) Ratio of contribution for changes in the mean. (g) Ratio of contribution for changes in variability.
Other studies show that the observational records reveal an increased risk of extreme precipitation, at least when taking the change in mean extremes as a proxy (Westra et al., 2013, 2014; Donat et al., 2016; Sippel et al., 2017). This in parts fits the trend seen in the CRCM5-LE, since the mean contributes to roughly 0.45 to the increase in extreme events. Although trends in single realizations (i.e., observations) could be underestimated since changes in variability are difficult to quantify from the limited sample size, studies from the detection and attribution community show that climate change is now detectable in everyday weather events (Sippel et al., 2020) and that recent extreme events over Europe have been amplified by climate change (Kreienkamp et al., 2021; Otto et al., 2018a), which makes the results from the CRCM5-LE seem plausible.
3.1.2 Future climates
In a 2 ∘C warmer world, the probability risk ratio continues to increase to 1.77, showing a doubling of 2σ extreme events in roughly 29 % of the land area (Fig. 3a). The strongest increases in the total risk ratio can be seen in the Scandinavian region with an average increase in the PRtotal of 2.1 with roughly 56 % of grid cells showing a doubling of events. By looking at a change in mean or variability alone, a considerably smaller percentage of land area would show a doubling of extreme events in Scandinavia (mean: 13 %; var: 6.3 %) and over all land areas (mean: 4 %; var: 3.5 %). This emphasizes the joint role that changes in mean and variability have for shaping the total change in extremes. Both the Scandinavian region and the Alps are clearly visible in the PRmean maps, while the PRvar maps show a more widespread increase in the risk ratio throughout the entire domain (Fig. 3b–c).
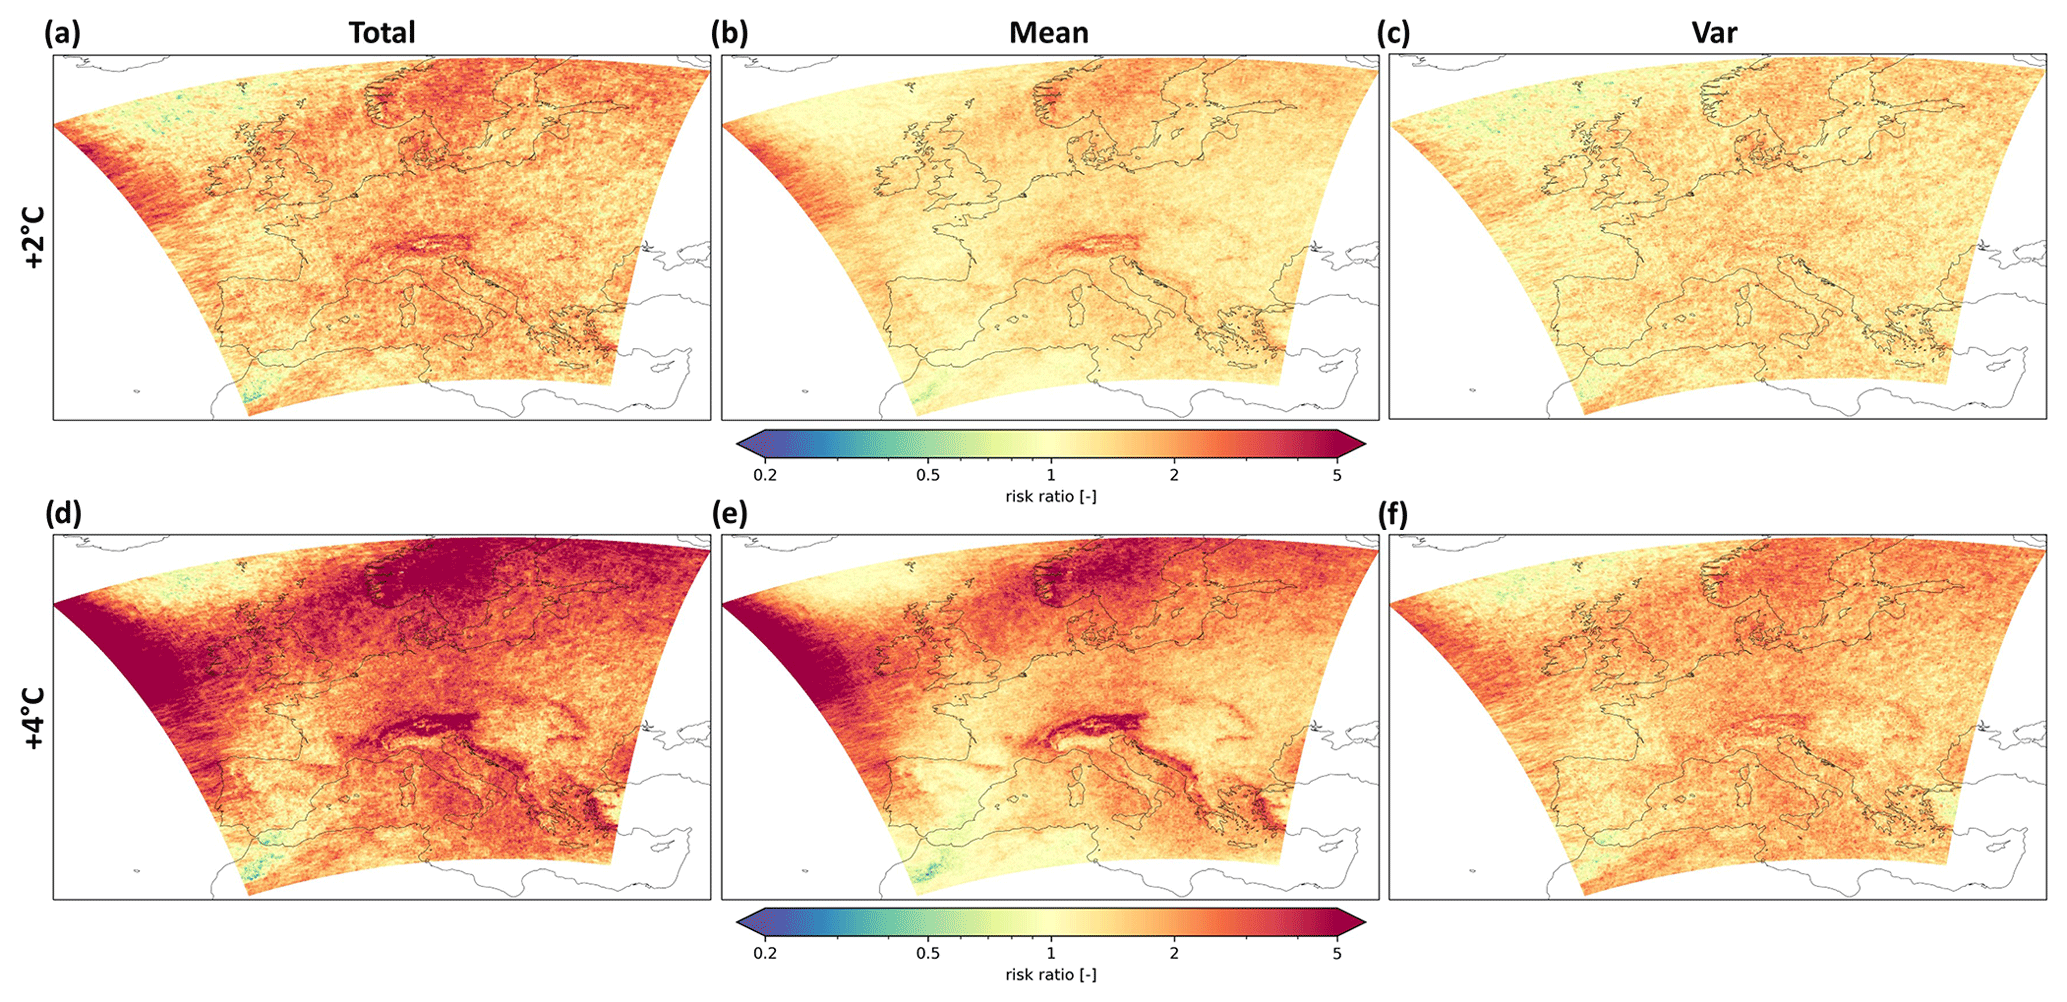
Figure 3Probability risk ratios for annual rx3h for extreme events larger than 2σ in a 2 and 4 ∘C warmer world: (a, d) PRtotal, (b, e) PRmean, and (c, f) PRvar. Panels (a)–(c) show +2 ∘C climate, and panels (d)–(f) show +4 ∘C climate. All probabilities are relative to the pre-industrial climate.
In a 4 ∘C warmer world, the risk of 2σ extreme events becomes more likely, with roughly 69 % of land grid cells showing at least a doubling of events with an average increase in PRtotal of 2.7 (Fig. 3d–f). While the PRvar is generally still increasing in a more widespread manner, the PRmean shows a more contrasting picture, with regions such as the Alps and Scandinavia showing a very large increase in PR values, while other regions show PR values closer to 1 (i.e., no change), such as parts of the Iberian Peninsula or France. Figure 4 shows the regional average PR values (total, mean, and var) for all PRUDENCE subregions at different warming levels and reveals that in most regions the PRmean and PRvar develop similar. In central Europe, eastern Europe, and the Mediterranean, the PRmean and PRvar develop very similarly and show almost identical PR values. Over the British Isles, the PRmean starts to increase more steeply towards the 4 ∘C warming level, diverging from the PRvar, which shows a continued increase but at a lower level. In Scandinavia and the Alps, where the change in the PRtotal is most pronounced, the PRmean diverges already at +2 ∘C from the PRvar and increases at considerably higher rates. Over France and the Iberian Peninsula, where overall PRtotal values are lower than in other regions, the PRvar remains slightly above the increase in PRmean throughout all warming levels. In all subdomains the probability of more extremes increases regardless of whether this is driven by a change in the mean or variability.
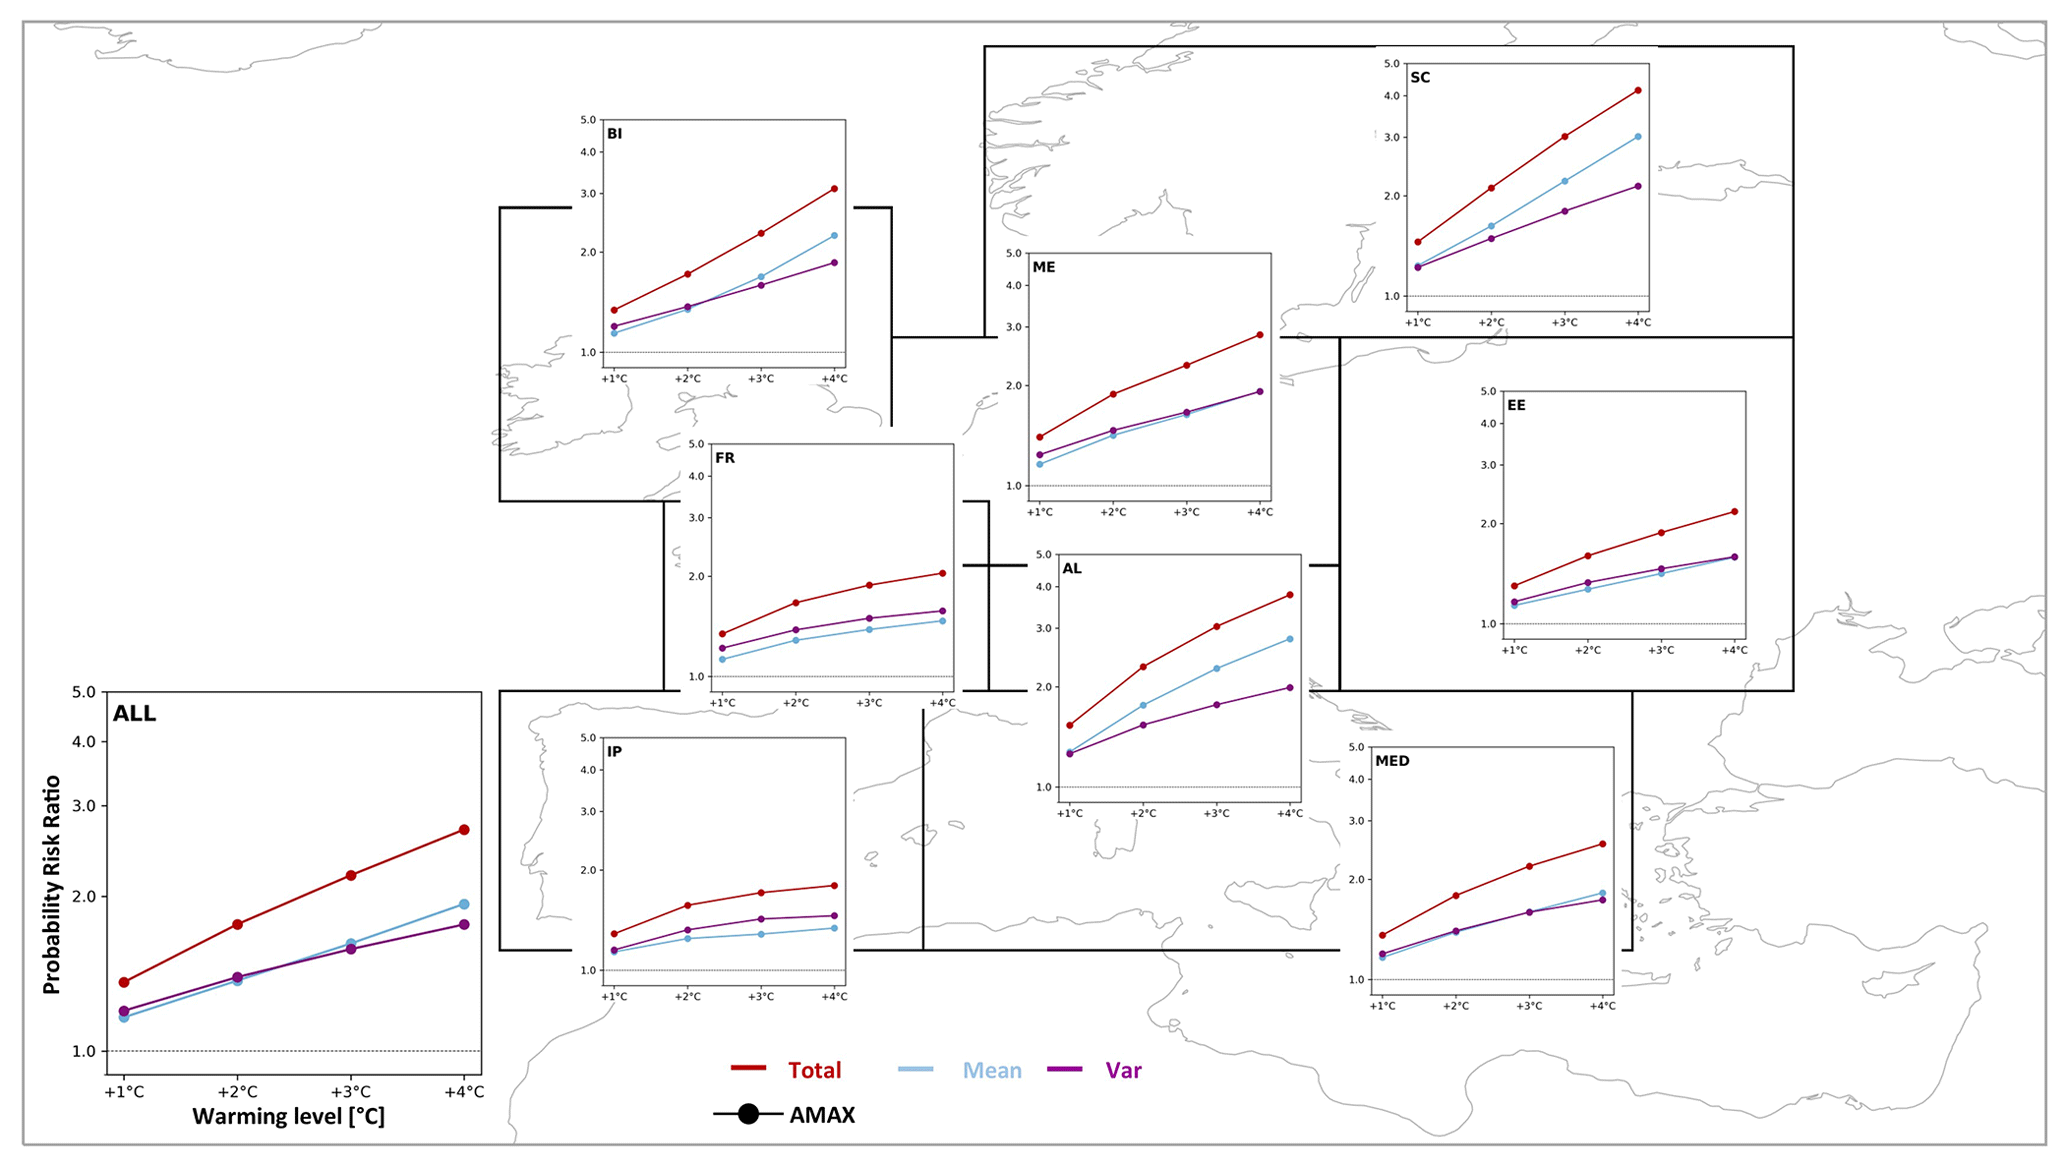
Figure 4Regional averaged PR values (total, mean, and var) for the PRUDENCE regions at different warming levels for annual rx3h (AMAX) events larger than 2σ. PRtotal (red), PRmean (blue), and PRvar (purple) values (y axis) at warming levels (+1, +2, +3, +4 ∘C) (x axis). The lower-left panel (ALL) shows the aggregation over all land grid cells and shows axis labels that apply for all panels.
In Fig. 5, the individual contributions from PRmean and PRvar to the total change (PRtotal) are shown for the subregions. Generalized over all land areas, the contributions reveal that the change in variability contributes slightly more (approx. 0.55) in the current climate (+1 ∘C), and the contributions steadily reduce to approx. 0.45 in the 4 ∘C warmer world. This means the contributions from mean and variability develop diagonally from each other with the mean gaining in importance. On the regional scale, however, there are distinct differences among the regions. The British Isles show a similar development to the domain average, but it is slightly more pronounced, with the variability contributing 0.58 in the current climate and 0.41 at +4 ∘C. In the Mediterranean this is less pronounced, and both contribute close to equally in the current and future climates. In central and eastern Europe, the contributions from variability and mean converge with continued warming. In the current climate the variability has a higher contribution. Over eastern Europe the convergence takes slightly longer than over central Europe where both (mean and variability) contribute equally from a +2 ∘C climate onwards. In France, both contributions tend to converge; however, the contributions from variability remain higher than the mean (0.55–0.63). In contrast, over Scandinavia and the Alps the contributions are approximately equal at current levels and diverge throughout the future warming with the mean gaining in importance (0.64 in both regions). Over the Iberian Peninsula the variability gains in importance towards a +3 ∘C world (0.6) and slightly converges towards the end but remains higher than the mean. Generally, at smaller warming levels where the PRtotal values are small the differences in the ratio of contributions might be slightly exaggerated (e.g., over central Europe, the British Isles, or France) because small absolute differences between PRmean and PRvar seem larger in the relative context.
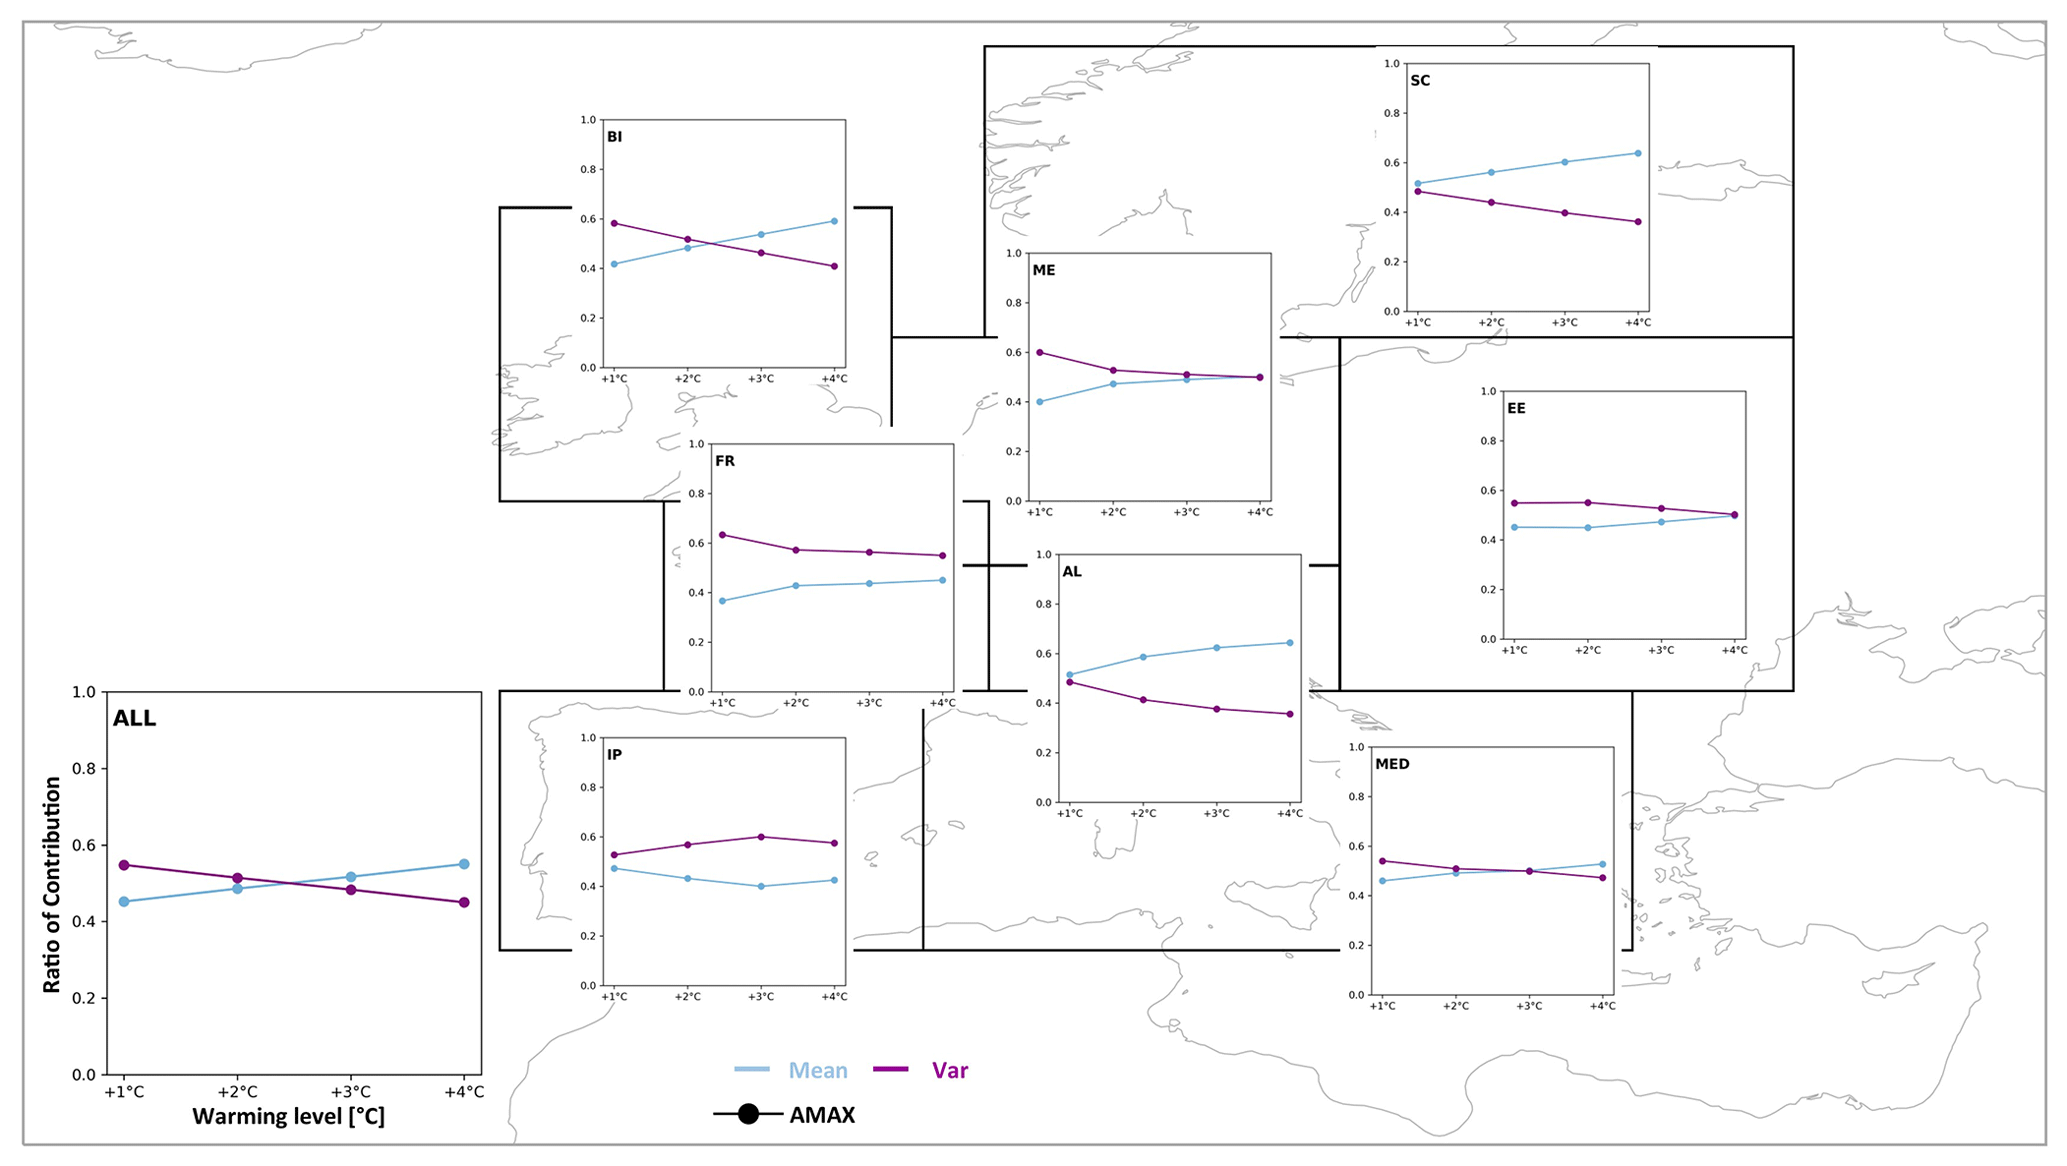
Figure 5Individual contributions from PRmean and PRvar to the PRtotal in the different PRUDENCE regions at different warming levels. Ratio of contributions from PR values in Fig. 4. Contribution from the mean are shown in blue, and contributions from variability are shown in purple. Ratio of contribution is on the y axis, and different warming levels are on the x axis. The warming levels are +1, +2, +3, +4 ∘C. The lower-left panel (ALL) shows the aggregation over all land grid cells and shows axis labels that apply for all panels.
3.2 Extremes on seasonal scales
3.2.1 Probability risk ratios
Looking at the seasonal scale, which can be relevant for decision-makers, the patterns reveal some interesting and diverse characteristics. Figure 6 shows maps of the probability risk ratios (PRtotal, PRmean, and PRvar) in the +4 ∘C world for the two seasons of winter (DJF) and summer (JJA) in comparison to the annual scale (as seen in Fig. 3). The two seasons have been chosen since they show a strong seasonal contrast in the forced response of mean seasonal maximum precipitation and seasonal total precipitation amounts (Wood and Ludwig, 2020; Christensen et al., 2019; Matte et al., 2019; Rajczak et al., 2013).
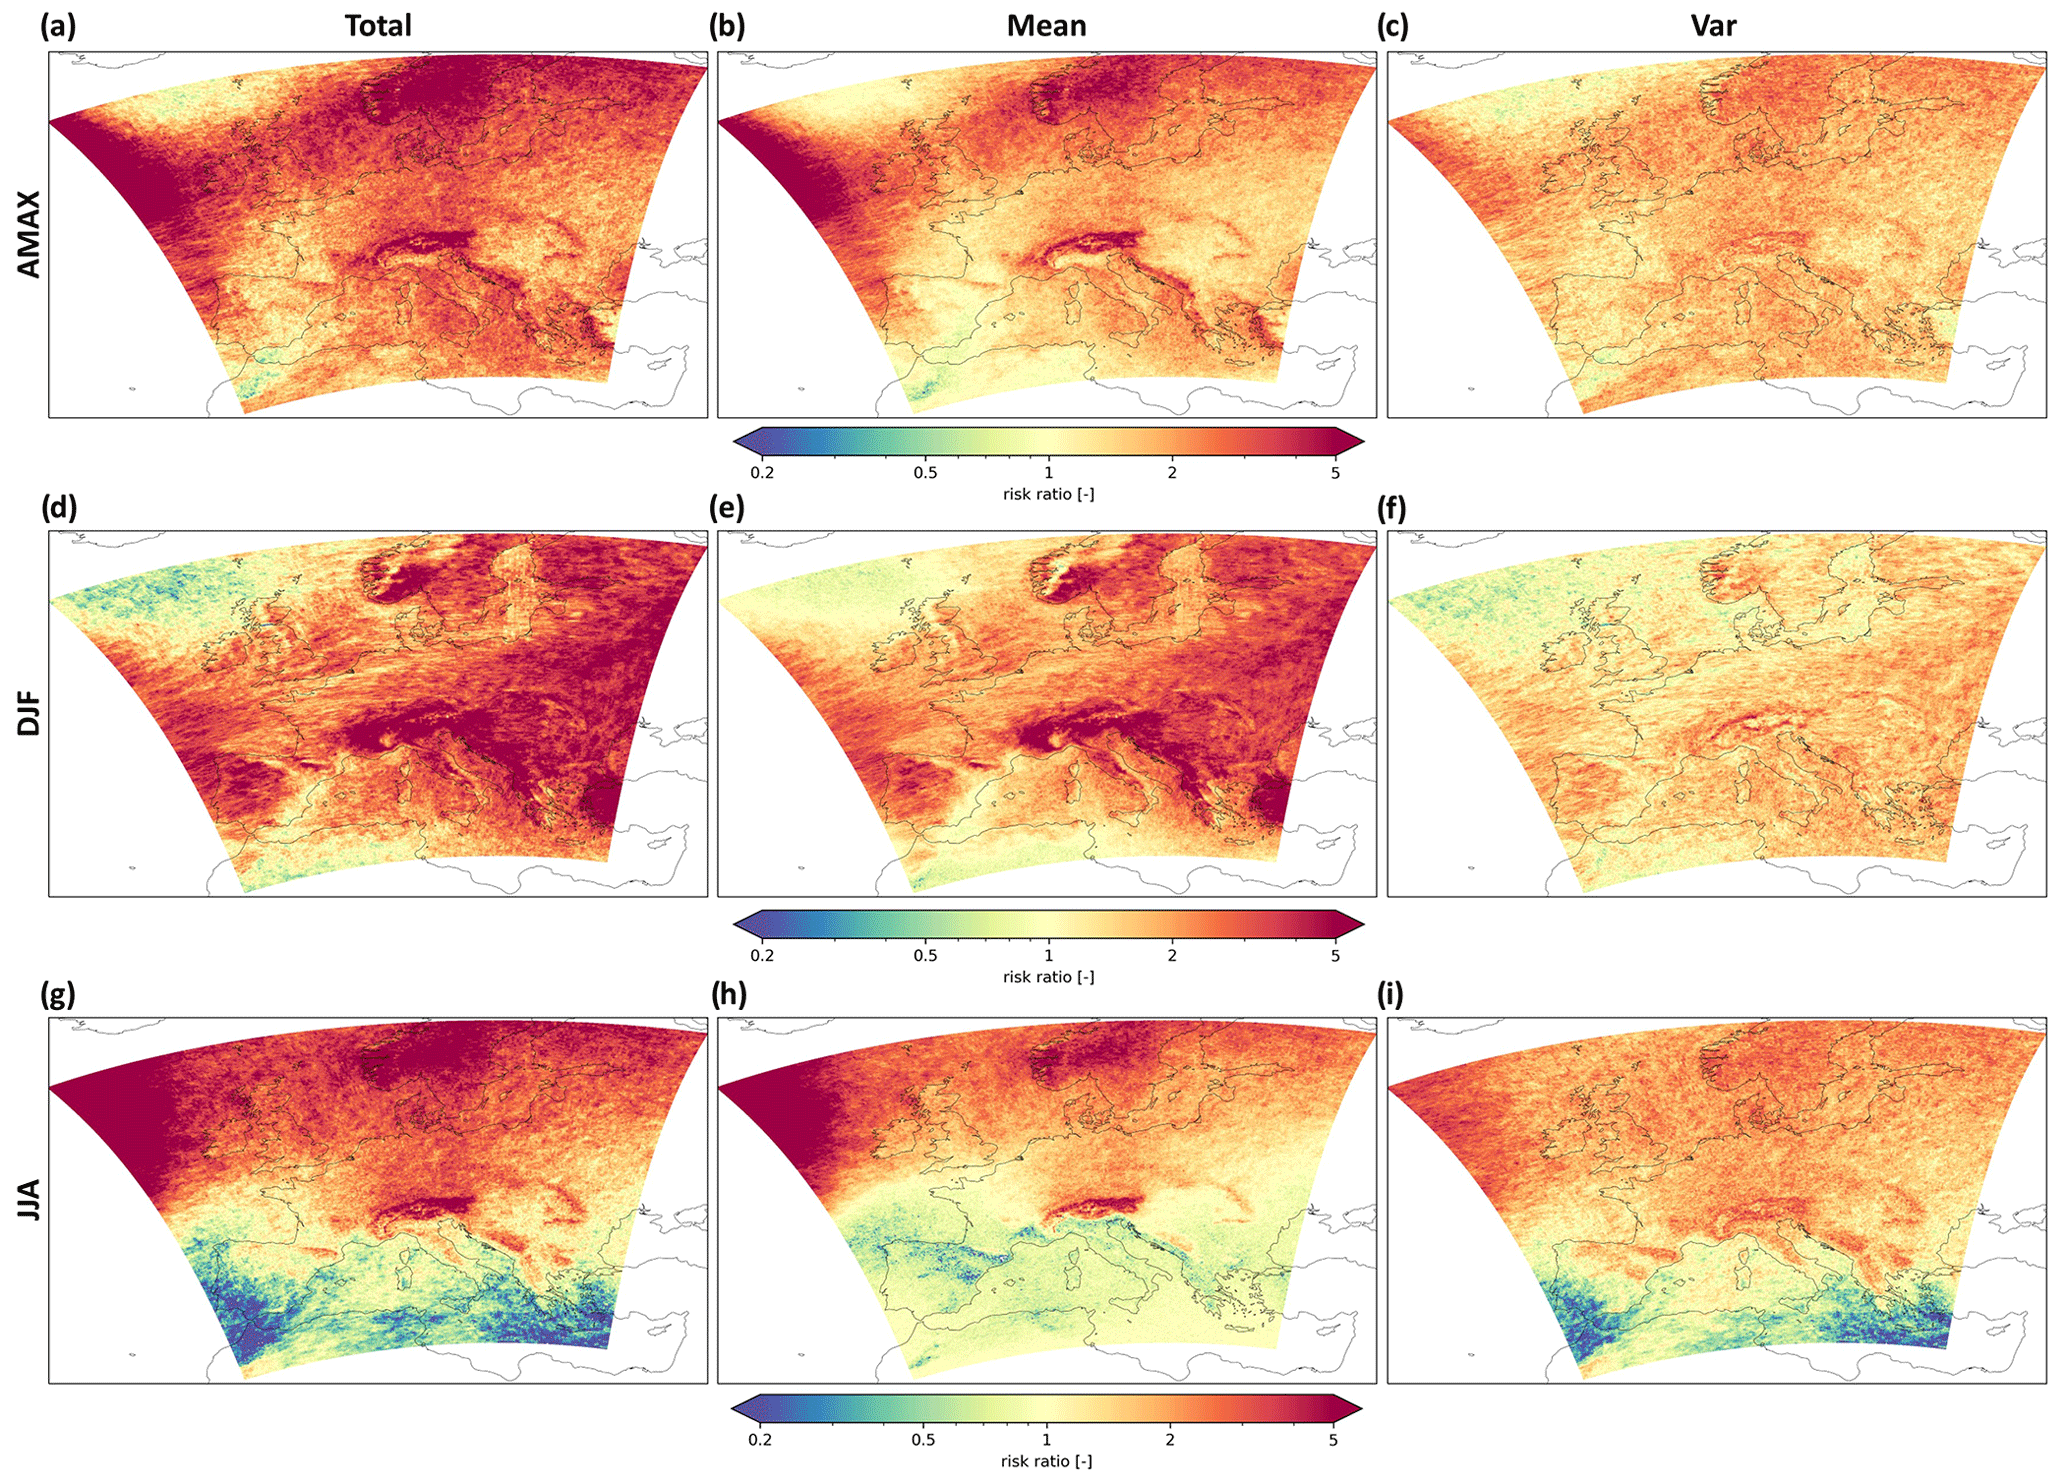
Figure 6Annual probability risk ratios of rx3h events compared to seasonal DJF and JJA PR values at 4 ∘C warming: (a–c) annual PR values, (d–f) DJF PR values, (g–i) JJA PR values, (a, d, g) PRtotal, (b, e, h) PRmean, and (c, f, i) PRvar.
In winter the increase in total risk ratio is in many parts of the domain larger than on the annual scales. Over eastern Europe, the greater Alps region, the Balkan region, and the Iberian Peninsula, more intense and widespread increases can be seen compared to the annual scale. In winter the contrast between PRmean and PRvar is also more pronounced, with the mean projecting a higher probability of extremes. While the winter shows large widespread increases, in summer more grid cells emerge that show a decrease, no change, or only a marginal increase in the PRtotal. In general, the pattern of PRtotal follows the expected north–south gradient with increases in the north and decreases in the south. However, despite the summerly decrease in PRmean over France, Italy, eastern Europe, the Balkans, and the Pyrenees, which clearly follows the decrease in the mean JJAx3h (see Fig. S1 in the Supplement), the PRtotal is still increasing in parts of these regions. This means that the number of extremes is increasing even though the mean is decreasing and would project a decline in extremes. Here, the decline in the risk ratio is compensated for by the change in variability, which shows the opposite change and an increase in the PRvar in these areas. This clearly highlights that the mean change is not always a sufficient proxy for the change in the probability of extremes. A widespread decline in the mean summerly average extremes is projected, especially over the Mediterranean and the Iberian Peninsula; however, due to the change in the variability, the probability of summerly extremes greater than 2σ remains and can even increase locally. Other clearly visible features in summer are the Alps and Scandinavia, which are also apparent features in winter and on the annual scale.
Through the regional aggregation some generalized statements can be formulated. Aggregated over all land areas, the PRtotal increase is strongest in DJF (3.34) compared to the annual scale (AMAX) (2.7) and lowest in JJA (2.06) at 4 ∘C warming (Fig. 7). Generally, this can also be shown for France (DJF: 2.8; AMAX: 2.04; JJA: 1.6), the Alps (DJF: 5.6; AMAX: 3.78; JJA: 3), and eastern Europe (DJF: 4.18; AMAX: 2.17; JJA: 1.6). In these regions the PRtotal increases for the two seasons and the annual values. In addition, the Iberian Peninsula and the Mediterranean show the same order of strongest to lowest increases but with the unique characteristic that in JJA the PRtotal is decreasing in the Iberian Peninsula (0.71) and declining towards no change in the Mediterranean.
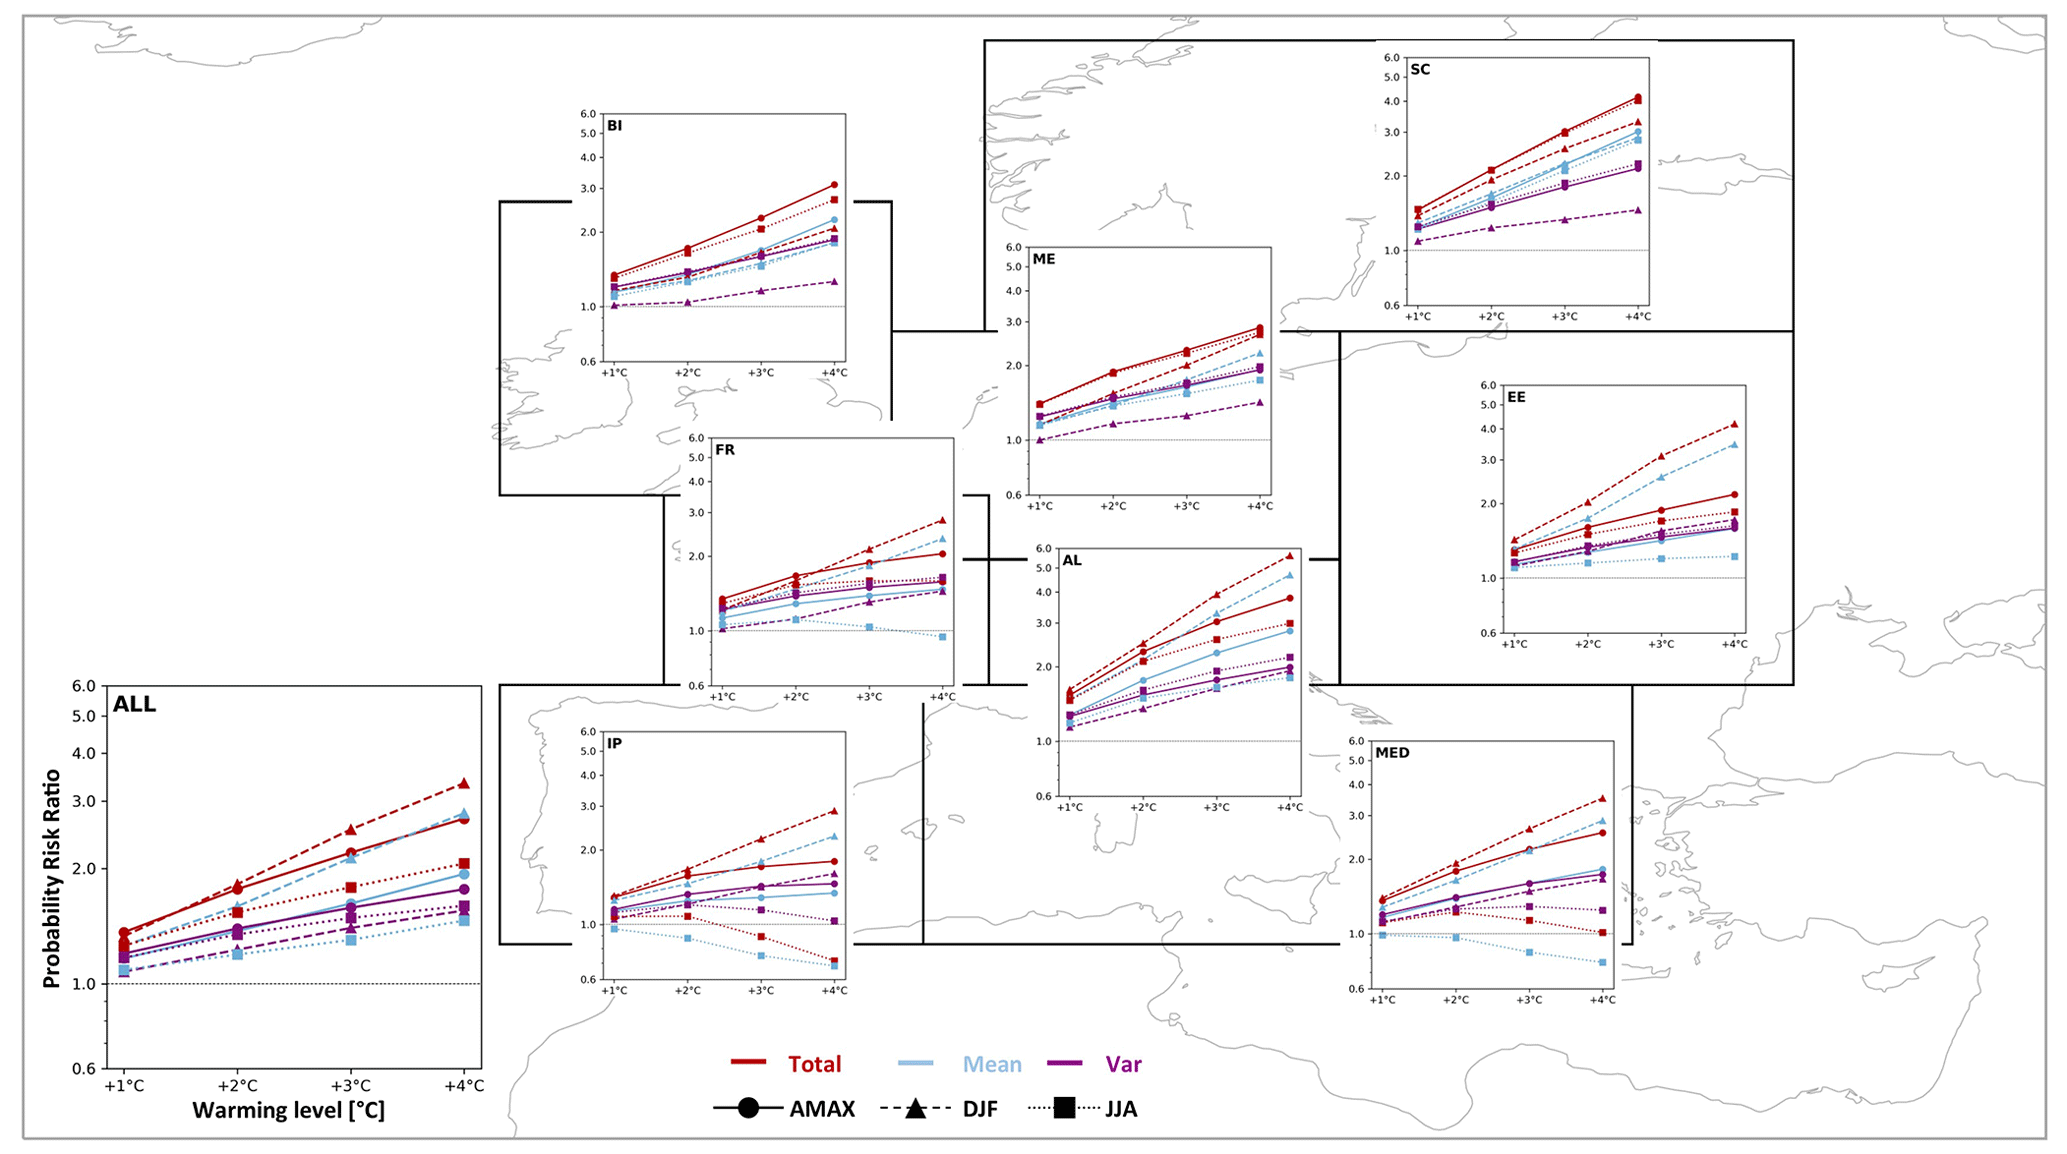
Figure 7Comparison of regional averaged annual and seasonal PR values (total, mean, and var) at different warming levels. The panels show PRtotal (red), PRmean (blue), and PRvar (purple) values (y axis) at warming levels of +1, +2, +3, +4 ∘C (x axis). The solid lines with the circle marker represent annual PR values (AMAX, the same as in Fig. 4); the dashed lines with the triangle marker represent PR values in winter (DJF); and the dotted lines with the square marker represent PR values in summer (JJA). The lower-left panel (ALL) shows the aggregation over all land grid cells and shows axis labels that apply for all panels.
A different order can be seen over Scandinavia and central Europe where the PRtotal in JJA and the annual scale are basically identical in their progression with warming. In Scandinavia, the PRtotal in DJF remains below JJA and the annual values for all warming levels. In central Europe, values for JJA remain below DJF and the annual values until the +4 ∘C world where all three values converge to approx. 2.7–2.8 (PRtotal). In the British Isles, the PRtotal is largest on the annual scale, closely followed by JJA, and shows a weaker increase in winter.
Generally, when comparing the evolution of PRmean and PRvar it can be stated that in summer the PRvar is above the PRmean, while in winter this relationship is reversed. The exception is in Scandinavia, where PRmean is always larger than PRvar. On annual scales, both the PRmean and PRvar are generally quite similar, except for in the Alps and Scandinavia, where PRmean is considerably larger than PRvar.
3.2.2 Ratio of contribution from mean and variability
In Fig. 8, the ratios of contribution for JJA, DJF, and the annual scale are compared. All regions, except for Scandinavia show the general behavior that the variability contributes to a large extent to the change in extremes in summer, while in winter this relation is reversed (i.e., mean > var). Aggregated over all land areas, the variability contributes to 0.56–0.66 of the change in summer while the mean only contributes to 0.34–0.44 of the change. In winter, the contribution of the variability only contributes to roughly a quarter (0.23–0.28) while the mean dominates the change in probability by roughly three-quarters (0.72–0.78). In comparison on the annual scale, either the mean or variability contribute closer to equal amounts (0.45–0.55).
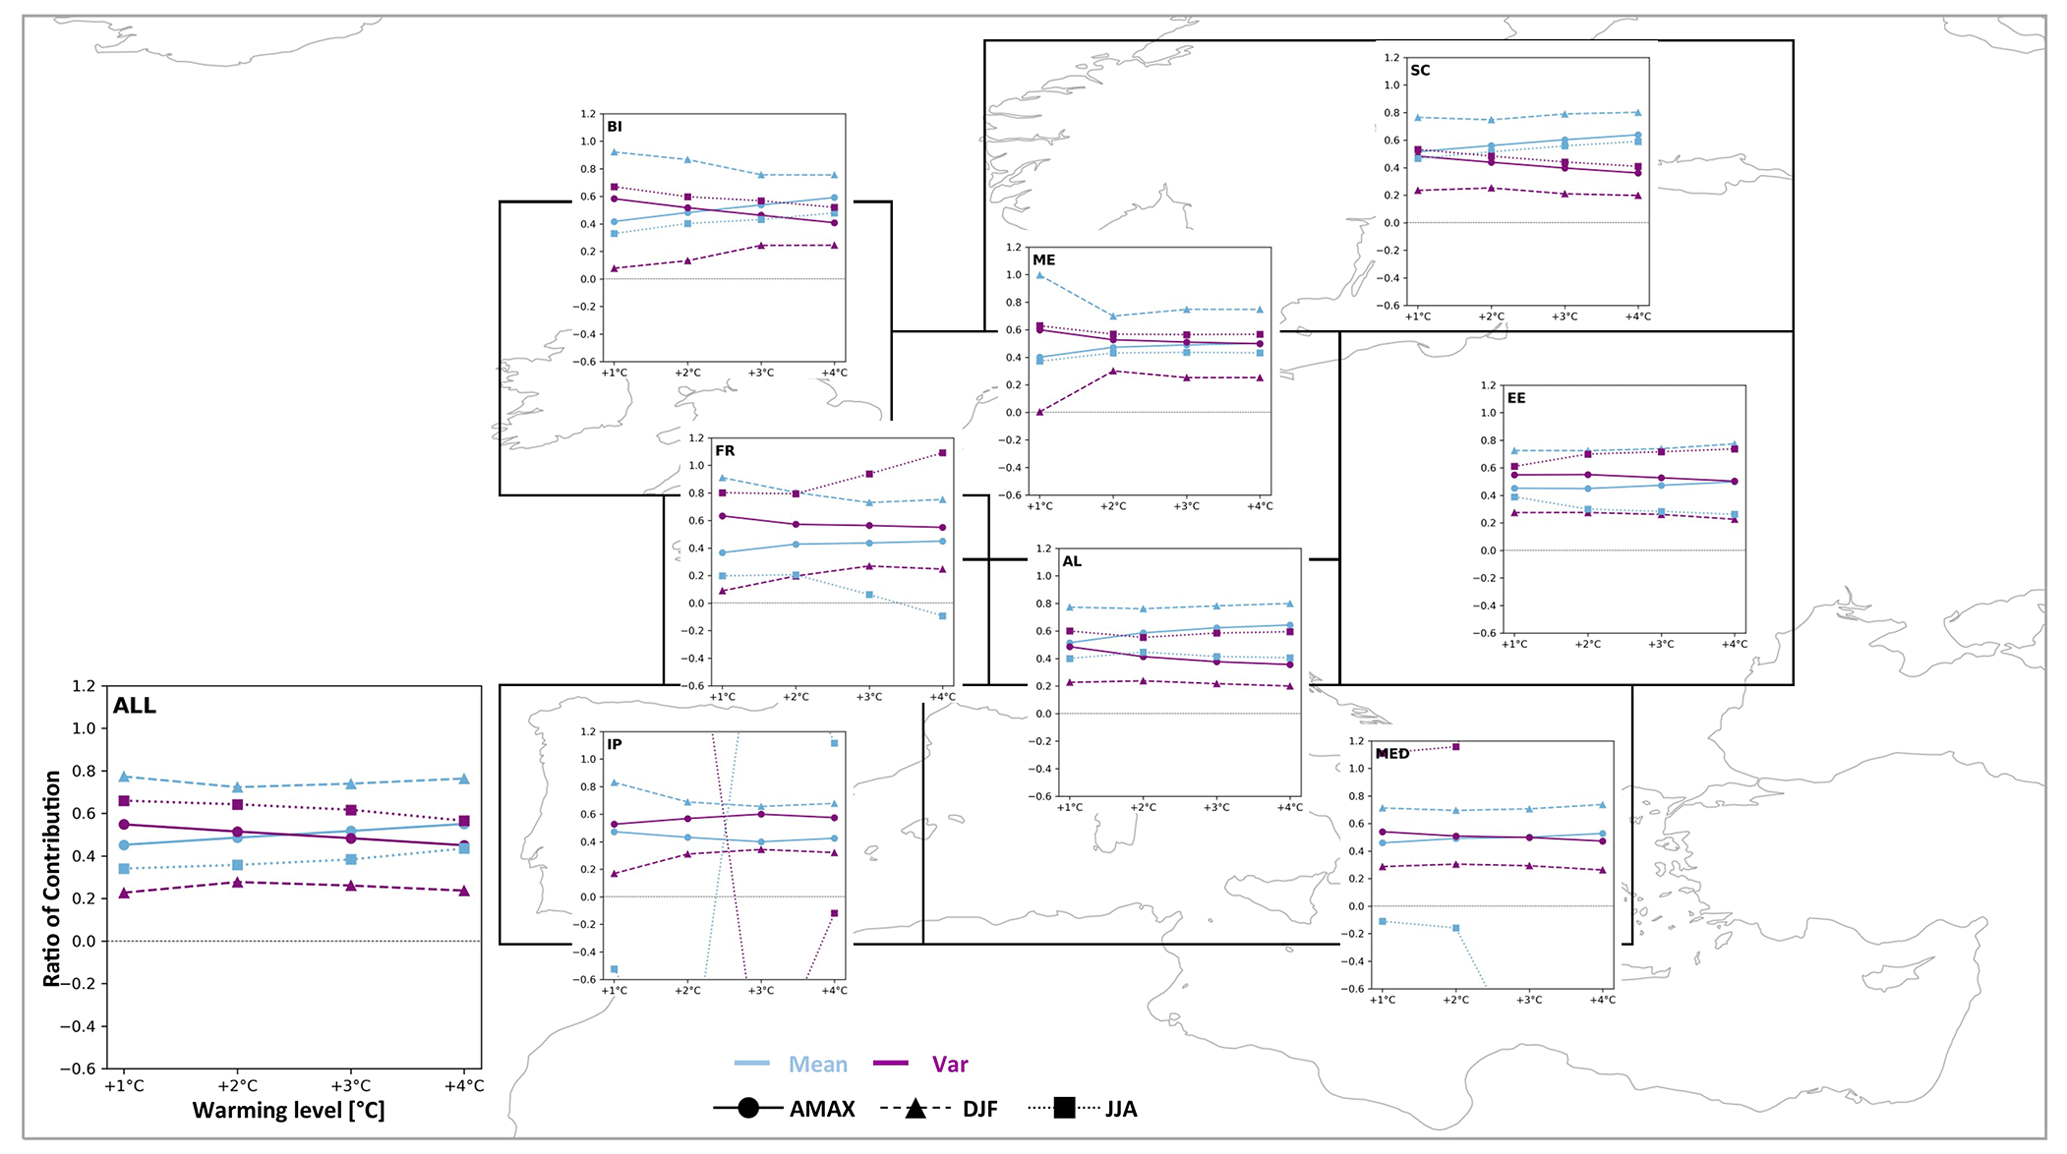
Figure 8Comparison of individual contributions of annual and seasonal PRmean and PRvar to the PRtotal at different warming levels. Ratio of contributions from PR values in Fig. 7. Contribution from the mean are shown in blue, and contributions from variability are shown in purple. Ratio of contribution is shown on the y axis, with different warming levels shown on the x axis (+1, +2, +3, +4 ∘C). The solid lines with the circle marker represent annual ratio of contributions (AMAX, the same as in Fig. 5); the dashed lines with the triangle marker represent ratios in winter (DJF); and the dotted lines with the square marker represent ratios in summer (JJA). The lower-left panel (ALL) shows the aggregation over all land grid cells and shows axis labels that apply for all panels.
Over the British Isles, the change in variability initially contributes to 0.7 (mean: 0.3) of the current change in the probability of summerly extremes before the contribution of both variability and mean converge to roughly equal contributions in a +4 ∘C world. In winter, the mean initially contributes to most of the change with roughly 0.9 (var: 0.1) and slowly reduces to 0.76 (var: 0.24).
Over the Alps, the ratios of contribution are very stable across all warming levels within their respective season. In summer, the variability contributes to a higher degree with roughly 0.6 compared to 0.4 from the mean. In winter, the change in probability is dominated by the change in the mean contributing by 0.8 (var: 0.2).
In Scandinavia the ratio of contribution remains very stable across the warming levels in winter, with the mean contributing by roughly 0.8 to the overall change (var: 0.2). In summer, both the mean and variability initially contribute almost equally to the change and diverge to roughly 0.6, which is attributable to the change in the mean compared to 0.4 by the variability.
Over eastern Europe, the variability contributes roughly to 0.6 (mean: 0.4) of the current change in summer and increases to 0.7 (mean: 0.3) in future climates. In winter, the contributions are stable across warming levels and the mean contributes to roughly 0.75 (var: 0.25) of the change.
Over central Europe, the difference in contributions between mean and variability is initially larger, and they slightly converge in a warmer climate. In summer, the variability contributes to 0.63 (mean: 0.37) of the total change before the two contributions converge slightly. In winter, the current change is predominantly driven by the change in the mean (close to 1.0) before the variability slightly gains in importance with roughly 0.25 (mean: 0.75) in warmer climates.
Over France, the ratios of contribution experience considerable changes throughout the different warming levels and seasons. In winter, the mean contributes by 0.9 to the current change before reducing slightly to 0.75. At the same time, contributions from variability increase from 0.1 to 0.25. In summer, the variability is the main driver of change, with 0.8 at current climate levels and increasing beyond 1 in the future climate. A contribution beyond 1 is possible because the mean contributes negatively to the change in the total risk ratio while variability shows an increase in extremes contributing to an overall increase in summerly extremes. This exemplifies that the change in the mean and variability not only amplify the change in event probability but also in some cases counteract each other.
Over the Iberian Peninsula, the decline in the mean is responsible for the overall decline in the probability of extremes in summer. While the mean contributes to a decline throughout all warming levels, the variability can initially offset the overall decline in summerly extremes but can not compensate for the strong decline in the mean in warmer climates. Note that the change in the sign of contributions in JJA is due to a change in the PRtotal shifting from an increase (>1) to a decrease (<1) (Fig. 7). However, increases in the probability of extremes in summer can still occur locally in the northern parts of the Iberian Peninsula due to the change in variability even though the mean is strongly decreasing (as seen in Fig. 6). In winter, for which the PRtotal is continuously increasing, the mean contributes initially with 0.83 (var: 0.17) and is subsequently lower in warmer climates (0.66–0.69).
In addition, over the Mediterranean the mean contributes continuously to a decline in summerly extremes; however, here the change in variability can initially offset the decline and lead to an increase in the probability of extremes in summer before the reversal of the trend towards no change in extremes in the +4 ∘C world which is slowed by the presence of variability. In winter the mean contributes to roughly 0.7 of the change, while variability contributes 0.3. The contributions are thereby stable across all warming levels.
3.3 Influence of the temporal aggregation
Until now, all results shown are for an aggregation level of 3 h, raising the question as to whether the level of aggregation (i.e., 24, 72 h) has any influence on the ratio of contribution. First, looking at the probability risk ratios of annual extremes reveals that the level of temporal aggregation influences the magnitude of the probability risk ratios of total, mean, and variability (as seen in Fig. 9). In general, the PR values of subdaily extremes (3 h) are higher than for 24 and 72 h in most regions and aggregated over all land area. Only over France do the 3 h and 24 h PRtotal values develop close to identically with the 72 h showing slightly lower values before all three aggregations converge in a similar PRtotal at +4 ∘C. In Scandinavia, both the 24 and 72 h extremes show near-identical PR values well below the 3 h aggregation.
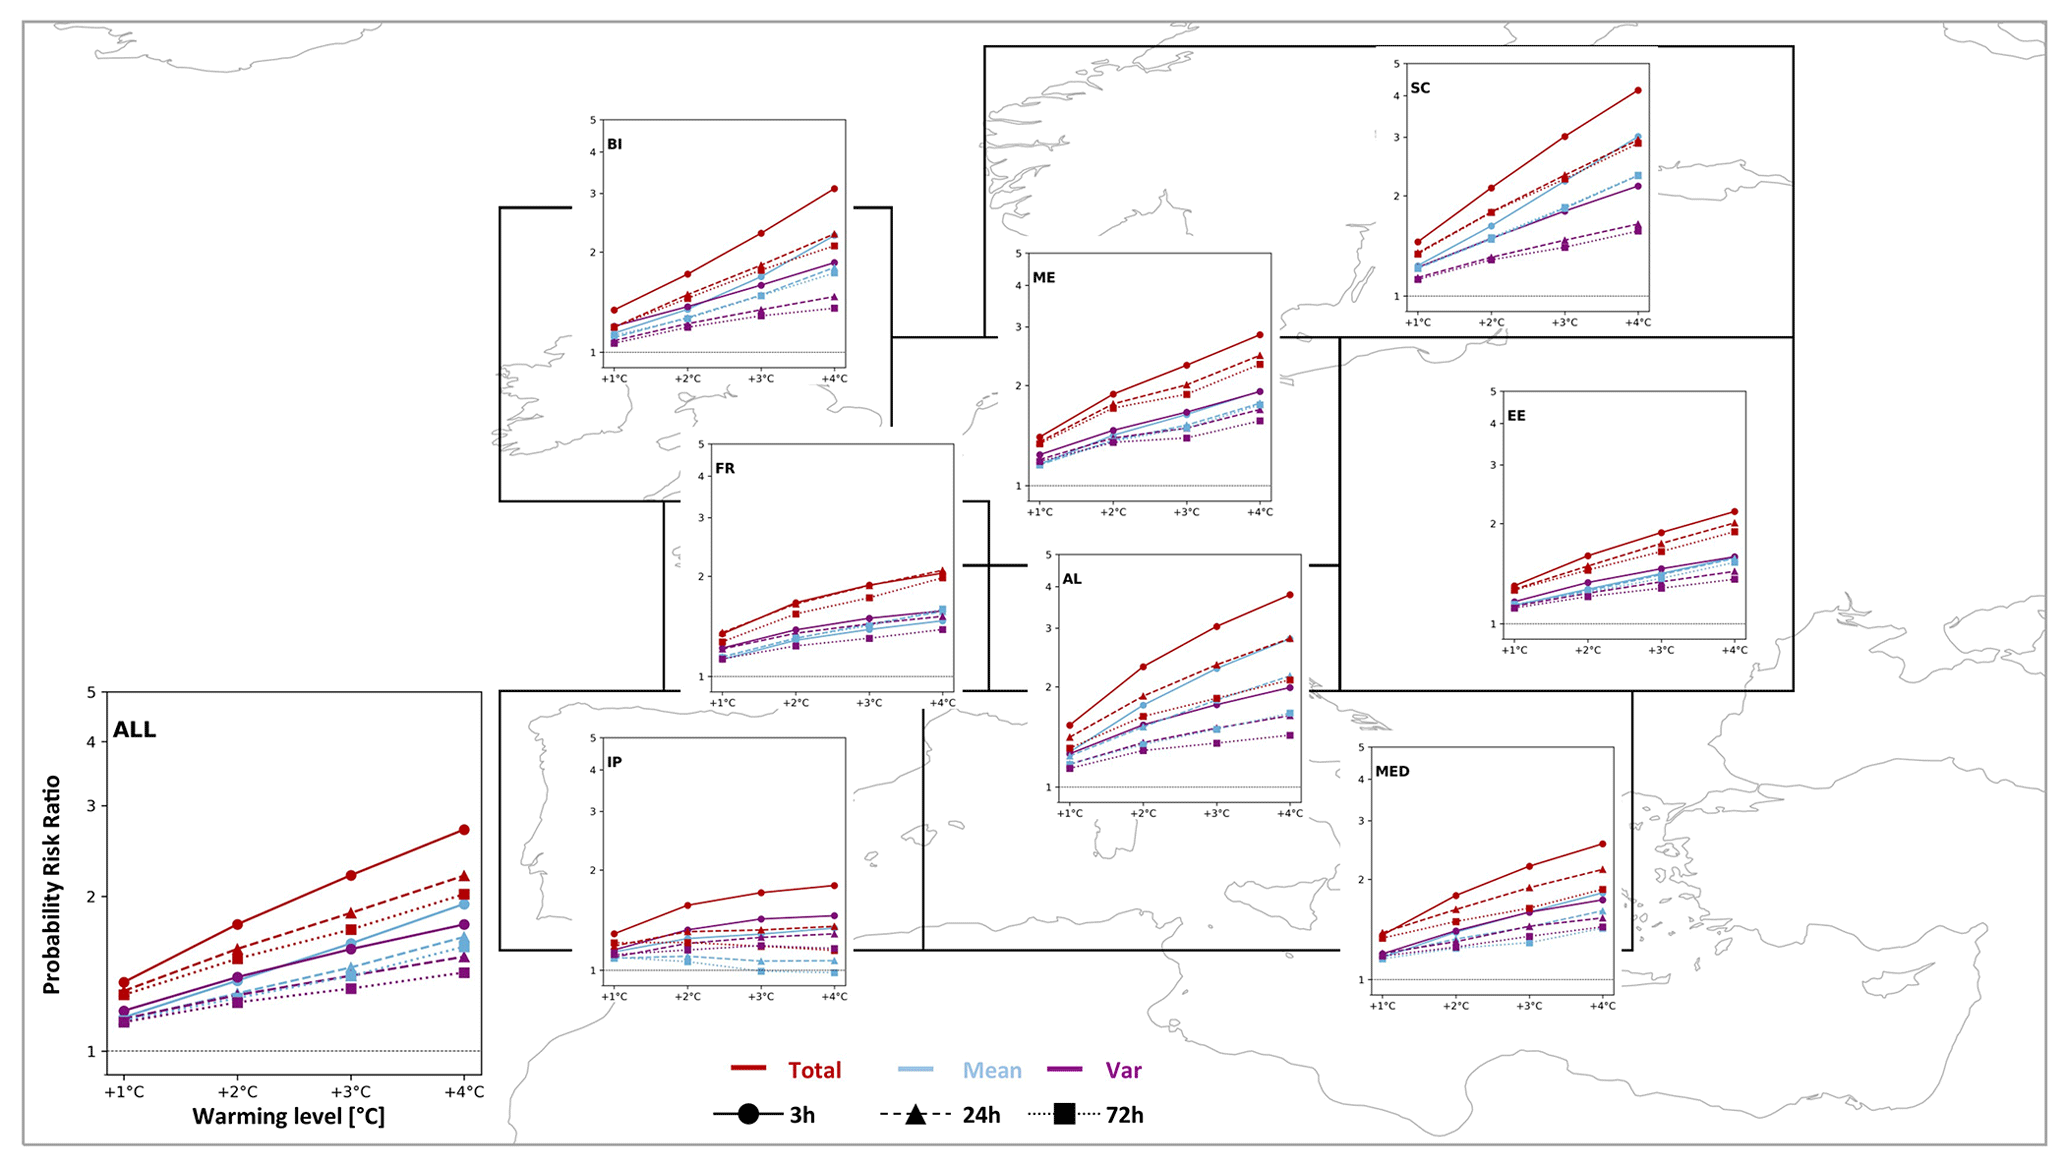
Figure 9Regional probability risk ratios for different temporal aggregation levels (3, 24, 72 h) on annual scales. The panels show PRtotal (red), PRmean (blue), and PRvar (purple) values (y axis) at warming levels of +1, +2, +3, +4 ∘C (x axis). The solid lines with the circle marker represent PR values for 3 h temporal aggregation (the same as in Fig. 4); the dashed lines with the triangle marker represent PR values for 24 h; and the dotted lines with the square marker represent PR values for 72 h. The lower-left panel (ALL) shows the aggregation over all land grid cells and shows axis labels that apply for all panels.
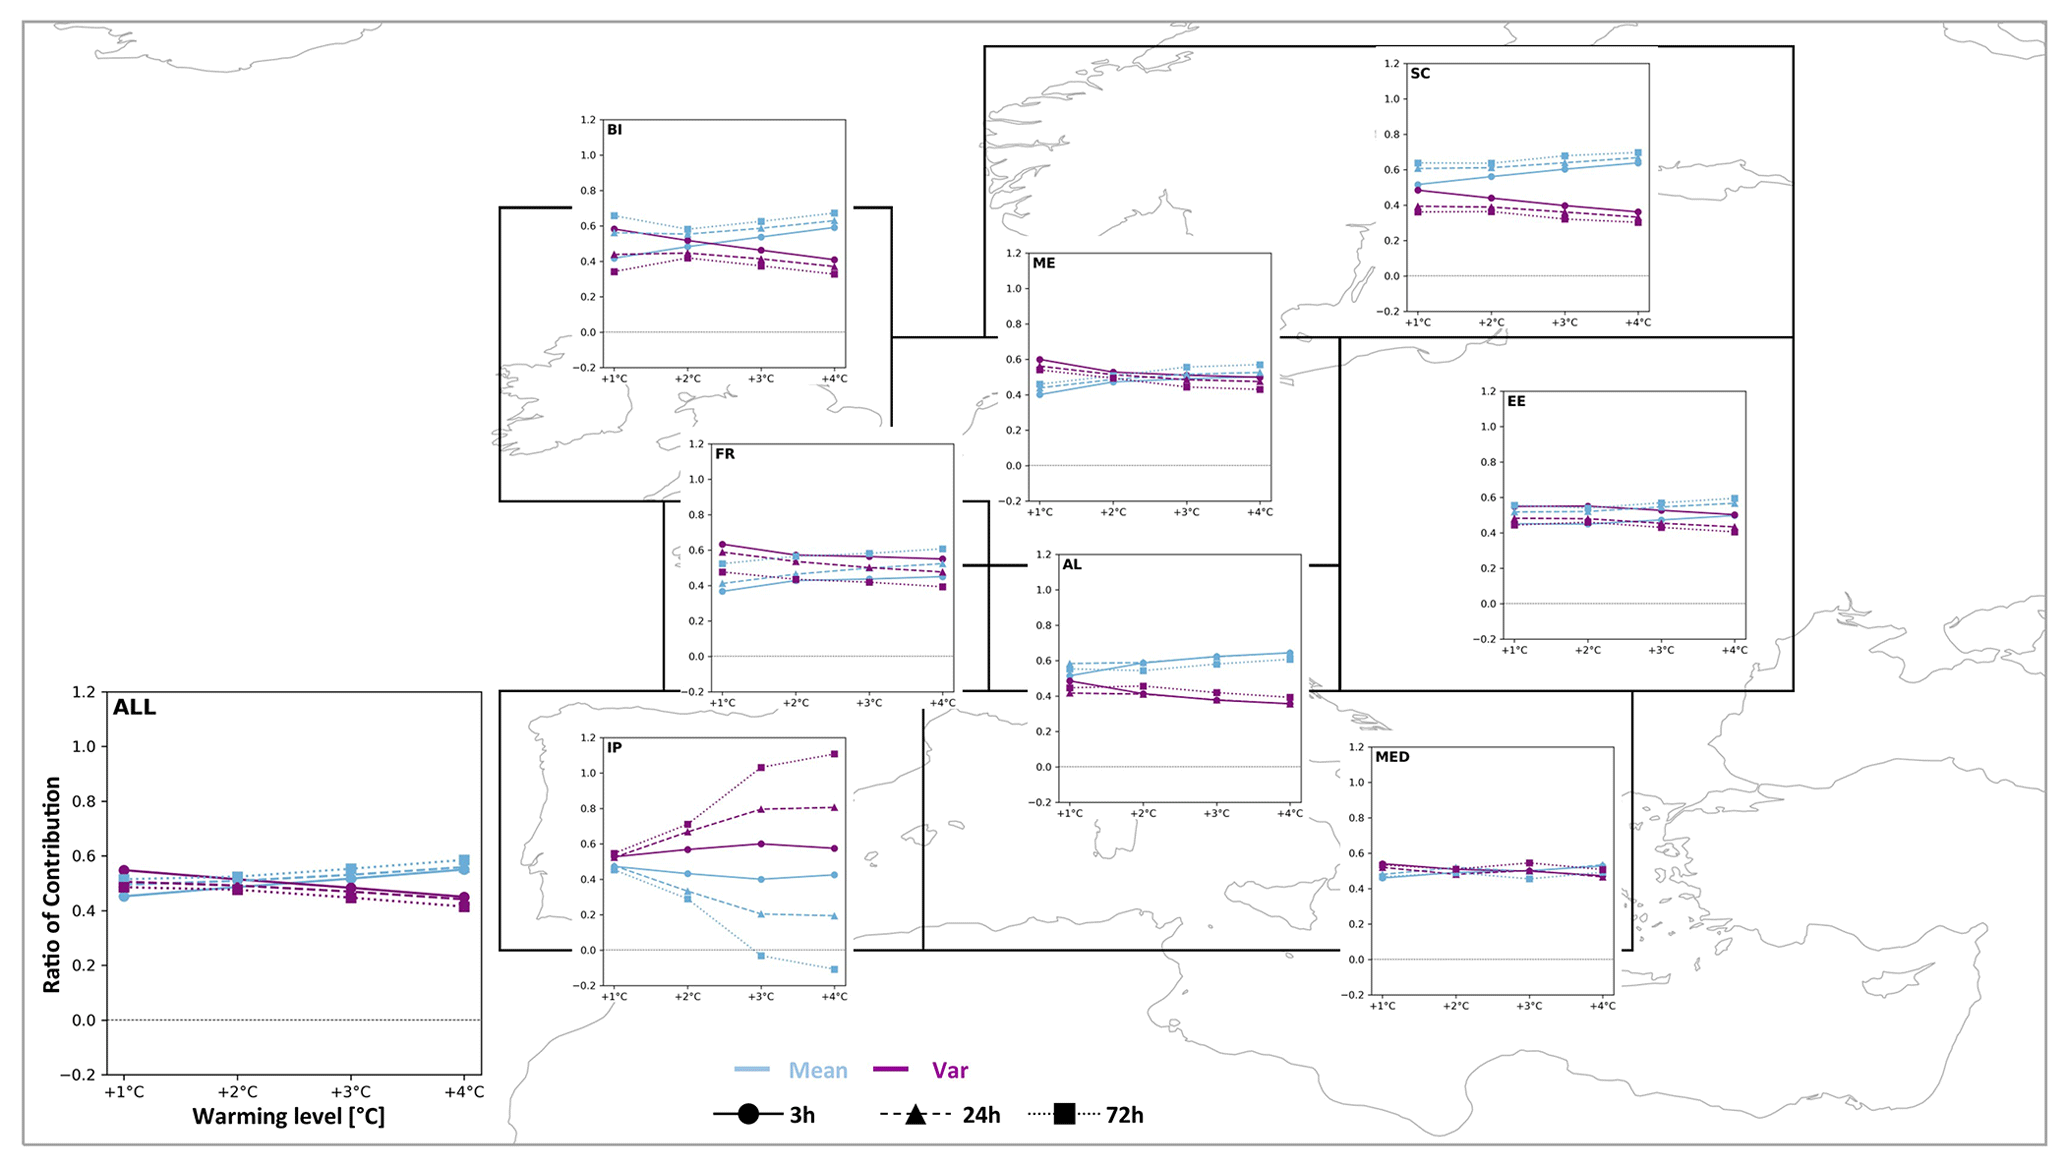
Figure 10Regional ratios of contribution based on different levels of temporal aggregation (3, 24, and 72 h) for annual maxima. Ratio of contributions from PR values in Fig. 9. Contribution from the mean is shown in blue, and contributions from variability are shown in purple. Ratio of contribution is shown on the y axis, with different warming levels shown on the x axis (+1, +2, +3, +4 ∘C). The solid lines with the circle marker represent individual contributions for 3 h temporal aggregation (same as in Fig. 5); the dashed lines with the triangle marker represent contributions for 24 h; and the dotted lines with the square marker represent contributions for 72 h. The lower-left panel (ALL) shows the aggregation over all land grid cells and shows axis labels that apply for all panels.
The level of temporal aggregation, however, has only a very marginal influence on the ratio of contribution (as seen in Fig. 10), and the main takeaways from the previous sections remain true. Only in the Iberian Peninsula does the influence of the variability considerably gain in importance (Fig. 10). This is caused by a decrease in the PRmean in the 24 and 72 h extremes. In the 3 h data, all PRtotal, PRmean, and PRvar show an increase, while in the 24 and 72 h data the PRmean shows a downward trend, and in the 72 h there is even a decrease in the PRmean from 3 ∘C warming on. In comparison, the PRvar continues to increase in the 24 h data and increases then decreases in the 72 h data.
Winter generally shows the same influence of temporal aggregation as seen on the annual scales. The PR values are generally lower over the longer durations then in the subdaily extremes (Fig. S2). In the British Isles, central Europe, eastern Europe, and over all land areas, the three aggregation levels produce very similar PR values throughout. Only in Scandinavia do the longer durations show considerably higher PR values then on the subdaily scale (PRtotal for 3 h: 3.3; PRtotal for 24 h: 4.2; PRtotal for 72 h: 4.4). Over the Alps (PRtotal for 3 h: 5.6; PRtotal for 24 h: 3.6; PRtotal for 72 h: 2.8) and the Iberian Peninsula (PRtotal for 3 h: 2.9; PRtotal for 24 h: 1.5; PRtotal for 72 h: 1.3), the longer-duration PR values are markedly lower. In addition, over France and the Mediterranean the PR values are lower in the 24 and 72 h data. However, these differences in the PR values only have a small influence on the overall ratio of contributions, which remains almost unaffected in the subregions of Scandinavia, eastern Europe, the Alps, the Mediterranean, and aggregated over all land area (Fig. S3). Over central Europe the influence of the variability gains in importance for explaining the changes in the current (3 h: ∼ 0, 24/72 h: ∼ 0.3) and near-term future climate (3 h: ∼ 0.3, 24/72 h: ∼ 0.4). In the +3 and +4 ∘C climates the ratios of contribution are near identical on all temporal aggregation levels. In the British Isles the mean contributes more to the changes in the current climate in both the 24 and 72 h data. In the future climate data, ratios are similar across aggregation levels. In France, the variability in the 24 h data gains slightly in importance in the current climate compared to the 3 h data. In the 72 h data the mean gains in importance in current climate and slightly gains in importance in future climates. In the Iberian Peninsula the 3 and 24 h ratios are near identical, but in the 72 h data the variability drops in importance, especially in the +4 ∘C climate, due to the decrease in PRvar towards no change (1) from a previous increase (>1).
However, in summer the ratio of contribution is markedly influenced by the level of temporal aggregation (Fig. S5). Aggregated over all land area this results in the variability contributing by 0.7–0.76 in the 24 h data and 0.74–0.87 in the 72 h data compared to 0.56–0.66 in the 3 h data. The gain in importance of the variability for changes in the probability of extremes with the level of aggregation can be seen in all regions. Differences due to the level of aggregation are less defined in the regions of Scandinavia and central Europe but very noticeable in France, the Alps, eastern Europe, the Iberian Peninsula, and the Mediterranean. These differences in the ratio of contribution can be explained by the mean showing progressively decreasing PR values (<1) or values closer to no-change with longer durations. The PRmean values of the 24 and 72 h data are markedly lower than for the 3 h data, while the temporal aggregation produces less of a difference in the PRvar values (Fig. S4). As a result, the importance of the variability for the future changes in extreme-event probability increases with temporal aggregation in summer.
3.4 Influence of the level of extremeness
The level of extremeness (2σ or 3σ) in general does not change the overall conclusions regarding the importance of both the mean and variability for the total change in extreme events. The regions largely show the same order of importance for either the mean or variability. For example, regions where the mean contributes more to a change in event probability then the variability will also show this behavior with a higher threshold for the event definition. However, the level of extremeness does in general increase the ratio of contribution for variability and lowers the ratio of the mean. This increase in the ratio of contribution for variability is true for the annual scales (Fig. S6) and the seasonal scales (Figs. S7, S8). Further, this can also be shown for the different temporal aggregations (Figs. S9, S10). On the seasonal scale the order of contribution is unchanged, with the mean showing higher contributions in winter and the variability showing higher contributions in summer. On the annual scales where the ratios of contribution are relatively similar anyway, the increase in the ratio for variability can change the major contributor from mean to variability. In regions where the mean and variability contributed near equally (e.g., central Europe, the Mediterranean) the contributions from the variability remain above the mean with the 3σ threshold. Regions where the main contributor switched throughout continued warming from variability to mean (e.g., the British Isles, all land area) also show for the 3σ events that the contribution from variability remains larger than the mean, but the ratios converge to near equal in the +4 ∘C world. The larger contribution from variability at the higher levels of extremeness could potentially be influenced by decreased sampling. Although a SMILE was used, there are grid cells where 3σ events do not occur in the pre-industrial simulation and (or) in the future simulations.
The strong seasonal contrast between DJF and JJA in the total risk ratio and especially in the risk ratio driven by the mean change can be associated with differences in the dynamic contributions. While in winter the response in the mean change is amplified by both a strong positive contribution from the dynamics and thermodynamics, in summer the partly negative response in the mean change can be associated with a negative dynamic contribution which offsets the thermodynamic contribution, as shown by Williams and O'Gorman (2022). In the study by Williams and O'Gorman (2022), it is suggested that there might be a link between the decrease in near-surface relative humidity causing an increased convective inhibition in summer. This is relevant since summer extreme precipitation events are mainly of a convective nature. The moisture limitation in summer has also been suggested by Wood and Ludwig (2020), showing an increase in the Bowen ratio for simulations with the CRCM5-LE matching the overall decline in summer mean maximum precipitation. The moisture limitation can reduce local moisture recycling over land and hence increase the contribution of remote moisture sources (i.e., from oceanic origin) to the precipitation over land (Findell et al., 2019). In contrast, where local moisture availability remains high (e.g., over the Alps), the local recycling of water increases convection and thus also extreme precipitation magnitudes (Giorgi et al., 2016). As many extreme precipitation events in Europe are associated with extratropical cyclones, any change to the dynamics of these will likely influence the magnitude and frequency of associated extreme precipitation events. Schemm et al. (2017) argue that the increase in the number of extreme precipitation events is potentially driven by an increase in the frequency of extremely strong frontal systems, as shown in reanalysis data. Further, they show that the precipitation amount increases with the strength of frontal systems. In future projections, Hawcroft et al. (2018) show that while the overall number of cyclones decreases, the number of intensely precipitating extratropical cyclones will increase in summer. The occurrence of extreme precipitation events is further also influenced by other large-scale dynamics, such as atmospheric blocking, which can influence the odds of heavy precipitation events (Kautz et al., 2022; Lenggenhager and Martius, 2019). This generally larger influence of the dynamical contribution in summer could explain the larger contribution of variability in explaining the occurrence of extreme summer precipitation. Hence, the dynamic contributions will likely determine the sign of the change.
In winter, a relatively strong thermodynamic contribution (especially in northern Europe) is amplified by dynamic contributions (Williams and O'Gorman, 2022). The amplified strong thermodynamic and dynamic components can also be indicated for the CRCM5-LE winter mean maximum precipitation by showing widespread scaling rates above Clausius–Clapeyron (>7 % ∘C−1) over Europe (Wood and Ludwig, 2020). Bevacqua et al. (2020) show that wintertime precipitation extremes associated with clustered cyclones are driven by an increase in mean precipitation amount per cyclone, which can be associated with the thermodynamic effect (i.e., larger water holding capacity of a warmer atmosphere), instead of an increase in cyclone frequency. This corroborates the findings of this study that wintertime precipitation extremes are to a larger extent driven by a change in the mean magnitude instead of a change in variability. The complex interplay between the dynamic and thermodynamic contributions in individual extreme precipitation events and the changes thereof will be key to understand the total change in event frequency.
In this study, only one regional large ensemble has been used, which makes it difficult to evaluate the importance of model uncertainty in these results. Using multiple global SMILEs, van der Wiel and Bintanja (2021) have shown that the model uncertainty seems to only play a minor role in the contributions of mean and variability to the extreme-event occurrence. However, different models will influence the magnitude of the probability risk ratios. On the local scale, different regional climate models can show different land–atmosphere feedbacks due to a difference in model components or parameterization, which can influence the evolution of local precipitation extremes (e.g., Ritzhaupt and Maraun, 2023). Other regional SMILEs are necessary to analyze the impact of model uncertainty on the results. However, the availability of other regional SMILEs is limited. The only two other regional SMILES over Europe (to the knowledge of the author) differ in the extent of the domain (Aalbers et al., 2018) or the model resolution (Brönnimann et al., 2018; Addor and Fischer, 2015). Von Trentini et al. (2020) have analyzed the three regional SMILEs and show that the three SMILEs reveal comparable changes in the interannual variability of various climate indicators. Comparing projections for seasonal maximum precipitation in the 50-member CRCM5-LE (Wood and Ludwig, 2020) and the 16-member EC-Earth-RACMO ensemble (Aalbers et al., 2018) reveals very comparable forced changes in the mean magnitudes. This might indicate that the findings in van der Wiel and Bintanja (2021) that show only a small influence of model uncertainty on the ratio of contribution could potentially also be true for regional SMILEs.
Over the Mediterranean region, including the Iberian Peninsula, it has been shown that the magnitude of the drying trend, especially for total summer precipitation, and mean extreme magnitudes can be model dependent; however, there is a high model agreement on an overall drying (e.g., Ritzhaupt and Maraun, 2023; Zittis et al., 2021). However, it has also been shown that lower-likelihood precipitation extremes still increase in the northern parts of the Mediterranean region (e.g., Zittis et al., 2021). Both the reduction in mean climate characteristics and the increase in upper tails fit the results shown in this study and strengthen the hypothesis that the increase in lower-likelihood precipitation events is mainly driven by an increase in the variability. Most regional climate simulations place the French domain within a transitional zone between a drying signal of summer precipitation in the south and a wetting in the north of Europe (e.g., Aalbers et al., 2018; Ritzhaupt and Maraun, 2023; Wood and Ludwig, 2020), largely showing no change or a slight decrease in mean state extremes, which is consistent with the results here. This means that any increase in the upper tails is dependent on the change in variability.
Scenario uncertainty could also have an influence. However, by using warming levels instead of fixed time periods and maintaining the assumption that there is a physical basis for the connection of level of warming and climate system response, the scenario uncertainty can at least be reduced for the warming levels that are reachable by both lower- and higher-emission scenarios. To fully address the influence of scenario uncertainty on the presented results, a regional SMILE with multiple dynamically downscaled emission scenarios from the same global model would be necessary. Unfortunately, such a multi-scenario regional SMILE ensemble does not exist.
Several studies have highlighted that convection-permitting climate models (CPMs) are better at representing precipitation extremes compared to regional climate models on non-convection-resolving resolutions, especially in summer for convective events (e.g., Ban et al., 2014; Kendon et al., 2017; Pichelli et al., 2021). These studies are, however, often only a single model with a single short time slice simulation. Progress is being made on the availability of a multi-model CPM ensemble (Coppola et al., 2020; Pichelli et al., 2021). However, these simulations will only cover a small part of the pan-European domain and will rely on short time slice simulations of single climate realizations. These single decadal climate realizations will, however, be strongly influenced by natural climate variability (Lehner et al., 2020; Leduc et al., 2019; Deser et al., 2012; Hawkins and Sutton, 2009). Poschlod (2021) has shown the suitability of the CRCM5-LE and highlights the added value of using a regional SMILE for the analysis of precipitation extremes even on non-convection-permitting resolutions. Other studies have shown that the CRCM5-LE, even though convection is parameterized in the model, can show a good representation of the timing of maximum annual precipitation (Wood and Ludwig, 2020) and good agreement for 10-year return levels of 3–24 h annual maxima with observations (Poschlod et al., 2021) over Europe. Concerning overall patterns of precipitation change in CPM compared to regional climate model (RCM) ensembles, Pichelli et al. (2021) have shown that both ensembles are largely in agreement on the patterns of the change (over the Alps and northern Mediterranean) but that differences might occur in the magnitudes. This will likely entail that the magnitudes of the probability risk ratios will be different in the CPM models. However, this does not necessarily mean a change in the relation between the influences of the mean and variability. The level of temporal aggregations or the level of extremeness also influence the magnitudes of the PR values but do not necessarily entail a change in the ratios of contribution. Further, Kendon et al. (2017) have shown that CPM and RCM simulations agree on many aspects of the change in future precipitation projections.
In this study, climate simulations from the regional CRCM5 initial-condition large ensemble are used to analyze the general drivers for the change in extreme annual and seasonal precipitation event probability. The concept of the probability risk ratio from van der Wiel and Bintanja (2021) is used to partition the change in extreme-event occurrence into individual contributions from a change in mean climate and a change in variability. The results reveal that for the increase in event probability of annual maxima larger than 2σ, both the change in the mean and variability contribute near equally to the total change. For seasonal extremes in winter (DJF) the change in the mean is the major contributor to the total change. In summer the contribution from the change in variability is larger than the mean, and in some regions variability is the sole driver of an increase in extreme-event occurrence. Over France, the Iberian Peninsula, and the Mediterranean, the change in variability can lead to an increase in extreme-event probability despite a strong decline in extreme precipitation events as projected by the mean. The strong decrease in the mean would likely entail a decrease in the probability of extreme precipitation events, but due to an increase in variability the overall probability can still increase or remain at current levels. The level of extremeness in the event definition (2σ or 3σ) in general does not change the overall results of this study. In addition, the level of temporal aggregation generally does not change the results. However, both do tend to increase the importance of the variability slightly.
The CRCM5-LE data for the historical and RCP8.5 simulations are available through https://www.climex-project.org/en/data-access (Ouranos, 2020). The CRCM5-LE pre-industrial control simulations are available upon reasonable request.
The supplement related to this article is available online at: https://doi.org/10.5194/esd-14-797-2023-supplement.
The author has declared that there are no competing interests.
Publisher's note: Copernicus Publications remains neutral with regard to jurisdictional claims in published maps and institutional affiliations.
CRCM5 was developed by the ESCER Centre of Université du Québec à Montréal (UQAM) in collaboration with Environment and Climate Change Canada. We acknowledge Environment and Climate Change Canada's Canadian Centre for Climate Modeling and Analysis for executing and making available the CanESM2 large-ensemble simulations used in this study and the Canadian Sea Ice and Snow Evolution Network for proposing the simulations. Computations with CRCM5 for the ClimEx project were made on the SuperMUC supercomputer at the Leibniz Supercomputing Centre (LRZ) of the Bavarian Academy of Sciences and Humanities. The operation of this supercomputer is funded via the Gauss Centre for Supercomputing (GCS) by the German Federal Ministry of Education and Research and the Bavarian State Ministry of Education, Science and the Arts.
The CRCM5-LE simulations and pre-industrial simulations used in this research were produced for the ClimEx project funded
by the Bayerisches Staatsministerium für Umwelt und Verbraucherschutz (grant no. 81-0270-024570/2015).
This open-access publication was funded by Ludwig-Maximilians-Universität München.
This paper was edited by Fubao Sun and reviewed by two anonymous referees.
Aalbers, E. E., Lenderink, G., van Meijgaard, E., and van den Hurk, B. J. J. M.: Local-scale changes in mean and heavy precipitation in Western Europe, climate change or internal variability?, Clim. Dynam., 50, 4745–4766, https://doi.org/10.1007/s00382-017-3901-9, 2018.
Aalbers, E. E., van Meijgaard, E., Lenderink, G., de Vries, H., and van den Hurk, B. J. J. M.: The 2018 west-central European drought projected in a warmer climate: how much drier can it get?, Nat. Hazards Earth Syst. Sci., 23, 1921–1946, https://doi.org/10.5194/nhess-23-1921-2023, 2023.
Addor, N. and Fischer, E. M.: The influence of natural variability and interpolation errors on bias characterization in RCM simulations, J. Geophys. Res.-Atmos., 120, 10180–10195, https://doi.org/10.1002/2014JD022824, 2015.
Allen, M. R. and Ingram, W. J.: Constraints on future changes in climate and the hydrologic cycle, Nature, 419, 224–232, https://doi.org/10.1038/nature01092, 2002.
Arora, V. K., Scinocca, J. F., Boer, G. J., Christian, J. R., Denman, K. L., Flato, G. M., Kharin, V. V., Lee, W. G., and Merryfield, W. J.: Carbon emission limits required to satisfy future representative concentration pathways of greenhouse gases, Geophys. Res. Lett., 38, L05805, https://doi.org/10.1029/2010GL046270, 2011.
Bador, M. and Alexander, L. V.: Future Seasonal Changes in Extreme Precipitation Scale With Changes in the Mean, Earth's Future, 10, e2022EF002979, https://doi.org/10.1029/2022EF002979, 2022.
Ban, N., Schmidli, J., and Schär, C.: Evaluation of the convection-resolving regional climate modeling approach in decade-long simulations, J. Geophys. Res.-Atmos., 119, 7889–7907, https://doi.org/10.1002/2014JD021478, 2014.
Bélair, S., Mailhot, J., Girard, C., and Vaillancourt, P.: Boundary Layer and Shallow Cumulus Clouds in a Medium-Range Forecast of a Large-Scale Weather System, Mon. Weather Rev., 133, 1938–1960, https://doi.org/10.1175/MWR2958.1, 2005.
Bevacqua, E., Zappa, G., and Shepherd, T. G.: Shorter cyclone clusters modulate changes in European wintertime precipitation extremes, Environ. Res. Lett., 15, 124005, https://doi.org/10.1088/1748-9326/abbde7, 2020.
Bintanja, R. and Selten, F. M.: Future increases in Arctic precipitation linked to local evaporation and sea-ice retreat, Nature, 509, 479–482, https://doi.org/10.1038/nature13259, 2014.
Bintanja, R., van der Wiel, K., van der Linden, E. C., Reusen, J., Bogerd, L., Krikken, F., and Selten, F. M.: Strong future increases in Arctic precipitation variability linked to poleward moisture transport, Sci. Adv., 6, eaax6869, https://doi.org/10.1126/sciadv.aax6869, 2020.
Böhnisch, A., Ludwig, R., and Leduc, M.: Using a nested single-model large ensemble to assess the internal variability of the North Atlantic Oscillation and its climatic implications for central Europe, Earth Syst. Dynam., 11, 617–640, https://doi.org/10.5194/esd-11-617-2020, 2020.
Böhnisch, A., Mittermeier, M., Leduc, M., and Ludwig, R.: Hot Spots and Climate Trends of Meteorological Droughts in Europe–Assessing the Percent of Normal Index in a Single-Model Initial-Condition Large Ensemble, Front. Water, 3, 716621, https://doi.org/10.3389/frwa.2021.716621, 2021.
Brogli, R., Kröner, N., Sørland, S. L., Lüthi, D., and Schär, C.: The Role of Hadley Circulation and Lapse-Rate Changes for the Future European Summer Climate, J. Climate, 32, 385–404, https://doi.org/10.1175/JCLI-D-18-0431.1, 2019.
Brönnimann, S., Rajczak, J., Fischer, E. M., Raible, C. C., Rohrer, M., and Schär, C.: Changing seasonality of moderate and extreme precipitation events in the Alps, Nat. Hazards Earth Syst. Sci., 18, 2047–2056, https://doi.org/10.5194/nhess-18-2047-2018, 2018.
Brunner, M. I., Swain, D. L., Wood, R. R., Willkofer, F., Done, J. M., Gilleland, E., and Ludwig, R.: An extremeness threshold determines the regional response of floods to changes in rainfall extremes, Commun. Earth Environ., 2, 173, https://doi.org/10.1038/s43247-021-00248-x, 2021.
Christensen, J. H. and Christensen, O. B.: A summary of the PRUDENCE model projections of changes in European climate by the end of this century, Climatic Change, 81, 7–30, https://doi.org/10.1007/s10584-006-9210-7, 2007.
Christensen, J. H., Larsen, M. A. D., Christensen, O. B., Drews, M., and Stendel, M.: Robustness of European climate projections from dynamical downscaling, Clim. Dynam., 53, 4857–4869, https://doi.org/10.1007/s00382-019-04831-z, 2019.
Contractor, S., Donat, M. G., and Alexander, L. V.: Changes in Observed Daily Precipitation over Global Land Areas since 1950, J. Climate, 34, 3–19, https://doi.org/10.1175/JCLI-D-19-0965.1, 2021.
Coppola, E., Sobolowski, S., Pichelli, E., Raffaele, F., Ahrens, B., Anders, I., Ban, N., Bastin, S., Belda, M., Belusic, D., Caldas-Alvarez, A., Cardoso, R. M., Davolio, S., Dobler, A., Fernandez, J., Fita, L., Fumiere, Q., Giorgi, F., Goergen, K., Güttler, I., Halenka, T., Heinzeller, D., Hodnebrog, Ø., Jacob, D., Kartsios, S., Katragkou, E., Kendon, E., Khodayar, S., Kunstmann, H., Knist, S., Lavín-Gullón, A., Lind, P., Lorenz, T., Maraun, D., Marelle, L., van Meijgaard, E., Milovac, J., Myhre, G., Panitz, H.-J., Piazza, M., Raffa, M., Raub, T., Rockel, B., Schär, C., Sieck, K., Soares, P. M. M., Somot, S., Srnec, L., Stocchi, P., Tölle, M. H., Truhetz, H., Vautard, R., de Vries, H., and Warrach-Sagi, K.: A first-of-its-kind multi-model convection permitting ensemble for investigating convective phenomena over Europe and the Mediterranean, Clim. Dynam., 55, 3–34, https://doi.org/10.1007/s00382-018-4521-8, 2020.
Deser, C., Lehner, F., Rodgers, K. B., Ault, T., Delworth, T. L., DiNezio, P. N., Fiore, A., Frankignoul, C., Fyfe, J. C., Horton, D. E., Kay, J. E., Knutti, R., Lovenduski, N. S., Marotzke, J., McKinnon, K. A., Minobe, S., Randerson, J., Screen, J. A., Simpson, I. R., and Ting, M.: Insights from Earth system model initial-condition large ensembles and future prospects, Nat. Clim. Change, 10, 277–286, https://doi.org/10.1038/s41558-020-0731-2, 2020.
Deser, C., Phillips, A., Bourdette, V., and Teng, H.: Uncertainty in climate change projections: the role of internal variability, Clim. Dynam., 38, 527–546, https://doi.org/10.1007/s00382-010-0977-x, 2012.
de Vries, H., Lenderink, G., van der Wiel, K., and van Meijgaard, E.: Quantifying the role of the large-scale circulation on European summer precipitation change, Clim. Dynam., 59, 2871–2886, https://doi.org/10.1007/s00382-022-06250-z, 2022.
Donat, M. G., Lowry, A. L., Alexander, L. V., O'Gorman, P. A., and Maher, N.: More extreme precipitation in the world's dry and wet regions, Nat. Clim. Change, 6, 508–513, https://doi.org/10.1038/nclimate2941, 2016.
Findell, K. L., Keys, P. W., van der Ent, R. J., Lintner, B. R., Berg, A., and Krasting, J. P.: Rising Temperatures Increase Importance of Oceanic Evaporation as a Source for Continental Precipitation, J. Climate, 32, 7713–7726, https://doi.org/10.1175/JCLI-D-19-0145.1, 2019.
Fischer, E. M. and Knutti, R.: Observed heavy precipitation increase confirms theory and early models, Nat. Clim. Change, 6, 986–991, https://doi.org/10.1038/NCLIMATE3110, 2016.
Fowler, H. J., Lenderink, G., Prein, A. F., Westra, S., Allan, R. P., Ban, N., Barbero, R., Berg, P., Blenkinsop, S., Do, H. X., Guerreiro, S., Haerter, J. O., Kendon, E. J., Lewis, E., Schaer, C., Sharma, A., Villarini, G., Wasko, C., and Zhang, X.: Anthropogenic intensification of short-duration rainfall extremes, Nat. Rev. Earth Environ., 2, 107–122, https://doi.org/10.1038/s43017-020-00128-6, 2021.
Fyfe, J. C., Derksen, C., Mudryk, L., Flato, G. M., Santer, B. D., Swart, N. C., Molotch, N. P., Zhang, X., Wan, H., Arora, V. K., Scinocca, J., and Jiao, Y.: Large near-term projected snowpack loss over the western United States, Nat. Commun., 8, 14996, https://doi.org/10.1038/ncomms14996, 2017.
Giorgi, F., Torma, C., Coppola, E., Ban, N., Schär, C., and Somot, S.: Enhanced summer convective rainfall at Alpine high elevations in response to climate warming, Nat. Geosci., 9, 584–589, https://doi.org/10.1038/ngeo2761, 2016.
Guerreiro, S. B., Fowler, H. J., Barbero, R., Westra, S., Lenderink, G., Blenkinsop, S., Lewis, E., and Li, X.-F.: Detection of continental-scale intensification of hourly rainfall extremes, Nat. Clim. Change, 8, 803–807, https://doi.org/10.1038/s41558-018-0245-3, 2018.
Hawcroft, M., Walsh, E., Hodges, K., and Zappa, G.: Significantly increased extreme precipitation expected in Europe and North America from extratropical cyclones, Environ. Res. Lett., 13, 124006, https://doi.org/10.1088/1748-9326/aaed59, 2018.
Hawkins, E. and Sutton, R.: The Potential to Narrow Uncertainty in Regional Climate Predictions, B. Am. Meteorol. Soc., 90, 1095–1108, https://doi.org/10.1175/2009BAMS2607.1, 2009.
Held, I. M. and Soden, B. J.: Robust Responses of the Hydrological Cycle to Global Warming, J. Climate, 19, 5686–5699, https://doi.org/10.1175/JCLI3990.1, 2006.
Hodnebrog, Ø., Marelle, L., Alterskjær, K., Wood, R. R., Ludwig, R., Fischer, E. M., Richardson, T. B., Forster, P. M., Sillmann, J., and Myhre, G.: Intensification of summer precipitation with shorter time-scales in Europe, Environ. Res. Lett., 14, 124050, https://doi.org/10.1088/1748-9326/ab549c, 2019.
Innocenti, S., Mailhot, A., Frigon, A., Cannon, A. J., and Leduc, M.: Observed and Simulated Precipitation over Northeastern North America: How Do Daily and Subdaily Extremes Scale in Space and Time?, J. Climate, 32, 8563–8582, https://doi.org/10.1175/JCLI-D-19-0021.1, 2019.
Kain, J. S. and Fritsch, J. M.: A One-Dimensional Entraining/Detraining Plume Model and Its Application in Convective Parameterization, J. Atmos. Sci., 47, 2784–2802, https://doi.org/10.1175/1520-0469(1990)047<2784:AODEPM>2.0.CO;2, 1990.
Kautz, L.-A., Martius, O., Pfahl, S., Pinto, J. G., Ramos, A. M., Sousa, P. M., and Woollings, T.: Atmospheric blocking and weather extremes over the Euro-Atlantic sector – a review, Weather Clim. Dynam., 3, 305–336, https://doi.org/10.5194/wcd-3-305-2022, 2022.
Kelder, T., Wanders, N., van der Wiel, K., Marjoribanks, T. I., Slater, L. J., Wilby, R. L., and Prudhomme, C.: Interpreting extreme climate impacts from large ensemble simulations – are they unseen or unrealistic?, Environ. Res. Lett., 17, 44052, https://doi.org/10.1088/1748-9326/ac5cf4, 2022.
Kendon, E. J., Ban, N., Roberts, N. M., Fowler, H. J., Roberts, M. J., Chan, S. C., Evans, J. P., Fosser, G., and Wilkinson, J. M.: Do Convection-Permitting Regional Climate Models Improve Projections of Future Precipitation Change?, B. Am. Meteorol. Soc., 98, 79–93, https://doi.org/10.1175/BAMS-D-15-0004.1, 2017.
Kirchmeier-Young, M. C., Zwiers, F. W., and Gillett, N. P.: Attribution of Extreme Events in Arctic Sea Ice Extent, J. Climate, 30, 553–571, https://doi.org/10.1175/JCLI-D-16-0412.1, 2017.
Kirchmeier-Young, M. C., Gillett, N. P., Zwiers, F. W., Cannon, A. J., and Anslow, F. S.: Attribution of the Influence of Human-Induced Climate Change on an Extreme Fire Season, Earth's Future, 7, 2–10, https://doi.org/10.1029/2018EF001050, 2019a.
Kirchmeier-Young, M. C., Wan, H., Zhang, X., and Seneviratne, S. I.: Importance of Framing for Extreme Event Attribution: The Role of Spatial and Temporal Scales, Earth's Future, 7, 1192–1204, https://doi.org/10.1029/2019EF001253, 2019b.
Kreienkamp, F., Philip, S. Y., Tradowsky, J. S., Kew, S. F., Lorenz, P., Arrighi, J., Belleflamme, A., Bettmann, T., Caluwaerts, S., Chan, S. C., Ciavarella, A., de Cruz, L., de Vries, H., Demuth, N., Ferrone, A., Fischer, r. M., Fowler, H. J., Goergen, K., Heinrich, D., Henrichs, Y., Lenderink, G., Kaspar, F., Nilson, E., Otto, F. E. L., Ragone, F., Seneviratne, S. I., Singh, R. K., Skålevåg, A., Termonia, P., Thalheimer, L., van Aalst, M., van den Bergh, J., van de Vyver, H., Vannitsem, S., van Oldenborgh, G. J., van Schaeybroeck, B., Vautard, R., Vonk, D., and Wanders, N.: Rapid attribution of heavy rainfall events leading to the severe flooding in Western Europe during July 2021, https://www.worldweatherattribution.org/heavy-rainfall-which-led-to-severe-flooding-in-western-europe-made-more-likely-by-climate-change/ (last access: 25 February 2022), 2021.
Kröner, N., Kotlarski, S., Fischer, E., Lüthi, D., Zubler, E., and Schär, C.: Separating climate change signals into thermodynamic, lapse-rate and circulation effects: theory and application to the European summer climate, Clim. Dynam., 48, 3425–3440, https://doi.org/10.1007/s00382-016-3276-3, 2017.
Kuo, H. L.: On Formation and Intensification of Tropical Cyclones Through Latent Heat Release by Cumulus Convection, J. Atmos. Sci., 22, 40–63, https://doi.org/10.1175/1520-0469(1965)022<0040:OFAIOT>2.0.CO;2, 1965.
Leduc, M., Mailhot, A., Frigon, A., Martel, J.-L., Ludwig, R., Brietzke, G. B., Giguère, M., Brissette, F., Turcotte, R., Braun, M., and Scinocca, J.: The ClimEx Project: A 50-Member Ensemble of Climate Change Projections at 12-km Resolution over Europe and Northeastern North America with the Canadian Regional Climate Model (CRCM5), J. Appl. Meteorol. Clim., 58, 663–693, https://doi.org/10.1175/JAMC-D-18-0021.1, 2019.
Lehner, F., Deser, C., Maher, N., Marotzke, J., Fischer, E. M., Brunner, L., Knutti, R., and Hawkins, E.: Partitioning climate projection uncertainty with multiple large ensembles and CMIP5/6, Earth Syst. Dynam., 11, 491–508, https://doi.org/10.5194/esd-11-491-2020, 2020.
Lenderink, G. and van Meijgaard, E.: Increase in hourly precipitation extremes beyond expectations from temperature changes, Nat. Geosci., 1, 511–514, https://doi.org/10.1038/ngeo262, 2008.
Lenderink, G., Barbero, R., Loriaux, J. M., and Fowler, H. J.: Super-Clausius–Clapeyron Scaling of Extreme Hourly Convective Precipitation and Its Relation to Large-Scale Atmospheric Conditions, J. Climate, 30, 6037–6052, https://doi.org/10.1175/JCLI-D-16-0808.1, 2017.
Lenggenhager, S. and Martius, O.: Atmospheric blocks modulate the odds of heavy precipitation events in Europe, Clim. Dynam., 53, 4155–4171, https://doi.org/10.1007/s00382-019-04779-0, 2019.
Maher, N., Matei, D., Milinski, S., and Marotzke, J.: ENSO Change in Climate Projections: Forced Response or Internal Variability?, Geophys. Res. Lett., 45, 11390–11398, https://doi.org/10.1029/2018GL079764, 2018.
Maher, N., Milinski, S., and Ludwig, R.: Large ensemble climate model simulations: introduction, overview, and future prospects for utilising multiple types of large ensemble, Earth Syst. Dynam., 12, 401–418, https://doi.org/10.5194/esd-12-401-2021, 2021a.
Maher, N., Power, S. B., and Marotzke, J.: More accurate quantification of model-to-model agreement in externally forced climatic responses over the coming century, Nat. Commun., 12, 788, https://doi.org/10.1038/s41467-020-20635-w, 2021b.
Martel, J.-L., Mailhot, A., and Brissette, F.: Global and Regional Projected Changes in 100-yr Subdaily, Daily, and Multiday Precipitation Extremes Estimated from Three Large Ensembles of Climate Simulations, J. Climate, 33, 1089–1103, https://doi.org/10.1175/JCLI-D-18-0764.1, 2020.
Martel, J.-L., Brissette, F. P., Lucas-Picher, P., Troin, M., and Arsenault, R.: Climate Change and Rainfall Intensity–Duration–Frequency Curves: Overview of Science and Guidelines for Adaptation, J. Hydrol. Eng., 26, 3121001, https://doi.org/10.1061/(ASCE)HE.1943-5584.0002122, 2021.
Martynov, A., Laprise, R., Sushama, L., Winger, K., Šeparović, L., and Dugas, B.: Reanalysis-driven climate simulation over CORDEX North America domain using the Canadian Regional Climate Model, version 5: model performance evaluation, Clim. Dynam., 41, 2973–3005, https://doi.org/10.1007/s00382-013-1778-9, 2013.
Matte, D., Larsen, M. A. D., Christensen, O. B., and Christensen, J. H.: Robustness and Scalability of Regional Climate Projections Over Europe, Front. Environ. Sci., 6, 163, https://doi.org/10.3389/fenvs.2018.00163, 2019.
McKenna, C. M. and Maycock, A. C.: Sources of Uncertainty in Multimodel Large Ensemble Projections of the Winter North Atlantic Oscillation, Geophys. Res. Lett., 48, e2021GL093258, https://doi.org/10.1029/2021GL093258, 2021.
Meinshausen, M., Smith, S. J., Calvin, K., Daniel, J. S., Kainuma, M. L. T., Lamarque, J.-F., Matsumoto, K., Montzka, S. A., Raper, S. C. B., Riahi, K., Thomson, A., Velders, G. J. M., and van Vuuren, D. P.: The RCP greenhouse gas concentrations and their extensions from 1765 to 2300, Climatic Change, 109, 213–241, https://doi.org/10.1007/s10584-011-0156-z, 2011.
Mittermeier, M., Braun, M., Hofstätter, M., Wang, Y., and Ludwig, R.: Detecting Climate Change Effects on Vb Cyclones in a 50-Member Single-Model Ensemble Using Machine Learning, Geophys. Res. Lett., 46, 14653–14661, https://doi.org/10.1029/2019GL084969, 2019.
Mittermeier, M., Weigert, M., Rügamer, D., Küchenhoff, H., and Ludwig, R.: A deep learning based classification of atmospheric circulation types over Europe: projection of future changes in a CMIP6 large ensemble, Environ. Res. Lett., 17, 84021, https://doi.org/10.1088/1748-9326/ac8068, 2022.
Myhre, G., Alterskjær, K., Stjern, C. W., Hodnebrog, Ø., Marelle, L., Samset, B. H., Sillmann, J., Schaller, N., Fischer, E., Schulz, M., and Stohl, A.: Frequency of extreme precipitation increases extensively with event rareness under global warming, Sci. Rep., 9, 16063, https://doi.org/10.1038/s41598-019-52277-4, 2019.
Norris, J., Chen, G., and Neelin, J. D.: Thermodynamic versus Dynamic Controls on Extreme Precipitation in a Warming Climate from the Community Earth System Model Large Ensemble, J. Climate, 32, 1025–1045, https://doi.org/10.1175/JCLI-D-18-0302.1, 2019.
O'Gorman, P. A. and Schneider, T.: Scaling of Precipitation Extremes over a Wide Range of Climates Simulated with an Idealized GCM, J. Climate, 22, 5676–5685, https://doi.org/10.1175/2009JCLI2701.1, 2009.
Otto, F. E. L., van der Wiel, K., van Oldenborgh, G. J., Philip, S., Kew, S. F., Uhe, P., and Cullen, H.: Climate change increases the probability of heavy rains in Northern England/Southern Scotland like those of storm Desmond – a real-time event attribution revisited, Environ. Res. Lett., 13, 24006, https://doi.org/10.1088/1748-9326/aa9663, 2018a.
Otto, F. E. L., Philip, S., Kew, S., Li, S., King, A., and Cullen, H.: Attributing high-impact extreme events across timescales – a case study of four different types of events, Climatic Change, 149, 399–412, https://doi.org/10.1007/s10584-018-2258-3, 2018b.
Ouranos: CRCM5-LE ClimEx, https://www.climex-project.org/en/data-access (last access: 14 August 2023), 2020.
Pendergrass, A. G., Knutti, R., Lehner, F., Deser, C., and Sanderson, B. M.: Precipitation variability increases in a warmer climate, Sci. Rep., 7, 17966, https://doi.org/10.1038/s41598-017-17966-y, 2017.
Pfahl, S., O'Gorman, P. A., and Fischer, E. M.: Understanding the regional pattern of projected future changes in extreme precipitation, Nat. Clim. Change, 7, 423–427, https://doi.org/10.1038/nclimate3287, 2017.
Philip, S. Y., Kew, S. F., van Oldenborgh, G. J., Anslow, F. S., Seneviratne, S. I., Vautard, R., Coumou, D., Ebi, K. L., Arrighi, J., Singh, R., van Aalst, M., Pereira Marghidan, C., Wehner, M., Yang, W., Li, S., Schumacher, D. L., Hauser, M., Bonnet, R., Luu, L. N., Lehner, F., Gillett, N., Tradowsky, J. S., Vecchi, G. A., Rodell, C., Stull, R. B., Howard, R., and Otto, F. E. L.: Rapid attribution analysis of the extraordinary heat wave on the Pacific coast of the US and Canada in June 2021, Earth Syst. Dynam., 13, 1689–1713, https://doi.org/10.5194/esd-13-1689-2022, 2022.
Pichelli, E., Coppola, E., Sobolowski, S., Ban, N., Giorgi, F., Stocchi, P., Alias, A., Belušić, D., Berthou, S., Caillaud, C., Cardoso, R. M., Chan, S., Christensen, O. B., Dobler, A., de Vries, H., Goergen, K., Kendon, E. J., Keuler, K., Lenderink, G., Lorenz, T., Mishra, A. N., Panitz, H.-J., Schär, C., Soares, P. M. M., Truhetz, H., and Vergara-Temprado, J.: The first multi-model ensemble of regional climate simulations at kilometer-scale resolution part 2: historical and future simulations of precipitation, Clim. Dynam., 56, 3581–3602, https://doi.org/10.1007/s00382-021-05657-4, 2021.
Poschlod, B.: Using high-resolution regional climate models to estimate return levels of daily extreme precipitation over Bavaria, Nat. Hazards Earth Syst. Sci., 21, 3573–3598, https://doi.org/10.5194/nhess-21-3573-2021, 2021.
Poschlod, B. and Ludwig, R.: Internal variability and temperature scaling of future sub-daily rainfall return levels over Europe, Environ. Res. Lett., 16, 64097, https://doi.org/10.1088/1748-9326/ac0849, 2021.
Poschlod, B., Ludwig, R., and Sillmann, J.: Ten-year return levels of sub-daily extreme precipitation over Europe, Earth Syst. Sci. Data, 13, 983–1003, https://doi.org/10.5194/essd-13-983-2021, 2021.
Prein, A. F., Gobiet, A., Truhetz, H., Keuler, K., Goergen, K., Teichmann, C., Fox Maule, C., van Meijgaard, E., Déqué, M., Nikulin, G., Vautard, R., Colette, A., Kjellström, E., and Jacob, D.: Precipitation in the EURO-CORDEX 0.11∘ and 0.44∘ simulations: high resolution, high benefits?, Clim. Dynam., 46, 383–412, https://doi.org/10.1007/s00382-015-2589-y, 2016.
Rajczak, J. and Schär, C.: Projections of Future Precipitation Extremes Over Europe: A Multimodel Assessment of Climate Simulations, J. Geophys. Res.-Atmos., 122, 10773–10800, https://doi.org/10.1002/2017JD027176, 2017.
Rajczak, J., Pall, P., and Schär, C.: Projections of extreme precipitation events in regional climate simulations for Europe and the Alpine Region, J. Geophys. Res.-Atmos., 118, 3610–3626, https://doi.org/10.1002/jgrd.50297, 2013.
Ritzhaupt, N. and Maraun, D.: Consistency of Seasonal Mean and Extreme Precipitation Projections Over Europe Across a Range of Climate Model Ensembles, J. Geophys. Res.-Atmos., 128, e2022JD037845, https://doi.org/10.1029/2022JD037845, 2023.
Rutgersson, A., Kjellström, E., Haapala, J., Stendel, M., Danilovich, I., Drews, M., Jylhä, K., Kujala, P., Larsén, X. G., Halsnæs, K., Lehtonen, I., Luomaranta, A., Nilsson, E., Olsson, T., Särkkä, J., Tuomi, L., and Wasmund, N.: Natural hazards and extreme events in the Baltic Sea region, Earth Syst. Dynam., 13, 251–301, https://doi.org/10.5194/esd-13-251-2022, 2022.
Schemm, S., Sprenger, M., Martius, O., Wernli, H., and Zimmer, M.: Increase in the number of extremely strong fronts over Europe? A study based on ERA-Interim reanalysis (1979–2014), Geophys. Res. Lett., 44, 553–561, https://doi.org/10.1002/2016GL071451, 2017.
Šeparović, L., Alexandru, A., Laprise, R., Martynov, A., Sushama, L., Winger, K., Tete, K., and Valin, M.: Present climate and climate change over North America as simulated by the fifth-generation Canadian regional climate model, Clim. Dynam., 41, 3167–3201, https://doi.org/10.1007/s00382-013-1737-5, 2013.
Sippel, S., Zscheischler, J., Heimann, M., Lange, H., Mahecha, M. D., van Oldenborgh, G. J., Otto, F. E. L., and Reichstein, M.: Have precipitation extremes and annual totals been increasing in the world's dry regions over the last 60 years?, Hydrol. Earth Syst. Sci., 21, 441–458, https://doi.org/10.5194/hess-21-441-2017, 2017.
Sippel, S., Meinshausen, N., Fischer, E. M., Székely, E., and Knutti, R.: Climate change now detectable from any single day of weather at global scale, Nat. Clim Change, 10, 35–41, https://doi.org/10.1038/s41558-019-0666-7, 2020.
Suarez-Gutierrez, L., Müller, W. A., Li, C., and Marotzke, J.: Dynamical and thermodynamical drivers of variability in European summer heat extremes, Clim. Dynam,, 54, 4351–4366, https://doi.org/10.1007/s00382-020-05233-2, 2020.
Swain, D. L., Langenbrunner, B., Neelin, J. D., and Hall, A.: Increasing precipitation volatility in twenty-first-century California, Nat. Clim. Change, 8, 427–433, https://doi.org/10.1038/s41558-018-0140-y, 2018.
Swain, D. L., Singh, D., Touma, D., and Diffenbaugh, N. S.: Attributing Extreme Events to Climate Change: A New Frontier in a Warming World, One Earth, 2, 522–527, https://doi.org/10.1016/j.oneear.2020.05.011, 2020.
Thompson, V., Dunstone, N. J., Scaife, A. A., Smith, D. M., Slingo, J. M., Brown, S., and Belcher, S. E.: High risk of unprecedented UK rainfall in the current climate, Nat. Commun., 8, 107, https://doi.org/10.1038/s41467-017-00275-3, 2017.
van der Wiel, K. and Bintanja, R.: Contribution of climatic changes in mean and variability to monthly temperature and precipitation extremes, Commun. Earth Environ., 2, 1, https://doi.org/10.1038/s43247-020-00077-4, 2021.
van der Wiel, K., Wanders, N., Selten, F. M., and Bierkens, M. F. P.: Added Value of Large Ensemble Simulations for Assessing Extreme River Discharge in a 2 ∘C Warmer World, Geophys. Res. Lett., 46, 2093–2102, https://doi.org/10.1029/2019GL081967, 2019.
van der Wiel, K., Batelaan, T. J., and Wanders, N.: Large increases of multi-year droughts in north-western Europe in a warmer climate, Clim. Dynam., 60, 1781–1800, https://doi.org/10.1007/s00382-022-06373-3, 2022.
von Trentini, F., Aalbers, E. E., Fischer, E. M., and Ludwig, R.: Comparing interannual variability in three regional single-model initial-condition large ensembles (SMILEs) over Europe, Earth Syst. Dynam., 11, 1013–1031, https://doi.org/10.5194/esd-11-1013-2020, 2020.
Westra, S., Alexander, L. V., and Zwiers, F. W.: Global Increasing Trends in Annual Maximum Daily Precipitation, J. Climate, 26, 3904–3918, https://doi.org/10.1175/JCLI-D-12-00502.1, 2013.
Westra, S., Fowler, H. J., Evans, J. P., Alexander, L. V., Berg, P., Johnson, F., Kendon, E. J., Lenderink, G., and Roberts, N. M.: Future changes to the intensity and frequency of short-duration extreme rainfall, Rev. Geophys., 52, 522–555, https://doi.org/10.1002/2014RG000464, 2014.
Williams, A. I. L. and O'Gorman, P. A.: Summer-Winter Contrast in the Response of Precipitation Extremes to Climate Change Over Northern Hemisphere Land, Geophys. Res. Lett., 49, e2021GL096531, https://doi.org/10.1029/2021GL096531, 2022.
Wood, R. R. and Ludwig, R.: Analyzing Internal Variability and Forced Response of Subdaily and Daily Extreme Precipitation Over Europe, Geophys. Res. Lett., 47, e2020GL089300, https://doi.org/10.1029/2020GL089300, 2020.
Wood, R. R., Lehner, F., Pendergrass, A. G., and Schlunegger, S.: Changes in precipitation variability across time scales in multiple global climate model large ensembles, Environ. Res. Lett., 16, 84022, https://doi.org/10.1088/1748-9326/ac10dd, 2021.
Zittis, G., Bruggeman, A., and Lelieveld, J.: Revisiting future extreme precipitation trends in the Mediterranean, Weather and Climate Extremes, 34, 100380, https://doi.org/10.1016/j.wace.2021.100380, 2021.