the Creative Commons Attribution 4.0 License.
the Creative Commons Attribution 4.0 License.
 | 14 Aug 2023
Climatology of the Mount Brown South ice core site in East Antarctica: implications for the interpretation of a water isotope record
Sarah L. Jackson
Tessa R. Vance
Camilla Crockart
Andrew Moy
Christopher Plummer
Nerilie J. Abram
Water stable isotope records from ice cores (δ18O and δD) are a critical tool for constraining long-term temperature variability at high latitudes. However, precipitation in Antarctica consists of semi-continuous small events and intermittent extreme events. In regions of high accumulation, this can bias ice core records towards recording the synoptic climate conditions present during extreme precipitation events. In this study we utilise a combination of ice core data, reanalysis products, and models to understand how precipitation intermittency impacts the temperature records preserved in an ice core from Mount Brown South in East Antarctica. Extreme precipitation events represent only the largest 10 % of all precipitation events, but they account for 52 % of the total annual snowfall at this site, leading to an overrepresentation of these events in the ice core record. Extreme precipitation events are associated with high-pressure systems in the mid-latitudes that cause increased transport of warm and moist air from the southern Indian Ocean to the ice core site. Warm temperatures associated with these events result in a +4.8 ∘C warm bias in the mean annual temperature when weighted by daily precipitation, and water isotopes in the Mount Brown South ice core are shown to be significantly correlated with local temperature when this precipitation-induced temperature bias is included. The Mount Brown South water isotope record spans more than 1000 years and will provide a valuable regional reconstruction of long-term temperature and hydroclimate variability in the data-sparse southern Indian Ocean region.


Antarctica and the southern high latitudes play a critical role in the global climate system through polar–tropical teleconnections (Li et al., 2021; Yuan et al., 2018) and the modulation of meridional transport of heat (Trenberth and Caron, 2001; Turner et al., 2014). Despite the global importance of Antarctica to the climate system, direct observations of Antarctic climate are largely restricted to the satellite era (1979–onwards; Jones and Lister, 2015) and limited longer-term data from permanent land-based stations (Turner et al., 2005, 2020). The short observational window limits our ability to understand the natural variability in Antarctic climate at decadal to millennial scales. As such, it is necessary to employ paleo-climate archives to extend observational records and better constrain natural variability. Ice cores have been utilised across the continent to provide both low-resolution records of glacial–interglacial cycles and high-resolution records of interannual climate variability (e.g. Augustin et al., 2004; Stenni et al., 2017). Coastal or near-coastal ice cores located in regions of high accumulation are increasingly being used to help frame modern anthropogenic warming in the context of natural climate variability in Antarctica, as these can provide annually resolved records capable of recording interannual to decadal fluctuations in the climate (e.g. Thomas et al., 2009; Jones et al., 2016; Stenni et al., 2017).
Water stable isotope ratios in ice core records (δ18O and δD) are routinely used to reconstruct past temperature variations across Antarctica (e.g. Dansgaard, 1964; Stenni et al., 2017). Fractionation of water isotopes occurs as heavy isotopes are preferentially removed as air masses are transported poleward, leading to a strong spatial isotope–temperature relationship across Antarctica (Lorius et al., 1969; Masson-Delmotte et al., 2008). However, water isotope records are not solely controlled by site temperature. Source region conditions (Markle and Steig, 2022), transportation pathways (Markle et al., 2012; Jouzel et al., 1997), and post-depositional effects (Casado et al., 2018) also influence the water isotope record, leading to complications in interpreting the climate signature captured by stable water isotopes in ice cores. Similarly, water isotopes primarily reflect conditions during precipitation events and can be strongly affected by the intermittency of precipitation. This can result in potential signal bias where climate during certain synoptic conditions is preserved and recorded in the accumulated snowfall, which may not necessarily be representative of the mean climatology (Turner et al., 2019; Sime et al., 2009; Casado et al., 2020; Münch et al., 2021).
Snowfall across Antarctica manifests as a combination of frequent small events and infrequent large events. We refer to the infrequent large events as extreme precipitation events (EPEs) and define these as representing days where daily snowfall amount is in the 90th percentile or higher, which is consistent with the previous definition from Turner et al. (2019). Although infrequent, EPEs can contribute a significant amount of the annual snowfall at a particular site and are the primary drivers of seasonal and interannual accumulation variability in many regions of Antarctica (Turner et al., 2019). The water isotope record from ice cores is primarily an archive of climate conditions present during precipitation, thus it is critical to understand the biases introduced to the record due to variability in EPEs and precipitation intermittency. At a continental scale, more than 40 % of total precipitation can be attributed to EPEs (Turner et al., 2019). In many coastal regions, where orography exerts stronger controls on the transport of marine air masses inland, EPEs can have an even larger impact. For example, in the Amery Ice Shelf region, on average 60 % of annual snowfall accumulates during only 10 d each year (Turner et al., 2019). Similarly, at Aurora Basin North, an ice core site located on the East Antarctic Plateau approximately 500 km inland from the coastal station Casey, it is estimated that half of the annual precipitation occurs during only 10 % of days (Servettaz et al., 2020).
Atmospheric rivers are a subset of EPEs and can greatly influence the total annual accumulation. In Antarctica, these occur when there is a narrow band of strong horizontal water vapour transport which brings warm, moist air from the low latitudes and mid-latitudes of the Southern Hemisphere to the cold Antarctic region. A study by Wille et al. (2021) identified that 25 %–35 % of all EPEs (when applying a definition of the 90th percentile) in Antarctica can typically be classified as atmospheric rivers. This percentage increases when more stringent classifications are imposed on EPEs. Similarly, Adusumilli et al. (2021) found that 37 %–55 % of all EPEs in 2019 (here defined as 95th percentile) on the West Antarctic Ice Sheet could be attributed to atmospheric rivers. In 2009 and 2011, Princess Elizabeth Station in Dronning Maud Land received 74 % and 80 % of total annual snowfall, respectively, from a series of atmospheric river events, resulting in anomalously high snowfall in these years (Gorodetskaya et al., 2014).
Annually resolved ice core records are a critical tool for improving our understanding of natural variability in the Earth's climate (Stenni et al., 2017). However, there are currently only a few published records from long (multi-centennial), high-resolution ice cores in the Indian Ocean sector of Antarctica, which covers a broad region between Enderby Land and Wilkes Land in East Antarctica (67–160∘ E; Delmotte et al., 2000; Ekaykin et al., 2017; Stenni et al., 2017). Previous work on the Law Dome ice core trace chemistry record has indicated that there are strong teleconnections between the southern Indian Ocean climate and Australian hydroclimate (Udy et al., 2021). The Law Dome snow accumulation record (Roberts et al., 2015) has been used to reconstruct rainfall across southwestern Western Australia, indicating that current drying in the region is unusual but not unprecedented over the past 2000 years (Zheng et al., 2021; van Ommen and Morgan, 2010). Similarly, there is a strong correlation between concentrations of aerosol sea salts during summer snowfall at Law Dome with rainfall in eastern Australia (Vance et al., 2013, 2015; Udy et al., 2022). This relationship has been used to highlight the increased drought risks in eastern Australia associated with positive phases of the Interdecadal Pacific Oscillation and the potential for megadroughts much longer than any historically observed drought in this region (Vance et al., 2015, 2022).
An extensive site-selection study by Vance et al. (2016) identified Mount Brown South (69.11∘ S 86.31∘ E, 2084 m elevation) as a promising location for a new ice core that would likely provide unique climate signals and be complementary to the Law Dome ice core record. The authors also suggest that an ice core collected from Mount Brown South would contain strong teleconnections to the mid-latitudes of the southern Indian Ocean. In 2017/2018, a series of four ice cores were drilled at this site, including a 295 m long main ice core record, which is estimated based on a current age scale in development to extend back 1200 years. Early investigations into the record by Crockart et al. (2021) demonstrated that the ice core preserves an annually resolved climate history that differs from the Law Dome record, with a clear signal of mid-latitude Indian Ocean atmospheric variability in annual sea salt concentrations relating to the El Niño–Southern Oscillation.
In this study, we investigate how the synoptic climate conditions associated with extreme precipitation at the Mount Brown South site impact the ice core record. Firstly, we investigated seasonal and interannual variability in precipitation and extreme precipitation events using data from ERA-5. Secondly, we identified geopotential height and temperature anomalies associated with extreme events using ERA-5. Thirdly, we discuss how temperature anomalies associated with extreme precipitation lead to a temperature bias in the Mount Brown South water isotope record.
2.1 Mount Brown South ice core site properties, analysis, and timescale
2.1.1 Site description
During the 2017/2018 Australian Antarctic Program (AAP) field season, four ice cores were drilled at 69.11∘ S 86.31∘ E, south of Mount Brown in Wilhelm II Land and in East Antarctica, at an altitude of 2084 m a.s.l. (Fig. 1). Ice thickness at this location is approximately 2000 m. The drill site (hereafter referred to as Mount Brown South or MBS) is located approximately 380 km east from Australia's Davis Station and approximately 1000 km west of Law Dome. The four cores included a 295 m long core (hereafter referred to as MBS-Main) and three short surface cores (MBS-Alpha, MBS-Bravo, and MBS-Charlie), which were each 20–25 m in length. MBS-Main was drilled from 4 m below the snow surface using a Hans Tausen drill (Johnsen et al., 2007; Sheldon et al., 2014), and MBS-Alpha, MBS-Bravo, and MBS-Charlie were all drilled from the surface using a Kovacs drill. The MBS site is located approximately 15 km from where a series of firn cores were drilled between 1997–1999 (Foster et al., 2006; Smith et al., 2002).
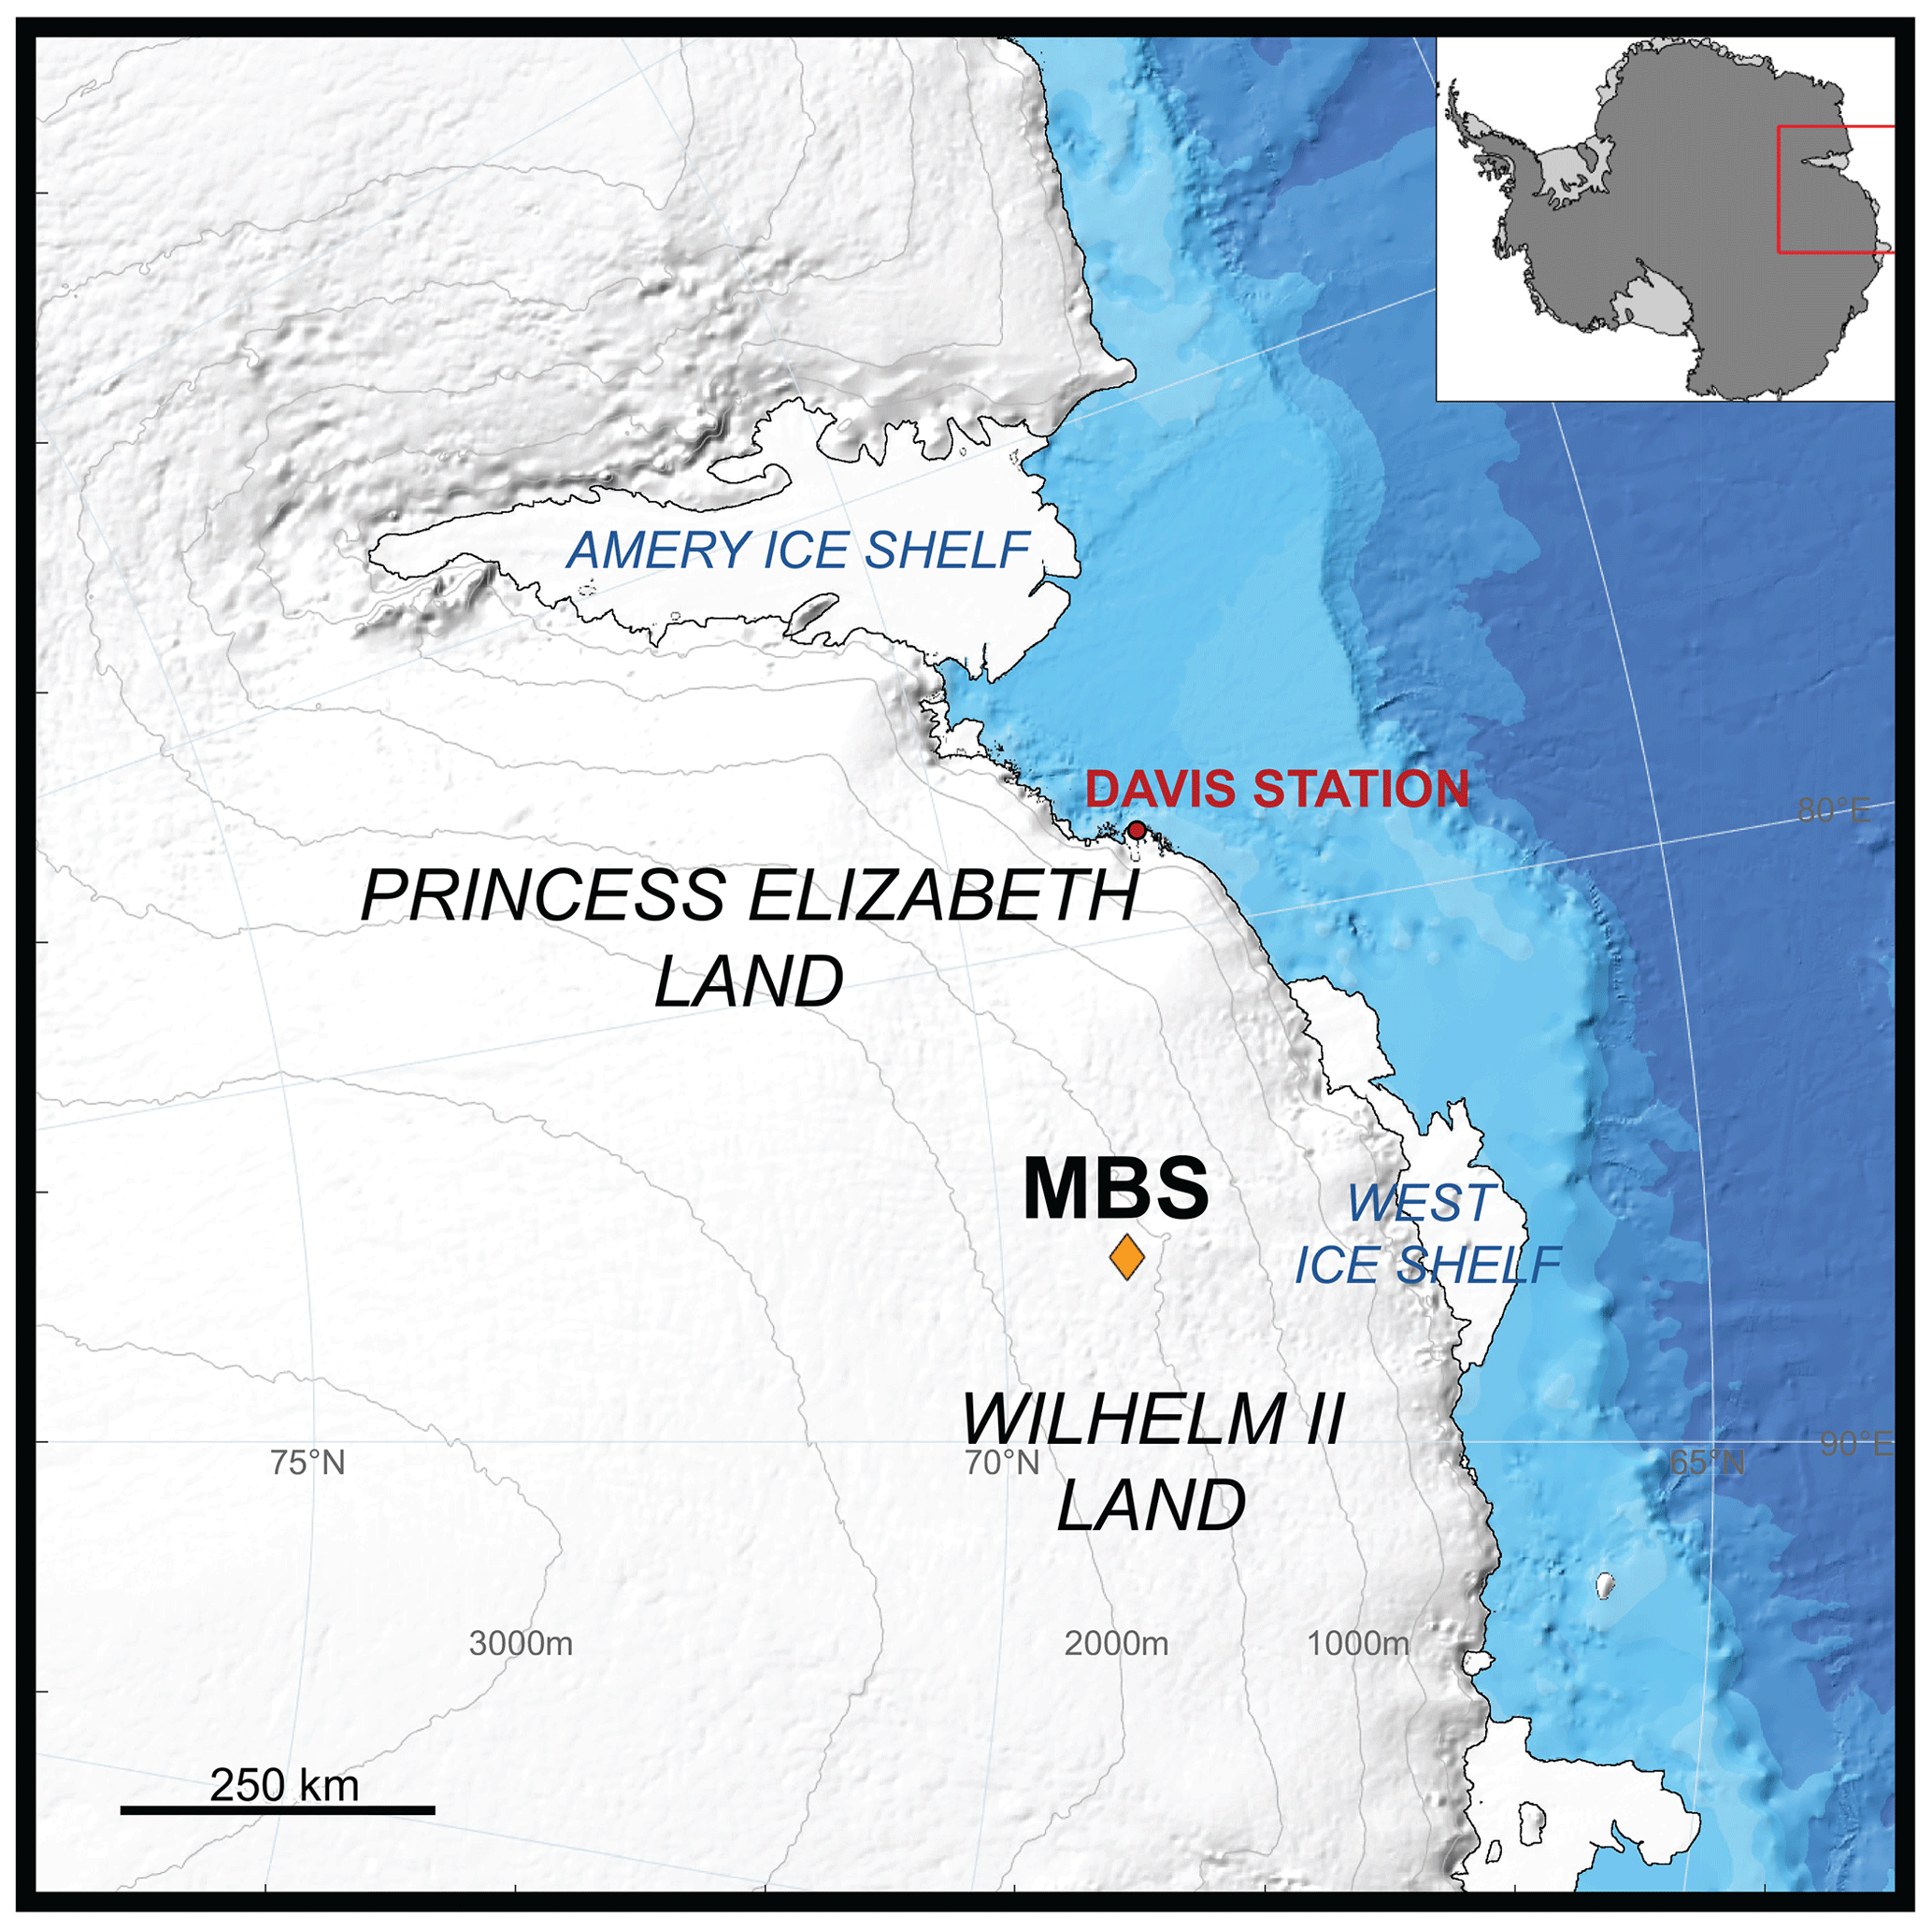
Figure 1The Mount Brown South (MBS) ice core drill site, located in Wilhelm II Land in East Antarctica. The location of the drill site is indicated by the yellow diamond. The map was produced using Antarctic Mapping Tools (Greene et al., 2017) with ice sheet elevation data from Bedmap2 (Fretwell et al., 2013) and bathymetric data from IBSCO (Arndt et al., 2013).
The four cores were cut into 1 m long sections on site and stored in individual low-density polyethylene (LDPE) Poly bags. The cores were transported by helicopter from the drill site to freezer storage at Davis Station and then transported by ship to Hobart. The ice cores were stored in the Australian Antarctic Division commercial cold storage facility and further processing and analysis was completed at the Institute for Marine and Antarctic Studies (IMAS) in Hobart.
2.1.2 Ice core analyses
The MBS-Main and MBS-Charlie ice cores were cut into discrete samples for water isotope analysis. Analyses for MBS-Main are complete, and a full age scale is being prepared for publication. The upper 4–20 m of MBS-Main and 0–20 m of MBS-Charlie will be discussed in this paper, as these sections overlap with the modern satellite era (1979–present) and have been analysed for water isotopes. For MBS-Main, 3 cm samples were cut and analysed for the 4–16 m section, and 1.5 cm samples were analysed for 16–20 m section. MBS-Charlie was cut uniformly into 3 cm samples; 3 cm sampling yields a mean sample resolution of 10 samples per year. The higher-resolution sampling (1.5 cm) yields a mean sample resolution of 20 samples per year, but due to the effects of diffusion on the stable water isotope record, this increased time resolution does not result in enhanced signal preservation.
The MBS-Main samples were initially analysed for deuterium isotope (δD) and oxygen isotope (δ18O) ratios by cavity ring-down spectroscopy using a Picarro L2130-i water isotope analyser in Hobart. The analysed samples were refrozen and stored at −18 ∘C and later transported frozen to the Australian National University (ANU) in Canberra, and initial analyses were made on MBS-Charlie (not previously measured at IMAS). At the ANU, samples were remelted and reanalysed on a Picarro L2140-i. There is excellent inter-laboratory agreement between δD and δ18O from the initial measurements in Hobart and the repeat measurements at the ANU, which gives confidence that fractionation was negligible during the melting and refreezing processes in the laboratories (r>0.99 for all parameters).
Discrete chemistry analyses of MBS-Main core, MBS-Charlie, and MBS-Alpha were also conducted at IMAS on 3 cm resolution samples. The MBS-Bravo core was collected exclusively for persistent organic pollutant analyses that are still ongoing and therefore will not be discussed as part of this study. Analyses of anions and cations were performed using a Thermo-Fisher/Dionex ICS3000 ion chromatograph. A detailed discussion of the discrete chemistry analyses can be found in Crockart et al. (2021) with data available from Crockart (2020).
2.1.3 Ice core dating
Details of the dating procedures and accumulation calculations for the short cores and upper section of MBS-Main can be found in Crockart et al. (2021). Chemical species with clear seasonality (i.e. non-sea-salt sulfate (nssSO), sodium (Na+), and the ratio of sulfate to chloride ()) were used in conjunction with water isotope measurements to identify annual layers in MBS-Alpha, MBS-Charlie, and the upper portion of MBS-Main. Annual summer horizons were aligned with the sea salt (Na+) minima and maxima in the nssSO and ratio. Sea salt minima during the summer months reflect the reduced sea salt aerosol input due to reduced storminess in the Southern Ocean (McMorrow et al., 2004). In contrast, the summer peaks in nssSO and reflect enhanced biological productivity during the summer months, with the oxidation of biologically produced dimethyl sulfide representing the major SO source external to sea salts (Kaufmann et al., 2010). Layer thicknesses were combined with an empirical density model to determine annual ice-equivalent snow accumulation rates.
The Pinatubo eruption (mid-1991) was identified as a peak in nssSO in all cores and was used as a marker to confirm the accuracy of layer counting. Weak seasonality in the years preceding the Pinatubo eruption (1986–1990) introduces an estimated dating uncertainty of ±3 years at the base of the ice core sections considered here (1979–2016).
2.2 Reanalysis data
2.2.1 ERA-5
Output from the reanalysis product ERA-5 (produced by the European Centre for Medium-Range Weather Forecasts) was used to investigate the climatic conditions associated with extreme precipitation events at MBS. ERA-5 provides hourly data at resolution for a number of atmospheric, sea-based, and land-based processes from 1950 onwards. The quality of the data is improved from 1979 as satellite-based measurements help to reduce uncertainties in the observational data. This is particularly true for the data-sparse southern high latitudes; hence, we only consider the period from 1979 to 2016 in our analyses.
Daily total precipitation (P) was extracted for the grid cell containing the MBS ice core site. To maintain consistency with previous studies on extreme precipitation events (EPEs; Turner et al., 2019), a precipitation day was identified when total daily precipitation exceeded 0.02 mm w.e. (water equivalent). EPEs were classified as those exceeding the 90th percentile of all precipitation days at MBS, as defined by Turner et al. (2019). According to this definition, an EPE at MBS is any day where daily precipitation exceeds 3.2 mm d−1 w.e.
Daily mean 500 hPa geopotential height and daily mean 2 m air temperature were extracted from ERA-5 for the entire region south of 40∘ S (Hersbach et al., 2023a, b). Geopotential height and 2 m temperature anomalies were calculated for each day relative to the seasonal average for that day. We calculate the seasonal average as the mean value for each day from 1979 to 2016, with a 30 d rolling mean filter applied across daily mean values to obtain a smoothed seasonal record (Servettaz et al., 2020).
ERA-5 has been demonstrated to reproduce observational data well over many regions of Antarctica (Tetzner et al., 2019; Zhu et al., 2021). To confirm the validity of ERA-5 temperature data for this location, we compared ERA-5 temperature measurements to temperature measurements from a nearby automatic weather station (AWS) (Allison and Heil, 2001). The AWS is 19 km from the ice core site (69.13∘ S, 86.00∘ E) at an elevation of 2067 m. Hourly temperature data are available from the AWS from 2003 to 2008. Comparisons of monthly mean temperature from ERA-5 for the nearest grid cell to the AWS indicate that ERA-5 is able to reproduce the AWS temperature observations well (r=0.97, p<0.001). There is a warm bias in the ERA-5 data (mean difference of 0.75 ∘C; Fig. A2), which may be due to localised temperature effects at the AWS that are not resolved by ERA-5.
2.2.2 Atmospheric river identification
Atmospheric rivers (ARs) represent a subset of EPEs. As atmospheric rivers are typically associated with strong meridional transport, warm temperature anomalies, and extreme snowfall, we would expect these events to be especially impactful on mean annual accumulation and water isotope records in ice cores. Many methods have been developed to identify atmospheric rivers; however, we choose here to compare to published catalogue of ARs from Wille et al. (2021), which has been specifically tuned for identification of atmospheric river events in the high southern latitudes. This method uses integrated vapour transport (vIVT) data from the Modern-Era Retrospective analysis for Research and Applications, Version 2 (MERRA-2), to identify grid cells that are at or above the 98th percentile of all monthly vIVT values, which are classified as an atmospheric river if they extend for at least 20∘ latitudinally. We note that the method used to detect ARs used here relies on a different reanalysis product to that used throughout the paper (ERA-5). This may result in some differences in the identification of EPEs and ARs; however, a catalogue of ARs based on ERA-5 is not currently available.
2.3 HYSPLIT back-trajectory modelling
2.3.1 Model description
The Hybrid Single-Particle Lagrangian Integrated Trajectory model (HYSPLIT) was developed by the National Oceanic and Atmospheric Administration's (NOAA) Air Research Laboratory as a tool for constructing 3-D air parcel trajectories (Stein et al., 2015). Here, we use HYSPLIT to generate 5 d back-trajectories (120 h), originating at the MBS site at a height of 1500 m a.g.l. (above ground level), which is equivalent to approximately 3500 m a.s.l. HYSPLIT was developed to be forced using meteorological conditions defined by the NCEP–NCAR reanalysis product, although boundary conditions may also be defined by different reanalysis products, with ERA-Interim frequently being used. However, the software is formatted to readily utilise NCEP–NCAR datasets, while other reanalysis products require reformatting. Sinclair et al. (2013) compared the difference in back-trajectories for an ice core site in the Ross Sea region of Antarctica forced by both ERA-Interim and NCEP–NCAR and found the results comparable. As such, for this study the meteorological parameters in the HYSPLIT model were forced using the more readily applied NCEP–NCAR Global Reanalysis data (Kalnay et al., 1996). Daily trajectories were generated from 1 January 1979 to 31 December 2019, resulting in a total of 14 610 back-trajectories.
A previous investigation into the uncertainties associated with HYSPLIT back-trajectory modelling have estimated errors of 15 %–20 % for 5 d back-trajectories (Scarchilli et al., 2011). The 5 d back-trajectories used in this study likely do not capture the full range of moisture sources. However, increasing the trajectory length leads to increases in the error associated with the calculations. The 5 d back trajectories are used here to provide a balance between estimating moisture sources and transportation pathways while minimising the error associated with these calculations.
2.3.2 HYSPLIT clustering
Individual trajectories were clustered using HYSPLIT's inbuilt clustering algorithm, which aims to minimise inter-cluster variability while maximising intra-cluster variability for a user-defined number of clusters (Stein et al., 2015). Due to computational limitations, the full dataset was clustered at 2 d resolution (7160 trajectories) using points at 4 h intervals along the trajectory. The HYSPLIT clustering algorithm requires the user to define the number of clusters, which is chosen to minimise the total spatial variance while still capturing a variety of different trajectories linked to synoptic climate conditions. We identified a total of five clusters; this number was chosen as it was the point where total spatial variance approached a minimum, but it still allowed for the identification of distinct trajectories linked to synoptic climate conditions.
3.1 Seasonal and interannual accumulation
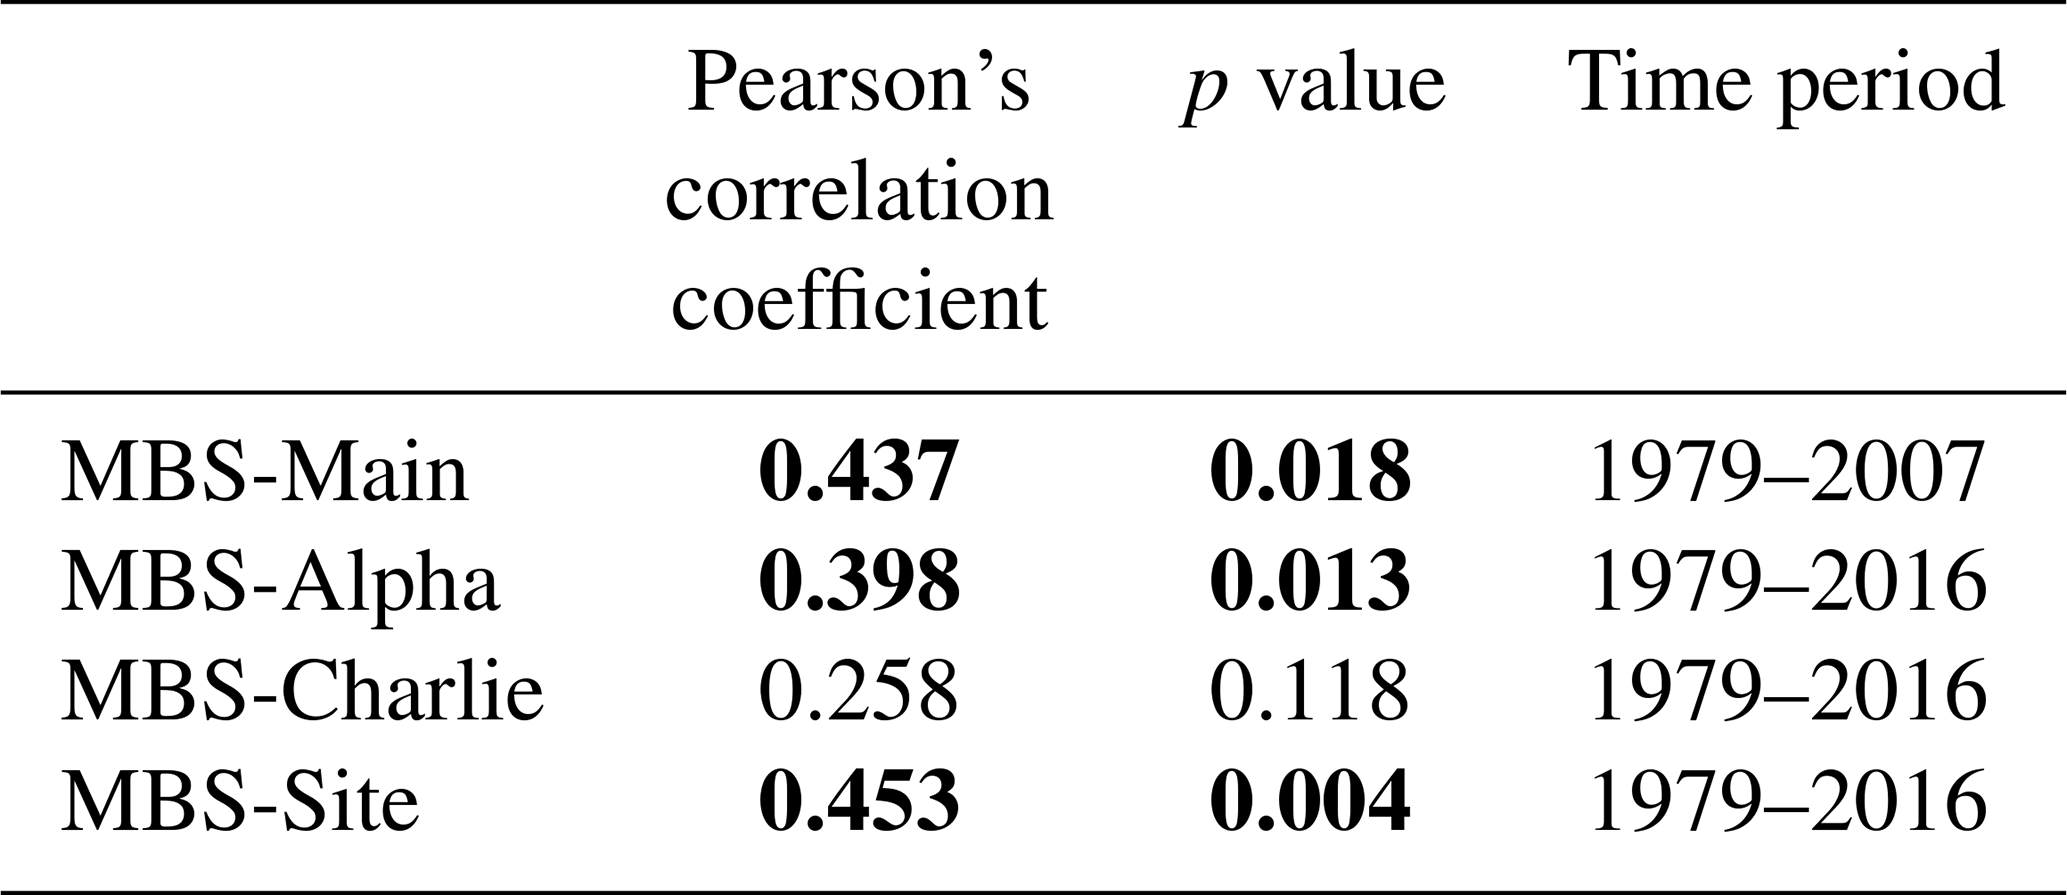
The mean annual accumulation from 1979 to 2016 at MBS from ERA-5 is 0.263±0.046 m w.e. (water equivalent) per year, with uncertainties representing 1 SD (standard deviation) (Fig. 2). The mean measured annual accumulation rates for MBS-Alpha, MBS-Charlie and MBS-Main are 0.274±0.065, 0.273±0.068, and 0.289±0.073 m w.e. yr−1, respectively. Accumulation rates have been converted to water equivalent accumulation from the original Crockart et al. (2021) data, which are presented as ice equivalent, assuming an ice density of ρ=917 kg m−3. Mean annual accumulation from ERA-5 slightly under-estimates accumulation rates derived from the ice cores; however, the annual accumulation from the model is still significantly correlated with ice core accumulation (Table 1), with the exception of MBS-Charlie, which has been previously shown to be poorly correlated with accumulation (Crockart et al., 2021). As noted in Crockart et al. (2021), there is potential for annual layers to be missed during dating, particularly during low-accumulation years. For example, model outputs identify 1993/1994 as sequential years with low accumulation (from ERA-5 in this study and in ERA-5 and MAR in Crockart et al., 2021), while accumulation measurements from MBS-Main, MBS-Alpha, and MBS-Charlie do not identify consecutive low-accumulation years during this period (Fig. 2). This introduces a degree of dating uncertainty into our accumulation measurements, which may be responsible for the poor correlation between MBS-Charlie and ERA-5 accumulation. Despite these uncertainties, MBS-Alpha, MBS-Main, and the site-averaged accumulation record are all significantly correlated with ERA-5 accumulation, and we therefore consider the model to reliably capture the interannual variability in accumulation at the MBS site.
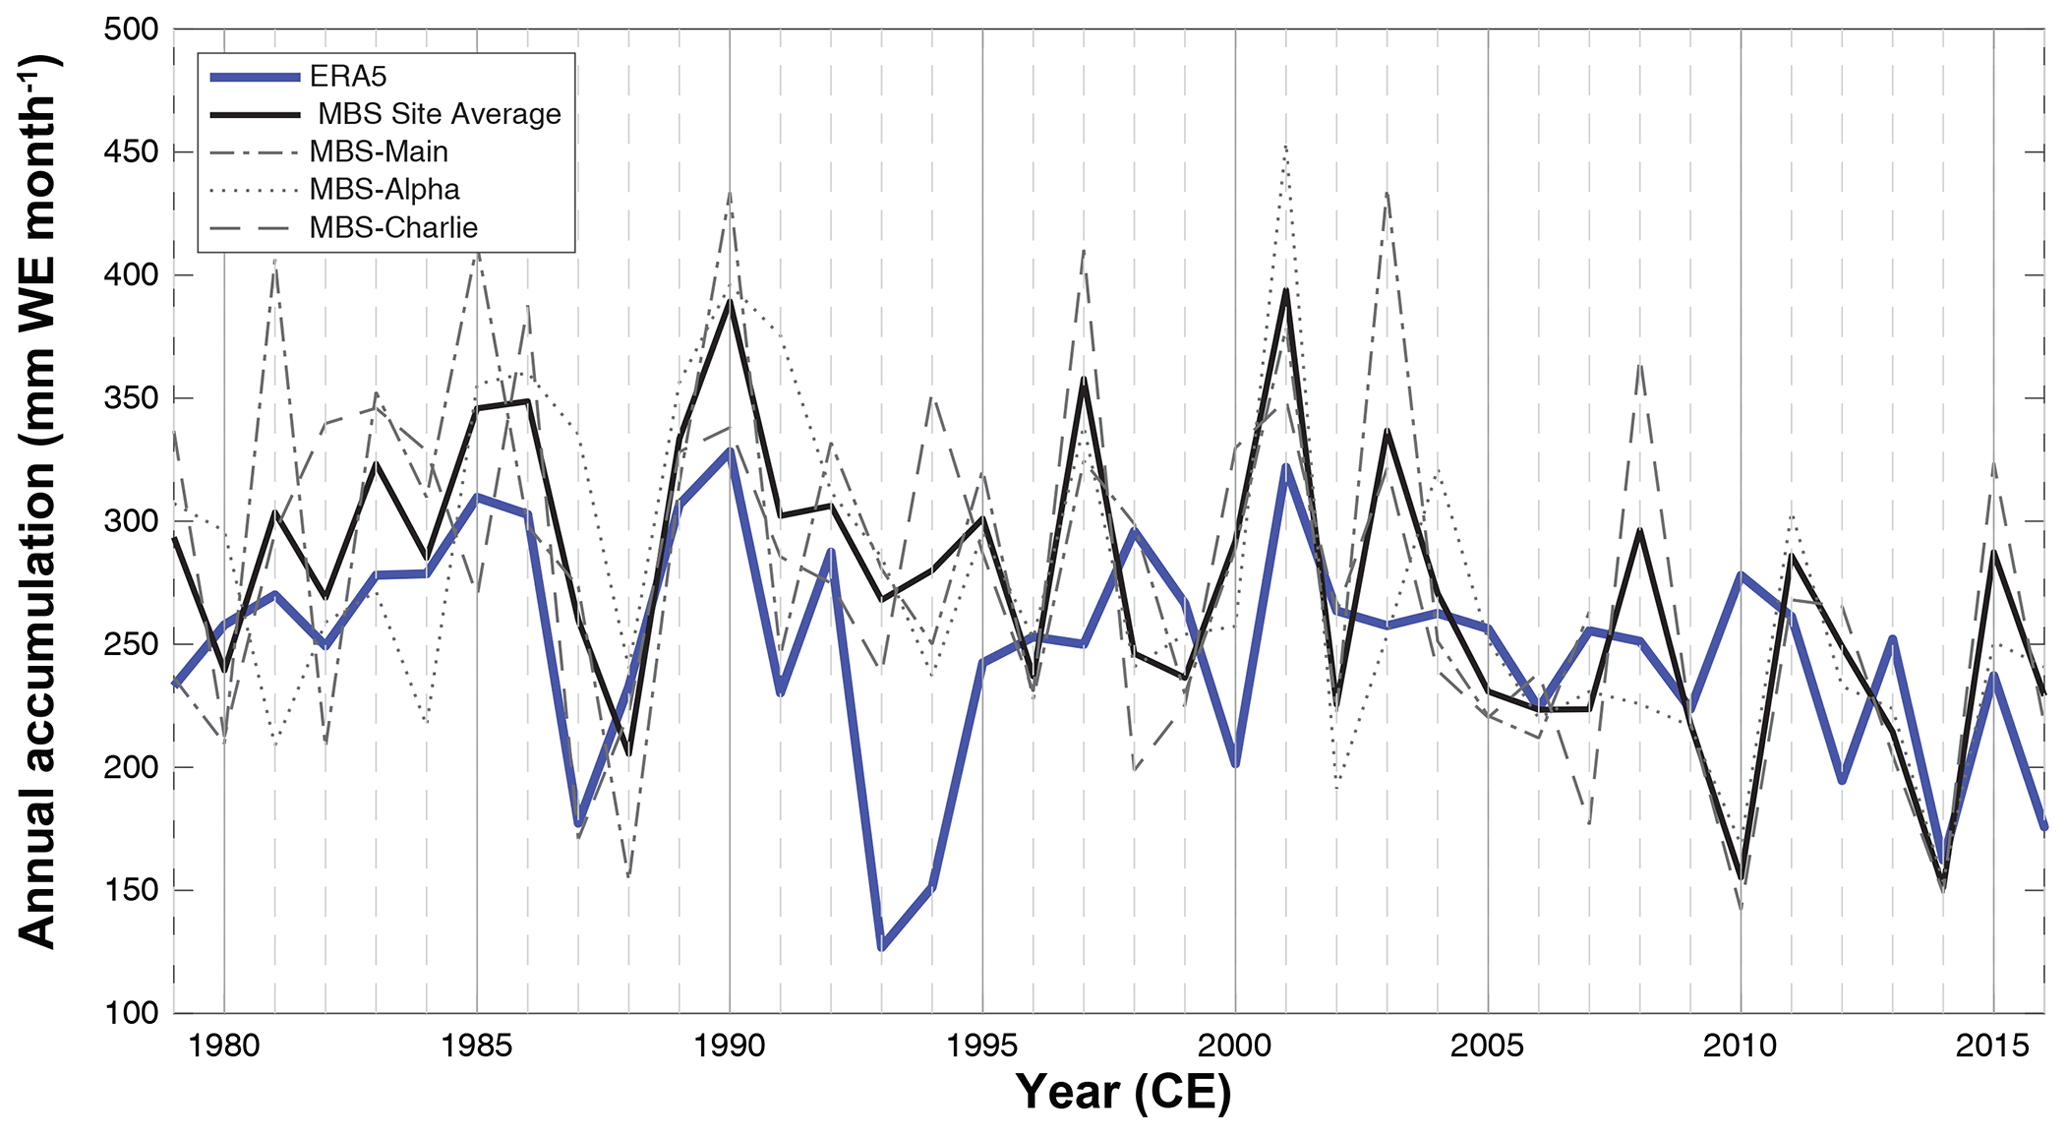
Figure 2A comparison of annual accumulation from ERA-5 (solid blue line) and the MBS ice core records. Site-averaged accumulation is shown by the solid black line, with the individual records indicated by dashed lines.
Table 1Pearson's correlation coefficient (r) and p values for mean annual precipitation from ERA-5 with the MBS-Main, MBS-Alpha, and MBS-Charlie ice cores and the ice core site average. Significant correlations (p<0.05) are marked in bold and are found for all ice cores aside from MBS-Charlie.
Previous studies have looked at spatial comparisons between observational measurements of accumulation (i.e. from ice cores or snow stakes) and model outputs. Wang et al. (2021) found that ERA-5 captures >70 % of the surface mass balance observations from Law Dome in East Wilkes Land and generally captures interannual variability across most of the Antarctic Ice Sheet. Similarly, Tetzner et al. (2019) demonstrated improved performance of ERA-5 at capturing accumulation in the Antarctic Peninsula region compared to ERA-Interim. Comparisons of surface mass estimates from ice core records across Antarctica with outputs from ERA-Interim and RACMO2.3p2 found that regional ice core accumulation composites capture 25 %–40 % of interannual regional variance in the models. In particular, composite ice core surface mass balance records from the Wilkes Land region were shown to be representative of regional surface mass balance derived from both RACMO2.3p2 and ERA-Interim. These previous studies provide further evidence that ERA-5 accurately captures accumulation variability in this region.
EPEs strongly impact the annual accumulation at MBS (Fig. 3a). There are only 22±6 EPE events per year (i.e. days where total daily accumulation exceeds 3.2 mm w.e. d−1) from 1979 to 2016 (6±2 % of days). However, these small number of days account for 52±9 % of the total annual snowfall. This implies that the synoptic conditions associated with extreme moisture transport to the ice core site will be overrepresented in annual snowfall and therefore also overrepresented in the ice core record.
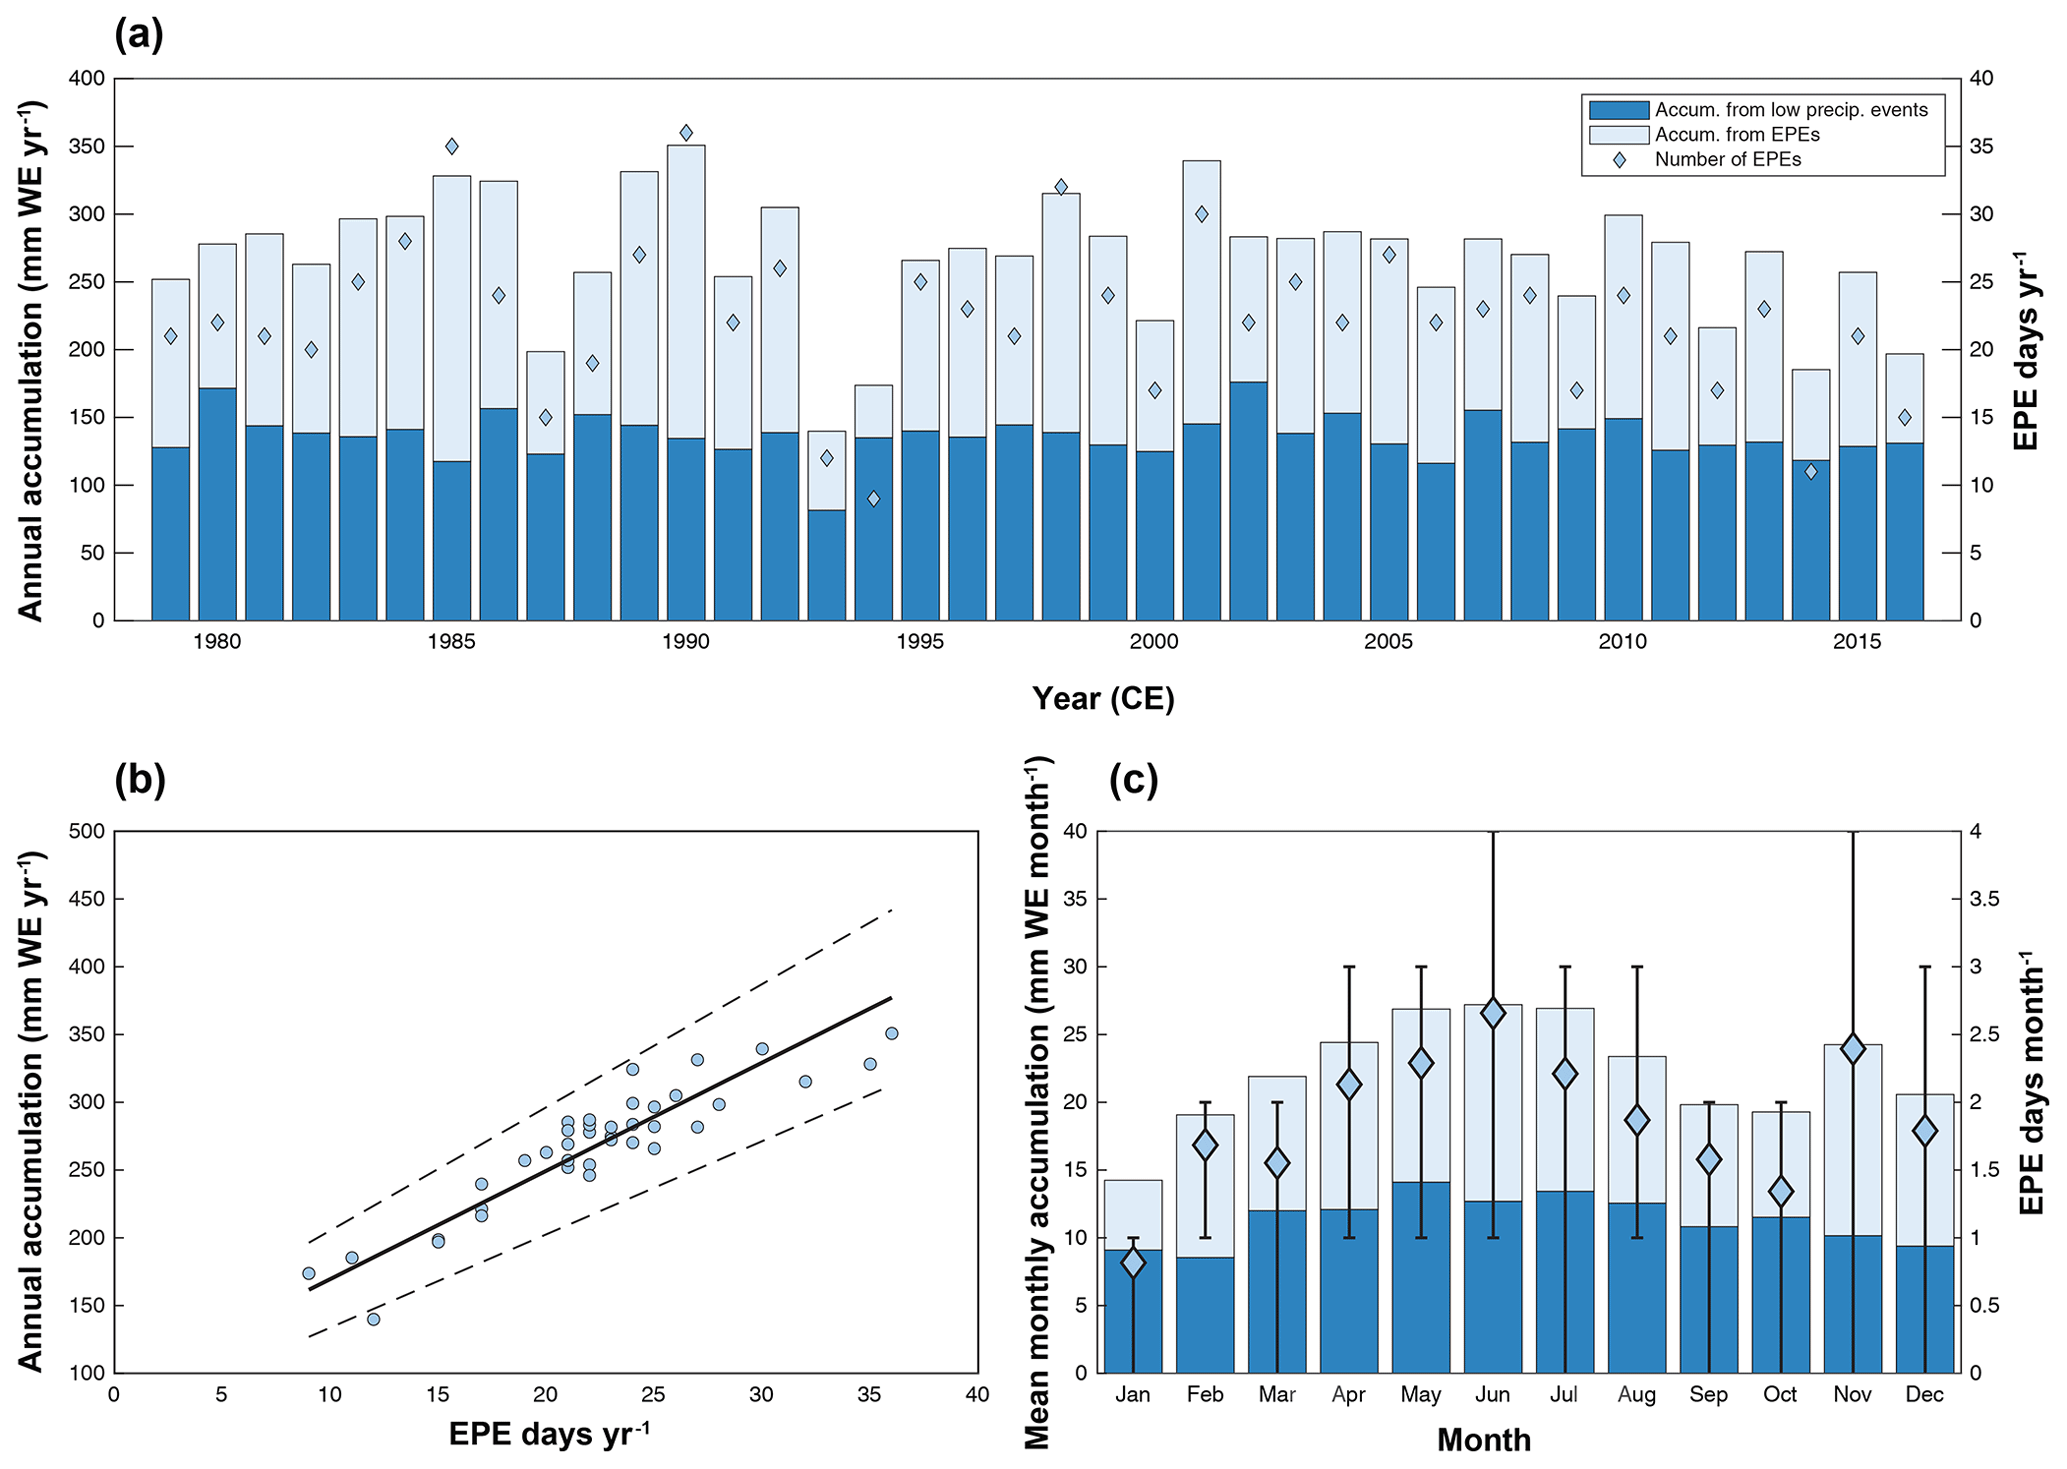
Figure 3(a) Annual accumulation at MBS from ERA-5 for 1979–2016. Accumulation from non-EPE precipitation days is shown in dark blue, and accumulation from EPEs in light blue. The blue diamonds indicate the number of EPE days in a year. (b) Annual accumulation at MBS versus number of EPE days in a year. The solid line indicates the linear regression, with dashed lines indicating uncertainty in the regression (r=0.91). (c) Mean monthly precipitation at MBS from ERA-5 for 1979–2016. Colours are the same as in (a). Blue diamonds represent the mean number of EPE days per month, with error bars indicating the upper and lower quartiles.
The highest accumulation from ERA-5 occurs during the winter months at MBS (May = 26.9 mm w.e. per month; June = 27.2 mm w.e. per month; July = 26.9 mm w.e. per month), with a secondary peak in November (24.3 mm w.e. per month) giving a bimodal character to the annual cycle of accumulation (Fig. 3c). Accumulation from non-EPE snowfall is relatively constant throughout the year (11±2 mm w.e. per month), with the seasonality largely driven by EPEs. Bimodality is observed in both the mean number of EPE days in a month and the amount of accumulation associated with EPEs. May, June, and July have 2.3, 2.7, and 2.2 EPEs per month, respectively, while November has 2.4. This results in maxima in accumulation from EPEs of 12.8 mm w.e. per month for May, 14.5 mm w.e. per month for June, 13.5 mm w.e. per month for July, and 14.1 mm w.e. per month for November. The minimum total monthly accumulation (14.2 mm w.e. per month), accumulation from EPEs (5.1 mm w.e. per month), and number of EPE days (0.8) occurs in January. A total of 84 % of the variance in monthly accumulation can be explained by variance in accumulation from EPEs (r2=0.842).
Variability in accumulation at an interannual scale is also driven by variability in EPEs (Fig. 3a and b). The contribution of smaller (i.e. not EPE) precipitation events to annual accumulation is relatively constant from 1979 to 2016 (0.136±0.016 m w.e. yr−1). In contrast, there is considerable interannual variability in both the number of EPE events in a year (22.3±5.8 d yr−1) and the amount of accumulation from EPEs in a year (0.132±0.041 m w.e. yr−1). The number of EPE days in a year is strongly correlated with both total annual accumulation (r=0.91, p≤0.001) and accumulation from EPEs (r=0.95, p≤0.001). A total of 88% of the variance in interannual accumulation can be explained by variance in accumulation from EPEs (r2=0.88).
3.2 Climatic conditions during EPEs
3.2.1 Geopotential height anomalies
It has previously been noted that extreme precipitation across Antarctica is frequently associated with geopotential height anomalies that cause atmospheric blocking, which forces warm moist air from the mid-latitudes onto the Antarctic continent (Turner et al., 2019; Servettaz et al., 2020). The 500 hPa geopotential height was investigated using ERA-5 (Sect. 2.2.1) to understand the synoptic climate conditions associated with extreme precipitation at MBS, and to determine whether similar blocking events could be identified during EPEs at this location. We calculated the mean 500 hPa geopotential height anomaly for all days that were identified as an extreme precipitation event during 1979–2016 (Sect. 2.2.1).
Extreme precipitation was on average associated with a strong positive geopotential height anomaly located at 55–65∘ S, 100–120∘ E, offshore and to the east of the ice core site. An associated weak negative pressure centre can also be identified to the west of the ice core site (Fig. 4a). The location of high-pressure system during EPEs, directly to the east of the MBS ice core site, acts to block the transport of air masses from the west. Instead, the high-pressure system induces meridional transport of warm, moist air up onto the continent, where rapid cooling can result in large precipitation events. Similar studies at other locations in East Antarctica have also demonstrated that high-pressure blocking systems located to the east of ice core sites are related to high levels of precipitation at the respective ice core sites (Servettaz et al., 2020; Turner et al., 2019; Scarchilli et al., 2011).
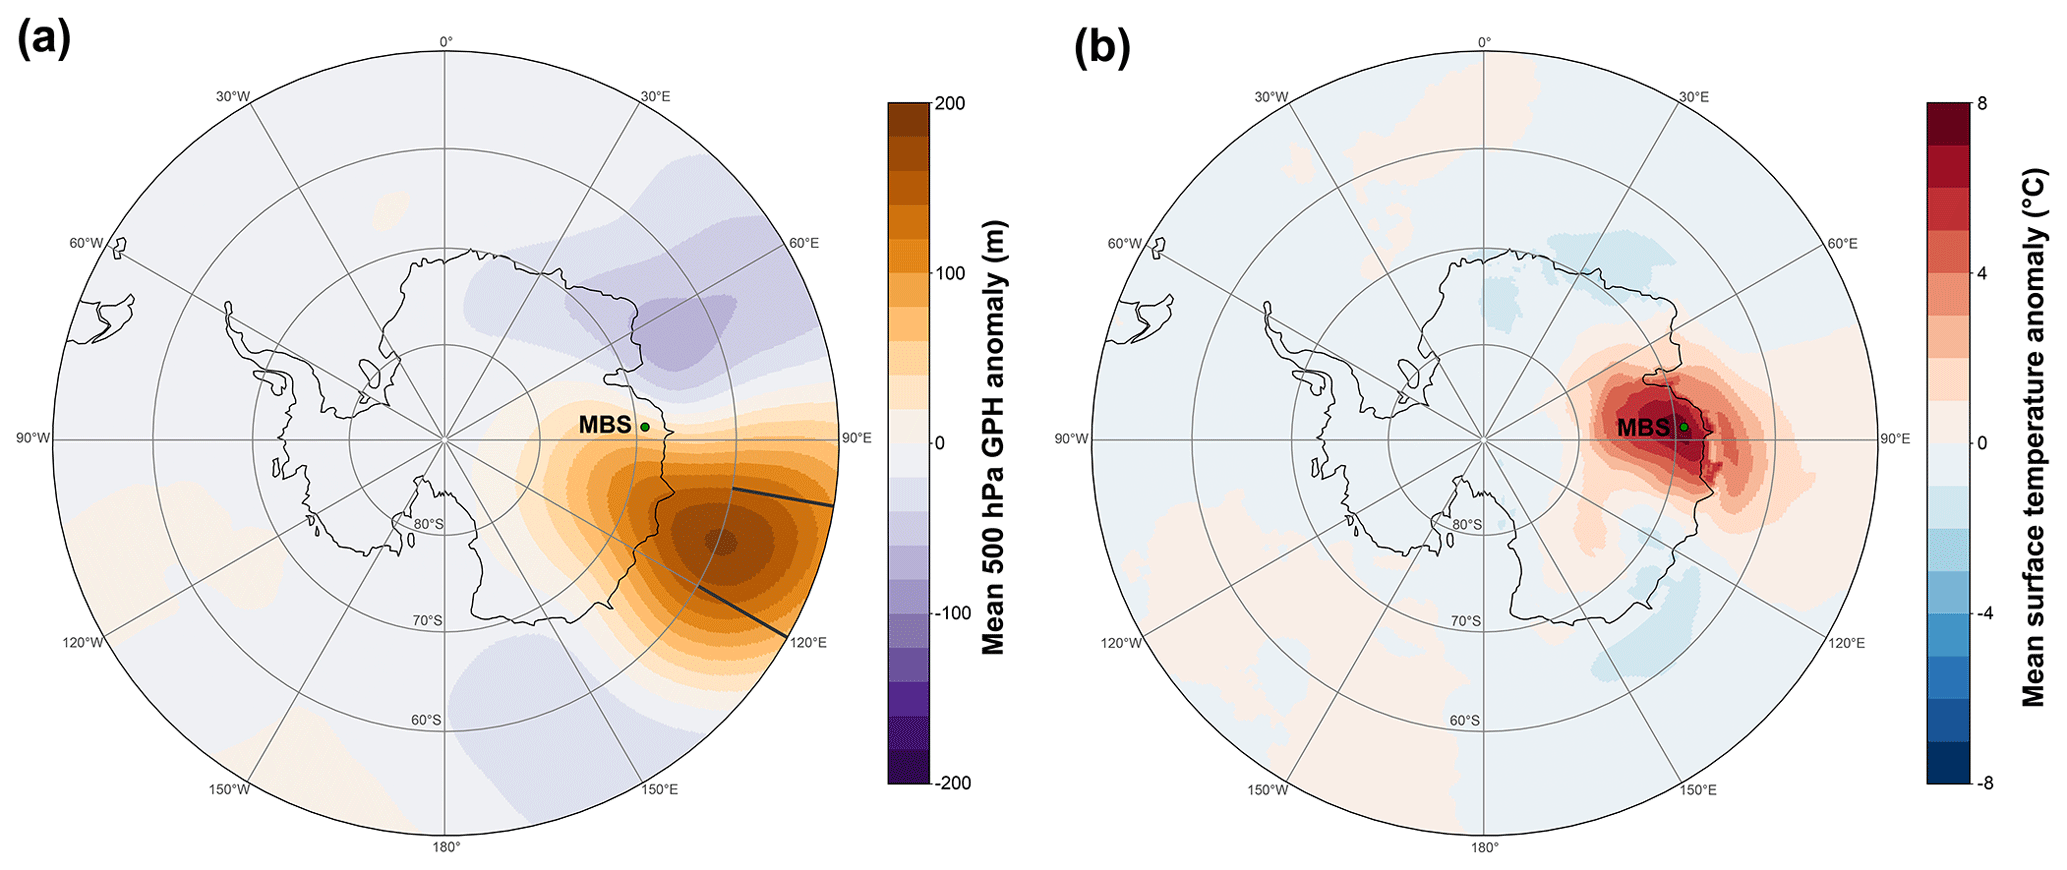
Figure 4(a) Mean 500 hPa geopotential height anomaly relative to the seasonal mean for all EPE days identified using ERA-5 from 1979 to 2016. Grey bars indicate the regions between which the blocking index is calculated. (b) Mean surface temperature anomaly relative to the seasonal mean for all EPE days identified using ERA-5 from 1979 to 2016.
3.2.2 Comparison with synoptic studies
Previous studies have categorised synoptic-scale climate conditions in the southern Indian Ocean using self-organising maps (Udy et al., 2021) and k-means clustering methods (Pohl et al., 2021). These methods utilise 500 hPa geopotential height anomalies (in Udy et al., 2021) and 700 hPa geopotential height anomalies (in Pohl et al., 2021) to identify regional-scale synoptic patterns. Synoptic type 1 (SOM1) from Udy et al. (2021) displays a geopotential height anomaly remarkably similar to that observed during extreme precipitation events at MBS, i.e. a strong positive geopotential height anomaly located to the east of the ice core site (at approximately 100–120∘ E) coupled with a low-pressure centre to the west. We filtered the self-organising maps from Udy et al. (2020) to examine the proportion of each synoptic type associated with EPEs at MBS and found that there is a strong preference for extreme snowfall to occur during SOM1 (35.2 % of EPEs occur during SOM1 – Table A2). This is consistent with the results discussed in Sect. 3.2.1, with both approaches indicating that the presence of a high-pressure system to the east of the ice core site is the primary driver of extreme precipitation at MBS.
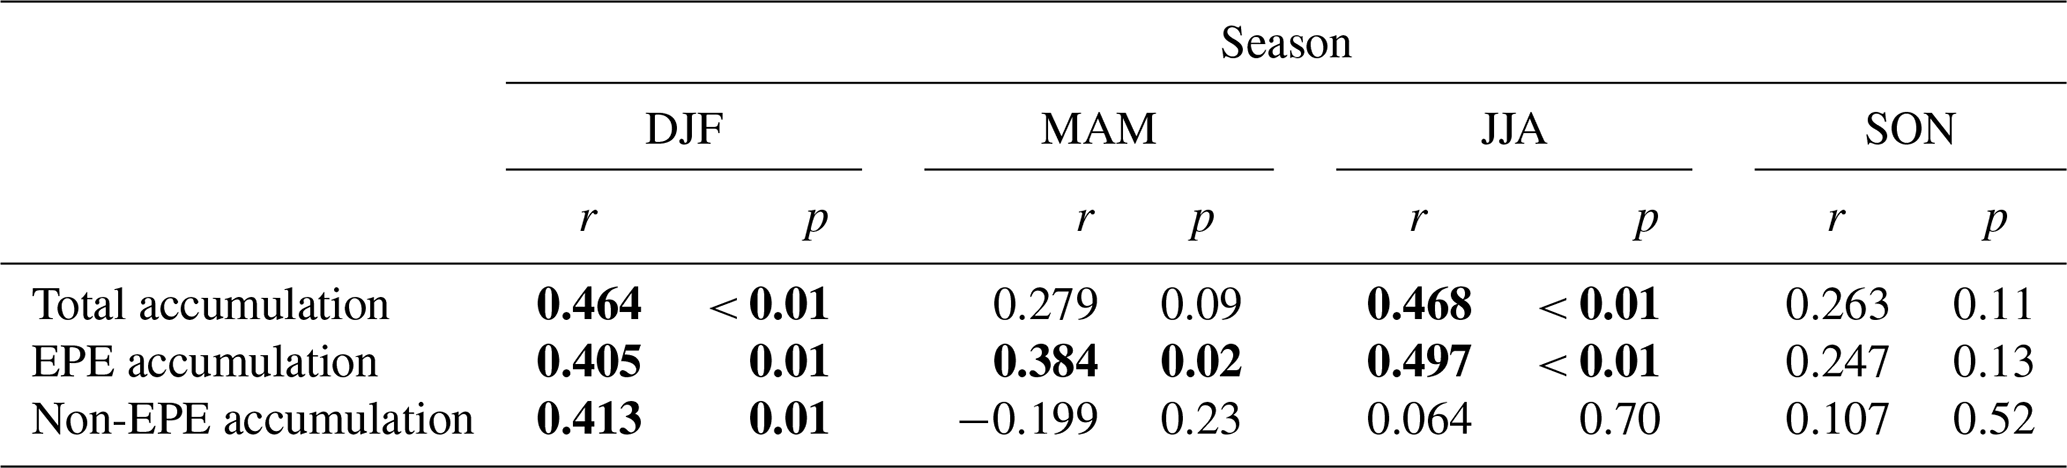
Table 2Pearson's correlation coefficient (r) and p values for the zonally averaged blocking index (100–120∘ E) with total accumulation, EPE accumulation, and non-EPE accumulation for December–January (DJF), March–April (MAM), June–August (JJA), and September–November (SON). Significant correlations (p<0.05) are shown in bold.
3.2.3 Blocking index
To investigate the impacts of atmospheric blocking on accumulation and EPEs at MBS, we compared total seasonal accumulation, EPE-associated seasonal accumulation, and non-EPE seasonal accumulation with a blocking index initially derived by Wright (1974) and later modified by Pook and Gibson (1999; Table 2). The original blocking index uses the NCEP–NCAR dataset to calculate the difference in the sum of geostrophic westerly winds at relatively low latitudes (25–30∘ S) and high latitudes (55–60∘ S) with the sum of mid-latitude westerly winds (40–50∘ S) and can be defined as follows:
where Ux represents the zonal component of mean 500 hPa wind at southerly latitude x. We adapt the index to use 500 hPa zonal wind (u component) from ERA-5 here instead to retain consistency with the datasets used throughout. A high BI value indicates either a reduction in the mid-latitude zonal winds or an increase in the high- and low-latitude zonal winds (or a combination of both) and is indicative of atmospheric blocking.
Blocking indices are calculated based on monthly mean values and are averaged to generate seasonal means. Here we calculate the blocking index between longitudes 100–120∘ E, as this is the region where we identify a positive geopotential height anomaly associated with EPEs at MBS. Seasons are identified as DJF (austral summer), MAM (austral autumn), JJA (austral winter), and SON (austral spring).
For all seasons except the austral summer (DJF), there is no correlation between smaller (non-EPE) accumulation and blocking. This indicates that small-scale precipitation events at MBS can occur regardless of atmospheric blocking and are likely due to a variety of transport mechanisms. However, during the summer months when there is reduced storminess in the Southern Ocean (Nakamura and Shimpo, 2004; Trenberth, 1991), blocking still provides an important mechanism for driving even smaller-scale precipitation.
There is a strong positive correlation between EPE accumulation and atmospheric blocking across all seasons except for the austral spring (SON), indicating that large precipitative events throughout most of the year occur in association with atmospheric blocking in the mid-latitudes. Similarly, blocking is associated with total accumulation during the austral summer (DJF) and winter (JJA) but not during the spring and autumn (MAM and SON).
This suggests that atmospheric blocking is an important mechanism for driving precipitation at MBS throughout most of the year, particularly during the summer (DJF) and winter (JJA) months. Extreme precipitation is particularly dependent on blocking conditions in the southern Indian Ocean, as indicated by the strong positive correlation between the blocking index and EPE accumulation during all seasons except for SON. A strong positive geopotential height anomaly is observed for all seasons during EPEs (Fig. A3).
3.3 HYSPLIT cluster analyses
To further investigate the circulation patterns and synoptic conditions associated with EPEs, HYSPLIT cluster analyses were used to identify how trajectory pathways are associated with EPEs.
Using HYSPLIT's inbuilt clustering algorithm, we identified five clusters that represent broad synoptic conditions for atmospheric transport to the MBS site (Sect. 2.3.2). The five clusters identified are as follows: cluster 1 is representative of locally sourced trajectories, with slow speed, a short path length, and a moderate altitude along the full path length (36.7 % of all trajectories; Fig. 5a). Cluster 2 (26.5 % of all trajectories) represents a high-altitude easterly pathway that follows the coastline of Wilkes Land. Cluster 3 (22.8 % of all trajectories) follows a high-altitude westerly pathway from the western southern Indian Ocean and coastal Queen Maud Land. Cluster 4 (9.5 % of all trajectories) represents a cyclonic pathway that originates in the southern Indian Ocean. It remains at a low altitude (<1000 m a.g.l.) for most of the pathway, before increasing in altitude as it moves up onto the Antarctic continent (Fig. 5b). The remaining 4.4 % of all trajectories are part of the trans-continental pathway defined by cluster 5.
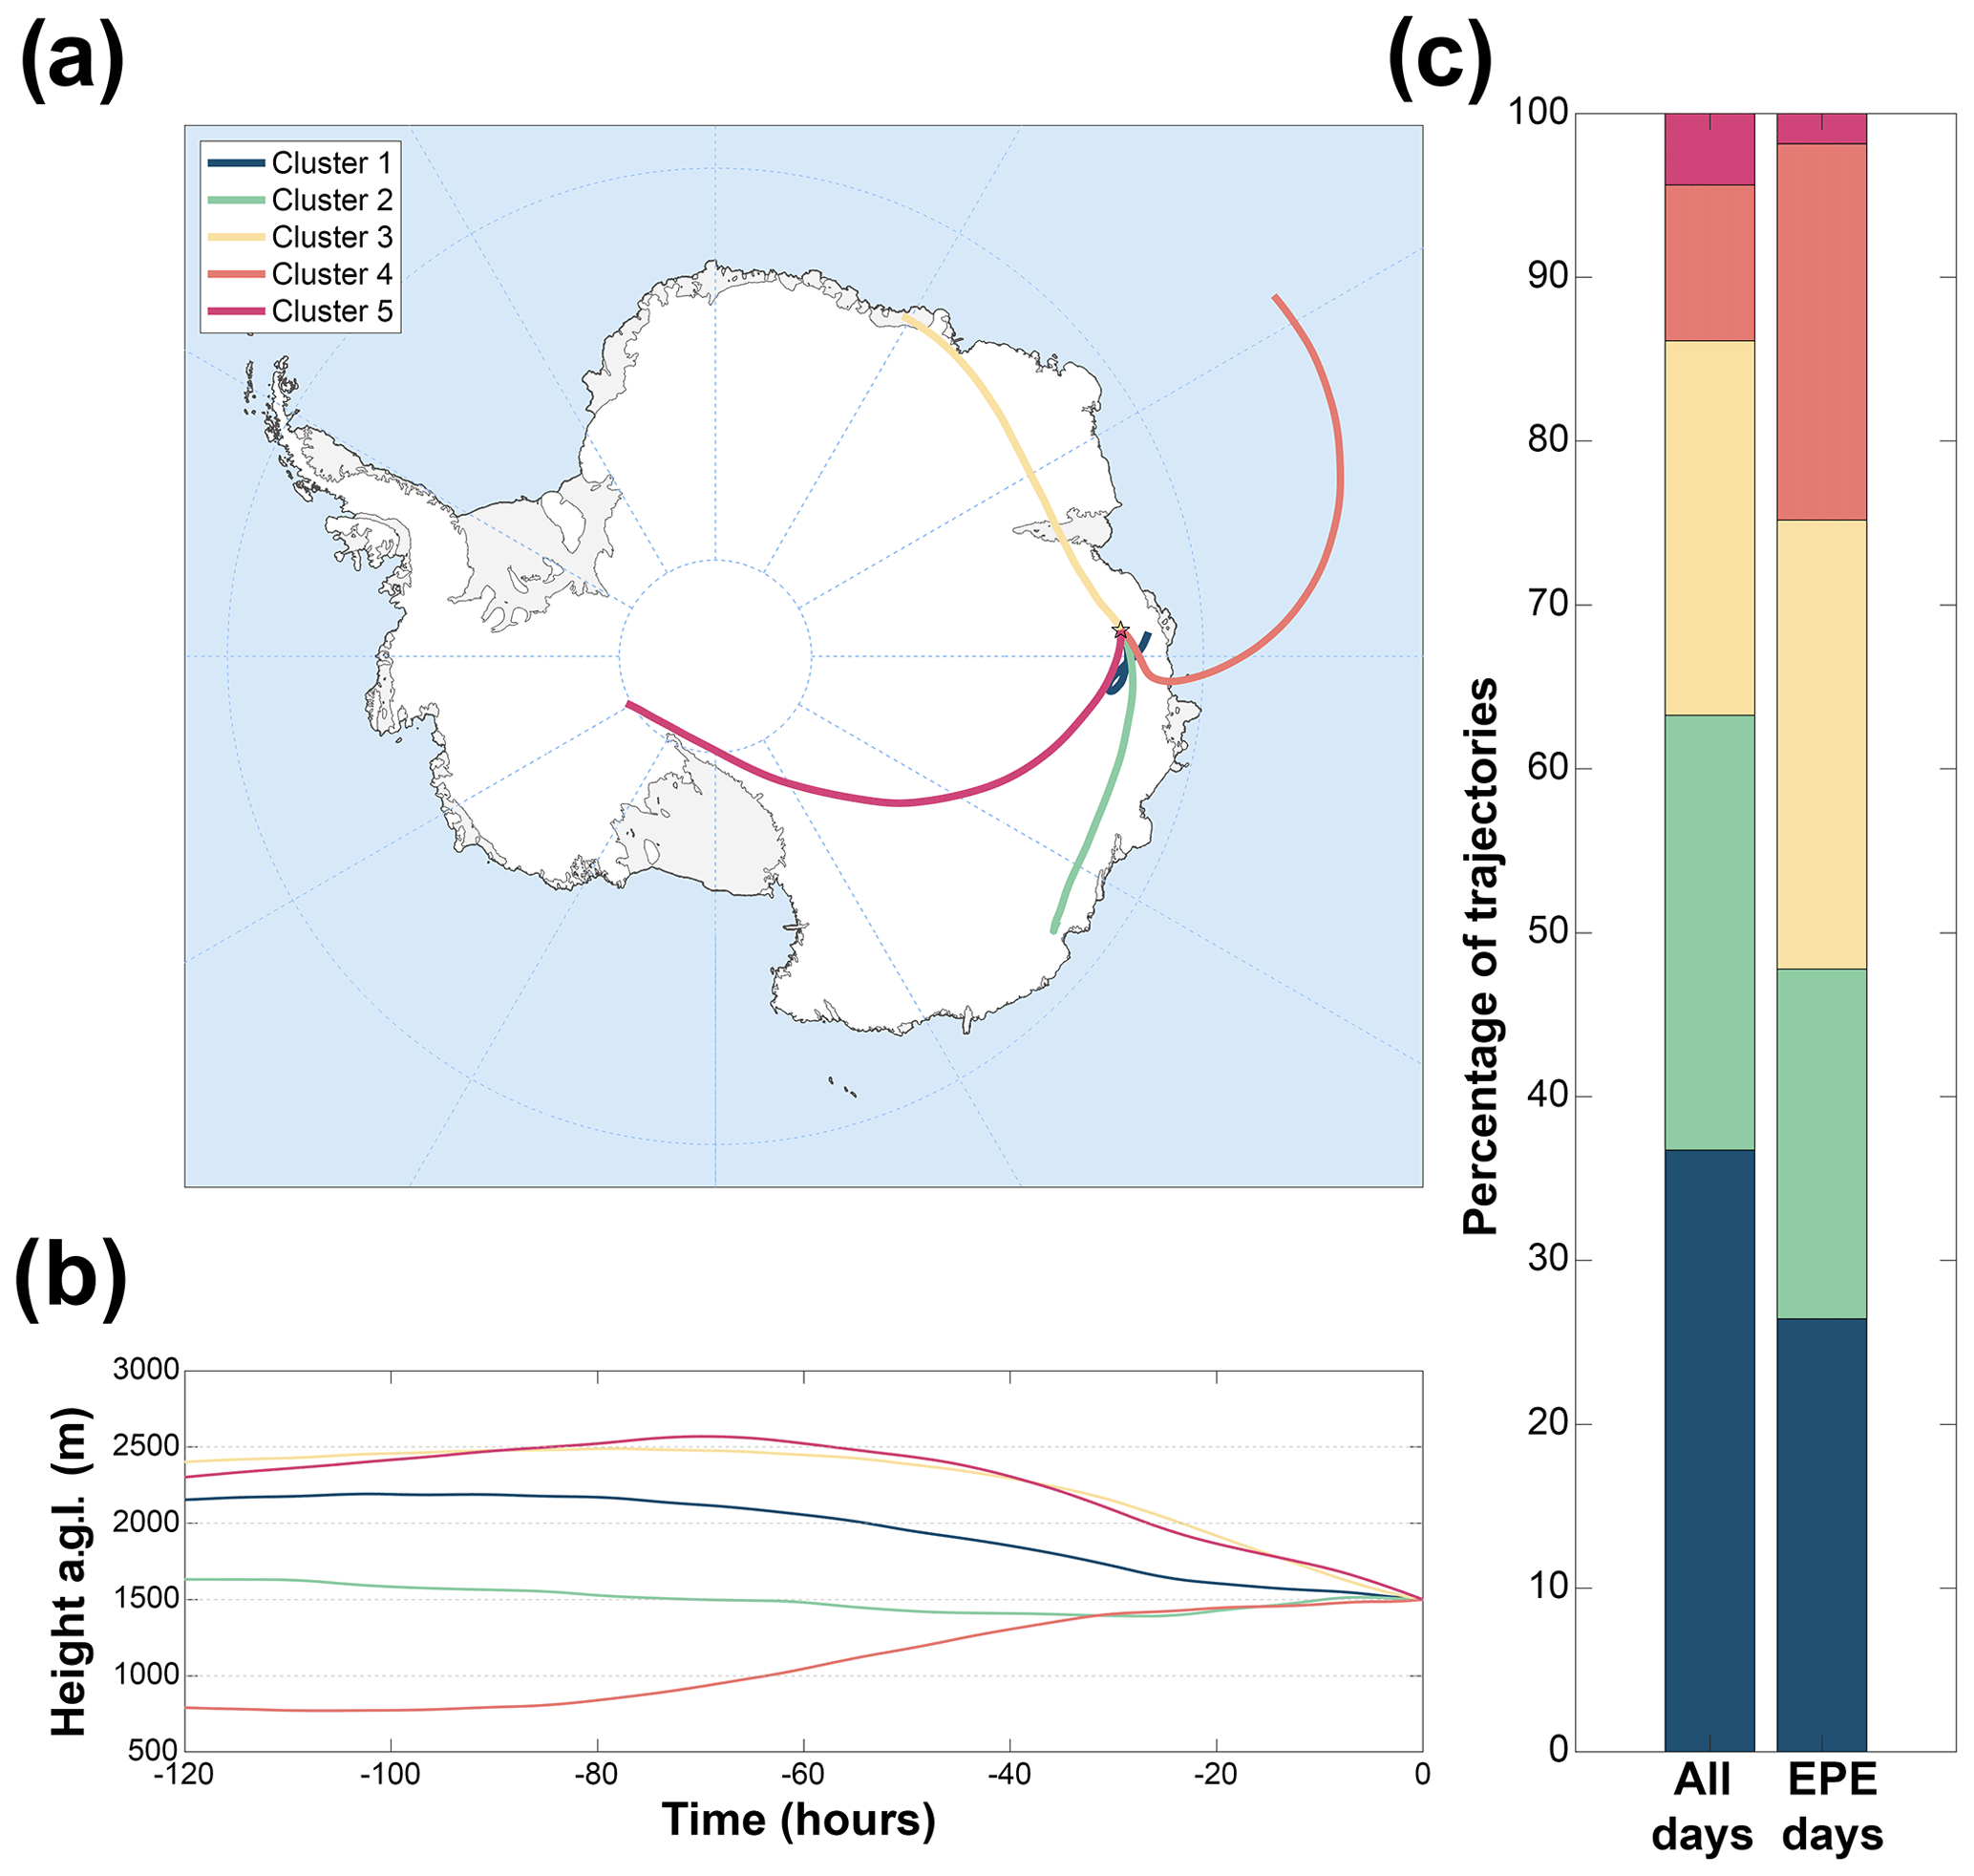
Figure 5(a) The five different clusters identified by HYSPLIT's back-trajectory clustering algorithm for all back-trajectories originating at the MBS ice core site from 1979 to 2016. The MBS ice core site is indicated by a yellow star. (b) Mean altitude of each cluster for the full 120 h back-trajectory, with time point 0 indicating the MBS ice core site. (c) Proportion of HYSPLIT back-trajectories associated with each cluster for all days from 1979 to 2016 and for days identified as an EPE from 1979 to 2016.
Clusters 1, 4, and 5 only have weak seasonality (i.e. a similar proportion of trajectories is associated with each cluster for each season). Clusters 2 and 3 show stronger seasonality. Few trajectories are associated with cluster 3 during the austral summer (2.6 % in DJF) compared with autumn (8.1 % in MAM). In contrast, there are a greater proportion of trajectories associated with cluster 2 during the austral summer (10.0 %) than the other seasons (4.4 %–6.3 %). It is important to note that the clusters represent a continuous spectrum of trajectories moving towards the MBS site rather than discrete pathways, but they still provide a useful tool for understanding the variability in moisture transport pathways.
The positive geopotential height anomaly we observe in association with EPEs suggests that snowfall associated with EPEs often originates in the mid-latitude southern Indian Ocean and is associated with strong meridional transport due to atmospheric blocking (Sect. 3.2.1 and 3.2.3). To investigate this using the HYSPLIT back-trajectories, we filtered trajectories to only include those days identified as an EPE (Table 3). When this filtering is applied, we see a shift in the percentage of trajectories associated with each cluster (Fig. 5c). There is a sharp decrease in the trajectories associated with the local pathway (cluster 1) from 36.7 % to 26.5 % and a greater than 2-fold increase in the trajectories in cluster 4 from 9.5 % to 23.0 %, which follows a cyclonic pathway from the southern Indian Ocean. There is also a weaker decrease in trajectories associated with cluster 2 (easterly coastal route) and cluster 5 (trans-continental route) and an increase in cluster 3 (westerly coastal route).
Table 3Percentage of air mass trajectories associated with each individual cluster for Mount Brown South from HYSPLIT analysis (Fig. 5). The upper half of the table indicates all trajectories for the period 1979–2016, while the lower half of the table includes only trajectories on days identified as EPEs. For each group, we show both the total percentage of trajectories associated with each cluster for the period 1979–2016 (all data) and the percentages associated with each cluster for each season (DJF, MAM, JJA, SON).
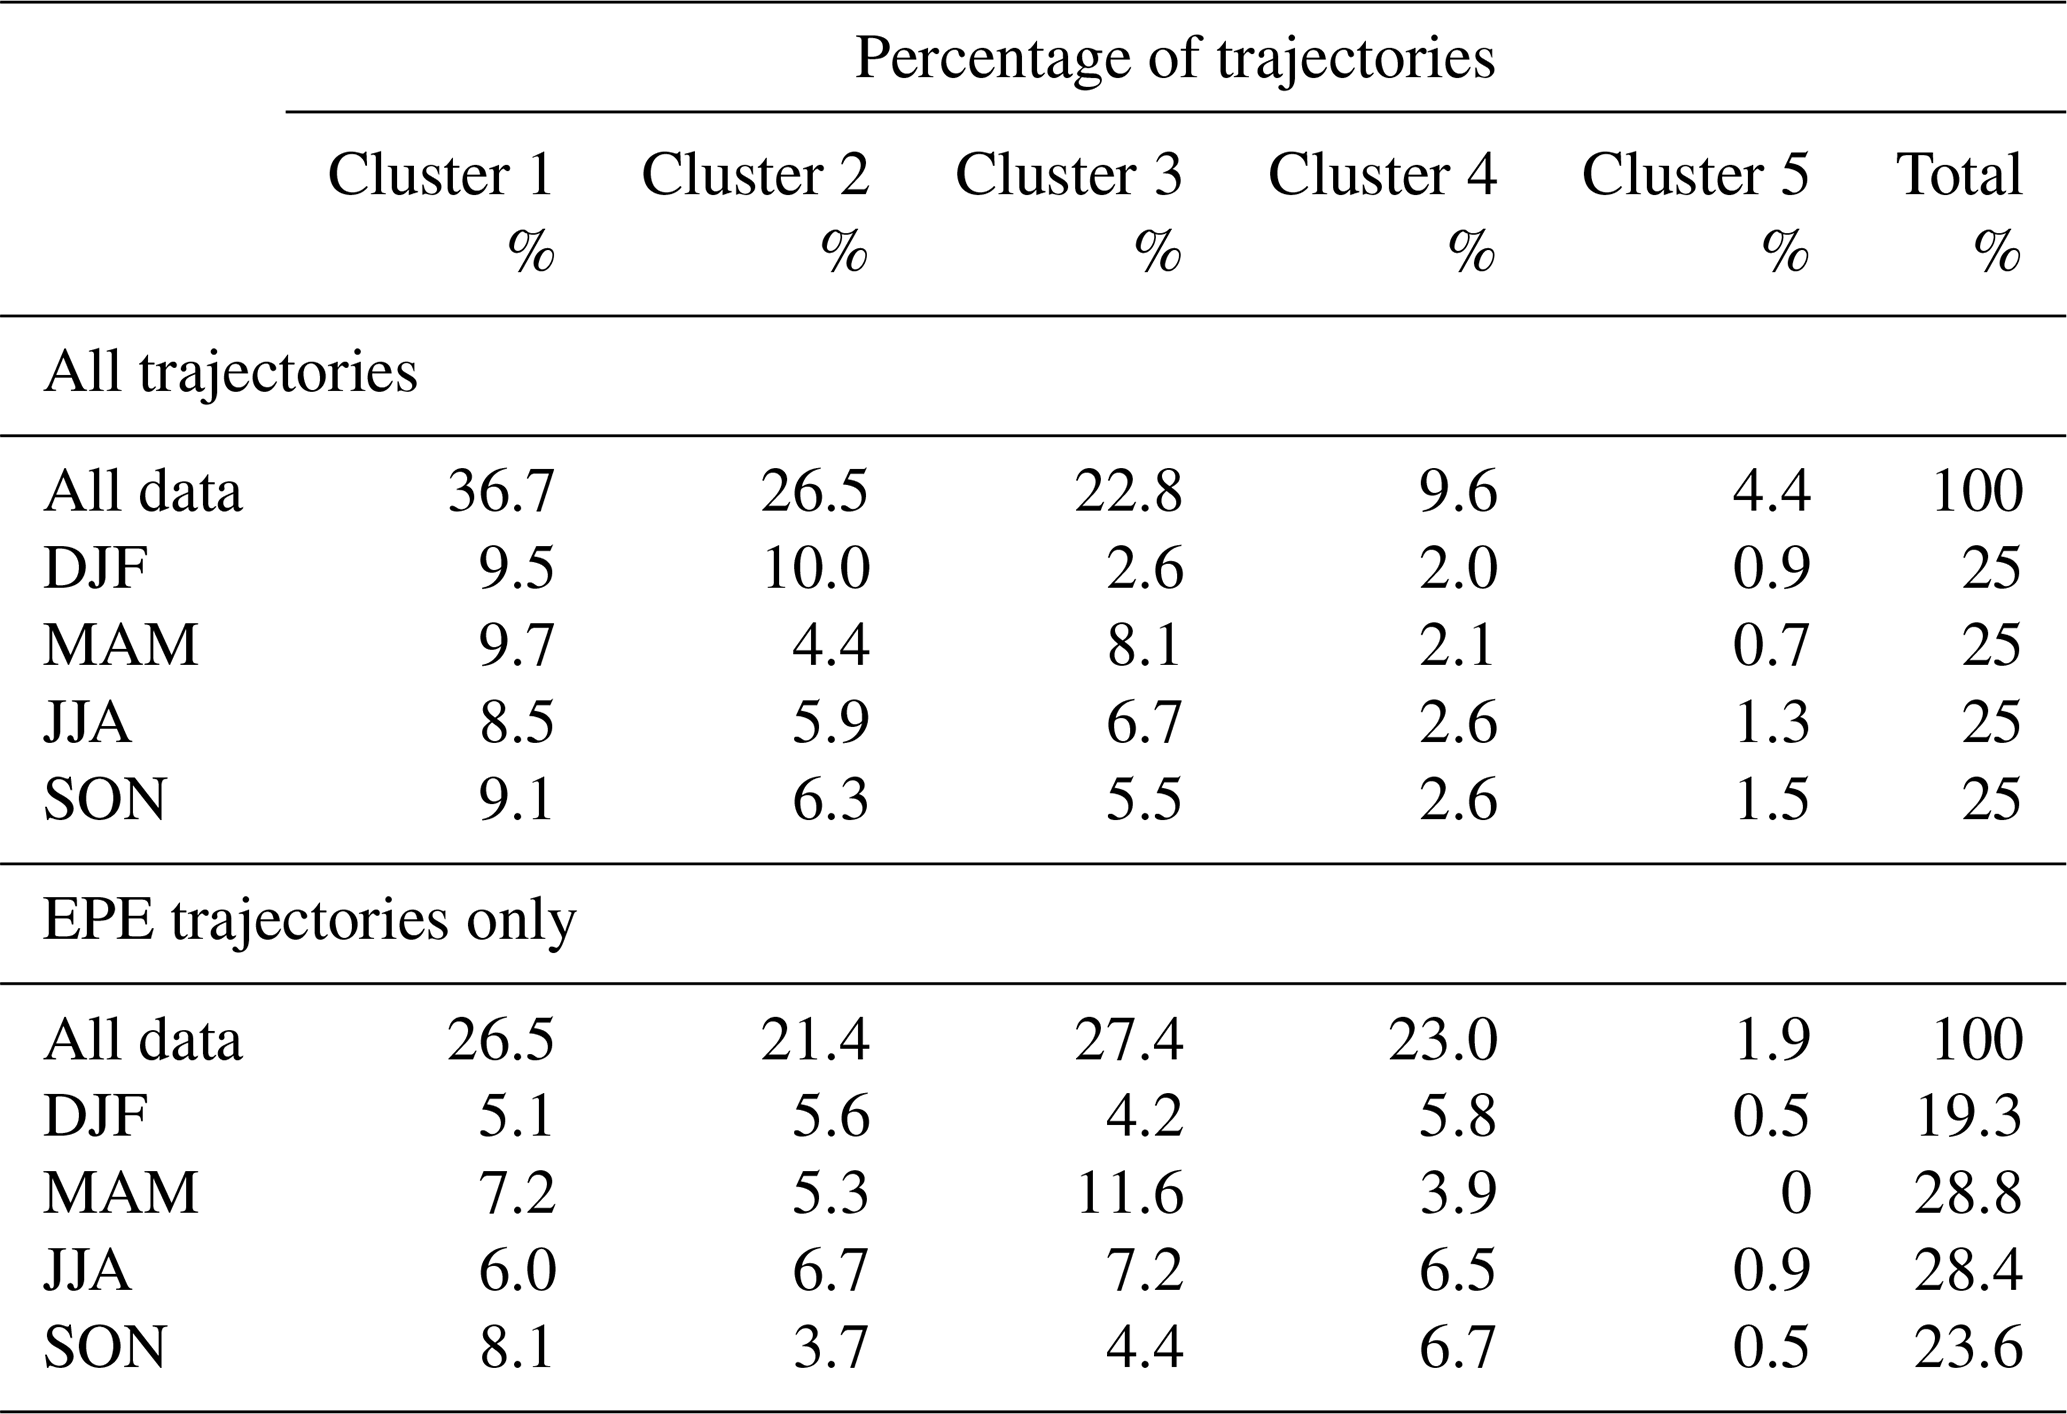
We also find strong seasonality for some clusters when filtering for EPEs is applied. In particular, we find a greater preference for trajectories to be associated with the local transport route described by cluster 1 during the austral spring (SON) than during other seasons. We find that both total accumulation and accumulation from EPEs decorrelates with atmospheric blocking during this season (Sect. 3.2.3). The greater association of EPEs with cluster 1 trajectories may indicate that the occurrence of EPEs during SON can result from a broader range of synoptic conditions than during other seasons.
Regardless of the differences in pathways, when we examine the geopotential height anomalies for each cluster during EPEs we still find a positive geopotential height anomaly to the east of the MBS site (Fig. A4). The strength and positioning of this anomaly varies for each cluster (with clusters 3 and 4 displaying an anomaly pattern most similar to the mean anomaly for all EPE events). This suggests that mid-latitudinal blocking is a persistent feature of EPEs regardless of the transportation pathway.
3.4 Atmospheric rivers
We found that 28.0 % of all identified EPEs were also identified as atmospheric rivers in the Wille et al. (2021) catalogue (Sect. 2.2.2); conversely, 79.8 % of ARs were also identified as EPEs. Wille et al. (2021) found that atmospheric rivers account for a similar percentage of EPEs across Antarctica (25 %–35 % for the 90th percentile, 35 %–45 % for the 95th, and 60 %–70 % for the 99th). The Amery Ice Shelf region, located nearby and to the west of the MBS ice core site, was identified as having particularly high accumulation from ARs in the Wille et al. (2021) study (∼20 %), compared with 10 %–20 % across much of the rest of East Antarctica.
There is also a strong association of atmospheric rivers with cluster 4 from the HYSPLIT analyses (Sect. 3.3); 32.1 % of all identified atmospheric rivers at MBS are associated with cluster 4, compared with 22.6 %, 18.2 %, 25.5 %, and 1.5 % associated with clusters 1, 2, 3, and 5, respectively. We would expect most atmospheric rivers to be associated with cluster 4 as this best represents the meridional onshore pathway typically associated with atmospheric river transport to Antarctica.
It is interesting to note that the highest monthly accumulation at MBS occurred in December 1989 (94.1 mm w.e. accumulation). This anomalously high monthly accumulation was driven by two unusual atmospheric events during December 1989 that lead to both extreme precipitation and high temperatures in the region around the MBS ice core site (Turner et al., 2022). The first event, which occurred around 5 December 1989, was caused by the combined impacts of an atmospheric river with strong downslope winds. This led to both extreme snowfall and high temperatures across coastal East Antarctica (Turner et al., 2022). A second atmospheric river impacted the region on 27–28 December, again resulting in anomalously high temperatures and snowfall. Atmospheric rivers are rare across Antarctica, and the co-occurrence of these two events in December 1989 resulted in extreme accumulation for this month, observable in the ERA-5 monthly precipitation record.
While atmospheric rivers represent an important contribution to annual snowfall across Antarctica and are frequently associated with extreme temperature anomalies, we cannot readily differentiate the impacts of atmospheric rivers from other EPEs in ice cores. Future high-resolution snow pit sampling may help to quantify the magnitude of the impacts of strong atmospheric river events on the water isotope record; however, in the context of this work we cannot further differentiate the impacts of atmospheric rivers from EPEs associated with other synoptic conditions.
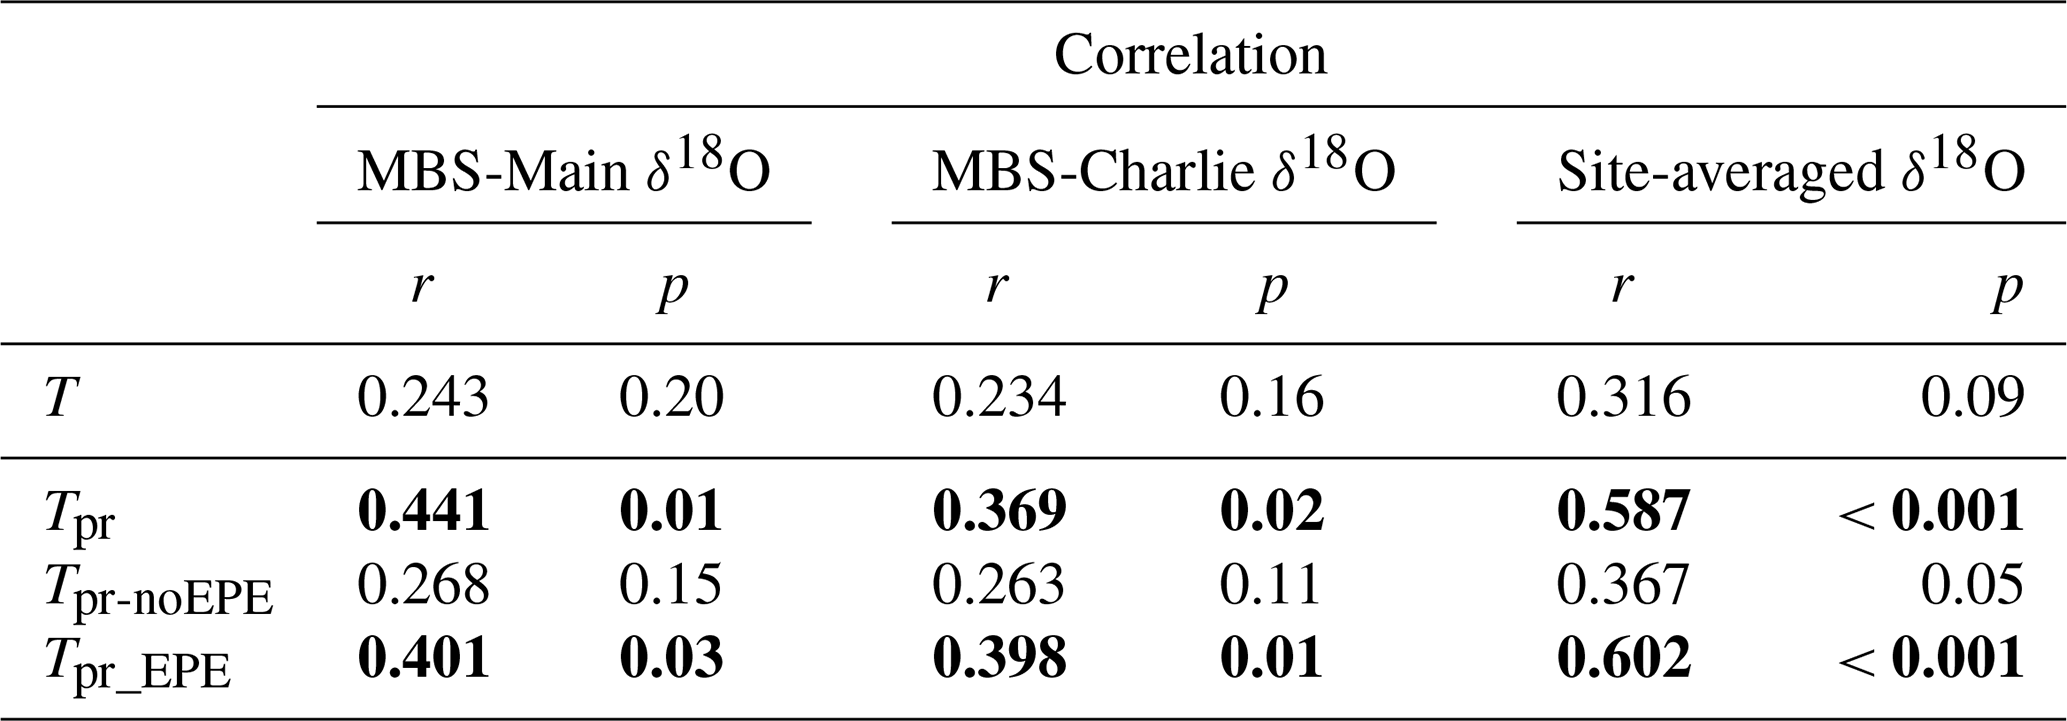
Table 4Pearson's correlation coefficient (r) and p values for annually averaged δ18O values from MBS-Main and MBS-Charlie; site-averaged with mean annual temperature (T) values; and the precipitation-weighted temperature time series (Tpr, Tpr-noEPE, and Tpr-EPE). Significant correlations (p<0.05) are shown in bold.
3.5 Temperature anomalies
There is a strong positive temperature anomaly across Wilhelm II Land during EPEs at MBS (Fig. 4b). In the surface temperature field, there is a strong anomaly centred over the MBS site, with a mean positive anomaly of +7.2 ∘C for the grid cell containing the ice core site. This warm anomaly also extends over a broad region of East Antarctica from 60 to 105∘ E and inland to 80∘ S. The temperature anomaly is associated with atmospheric blocking, which causes increased meridional flow of warm, moist air from the mid-latitudes to the MBS site during EPEs. This results in both positive temperature anomalies and high accumulation.
3.5.1 Temperature bias
As accumulation from EPEs makes up ∼50 % of annual snowfall at MBS, the impact of the warm temperature anomalies during these events would be expected to generate a warm bias in the ice core record. Previous studies have identified the warm bias introduced into ice core records due to warm temperature anomalies during precipitation (Sime et al., 2009; Casado et al., 2020; Persson et al., 2011).
We investigate the impact of EPEs on mean annual temperature by deriving precipitation-weighted synthetic temperature records using daily accumulation from ERA-5 and mean daily 2 m air temperature from ERA-5 (Sect. 2.2.1). Mean annual temperature (T) for the site is calculated based on the mean daily temperatures. To highlight the influence of EPEs we generate three precipitation-weighted time series based on total daily accumulation and mean daily temperature from ERA-5.
-
Tpr: daily temperature weighted by total daily accumulation from ERA-5.
-
Tpr-noEPE: daily temperature weighted by total daily accumulation from ERA-5 without EPEs (i.e. days identified as EPEs (daily accumulation is >3.2 mm d−1) are set to have 0 mm daily accumulation).
-
Tpr-EPE: daily temperature weighted by total daily accumulation from ERA-5 with only EPEs (i.e. days not identified as EPEs (daily accumulation is <3.2 mm d−1) are set to have 0 mm daily accumulation).
For each of the input precipitation time series (Tpr, Tpr-noEPE, and Tpr-EPE) the precipitation-weighted mean annual temperature is calculated as follows:
where Tday is the daily temperature and Prday is the daily accumulation.
There is a warm bias for all the precipitation-weighted time series (Tpr, Tpr-noEPE, and Tpr-EPE) when compared with annual mean temperature (T) (Fig. 6). For Tpr, the mean warm bias is ∘C, but there is considerable interannual variability in the magnitude of the bias (interquartile range = 1.1 ∘C). The largest warm bias occurs in 2001, where the precipitation-weighted mean annual temperature is +7.1 ∘C warmer than the mean annual temperature. Conversely, in 2007 the temperature bias is only +2.1 ∘C. The magnitude of the bias is significantly correlated with the number of EPEs in a year (r=0.478, p=0.002), as well as mean annual temperature (r=0.651, p<0.001).
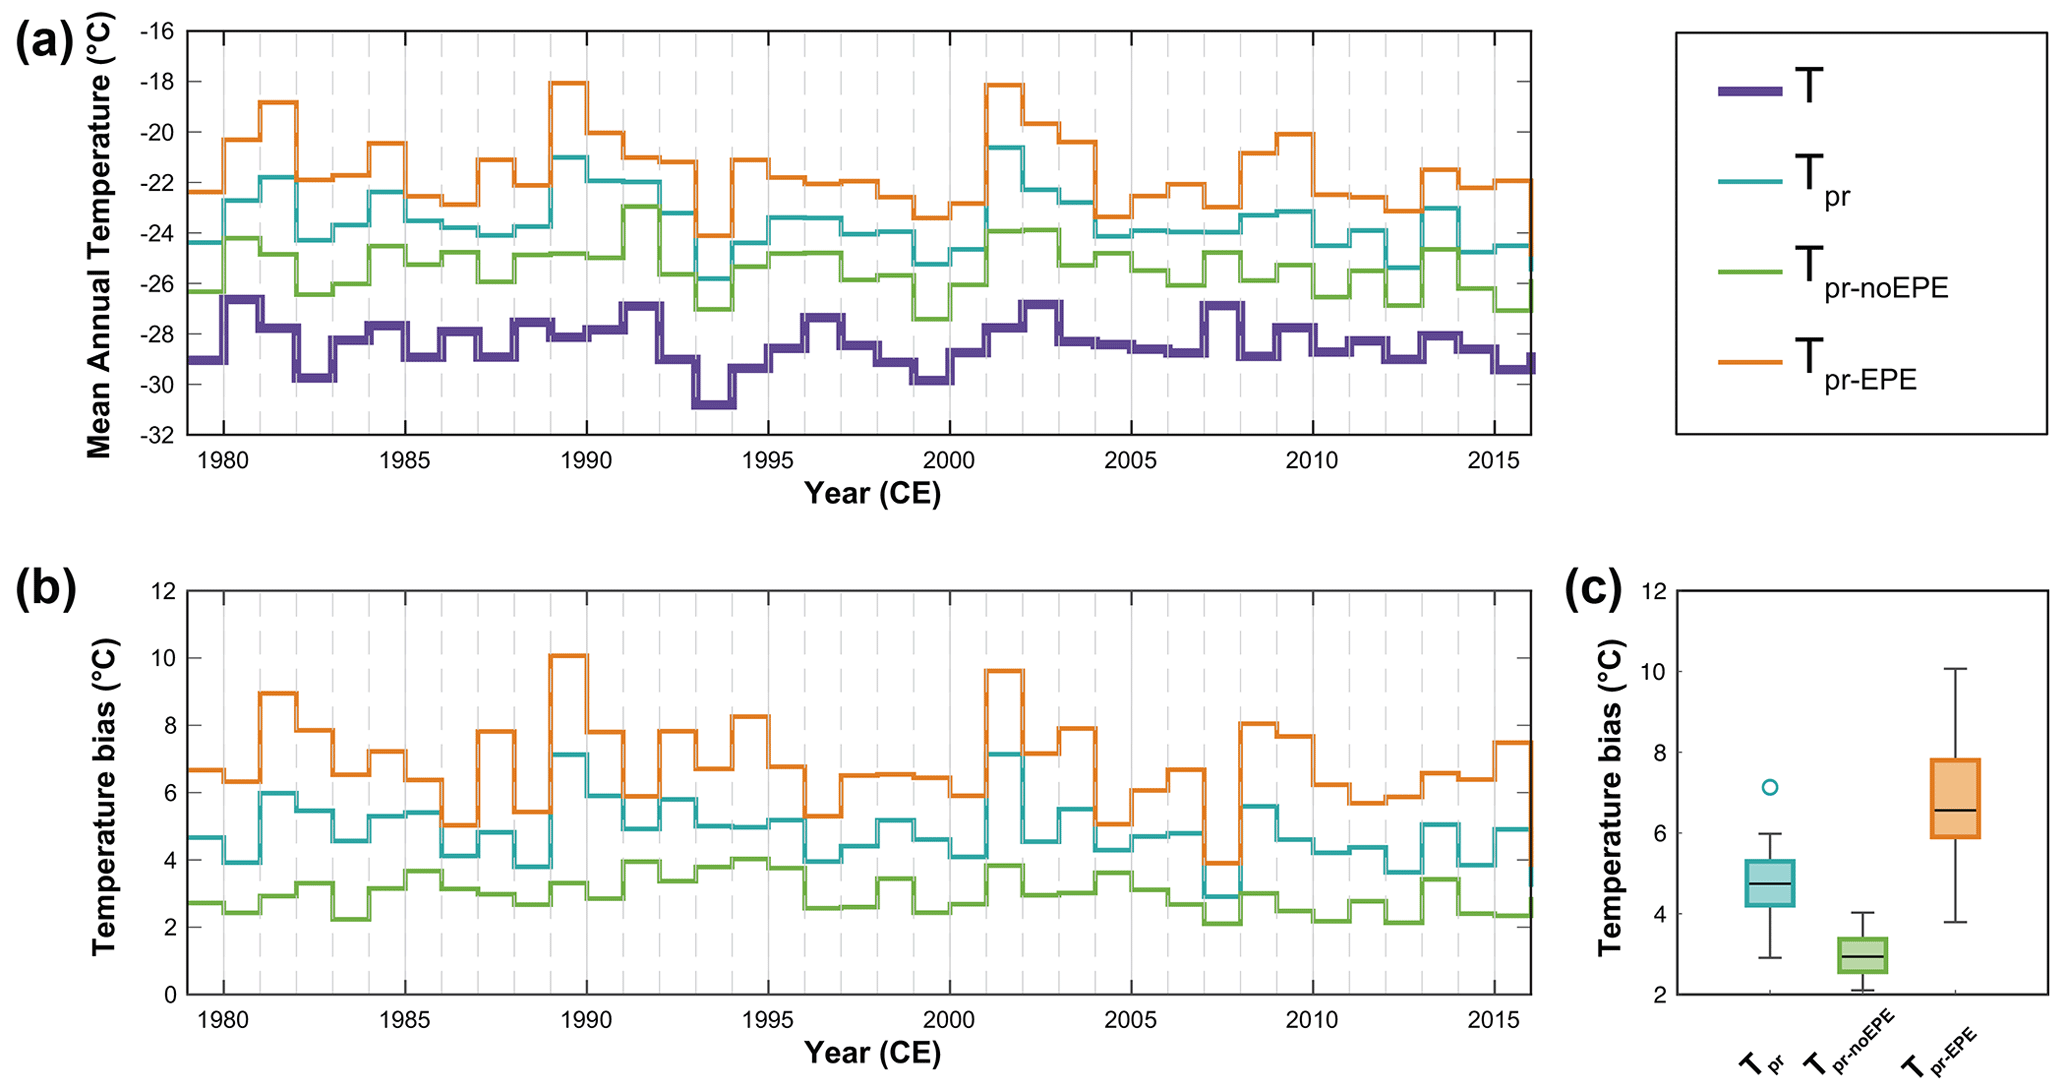
Figure 6(a) Mean annual temperature from ERA-5 for 1979–2016 at MBS (bold purple line) and the mean annual precipitation-weighted temperature time series for the same period (Tpr: teal line; Tpr-noEPE: green line; Tpr-EPE: orange line). (b) Temperature difference between the mean annual precipitation-weighted temperature time series (Tpr: teal line; Tpr-noEPE: green line; Tpr-EPE: orange line) and mean annual temperature. (c) Box plot showing the temperature difference between the mean annual precipitation-weighted temperature time series (Tpr: teal box; Tpr-noEPE: green box; Tpr-EPE: orange box) and mean annual temperature.
When EPEs are removed from the record (Tpr-noEPE), the mean bias is reduced to ∘C. Importantly, the variability in the bias is also reduced, with a maximum bias in 1994 of +4.0 ∘C, a minimum in 2007 of +2.1 ∘C, and an interquartile range of 0.8 ∘C. When only EPEs are considered, the mean bias increases to 6.7±1.3 ∘C and there is a large increase in interannual variability. The maximum bias is +10.1 ∘C in 1989, the minimum is +3.8 ∘C in 2016, and the interquartile range is 1.9 ∘C. Both Tpr-noEPE and Tpr-EPE are significantly correlated with mean annual temperature (T) (Tpr-noEPE: r=0.832, p<0.001; Tpr-EPE: r=0.467, p=0.003). However, the correlation between Tpr-EPE and mean annual climate is weaker due to the greater interannual variability in the bias.
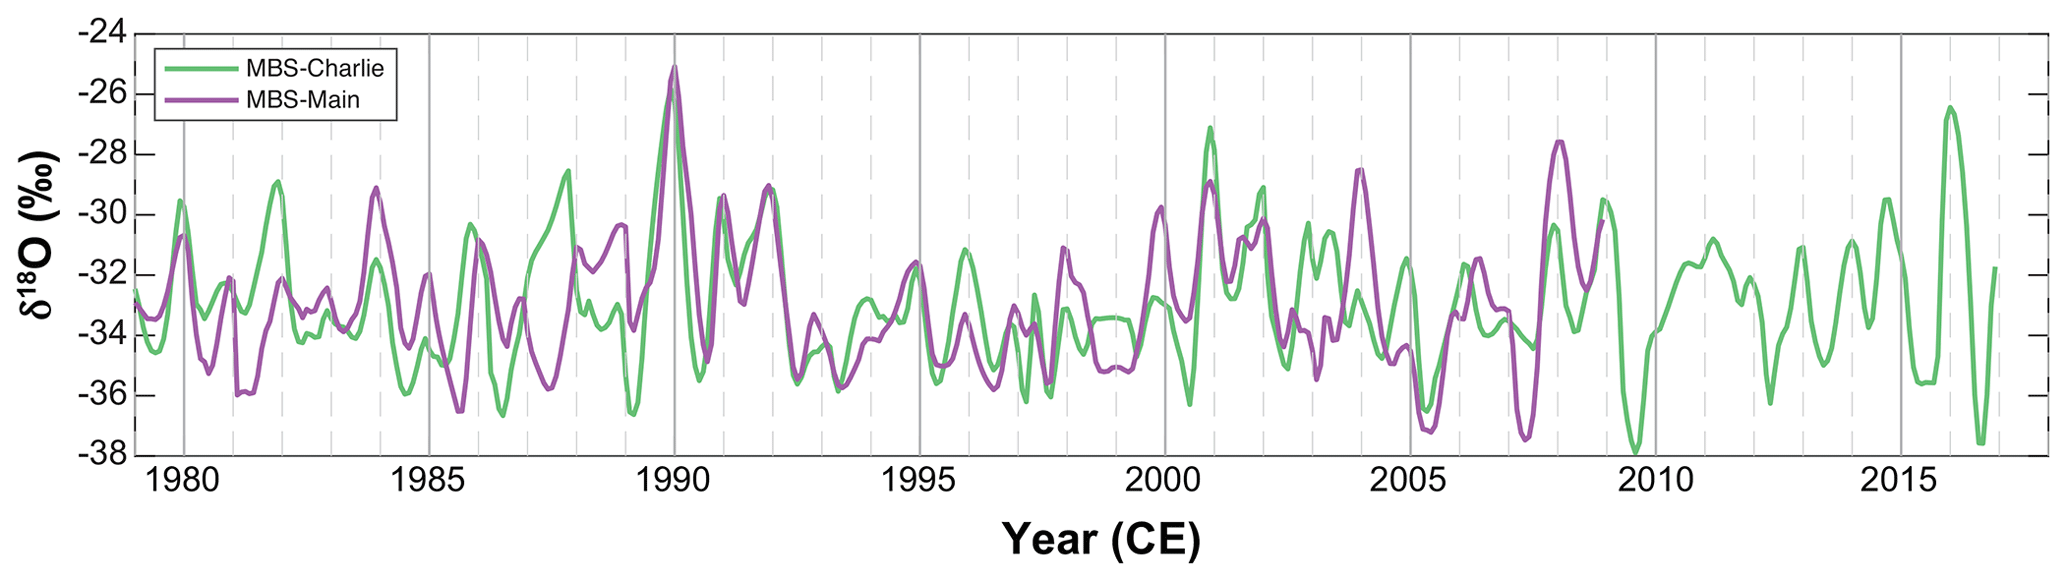
Figure 7Ice core δ18O profiles from MBS-Main for 1979–2008 (purple) and MBS-Charlie for 1979–2016 (green) at monthly resolution.
3.6 Mount Brown South water isotope record
We now present the water isotope record for 4–20 m of the MBS-Main (1979–2009) and 0–20 m of the MBS-Charlie (1979–2017) ice cores (Fig. 7), and consider how extreme precipitation events impact the δ18O record. The ice core water isotope record is in part a reflection of the conditions present during deposition and will thus be biased towards recording the climate conditions associated with precipitation at MBS. Here we discuss both the impact of precipitation intermittency on the δ18O record in the MBS ice core and the particular temperature biases that occur due to EPEs.
3.6.1 The MBS δ18O records
The MBS-Main and MBS-Charlie δ18O records both show strong seasonal cycles, with enriched values during the summer months and depleted values during the winter months (Fig. 7). The amplitudes of the cycles vary greatly from year to year, with the largest-amplitude seasonal cycles being ∼10 ‰ and the smallest-amplitude cycles being ∼1 ‰. Clear seasonality is observed in both cores during certain periods (i.e. 1990–1993), and much weaker seasonality is observed in other years (i.e. 1994–1999). For both records, the most enriched δ18O values are observed in the summer of 1989/1990 (δ18O ≈ −25 ‰). The coincidence of this prominent peak in both records gives confidence in the dating process and the alignment of the two records.
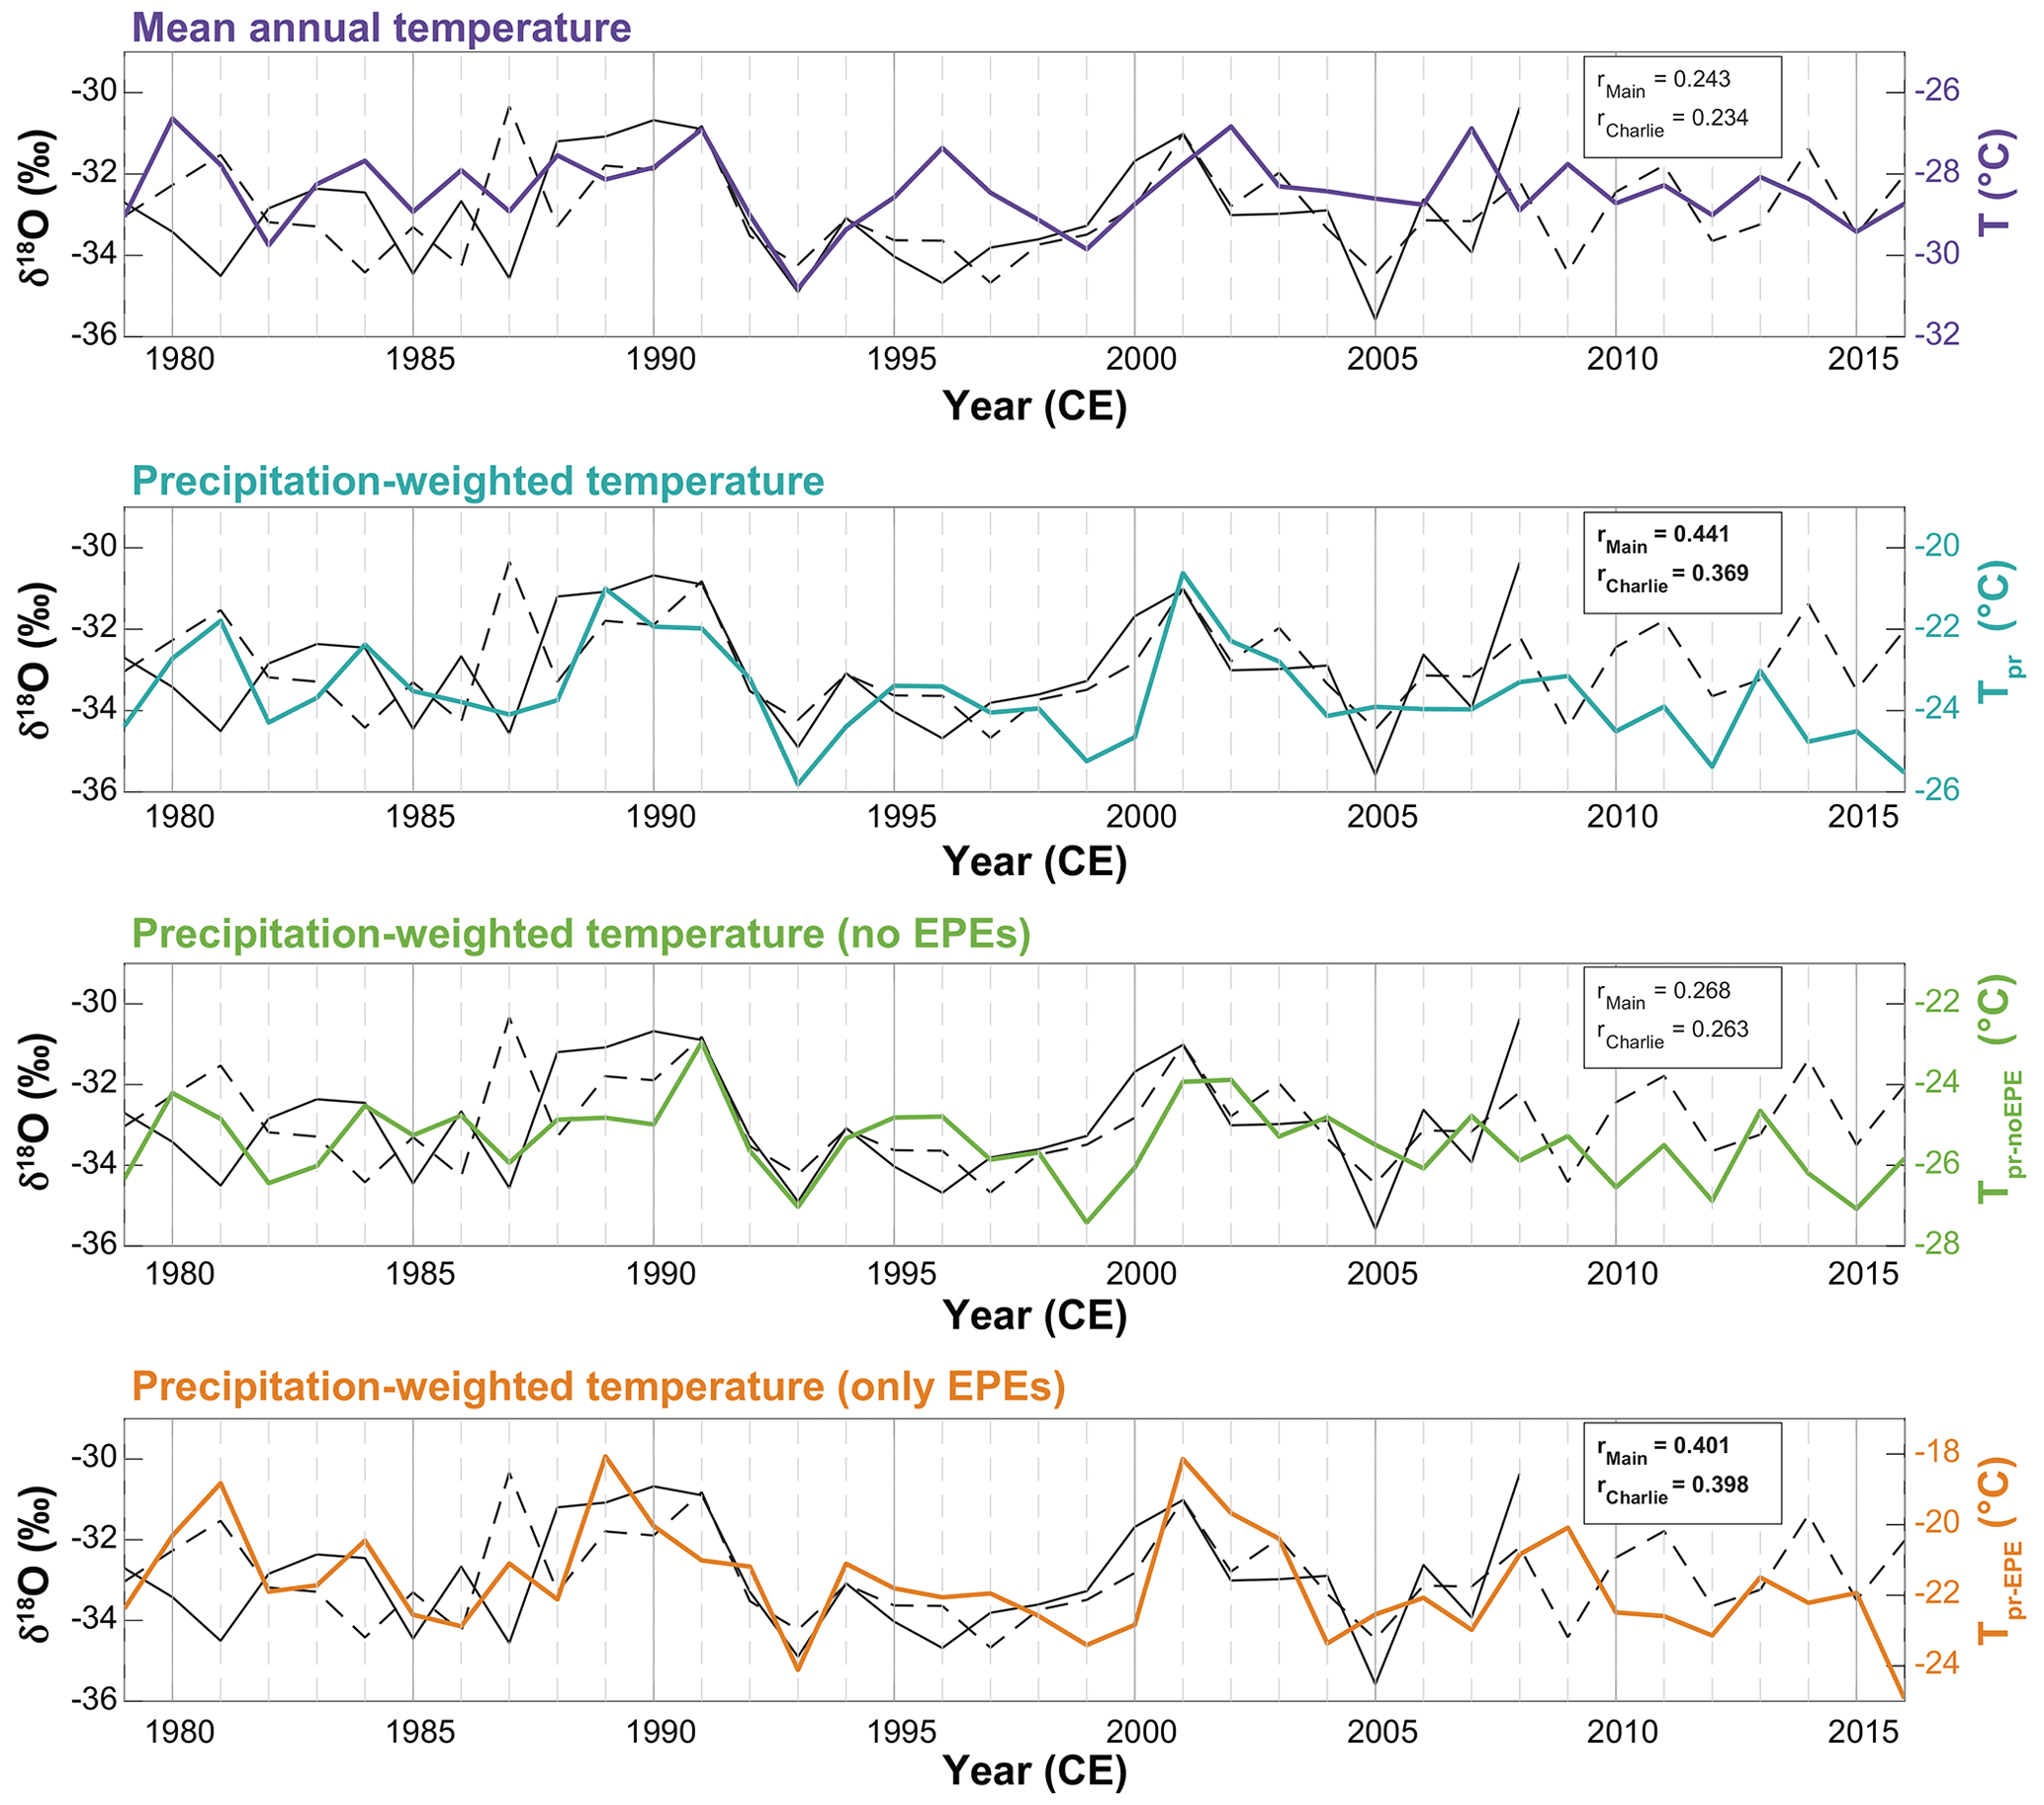
Figure 8Annually averaged δ18O from MBS-Main (solid black line) and MBS-Charlie (dashed black line) and (a) mean annual temperature (T; purple line); (b) precipitation-weighted temperature (Tpr; teal line); (c) precipitation-weighted temperature with accumulation from EPEs removed (Tpr-noEPE; green line); and (d) precipitation-weighted temperature based only on accumulation from EPEs (Tpr-EPE; orange line). All temperature time series are constructed using daily mean temperature and total daily precipitation from ERA-5. Pearson's correlation coefficients (r) for MBS-Main and MBS-Charlie with the temperature time series are shown for each panel, with significant correlations (p<0.05) shown in bold.
As discussed earlier (Sect. 3.4), December 1989 was an anomalous month for both accumulation and temperatures in the MBS region (Turner et al., 2022). The co-occurrence of two large atmospheric river events led to both strong (warm) temperature anomalies and extreme levels of precipitation in the region around the ice core site. This type of single (or compound) extreme event would be expected to lead to strong warm biases and an overrepresentation of this extreme event in the preserved ice core δ18O record. The unusually enriched δ18O in MBS-Main and MBS-Charlie in the summer of 1989/1990 may illustrate the effect of precipitation intermittency and EPEs on the climate signals preserved in ice cores from this site.
3.6.2 Correlation with temperature
To investigate the relationship between temperature, extreme precipitation events, and the water isotope records from both MBS-Main and MBS-Charlie, we compare the annually averaged (January–December) δ18O record with mean annual temperature at the ice core site from ERA-5 and the precipitation-weighted mean annual temperature records generated in Sect. 3.5 (Tpr, Tpr-noEPE, and Tpr-EPE; Fig. 8).
There is no significant correlation between mean annual temperature and mean annual δ18O for both the MBS-Main and MBS-Charlie cores (MBS-Main: r=0.24, p=0.20; MBS-Charlie: r=0.23, p=0.16; Fig. 8a, Table 4). However, a strong positive correlation emerges when the ice cores records are compared with the precipitation-weighted mean annual temperature, Tpr (MBS-Main: r=0.44, p=0.01; MBS-Charlie: r=0.37, p=0.02; Fig. 8b, Table 4). This demonstrates the improved climate relationships that can be obtained when taking the influence of precipitation intermittency on ice core δ18O into account.
The impact of EPEs on the preserved δ18O record at the MBS ice core site is further highlighted by the relationships between the ice cores and the precipitation-weighted mean annual temperatures without EPEs (Tpr-noEPE; Fig. 8c) and with only EPEs (Tpr-EPE; Fig. 8d). Where EPEs are removed from the precipitation record (Tpr-noEPE), we find that there is no correlation between the precipitation-weighted mean annual temperature (MBS-Main: r=0.27, p=0.15; MBS-Charlie: r=0.27, p=0.11). Conversely, when only EPEs are considered (Tpr-EPE), we find that there is a strong positive correlation (MBS-Main: r=0.40, p=0.03; MBS-Charlie: r=0.40, p=0.01).
The observed relationships between the MBS δ18O records and the different weighted temperature records highlight the dominant influence of EPEs on the ice core records at this site. Interannual variability in both MBS-Main and MBS-Charlie is not significantly related to the mean annual temperature time series where the influences of EPEs are not considered (T and Tpr-noEPE). In contrast, the ice core δ18O records show strong relationships with the temperature time series that include weighting for EPEs (Tpr and Tpr-EPE). At this location, EPEs account for approximately 50 % of total annual accumulation (see Sect. 3.1). Removal of the EPE portion of the accumulation record (i.e. Tpr-noEPE) results in no significant relationship between δ18O and the local climate. However, removal of the remaining ∼50 % of the total annual accumulation (i.e. events not identified as EPEs; i.e. Tpr-EPE) does not reduce the relationship between δ18O and the local climate. This highlights that at this location, the δ18O record preserved in the ice cores is most strongly representative of the synoptic conditions present during EPEs, rather than mean annual climate conditions or the climate conditions present during smaller snowfall events. In other words, it is not simply precipitation intermittency that determines the interannual climate record preserved at this site, but it is instead the role of EPEs in precipitation intermittency that dominates this influence.
3.6.3 Signal bias from EPEs
Including EPEs in the precipitation-weighted temperature records results in greater interannual variability in the magnitude of the temperature bias (Sect. 3.5.1). For the interpretation of water isotopes as a temperature proxy, the interannual variability in the magnitude of the bias represents a source of “noise” around the true temperature signal. Increasing the amplitude of that noise decreases the “signal-to-noise” ratio in the ice core δ18O records, which reduces the timescales at which a temperature signal is retrievable from an ice core record (Casado et al., 2020; Sime et al., 2009; Münch et al., 2021). The greater interannual variability in the temperature bias associated with Tpr and Tpr-EPE compared to Tpr-noEPE highlights that much of the variability in the bias is due to interannual variability in EPEs at this site.
Given the strong propensity of δ18O at this site to capture the climate conditions during extreme events, rather than the mean climate, caution must be taken when interpreting interannual variations in δ18O purely as an indicator of mean temperature variability. Both increased numbers of EPE in a year and increased intensity of individual events may lead to enrichment of δ18O unrelated to an increase in the mean annual temperature.
However, knowing that EPEs play a strong role in determining interannual δ18O variability means that more informed climate interpretations can be made. Large-scale modes of climate variability, such as the Southern Annular Mode (SAM) or the El Niño–Southern Oscillation (ENSO) have been demonstrated to influence the number of EPEs across different regions of Antarctica (Turner et al., 2019). For example, in much of East Antarctica negative phases of the SAM are associated with an increase in EPEs during the autumn (Turner et al., 2019). The relationship between large-scale modes of climate variability and synoptic-scale EPEs, as well as the enrichment of δ18O associated with these extreme events, provides a mechanism where enhanced signals of interannual climate variability may be preserved in Antarctic ice cores through the biases induced by EPE events, even though these precipitation biases reduce the fidelity for reconstructing purely past temperature.
3.6.4 Additional sources of noise
In this paper we have focussed primarily on one source of noise in δ18O in the MBS ice cores – the biases introduced by EPEs. However, there are many additional factors that can introduce noise to the ice core record, thereby further reducing the relationship with local climate. Stratigraphic noise is a broad term used to describe the many different physical processes that can alter the snow isotopic composition in the surface layers (Fisher et al., 1985). This includes blowing of surface snow (Groot Zwaaftink et al., 2013), leading to redistribution of the surface layers, sublimation and condensation (Casado et al., 2016; Ritter et al., 2016), and metamorphism of the surface snow (Casado et al., 2018).
Stratigraphic noise impacts ice core records over different spatial scales to that of precipitation intermittency or – more specifically – the biases resulting from EPEs (Münch et al., 2016). Precipitation intermittency introduces noise into ice core records at a broad spatial scale, with an estimated decorrelation scale of ∼300–500 km (Münch and Laepple, 2018). Conversely, stratigraphic noise has a much more localised impact, with decorrelation scales of <5 m (Münch et al., 2016) resulting in a decorrelation between replica cores from the same site. The two ice cores discussed in this study (MBS-Main and MBS-Charlie) are located 94 m apart, indicating that while they are similarly affected by noise from precipitation intermittency and EPEs, stratigraphic noise will affect each core differently, thereby reducing the correlation between the records.
A reduction in stratigraphic noise can be achieved by core replication at a single site. At the MBS ice core site, deriving a site-averaged δ18O record from the MBS-Main and MBS-Charlie records improved the correlation with local climate for all of our synthetic temperature time series (T, Tpr, Tpr-noEPE, and Tpr-EPE). The correlations with both T and Tpr-noEPE improve but are still non-significant at the α=0.05 significance level (T: r=0.316, p=0.09; Tpr-noEPE: r=367, p=0.05). The correlation between site-averaged δ18O and Tpr and Tpr-EPE also improve relative to the individual cores (Tpr: r=0.587, p<0.001; Tpr-EPE: r=0.602, p<0.001). This again emphasises the strong relationship between δ18O at this site and the conditions present during EPEs and also demonstrates that stratigraphic noise plays a lesser role than precipitation intermittency in biassing the δ18O signals preserved at the MBS site.
It is also important to note that water isotopes do not simply reflect site conditions during precipitation but are instead an integration of all of the fractionation processes throughout the history of the water mass. This means the final δ18O recorded in the ice core reflects a broad range of parameters, including source conditions, transportation pathways, and rainout. Accumulation from EPEs is associated with more consistent synoptic conditions and transportation pathways than accumulation from smaller events (see Sects. 3.2.2 and 3.3). This may help to enforce the relationship between δ18O in the ice cores and the climate conditions during EPEs where moisture is sourced from ocean regions to the north of the site (Fig. 5a), although further modelling of δ18O with consideration for transportation histories would be needed to fully understand this relationship.
This study has used a combination of ice core data and reanalysis products to understand how precipitation intermittency impacts the temperature records preserved in an East Antarctic ice core. Accumulation at the Mount Brown South ice core site is not constant and continuous but instead shows clear seasonality and interannual variability. Much of this variability can be explained by variability in extreme precipitation events, i.e. days where daily accumulation exceeds 3.2 mm d−1 (water equivalent). There is a greater occurrence of extreme accumulation events during the austral winter months (May–June), which also coincides with the highest monthly mean accumulation. Much of the interannual variability in accumulation is also caused by variability in EPEs. We found that years with a greater number of EPEs also have higher annual accumulation than those with fewer events. Although EPEs only occur on 6.0 % days each year on average, they account for around 51.5 % of annual snowfall, and thus the synoptic conditions associated with extreme snowfall are overrepresented in the MBS ice core.
Extreme events tend to be associated with strong meridional transport driven by large blocking highs to the east of the MBS ice core site, which can be identified in mean 500 hPa geopotential heights. Precipitation during the summer months, both from extreme events and total accumulation is positively correlated with atmospheric blocking. During the winter months, there is a weaker association between extreme events and blocking; however, blocking still plays an important role in the total accumulation. Investigation into back-trajectories associated with extreme events using HYSPLIT further confirms that precipitation during these events is more frequently associated with direct transport from the mid-latitude Indian Ocean to the ice core site.
The increase in meridional flow during extreme events is associated with direct transport of warmer air masses from the mid-latitudes to the ice core site, meaning that extreme precipitation is also associated with a strong positive temperature anomaly. There is a mean surface temperature anomaly of +7.2 ∘C during EPEs at the MBS site. Water isotopic records in ice cores are principally an archive of the climate conditions during precipitation. A consequence of this is that the mean annual isotopic composition of the ice core records is not representative of a mean annual temperature but instead reflects the temperature during snowfall events.
The water isotope record in both MBS-Main and MBS-Charlie is not significantly correlated to mean annual temperature at the MBS site. However, δ18O in both MBS-Main and MBS-Charlie is positively correlated with the precipitation-weighted mean annual temperature. The relationship between δ18O in the ice cores and extreme events is further highlighted by removing precipitation from extreme events from the precipitation-weighted temperature record, which results in no correlation with δ18O. Conversely, a precipitation-weighted temperature record based only on accumulation from extreme events results in a positive correlation with δ18O. These results highlight that interannual variability in the δ18O signal preserved in the ice core records at this site is strongly controlled by the synoptic conditions that persist during EPEs rather than precipitation intermittency alone.
Extreme snowfall events at the MBS site are frequently associated with moisture trajectories originating in the southern Indian Ocean. This region is of particular interest due to the strong teleconnections with Australian hydroclimate and emerging evidence for potential climate-driven changes in the East Antarctic Ice Sheet (Stokes et al., 2022). However, long-term records of the climate variability in this region are sparse. The full MBS ice core record, covering more than 1000 years, will be a valuable addition to providing a long-term perspective on climate variability and change in the southern Indian Ocean and coastal East Antarctica. It will also be a valuable addition to global scientific efforts. One of the key priorities in ice core research is to expand and develop current networks of temperature and hydroclimate records for the Common Era (IPICS, 2015). Improved spatial distribution of these records will allow for regionally specific details and processes to be reconstructed, giving greater context to global climate changes.
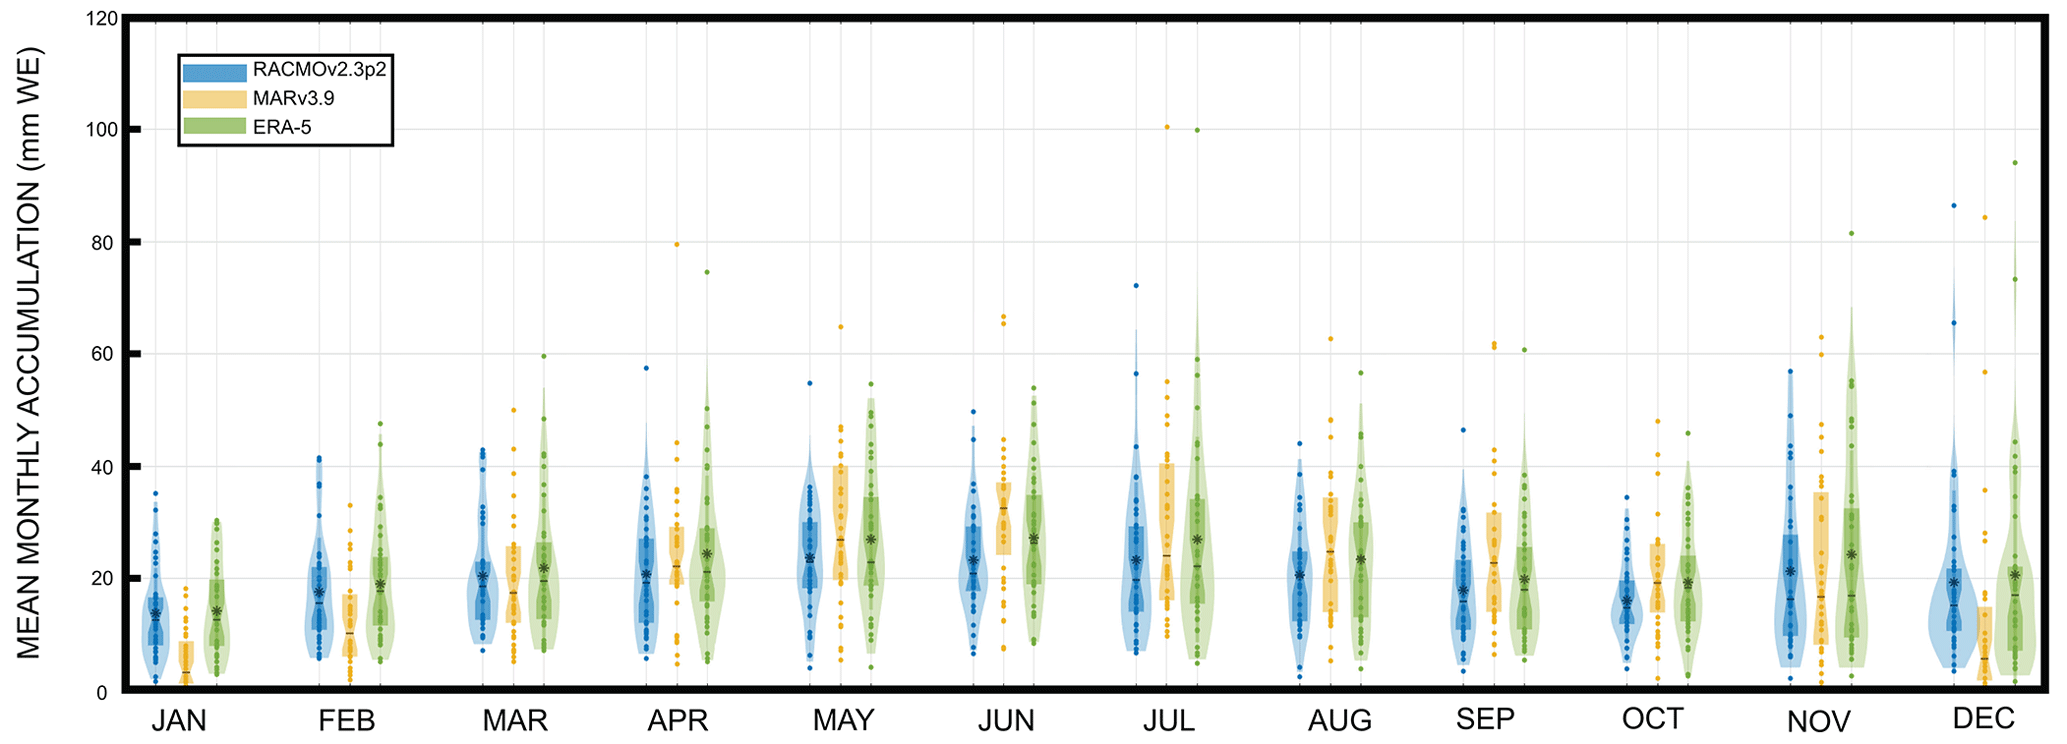
Figure A1Violin plots showing monthly accumulation from RACMO2.3p2 of 1979–2016 (blue), MARv3.9 of 1981–2018 (yellow), and ERA-5 of 1979–2020 (green). Mean monthly values are indicated by an asterisk.
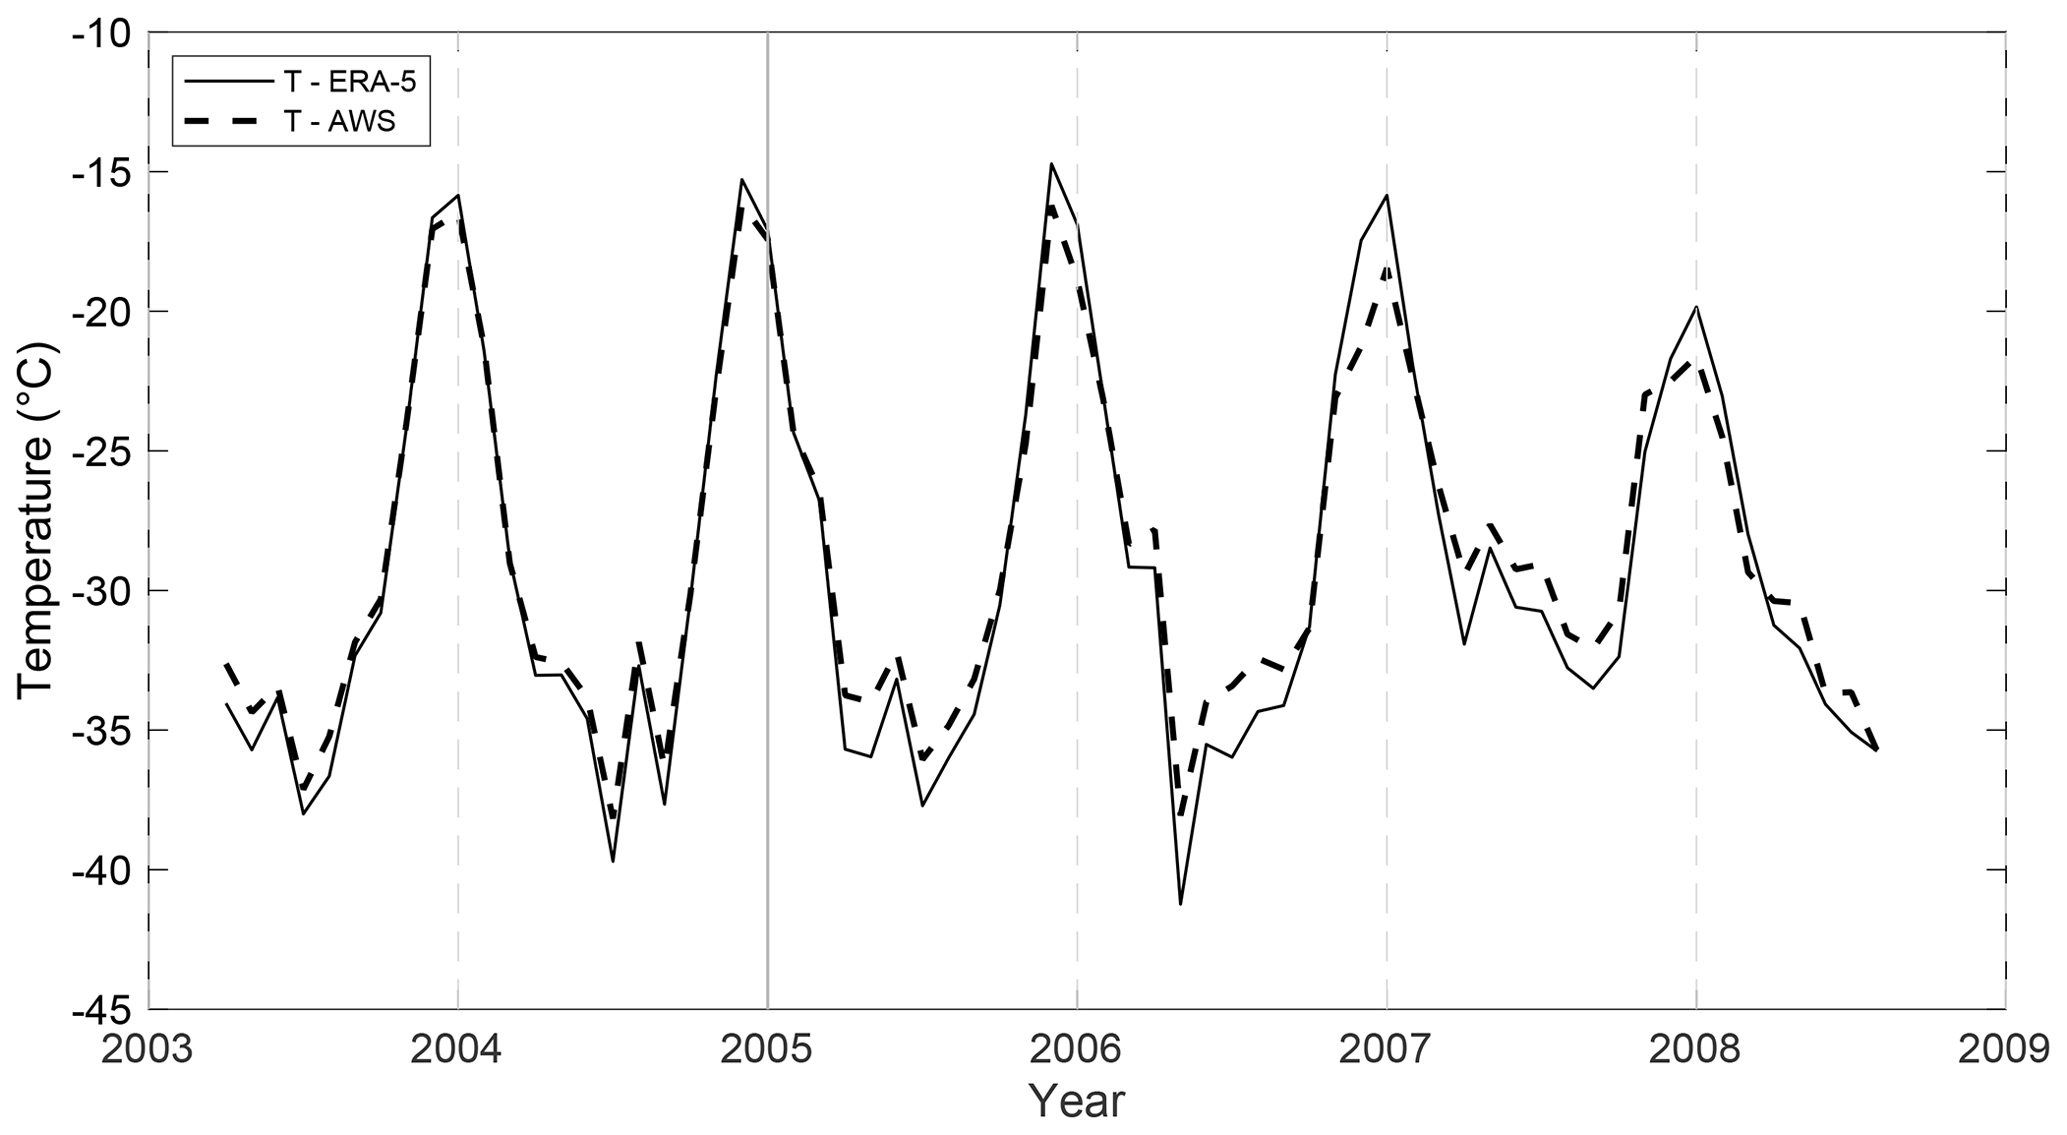
Figure A2Comparison of mean monthly temperatures from an automated weather station located on Mount Brown, 19 km from the MBS drill site (dashed line), and mean monthly 2 m air temperatures for the grid cell encompassing the MBS drill site from ERA-5 (solid line).
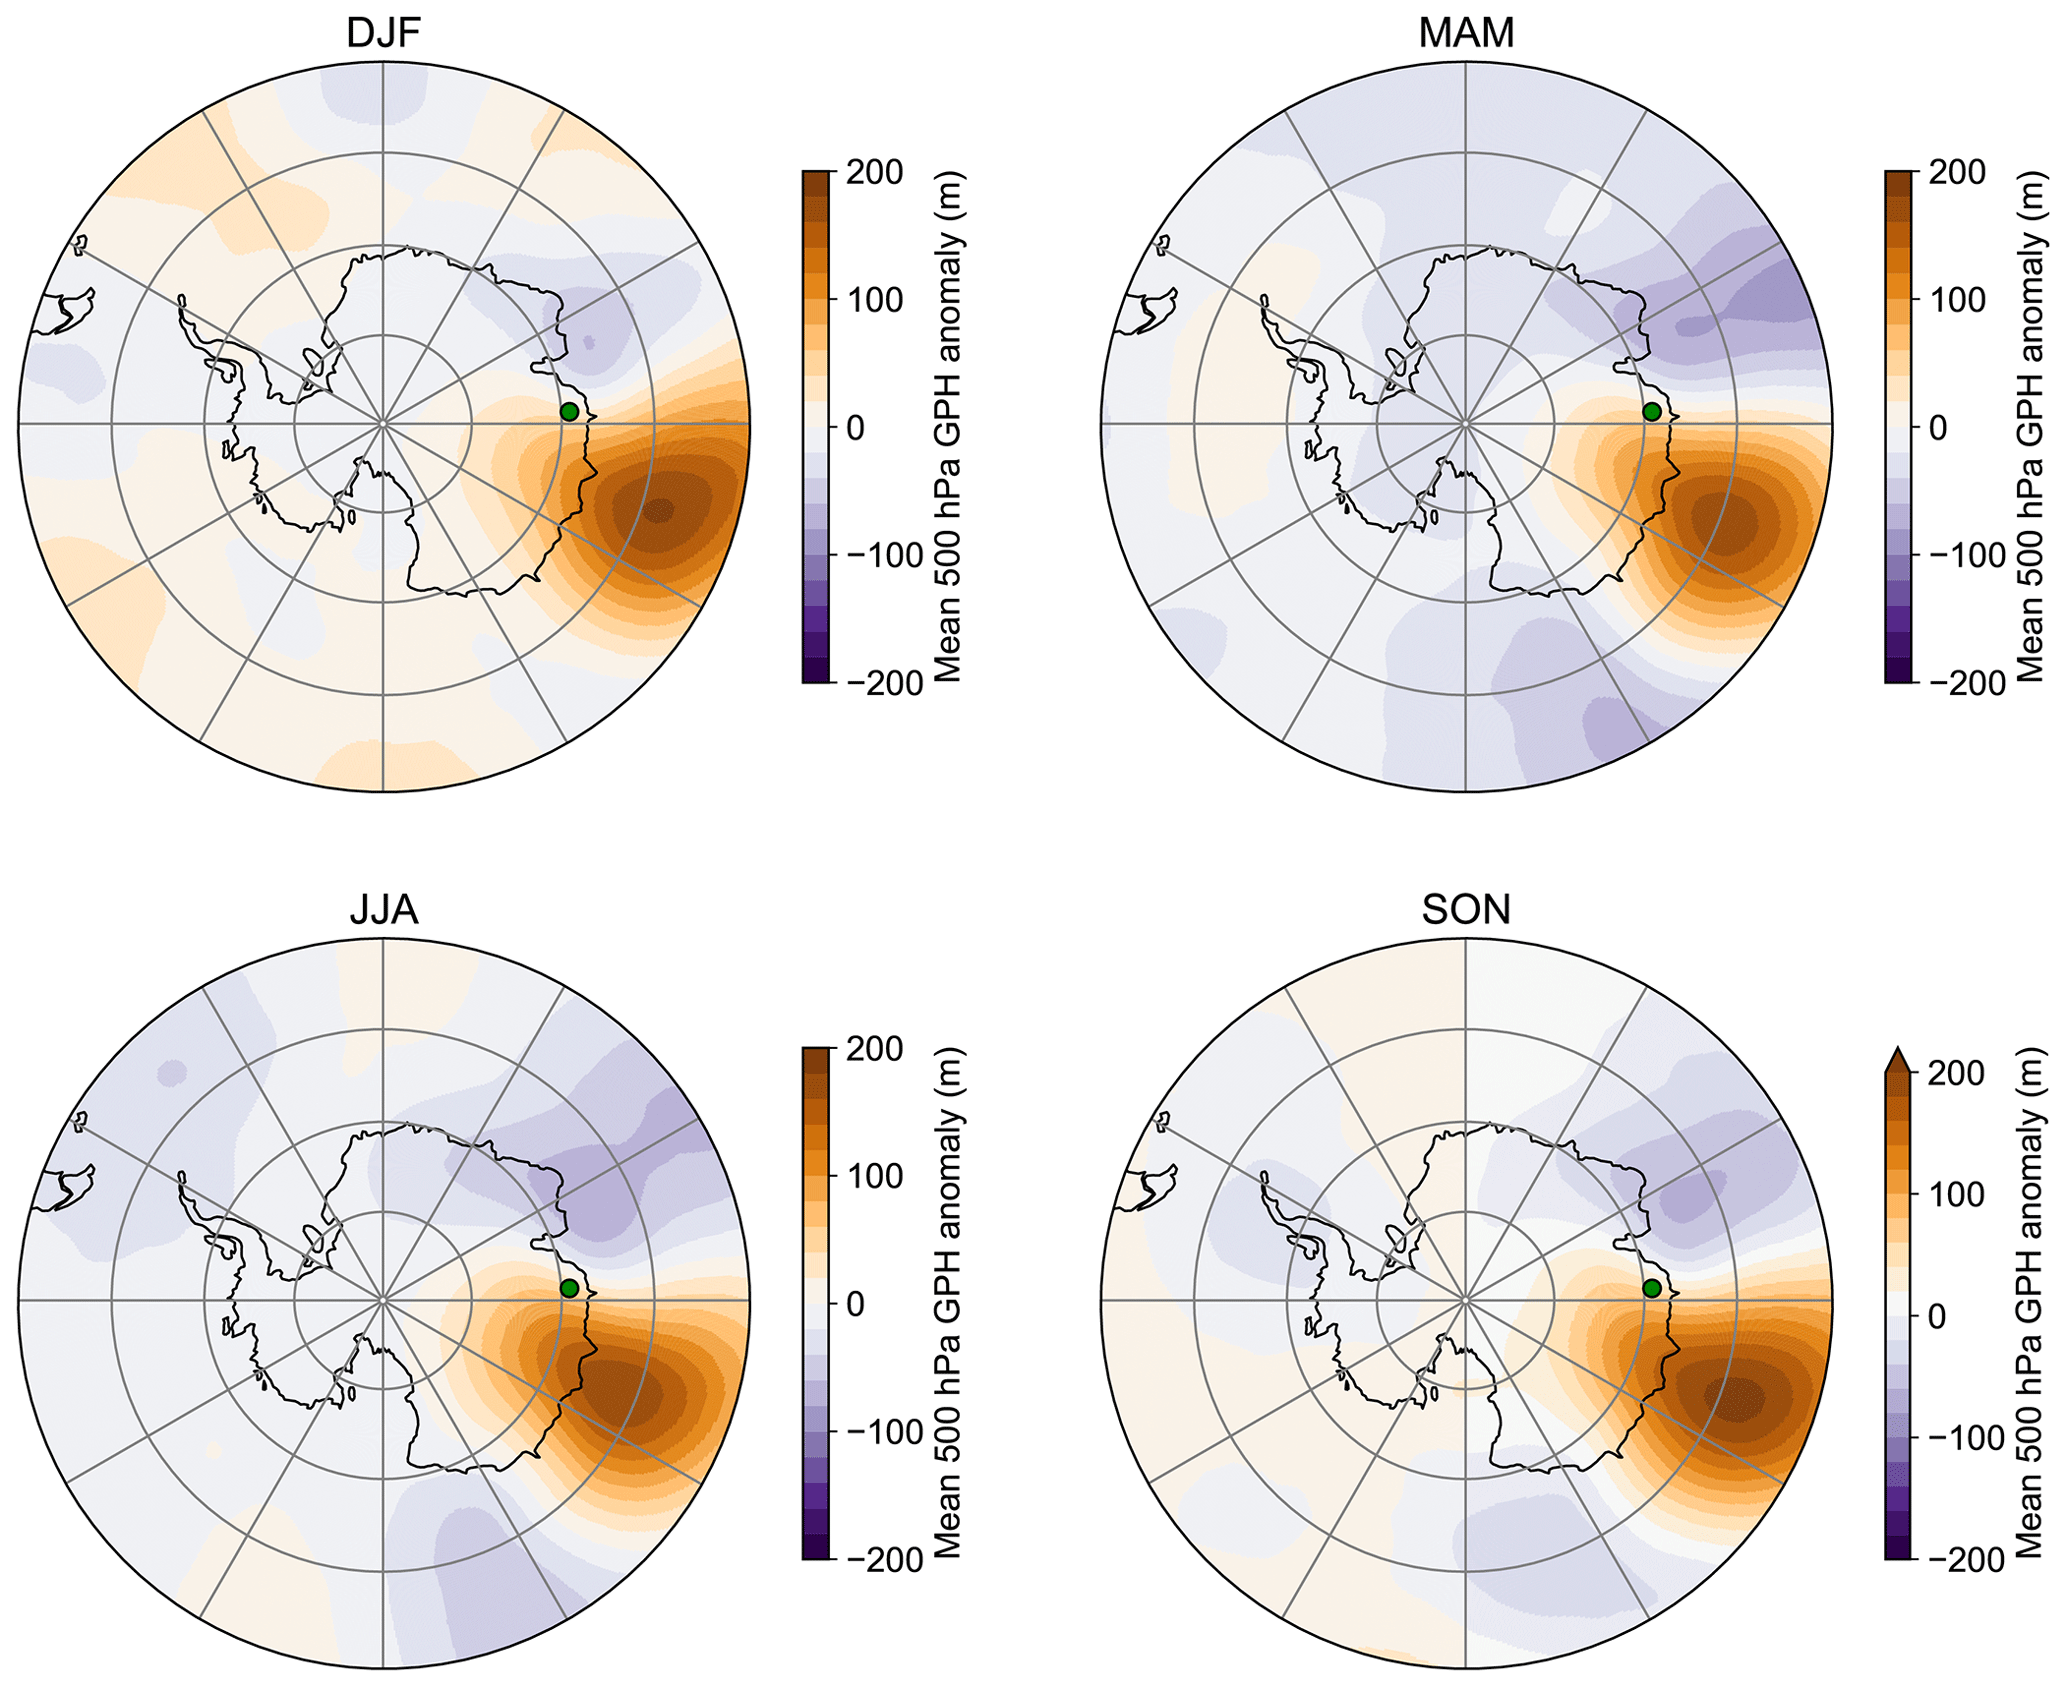
Figure A3Mean 500 hPa geopotential height anomaly for all EPE days identified using ERA-5 from 1979 to 2016 for each season (DJF, MAM, JJA, SON) relative to the seasonal mean from ERA-5. Grey bars indicate the regions between which the blocking index is calculated.
Table A1Pearson's correlation coefficient (r) for different accumulation (RACMO2.3p2 and ERA-5) and surface mass balance products (MARv3.9).
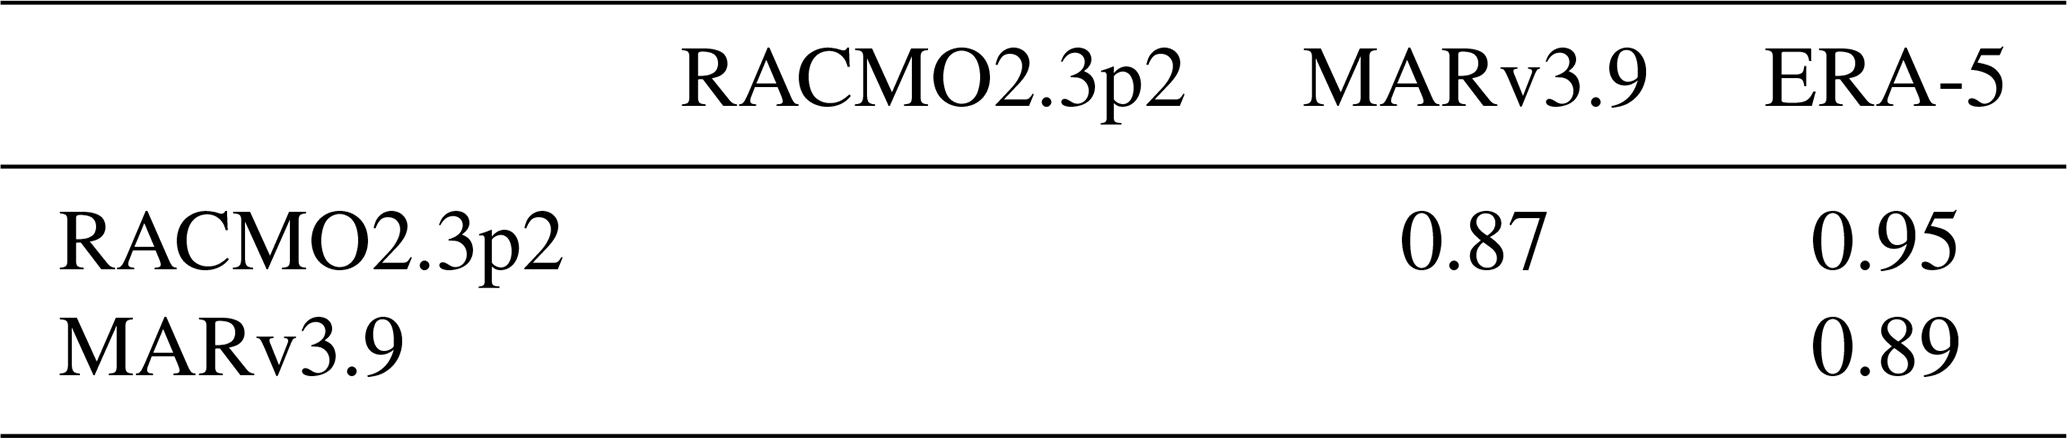
Table A2Percentage of days associated with each synoptic type from 1979 to 2016 from Udy et al. (2021). Days are filtered to only include days where an extreme precipitation day is identified. The threshold for EPE events is set at the 90th, 95th, and 99th percentile.
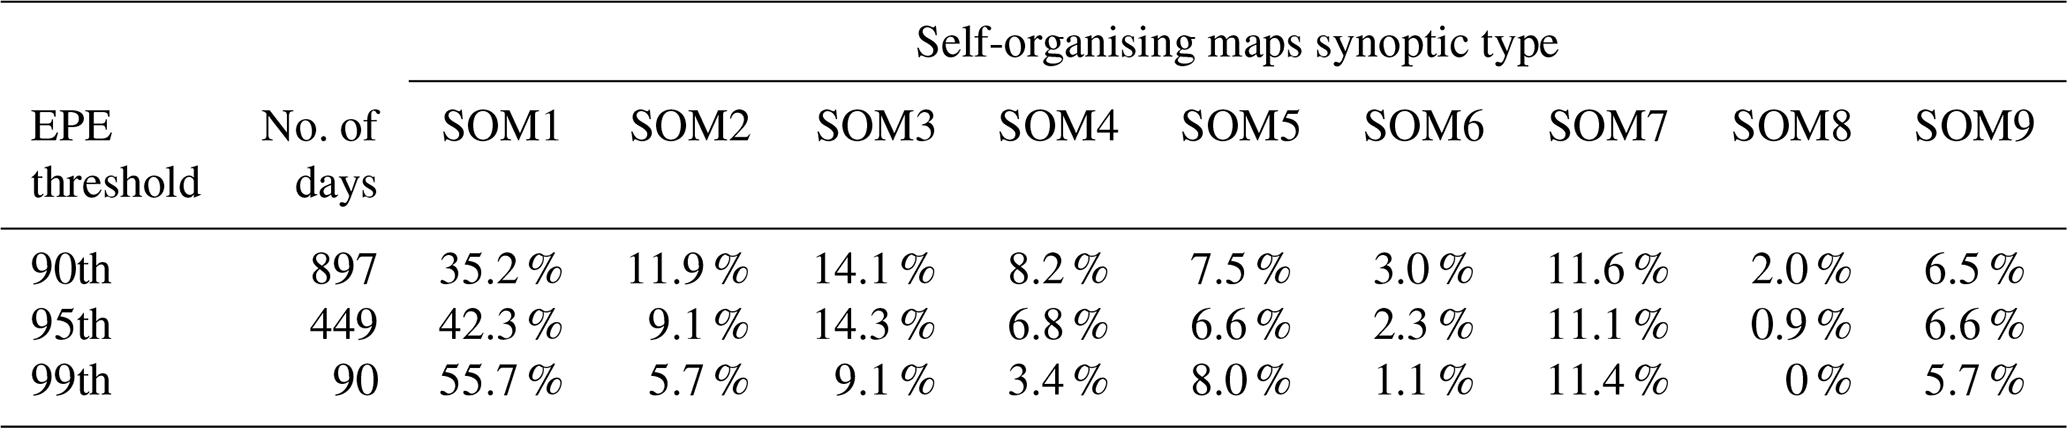
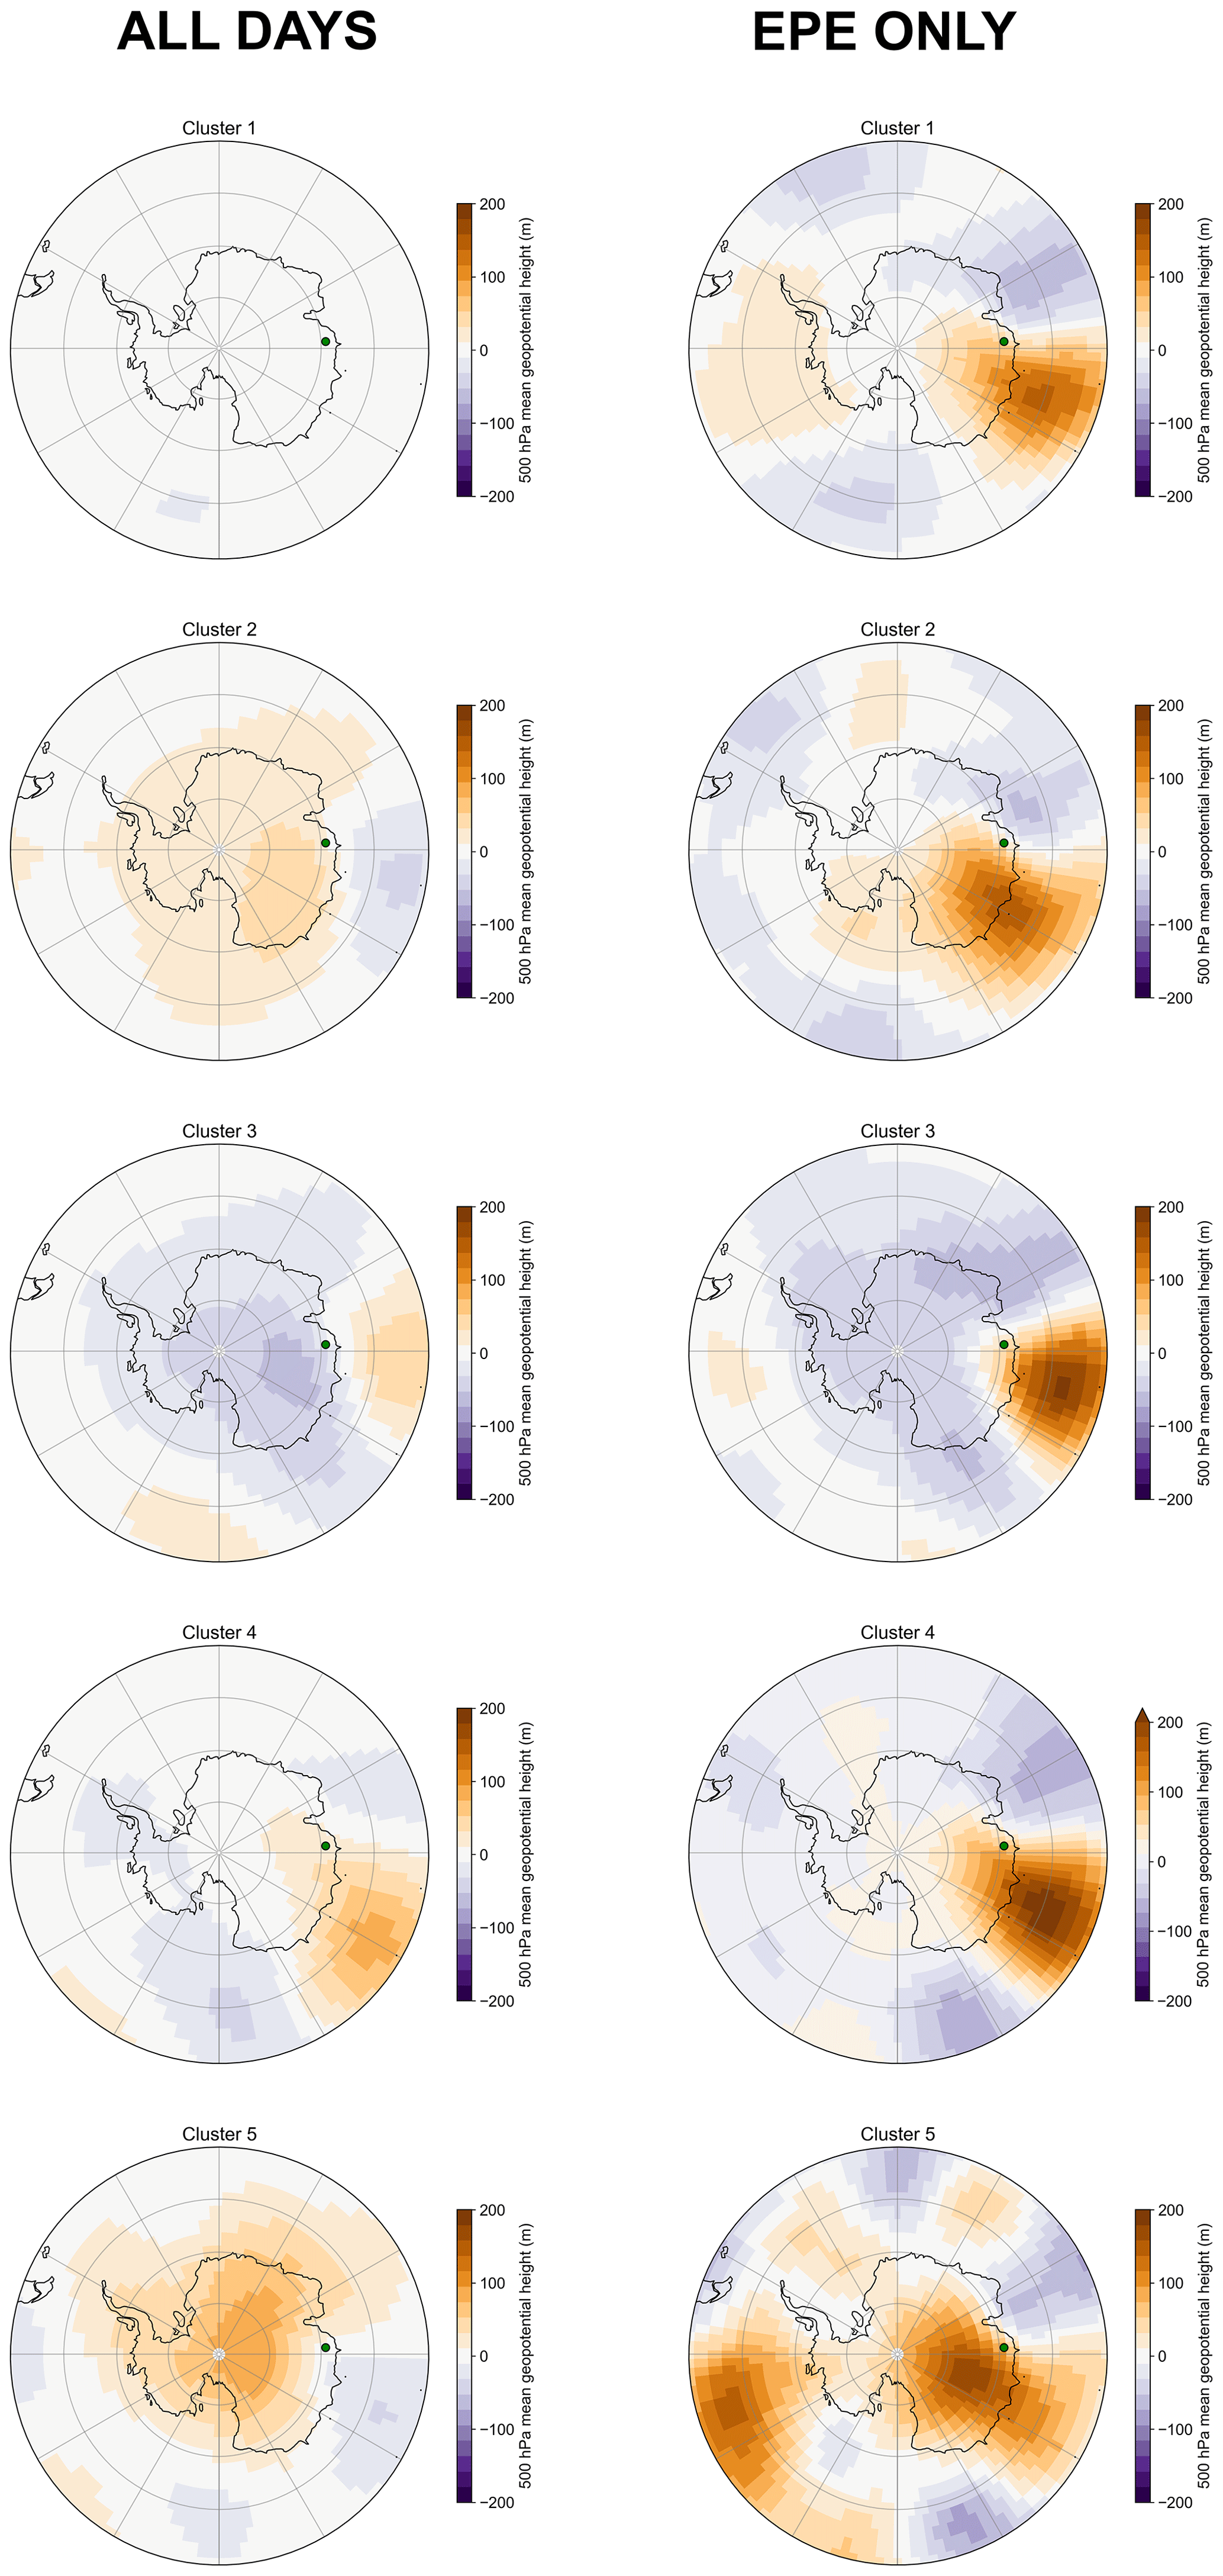
Figure A4Mean 500 hPa geopotential height anomaly using data from NCEP–NCAR for each cluster identified by HYSPLIT back-trajectory analysis. The left column shows mean anomalies for all days in each cluster, while the right column shows the anomalies only for days identified as EPEs using ERA-5 from 1979 to 2016.
The datasets used in this study are available online from the following locations: temperature and geopotential height data from ERA-5 are available at https://doi.org/10.24381/cds.adbb2d47 (Hersbach et al., 2023a) and https://doi.org/10.24381/cds.bd0915c6 (Hersbach et al., 2023b); geopotential height data from NCEP–NCAR are available in Kalnay et al. (1996); daily precipitation amounts from RACMO2.3p2 are available at https://doi.org/10.5285/bbf12a6f-7d97-4951-9bd1-e4224e2abac9 (van de Berg et al., 2019); surface mass balance data from MARv3.9 are available at https://doi.org/10.5281/zenodo.5195636 (Kittel et al., 2020); Mount Brown South Automated Weather Station temperature data are available at https://data.aad.gov.au/metadata/records/antarctic_aws (Allison and Heil, 2001); the atmospheric river catalogue is available at https://doi.org/10.26024/rawv-yx53 (NCAR, 2023); the daily synoptic typing dataset for the southern Indian Ocean is available at https://doi.org/10.4225/15/58eedf00d78fe (Udy et al., 2020); and the Mount Brown South ice core record accumulation data and dating dataset are available at https://doi.org/10.4225/15/58eedf6812621 (Crockart, 2021).
SLJ led the study, including the data analysis and writing of the manuscript. SLJ and NJA conceived the concept. TRV and NJA provided funding acquisition and assisted with project administration. TRV, CKC, ADM, and CTP contributed to ice core analysis and dating. All authors contributed to writing the manuscript.
At least one of the (co-)authors is a member of the editorial board of Climate of the Past. The peer-review process was guided by an independent editor, and the authors also have no other competing interests to declare.
Publisher's note: Copernicus Publications remains neutral with regard to jurisdictional claims in published maps and institutional affiliations.
This article is part of the special issue “Ice core science at the three poles (CP/TC inter-journal SI)”. It is a result of the IPICS 3rd Open Science Conference, Crans-Montana, Switzerland, 2–7 October 2022.
We thank all involved with the drilling and collection of the Mount Brown South ice core (Sharon Labudda, Paul Vallelonga, Allison Criscitiello, Jason Roberts, Peter Campbell). Sarah L. Jackson is supported by an Australian Research Training scholarship. Sarah L. Jackson and Nerilie J. Abram are both supported by the Australian Research Council (ARC) Centre of Excellence for Climate Extremes (CE170100023) and the ARC Australian Centre for Excellence in Antarctic Science (SR200100008). Tessa R. Vance acknowledges support from an ARC Discovery Project (DP180102522; DP220100606), the ARC Special Research Initiative for Antarctic Gateway Partnership (SR140300001), and the Australian Antarctic Program Partnership (ASCI000002). This work contributes to Australian Antarctic Science projects (4414, 4537, and 4061) and a National Science Foundation project (NSF P2C2 18041212).
This research has been supported by the Australian Research Council (ARC) Centre of Excellence for Climate Extremes (CE170100023) and the ARC Australian Centre for Excellence in Antarctic Science (SR200100008), ARC Discovery Projects (grant nos. DP180102522 and DP220100606), the ARC Special Research Initiative for the Antarctic Gateway Partnership (grant no. SR140300001), and the Australian Antarctic Program Partnership (ASCI000002) and a National Science Foundation project (grant no. NSF P2C2 1804121).
This paper was edited by Alexey Ekaykin and reviewed by Mathieu Casado and one anonymous referee.
Adusumilli, S., A. Fish, M., Fricker, H. A., and Medley, B.: Atmospheric River Precipitation Contributed to Rapid Increases in Surface Height of the West Antarctic Ice Sheet in 2019, Geophys. Res. Lett., 48, e2020GL091076, https://doi.org/10.1029/2020GL091076, 2021.
Allison, I. and Heil, P.: Surface meteorological data from a network of automatic weather stations at a number of Antarctic sites and sub-Antarctic sites, Ver. 1, Australian Antarctic Data Centre [data set], https://data.aad.gov.au/metadata/records/antarctic_aws (last access: 27 July 2021), 2001.
Arndt, J. E., Schenke, H. W., Jakobsson, M., Nitsche, F. O., Buys, G., Goleby, B., Rebesco, M., Bohoyo, F., Hong, J., Black, J., Greku, R., Udintsev, G., Barrios, F., Reynoso-Peralta, W., Taisei, M., and Wigley, R.: The International Bathymetric Chart of the Southern Ocean (IBCSO) Version 1.0 – A new bathymetric compilation covering circum-Antarctic waters, Geophys. Res. Lett., 40, 3111–3117, https://doi.org/10.1002/GRL.50413, 2013.
Augustin, L., Barbante, C., Barnes, P. R. F., Barnola, J. M., Bigler, M., Castellano, E., Cattani, O., Chappellaz, J., Dahl-Jensen, D., Delmonte, B., Dreyfus, G., Durand, G., Falourd, S., Fischer, H., Flückiger, J., Hansson, M. E., Huybrechts, P., Jugie, G., Johnsen, S. J., Jouzel, J., Kaufmann, P., Kipfstuhl, J., Lambert, F., Lipenkov, V. Y., Littot, G. C., Longinelli, A., Lorrain, R., Maggi, V., Masson-Delmotte, V., Miller, H., Mulvaney, R., Oerlemans, J., Oerter, H., Orombelli, G., Parrenin, F., Peel, D. A., Petit, J. R., Raynaud, D., Ritz, C., Ruth, U., Schwander, J., Siegenthaler, U., Souchez, R., Stauffer, B., Steffensen, J. P., Stenni, B., Stocker, T. F., Tabacco, I. E., Udisti, R., van de Wal, R. S. W., van den Broeke, M., Weiss, J., Wilhelms, F., Winther, J. G., Wolff, E. W., and Zucchelli, M.: Eight glacial cycles from an Antarctic ice core, Nature, 429, 623–628, https://doi.org/10.1038/nature02599, 2004.
Casado, M., Landais, A., Masson-Delmotte, V., Genthon, C., Kerstel, E., Kassi, S., Arnaud, L., Picard, G., Prie, F., Cattani, O., Steen-Larsen, H. C., Vignon, E., and Cermak, P.: Continuous measurements of isotopic composition of water vapour on the East Antarctic Plateau, Atmos. Chem. Phys., 16, 8521–8538, https://doi.org/10.5194/acp-16-8521-2016, 2016.
Casado, M., Landais, A., Picard, G., Münch, T., Laepple, T., Stenni, B., Dreossi, G., Ekaykin, A., Arnaud, L., Genthon, C., Touzeau, A., Masson-Delmotte, V., and Jouzel, J.: Archival processes of the water stable isotope signal in East Antarctic ice cores, The Cryosphere, 12, 1745–1766, https://doi.org/10.5194/tc-12-1745-2018, 2018.
Casado, M., Münch, T., and Laepple, T.: Climatic information archived in ice cores: Impact of intermittency and diffusion on the recorded isotopic signal in Antarctica, Clim. Past, 16, 1581–1598, https://doi.org/10.5194/cp-16-1581-2020, 2020.
Crockart, C. K.: El Niño Southern Oscillation signal in a new East Antarctic ice core, Mount Brown South, Ver. 1, Australian Antarctic Data Centre [data set], https://doi.org/10.4225/15/58eedf6812621, 2021.
Crockart, C. K., Vance, T. R., Fraser, A. D., Abram, N. J., Criscitiello, A. S., Curran, M. A., Favier, V., Gallant, A. J., Kittel, C., Kjaer, H. A., Klekociuk, A. R., Jong, L. M., Moy, A. D., Plummer, C. T., Vallelonga, P. T., Wille, J., and Zhang, L.: El Niño-Southern Oscillation signal in a new East Antarctic ice core, Mount Brown South, Clim. Past, 17, 1795–1818, https://doi.org/10.5194/cp-17-1795-2021, 2021.
Dansgaard, W.: Stable isotopes in precipitation, Tellus, 16, 436–468, https://doi.org/10.1111/j.2153-3490.1964.tb00181.x, 1964.
Delmotte, M., Masson, V., Jouzel, J., and Morgan, V. I.: A seasonal deuterium excess signal at Law Dome, coastal eastern Antarctica: A southern ocean signature, J. Geophys. Res.-Atmos., 105, 7187–7197, https://doi.org/10.1029/1999JD901085, 2000.
Ekaykin, A. A., Vladimirova, D. O., Lipenkov, V. Y., and Masson-Delmotte, V.: Climatic variability in Princess Elizabeth Land (East Antarctica) over the last 350 years, Clim. Past, 13, 61–71, https://doi.org/10.5194/cp-13-61-2017, 2017.
Fisher, D. A., Reeh, N., and Clausen, H. B.: Stratigraphic Noise in Time Series Derived from Ice Cores, Ann. Glaciol., 7, 76–83, https://doi.org/10.3189/S0260305500005942, 1985.
Foster, A. F. M., Curran, M. A. J., Smith, B. T., van Ommen, T. D., and Morgan, V. I.: Covariation of sea ice and methanesulphonic acid in Wilhelm II Land, East Antarctica, Ann. Glaciol., 44, 429–432, https://doi.org/10.3189/172756406781811394, 2006.
Fretwell, P., Pritchard, H. D., Vaughan, D. G., Bamber, J. L., Barrand, N. E., Bell, R., Bianchi, C., Bingham, R. G., Blankenship, D. D., Casassa, G., Catania, G., Callens, D., Conway, H., Cook, A. J., Corr, H. F. J., Damaske, D., Damm, V., Ferraccioli, F., Forsberg, R., Fujita, S., Gim, Y., Gogineni, P., Griggs, J. A., Hindmarsh, R. C. A., Holmlund, P., Holt, J. W., Jacobel, R. W., Jenkins, A., Jokat, W., Jordan, T., King, E. C., Kohler, J., Krabill, W., Riger-Kusk, M., Langley, K. A., Leitchenkov, G., Leuschen, C., Luyendyk, B. P., Matsuoka, K., Mouginot, J., Nitsche, F. O., Nogi, Y., Nost, O. A., Popov, S. V., Rignot, E., Rippin, D. M., Rivera, A., Roberts, J., Ross, N., Siegert, M. J., Smith, A. M., Steinhage, D., Studinger, M., Sun, B., Tinto, B. K., Welch, B. C., Wilson, D., Young, D. A., Xiangbin, C., and Zirizzotti, A.: Bedmap2: Improved ice bed, surface and thickness datasets for Antarctica, The Cryosphere, 7, 375–393, https://doi.org/10.5194/tc-7-375-2013, 2013.
Gorodetskaya, I. V., Tsukernik, M., Claes, K., Ralph, M. F., Neff, W. D., and Van Lipzig, N. P. M.: The role of atmospheric rivers in anomalous snow accumulation in East Antarctica, Geophys. Res. Lett., 41, 6199–6206, https://doi.org/10.1002/2014GL060881, 2014.
Greene, C. A., Gwyther, D. E., and Blankenship, D. D.: Antarctic Mapping Tools for Matlab, Comput. Geosci., 104, 151–157, https://doi.org/10.1016/J.CAGEO.2016.08.003, 2017.
Groot Zwaaftink, C. D., Cagnati, A., Crepaz, A., Fierz, C., MacElloni, G., Valt, M., and Lehning, M.: Event-driven deposition of snow on the Antarctic Plateau: Analyzing field measurements with SNOWPACK, The Cryosphere, 7, 333–347, https://doi.org/10.5194/tc-7-333-2013, 2013.
Hersbach, H., Bell, B., Berrisford, P., Biavati, G., Horányi, A., Muñoz Sabater, J., Nicolas, J., Peubey, C., Radu, R., Rozum, I., Schepers, D., Simmons, A., Soci, C., Dee, D., and Thépaut, J.-N.: ERA5 hourly data on single levels from 1940 to present, Copernicus Climate Change Service (C3S) Climate Data Store (CDS) [data set], https://doi.org/10.24381/cds.adbb2d47, 2023a.
Hersbach, H., Bell, B., Berrisford, P., Biavati, G., Horányi, A., Muñoz Sabater, J., Nicolas, J., Peubey, C., Radu, R., Rozum, I., Schepers, D., Simmons, A., Soci, C., Dee, D., and Thépaut, J.-N.: ERA5 hourly data on pressure levels from 1940 to present, Copernicus Climate Change Service (C3S) Climate Data Store (CDS) [data set], https://doi.org/10.24381/cds.bd0915c6, 2023b.
IPICS: International Priorities and Challenges in Antarctic Ice Core Science: A Contribution to the COMNAP Antarctic Roadmap Challenges, https://static1.squarespace.com/static/61073506e9b0073c7eaaf464/t/6114888d0d80f776ba42287b/1628735630121/IPICS_Whitepaper_6August2015.pdf (last access: 15 April 2023), 2015.
Johnsen, S. J., Hansen, S. B., Sheldon, S. G., Dahl-Jensen, D., Steffensen, J. P., Augustin, L., Journé, P., Alemany, O., Rufli, H., Schwander, J., Azuma, N., Motoyama, H., Popp, T., Talalay, P., Thorsteinsson, T., Wilhelms, F., and Zagorodnov, V.: The Hans Tausen drill: design, performance, further developments and some lessons learned, Ann. Glaciol., 47, 89–98, https://doi.org/10.3189/172756407786857686, 2007.
Jones, J. M., Gille, S. T., Goosse, H., Abram, N. J., Canziani, P. O., Charman, D. J., Clem, K. R., Crosta, X., De Lavergne, C., Eisenman, I., England, M. H., Fogt, R. L., Frankcombe, L. M., Marshall, G. J., Masson-Delmotte, V., Morrison, A. K., Orsi, A. J., Raphael, M. N., Renwick, J. A., Schneider, D. P., Simpkins, G. R., Steig, E. J., Stenni, B., Swingedouw, D., and Vance, T. R.: Assessing recent trends in high-latitude Southern Hemisphere surface climate, Nat. Clim. Change, 6, 917–926, https://doi.org/10.1038/nclimate3103, 2016.
Jones, P. D. and Lister, D. H.: Antarctic near-surface air temperatures compared with ERA-Interim values since 1979, Int. J. Climatol., 35, 1354–1366, https://doi.org/10.1002/JOC.4061, 2015.
Jouzel, J., Alley, R. B., Cuffey, K. M., Dansgaard, W., Grootes, P., Hoffmann, G., Johnsen, S. J., Koster, R. D., Peel, D., Shuman, C. A., Stievenard, M., Stuiver, M., and White, J.: Validity of the temperature reconstruction from water isotopes in ice cores, J. Geophys. Res.-Oceans, 102, 26471–26487, https://doi.org/10.1029/97JC01283, 1997.
Kalnay, E., Kanamitsu, M., Kistler, R., Collins, W., Deaven, D., Gandin, L., Iredell, M., Saha, S., White, G., Woollen, J., Zhu, Y., Chelliah, M., Ebisuzaki, W., Higgins, W., Janowiak, J., Mo, K. C., Ropelewski, C., Wang, J., Leetmaa, A., Reynolds, R., Jenne, R., and Joseph, D.: The NCEP/NCAR 40-Year Reanalysis Project, B. Am. Meteorol. Soc., 77, 437–472, https://doi.org/10.1175/1520-0477(1996)077<0437:TNYRP>2.0.CO;2, 1996.
Kaufmann, P., Fundel, F., Fischer, H., Bigler, M., Ruth, U., Udisti, R., Hansson, M., de Angelis, M., Barbante, C., Wolff, E. W., Hutterli, M., and Wagenbach, D.: Ammonium and non-sea salt sulfate in the EPICA ice cores as indicator of biological activity in the Southern Ocean, Quaternary Sci. Rev., 29, 313–323, https://doi.org/10.1016/J.QUASCIREV.2009.11.009, 2010.
Kittel, C., Amory, C., Agosta, C., and Fettweis, X.: MARv3.10 outputs: What is the Surface Mass Balance of Antarctica? An Intercomparison of Regional Climate Model Estimates, Zenodo [data set], https://doi.org/10.5281/zenodo.5195636, 2020.
Li, X., Cai, W., Meehl, G. A., Chen, D., Yuan, X., Raphael, M., Holland, D. M., Ding, Q., Fogt, R. L., Markle, B. R., Wang, G., Bromwich, D. H., Turner, J., Xie, S.-P., Steig, E. J., Gille, S. T., Xiao, C., Wu, B., Lazzara, M. A., Chen, X., Stammerjohn, S., Holland, P. R., Holland, M. M., Cheng, X., Price, S. F., Wang, Z., Bitz, C. M., Shi, J., Gerber, E. P., Liang, X., Goosse, H., Yoo, C., Ding, M., Geng, L., Xin, M., Li, C., Dou, T., Liu, C., Sun, W., Wang, X., and Song, C.: Tropical teleconnection impacts on Antarctic climate changes, Nat. Rev. Earth Environ. 2021, 1–19, https://doi.org/10.1038/s43017-021-00204-5, 2021.
Lorius, C., Merlivat, L., and Hagemann, R.: Variation in the mean deuterium content of precipitations in Antarctica, J. Geophys. Res., 74, 7027–7031, https://doi.org/10.1029/JC074I028P07027, 1969.
Markle, B. R. and Steig, E. J.: Improving temperature reconstructions from ice-core water-isotope records, Clim. Past, 18, 1321–1368, https://doi.org/10.5194/cp-18-1321-2022, 2022.
Markle, B. R., Bertler, N. A. N., Sinclair, K. E., and Sneed, S. B.: Synoptic variability in the Ross Sea region, Antarctica, as seen from back-trajectory modeling and ice core analysis, J. Geophys. Res., 117, D02113, https://doi.org/10.1029/2011JD016437, 2012.
Masson-Delmotte, V., Hou, S., Ekaykin, A., Jouzel, J., Aristarain, A., Bernardo, R. T., Bromwich, D., Cattani, O., Delmotte, M. M., Falourd, S., Frezzotti, M., Gallée, H., Genoni, L., Isaksson, E., Landais, A., Helsen, M. M., Hoffmann, G., Lopez, J., Morgan, V., Motoyama, H., Noone, D., Oerter, H., Petit, J. R., Royer, A., Uemura, R., Schmidt, G. A., Schlosser, E., Simões, J. C., Steig, E. J., Stenni, B., Stievenard, M., Van Den Broeke, M. R., Van De Wal, R. S. W., Van De Berg, W. J., Vimeux, F., and White, J. W. C.: A Review of Antarctic Surface Snow Isotopic Composition: Observations, Atmospheric Circulation, and Isotopic Modeling, J. Climate, 21, 3359–3387, https://doi.org/10.1175/2007JCLI2139.1, 2008.
McMorrow, A., Van Ommen, T., Morgan, V., and Curran, M. A. J.: Ultra-high-resolution seasonality of trace-ion species and oxygen isotope ratios in Antarctic firn over four annual cycles, Ann. Glaciol., 39, 34–40, https://doi.org/10.3189/172756404781814609, 2004.
Münch, T. and Laepple, T.: What climate signal is contained in decadal-to centennial-scale isotope variations from Antarctic ice cores?, Clim. Past, 14, 2053–2070, https://doi.org/10.5194/cp-14-2053-2018, 2018.
Münch, T., Kipfstuhl, S., Freitag, J., Meyer, H., and Laepple, T.: Regional climate signal vs. local noise: A two-dimensional view of water isotopes in Antarctic firn at Kohnen Station, Dronning Maud Land, Clim. Past, 12, 1565–1581, https://doi.org/10.5194/cp-12-1565-2016, 2016.
Münch, T., Werner, M., and Laepple, T.: How precipitation intermittency sets an optimal sampling distance for temperature reconstructions from Antarctic ice cores, Clim. Past, 17, 1587–1605, https://doi.org/10.5194/cp-17-1587-2021, 2021.
Nakamura, H. and Shimpo, A.: Seasonal Variations in the Southern Hemisphere Storm Tracks and Jet Streams as Revealed in a Reanalysis Dataset, J. Climate, 17, 1828–1844, 2004.
NCAR: ARTMIP Tier 2 Reanalysis catalogue, NCAR [data set], https://doi.org/10.26024/rawv-yx53, 2023.
Persson, A., Langen, P. L., Ditlevsen, P., and Vinther, B. M.: The influence of precipitation weighting on interannual variability of stable water isotopes in Greenland, J. Geophys. Res.-Atmos., 116, 20120, https://doi.org/10.1029/2010JD015517, 2011.
Pohl, B., Favier, V., Wille, J., Udy, D. G., Vance, T. R., Pergaud, J., Dutrievoz, N., Blanchet, J., Kittel, C., Amory, C., Krinner, G., and Codron, F.: Relationship Between Weather Regimes and Atmospheric Rivers in East Antarctica, J. Geophys. Res.-Atmos., 126, e2021JD035294, https://doi.org/10.1029/2021JD035294, 2021.
Pook, M. and Gibson, T.: Atmospheric blocking and storm tracks during SOP-1 of the FROST Project, June Special Edition, Aust. Meteorol. Mag., 48, 51–60, 1999.
Ritter, F., Christian Steen-Larsen, H., Werner, M., Masson-Delmotte, V., Orsi, A., Behrens, M., Birnbaum, G., Freitag, J., Risi, C., and Kipfstuhl, S.: Isotopic exchange on the diurnal scale between near-surface snow and lower atmospheric water vapor at Kohnen station, East Antarctica, The Cryosphere, 10, 1647–1663, https://doi.org/10.5194/tc-10-1647-2016, 2016.
Roberts, J., Plummer, C., Vance, T., van Ommen, T., Moy, A., Poynter, S., Treverrow, A., Curran, M., and George, S.: A 2000-year annual record of snow accumulation rates for Law Dome, East Antarctica, Clim. Past, 11, 697–707, https://doi.org/10.5194/cp-11-697-2015, 2015.
Scarchilli, C., Frezzotti, M., and Ruti, P. M.: Snow precipitation at four ice core sites in East Antarctica: Provenance, seasonality and blocking factors, Clim. Dynam., 37, 2107–2125, https://doi.org/10.1007/s00382-010-0946-4, 2011.
Servettaz, A. P. M., Orsi, A. J., Curran, M. A. J., Moy, A. D., Landais, A., Agosta, C., Holly, V., Winton, L., Touzeau, A., Mcconnell, J. R., Werner, M., and Baroni, M.: Snowfall and Water Stable Isotope Variability in East Antarctica Controlled by Warm Synoptic Events, J. Geophys. Res.-Atmos., 125, e2020JD032863, https://doi.org/10.1029/2020JD032863, 2020.
Sheldon, S. G., Popp, T. J., Hansen, S. B., Hedegaard, T. M., and Mortensen, C.: A new intermediate-depth ice-core drilling system, Ann. Glaciol., 55, 271–284, https://doi.org/10.3189/2014AOG68A038, 2014.
Sime, L. C., Marshall, G. J., Mulvaney, R., and Thomas, E. R.: Interpreting temperature information from ice cores along the Antarctic Peninsula: ERA40 analysis, Geophys. Res. Lett., 36, 18801, https://doi.org/10.1029/2009GL038982, 2009.
Sinclair, K. E., Bertler, N. A. N., Trompetter, W. J., and Baisden, W. T.: Seasonality of Airmass Pathways to Coastal Antarctica: Ramifications for Interpreting High-Resolution Ice Core Records, J. Climate, 26, 2065–2076, https://doi.org/10.1175/JCLI-D-12-00167.1, 2013.
Smith, B. T., van Ommen, T. D., and Morgan, V. I.: Distribution of oxygen isotope ratios and snow accumulation rates in Wilhelm II Land, East Antarctica, Ann. Glaciol., 35, 107–110, https://doi.org/10.3189/172756402781816898, 2002.
Stein, A. F., Draxler, R. R., Rolph, G. D., Stunder, B. J. B., Cohen, M. D., and Ngan, F.: NOAA's HYSPLIT Atmospheric Transport and Dispersion Modeling System, B. Am. Meteorol. Soc., 96, 2059–2077, https://doi.org/10.1175/BAMS-D-14-00110.1, 2015.
Stenni, B., J Curran, M. A., Abram, N. J., Orsi, A., Goursaud, S., Masson-Delmotte, V., Neukom, R., Goosse, H., Divine, D., van Ommen, T., Steig, E. J., Dixon, D. A., Thomas, E. R., N Bertler, N. A., Isaksson, E., Ekaykin, A., Werner, M., and Frezzotti, M.: Antarctic climate variability on regional and continental scales over the last 2000 years, Clim. Past, 13, 1609–1634, https://doi.org/10.5194/cp-13-1609-2017, 2017.
Stokes, C. R., Abram, N. J., Bentley, M. J., Edwards, T. L., England, M. H., Foppert, A., Jamieson, S. S. R., Jones, R. S., King, M. A., Lenaerts, J. T. M., Medley, B., Miles, B. W. J., Paxman, G. J. G., Ritz, C., van de Flierdt, T., and Whitehouse, P. L.: Response of the East Antarctic Ice Sheet to past and future climate change, Nature, 608, 275–286, https://doi.org/10.1038/s41586-022-04946-0, 2022.
Tetzner, D., Thomas, E., and Allen, C.: A Validation of ERA5 Reanalysis Data in the Southern Antarctic Peninsul a– Ellsworth Land Region, and Its Implications for Ice Core Studies, Geosciences, 9, 289, https://doi.org/10.3390/GEOSCIENCES9070289, 2019.
Thomas, E. R., Dennis, P. F., Bracegirdle, T. J., and Franzke, C.: Ice core evidence for significant 100-year regional warming on the Antarctic Peninsula, Geophys. Res. Lett., 36, 20704, https://doi.org/10.1029/2009GL040104, 2009.
Trenberth, K.: Storm Tracks in the Southern Hemisphere, J. Atmos. Sci., 48, 2159–2178, 1991.
Trenberth, K. and Caron, J.: Estimates of meridional atmosphere and ocean heat transports, J. Climate, 14, 3433–3443, 2001.
Turner, J., Colwell, S. R., Marshall, G. J., Lachlan-Cope, T. A., Carleton, A. M., Jones, P. D., Lagun, V., Reid, P. A., and Iagovkina, S.: Antarctic climate change during the last 50 years, Int. J. Climatol., 25, 279–294, https://doi.org/10.1002/JOC.1130, 2005.
Turner, J., Barrand, N. E., Bracegirdle, T. J., Convey, P., Hodgson, D. A., Jarvis, M., Jenkins, A., Marshall, G., Meredith, M. P., Roscoe, H., Shanklin, J., French, J., Goosse, H., Guglielmin, M., Gutt, J., Jacobs, S., Kennicutt, M. C., Masson-Delmotte, V., Mayewski, P., Navarro, F., Robinson, S., Scambos, T., Sparrow, M., Summerhayes, C., Speer, K., and Klepikov, A.: Antarctic climate change and the environment: An update, Polar Rec., 50, 237–259, https://doi.org/10.1017/S0032247413000296, 2014.
Turner, J., Phillips, T., Thamban, M., Rahaman, W., Marshall, G. J., Wille, J. D., Favier, V., Winton, V. H. L., Thomas, E., Wang, Z., van den Broeke, M., Hosking, J. S., and Lachlan-Cope, T.: The Dominant Role of Extreme Precipitation Events in Antarctic Snowfall Variability, Geophys. Res. Lett., 46, 3502–3511, https://doi.org/10.1029/2018GL081517, 2019.
Turner, J., Marshall, G. J., Clem, K., Colwell, S., Phillips, T., and Lu, H.: Antarctic temperature variability and change from station data, Int. J. Climatol., 40, 2986–3007, https://doi.org/10.1002/JOC.6378, 2020.
Turner, J., Lu, H., King, J. C., Carpentier, S., Lazzara, M., Phillips, T., and Wille, J.: An Extreme High Temperature Event in Coastal East Antarctica Associated With an Atmospheric River and Record Summer Downslope Winds, Geophys. Res. Lett., 49, e2021GL097108, https://doi.org/10.1029/2021GL097108, 2022.
Udy, D., Vance, T., Kiem, A., Holbrook, N., and Curran, M.: Daily synoptic weather types of southern Indian Ocean: January 1979–October 2018, Ver. 1, Australian Antarctic Data Centre [data set], https://doi.org/10.4225/15/58eedf00d78fe, 2020.
Udy, D. G., Vance, T. R., Kiem, A. S., Holbrook, N. J., and Curran, M. A. J.: Links between Large-Scale Modes of Climate Variability and Synoptic Weather Patterns in the Southern Indian Ocean, J. Climate, 34, 883–899, https://doi.org/10.1175/JCLI-D-20-0297.1, 2021.
Udy, D. G., Vance, T. R., Kiem, A. S., and Holbrook, N. J.: A synoptic bridge linking sea salt aerosol concentrations in East Antarctic snowfall to Australian rainfall, Commun. Earth Environ., 31, 3, https://doi.org/10.1038/s43247-022-00502-w, 2022.
Vance, T. R., van Ommen, T. D., Curran, M. A. J., Plummer, C. T., and Moy, A. D.: A Millennial Proxy Record of ENSO and Eastern Australian Rainfall from the Law Dome Ice Core, East Antarctica, J. Climate, 26, 710–725, https://doi.org/10.1175/JCLI-D-12-00003.1, 2013.
Vance, T. R., Roberts, J. L., Plummer, C. T., Kiem, A. S., and van Ommen, T. D.: Interdecadal Pacific variability and eastern Australian megadroughts over the last millennium, Geophys. Res. Lett., 42, 129–137, https://doi.org/10.1002/2014GL062447, 2015.
Vance, T. R., Roberts, J. L., Moy, A. D., Curran, M. A. J., Tozer, C. R., Gallant, A. J. E., Abram, N. J., van Ommen, T. D., Young, D. A., Grima, C., Blankenship, D. D., and Siegert, M. J.: Optimal site selection for a high-resolution ice core record in East Antarctica, Clim. Past, 12, 595–610, https://doi.org/10.5194/cp-12-595-2016, 2016.
Vance, T. R., Kiem, A. S., Jong, L. M., Roberts, J. L., Plummer, C. T., Moy, A. D., Curran, M. A. J., and van Ommen, T. D.: Pacific decadal variability over the last 2000 years and implications for climatic risk, Commun. Earth Environ., 31, 3, https://doi.org/10.1038/s43247-022-00359-z, 2022.
van de Berg, W., van Wessem, M., van de Broeke, M., Turner, J., and Phillips, T.: Antarctic daily precipitation amounts for January 1979–July 2017 from the RACMO version 3p2 limited area atmospheric model, along with flags that indicate extreme precipitation events (Version 1), UK Polar Data Centre, Natural Environment Research Council, UK Research & Innovation [data set], https://doi.org/10.5285/bbf12a6f-7d97-4951-9bd1-e4224e2abac9, 2019.
van Ommen, T. D. and Morgan, V.: Snowfall increase in coastal East Antarctica linked with southwest Western Australian drought, Nat. Geosci., 34, 267–272, https://doi.org/10.1038/ngeo761, 2010.
Wang, Y., Ding, M., Reijmer, C. H., Smeets, P. C. J. P., Hou, S., and Xiao, C.: The AntSMB dataset: a comprehensive compilation of surface mass balance field observations over the Antarctic Ice Sheet, Earth Syst. Sci. Data, 13, 3057–3074, https://doi.org/10.5194/essd-13-3057-2021, 2021.
Wille, J. D., Favier, V., Gorodetskaya, I. V., Agosta, C., Kittel, C., Beeman, J. C., Jourdain, N. C., Lenaerts, J. T. M., and Codron, F.: Antarctic Atmospheric River Climatology and Precipitation Impacts, J. Geophys. Res.-Atmos., 126, e2020JD033788, https://doi.org/10.1029/2020JD033788, 2021.
Wright, A. D. F.: Blocking action in the Australian region, Tech. Rep. no. 10, 29 pp., 1974.
Yuan, X., Kaplan, M. R., and Cane, M. A.: The Interconnected Global Climate System – A Review of Tropical–Polar Teleconnections, J. Climate, 31, 5765–5792, https://doi.org/10.1175/JCLI-D-16-0637.1, 2018.
Zheng, Y., Jong, L. M., Phipps, S. J., Roberts, J. L., Moy, A. D., Curran, M. A. J., and van Ommen, T. D.: Extending and understanding the South West Western Australian rainfall record using a snowfall reconstruction from Law Dome, East Antarctica, Clim. Past, 17, 1973–1987, https://doi.org/10.5194/cp-17-1973-2021, 2021.
Zhu, J., Xie, A., Qin, X., Wang, Y., Xu, B., and Wang, Y.: An Assessment of ERA5 Reanalysis for Antarctic Near-Surface Air Temperature, Atmosphere, 12, 217, https://doi.org/10.3390/ATMOS12020217, 2021.
- Abstract
- Introduction
- Methods
- Results and discussion
- Conclusions
- Appendix A: Climatology of the Mount Brown South ice core site in East Antarctica: implications for the interpretation of a water isotope record
- Data availability
- Author contributions
- Competing interests
- Disclaimer
- Special issue statement
- Acknowledgements
- Financial support
- Review statement
- References