the Creative Commons Attribution 4.0 License.
the Creative Commons Attribution 4.0 License.
 | 08 Aug 2023
Tracing North Atlantic volcanism and seaway connectivity across the Paleocene–Eocene Thermal Maximum (PETM)
Ella W. Stokke
Alan D. Rooney
Joost Frieling
Philip A. E. Pogge von Strandmann
David J. Wilson
Henrik H. Svensen
Sverre Planke
Thierry Adatte
Nicolas Thibault
Madeleine L. Vickers
Tamsin A. Mather
Christian Tegner
Valentin Zuchuat
Bo P. Schultz
There is a temporal correlation between the peak activity of the North Atlantic Igneous Province (NAIP) and the Paleocene–Eocene Thermal Maximum (PETM), suggesting that the NAIP may have initiated and/or prolonged this extreme warming event. However, corroborating a causal relationship is hampered by a scarcity of expanded sedimentary records that contain both climatic and volcanic proxies. One locality hosting such a record is the island of Fur in Denmark, where an expanded pre- to post-PETM succession containing hundreds of NAIP ash layers is exceptionally well preserved. We compiled a range of environmental proxies, including mercury (Hg) anomalies, paleotemperature proxies, and lithium (Li) and osmium (Os) isotopes, to trace NAIP activity, hydrological changes, weathering, and seawater connectivity across this interval. Volcanic proxies suggest that NAIP activity was elevated before the PETM and appears to have peaked during the body of the δ13C excursion but decreased considerably during the PETM recovery. This suggests that the acme in NAIP activity, dominated by flood basalt volcanism and thermogenic degassing from contact metamorphism, was likely confined to just ∼ 200 kyr (ca. 56.0–55.8 Ma). The hundreds of thick (> 1 cm) basaltic ashes in the post-PETM strata likely represent a change from effusive to explosive activity, rather than an increase in NAIP activity. Detrital δ7Li values and clay abundances suggest that volcanic ash production increased the basaltic reactive surface area, likely enhancing silicate weathering and atmospheric carbon sequestration in the early Eocene. Signals in lipid biomarkers and Os isotopes, traditionally used to trace paleotemperature and weathering changes, are used here to track seaway connectivity. These proxies indicate that the North Sea was rapidly cut off from the North Atlantic in under 12 kyr during the PETM recovery due to NAIP thermal uplift. Our findings reinforce the hypothesis that the emplacement of the NAIP had a profound and complex impact on Paleocene–Eocene climate, both directly through volcanic and thermogenic degassing and indirectly by driving regional uplift and changing seaway connectivity.
- Article
(6789 KB) - Full-text XML
-
Supplement
(434 KB) - BibTeX
- EndNote


The Paleocene–Eocene Thermal Maximum (PETM) (Kennett and Stott, 1991) was a period of extreme global warming during the greenhouse conditions already present during the early Cenozoic (Cramwinckel et al., 2018; Zachos et al., 2008). This hyperthermal event began at ∼ 56.0–55.9 Ma (Westerhold et al., 2017; Zeebe and Lourens, 2019) and lasted for ∼ 150–200 kyr (Murphy et al., 2010; Röhl et al., 2007). The PETM is characterised in the sedimentary record by a large and sustained negative carbon isotope (δ13C) excursion (CIE) that varies in magnitude from 2 ‰ to 7 ‰, with the larger excursions generally found in organic and terrestrial archives (McInerney and Wing, 2011). The carbon cycle perturbations, and particularly the CIE onset, are traditionally attributed to the rapid release of large volumes of 12C-enriched carbon to the ocean–atmosphere system (Dickens et al., 1995; Zachos et al., 2008), which caused an estimated global surface warming of ∼ 5 ∘C (Dunkley-Jones et al., 2013; Frieling et al., 2017; Inglis et al., 2020). The potential triggers of the PETM remain contentious, despite intense study of many sedimentary sections through Paleocene–Eocene strata. Carbon sources that have received significant attention are the destabilisation of surface reservoirs such as methane hydrates (Dickens et al., 1995), possibly triggered by orbital forcing (Li et al., 2022; Lourens et al., 2005). Other well-studied sources include the direct volcanic emissions from the North Atlantic Igneous Province (NAIP) (Eldholm and Thomas, 1993; Storey et al., 2007a) and thermogenic degassing from NAIP contact metamorphism (Svensen et al., 2004).
The NAIP is a prominent candidate for the initiation and/or extended duration of the PETM because there is good temporal agreement between NAIP activity and the Paleocene–Eocene boundary (Storey et al., 2007a), and there are numerous climate forcings operating on a range of timescales associated with its emplacement. Volatile degassing during large igneous province (LIP) eruptions and the thermogenic release from contact metamorphism around intrusions can release significant volumes of both carbon and sulfur to the atmosphere, directly affecting their surface cycles and consequently the climate and environment (Jones et al., 2016). Recent studies often argue for a combination of volcanic and metamorphic NAIP sources (Gutjahr et al., 2017) or a mix of volcanic and surface reservoirs (Frieling et al., 2016) as a driver of hyperthermal conditions. Uncertainties persist because an extremely 12C-enriched (i.e. organic-rich) source that is sufficient to cause the CIE does not produce the magnitude of warming derived from proxy data within realistic bounds of climate sensitivity (Zeebe et al., 2009). Modelling estimates based on inverted pH proxy data arrived at far greater degassing volumes (thousands of gigatonnes of carbon), which would require less 12C-enriched (e.g. magmatic) sources to match the CIE (Gutjahr et al., 2017). A recent study by Gernon et al. (2022) suggested that elevated magmatic carbon release from a lithospheric mantle source may have augmented NAIP degassing fluxes during the PETM. However, their model is based on localities with sparse, uncorrected, and ambiguous geochronological data (e.g. Passey and Jolley, 2008; Wilkinson et al., 2017), and a refined and up-to-date bio- and chemostratigraphic control of target localities is required for this hypothesis to be thoroughly tested.
A key issue is that most carbon cycle model scenarios appear to be at odds with the extremely enhanced organic carbon burial rates during much of the PETM (Kaya et al., 2022; John et al., 2008). A recent modelling study demonstrated that a large organic carbon sink would rapidly drive exogenic δ13C to positive values unless the impact of organic carbon burial was reduced during the CIE body (Papadomanolaki et al., 2022). More often, a scenario is chosen that focuses the impact of organic carbon burial on the later parts of the CIE to match the CIE recovery (Bowen and Zachos, 2010; Bowen, 2013; Gutjahr et al., 2017; Papadomanolaki et al., 2022). However, scenarios with reduced organic carbon burial during the initial phases of the CIE remain in conflict with field observations (e.g. John et al., 2008; Kaya et al., 2022) and complicate direct interpretation of the CIE purely on the grounds of the source δ13C signature. Constraining the timing and style of NAIP activity is critical to understanding the volumes and fluxes of each potential carbon source in order to determine their roles in the initiation and long duration of the PETM.
1.1 Direct NAIP climate impacts
1.1.1 Volcanic degassing
The NAIP is one of the largest known LIPs in the Phanerozoic (Ernst and Youbi, 2017), with an estimated total volume of 6–10 × 106 km3 of magma emplaced at or near the Earth's surface (Eldholm and Grue, 1994; Horni et al., 2017). Assuming a magmatic CO2 content of 0.5 wt % and a degassing potential of 3.5 Mt C km−3 of magma (Jones et al., 2016), the NAIP represents a total magmatic carbon reservoir of 21 000 to 35 000 Gt C. Much of this volume was likely degassed during effusive and explosive volcanic eruptions. While the NAIP was active from ∼ 63–54 Ma, the main acme (∼ 80 %) of volcanism occurred from 56 to 54 Ma (Wilkinson et al., 2017). In East Greenland, voluminous eruptions formed a ∼ 5–6 km thick part of the flood basalt province between 56.0 and 55.5 Ma (Larsen and Tegner, 2006; Storey et al., 2007a, b), representing a basalt accumulation rate of at least 1 cm yr−1 for 500 000 years. There is also evidence of significant explosive volcanism across the PETM interval from the presence of hundreds of NAIP-sourced ash layers across northern Europe (Egger and Brückl, 2006; M. T. Jones et al., 2019; Larsen et al., 2003; Stokke et al., 2020b). These findings suggest that effusive and explosive volcanic degassing from the NAIP considerably amplified global volcanic emissions of carbon and sulfur across the Paleocene–Eocene boundary.
1.1.2 Thermogenic emissions
In addition to extrusive activity, massive sill complexes were emplaced in organic-rich sediments around the north-eastern Atlantic continental margins (Fig. 1). The sill edges connect to thousands of explosive hydrothermal vent complexes that were formed through volatile generation and gas overpressure during contact metamorphism (Svensen et al., 2004). Many of these vent systems terminate at or close to the Paleocene–Eocene paleo-surface on the Greenlandic, Faroe–Shetland, and Norwegian continental margins (Hansen, 2006; Manton et al., 2022; Planke et al., 2005; Reynolds et al., 2017). Degassing was likely a combination of magmatic gases and thermogenic volatiles formed during contact metamorphism. The high methane (CH4) content in thermogenic volatiles both enhances the atmospheric greenhouse effect compared to CO2 and leads to more 12C-enriched emissions, making this source a prime candidate for causing the PETM CIE. Recent drilling of two hydrothermal vent complexes shows that both were formed just before or during the PETM (Berndt et al., 2023; Frieling et al., 2016; Planke et al., 2023). Estimates for carbon release from hydrothermal vents on the Norwegian continental margin range from 225 to 2250 Gt C (Svensen et al., 2004), with the degassing over the entire area affected by NAIP intrusions possibly up to 13 000 Gt C (S. M. Jones et al., 2019). This volatile source has the potential for rapid (< 100 kyr) and voluminous degassing if many sill–vent systems were active simultaneously.
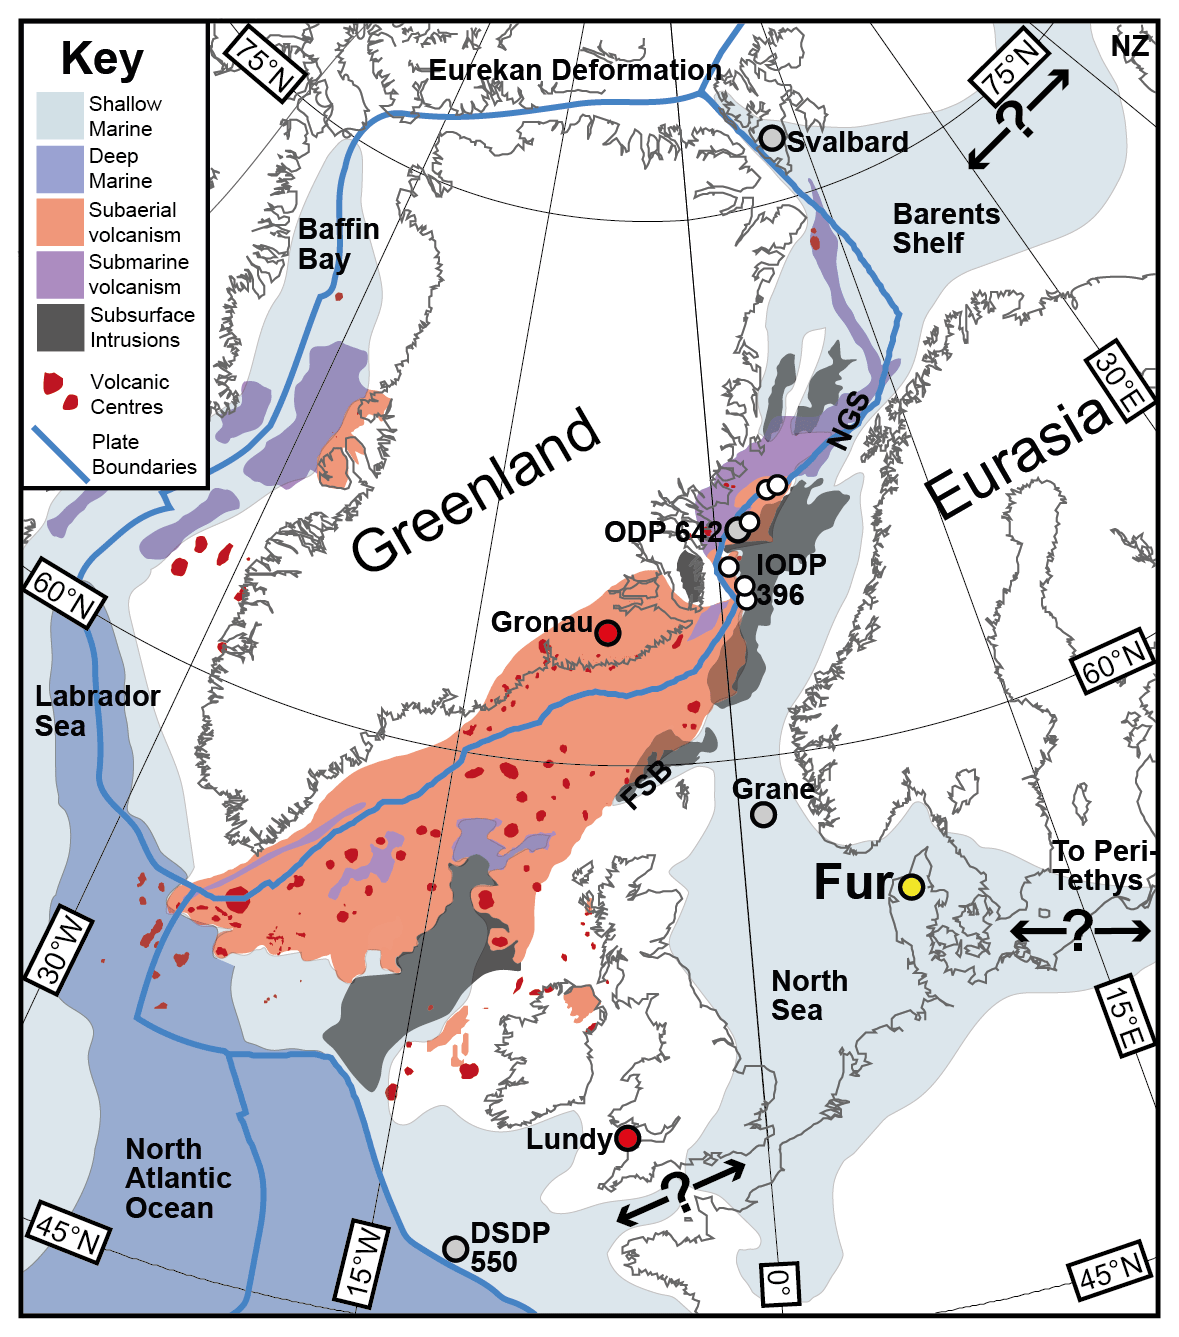
Figure 1A plate reconstruction at 56 Ma showing the known extent of the North Atlantic Igneous Province (NAIP). Light-red and purple areas denote subaerial and submarine volcanism, respectively, with dark-red points marking individual volcanic centres (Abdelmalak et al., 2016; Horni et al., 2017). The shaded grey areas show the known extent of NAIP sill intrusions on the continental margins (Planke et al., 2005; Rateau et al., 2013; Reynolds et al., 2017), although this is a minimum estimate as the identification of sills beneath extrusive layers is obscured by poor seismic retrievals. Paleo-shoreline estimates are an amalgamation from several sources (Abdelmalak et al., 2016; Golonka, 2009; Hovikoski et al., 2021; Zacke et al., 2009). Shelf areas are shown in light blue, while ocean basins are shown in dark blue. NZ: Novaya Zemlya; NGS: Norwegian–Greenland Seaway; FSB: Faroe–Shetland Basin. Fur is labelled with a yellow marker. The volcanic localities of the Gronau West Nunatak (Heister et al., 2001) and the island of Lundy (Larsen et al., 2003) have red markers. The locations of Deep Sea Drilling Project (DSDP) Site 550 (Goban Spur), Ocean Drilling Program (ODP) Site 642, Svalbard, and Grane cores (M. T. Jones et al., 2019; Knox, 1984, 1985; Wieczorek et al., 2013) are shown with grey markers, while International Ocean Discovery Program (IODP) Expedition 396 sites (Planke et al., 2023) are shown with white markers. The plate reconstruction was created using a modified version of GPlates (Boyden et al., 2011; Gurnis et al., 2012; Shephard et al., 2013) and plotted with Generic Mapping Tools (Wessel et al., 2013).
1.2 Indirect NAIP climate impacts
In addition to volatile degassing, the emplacement of the NAIP may have affected the global climate system through other processes such as increased continental weathering and widespread regional uplift.
1.2.1 Enhanced carbon sinks
The PETM led to a global increase in continental weathering and erosion (Pogge von Strandmann et al., 2021; Pujalte et al., 2015; Ravizza et al., 2001) as well as widespread enhanced marine organic carbon burial (John et al., 2008; Kaya et al., 2022; Papadomanolaki et al., 2022), which both act as negative feedbacks to increased atmospheric CO2 levels. The emplacement of flood basalt lavas and widespread ash deposits would have significantly enhanced the availability of fresh reactive silicate material at the surface (Dessert et al., 2003). Volcanic ash from explosive eruptions is particularly important in this process due to its high surface-area-to-volume ratio (Ayris and Delmelle, 2012; Longman et al., 2021). Combined with an intensified hydrological cycle (Carmichael et al., 2017; Walters et al., 2022), this increase in reactive volcanic substrate amplified the transport of weathered material to the oceans (Nielsen et al., 2015; Stokke et al., 2021). Enhanced fluvial fluxes of nutrients and alkalinity are likely to have increased carbon sequestration through both carbonate formation and organic matter burial (Jones et al., 2016). The silicate weathering of NAIP basalts and ash deposits has therefore been proposed as a potential carbon sink that acted as a negative feedback to global warming and aided the termination of the PETM (Longman et al., 2021; Stokke et al., 2021).
1.2.2 Regional uplift
The North Sea was a pivotal epicontinental sea with intermittent connections to the Arctic, Atlantic, and Tethys oceans (Fig. 1). An estimated 1–3 km of transient convective uplift occurred between Greenland and the British Isles during the latest Paleocene (Hartley et al., 2011; Shaw Champion et al., 2008; White and Lovell, 1997). The NAIP uplift has been cited as a potential source of methane hydrate release from raised marine sediments (Maclennan and Jones, 2006). This uplifted region would have had a marked effect on atmospheric and oceanic circulation, particularly seaway connectivity to the Arctic Ocean that likely had a strong influence on global climate (Roberts et al., 2009). A sporadic shallow marine connection in the English Channel connected the North Sea with the North Atlantic Ocean (Zacke et al., 2009), whereas Paleocene NAIP uplift closed the strait in the Faroe–Shetland Basin, and it remained closed until at least 54 Ma (Hartley et al., 2011; Shaw Champion et al., 2008). Further north, thermal uplift and lava delta progradation narrowed the Norwegian–Greenland Seaway to possibly as little as 50 km of open water (Hovikoski et al., 2021), potentially isolating the North Sea from the intra-rift seaways of the northern Norwegian margin (Fig. 1). While the Central Spitsbergen Basin in Svalbard was not directly connected to the Arctic due to the Eurekan deformation (Straume et al., 2022), there was likely a broad seaway across the Barents Shelf that connected the Norwegian–Greenland Seaway with the Arctic Ocean somewhere between Svalbard and Novaya Zemlya (Prøis, 2015) (Fig. 1). To the east of the North Sea, there may have also been a shallow seawater connection to the Peri-Tethys through eastern Europe (Radionova et al., 2003).
1.3 An improved understanding of the NAIP
Despite the close temporal link between the NAIP emplacement and the PETM, the exact relationship is complicated by multiple concurrent climate forcings, incomplete/imprecise geochronological data (Wilkinson et al., 2017), and uncertainties in the timing and sources of volatile fluxes from the NAIP (Passey and Jolley, 2008; Stoker et al., 2018). These uncertainties are compounded by a lack of expanded sedimentary records that contain both volcanic and climatic proxies in the same sections. The limited dispersal of many geochemical/geological indicators of volcanism means that such proxies are often regionally constrained (Jones, 2015; M. T. Jones et al., 2019). In addition, paleoclimate proxies across the Paleocene–Eocene transition are often complicated by the significant changes in sedimentation, seawater acidification, regional uplift/subsidence, eustatic sea level, and seaway connections. These uncertainties can only be resolved by targeted studies on expanded and continuous sedimentary sequences proximal to the NAIP that contain a multitude of volcanic and climatic proxies.
The eastern North Sea basin is an ideal setting for constraining the uplift history and magmatic activity of the NAIP across the PETM. This region has experienced near-continuous tectonic subsidence since the Late Cretaceous, resulting in high sedimentation rates and expanded sedimentary sequences. The relative proximity of this basin to the NAIP (Fig. 1) resulted in the co-preservation of multiple volcanic and climatic proxies. Additionally, this location was sufficiently distant from LIP activity to avoid subtle climatic indicators being overwhelmed by the volcanic signal and was relatively unaffected by the regional forced regressions caused by thermal uplift. The enclosed nature of the North Sea and the lack of significant thermal or diagenetic overprints have resulted in the exceptional preservation of both inorganic and organic records (Nielsen, 1995). These factors make North Sea sediments ideal for a wide range of integrated geochemical, biological, oceanographic, and volcanological studies. The Limfjord area in Denmark (Fig. 2) offers rare onshore access to North Sea Paleocene and Eocene strata due to glaciotectonic uplift (Pedersen, 2014). These outcrops provide a unique opportunity to attain a high-quality, virtually uninterrupted record of NAIP activity and environmental change spanning the latest Paleocene and early Eocene (Heilmann-Clausen et al., 1985).
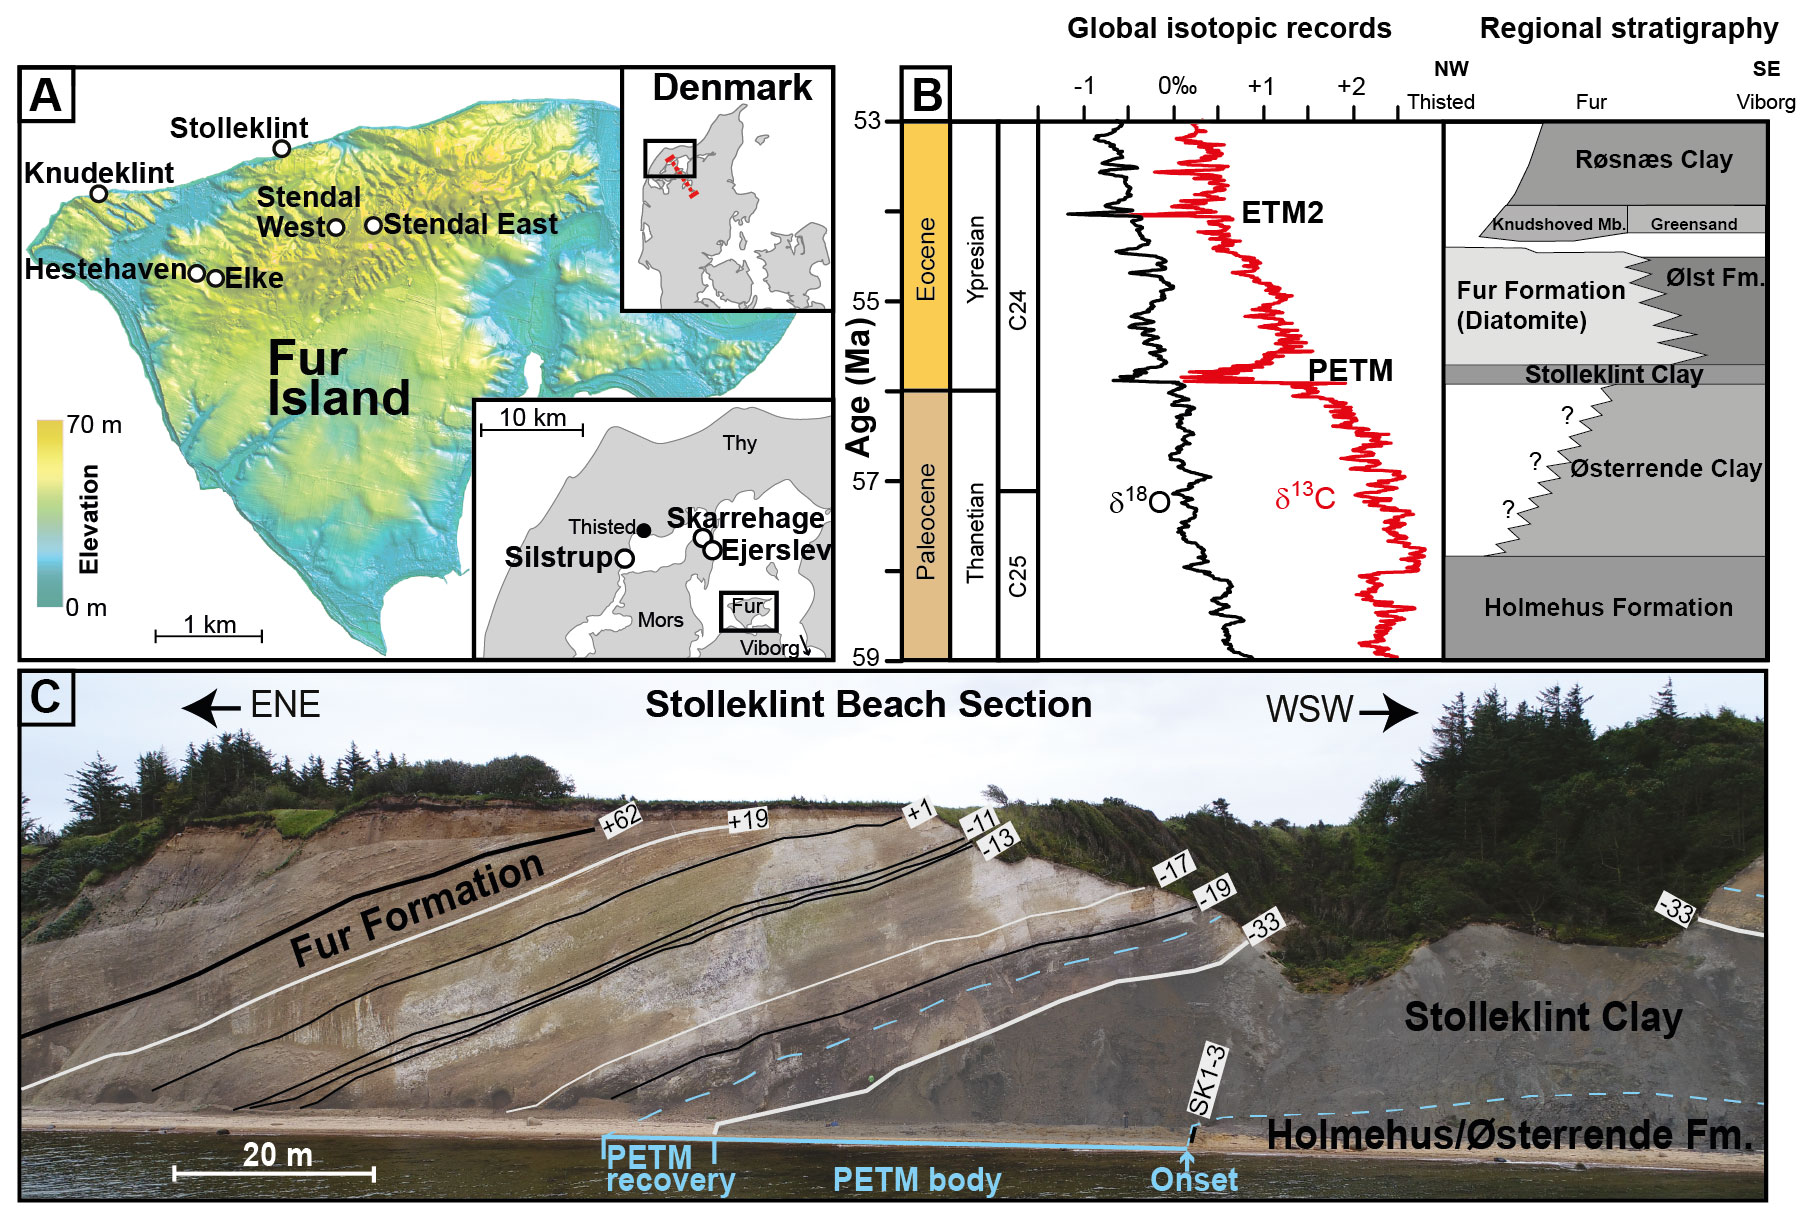
Figure 2(a) A topographic map of Fur showing the locations of the Stolleklint, Knudeklint, and quarry sections. The regional map of Limfjorden shows the Skarrehage and Ejerslev localities on Mors and the Silstrup locality. The Denmark map shows the line of the stratigraphic cross-section in red between Thisted and Viborg. (b) A synthesis of the target interval showing the Paleogene stratigraphy of northern Denmark (Heilmann-Clausen et al., 1985; King, 2016) in relation to the GTS2020 geological timescale (Speijer et al., 2020) and global oxygen and carbon isotope curves (Cramer et al., 2009; Littler et al., 2014). PETM: Paleocene–Eocene Thermal Maximum; ETM2: Eocene Thermal Maximum 2. (c) A view of Stolleklint Beach from the north, with the outcropping strata labelled (Stokke et al., 2021). Black lines denote key basaltic ash layers, while white lines mark the silicic Ashes −33, −17, and +19. The onset, body, and recovery of the PETM CIE are highlighted in light blue. The boundary between the Holmehus/Østerrende Formation and the Stolleklint Clay in the cliff face obscured by slumping is inferred from sub-beach outcrops. The map, stratigraphic log, and photo are modified from figures in Stokke et al. (2021).
This study presents a compilation of new and existing proxy data for volcanism (ash layers, Hg anomalies, Os isotopes) and paleoclimate (lipid biomarkers and C, Li, and Os isotopes) from the Stolleklint Beach section on Fur and other localities around the Limfjord area (Fig. 2). These data are uniquely poised to (1) assess changes in environmental conditions across the PETM and in the earliest Eocene, (2) investigate how the style and magnitude of NAIP activity varied concurrently, and (3) evaluate how these regional signals relate to global changes through comparison to existing PETM localities worldwide.
All of the samples used in this study were derived from the Paleogene succession in northern Denmark (Fig. 2). Pleistocene glaciotectonism provides valuable onshore outcrops of these Paleogene sediments, but the associated folding and faulting often limit individual outcrops to just part of the overall stratigraphy. However, there are over 180 NAIP ash layers (> 2 mm thick) found within the succession (Larsen et al., 2003), which act as marker horizons and enable a precise correlation between outcrops and a composite reconstruction of the whole sequence of strata. The ashes are numbered and subdivided into a negative ash series (Ash −39 to Ash −1) and a positive ash series (Ash +1 to Ash +140) based on chemical variations and outcrop appearances (Bøggild, 1918). The succession is divided here into nine intervals, based on changes in lithology, the presence of ash layers, and/or bulk organic δ13C values.
The primary locality is Stolleklint Beach on the north coast of Fur, which contains a complete outcrop of pre-PETM to early Eocene strata (Fig. 2c). The base of the sequence comprises a heavily bioturbated, hemipelagic mudstone devoid of carbonate microfossils, referred to here as the Holmehus/Østerrende Formation (Interval 1) due to the uncertain lateral extent of the Østerrende Clay (Fig. 2b; Heilmann-Clausen, 1995; Stokke et al., 2021). The overlying unit is the Stolleklint Clay (Intervals 2 to 6), a ∼ 24 m thick expanded section of dark, laminated, thermally immature clay, almost completely devoid of benthic fauna and calcareous fossils (Heilmann-Clausen et al., 1985). The transition from the Holmehus/Østerrende Formation to the Stolleklint Clay is marked by a possible hiatus of unknown duration and a glauconite-rich silty horizon (Heilmann-Clausen, 1995; Schmitz et al., 2004), which is comprised of mainly authigenic grains and is interpreted as evidence of very low sedimentation rates (Schoon et al., 2015). Above this glauconite-rich horizon, there is no clear evidence of any breaks in sedimentation until the top of the Fur Formation (Heilmann-Clausen et al., 1985; 2014; Stokke et al., 2020a). Two thick ash layers (named SK1 and SK2) are found at the base of the Stolleklint Clay (Interval 2), directly below the onset of the PETM CIE.
The sediments above Ash SK2 show the PETM onset (Interval 3), with the first appearance of the diagnostic dinoflagellate cyst Apectodinium augustum (Heilmann-Clausen, 1994) and a δ13Corg excursion of −4.5 ‰ over just 11 cm of strata (M. T. Jones et al., 2019; Schoon et al., 2013). The body of the PETM δ13C excursion comprises the bulk of the Stolleklint Clay (Intervals 4 to 6), with δ13Corg values largely stable at −31 ‰ (M. T. Jones et al., 2019). The subdivision of the PETM body is based on a sustained increase in TOC (total organic carbon) content at −12.96 m that marks the boundary between Intervals 4 and 5 and the re-emergence of ash layers from −5.92 m onwards that marks Interval 6. The Stolleklint Clay is overlain by a ca. 52 m thick, fossil-rich clayey diatomite named the Fur Formation. The PETM δ13Corg recovery (Interval 7) is ∼ 4.5 m thick and constrained between Ashes −33 and −21a (Heilmann-Clausen et al., 1985). The lower post-PETM strata (Interval 8) contain occasional heterolithic ash layers of the negative ash series (Larsen et al., 2003), and the diatomite displays frequent laminations (Pedersen et al., 2004). The start of Interval 9 is marked by the appearance of Ash +1, the first of 140 mainly tholeiitic basalts of the positive ash series that corresponds to the Balder Formation offshore (King, 2016). In contrast to much of Interval 8, the interstitial diatomites of the positive ash series (Interval 9) are mostly non-laminated (Pedersen et al., 2004).
3.1 Materials
The succession was logged and sampled at several outcrops and quarries on Fur (M. T. Jones et al., 2019; Stokke et al., 2020a), supplemented with Skarrehage and Ejerslev localities on the island of Mors and at Silstrup in mainland Denmark (Fig. 2a). These sequences were compiled to form a composite stratigraphic succession where the zero of the depth scale is set to the top of the ubiquitous and easily distinguishable felsic Ash −33 (Fig. 2c). The stratigraphic thicknesses vary slightly between localities, so sections within the composite succession are tied to specific localities. The lowermost pre-PETM to post-PETM section (−24.8 to +21.8 m) is based on the Stolleklint Beach locality (M. T. Jones et al., 2019). The Elke and Stendal East quarries (+21.8 to +41.0 m) form the basis of the log between Ash −11 and Ash +98. The uppermost part (+41.0 to +51.0 m) is based on the Silstrup locality (Fig. 2a).
The presence of abundant ash layers in the Danish strata offers insights into the extent and style of NAIP volcanism, and they act as key marker horizons between localities. High-precision radiometric dating of magmatic crystals within ash deposits provides a geochronological framework into which paleoenvironmental records can be placed (Lowe, 2011). Key felsic ash layers in the Danish strata such as Ashes −17 and +19 are important marker horizons across Greenland and Europe (Storey et al., 2007a; Westerhold et al., 2009). Some of the basaltic ash layers are up to 12 cm thick and found 700–1500 km from the known source volcanoes, representing some of the largest explosive basaltic eruptions recorded in the geological record (Egger and Brückl, 2006; Stokke et al., 2020b). The Stolleklint Clay and Fur Formation were systematically logged and sampled, with the thickness of each ash layer recorded and combined into a percentage of the strata (after compaction) per metre of section.
3.2 Mercury anomalies
A widely used volcanic proxy is mercury (Hg) content in sedimentary records (Grasby et al., 2019; Percival et al., 2021). Volcanic emissions are a primary source of gaseous Hg0 that is rapidly dispersed through the atmosphere (Pyle and Mather, 2003). Prolonged periods of elevated volcanism, such as from LIPs, directly impact the global Hg cycle (Grasby et al., 2019). Mercury has a strong affinity for organic matter, which provides the main depositional pathway for Hg in aqueous environments (Outridge et al., 2007). Elevated Hg TOC is interpreted to show enhanced Hg sequestration, either through enrichment of Hg in organic matter or via deposition through other means such as adhesion to clay particles or in sulfides (Sanei et al., 2012). Therefore, anomalously high Hg content or peaks in host-phase normalised ratios (e.g. Hg TOC, Hg S) can be indicative of extensive regional or global volcanic activity (Grasby et al., 2019).
High-resolution sampling and analyses were conducted for Hg and TOC through the Stolleklint Clay (M. T. Jones et al., 2019) and the Fur Formation (this study). The lowermost strata (−24.8 to −24.3 m) were continuously sampled, while the mean sample spacing for the rest of the stratigraphy was 8 cm (including 425 new samples). All samples were oven-dried at ≤ 50 ∘C and powdered in either an agate hand mortar or agate disc mill before further analysis. Mercury content was analysed using a Zeeman R-915F (Lumex) high-frequency atomic absorption spectrometer at the University of Lausanne. Samples were heated to > 700 ∘C, and measurements were taken on the direct thermal evaporation of Hg from solid samples. Each aliquot was measured in duplicate, while machine accuracy was confirmed by the analysis of the GSD-11 standard certified reference material (Chinese alluvium: 72.0±3.6 ppb). Total organic carbon (TOC) concentrations were obtained by Rock-Eval pyrolysis (Behar et al., 2001) at the University of Lausanne.
3.3 Lithium isotopes
The ratio of lithium isotopes 7Li and 6Li, expressed as δ7Li, is a tracer for silicate weathering in sedimentary records. Lithium is abundant in silicate rocks, largely absent from carbonate rocks, and is not known to be fractionated by organic growth (Kisakürek et al., 2005; Pogge von Strandmann et al., 2016). As such, Li isotopes are dominantly controlled by silicate weathering processes (Pogge von Strandmann et al., 2021). In fluvial waters, Li isotopes reflect the balance between primary rock dissolution and secondary clay formation. Isotopic fractionation through clay formation increases dissolved-δ7Li values, whereas primary rock dissolution does not fractionate Li isotopes and therefore drives dissolved δ7Li to low values (Misra and Froelich, 2012; Pogge von Strandmann et al., 2017b). Low-intensity fluvial weathering regimes (i.e. high erosion relative to weathering rates) are characterised by high primary rock dissolution relative to clay formation, leading to low dissolved-δ7Li values but high dissolved-Li fluxes. Moderate-intensity weathering regimes have greater clay formation and therefore elevated dissolved-δ7Li values but somewhat lower dissolved-Li fluxes. High-intensity weathering regimes induce the dissolution of secondary clays with little primary rock dissolution, which leads to low δ7Li values and low Li fluxes (Dellinger et al., 2015; Pogge von Strandmann et al., 2020). In this study, we analysed the solid (largely clay) material from the sediment sequences, providing a counterpart to the dissolved signal. The advantage compared to marine carbonate sections is that detrital clay sections are not affected by the long (∼ 1 Myr) ocean residence time of Li but instead provide information on local conditions. Selected samples were analysed through the Stolleklint Clay (Pogge von Strandmann et al., 2021) and the Fur Formation (this study). Powdered samples were dissolved first using HF–HNO3–HClO4, then steps of concentrated HNO3 and 6 M HCl. The samples were then purified for Li using a two-column method with AG 50W-X12 resin and 0.2 M HCl as an eluent (Pogge von Strandmann et al., 2017a). The purified samples were analysed at the LOGIC group at University College London using a Nu Plasma 3 multi-collector inductively coupled plasma mass spectrometer (MC-ICP-MS) and normalised to IRMM-016 bracketing standards. The measured δ7Li values of secondary standards at this facility are seawater (31.17±0.38 ‰, n=43), USGS BCR-2 (2.57±0.30 ‰, n=11), and USGS SGR-1b (3.82±0.28 ‰, n=9). The total procedural blank is ≤ 0.003 ng Li (Pogge von Strandmann et al., 2019). Long-term external analytical uncertainties using this method are ±0.4 ‰ (2σ) (Pogge von Strandmann et al., 2021).
3.4 Clay mineralogy
Samples from the Fur Formation were analysed for clay mineralogy to expand on the existing dataset from Stokke et al. (2021). The clay fraction (< 2 µm) was prepared as oriented aggregate mounds using gravity settling and the Millipore filter transfer method (Moore and Reynolds, 1997). The X-ray diffraction (XRD) clay data were recorded with a step size of 0.01 from 2 to 65 (2θ) at a count time of 0.3 s (2θ) in air-dried samples and with a step size of 0.01 from 2 to 34 (2θ) at a count time of 0.3 s (2θ) on treated samples. Three rounds of treatments were applied: 24 h of ethylene glycol saturation, 1 h heating at 350 ∘C, and 1 h heating at 550 ∘C. The software NewMod II (Reynolds and Reynolds, 2012) was used for semi-quantification of the XRD patterns of inter-stratified clay minerals.
3.5 Rhenium and osmium isotopes
The osmium (187Os 188Os) isotope system is a powerful paleoceanographic tracer for silicate weathering, specifically identifying changes between evolved and juvenile sources through time (Peucker-Ehrenbrink and Ravizza, 2000; Peucker-Ehrenbrink and Ravizza, 2020). The ratio of rhenium to osmium (Re Os) is higher in crustal rocks than in the mantle, which means that the in situ beta decay of 187Re to 187Os leads to higher (radiogenic) 187Os 188Os ratios over time. The crustal 187Os 188Os average is ∼ 1.40 (Peucker-Ehrenbrink and Jahn, 2001), while the unradiogenic primitive upper-mantle value is ∼ 0.13 (Meisel et al., 2001). The oceanic record reflects the proportional mixing of these two end-members (Peucker-Ehrenbrink and Ravizza, 2000), with the unradiogenic component sourced from the weathering and alteration of subaerial basalts, submarine hydrothermal activity (Dickson et al., 2021), and occasional extraterrestrial bolide impacts (Sato et al., 2013).
Osmium is removed from the water column through the precipitation of Fe–Mn oxides and/or adsorption onto organic material and clays (Racionero-Gómez et al., 2017; Yamashita et al., 2007). The oceanic residence time of Os is 10–55 kyr (Levasseur et al., 1999; Sharma et al., 1997), which is longer than the present-day mixing time of the oceans (1–2 kyr) but considerably shorter than for other weathering tracers such as strontium (> 2 Myr) (Broeker and Peng, 1982). While the global oceans are relatively homogeneous at a given time, 187Os 188Os ratios can deviate rapidly from the fully mixed global signal in restricted environments such as enclosed basins (Rooney et al., 2016). Enhanced organic matter deposition can reduce Os residence times significantly, and local input and output fluxes become more important in enclosed settings (Martin et al., 2001; Paquay and Ravizza, 2012). Therefore, the 187Os 188Os proxy has multiple potential uses in this study, including tracking the emplacement and weathering of NAIP lavas and ashes; changes in continental weathering associated with regional uplift or climatic variations; and modifications to the extent of seaway connectivity between the North Sea basin and the Arctic, Tethys, and Atlantic realms.
Individual samples weighing ca. 50 g were selected for Os isotope chemostratigraphy analysis throughout the succession. Consolidated samples were cut using a rock saw and then hand-polished with a diamond-plated polishing pad to remove potential contamination from the saw blade and weathered surfaces. After being dried at room temperature overnight, all samples were crushed to a fine (∼ 30 µm) powder in a SPEX 8500 ShatterBox with a ceramic agate grinding container and puck to homogenise any potential Re and Os heterogeneity. The long half-life of 187Re (ca. 42 Gyr) leads to minimal age correction for Cenozoic samples, but both Re and Os concentrations and isotopic compositions were measured in this study to provide accurate initial Os isotope compositions for chemostratigraphy.
Sample Re and Os isotopic abundance and composition were determined at the Yale Geochemistry and Geochronology Center. Depending on Re concentration, between 0.3 and 1.0 g of sample powder was digested and equilibrated in 8 mL of CrVIO3–H2SO4 with a mixed 190Os–185Re tracer (spike) solution sealed in Carius tubes at 220 µC for 48 h. This dissolution method has been shown to preferentially liberate hydrogenous Re and Os to yield a more accurate and precise depositional age (Kendall et al., 2004). The Re and Os were extracted and purified through solvent extraction (NaOH, (CH3)2CO, and CHCl3), micro-distillation, and anion column chromatography and analysed using negative thermal ionisation mass spectrometry (Selby and Creaser, 2003). Isotopic measurements were performed via static Faraday collection for Re and ion counting using a secondary-electron multiplier in peak-hopping mode for Os on a ThermoElectron TRITON PLUS mass spectrometer (Creaser et al., 1991; Völkening et al., 1991). The Os samples were loaded onto 99.995 % Pt wire (H-Cross, NJ) in 9 N HBr, covered with a saturated solution of Ba(OH)2 in 0.1 N NaOH as an activator, and analysed as oxides of Os. Interference of 187ReO3 on 187OsO3 was corrected using the measured intensity of 185ReO3. Mass fractionation was corrected with 192Os 188Os = 3.0826 using the exponential fractionation law.
In-house Re and Os solutions were continuously analysed during this study to ensure and monitor long-term mass spectrometer reproducibility. The Yale Geochemistry and Geochronology Center Re standard solution measured on the Faraday cups yields an average 185Re 187Re value of 0.59748±0.0014 (), which agrees with the accepted value within error (Gramlich et al., 1973). The measured difference between 185Re 187Re values for the Re solution and the accepted value (0.59738) is used to correct the Re sample data. The Os isotope standard solution used at Yale Metal Isotope Center is the Durham Romil Osmium Standard (DROsS) (Luguet et al., 2008). Over the past 3 years on the Yale Triton, the runs have yielded a 187Os 188Os ratio of 0.16082±0.000116 (), which is identical, within uncertainty, to the value reported by other laboratories (e.g. Liu and Pearson, 2014; Luguet et al., 2008). Total procedural blanks during this study were 40±2.0 pg for Re and 0.06±0.11 pg for Os, with an average 187Os 188Os value of 0.25±0.05 (1σ).
Uncertainties for 187Re 188Os and 187Os 188Os are determined by error propagation of uncertainties in Re and Os mass spectrometry measurements, blank abundances and isotopic compositions, spike calibrations, and reproducibility of standard Re and Os isotopic values. The Re–Os isotopic data and 2σ calculated uncertainties for 187Re 188Os and 187Os 188Os are used to generate initial Os isotope (187Os 188Os(i)) compositions with an age of 55.9 Ma.
3.6 Seaway connectivity proxies
The extent of North Sea isolation may be tested using existing datasets of Os isotopes (see above) and thaumarchaeotal membrane lipid distributions. The composition of isoprenoid glycerol dialkyl glycerol tetraether lipids (GDGTs) is thought to regulate membrane fluidity of marine Thaumarchaeota (Schouten et al., 2013). As such, GDGT composition is commonly assumed to be largely governed by growth temperature and forms the basis of the TEX86 paleotemperature proxy (Schouten et al., 2002). Typically, the number of cyclo-pentane rings increases with temperature, with the TEX86 ratio presenting the statistically strongest relation (Kim et al., 2010; Schouten et al., 2002). However, other metrics, such as the ring index (Zhang et al., 2016) and fractional abundance of crenarchaeol regio-isomers (fcren') relative to total crenarchaeol (O'Brien et al., 2017), can be employed to detect non-thermal impact on TEX86 (Zhang et al., 2016) and differences in temperature response between communities (e.g. Inglis et al., 2015; O'Brien et al., 2017). Indeed, it has been recognised that certain modern ocean regions have distinct GDGT distributions and responses to temperature, arguably associated with distinct, isolated communities of Thaumarchaeota (e.g. Trommer et al., 2009). Some studies have turned this around to argue for distinct communities based on GDGT distributions in (semi-)restricted settings (Steinig et al., 2020).
High fcren' has been recognised in (warm) saline waters (Steinig et al., 2020; Trommer et al., 2009) and has been proposed to identify such paleoenvironmental conditions (Inglis et al., 2015). In contrast, many freshwater bodies are marked by reduced fcren' (e.g. Blaga et al., 2009; Powers et al., 2010). At times during the latest Paleocene–early Eocene, reduced-salinity water masses occupied the North Sea area (Bujak and Mudge, 1994; Eldrett et al., 2014; Kender et al., 2012; Zacke et al., 2009) and the Arctic Ocean (Pagani et al., 2006; Sluijs et al., 2006). Here we re-examine the published Paleocene–Eocene GDGT data, including those from the North Sea area, focusing on the differences in response to PETM warming between TEX86 and fcren' to assess whether GDGT distributions can be used as a supporting tool to detect basin restriction and/or reduced salinity.
4.1 Volcanic ash layers
The NAIP ash layers are largely constrained to discreet ash-rich intervals within the Stolleklint Clay and Fur Formation. Four ashes (SK1–SK4) are found just above and below the PETM onset (Fig. 3b), representing the earliest evidence of explosive volcanism in Danish strata (Heilmann-Clausen et al., 2014). There is a distinct lack of visible ash layers for a ∼ 19.3 m interval between the PETM onset and Ash −39, the first of the traditional numbered ash series (Fig. 3a). The second interval of ash-rich strata (−4.9 to +10.9 m) encompasses the recovery of the δ13Corg excursion and includes several felsic ash layers such as Ashes −33 and −17. It is followed by a ∼ 15 m thick ash-poor interval, with only three ash layers > 1 cm thickness. Ash +1 at +26.0 m heralds the main phase of ash deposition in the Fur Formation (Fig. 3a). With the exception of the felsic Ashes +13 and +19, the positive ash series comprises relatively homogenous tholeiitic basalts. Basaltic ash reaches a peak of 31 % of the total sediment (after compaction) between +42.0 and +43.0 m (Ashes +110 to +118; Fig. 3a), representing a considerable portion of the total stratigraphy.
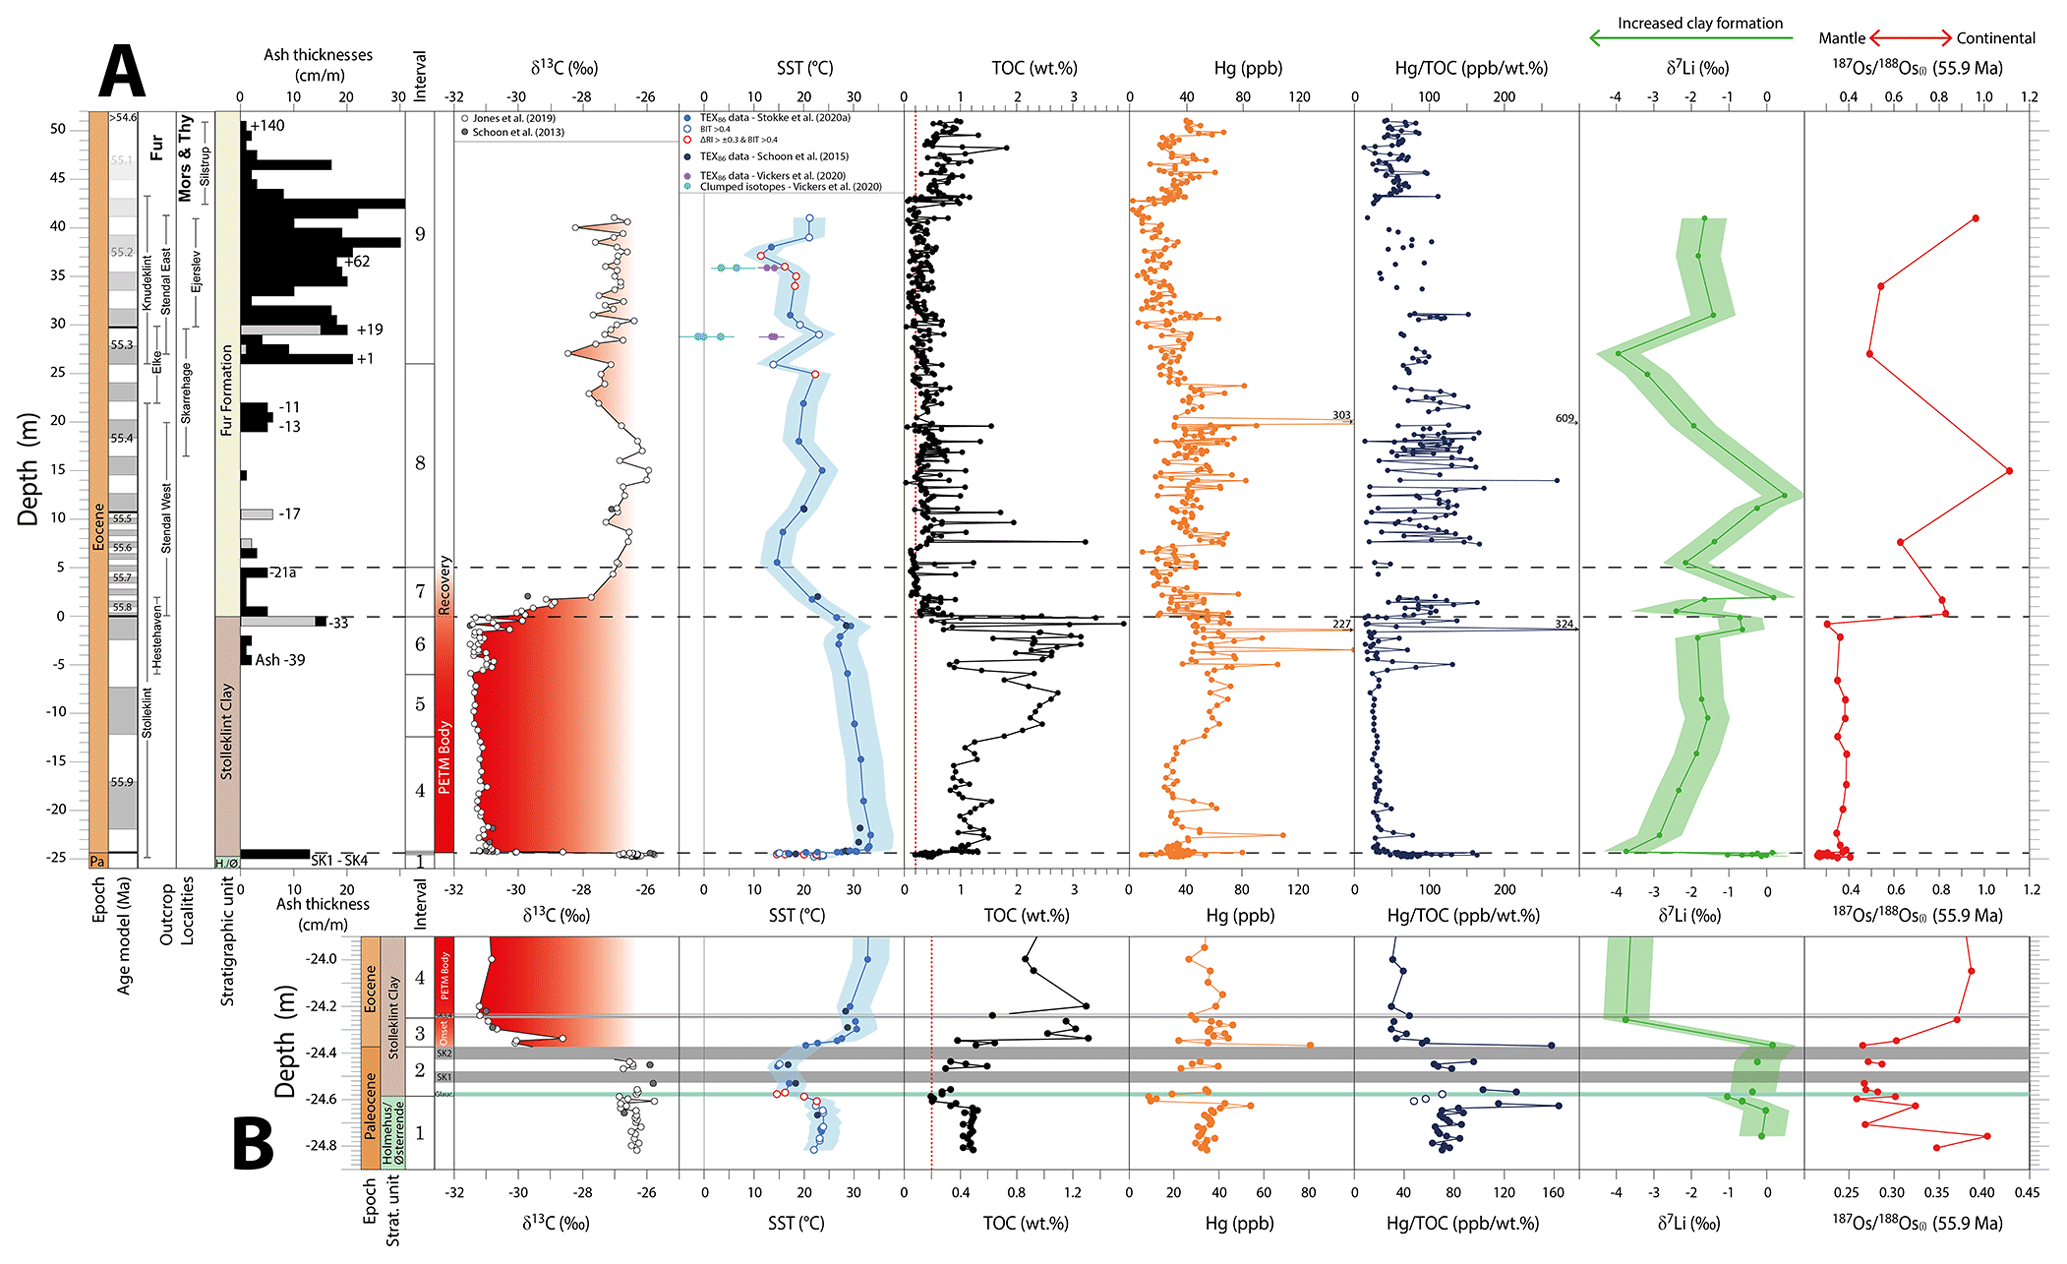
Figure 3Composite data from the studied outcrops. (a) The full succession from late Paleocene to Eocene strata, with the zero on the depth scale set to the top of Ash −33. (b) The first metre of the condensed Stolleklint Beach section. Note the change in scale for some proxies. The glauconite-rich horizon is marked in the lower stratigraphic log, along with ash layers SK1 to SK4 (Stokke et al., 2021). The age model is based on four marker horizons: the PETM onset at 55.93 Ma (Westerhold et al., 2017), a 101 kyr PETM body duration (van der Meulen et al., 2020), the corrected Ar–Ar age of 55.48±0.12 Ma for Ash −17 (Storey et al., 2007a), and an estimated age of ∼ 55.28 Ma for Ash +19 based on an estimated ∼ 200 kyr interval between Ashes −17 and +19 (Röhl et al., 2007; Westerhold et al., 2009). The top of the Fur Formation is older than 54.6 Ma (King, 2016). The “ash thicknesses” column shows the percentage of sediment (after compaction) that is volcanic ash for each metre of strata. Black bars denote basaltic ashes, while grey bars denote felsic ashes. The δ13Corg data are from previous studies (M. T. Jones et al., 2019; Schoon et al., 2013), with the red infill denoting the PETM CIE. The sea surface temperature (SST) estimates using the TEX86 proxy and bottom water temperatures from clumped isotopes of glendonite calcite are plotted from previous studies (Schoon et al., 2015; Stokke et al., 2020a; Vickers et al., 2020). The mercury (Hg) and total organic carbon (TOC) concentrations are a combination of this study and M. T. Jones et al. (2019). Lithium (δ7Li) isotopes are from this study and Pogge von Strandmann et al. (2021). The osmium (Os) isotopes show initial 187Os 188Os values at 55.9 Ma (187Os 188Os(i)). The succession is divided into nine distinct intervals based on lithological changes and variations in δ13Corg values: (1) the late Paleocene Holmehus/Østerrende Formation, (2) the pre-PETM, (3) the PETM onset, (4) the lower part of the PETM body, (5) the middle part of the PETM body, (6) the ash-rich upper part of the PETM body, (7) the PETM recovery, (8) the lower part of the Fur Formation, and (9) the upper part of the Fur Formation (see also Table 1).
4.2 Sedimentary mercury
Mercury concentrations vary from 2 to 303 ppb through the succession, but within each interval Hg content is relatively consistent (Table 1). Mercury peaks are few and limited in amplitude, with only four samples exceeding 100 ppb. Mercury content was also normalised to TOC and plotted as Hg TOC (Fig. 3). Samples where TOC < 0.2 wt % were excluded from Hg TOC ratios as the propagated error creates unacceptably high uncertainties (Grasby et al., 2019). The intervals where this occurs are in the glauconite-rich layer at the top of Interval 1 (Fig. 3b) and in part of the diatomite-rich Fur Formation (Intervals 7–9; Fig. 3a). The late Paleocene and pre-PETM strata (Intervals 1 and 2) have relatively low mean Hg content values of 32.5 and 30.0 ppb, respectively (Table 1). When Hg is normalised to TOC, the late Paleocene strata are relatively uniform (Interval 1), while the pre-PETM strata (Interval 2) show more scatter and sporadic Hg TOC anomalies (Fig. 3b). Mercury content increases slightly across the PETM onset (Interval 3) to an average of 43.8 ppb (Table 1), but a concurrent increase in TOC content leads to lowered Hg TOC values compared to the interval below.
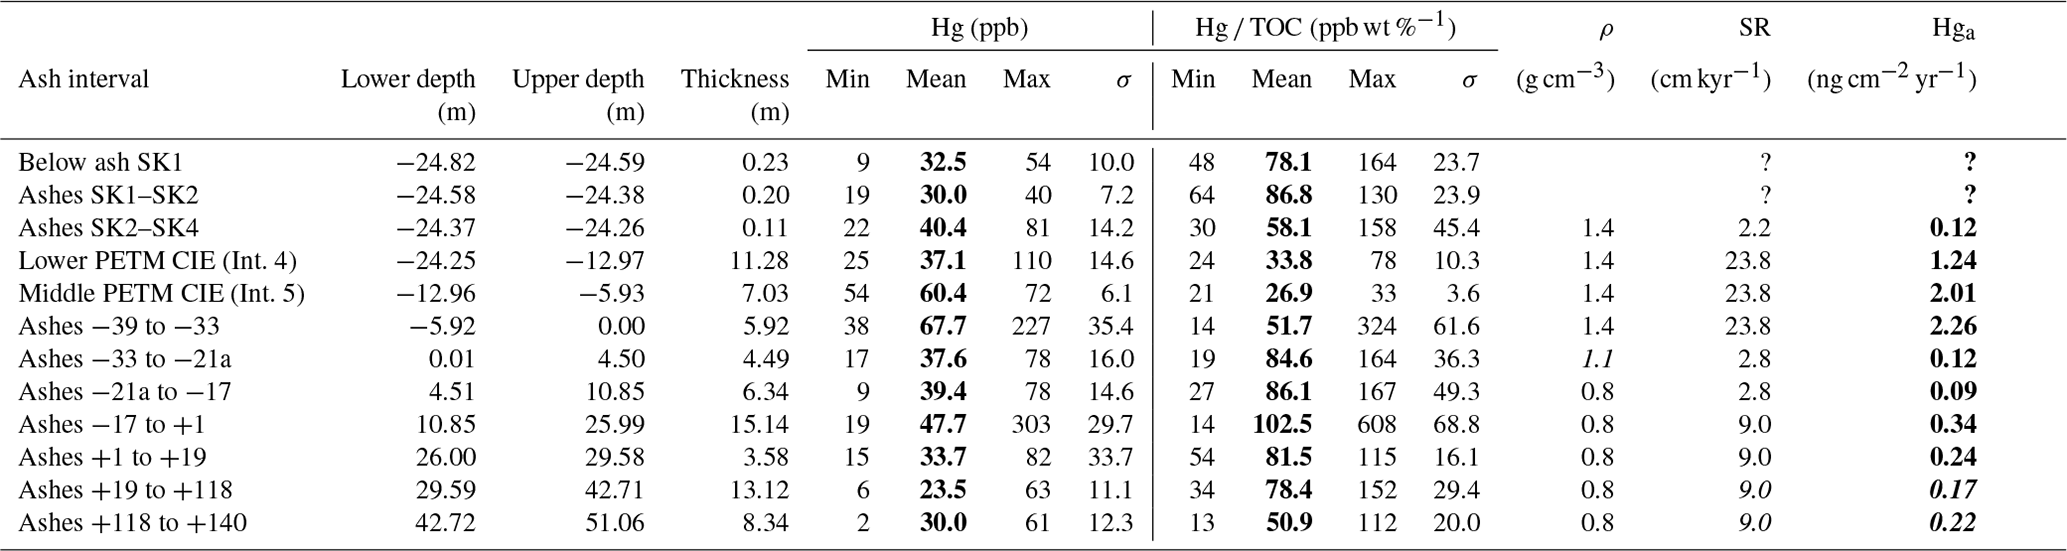
Table 1Compilation of the average Hg content (ppb), Hg TOC ratios (ppb wt %−1), and Hg accumulation rates (Hga) for the nine distinct intervals of the stratigraphy. The sediment densities (ρ) are taken from Pedersen et al. (2004), with the PETM recovery assumed to be a mix between the shale and diatomite. SR: sedimentation rate. Italics denote poorly constrained estimates. Bold text denotes data of key interest.
Within the PETM body, Hg becomes increasingly enriched upwards through the strata, with the largest mean concentrations observed in Interval 6 (67.7 ppb; Table 1). This concentration is comparable to the average shale value (62.4 ppb) from a compilation of global datasets (Grasby et al., 2019). In the lower and middle parts of the PETM (Intervals 4 and 5), the Hg content covaries with TOC enrichments, resulting in an average Hg TOC ratio of 33.8 ppb wt %−1 (σ= 10.0) for Interval 4 and 26.9 ppb wt %−1 (σ=3.6) for Interval 5. The low standard deviations highlight that Hg TOC values are remarkably uniform through Intervals 4 and 5 (Table 1). The relative homogeneity ends in the final 5.6 m of the PETM body (Interval 6), where Hg enrichments outpace increased TOC content, coincident with the re-emergence of ash layers in the stratigraphy (Fig. 3a). The PETM recovery (Interval 7) heralds a decrease in Hg and TOC concentrations into the diatomitic Fur Formation. Mercury content rises again slightly into Interval 8, becoming more pronounced in the section between Ashes −17 and +1, with a mean Hg content of 47 ppb (Table 1). Variable TOC enrichments in Interval 8 lead to a large scatter in Hg TOC ratios (Fig. 3a). Mercury and TOC content gradually declines into Interval 9, reaching a nadir (mean 21.4 ppb Hg) in the strata between Ashes +19 and +118, with many samples < 0.2 wt % TOC. Mercury and TOC content slightly increases again towards the top of the section exposed at Silstrup, but Hg TOC ratios are comparable to much of the rest of the Fur Formation (Fig. 3a).
4.3 Lithium isotopes
There are significant variations in detrital Li isotopes (δ7Li) through the studied section. Within the late Paleocene and pre-PETM strata (Intervals 1 and 2), δ7Li values are typically between −1.1 ‰ and +0.2 ‰. The two samples encompassing the negative δ13C onset (at −24.37 and −24.26 m) show a −3.9 ‰ δ7Li excursion (Fig. 3b), accompanied by a TEX86-based ∼ 10 µC sea surface temperature (SST) warming across the same interval (Schoon et al., 2015; Stokke et al., 2020a). The Li isotopes gradually return to less negative values through the course of the PETM body, returning to −0.7 ‰ by the end of Interval 6 (Fig. 3a). Lithium isotope values then oscillate from −2.4 to +0.2 and back to −2.2 ‰ through the PETM recovery (Interval 7). The post-PETM strata (Interval 8) first show a gradual positive δ7Li excursion, peaking at 0.5 ‰ at ∼ 1.5 m above Ash −17 (Fig. 3a). There is then a progressive negative δ7Li excursion to −4.0 ‰ just above Ash +9. The remaining samples from the upper Fur Formation between Ashes +31 and +98 (Interval 9) have δ7Li values between −1.8 and −1.4 ‰.
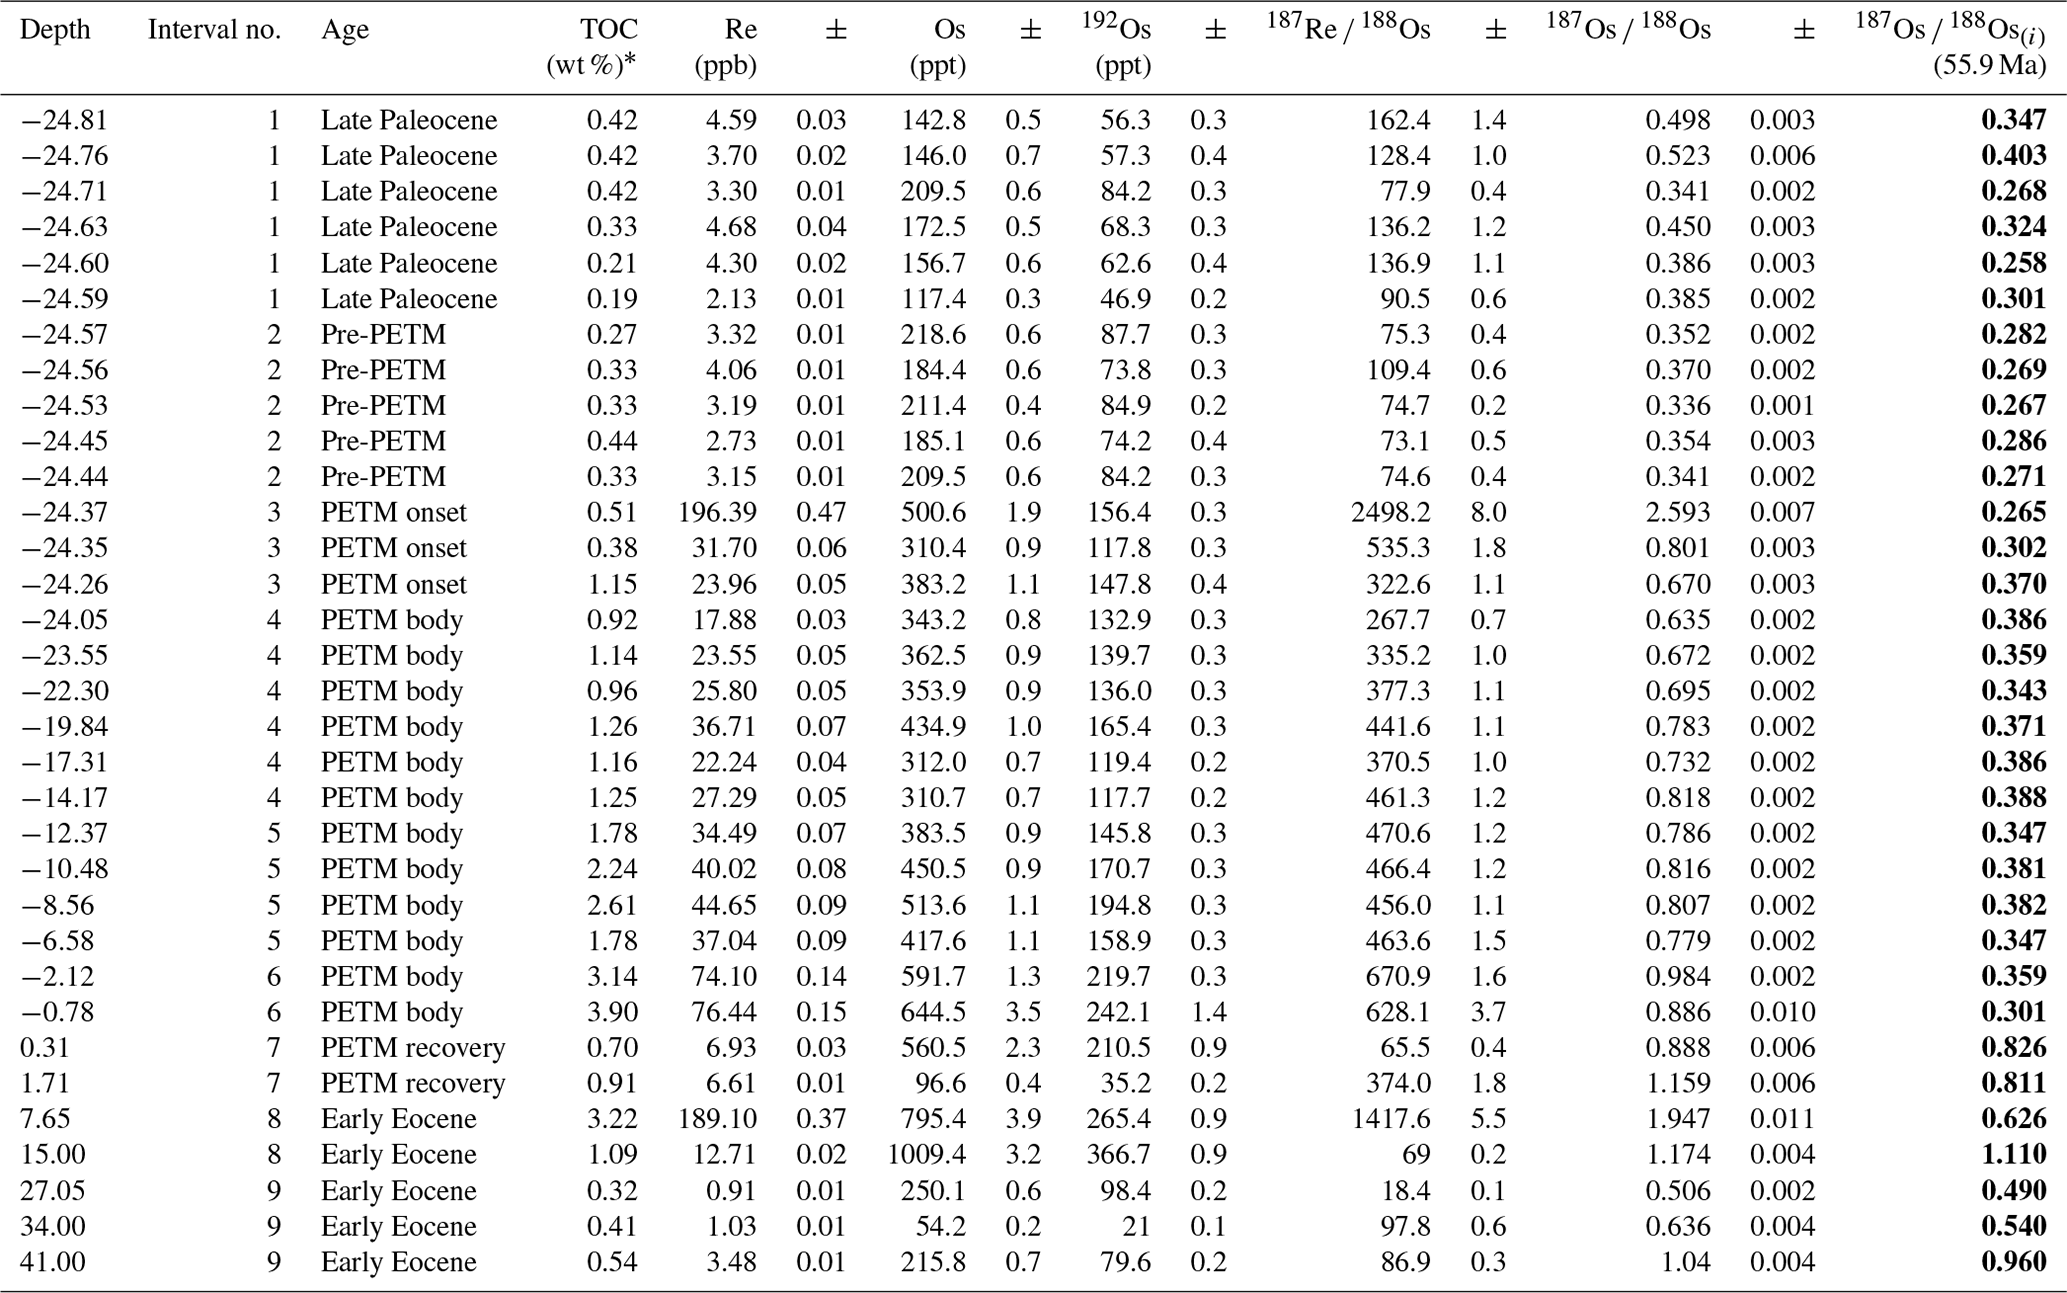
4.4 Rhenium and osmium isotopes
The Re and Os abundances and isotopic compositions vary considerably in the studied samples. Elemental Re and Os abundances range from 0.9 to 196.4 ppb and 54 to 1009 ppt, respectively (Table 2). 187Re 188Os ratios vary between 18 and 2498, while 187Os 188Os ratios vary from 0.336 to 2.593. Rhenium and Os enrichments appear to covary with TOC content, with the PETM interval showing elevated element abundances compared to pre- and post-PETM strata (Table 2). Using an assigned age of 55.9 Ma, calculated initial 187Os 188Os values (187Os 188Os(i)) range from 0.258 to 1.110, with significant and systematic changes through the stratigraphy. The late Paleocene samples (Interval 1) are consistently unradiogenic, with 187Os 188Os(i) values between 0.26 and 0.40 (Table 2, Fig. 3b). The 187Os 188Os(i) values are lower in the ash-bearing pre-PETM strata (Interval 2), consistently between 0.27 and 0.29. The PETM onset (Interval 3) is marked by an increase in 187Os 188Os(i) values from 0.27 to 0.39. Throughout the body of the δ13C excursion (Intervals 4–6), the 187Os 188Os(i) values remain unradiogenic (0.30–0.39) and remarkably stable for ∼ 24 m of stratigraphy (Table 2). However, the PETM recovery samples (Interval 7) exhibit an extreme change in 187Os 188Os(i) values from 0.3 to 0.83 across a ∼ 1 m interval containing the felsic Ash −33 (Fig. 3a). This more radiogenic signature persists throughout the Fur Formation, albeit with considerable variations in 187Os 188Os(i) (0.49–1.11).
Table 2Rhenium and osmium geochemistry for the studied strata. * Total organic carbon (TOC) content (M. T. Jones et al., 2019) shown for reference. Bold text denotes data of key interest.
4.5 Geochronology and accumulation rates
Absolute age estimates allow for the quantification of sediment deposition rates for environmental proxies such as TOC and Hg. A robust geochronological framework is achievable for the Stolleklint Clay due to the clear onset, body, and recovery of the PETM δ13C excursion and for parts of the Fur Formation due to the prevalence of ash layers that act as key marker horizons (Westerhold et al., 2009). In contrast, the chronology of the pre-PETM strata is poorly constrained due to intense bioturbation and a potential unconformity below the glauconite-rich horizon.
Sedimentation rates during the PETM can be estimated by two methods. The first method uses the estimated durations of the PETM onset and body from astronomically calibrated localities and modelling. If the 11 cm of preserved strata is the entire PETM onset (Fig. 3b), and assuming a maximum duration of 5 kyr for this interval (Kirtland Turner, 2018), the minimum average sedimentation rates at the start of the hyperthermal were ∼ 2.2 cm kyr−1 (Table 1). For the PETM body, van der Meulen et al. (2020) predict a CIE duration of 101±9 kyr. Including propagated uncertainties, this duration gives an average sedimentation rate of 23.8±4.5 cm kyr−1, up to an order of magnitude greater than the sedimentation rate during the onset interval (Table 1). The alternative method is to use marker horizons of known ages. The PETM onset is constrained by astronomical tuning to 55.93 Ma, based on the best-fit orbital solution of Westerhold et al. (2017). A bentonite horizon within the PETM CIE in Svalbard has a 206Pb 238U age of 55.785±0.034 Ma (Charles et al., 2011), estimated to be equivalent to ∼ 2 m above Ash −33 in the Danish strata (Stokke et al., 2020a). Using these two ages gives a sedimentation rate of 17.9±2.8 cm kyr−1, including uncertainties in the thickness of the Stolleklint Clay and the position of the Svalbard marker horizon in the Fur strata. The slight disparity between these two sedimentation rate estimates may arise because the latter value includes part of the PETM recovery, where deposition rates were reduced at Fur. Overall, the two methods are in good agreement, and we base our age model on the former estimate.
Estimating Fur Formation deposition rates is aided by the presence of numerous ash layers, which have been correlated with tuff horizons within the East Greenland flood basalts at the Gronau Nunatak (Heister et al., 2001; Storey et al., 2007a), offshore along the north-western Europe continental margin of Goban Spur (DSDP Site 550), and the Norwegian continental margin (ODP Site 642; Fig. 1) (Knox, 1984, 1985). In particular, two prominent felsic ash layers (Ashes −17 and +19) are used to constrain the geochronology of the early Eocene. Ash −17 was Ar–Ar-dated to 55.48±0.12 Ma once corrected using the 28.201 Ma Fish Canyon Tuff calibration (Kuiper et al., 2008; Storey et al., 2007a). Astronomical tuning using records from Site 550 and the Walvis Ridge (ODP Sites 1262 and 1263) predicts a ∼ 200 kyr interval between the two ashes (Röhl et al., 2007; Westerhold et al., 2009), which gives an estimated age of ∼ 55.28 Ma for Ash +19 (Fig. 3). The measured thickness between Ash −17 and Ash +19 based on the Stolleklint and Elke outcrops is 18.67 m, or 18.02 m excluding ash intervals, which gives an estimated deposition rate of 9.0 cm kyr−1 for this section of the Fur Formation (Table 1).
5.1 Constraining NAIP activity
The main proxies for the eruption style and intensity of NAIP activity are ash deposition, Os isotope chemostratigraphy, clay mineralogy, and Hg anomalies, and each of these proxies has its strengths and weaknesses. Ash layers are conclusive evidence of explosive eruptions. However, the eastern North Sea is 700–1500 km from the known NAIP source volcanoes (Fig. 1), which means that only the largest explosive eruptions are preserved in Danish strata. Several ashes show evidence of magma–water interactions in their formation (Stokke et al., 2020b), suggesting that phreatomagmatic processes led to the explosive nature of eruptions. Therefore, while the distribution of ashes is a clear indicator of extreme explosive volcanism, it may reflect changes in eruption style and may not be indicative of overall volcanic activity. Osmium isotopes can be used as a passive tracer for the weathering and erosion of LIP basalts and ashes affecting ocean chemistry, providing the signal is discernible from other factors such as changing continental weathering and other sources of unradiogenic Os such as extraterrestrial inputs and mid-ocean-ridge spreading (Dickson et al., 2021). Another indicator of the weathering and erosion of LIP basalts and ash is the presence of the minerals smectite and zeolite (Nielsen et al., 2015; Stefánsson and Gíslason, 2001). While clay mineralogy is affected by changes in climate and hydrology, the presence of both smectite and zeolite minerals in variable abundance throughout the Fur stratigraphy has been linked mainly to weathering of volcanic products of NAIP origin (Heilmann-Clausen et al., 1985; Stokke et al., 2021) rather than to reworking of smectite-rich sediments (Li et al., 2020) or post-deposition flocculation (Deconinck and Chamley, 1995).
Sedimentary mercury is generally accepted as a viable proxy for large-scale volcanism in the geological record, with Hg and Hg TOC anomalies coeval with periods of (subaerial) LIP emplacement (Grasby et al., 2019). However, other factors can impact Hg and TOC content non-uniformly (Grasby et al., 2019; Percival et al., 2015; Frieling et al., 2023), so it is important to rigorously assess individual localities taking these factors into account. Directly comparing (normalised) Hg records between localities is complicated by differences in depositional environments, such as organic matter source and content, lithology, sediment accumulation rates, and redox state (Grasby et al., 2019). It is also currently challenging to differentiate between thermogenic and volcanic sources for Hg in the sedimentary record, since both are large potential Hg sources (Svensen et al., 2023). The regional distribution of Hg emissions would be heavily affected by whether Hg degassing is subaerial or submarine (M. T. Jones et al., 2019; Percival et al., 2018). Passive submarine degassing around modern volcanic systems can limit Hg deposition to just tens of kilometres from the source in enclosed, shallow marine environments (e.g. Tomiyasu et al., 2007), so the depth and explosivity of submarine emissions will have a major impact on subsequent Hg dispersal. Thermogenic degassing from the NAIP was most likely dominated by explosive shallow marine venting (Svensen et al., 2004), which may suggest that Hg anomalies proximal to the NAIP are more likely to be of contact metamorphic origin. However, given that widespread sill intrusions and continental flood basalts are both chronologically constrained to somewhere in this time interval and that the ratio of submarine versus subaerial Hg emissions for each source is poorly constrained, the Hg record can only give an overall qualitative indicator of NAIP activity across this interval.
Existing data across the PETM suggest larger Hg anomalies closer to the NAIP (M. T. Jones et al., 2019; Keller et al., 2018; Kender et al., 2021; Liu et al., 2019; Tremblin et al., 2022), indicating that subaqueous emissions from volcanic and/or thermogenic sources may well have limited Hg deposition to more proximal settings than from atmospheric distribution. In fact, even within the North Sea basin there appears to be a substantial gradient in the magnitude and frequency of Hg anomalies, decreasing in intensity from north-west to south-east (M. T. Jones et al., 2019; Kender et al., 2021). Therefore, the Danish strata do not experience significant Hg anomalies compared to more proximal localities. However, what the Fur succession does have is an expanded sedimentary sequence and a well-constrained geochronology, which allows us to estimate Hg mass accumulation rates (Hga) using Eq. (1):
where Hgc is the mean measured Hg concentration, SR is the estimated sedimentation rate, and ρ is the density of the host sediments. The density of the Stolleklint Clay is measured as 1.4 g cm−3, while the Fur Formation diatomite has a measured density of 0.8 g cm−3 (Pedersen et al., 2004). The calculated Hga values for each interval are shown in Table 1.
5.1.1 Late Paleocene (Holmehus/Østerrende Formation), Interval 1
There are no ash deposits in the Holmehus or Østerrende clays in Denmark (Heilmann-Clausen et al., 2014), but occasional ash layers are present in the coeval Lista Formation in the North Sea (Haaland et al., 2000; Knox and Morton, 1988). Both Hg and TOC are relatively uniform up until the base of the glauconite-rich horizon (Fig. 3b). Mean Hg TOC values are 78.1 ppb wt % (Table 1), comparable to the average of published shale datasets (Grasby et al., 2019). Global ocean 187Os 188Os values were low during the late Paleocene (187Os 188Os(i)≈0.4) and considerably more unradiogenic than present-day values of 1.06 (Dickson et al., 2021). These values imply that mantle sources were already a major component of global Os fluxes, including basalt weathering from ongoing NAIP activity and the earlier tropical emplacement of the Deccan Traps at 66.5–65 Ma (Schoene et al., 2019). Late Paleocene sediments in the North Sea have abundant smectite and zeolite mineral components (Nielsen et al., 2015; Stokke et al., 2021), potentially indicating extensive weathering and denudation of basaltic material into the epicontinental sea. The 187Os 188Os(i) values in the Holmehus/Østerrende Formation are variable between 0.40 and 0.27, becoming more unradiogenic towards the glauconite-rich horizon (Table 2, Fig. 3). This finding suggests that low-level NAIP activity was occurring in the late Paleocene and potentially increasing into the latest Paleocene, consistent with the estimated magmatic activity of the NAIP at this time (Wilkinson et al., 2017).
5.1.2 Pre-PETM (Stolleklint Clay), Interval 2
The latest Paleocene section at Fur is a condensed interval of just 20 cm, 12 cm of which is made up of the ash layers SK1 and SK2 (Fig. 3b). These ashes mark the first explosive eruptions that were large enough to reach Denmark (Heilmann-Clausen et al., 2014). The interstitial sediments between the thick ash layers also appear to have a large ash component (Stokke et al., 2021). Mercury concentrations are not elevated with respect to the underlying strata, but Hg TOC values are consistently high, with a mean of 86.8 ppb wt %−1 (Table 1, Fig. 4). Osmium isotopes are extremely low in this interval, with a mean 187Os 188Os(i) of 0.275 (Table 2, Fig. 3b). A pre-PETM shift to unradiogenic 187Os 188Os values has been noted elsewhere, particularly at Svalbard (Wieczorek et al., 2013) and Millville, New Jersey (Liu et al., 2019). This apparent global pulse of unradiogenic Os to the marine realm was most likely of NAIP origin (Dickson et al., 2021), as the negative 187Os 188Os excursions in Svalbard and Fur are accompanied by Hg anomalies in the interstitial sediments that predate the PETM CIE (M. T. Jones et al., 2019). In addition, the clay mineral smectite comprises 38 % of the mineralogy in Interval 2 at Fur (Heilmann-Clausen et al., 1985; Stokke et al., 2021), suggesting a significant input of weathered basaltic material.
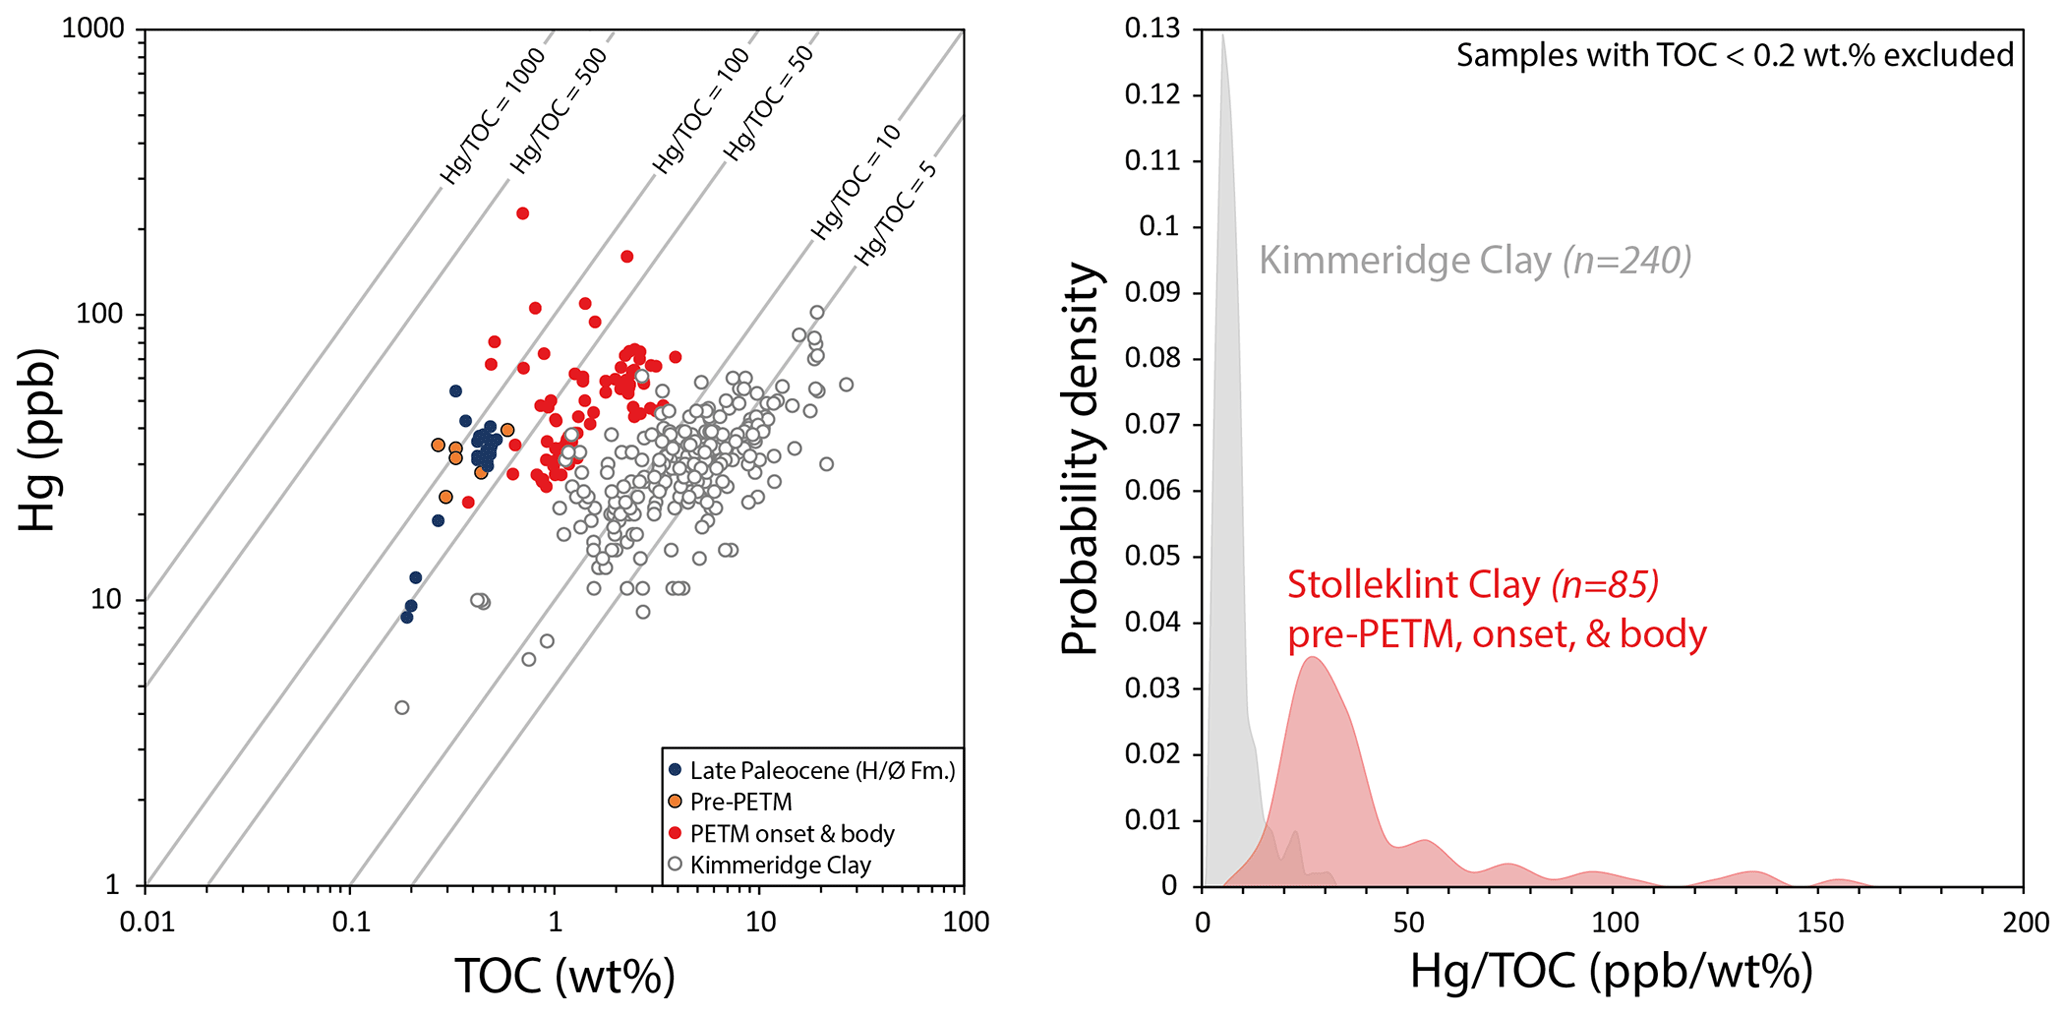
Figure 4Left: a comparison of mercury (Hg) to total organic carbon (TOC) data for the Holmehus/Østerrende Formation (late Paleocene) and the Stolleklint Clay (pre-PETM onset and body) compared with the Upper Jurassic Kimmeridge Clay (southern England), which is an organic-rich shale control site that was not associated with LIP volcanism (Percival et al., 2015). Right: a probability density diagram for Hg TOC ratios in the Stolleklint Clay (red) and the Kimmeridge Clay (grey).
5.1.3 PETM onset (Stolleklint Clay), Interval 3
The PETM onset at Fur is bounded by Ash SK2 and the much thinner SK3 and SK4 layers that are the last ash occurrences for > 19 m of strata (Fig. 3), suggesting either that explosive volcanism decreased in magnitude to not transport ash as far or that there was a period of explosive volcanic quiescence. Trace metals typically associated with volcanic ash such as Ni, Cu, and V are not enriched in the sediments in this interval (Stokke et al., 2021). Aside from the sample directly above Ash SK2, there are no Hg anomalies, and Hg TOC values are reduced compared to pre-PETM strata (Table 1, Fig. 3b). Calculated Hg deposition rates (Hga, using Eq. 1) are 0.12 ng cm−2 yr−1, assuming the onset is complete and 5 kyr in duration (Fig. 5). This rate is less than the Hg deposition rates of 0.7 to 1.6 ng cm−2 yr−1 calculated for the unpolluted Holocene (< 1000 CE) Baltic Sea (Frieling et al., 2023) but greater than the estimated 0.05 to 0.1 ng cm−2 yr−1 of atmospheric Hg deposition in Swedish Holocene peat bogs (Bindler, 2003). The lack of Hg anomalies during the PETM onset may suggest a period of volcanic quiescence, or perhaps a shift to subaqueous Hg emissions (either volcanic or thermogenic) became more dominant, thereby affecting more NAIP-proximal localities than Denmark (M. T. Jones et al., 2019; Kender et al., 2021).
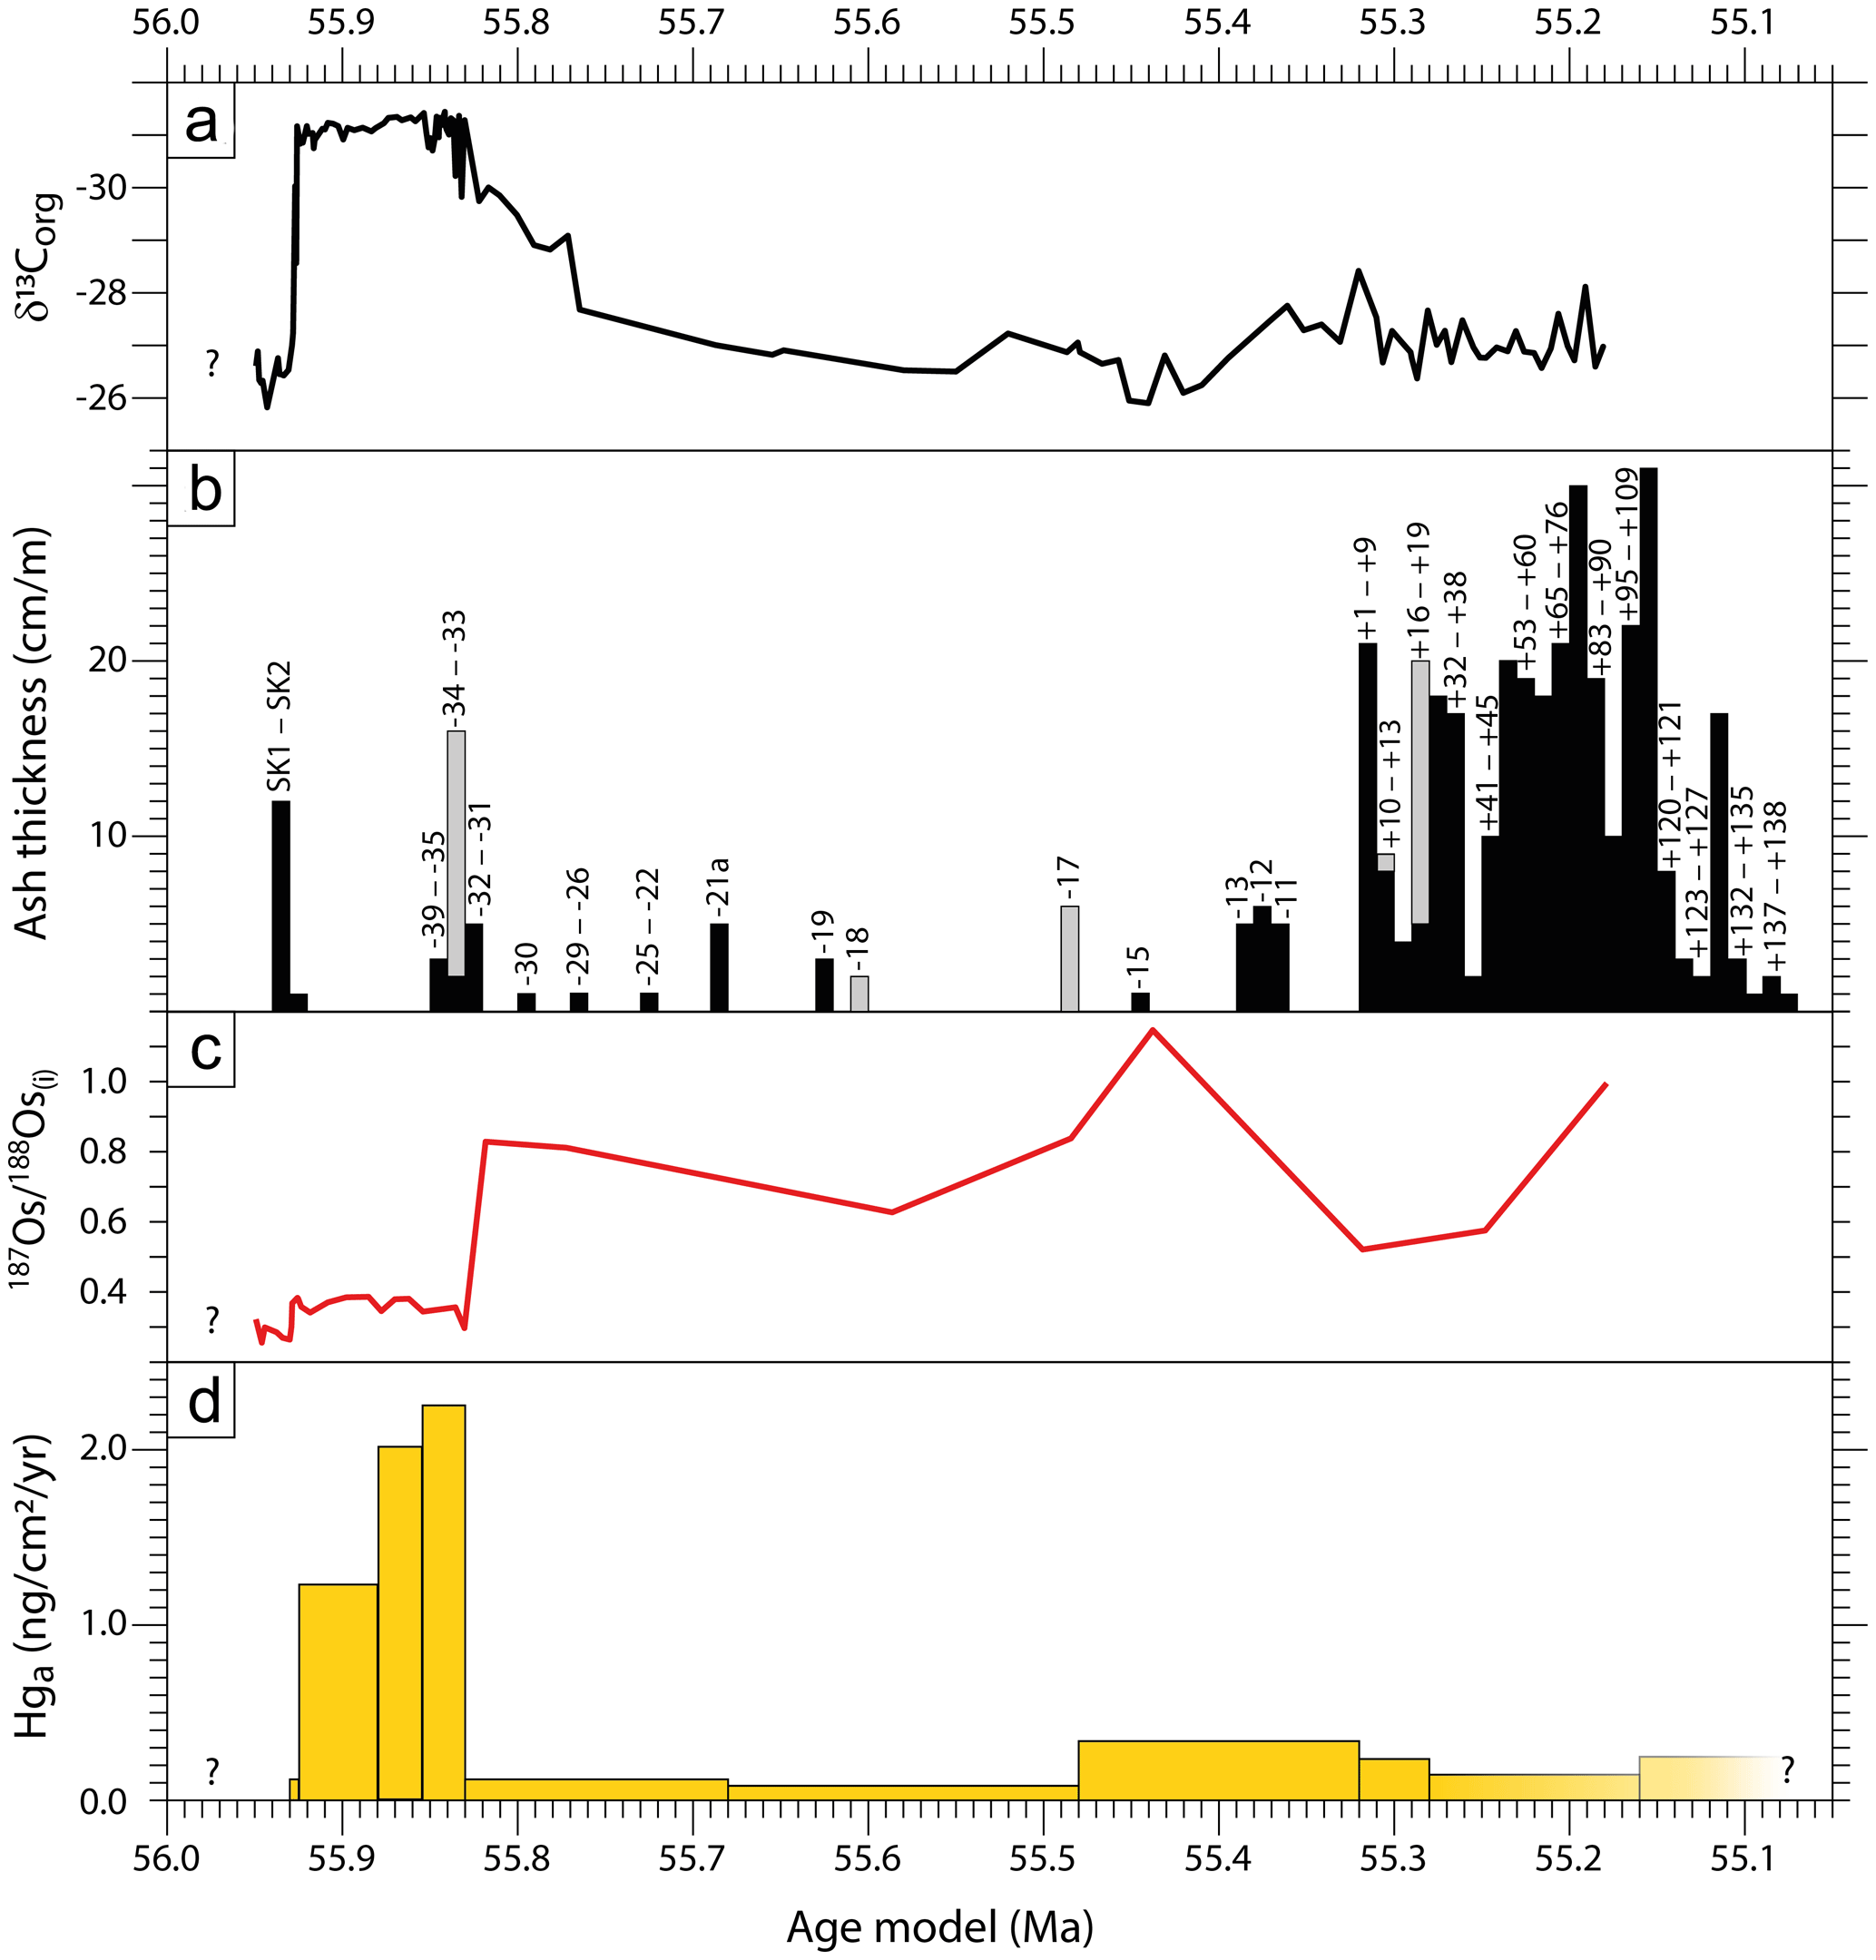
Figure 5Volcanic proxies through the studied section, normalised to their estimated depositional age based on the age model shown in Fig. 3. (a) Carbon isotopes (δ13Corg) for reference (M. T. Jones et al., 2019), showing the PETM CIE from 55.93–55.83 Ma. (b) Ash thicknesses as a combined percentage of ash (after compaction) per metre of sediment. Black bars denote basaltic ashes, and the grey bars denote felsic ashes. (c) Initial 187Os 188Os isotopes (187Os 188Os(i)). (d) Estimated Hg accumulation rates (Hga), subdivided into specific intervals. The volcanic proxy records below the glauconite-rich layer are not shown due to uncertainties in the timing of deposition, while Hga values in the youngest part of the strata are uncertain due to poorly constrained sedimentation rates above Ash +19.
The Os isotope record shows a pronounced (> 0.1) radiogenic shift through the PETM onset (Fig. 3b), which has also been noted at other localities worldwide (Dickson et al., 2015; Liu et al., 2019; Ravizza et al., 2001; Wieczorek et al., 2013). This change has been interpreted to record enhanced continental weathering in response to warmer conditions and a more vigorous hydrological cycle (Dickson et al., 2015; Pujalte et al., 2015; Ravizza et al., 2001). This hypothesis is corroborated by large changes in clay assemblages, Li isotopes, and surface temperature proxies across the CIE onset at Fur (Fig. 3b) (Pogge von Strandmann et al., 2021; Schoon et al., 2015; Stokke et al., 2021, 2020a). The shift to radiogenic 187Os 188Os values suggests that an increase in submarine volcanism is unlikely during the onset. The rapidity of the change in Os isotopes is also notable, as the onset duration (Kirtland Turner, 2018) is less than the modern oceanic residence time of Os (10–55 kyr; Levasseur et al., 1999; Sharma et al., 1997). Changes on such a timescale suggest not only that Os inputs changed across the PETM onset but also that marine Os export may have increased rapidly due to enhanced sedimentation rates and organic matter burial.
5.1.4 PETM body (Stolleklint Clay), Intervals 4–6
Evidence for explosive volcanic activity during the ∼ 24 m PETM body is limited to the lowermost 12 cm (Ashes SK3 and SK4) and uppermost 5 m (Ashes −39 to −33) of strata. The sediments in between (Intervals 4 and 5) have no macroscopic ashes. However, a large zeolite component (up to 36.1 % of bulk mineralogy) in this interval suggests continued weathering of volcanic material in sediment source areas (Stokke et al., 2021), and Os isotopes show a mantle-dominated signature of ∼ 0.4 (Fig. 3). The Hg and TOC signal in this interval is noteworthy as their covariance results in remarkably stable Hg TOC ratios (Fig. 3), indicating that the Hg cycle was coupled to TOC deposition and was in a steady state. The Hg TOC values are lower than both the pre- and post-PETM sequences (Table 1), which at first glance suggests low volcanic activity. However, when compared to the Upper Jurassic Kimmeridge Clay, which was deposited under similar conditions (i.e. anoxic, high productivity) during a period with no LIP activity (Percival et al., 2015), the Hg TOC ratios in the Stolleklint Clay are considerably elevated (Fig. 4). It is also conceivable that the rapid sedimentation rates and high TOC content led to suppressed Hg TOC anomalies during the PETM.
Using a sedimentation rate of 23.8 cm kyr−1, based on an estimated PETM body duration of 101±9 kyr (van der Meulen et al., 2020), and a mean Hg content of 52.8 ppb through Intervals 4–6 gives an estimated Hg mass accumulation rate (Hga) of 1.76 ng cm−2 yr−1. This rate is an order of magnitude higher than the estimated Hga during the PETM onset and considerably higher than those calculated for the Holocene (Bindler, 2003; Frieling et al., 2023). The general trend through the PETM body is of increasing Hg content up-section, which outpaced concomitant TOC increases in Interval 6, leading to the highest mean Hg content and discrete Hg TOC anomalies coincident with the re-emergence of ash layers in the stratigraphy (Fig. 3). Assuming constant sedimentation rates, we calculate Hga to be 1.24 ng cm−2 yr−1 for Interval 4 (lower PETM body), 2.01 ng cm−2 yr−1 for Interval 5 (middle PETM body), and 2.26 ng cm−2 yr−1 for Interval 6 (upper PETM body; Table 1, Fig. 5). If an average Hga of 1.76 ng cm−2 yr−1 during the PETM body is indicative of the whole North Sea basin at this time (∼ 500 000 km2), it would result in annual deposition of 8.8 t of Hg into this epicontinental sea and a total of ∼ 0.9 Mt Hg deposition across the duration of the PETM body. This is likely a conservative estimate, given that more proximal sites have higher Hg content and that > 20 m deposition during the PETM body is not unusual in this basin (Jin et al., 2022). The calculated Hg accumulation flux for the North Sea is 1.3 %–12 % of current (albeit poorly constrained) estimates of modern global volcanic Hg emissions (Grasby et al., 2019, and references therein), despite representing just 0.1% of the Earth's surface area.
High Hg deposition rates during the CIE body are substantiated by sediments in Svalbard, where Hg content and Hg TOC ratios are consistently elevated during the PETM compared to overlying and preceding strata (M. T. Jones et al., 2019). Svalbard is unique as a PETM locality in that there were high sedimentation rates before, during, and after the CIE, with neither breaks in sedimentation nor significant changes in lithology (Charles et al., 2011; Dypvik et al., 2011), so the potential for sedimentological disruption to the Hg signal is minimised. The combined records from Fur and Svalbard suggest that Hg emissions were substantially elevated during the PETM, resulting in higher Hg accumulation rates in these rapidly deposited sediments (Fig. 3). The increase in Hga values and Hg TOC anomalies towards the end of the CIE body at Fur (Interval 6), combined with the reappearance of ash layers in the stratigraphy, may suggest an increase in NAIP activity. However, it could potentially be an artefact of assuming constant sedimentation rates through the PETM body, whereas both Li isotope variations (Pogge von Strandmann et al., 2021) and clay mineral assemblages (Stokke et al., 2021) suggest that surface runoff and erosion rates were greater earlier in the PETM. This discrepancy may affect the individual Hga interval estimations but does not change the main finding that average Hg accumulation rates during the PETM CIE were significantly elevated (Fig. 5).
5.1.5 PETM recovery (Fur Formation), Interval 7
The PETM recovery is bounded by the thick felsic Ash −33 and the basaltic Ash −21a (Fig. 3), based on dinoflagellate cyst assemblages (Heilmann-Clausen, 1994) and δ13C values (M. T. Jones et al., 2019). Using estimated ages of ∼ 55.83 Ma for the end of the PETM body (van der Meulen et al., 2020) and ∼ 55.48 Ma for the radiometric age of Ash −17 (Storey et al., 2007a) gives an estimated duration of 160 kyr between Ashes −33 and −21a (Fig. 3). However, the relatively well-constrained stratigraphic sections (PETM body and Ash −17 to Ash +19) are not necessarily well correlated with each other, leading to potentially significant errors in estimating the duration of Interval 7. Although there are 12 ash layers in this interval, most are < 1 cm (Bøggild, 1918) and are extremely heterogeneous in composition, suggesting sources from the NW European shelf (Larsen et al., 2003). The bulk rock mineralogy shows the zeolite component declining from 27 % to 0 % from −0.28 to +5.35 m depth (Stokke et al., 2021), although there is a concurrent increase in the clay fraction from 4 % to 17 % that is dominated by illite–smectite (Fig. 6). These mineralogical shifts suggest a fundamental change in the volcanogenic sediment fluxes into the eastern North Sea basin across the PETM recovery. The 187Os 188Os data for Intervals 7–9 are considerably more radiogenic than Intervals 1–6, suggesting a fundamental shift in Os supply into the North Sea that may not solely reflect changes in weathering of continental and basaltic substrates (see Sect. 5.2.1).
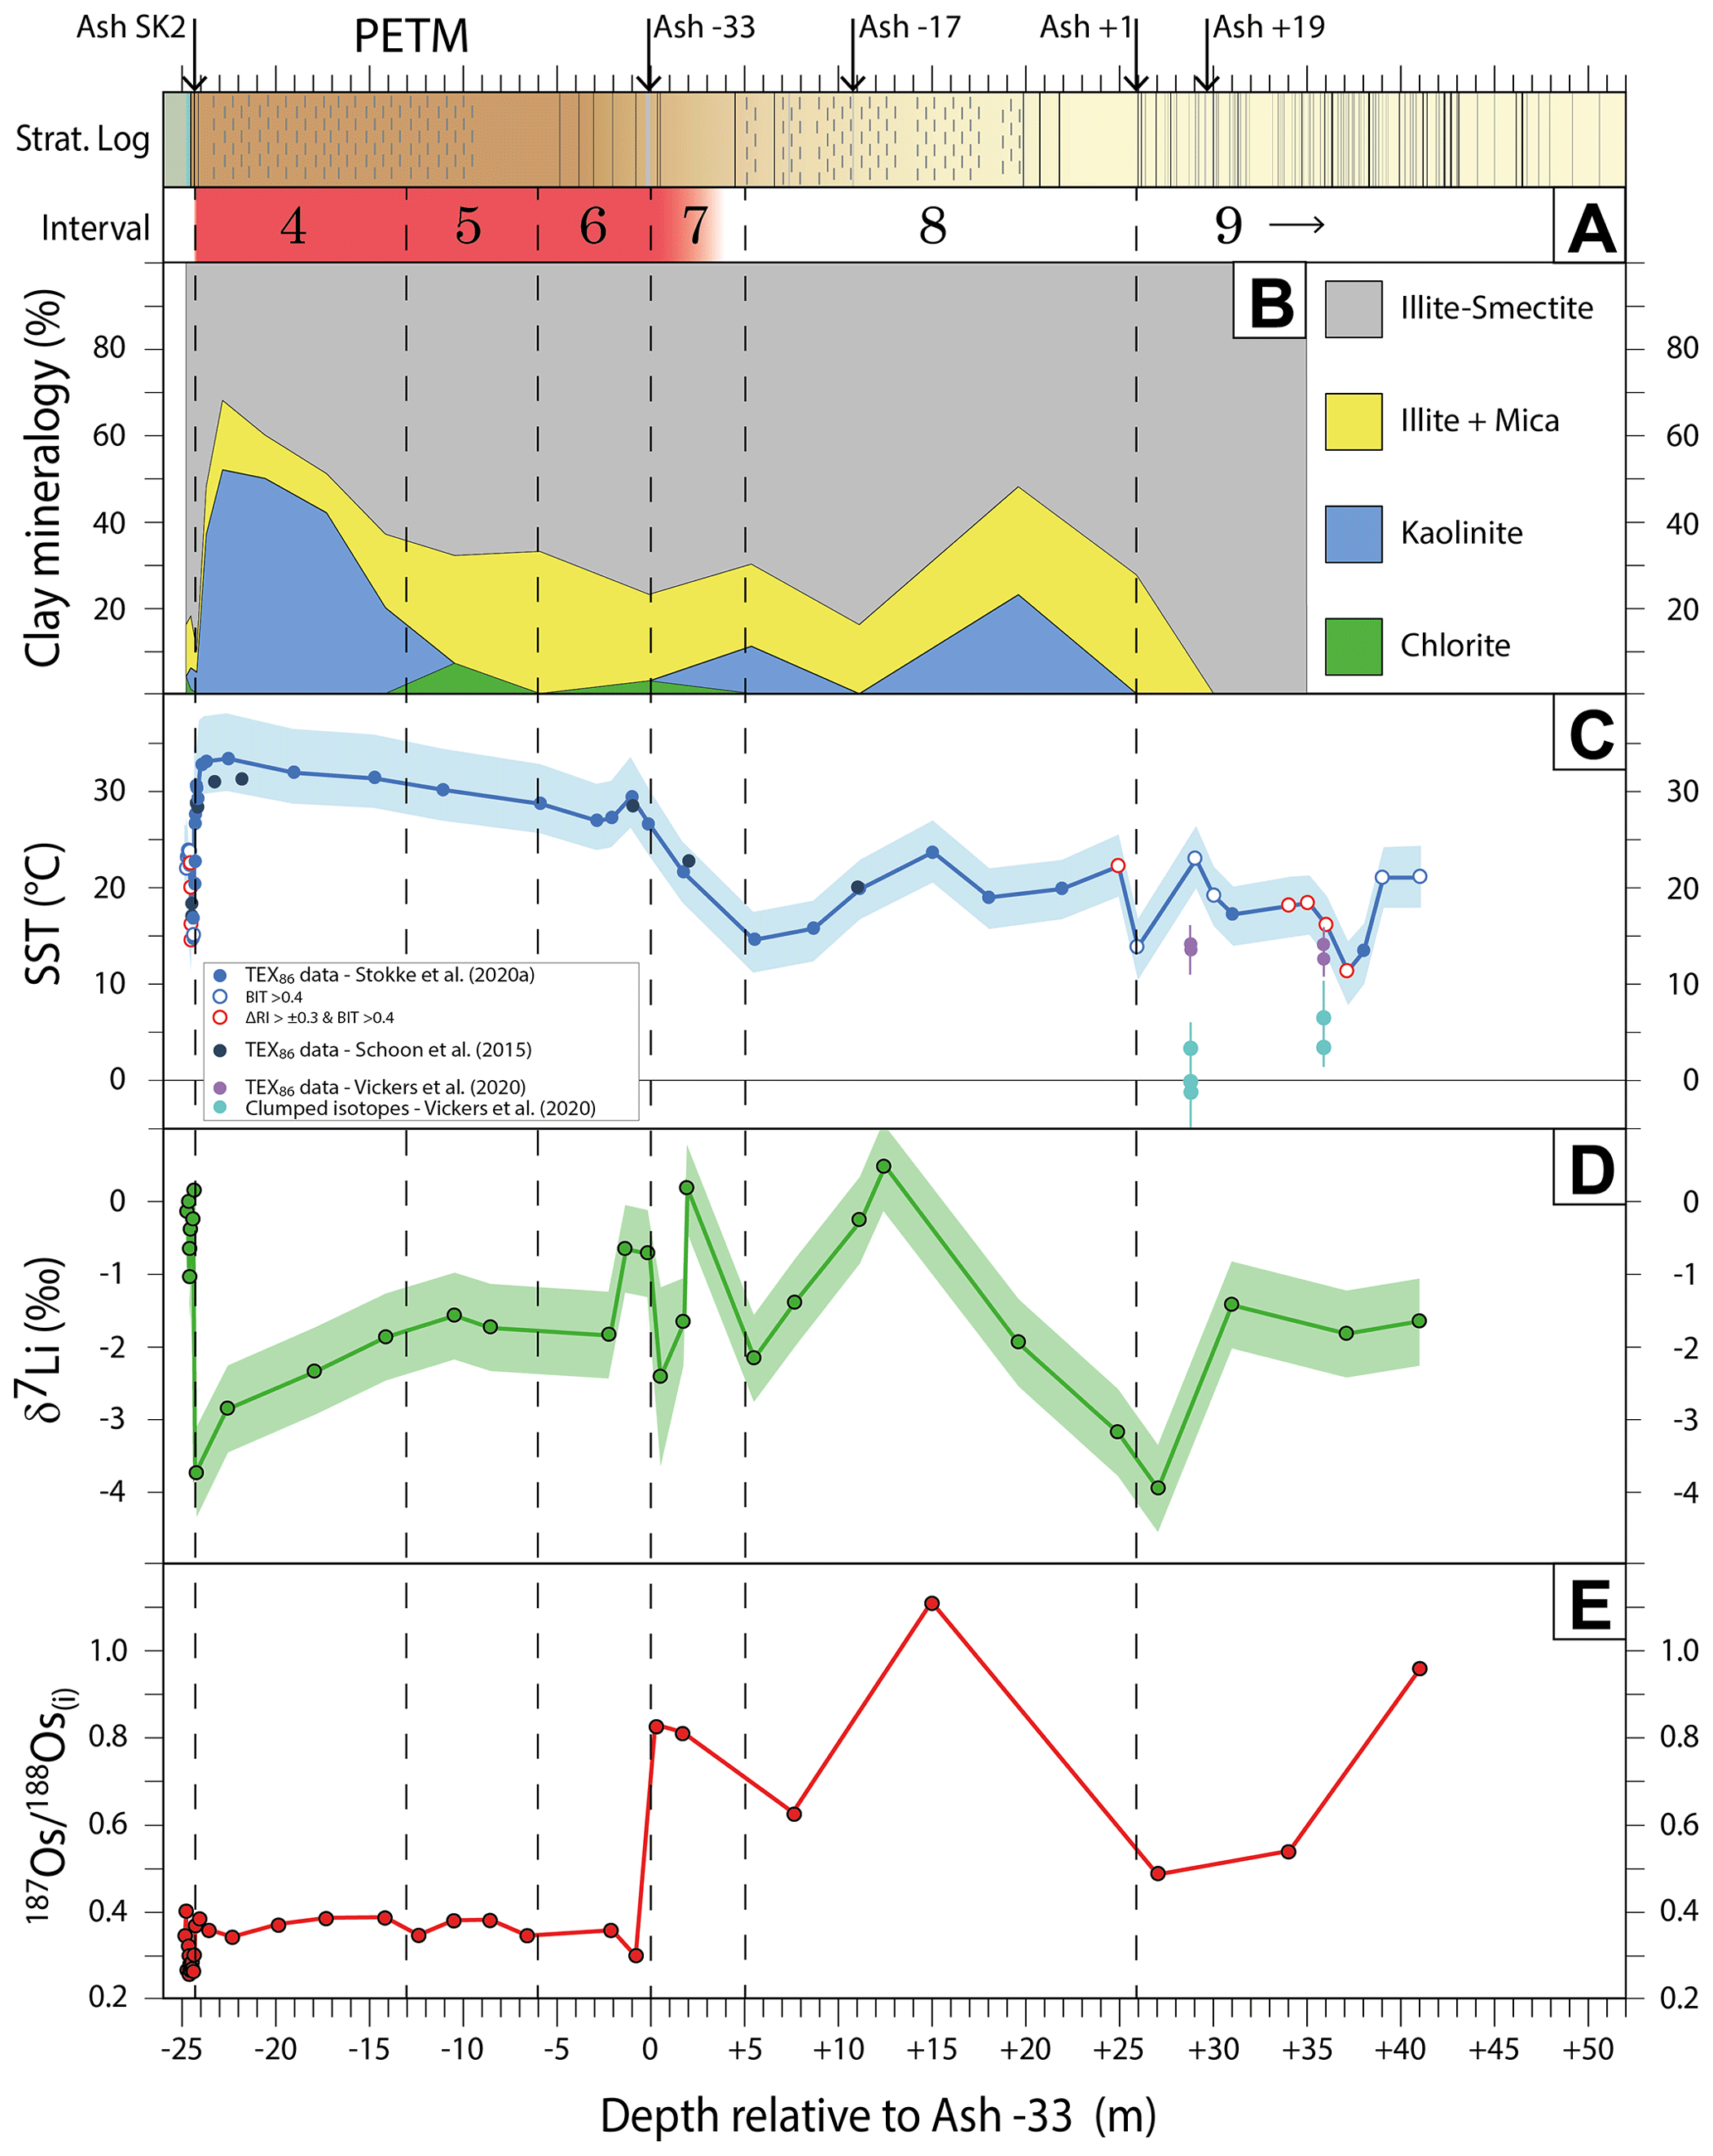
Figure 6A compilation of weathering and climate proxies through the studied section. (a) The stratigraphic log is adapted from Stokke et al. (2020a), showing laminated intervals (dashed lines) and ash layers (solid lines). Key ash layers are labelled on the log, along with the position of the PETM CIE and intervals proposed in this study. (b) Variations in the relative abundance of clay minerals for Intervals 1–8 (Stokke et al., 2021) and Interval 9 (this study). (c) Sea surface temperature data based on the TEX86 proxy (Schoon et al., 2015; Stokke et al., 2020a) and benthic temperatures based on clumped isotopes (Vickers et al., 2020). (d) Detrital δ7Li values from Intervals 1–7 (Pogge von Strandmann et al., 2021) and Intervals 7–9 (this study). (e) Initial 187Os 188Os values at 55.9 Ma (187Os 188Os(i)) through the studied section.
The Hg signal during the PETM recovery is likely affected by the change from clay-rich to diatomite-rich sediments and the associated change in sedimentation rates and more oxidising conditions. Mercury content shows a general decrease from ∼ 60 to ∼ 20 ppb (Fig. 3), but the parallel decrease in TOC is significantly greater, leading to higher Hg TOC ratios (Table 1). The upper part of Interval 7 has TOC content < 0.2 wt %, which is taken as the cut-off for propagated errors in Hg TOC ratios being too high. However, even at TOC content values above 0.2 wt % there is a (subtle) remaining trend that is not accounted for by a linear Hg–TOC relation, leading to higher Hg TOC at comparatively lower TOC in many datasets (Grasby et al., 2019). Calculating Hga is complicated by the lack of a good chronology for this interval, coupled with a gradual change in sediment density into the diatomite-rich strata. A 160 kyr duration between Ashes −33 and −21a gives a sedimentation rate of 2.8 cm kyr−1. Taking the mean Hg content of 37.6 ppb (Table 1) and assuming a density between that of the Stolleklint Clay and the Fur Formation (ρ ≈ 1.1 g cm−3) gives a mass accumulation rate (Hga) of 0.12 ng cm−2 yr−1. Even with the substantial errors ingrained in this estimation it is clear that Hg deposition decreased significantly during the PETM recovery in the eastern North Sea (Fig. 5). A decline in volcanogenic sediment input is corroborated by the extreme radiogenic shift in 187Os 188Os(i) isotopic values from 0.3 to 0.83 (Table 2, Fig. 3a), although the amplitude of this change may be indicative of local changes in the basin configuration rather than just changes in volcanic activity (see Sect. 5.2.1).
5.1.6 Early Eocene (Fur Formation), Intervals 8–9
The post-PETM Fur Formation is separated into two intervals based on the abundance and chemistry of ash layers. In Interval 8, the Ashes −21a to −1 are relatively sparse and chemically heterolithic, likely being sourced from a mixture of shelf sources and failed or propagating parts of the central rift system (Larsen et al., 2003). In contrast, Interval 9 is dominated by vast volumes of chemically homogenous tholeiitic basaltic ashes numbered +1 to +140 (Larsen et al., 2003). Physical and chemical evidence of glass shards suggests that the central rift system started to develop surface waterbodies, leading to phreatomagmatic activity and a shift from effusive to explosive activity (Stokke et al., 2020b). The clay fraction in the Fur Formation is dominated by smectite, reaching 100 % in Interval 9 (Fig. 6), which suggests that the weathering and erosion of volcanic rocks into the North Sea basin continued to be an important sediment source into the early Eocene.
Mercury content in the Fur Formation displays a gradual decrease from a mean value of 47 ppb in the second part of Interval 8 (Ashes −17 to +1) to 21 ppb in the middle part of Interval 9 (Ashes +19 to +118; Table 1) before increasing slightly at the top of the section in conjunction with higher TOC content (Fig. 3). Organic carbon content is predominantly < 1 wt % in the diatomite, leading to significant scatter in Hg TOC values. The apparent enrichment in Hg TOC compared to the Stolleklint data likely reflects the bias of inflating Hg TOC ratios at lower TOC content (Grasby et al., 2019). Mercury accumulation rates (Hga) reach a nadir of 0.09 ng cm−2 yr−1 in the first part of Interval 8 (Table 1, Fig. 5), although it may be partly due to the aforementioned uncertainties in sedimentation rate between Ashes −33 and −17. The better-constrained sedimentation rates in the 200 kyr interval between Ashes −17 and +19 give calculated Hga values of 0.34 ng cm−2 yr−1 for the second part of Interval 8 and 0.23 ng cm−2 yr−1 for the first part of Interval 9 (Table 1). These accumulation rates are well below the calculated Hga values during the PETM (Fig. 5) due to reduced sedimentation rates and lower density of the diatomite. The sedimentation rates for the upper part of Interval 9 are not known, but if the calculated value of 9.0 cm kyr−1 between Ashes −17 and +19 is assumed to continue, then Hga values are 0.15 ng cm−2 yr−1 between Ashes +19 and +118 and 0.25 ng cm−2 yr−1 between Ashes +118 and +140 (Table 1). These Hga estimates indicate that the highest Hg deposition rates occur in the second half of Interval 8 and not concomitant with the start of the voluminous explosive volcanism in Interval 9 (Fig. 5).
5.2 Tracing seaway connectivity
The Paleocene–Eocene transition is marked by several regional and eustatic changes in sea levels. A global sea-level rise on the order of a few metres during the PETM is attributed to the thermal expansion of seawater (Sluijs et al., 2008). While this effect would be important for shallow slope/margin environments, it is insufficient to affect seaway connectivity. In contrast, the transient thermal uplift in the centre of the NAIP closed the Atlantic connection via the Faroe–Shetland Basin until ∼ 54 Ma (Hartley et al., 2011; Shaw Champion et al., 2008; White and Lovell, 1997). Evidence from the δ18O record of shark-tooth apatite indicates a North Sea surface-water freshening in the early Eocene (Zacke et al., 2009), suggesting that the Atlantic connection via the English Channel was also temporarily restricted. This North Sea freshening is corroborated by an influx of low-salinity tolerant dinocyst taxa into the North Sea prior to the PETM CIE (Kender et al., 2012). There is also evidence of a transient closure of the shallow marine connection to the Peri-Tethys (Radionova et al., 2003) and a restriction of the Norwegian–Greenland Seaway (Hovikoski et al., 2021) around the late Paleocene to early Eocene. Although the exact timings of these events are not well constrained, these observations indicate the potential for restriction of the pre-breakup Nordic and North Sea basins. The multiple datasets from the Danish Paleogene strata in this study and prior work can be compared with other global high-resolution records to explore changes to the oceanic connections between the North Sea and the Atlantic, Tethys, and Arctic oceans.
5.2.1 Osmium isotopes
There are now several 187Os 188Os datasets from numerous global localities that can be used to assess the extent of ocean connectivity during the latest Paleocene and early Eocene (Fig. 7). The methodology of Os retrieval has evolved through time. Older PETM studies used inverse aqua regia for sample digestion (e.g. Dickson et al., 2015; Ravizza et al., 2001; Schmitz et al., 2004; Wieczorek et al., 2013), while more recent analyses used chromic acid to preferentially liberate hydrogenous Os (Liu et al., 2019; this study). The inverse aqua regia digestion method is more aggressive, potentially leading to contamination from detrital Os in silicate minerals (e.g. Kendall et al., 2004). However, the existing 187Os 188Os data across the PETM are largely homogeneous across the North Atlantic, Indian, and Tethys oceans (Dickson et al., 2015; Liu et al., 2019; Ravizza et al., 2001; Schmitz et al., 2004). This global homogeneity suggests that any detrital contamination is minimal and that the open marine Os residence time exceeded the ocean mixing time.
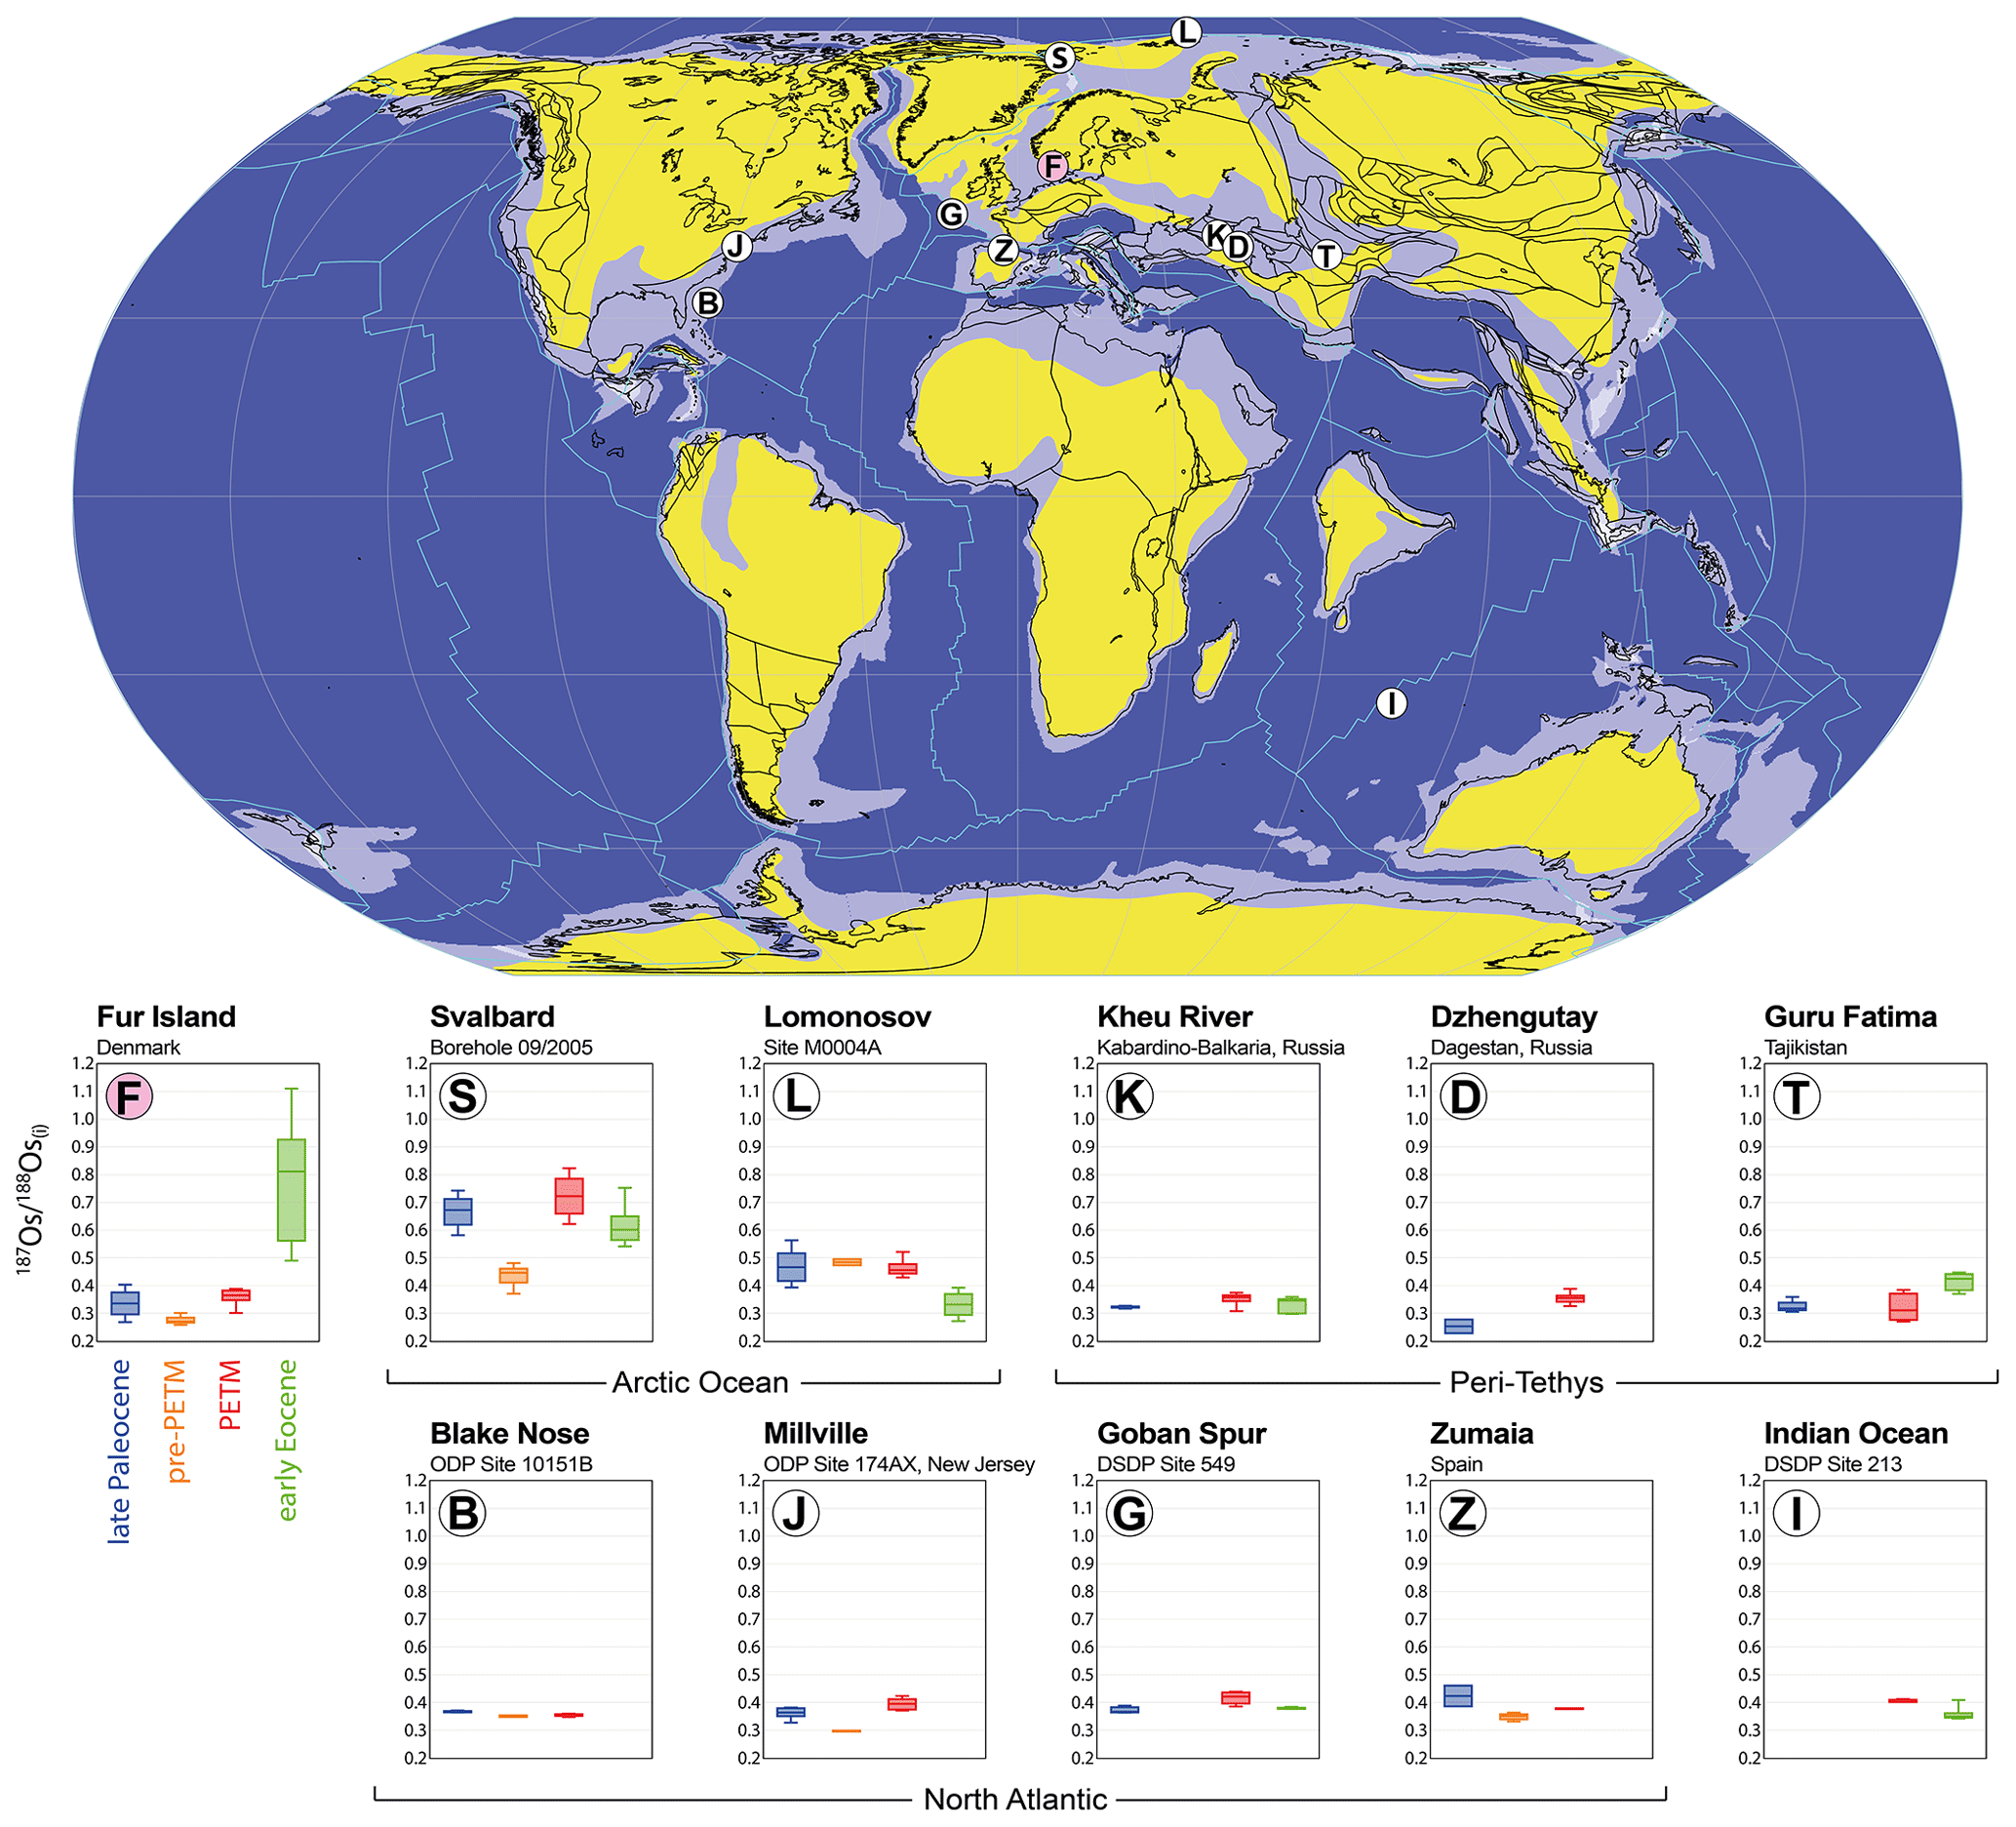
Figure 7A global compilation of initial Os isotopes at 55.9 Ma (187Os 188Os(i)) from sites across the Paleocene–Eocene boundary. Fur (F; this study); Svalbard (S; Wieczorek et al., 2013); Lomonosov Ridge (L), Kheu River in Russia (K), Dzhengutay in Russia (D), and Guru Fatima in Tajikistan (T) (Dickson et al., 2015); Blake Nose (B) and Millville in New Jersey (J) (Liu et al., 2019); Goban Spur site 549 (G) and Indian Ocean Site 213 (I) (Ravizza et al., 2001); Zumaia in Spain (Z) (187Os 188Os(i) calculated to 55 Ma in this study.) (Schmitz et al., 2004). The data are shown as boxplots, where blue denotes late Paleocene samples, orange denotes confirmed pre-PETM data (last few thousand years of the Paleocene), red denotes the PETM CIE, and green denotes post-PETM early Eocene samples. Plate tectonic reconstruction map adapted from Pogge von Strandmann et al. (2021).
Overall, the global marine 187Os 188Os pool reflects a highly unradiogenic signature (187Os 188Os(i)≈0.4) before, during, and after the PETM (Fig. 7). There is some variability between localities, such as a pronounced drop in 187Os 188Os(i) in pre-PETM strata from the North Atlantic that suggests elevated unradiogenic fluxes prior to the onset of the CIE (Liu et al., 2019; Schmitz et al., 2004). This signal appears to be absent from other sites, but that may be due to data gaps and/or condensed sections (Fig. 7). The late Paleocene, pre-PETM, and PETM body intervals in Denmark have 187Os 188Os(i) values between 0.258 and 0.403 (Table 2, Fig. 5), with the more unradiogenic values found in pre-PETM strata. These values are in good agreement with global ocean datasets, which suggests that there was an open seaway connection between the North Sea and the North Atlantic Ocean before and during the PETM CIE (Fig. 1). In contrast to the global ocean signal, the 187Os 188Os(i) records from Svalbard (Wieczorek et al., 2013) and Lomonosov Ridge (Dickson et al., 2015) show much more radiogenic signatures (Fig. 7). This heterogeneity suggests that both the Central Spitsbergen Basin and the Arctic Ocean were largely cut off from the global oceans, with little evidence of an open Barents Shelf. The pre-PETM Svalbard strata do show an unradiogenic 187Os 188Os shift (Wieczorek et al., 2013), as also observed in this study (Table 2) and in North Atlantic datasets (Liu et al., 2019; Schmitz et al., 2004). This consistent regional pattern suggests that a source of unradiogenic Os such as NAIP volcanism was also able to affect the northern part of the Norwegian–Greenland Seaway (Fig. 1). The early Eocene shift to unradiogenic 187Os 188Os values at Lomonosov Ridge (Fig. 5; Dickson et al., 2015) may then indicate a post-PETM increase in seawater transfer between the Arctic and the Peri-Tethys through western Siberia (Radionova et al., 2003).
The extreme change in 187Os 188Os(i) values from 0.3 to 0.83 at the beginning of the PETM recovery in the Danish strata (Table 2, Fig. 5) is a large deviation from the global trend that continues for the entire Fur Formation. This radiogenic 187Os 188Os(i) shift occurs in samples 109 cm apart, or 88 cm excluding the thicknesses of Ashes −34 to −31 (Fig. 3). Using the calculated sedimentation rates for Intervals 6 and 7 (Sect. 5.1.4 and 5.1.5) gives an estimated duration of ∼ 11.9 kyr between the two samples, which suggests that a rapid and sustained isolation of the North Sea basin coincided with the start of the PETM recovery. This result corroborates previous findings of a freshening of the North Sea in the early Eocene (Zacke et al., 2009) while markedly improving the resolution of the timing of isolation to ∼ 55.82 Ma. This timing is in excellent agreement with the estimated age of 55.80±0.8 Ma for a buried landscape surface in the Faroe–Shetland Basin (Hartley et al., 2011; Shaw Champion et al., 2008), which represented a major regional regression associated with NAIP uplift (Conway-Jones and White, 2022). The presence of Ash −33 within the interval of rapid 187Os 188Os change is also noteworthy, as the source volcano is postulated to be the island of Lundy in south-western England (Larsen et al., 2003). It is therefore plausible that the uplift associated with the NAIP reactivated the Lundy volcanic system in conjunction with the closing of the English Channel (Fig. 1).
5.2.2 Lipid biomarkers
Unlike all other analysed sites, the Lomonosov Arctic Coring Expedition (ACEX) core and part of the Fur datasets do not show a marked response to the PETM warming in fcren' (Fig. 8). These observations suggest that thaumarchaeotal membrane adaptation predominantly occurred through GDGTs 1–3 for these datasets and not also through increased fcren', as seen at other open marine localities. It seems that only part of this divergent response can be ascribed to lower temperatures both at Fur and in the Arctic Ocean at the time, since TEX86-derived SSTs as well as vegetation reconstructions favour warm–temperate to subtropical conditions at both localities (Sluijs et al., 2020; Suan et al., 2017; Weijers et al., 2007; West et al., 2015; Willard et al., 2019; Willumsen, 2004), which is similar to sites in the high-latitude Southern Hemisphere (Bijl et al., 2021; Contreras et al., 2014; Huurdeman et al., 2020; Sluijs et al., 2011).
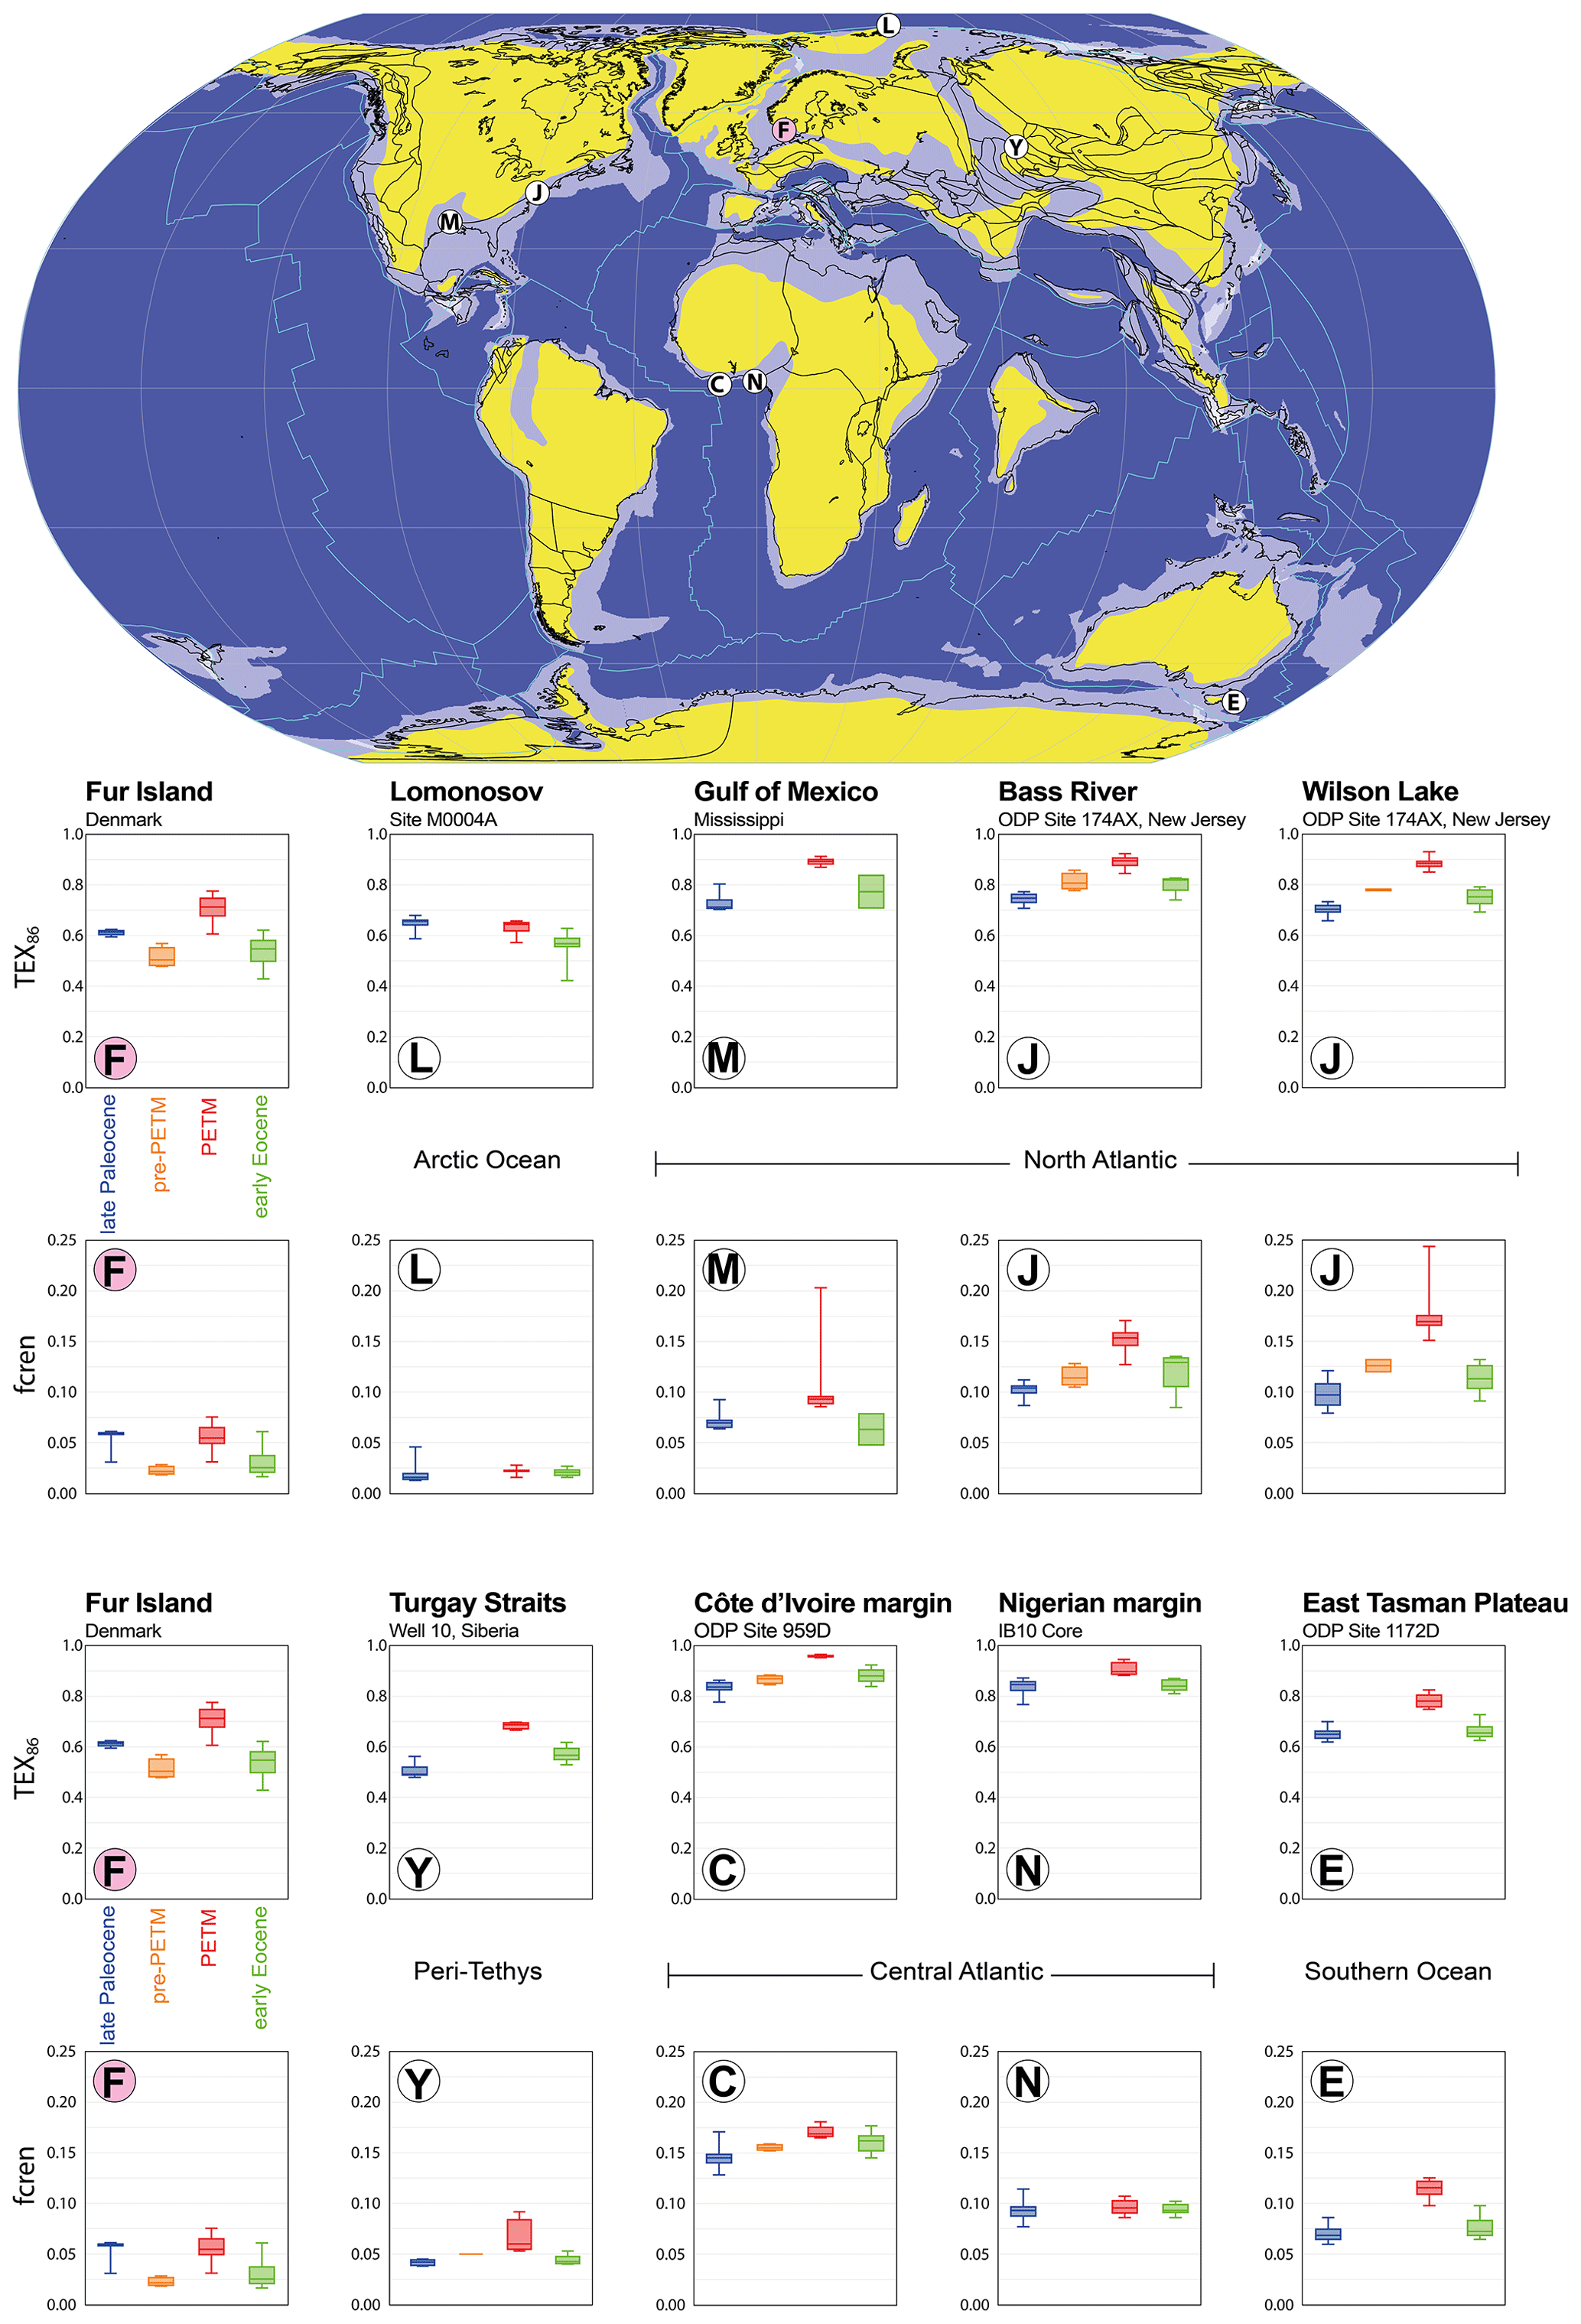
Figure 8A comparison of TEX86 and fcren' data across the PETM from existing global datasets: Fur (F; Stokke et al., 2020a); Lomonosov Ridge (L; Sluijs et al., 2020); Turgay Strait in Siberia (Y; Frieling et al., 2014); the Gulf of Mexico (M; Smith et al., 2020); Bass River and Wilson Lake, New Jersey, shelf (J; Sluijs et al., 2007); ODP 959D on the Côte d'Ivoire margin (C; Frieling et al., 2019); Nigerian margin BH10 (N; Frieling et al., 2017); and ODP 1172D on the East Tasman Plateau (E; Sluijs et al., 2011). The data are shown as boxplots, where blue denotes late Paleocene samples, orange denotes confirmed pre-PETM data (last few thousand years of the Paleocene), red denotes the PETM CIE, and green denotes post-PETM early Eocene samples. Plate tectonic reconstruction map adapted from Pogge von Strandmann et al. (2021).
In addition, the relatively cold West Siberian Sea at ∼ 58∘ N (Frieling et al., 2014) is considered to have had an open connection to the Arctic but also to the Peri-Tethys to the south, and its GDGT response follows the pattern of other globally distributed sites throughout the Paleocene and Eocene. Deoxygenation and freshwater input can be excluded as dominant controlling factors since these are not unique to either the Danish or the Lomonosov strata (e.g. Carmichael et al., 2017; Frieling et al., 2014; Sluijs et al., 2014). The divergent response between TEX86 and fcren' to temperature changes in the latest Paleocene and early Eocene at the Fur and ACEX sites may therefore have been facilitated by temporary basinal restriction. It is intriguing that the TEX86–fcren' data from the Lomonosov locality show a more normal marine response during the Eocene Thermal Maximum 2 (∼ 54 Ma) interval (Sluijs et al., 2020; Sluijs et al., 2009). While we cannot confirm that a similar signal occurred in the North Sea area at the same time, as this interval post-dates the Fur Formation, it highlights that exploring the behaviour of lipid-based proxies may aid in identifying and constraining periods of basin restriction in the region.
5.3 Weathering and hydrology
The Li isotope record for the Stolleklint Clay and Fur Formation shows large variations both during and after the PETM (Fig. 3). A major excursion in δ7Li values of −4 ‰ in under 10 kyr, which is coeval with the PETM onset and matches other global siliciclastic and carbonate Li isotope records, is interpreted to be a direct weathering response to an enhanced hydrological cycle during global warming (Pogge von Strandmann et al., 2021). However, the post-PETM record continues to show considerable variability, with three negative δ7Li excursions broadly coinciding with the start of Intervals 7, 8, and 9, each followed by positive excursions (Fig. 3). Notably, the excursion at the start of Interval 9 is of a comparable magnitude (−4 ‰) to the excursion during the PETM onset, albeit a gradual change over 15 m (∼ 160 kyr) rather than a sharp response over a 12 cm interval (Fig. 6).
Numerous factors could have influenced the detrital δ7Li signal to generate the observed fluctuations in the Fur Formation. Increased surface temperatures elevate both chemical weathering and erosion and may increase erosion more than chemical weathering, leading to a lower-weathering-intensity regime, as proposed to explain the negative δ7Li excursion during the PETM onset (Pogge von Strandmann et al., 2021). However, the lack of correlation between Li isotopes and paleotemperatures in post-PETM sediments suggests that climate was not the main driving factor of later δ7Li excursions (Fig. 6). Alternatively, uplift associated with the emplacement of the NAIP could affect detrital δ7Li values (Dellinger et al., 2017, 2015), since the increase in topography would steepen slopes and increase erosion rates, which could also lower the weathering intensity. This effect could account for the negative δ7Li excursion observed at the start of the PETM recovery (Interval 7), which was coeval with the NAIP uplift that isolated the North Sea from the North Atlantic Ocean. However, this NAIP uplift phase was the last major regression that is recognised in proximal settings (Hartley et al., 2011; Shaw Champion et al., 2008; White and Lovell, 1997), so continued uplift events were unlikely to be responsible for the negative δ7Li excursions during Intervals 8 and 9 (Fig. 6).
Variations in clay mineralogy and/or clay content could also cause δ7Li excursions in the bulk sediments, but there is little correlation between Li isotopes and clay mineralogy through the Fur Formation (Fig. 6). Peaks in kaolinite content, possibly indicating enhanced runoff transporting this denser clay further into the catchment (Nielsen et al., 2015; Stokke et al., 2021), do not correlate with δ7Li values (Fig. 6). The δ7Li excursions also do not appear to be linked to changes in the bulk lithology. The heavily laminated sections in Intervals 4 (Stolleklint Clay) and 8 (Fur Formation diatomite) show opposing δ7Li trends, while the upper sections of Interval 9 (unlaminated diatomite), where the clay component comprises 100 % smectite, continue to show some isotopic variability (Fig. 6). In summary, variations in clay mineralogy or lithology do not appear to be driving the observed δ7Li fluctuations.
One proxy that does broadly correlate with δ7Li variations in the post-PETM sediments is the 187Os 188Os record (Fig. 6). Osmium isotopes reflect a basin-wide signal, while the detrital δ7Li record in Danish strata is likely representative of siliciclastic input from the Fennoscandian shield on the north-eastern North Sea margin (Anell et al., 2012). Assuming that the North Sea remained largely isolated from the North Atlantic Ocean during the deposition of the Fur Formation, the 187Os 188Os(i) record suggests an increase in basalt-derived fluxes towards the start of Interval 9 (Fig. 6). The correlation with the decreasing δ7Li values suggests that volcanic ash was likely being deposited on the Fennoscandian platform in increasing quantities towards the end of Interval 8 and that these ash deposits were rapidly weathered and eroded, forming isotopically light clays that were transported into the basin. During the 2010 eruption of Eyjafjallajökull in Iceland, clay formation occurred within just a few months of ash deposition in local catchments (Olsson et al., 2014; Paque et al., 2016; Pogge von Strandmann et al., 2019), and this process was likely to have been faster in the warmer Eocene climate. The gradual δ7Li excursion of −4 ‰ from Interval 8 to Interval 9 also coincides with an increase in Hg content (Fig. 3a) and estimated Hg accumulation rates (Fig. 5), which is also consistent with a volcanic origin. In combination, these proxies suggest that the post-PETM variations in δ7Li values were largely governed by the rapid weathering and erosion of terrestrial ash deposits from the NAIP, which reached a post-PETM peak around the start of Interval 9.
The combined proxies for volcanic ash deposition, clay mineralogy, Hg anomalies, Li isotopes, and initial 187Os 188Os (187Os 188Os(i)) values indicate that NAIP activity is prevalent throughout the entire Paleogene strata exposed at Fur in north-western Denmark. However, the proxies wax and wane, indicating significant changes in the NAIP activity across this interval (ca. 56–55 Ma). The late Paleocene Holmehus/Østerrende clay (Interval 1) contains a volcanogenically rich mineralogy and an unradiogenic 187Os 188Os(i) signature that suggest substantial erosion and weathering of basaltic terrains, while eruptive proxies suggest low-level but increasing NAIP activity towards the latest Paleocene. The strata above the possible unconformity (Interval 2) show more unradiogenic Os isotope values (mean 187Os 188Os(i)= 0.275), as observed in other pre-PETM records. The appearance of thick ash layers and Hg anomalies indicates a significant increase in NAIP activity just before the PETM. However, it is unclear what proportion of this activity was effusive, explosive, or volatile release from contact metamorphism around intrusions.
The PETM onset at Fur (Interval 3) is bounded by ash layers, but within the condensed δ13C excursion there is little evidence for elevated NAIP activity. The PETM body (Intervals 4–6) has the highest sediment accumulation rates in the studied strata, and several proxies (e.g. δ13C, 187Os 188Os) remain stable over ∼ 24 m of stratigraphy. Mercury content covaries with organic carbon, resulting in near-constant Hg TOC ratios. However, factoring in the elevated sedimentation rates, these data imply voluminous and continuous Hg accumulation rates (Hga) that were more than an order of magnitude greater than during both the PETM onset and recovery in the eastern North Sea. Combined with the sustained unradiogenic 187Os 188Os(i) values and a large increase in zeolite content, these findings suggest that the peak in NAIP activity occurred during the body of the PETM δ13C excursion (ca. 55.9–55.8 Ma). The relative scarcity of ash layers in the PETM strata implies that this elevated activity was likely dominated by effusive eruptions and/or thermogenic degassing.
The post-PETM Fur Formation (Intervals 7–9) contains the vast majority of the regionally recognised ash horizons, but other proxy evidence (e.g. Hga rates) suggests an overall diminished NAIP activity. These findings suggest a change in eruptive style to more explosive activity, and therefore ash production, that was likely aided by increased magma–water interactions within the rift system. Changes in detrital Li isotopes suggest that increased ash production enhanced silicate weathering and erosion fluxes, potentially increasing carbon sequestration during the PETM recovery (Longman et al., 2021) and early Eocene. These combined proxies indicate that much of the main acme of the NAIP activity, constrained to approximately 56–54 Ma based on the existing suite of sparse radiometric ages (Wilkinson et al., 2017), was likely to have been concentrated in a much shorter interval between 56.0 and 55.8 Ma coincident with the PETM CIE.
There is evidence for transiently reduced-salinity conditions in the North Sea and the Arctic Ocean in the late Paleocene and early Eocene, but the timing of these potential basin restrictions is not well constrained. A combination of Os isotopes and biomarkers was compared with global datasets to provide high-resolution proxies for the restriction of the North Sea basin. The Os isotope record at Fur deviates rapidly from the global ocean signal in under 12 kyr at the end of the PETM body, coinciding with the start of the CIE recovery, which suggests that there was a rapid isolation of the North Sea contemporaneous with the end of hyperthermal conditions. The TEX86 and fcren' records may indicate short-lived basinal restriction and/or reduced salinity in pre-PETM strata, but the deviation from open-ocean datasets is most pronounced during the PETM recovery phase and early Eocene. Combined, these data suggest that the NAIP uplift closed the English Channel at an estimated 55.82 Ma, with the North Sea subsequently remaining restricted from the Atlantic Ocean for at least several hundred thousand years. The close temporal correlation between the large radiogenic shift in Os isotopes and the end of the PETM warrants further investigation, as it suggests a possible relationship between the NAIP uplift, seaway connectivity, and the end of hyperthermal conditions.
All data generated in this study are available in the Supplement.
Samples may be available upon request.
The supplement related to this article is available online at: https://doi.org/10.5194/cp-19-1623-2023-supplement.
MTJ, JF, HHS, and SP devised the study. MTJ, EWS, HHS, SP, TA, NT, MLV, CT, VZ, and BPS contributed to fieldwork. MTJ, ADR, EWS, JF, PPvS, DJW, TA, NT, and TAM conducted laboratory analyses. MTJ prepared the manuscript with contributions from all co-authors.
The contact author has declared that none of the authors has any competing interests.
Publisher’s note: Copernicus Publications remains neutral with regard to jurisdictional claims in published maps and institutional affiliations.
Gauti Eliassen, Lars Eivind Augland, Sara Callegaro, Olivia Jones, Christine Grabatin, and Claus Heilman-Clausen are warmly thanked for their assistance. Nina Papadomanolaki, Marcus Gutjahr, and Thomas Gernon are thanked for their constructive reviews and comments, and Yannick Donnadieu is thanked for handling this paper. This work was supported by the Research Council of Norway through its Centres of Excellence funding scheme, project numbers 223272 and 332523. Morgan T. Jones and Ella W. Stokke were funded by the Research Council of Norway Ungeforskertalenter project “Ashlantic”, project number 263000. Tamsin A. Mather and Joost Frieling acknowledge funding from the European Research Council Consolidator Grant (ERC-2018-COG-818717-V-ECHO). Philip A. E. Pogge von Strandmann was supported by ERC grant 682760. David J. Wilson was supported by a NERC independent research fellowship (NE/T011440/1). Madeleine L. Vickers was funded by the European Commission, Horizon 2020 project ICECAP, grant no. 101024218.
This research has been supported by the Norges Forskningsråd (grant nos. 263000 and 223272).
This paper was edited by Yannick Donnadieu and reviewed by Nina Papadomanolaki and Marcus Gutjahr.
Abdelmalak, M. M., Planke, S., Faleide, J. I., Jerram, D. A., Zastrozhnov, D., Eide, S., and Myklebust, R.: The development of volcanic sequences at rifted margins: New insights from the structure and morphology of the Vøring Escarpment, mid-Norwegian Margin, J. Geophys. Res.-Sol. Ea., 121, 5212–5236, 2016.
Anell, I., Thybo, H., and Rasmussen, E.: A synthesis of Cenozoic sedimentation in the North Sea, Basin Res., 24, 154–179, 2012.
Ayris, P. and Delmelle, P.: Volcanic and atmospheric controls on ash iron solubility: A review, Phys. Chem. Earth, 45–46, 103–112, 2012.
Behar, F., Beaumont, V., and Penteado, H. L. D.: Rock-Eval 6 technology: Performances and developments, Oil and Gas Science and Technology, 56, 111–134, 2001.
Berndt, C., Planke, S., Alvarez Zarikian, C. A., Frieling, J., Jones, M. T., Millett, J. M., Brinkhuis, H., Bünz, S., Svensen, H. H., Longman, J., Scherer, R. P., Karstens, J., Manton, B., Nelissen, M., Reed, B., Faleide, J. I., Huismans, R. S., Agarwal, A., Andrews, G. D. M., Betlem, P., Bhattacharya, J., Chatterjee, S., Christopoulou, M., Clementi, V. J., Ferré, E. C., Filina, I. Y., Guo, P., Harper, D. T., Lambart, S., Mohn, G., Nakaoka R., Tegner, C., Varela, N., Wang, M., Xu, W., and Yager, S. L.: Shallow-water hydrothermal venting linked to the Palaeocene–Eocene Thermal Maximum, Nat. Geosci., https://doi.org/10.1038/s41561-023-01246-8, 2023.
Bijl, P. K., Frieling, J., Cramwinckel, M. J., Boschman, C., Sluijs, A., and Peterse, F.: Maastrichtian–Rupelian paleoclimates in the southwest Pacific – a critical re-evaluation of biomarker paleothermometry and dinoflagellate cyst paleoecology at Ocean Drilling Program Site 1172, Clim. Past, 17, 2393–2425, https://doi.org/10.5194/cp-17-2393-2021, 2021.
Bindler, R.: Estimating the natural background atmospheric deposition rate of mercury utilizing ombotrophic bogs in southern Sweden, Environ. Sci. Technol., 37, 40–46, 2003.
Blaga, C. I., Reichart, G. J., Heiri, O., and Sinninghe Damsté, J. S.: Tetraether membrane lipid distributions in water-column particulate matter and sediments: A study of 47 European lakes along a north-south transect, J. Paleolimnol., 41, 523–540, 2009.
Bøggild, O. B.: Den vulkanske Aske i Moleret samt en Oversigt over Danmarks ældre Tertiærbjærgarter, B. Geol. Soc. Denmark, 33, 1–159, 1918.
Bowen, G. and Zachos, J.: Rapid carbon sequestration at the termination of the Palaeocene–Eocene Thermal Maximum, Nat. Geosci., 3, 866–869, https://doi.org/10.1038/ngeo1014, 2010.
Bowen, G. J.: Up in smoke: A role for organic carbon feedbacks in Paleogene hyperthermals, Global Planet. Change, 109, 18–29, https://doi.org/10.1016/j.gloplacha.2013.07.001, 2013.
Boyden, J. A., Müller, D. R., Gurnis, M., Torsvik, T. H., Clark, J. A., Turner, M., Ivey-Law, H., Watson, R. J., and Cannon, J. S.: Next-generation plate-tectonic reconstructions using GPlates, in: Geoinformatics: Cyberinfrastructure for the Solid Earth Sciences, edited by: Keller, G. R. and Baru, C., Cambridge University Press, 95–114, ISBN 9780521897150, 2011.
Broeker, W. S. and Peng, T.-H.: Tracers in the sea. Eldigio Press, Lamont (Doherty Geological Observatory), https://doi.org/10.1017/S0033822200005221, 1982.
Bujak, J. P. and Mudge, D. C.: A high-resolution North Sea Eocene dinocyst zonation, J. Geol. Soc., 151, 449–462, https://doi.org/10.1144/gsjgs.151.3.0449, 1994.
Carmichael, M. J., Inglis, G. N., Badger, M. P., Naafs, B. D. A., Behrooz, L., Remmelzwaal, S., and Dickson, A. J.: Hydrological and associated biogeochemical consequences of rapid global warming during the Paleocene-Eocene Thermal Maximum, Global Planet. Change, 157, 114–138, 2017.
Charles, A., Condon, D., Harding, I., Pälike, H., Marshall, J., Cui, Y., Kump, L., and Croudace, I.: Constraints on the numerical age of the Palaeocene-Eocene boundary, Geochem. Geophy. Geosy., 12, Q0AA17, https://doi.org/10.1029/2010GC003426, 2011.
Contreras, L., Pross, J., Bijl, P. K., O'Hara, R. B., Raine, J. I., Sluijs, A., and Brinkhuis, H.: Southern high-latitude terrestrial climate change during the Palaeocene–Eocene derived from a marine pollen record (ODP Site 1172, East Tasman Plateau), Clim. Past, 10, 1401–1420, https://doi.org/10.5194/cp-10-1401-2014, 2014.
Conway-Jones, B. W. and White, N.: Paleogene buried landscapes and climatic aberrations triggered by mantle plume activity, Earth Planet. Sc. Lett., 593, 117644, https://doi.org/10.1016/j.epsl.2022.117644, 2022.
Cramer, B. S., Toggweiler, J. R., Wright, J. D., Katz, M. E., and Miller, K. G.: Ocean overturning since the Late Cretaceous: Inferences from a new benthic foraminiferal isotope compilation, Paleoceanography 24, PA4216, https://doi.org/10.1029/2008PA001683, 2009.
Cramwinckel, M. J., Huber, M., Kocken, I. J., Agnini, C., Bijl, P. K., Bohaty, S. M., Frieling, J., Goldner, A., Hilgen, F. J., Kip, E. L., Peterse, F., van der Ploeg, R., Röhl, U., Schouten, S., and Sluijs, A.: Synchronous tropical and polar temperature evolution in the Eocene, Nature, 559, 382–386, 2018.
Creaser, R. A., Papanastassiou, D. A., and Wasserburg, G. J.: Negative thermal ion mass spectrometry of osmium, rhenium and iridium, Geochim. Cosmochim. Ac., 55, 397–401, 1991.
Deconinck, J. F. and Chamley, H.: Diversity of smectite origins in Late Cretaceous sediments: example of chalks from northern France, Clay Miner., 30, 365–379, 1995.
Dellinger, M., Gaillardet, J., Bouchez, J., Calmels, D., Louvat, P., Dosseto, A., Gorge, C., Alanoca, L., and Maurice, L.: Riverine Li isotope fractionation in the Amazon River basin controlled by the weathering regimes, Geochim. Cosmochim. Ac., 164, 71–93, 2015.
Dellinger, M., Bouchez, J., Gaillardet, J., Faure, L., and Moureau, J.: Tracing weathering regimes using the lithium isotope composition of detrital sediments, Geology, 45, 411–414, 2017.
Dessert, C., Dupré, B., Gaillardet, J., François, L., and Allègre, C. J.: Basalt weathering laws and the impact of basalt weathering on the global carbon cycle, Chem. Geol., 202, 257–273, 2003.
Dickens, G. R., O'Neil, J. R., Rea, D. K., and Owen, R. M.: Dissociation of oceanic methane hydrate as a cause of the carbon-isotope excursion at the end of the Paleocene, Paleoceanography, 10, 965–971, 1995.
Dickson, A. J., Cohen, A. S., Coe, A. L., Davies, M., Shcherbinina, E. A., and Gavrilov, Y. O.: Evidence for weathering and volcanism during the PETM from Arctic Ocean and Peri-Tethys osmium isotope records, Palaeogeogr. Palaeocl., 438, 300–307, 2015.
Dickson, A. J., Cohen, A. S., and Davies, M.: The Osmium Isotope Signature of Phanerozoic Large Igneous Provinces, in: Large Igneous Provinces: A Driver of Global Environmental and Biotic Changes, edited by: Ernst, R. E., Dickson, A. J., and Bekker, A., American Geophysical Union and John Wiley and Sons, Inc, https://doi.org/10.1002/9781119507444.ch10, 2021.
Dunkley-Jones, T., Lunt, D. J., Schmidt, D. N., Ridgwell, A. J., Sluijs, A., Valdes, P. J., and Maslin, M. A.: Climate model and proxy data constraints on ocean warming across the Paleocene–Eocene Thermal Maximum, Earth Sci. Rev., 125, 123–145, 2013.
Dypvik, H., Riber, L., Burca, F., Rüther, D., Jargvoll, D., Nagy, J., and Jochmann, M.: The Paleocene-Eocene Thermal Maximum in Svalbard – clay mineral and geochemical signals, Palaeogeogr. Palaeocl., 303, 156–169, 2011.
Egger, H. and Brückl, E.: Gigantic volcanic eruptions and climatic change in the early Eocene, Int. J. Earth Sci., 95, 1065–1070, 2006.
Eldholm, O. and Grue, K.: North Atlantic volcanic margins: dimensions and production rates, J. Geophys. Res., 99, 2955–2968, 1994.
Eldholm, O. and Thomas, E.: Environmental impact of volcanic margin formation, Earth Planet. Sc. Lett., 117, 319–329, 1993.
Eldrett, J. S., Greenwood, D. R., Polling, M., Brinkhuis, H., and Sluijs, A.: A seasonality trigger for carbon injection at the Paleocene–Eocene Thermal Maximum, Clim. Past, 10, 759–769, https://doi.org/10.5194/cp-10-759-2014, 2014.
Ernst, R. E. and Youbi, N.: How Large Igneous Provinces affect global climate, sometimes cause mass extinctions, and represent natural markers in the geological record, Palaeogeogr. Palaeocl., 478, 30–52, 2017.
Frieling, J., Iakovleva, A. I., Reichart, G.-J., Aleksandrova, G. N., Gnibidenko, Z. N., Schouten, S., and Sluijs, A.: Paleocene-Eocene warming and biotic response in the epicontinental West Siberian Sea, Geology, 42, 767–770, 2014.
Frieling, J., Svensen, H. H., Planke, S., Cramwinckel, M. J., Selnes, H., and Sluijs, A.: Thermogenic methane release as a cause for the long duration of the PETM, P. Natl. Acad. Sci. USA, 113, 12059–12064, 2016.
Frieling, J., Gebhardt, H., Huber, M., Adekeye, O. A., Akande, S. O., Reichart, G.-J., Middelburg, J. J., Schouten, S., and Sluijs, A.: Extreme warmth and heat-stressed plankton in the tropics during the Paleocene-Eocene Thermal Maximum, Science Advances, 3, e1600891, https://doi.org/10.1126/sciadv.1600891, 2017.
Frieling, J., Peterse, F., Lunt, D. J., Bohaty, S. M., Sinninghe Damsté, J. S., Reichart, G. J., and Sluijs, A.: Widespread Warming Before and Elevated Barium Burial During the Paleocene-Eocene Thermal Maximum: Evidence for Methane Hydrate Release?, Paleoceanography and Paleoclimatology, 34, 546–566, 2019.
Frieling, J., Mather, T. A., März, C., Jenkyns, H., Hennekam, R., Reichart, G.-J., Slomp, C. P., and van Helmond, N.: Effects of redox variability and early diagenesis on marine sedimentary Hg records, Geochim. Cosmochim. Ac., 351, 78–95, 2023.
Gernon, T. M., Barr, R., Fitton, J. G., Hincks, T. K., Keir, D., Longman, J., Meridith, A. S., Mitchell, R. N., and Palmer, M. R.: Transient mobilization of subcrustal carbon coincident with Palaeocene–Eocene Thermal Maximum, Nat. Geosci., 15, 573–579, 2022.
Golonka, J.: Phanerozoic paleoenvironment and paleolithofacies maps: Cenozoic, Geologia/Akademia Górniczo-Hutnicza im, Stanisława Staszica w Krakowie, 35, 507–587, 2009.
Gramlich, J. W., Murphy, T. J., Garner, E. L., and Shields, W. R.: Absolute Isotopic Abundance Ratio and Atomic Weight of a Reference Sample of Rhenium, J. Res. Natl. Bur. Phys. Ch., 77, 691–698, 1973.
Grasby, S .E., Them II, T. R., Chen, Z., Yin, R., and Ardakani, O. H.: Mercury as a proxy for volcanic emissions in the geologic record, Earth Sci. Rev., 196, 102880, https://doi.org/10.1016/j.earscirev.2019.102880, 2019.
Gurnis, M., Turner, M., Zahirovic, S., DiCaprio, L., Spasojevic, S., Müller, R., Boyden, J., Seton, M., Manea, V., and Bower, D.: Plate Tectonic Reconstructions with Continuously Closing Plates, Comput. Geosci., 38, 35–42, 2012.
Gutjahr, M., Ridgwell, A., Sexton, P. F., Anagnostou, E., Pearson, P. N., Pälike, H., Norris, R. D., Thomas, E., and Foster, G. L.: Very large release of mostly volcanic carbon during the Palaeocene–Eocene Thermal Maximum, Nature, 548, 573–577, 2017.
Haaland, H. J., Furnes, H., and Martinsen, O. J.: Paleogene tuffaceous intervals, Grane Field (Block 25/11), Norwegian North Sea: their depositional, petrographicl, geochemical character and regional implications, Mar. Petrol. Geol., 17, 101–118, 2000.
Hansen, D. M.: The morphology of intrusion-related vent structures and their implications for constraining the timing of intrusive events along the NE Atlantic margin, J. Geol. Soc., 163, 789–800, 2006.
Hartley, R. A., Roberts, G. G., White, N., and Richardson, C.: Transient convective uplift of an ancient buried landscape, Nat. Geosci., 4, 562–565, 2011.
Heilmann-Clausen, C.: Review of Paleocene dinoflagellates from the North Sea region, GFF, 116, 51–53, https://doi.org/10.1080/11035899409546149, 1994.
Heilmann-Clausen, C.: Palæogene aflejringer over Danskekalken, in: Aarhus Geokompendier, edited by: Nielsen, O. B., No. 1, Danmarks geologi fra Kridt til i dag, 69–114, 1995.
Heilmann-Clausen, C., Nielsen, O. B., and Gersner, F.: Lithostratigraphy and depositional environments in the Upper Paleocene and Eocene of Denmark, Bulletin – Geological Society of Denmark, 33, 287–323, 1985.
Heilmann-Clausen, C., Schultz, B. P., Beyer, C., Friis, H., Schoon, P. L., and Tegner, C.: New evidence for NE Atlantic pre-PETM volcanism, Rendiconti Online – Società Geologica Italiana, 31, 99–100, 2014.
Heister, L. E., O'Day, P. A., Brooks, C. K., Neuhoff, P. S., and Bird, D. K.: Pyroclastic deposits within the East Greenland Tertiary flood basalts, J. Geol. Soc., 158, 269–284, 2001.
Horni, J., Hopper, J. R., Blischke, A., Geisler, W. H., Stewart, M., McDermott, K., Judge, M., Erlendsson, Ö., and Árting, U.: Regional distribution of volcanism within the North Atlantic Igneous Province, Geological Society, London, Special Publications, 447, https://doi.org/10.1144/SP447.18, 2017.
Hovikoski, J., Fyhn, M. B. W., Nøhr-Hansen, H., Hopper, J. R., Andrews, S., Barham, M., Nielsen, L. H., Bjerager, M., Bojesen-Koefoed, J., Lode, S., Sheldon, E., Uchman, A., Skorstengaard, P. R., and Alsen, P.: Paleocene-Eocene volcanic segmentation of the Norwegian-Greenland seaway reorganized high-latitude ocean circulation, Commun. Earth Environ., 2, 172, https://doi.org/10.1038/s43247-021-00249-w, 2021.
Huurdeman, E. P., Frieling, J., Reichgelt, T., Bijl, P. K., Bohaty, S. M., Holdgate, G. R., Gallagher, S. J., Peterse, F., Greenwood, D. R., and Pross, J.: Rapid expansion of meso-megathermal rain forests into the southern high latitudes at the onset of the Paleocene-Eocene Thermal Maximum, Geology, 49, 40–44, 2020.
Inglis, G. N., Farnsworth, A., Lunt, D. J., Foster, G. L., Hollis, C. J., Pagani, M., Jardine, P. E., Pearson, P. N., Markwick, P. J., Galsworthy, A. M. J., Raynham, L., Taylor, K. W. R., and Pancost, R. D.: Descent towards the Icehouse: Eocene sea surface cooling inferred from GDGT distributions, Paleoceanography, 30, 1000–1020, 2015.
Inglis, G. N., Bragg, F., Burls, N. J., Cramwinckel, M. J., Evans, D., Foster, G. L., Huber, M., Lunt, D. J., Siler, N., Steinig, S., Tierney, J. E., Wilkinson, R., Anagnostou, E., de Boer, A. M., Dunkley Jones, T., Edgar, K. M., Hollis, C. J., Hutchinson, D. K., and Pancost, R. D.: Global mean surface temperature and climate sensitivity of the early Eocene Climatic Optimum (EECO), Paleocene–Eocene Thermal Maximum (PETM), and latest Paleocene, Clim. Past, 16, 1953–1968, https://doi.org/10.5194/cp-16-1953-2020, 2020.
Jin, S., Kemp, D. B., Jolley, D. W., Vieira, M., Zachos, J. C., Huang, C., Li, M., and Chen, W.: Large-scale, astronomically paced sediment input to the North Sea Basin during the Paleocene Eocene Thermal Maximum, Earth Planet. Sc. Lett., 579, 117340, https://doi.org/10.1016/j.epsl.2021.117340, 2022.
John, C. M., Bohaty, S. M., Zachos, J. C., Sluijs, A., Gibbs, S., Brinkhuis, H., and Bralower, T. J.: North American continental margin records of the Paleocene-Eocene thermal maximum: Implications for global carbon and hydrological cycling, Paleoceanography 23, PA2217, https://doi.org/10.1029/2007PA001465, 2008.
Jones, M. T.: The environmental and climatic impacts of volcanic ash deposition, in: Volcanism and global environmental change, edited by: Schmidt, A., Fristad, K., and Elkins-Tanton, L., Cambridge University Press, 260–274, ISBN 9781107058378, 1107058376, 2015.
Jones, M. T., Jerram, D. A., Svensen, H. H., and Grove, C.: The effects of large igneous provinces on the global carbon and sulphur cycles, Palaeogeogr. Palaeocl., 441, 4–21, 2016.
Jones, M. T., Percival, L. M. E., Stokke, E. W., Frieling, J., Mather, T. A., Riber, L., Schubert, B. A., Schultz, B., Tegner, C., Planke, S., and Svensen, H. H.: Mercury anomalies across the Palaeocene–Eocene Thermal Maximum, Clim. Past, 15, 217–236, https://doi.org/10.5194/cp-15-217-2019, 2019.
Jones, S. M., Hoggett, M., Greene, S. E., and Dunkley Jones, T.: Large Igneous Province thermogenic greenhouse gas flux could have initiated Paleocene-Eocene Thermal Maximum climate change, Nat. Commun., 10, 5547, https://doi.org/10.1038/s41467-019-12957-1, 2019.
Kaya, M. Y., Dupont-Nivet, G., Frieling, J., Fioroni, C., Rohrmann, A., Altıner, S. Ö., Vardar, E., Tanyaş, H., Mamtimin, M., and Zhaojie, G.: The Eurasian epicontinental sea was an important carbon sink during the Palaeocene-Eocene thermal maximum, Commun. Earth Environ., 3, 124, https://doi.org/10.1038/s43247-022-00451-4, 2022.
Keller, G., Mateo, P., Punekar, J., Khozyem, H., Gertsch, B., Spangenberg, J., Bitchong, A., and Adatte, T.: Environmental changes during the cretaceous-Paleogene mass extinction and Paleocene-Eocene thermal maximum: Implications for the Anthropocene, Gondwana Res., 56, 69–89, 2018.
Kendall, B. S., Creaser, R. A., Ross, G. M., and Selby, D.: Constraints on the timing of Marinoan “Snowball Earth” glaciation by 187Re–187Os dating of a Neoproterozoic, post-glacial black shale in Western Canada, Earth Planet. Sc. Lett., 222, 729–740, 2004.
Kender, S., Stephenson, M. H., Riding, J. B., Leng, M. J., Knox, R. B., Peck, V. L., Kendrick, C. P., Ellis, M. A., Vane, C. H., and Jamieson, R.: Marine and terrestrial environmental changes in NW Europe preceding carbon release at the Paleocene–Eocene transition, Earth Planet. Sc. Lett., 353–354, 108–120, 2012.
Kender, S., Bogus, K., Pedersen, G. K., Dybkjær, K., Mather, T. A., Mariani, E., Ridgwell, A., Riding, J. B., Wagner, T., Hesselbo, S. P., and Leng, M. J.: Paleocene/Eocene carbon feedbacks triggered by volcanic activity, Nat. Commun., 12, 5186, https://doi.org/10.1038/s41467-021-25536-0, 2021.
Kennett, J. and Stott, L.: Abrupt deep-sea warming, palaeoceanographic changes and benthic extinctions at the end of the Palaeocene, Nature, 353, 225–229, 1991.
Kim, J. H., van der Meer, J., Schouten, S., Helmke, P., Willmott, V., Sangiorgi, F., Koç, N., Hopmans, E. C., and Damsté, J. S. S.: New indices and calibrations derived from the distribution of crenarchaeal isoprenoid tetraether lipids: Implications for past sea surface temperature reconstructions, Geochim. Cosmochim. Ac., 74, 4639–4654, 2010.
King, C.: A Revised Correlation of Tertiary Rocks in the British Isles and Adjacent Areas of NW Europe, The Geological Society, London, ISBN 978-1-86239-728-6, 2016.
Kirtland Turner, S.: Constraints on the onset duration of the Paleocene–Eocene Thermal Maximum, Philos. T. R. Soc. A, 376, 20170082, https://doi.org/10.1098/rsta.2017.0082, 2018.
Kisakürek, B., James, R. H., and Harris, N. B. W.: Li and δ7Li in Himalayan rivers: Proxies for silicate weathering?, Earth Planet. Sc. Lett., 237, 387–401, 2005.
Knox, R. B. and Morton, A.: The record of early Tertiary N Atlantic volcanism in sediments of the North Sea Basin, in: Early Tertiary Volcanism and the opening of the NE Atlantic, edited by: Morton, A. and Parson, L., Geological Society Special Publication, 407–419, 1988.
Knox, R. W. O. B.: Nannoplankton zonation and the Palaeocene/Eocene boundary beds of NW Europe: an indirect correlation by means of volcanic ash layers, J. Geol. Soc., 141, 993–999, 1984.
Knox, R. W. O. B.: Stratigraphic significance of volcanic ash in Paleocene and Eocene sediments at Sites 549 and 550, edited by: Graciansky, P. C. D., Poag, C. W., al., Initial Reports DSDP. U.S. Government Printing Office, Washington, 845–850, https://doi.org/10.2973/dsdp.proc.80.134.1985, 1985.
Kuiper, K., Deino, A., Hilgen, F., Krijgsman, W., Renne, P., and Wijbrans, J.: Synchronizing rock clocks of Earth history, Science, 320, 500–504, 2008.
Larsen, L., Fitton, J., and Pedersen, A.: Paleogene volcanic ash layers in the Danish Basin: compositions and source areas in the North Atlantic Igneous Province, Lithos, 71, 47–80, 2003.
Larsen, R. B. and Tegner, C.: Pressure conditions for the solidification of the Skaergaard intrusion: Eruption of East Greenland flood basalts in less than 300,000 years, Lithos, 92, 181–197, 2006.
Levasseur, S., Birck, J. L., and Allègre, C. J.: The osmium riverine flux and the oceanic mass balance of osmium, Earth Planet. Sc. Lett., 174, 7–23, 1999.
Li, M., Bralower, T. J., Kump, L. R., Self-Trail, J. M., Zachos, J. C., Rush, W. D., and Robinson, M. M.: Astrochronology of the Paleocene-Eocene Thermal Maximum on the Atlantic Coastal Plain, Nat. Commun., 13, 5618, https://doi.org/10.1038/s41467-022-33390-x, 2022.
Li, Y., Clift, P. D., Murray, R. W., Exnicios, E., Ireland, T., and Böning, P.: Asian summer monsoon influence on chemical weathering and sediment provenance determined by clay mineral analysis from the Indus Submarine Canyon, Quaternary Res., 93, 23–39, 2020.
Littler, K., Röhl, U., Westerhold, T., and Zachos, J. C.: A high-resolution benthic stable-isotope record for the South Atlantic: Implications for orbital-scale changes in Late Paleocene–Early Eocene climate and carbon cycling, Earth Planet. Sc. Lett., 401, 18–30, 2014.
Liu, J. and Pearson, D.G.: Rapid, precise and accurate Os isotope ratio measurements of nanogram to sub-nanogram amounts using multiple Faraday collectors and amplifiers equipped with 1012 Ω resistors by N-TIMS, Chem. Geol., 363, 301–311, 2014.
Liu, Z., Horton, D. E., Tabor, C., Sageman, B. B., Percival, L. M. E., Gill, B. C., and Selby, D.: Assessing the Contributions of Comet Impact and Volcanism Toward the Climate Perturbations of the Paleocene-Eocene Thermal Maximum, Geophys. Res. Lett., 46, 14798–14806, 2019.
Longman, J., Gernon, T. M., Palmer, M. R., Jones, M. T., Stokke, E. W., and Svensen, H. H.: Marine diagenesis of tephra aided the Palaeocene-Eocene Thermal Maximum termination, Earth Planet. Sc. Lett., 571, 117101, https://doi.org/10.1016/j.epsl.2021.117101, 2021.
Lourens, L. J., Sluijs, A., Kroon, D., Zachos, J. C., Thomas, E., Röhl, U., Bowles, J., and Raffi, I.: Astronomical pacing of late Palaeocene to early Eocene global warming events, Nature, 435, 1083–1087, 2005.
Lowe, D.: Tephrochronology and its application: a review, Quaternary Geology, 6, 107–153, 2011.
Luguet, A., Nowell, G. M., and Pearson, D. G.: 184Os 188Os and 186Os 188Os measurements by Negative Thermal Ionisation Mass Spectrometry (N-TIMS): Effects of interfering element and mass fractionation corrections on data accuracy and precision, Chem. Geol., 248, 342–362, 2008.
Maclennan, J. and Jones, S. M.: Regional uplift, gas hydrate dissociation and the origins of the Paleocene-Eocene Thermal Maximum, Earth Planet. Sc. Lett., 245, 65–80, 2006.
Manton, B., Müller, P., Mazzini, A., Zastrozhnov, D., Jerram, D. A., Millett, J. M., Schmid, D. W., Berndt, C., Myklebust, R., and Planke, S.: Characterizing ancient and modern hydrothermal venting systems, Mar. Geol., 447, 106781, https://doi.org/10.1016/j.margeo.2022.106781, 2022.
Martin, C. E., Peucker-Ehrenbrink, B., Brunskill, G., and Szymczak, R.: Osmium isotope geochemistry of a tropical estuary, Geochim. Cosmochim. Ac., 65, 3193–3200, 2001.
McInerney, F. A. and Wing, S. L.: The Paleocene-Eocene Thermal Maximum: a perturbation of carbon cycle, climate, and biosphere with implications for the future, Annu. Rev. Earth Pl. Sc., 39, 489–516, 2011.
Meisel, T., Walker, R. J., Irving, A. J., and Lorand, J.-P.: Osmium isotopic compositions of mantle xenoliths: a global perspective, Geochim. Cosmochim. Ac., 65, 1311–1323, 2001.
Misra, S. and Froelich, P. N.: Lithium isotope history of cenozoic seawater: Changes in silicate weathering and reverse weathering, Science, 335, 818–823, 2012.
Moore, D. M. and Reynolds, R. C.: X-ray diffraction and the identification and analysis of clay minerals, Oxford University Press, Oxford, ISBN 9780195051704, 1997.
Murphy, B., Farley, K., and Zachos, J.: An extra-terrestrial 3He-based timescale for the Paleocene-Eocene thermal maximum (PETM) from Walvis Ridge IODP Site 1266, Geochim. Cosmochim. Ac., 74, 5098–5108, 2010.
Nielsen, O. B.: Danmarks geologi fra Kridt til i dag, Aarhus Geokompendie, 1, 1–13, 1995.
Nielsen, O. B., Rasmussen, E. S., and Thyberg, B. I.: Distribution of Clay Minerals In the Northern North Sea Basin During the Paleogene and Neogene: A Result of Source-Area Geology and Sorting Processes, J. Sediment. Res., 85, 562–581, 2015.
O'Brien, C. L., Robinson, S. A., Pancost, R. D., Sinninghe Damsté, J. S., Schouten, S., Lunt, D. J., Alsenz, H., Bornemann, A., Bottini, C., Brassell, S. C., Farnsworth, A., Forster, A., Huber, B. T., Inglis, G. N., Jenkyns, H. C., Linnert, C., Littler, K., Markwick, P., McAnena, A., Mutterlose, J., Naafs, B. D. A., Püttmann, W., Sluijs, A., van Helmond, N. A. G. M., Vellekoop, J., Wagner, T., and Wrobel, N.E.: Cretaceous sea-surface temperature evolution: Constraints from TEX86 and planktonic foraminiferal oxygen isotopes, Earth Sci. Rev., 172, 224–247, 2017.
Olsson, J., Stipp, S. L. S., Makovicky, E., and Gislason, S. R.: Metal scavenging by calcium carbonate at the Eyjafjallajökull volcano: A carbon capture and storage analogue, Chem. Geol., 384, 135–148, 2014.
Outridge, P. M., Sanei, H., Stern, G. A., Hamilton, P. B., and Goodarzi, F.: Evidence for control of mercury accumulation rates in Canadian High Arctic lake sediments by variations of aquatic primary productivity, Environ. Sci. Technol., 41, 5259–5265, 2007.
Pagani, M., Pedentchouk, N., Huber, M., Sluijs, A., Schouten, S., Brinkhuis, H., Sinninghe Damsté, J. S., Dickens, G. R., and Expedition 302 Scientists: Arctic hydrology during global warming at the Palaeocene/Eocene Thermal Maximum, Nature 442, 671–675, 2006.
Papadomanolaki, N. M., Sluijs, A., and Slomp, C. P.: Eutrophication and Deoxygenation Forcing of Marginal Marine Organic Carbon Burial During the PETM, Paleoceanogr. Paleocl., 37, e2021PA004232, https://doi.org/10.1029/2021PA004232, 2022.
Paquay, F. S. and Ravizza, G.: Heterogeneous seawater 187Os 188Os during the Late Pleistocene glaciations, Earth Planet. Sc. Lett., 349–350, 126–138, 2012.
Paque, M., Detienne, M., Maters, E. C., and Delmelle, P.: Smectites and zeolites in ash from the 2010 summit eruption of Eyjafjallajökull volcano, Iceland, B. Volcanol., 78, 61, https://doi.org/10.1007/s00445-016-1056-x, 2016.
Passey, S. R. and Jolley, D. W.: A revised lithostratigraphic nomenclature for the Palaeogene Faroe Islands Basalt Group, NE Atlantic Ocean, T. RSE Eath, 99, 127–158, 2008.
Pedersen, G. K., Pedersen, S. A. S., Steffensen, J., and Pedersen, C. S.: Clay content of a clayey diatomite, the Early Eocene Fur Formation, Denmark, B. Geol. Soc. Denmark, 51, 159–177, 2004.
Pedersen, S. A. S.: Architecture of Glaciotectonic Complexes, Geosciences, 4, 269–296, 2014.
Percival, L. M. E., Witt, M. L. I., Mather, T. A., Hermoso, M., Jenkyns, H. C., Hesselbo, S. P., Al-Suwaidi, A. H., Storm, M. S., Xu, W., and Ruhl, M.: Globally enhanced mercury deposition during the end-Pliensbachian extinction and Toarcian OAE: A link to the Karoo-Ferrar Large Igneous Province, Earth Planet. Sc. Lett., 428, 267–280, 2015.
Percival, L. M. E., Jenkyns, H. C., Mather, T. A., Dickson, A. J., Batenburg, S. J., Ruhl, M., Hesselbo, S. P., Barclay, R., Jarvis, I., Robinson, S. A., and Woelders, L.: Does large igneous province volcanism always perturb the mercury cycle? Comparing the records of Oceanic Anoxic Event 2 and the end-Cretaceous to other Mesozoic events, Am. J. Sci., 318, 799–860, 2018.
Percival, L. M. E., Bergquist, B. A., Mather, T. A., and Sanei, H.: Sedimentary Mercury Enrichments as a Tracer of Large Igneous Province Volcanism, in: Large Igneous Provinces: A Driver of Global Environmental and Biotic Changes, edited by: Ernst, R. E., Dickson, A. J., and Bekker, A., American Geophyiscal Union, https://doi.org/10.1002/9781119507444.ch11, 2021.
Peucker-Ehrenbrink, B. and Jahn, B.-M.: Rhenium-osmium isotope systematics and platinum group element concentrations: Loess and the upper continental crust, Geochem. Geophy. Geosy., 2, 1061, https://doi.org/10.1029/2001GC000172, 2001.
Peucker-Ehrenbrink, B. and Ravizza, G.: The marine osmium isotope record, Terra Nova, 12, 205–219, 2000.
Peucker-Ehrenbrink, B. and Ravizza, G. E.: Chapter 8 – Osmium Isotope Stratigraphy, Geologic Time Scale 2020, edited by: Gradstein, F. M., Ogg, J. G., Schmitz, M. D., and Ogg, G. M., Elsevier, 239–257, https://doi.org/10.1016/B978-0-12-824360-2.00008-5, 2020.
Planke, S., Rasmussen, T., Rey, S., and Myklebust, R.: Seismic characteristics and distribution of volcanic intrusions and hydrothermal vent complexes in the Vøring and Møre basins, in: Petroleum Geology: North-West Europe and Global Perspectives – Proceedings of the 6th Petroleum Geology Conference, edited by: Doré, A. G. and Vining, B. A., Geological Society, London, 833–844, 2005.
Planke, S., Berndt, C., Alvarez Zarikian, C. A., and the Expedition 396 Scientists: Mid-Norwegian Margin Magmatism and Paleoclimate Implications, Proceedings of the International Ocean Discovery Program, Volume 396, https://doi.org/10.14379/iodp.proc.396.2023, 2023.
Pogge von Strandmann, P. A. E., Burton, K. W., Opfergelt, S., Eiriksdottir, E. S., Murphy, M. J., Einarsson, A., and Gislason, S. R.: The effect of hydrothermal spring weathering processes and primary productivity on lithium isotopes: Lake Myvatn, Iceland, Chem. Geol., 445, 4–13, 2016.
Pogge von Strandmann, P. A. E., Desrochers, A., Murphy, M. J., Finlay, A. J., Selby, D., and Lenton, T. M.: Global climate stabilisation by chemical weathering during the Hirnantian glaciation, Geochemical Perspective Letters, 3, 230–237, 2017a.
Pogge von Strandmann, P. A. E., Frings, P. J., and Murphy, M. J.: Lithium isotope behaviour during weathering in the Ganges Alluvial Plain, Geochim. Cosmochim. Ac., 198, 17–31, 2017b.
Pogge von Strandmann, P. A. E., Fraser, W. T., Hammond, S. J., Tarbuck, G., Wood, I. G., Oelkers, E. H., and Murphy, M. J.: Experimental determination of Li isotope behaviour during basalt weathering, Chem. Geol., 517, 34–43, 2019.
Pogge von Strandmann, P. A. E., Kasemann, S. A., and Wimpenny, J. B.: Lithium and lithium isotopes in Earth's surface cycles, Elements, 16, 253–258, 2020.
Pogge von Strandmann, P. A. E., Jones, M. T., West, A. J., Murphy, M. J., Stokke, E. W., Tarbuck, G., Wilson, D. J., Pearce, C. R., and Schmidt, D. N.: Lithium isotope evidence for enhanced weathering and erosion during the Palaeocene-Eocene Thermal Maximum, Science Advances, 7, eabh4224, https://doi.org/10.1126/sciadv.abh4224, 2021.
Powers, L., Werne, J. P., Vanderwoude, A. J., Sinninghe Damsté, J. S., Hopmans, E. C., and Schouten, S.: Applicability and calibration of the TEX86 paleothermometer in lakes, Org. Geochem., 41, 404–413, 2010.
Prøis, B. M.: Late Paleocene – earliest Eocene prograding system in the SW Barents Sea, Department of Geosciences, University of Oslo, p. 76, https://www.duo.uio.no/handle/10852/45547 (last access: 1 August 2023), 2015.
Pujalte, V., Baceta, J. I., and Schmitz, B.: A massive input of coarse-grained siliciclastics in the Pyrenean Basin during the PETM: the missing ingredient in a coeval abrupt change in hydrological regime, Clim. Past, 11, 1653–1672, https://doi.org/10.5194/cp-11-1653-2015, 2015.
Pyle, D. M. and Mather, T. A.: The importance of volcanic emissions for global atmospheric mercury cycle, Atmos. Environ., 37, 5115–5124, 2003.
Racionero-Gómez, B., Sproson, A. D., Selby, D., Gannoun, A., Gröcke, D. R., Greenwell, H. C., and Burton, K. W.: Osmium uptake, distribution, and 187Os 188Os and 187Re 188Os compositions in Phaeophyceae macroalgae, Fucus vesiculosus: Implications for determining the 187Os 188Os composition of seawater, Geochim. Cosmochim. Ac., 199, 48–57, 2017.
Radionova, E. P., Beniamovski, V. N., Iakovleva, A. I., Muzylöv, N. G., Oreshkina, T. V., Shcherbinina, E. A., and Kozlova, G. E.: Early Paleogene transgressions: Stratigraphical and sedimentological evidence from the northern Peri-Tethys, in: Causes and consequences of globally warm climates in the early Paleogene, Geological Society of America Special Paper, edited by: Wing, S. L., Gingerich, P. D., Schmitz, B., and Thomas, E., Boulder, Colordao, 239–261, https://doi.org/10.1130/0-8137-2369-8.239, 2003.
Rateau, R., Schofield, N., and Smith, M.: The potential role of igneous intrusions on hydrocarbon migration, West of Shetland, Petrol. Geosci., 19, 259–272, 2013.
Ravizza, G., Norris, R. D., Blusztajn, J., and Aubry, M.-P.: An osmium isotope excursion associated with the late Paleocene thermal maximum: Evidence of intensified chemical weathering, Paleoceanography 16, 155–163, 2001.
Reynolds III, R. C. and Reynolds Jr., R. C.: NEWMOD II a computer program for the calculation of one-dimensional diffraction patterns of mixed-layered clays, 1526 Farlow Avenue, Crofton, MD, 21114, USA, https://newmod-for-clays.com (last access: 30 July 2023), 2012.
Reynolds, P., Planke, S., Millett, J. M., Jerram, D. A., Trulsvik, M., and Schofield, N.: Hydrothermal vent complexes offshore Northeast Greenland: A potential role in driving the PETM, Earth Planet. Sc. Lett., 467, 72–78, 2017.
Roberts, C. D., LeGrande, A. N., and Tripati, A. K.: Climate sensitivity to Arctic seway restriction during the early Paleogene, Earth Planet. Sc. Lett., 286, 576–585, 2009.
Röhl, U., Westerhold, T., Bralower, T., and Zachos, J.: On the duration of the Paleocene-Eocene Thermal Maximum (PETM), Geochem. Geophy. Geosy., 8, Q12002, https://doi.org/10.1029/2007GC001784, 2007.
Rooney, A. D., Selby, D., Lloyd, J. M., Roberts, D. H., Lückge, A., Sageman, B. B., and Prouty, N. G.: Tracking millennial-scale Holocene glacial advance and retreat using osmium isotopes: Insights from the Greenland ice sheet, Quaternary Sci. Rev., 138, 49–61, 2016.
Sanei, H., Grasby, S., and Beauchamp, B.: Latest Permian mercury anomalies, Geology, 40, 63–66, 2012.
Sato, H., Onoue, T., Nozaki, T., and Suzuki, K.: Osmium isotope evidence for a large Late Triassic impact event, Nat. Commun., 4, 2455, https://doi.org/10.1038/ncomms3455, 2013.
Schmitz, B., Peucker-Ehrenbrink, B., Heilmann-Clausen, C., Aberg, G., Asaro, F., and Lee, C.-T. A.: Basaltic explosive volcanism, but no comet impact, at the Paleocene–Eocene boundary: high-resolution chemical and isotopic records from Egypt, Spain and Denmark, Earth Planet. Sc. Lett., 225, 1–17, 2004.
Schoene, B., Eddy, M. P., Samperton, K. M., Keller, C. B., Keller, G., Adatte, T., and Khadri, S. F. R.: U-Pb constraints on pulsed eruption of the Deccan Traps across the end-Cretaceous mass extinction, Science, 363, 862–866, 2019.
Schoon, P. L., Heilmann-Clausen, C., Schultz, B. P., Sluijs, A., Damasté, J. S. S., and Schouten, S.: Recognition of Early Eocene global carbon isotope excursions using lipids of marine Thaumarchaeota, Earth Planet. Sc. Lett., 373, 160–168, 2013.
Schoon, P. L., Heilmann-Clausen, C., Schultz, B. P., Damasté, J. S. S., and Schouten, S.: Warming and environmental changes in the eastern North Sea Basin during the Palaeocene–Eocene Thermal Maximum as revealed by biomarker lipids, Org. Geochem., 78, 79–88, 2015.
Schouten, S., Hopmans, E. C., Schefuß, E., and Sinninghe Damsté, J. S.: Distributional variations in marine crenarchaeotal membrane lipids: A new tool for reconstructing ancient sea water temperatures?, Earth Planet. Sc. Lett., 204, 265–274, 2002.
Schouten, S., Hopmans, E. C., and Sinninghe Damsté, J. S.: The organic geochemistry of glycerol dialkyl glycerol tetraether lipids: A review, Org. Geochem., 54, 19–61, 2013.
Selby, D. and Creaser, R. A.: Re–Os geochronology of organic rich sediments: an evaluation of organic matter analysis methods, Chem. Geol., 200, 225–240, 2003.
Sharma, M., Papanastassiou, D. A., and Wasserburg, G. J.: The concentration and isotopic composition of osmium in the oceans, Geochim. Cosmochim. Ac., 61, 3287–3299, 1997.
Shaw Champion, M. E., White, N. J., Jones, S. M., and Lovell, J. P. B.: Quantifying transient mantle convective uplift: An example from the Faroe-Shetland basin, Tectonics 27, TC1002, https://doi.org/10.1029/2007TC002106, 2008.
Shephard, G., Müller, D., and Seton, M.: The tectonic evolution of the Arctic since Pangea breakup: Integrating constraints from surface geology and geophysics with mantle structure, Earth Sci. Rev., 124, 148–183, 2013.
Sluijs, A., Schouten, S., Pagani, M., Woltering, M., Brinkhuis, H., Sinninghe Damste, J. S., Dickens, G., Huber, M., Reichart, G.-J., Stein, R., Matthiessen, J., Lourens, L. J., Pedentchouk, N., Backman, J., Moran, K., Clemens, S., Cronin, T., Eynaud, F., Gattacceca, J., Jakobsson, M., Jordan, R., Kaminski, M., King, J., Koc, N., Martinez, N., McInroy, D., Moore Jr., T. C., O'Regan, M., Onodera, J., Pälike, H., Rea, B., Rio, D., Sakamoto, T., Smith, D. C., St John, K. E. K., Suto, I., Suzuki, N., Takahashi, K., Watanabe, M., and Yamamoto, M.: Subtropical Arctic Ocean temperatures during the Paleocene/Eocene Thermal Maximum, Nature, 441, 610–613, 2006.
Sluijs, A., Brinkhuis, H., Schouten, S., Bohaty, S. M., John, C. M., Zachos, J. C., Reichart, G.-J., Sinninghe Damsté, J. S., Crouch, E. M., and Dickens, G. R.: Environmental precursors to rapid light carbon injection at the Palaeocene/Eocene boundary, Nature, 450, 12–18, 2007.
Sluijs, A., Brinkhuis, H., Crouch, E. M., John, C. M., Handley, L., Munsterman, D., Bohaty, S. M., Zachos, J. C., Reichart, G.-J., Schouten, S., Pancost, R. D., Sinninghe Damste, J. S., Welters, N. L. D., Lotter, A. F., and Dickens, G. R.: Eustatic variations during the Paleocene-Eocene greenhouse world, Paleoceanography, 23, PA1S11, https://doi.org/10.1029/2008PA001615, 2008.
Sluijs, A., Schouten, S., Donders, T. H., Schoon, P. L., Röhl, U., Reichart, G.-J., Sangiorgi, F., Kim, J.-H., Sinninghe Damsté, J. S., and Brinkhuis, H.: Warm and wet conditions in the Arctic region during Eocene Thermal Maximum 2, Nat. Geosci., 2, 777–780, 2009.
Sluijs, A., Bijl, P. K., Schouten, S., Röhl, U., Reichart, G.-J., and Brinkhuis, H.: Southern ocean warming, sea level and hydrological change during the Paleocene-Eocene thermal maximum, Clim. Past, 7, 47–61, https://doi.org/10.5194/cp-7-47-2011, 2011.
Sluijs, A., van Roij, L., Harrington, G. J., Schouten, S., Sessa, J. A., LeVay, L. J., Reichart, G.-J., and Slomp, C. P.: Warming, euxinia and sea level rise during the Paleocene–Eocene Thermal Maximum on the Gulf Coastal Plain: implications for ocean oxygenation and nutrient cycling, Clim. Past, 10, 1421–1439, https://doi.org/10.5194/cp-10-1421-2014, 2014.
Sluijs, A., Frieling, J., Inglis, G. N., Nierop, K. G. J., Peterse, F., Sangiorgi, F., and Schouten, S.: Late Paleocene–early Eocene Arctic Ocean sea surface temperatures: reassessing biomarker paleothermometry at Lomonosov Ridge, Clim. Past, 16, 2381–2400, https://doi.org/10.5194/cp-16-2381-2020, 2020.
Smith, V., Warny, S., Grice, K., Schaefer, B., Whalen, M. T., Vellekoop, J., Chenot, E., Gulick, S. P. S., Arenillas, I., Arz, J. A., Bauersachs, T., Bralower, T., Demory, F., Gattacceca, J., Jones, H., Lofi, J., Lowery, C. M., Morgan, J., Nuñez Otaño, N. B., O'Keefe, J. M. K., O'Malley, K., Rodríguez-Tovar, F. J., Schwark, L., and the IODP–ICDP Expedition 364 Scientists: Life and death in the Chicxulub impact crater: a record of the Paleocene–Eocene Thermal Maximum, Clim. Past, 16, 1889–1899, https://doi.org/10.5194/cp-16-1889-2020, 2020.
Speijer, R. P., Pälike, H., Hollis, C. J., Hooker, J. J., and Ogg, J. G.: Chapter 28 – The Paleogene Period, in: Geologic Time Scale 2020, edited by: Gradstein, F. M., Ogg, J. G., Schmitz, M. D., and Ogg, G. M., Elsevier, 1087–1140, https://doi.org/10.1016/B978-0-12-824360-2.00028-0, 2020.
Stefánsson, A. and Gíslason, S.R.: Chemical Weathering of Basalts, Southwest Iceland: Effect of Rock Crystallinity and Secondary Minerals on Chemical Fluxes to the Ocean, Am. J. Sci., 301, 513, https://doi.org/10.2475/ajs.301.6.513, 2001.
Steinig, S., Dummann, W., Park, W., Latif, M., Kusch, S., Hofmann, P., and Flögel, S.: Evidence for a regional warm bias in the Early Cretaceous TEX86 record, Earth Planet. Sc. Lett., 539, 116184, https://doi.org/10.1016/j.epsl.2020.116184, 2020.
Stoker, M. S., Holford, S. P., and Hillis, R. R.: A rift-to-drift record of vertical crustal motions in the Faroe–Shetland Basin, NW European margin: establishing constraints on NE Atlantic evolution, J. Geol. Soc., 175, 263–274, 2018.
Stokke, E. W., Jones, M. T., Tierney, J. E., Svensen, H. H., and Whiteside, J. H.: Temperature changes across the Paleocene-Eocene Thermal Maximum – a new high-resolution TEX86 temperature record from the Eastern North Sea Basin, Earth Planet. Sc. Lett., 544, 116388, https://doi.org/10.1016/j.epsl.2020.116388, 2020a.
Stokke, E. W., Liu, E. J., and Jones, M. T.: Evidence of explosive hydromagmatic eruptions during the emplacement of the North Atlantic Igneous Province, Volcanica, 3, 227–250, 2020b.
Stokke, E. W., Jones, M. T., Riber, L., Haflidason, H., Midtkandal, I., Schultz, B. P., and Svensen, H. H.: Rapid and sustained environmental responses to global warming: the Paleocene–Eocene Thermal Maximum in the eastern North Sea, Clim. Past, 17, 1989–2013, https://doi.org/10.5194/cp-17-1989-2021, 2021.
Storey, M., Duncan, R., and Swisher III, C.: Paleocene-Eocene Thermal Maximum and the opening of the Northeast Atlantic, Science, 316, 587–589, 2007a.
Storey, M., Duncan, R., and Tegner, C.: Timing and duration of volcanism in the North Atlantic Igneous Province: Implications for geodynamics and links to the Iceland hotspot, Chem. Geol., 241, 264–281, 2007b.
Straume, E. O., Nummelin, A., Gaina, C., and Nisancioglu, K. H.: Climate transition at the Eocene-Oligocene influenced by bathymetric changes to the Atlantic-Arctic oceanic gateways, P. Natl. Acad. Sci. USA, 119, e2115346119, https://doi.org/10.1073/pnas.2115346119, 2022.
Suan, G., Popescu, S.-M., Suc, J.-P., Schnyder, J., Fauquette, S., Baudin, F., Yoon, D., Piepjohn, K., Sobolev, N. N., and Labrousse, L.: Subtropical climate conditions and mangrove growth in Arctic Siberia during the early Eocene, Geology, 45, 539–542, https://doi.org/10.1130/G38547.1, 2017.
Svensen, H., Planke, S., Malthe-Sørenssen, Jamtveit, B., Myklebust, R., Rasmussen Eidem, T., and Rey, S.: Release of methane from a volcanic basin as a mechanism for initial Eocene global warming, Nature, 429, 542–545, 2004.
Svensen, H. H., Jones, M. T., Percival, L. M. E., Grasby, S. E., and Mather, T. A.: Release of mercury during contact metamorphism of shale: Implications for understanding the impacts of large igneous province volcanism, Earth Planet. Sci. Lett., 619, 118306, https://doi.org/10.1016/j.epsl.2023.118306, 2023.
Tomiyasu, T., Eguchi, T., Yamamoto, M., Anazawa, K., Sakamoto, H., Ando, T., Nedachi, M., and Marumo, K.: Influence of submarine fumaroles on the distribution of mercury in the sediment of Kagoshima Bay, Japan, Mar. Chem., 107, 173–183, 2007.
Tremblin, M., Khozyem, H., Adatte, T., Spangenberg, J.E., Fillon, C., Grauls, A., Hunger, T., Nowak, A., Läuchli, C., Lasseur, E., Roig, J.-Y., Serrano, O., Calassou, S., Guillocheau, F., and Castelltort, S.: Mercury enrichments of the Pyrenean foreland basins sediments support enhanced volcanism during the Paleocene-Eocene thermal maximum (PETM), Global Planet. Change 212, 103794, https://doi.org/10.1016/j.gloplacha.2022.103794, 2022.
Trommer, G., Siccha, M., van der Meer, M. T. J., Schouten, S., Sinninghe Damsté, J. S., Schulz, H., Hemleben, C., and Kucera, M.: Distribution of Crenarchaeota tetraether membrane lipids in surface sediments from the Red Sea, Org. Geochem., 40, 724–731, 2009.
van der Meulen, B., Gingerich, P. D., Lourens, L. J., Meijer, N., van Broekhuizen, S., van Ginneken, S., and Abels, H. A.: Carbon isotope and mammal recovery from extreme greenhouse warming at the Paleocene-Eocene boundary in astronomically-calibrated fluvial strata, Bighorn Basin, Wyoming, USA, Earth Planet. Sc. Lett., 534, 116044, https://doi.org/10.1016/j.epsl.2019.116044, 2020.
Vickers, M. L., Lengger, S. K., Bernasconi, S. M., Thibault, N., Schultz, B. P., Fernandez, A., Ullmann, C. V., McCormack, P., Bjerrum, C. J., Rasmussen, J. A., Hougård, I. W., and Korte, C.: Cold spells in the Nordic Seas during the early Eocene Greenhouse, Nat. Commun., 11, 4713, https://doi.org/10.1038/s41467-020-18558-7, 2020.
Völkening, J., Walczyk, T., and Heumann, K. G.: Osmium isotope ratio determinations by negative thermal ionization mass spectrometry, Int. J. Mass Spectrom., 105, 147–159, 1991.
Walters, G. L., Kemp, S. J., Hemingway, J. D., Johnston, D. T., and Hodell, D. A.: Clay hydroxyl isotopes show an enhanced hydrologic cycle during the Paleocene-Eocene Thermal Maximum, Nat. Commun., 13, 7885, https://doi.org/10.1038/s41467-022-35545-2, 2022.
Weijers, J. W. H., Schouten, S., Sluijs, A., Brinkhuis, H., and Sinninghe Damsté, J. S.: Warm arctic continents during the Palaeocene-Eocene thermal maximum, Earth Planet. Sc. Lett., 261, 230–238, 2007.
Wessel, P., Smith, W., Scharroo, R., Luis, J., and Wobbe, F.: Generic Mapping Tools: Improved 1542 Version Released. Eos T. Am. Geophys. Un., 94, 409–410, 2013.
West, C. K., Greenwood, D. R., and Basinger, J. F.: Was the Arctic Eocene “rainforest” monsoonal? Estimates of seasonal precipitation from early Eocene megafloras from Ellesmere Island, Nunavut, Earth Planet. Sc. Lett., 427, 18–30, 2015.
Westerhold, T., Röhl, U., McCarren, H. K., and Zachos, J. C.: Latest on the absolute age of the Paleocene-Eocene Thermal Maximum (PETM): New insights from exact stratigraphic position of key ash layers +19 and −17, Earth Planet. Sc. Lett., 287, 412–419, 2009.
Westerhold, T., Röhl, U., Frederichs, T., Agnini, C., Raffi, I., Zachos, J. C., and Wilkens, R. H.: Astronomical calibration of the Ypresian timescale: implications for seafloor spreading rates and the chaotic behavior of the solar system?, Clim. Past, 13, 1129–1152, https://doi.org/10.5194/cp-13-1129-2017, 2017.
White, N. and Lovell, B.: Measuring the pulse of a plume with the sedimentary record, Nature, 387, 888–891, 1997.
Wieczorek, R., Fantle, M. S., Kump, L. R., and Ravizza, G.: Geochemical evidence for volcanic activity prior to and enhanced terrestrial weathering during the Paleocene Eocene Thermal Maximum, Geochim. Cosmochim. Ac., 119, 391–410, 2013.
Wilkinson, C., Ganerød, M., Hendriks, B., and Eide, E.: Compilation and appraisal of geochronological data from the North Atlantic Igneous Province (NAIP), in: The NE Atlantic Region: A Reappraisal of Crustal Structure, Tectonostratigraphy and Magmatic Evolution, edited by: Péron-Pinvidic, G., Hopper, J. R., Stoker, M. S., Gaina, C., Doornenbal, J. C., Funck, T., and Árting, U. E., Geological Society, London, Special Publications, https://doi.org/10.1144/SP447.10, 2017.
Willard, D. A., Donders, T. H., Reichgelt, T., Greenwood, D. R., Sangiorgi, F., Peterse, F., Nierop, K. G. J., Frieling, J., Schouten, S., and Sluijs, A.: Arctic vegetation, temperature, and hydrology during Early Eocene transient global warming events, Global Planet. Change, 178, 139–152, 2019.
Willumsen, P. S.: Palynology of the Lower Eocene deposits of northwest Jutland, Denmark, B. Geol. Soc. Denmark, 51, 141–157, 2004.
Yamashita, Y., Takahashi, Y., Haba, H., Enomoto, S., and Shimizu, H.: Comparison of reductive accumulation of Re and Os in seawater–sediment systems, Geochim. Cosmochim. Ac., 71, 3458–3475, 2007.
Zachos, J., Dickens, G., and Zeebe, R.: An early Cenozoic perspective on greenhouse warming and carbon-cycle dynamics, Nature, 451, 279–283, 2008.
Zacke, A., Voigt, S., Joachimski, M. M., Gale, A. S., Ward, D. J., and Tütken, T.: Surface-water freshening and high-latitude river discharge in the Eocene North Sea, J. Geol. Soc., 166, 969–980, 2009.
Zeebe, R. E. and Lourens, L. J.: Solar System chaos and the Paleocene–Eocene boundary age constrained by geology and astronomy, Science, 365, 926–929, 2019.
Zeebe, R. E., Zachos, J. C., and Dickens, G. R.: Carbon dioxide forcing alone insufficient to explain Palaeocene–Eocene Thermal Maximum warming, Nat. Geosci., 2, 576–580, 2009.
Zhang, Y. G., Pagani, M., and Wang, Z.: Ring Index: A new strategy to evaluate the integrity of TEX86 paleothermometry, Paleoceanography, 31, 220–232, 2016.