the Creative Commons Attribution 4.0 License.
the Creative Commons Attribution 4.0 License.
 | 14 Apr 2022
Insights from 20 years of temperature parallel measurements in Mauritius around the turn of the 20th century
Samuel O. Awe
Martin Mahony
Edley Michaud
Conor Murphy
Simon J. Noone
Victor K. C. Venema
Thomas G. Thorne
There is considerable import in creating more complete, better understood holdings of early meteorological data. Such data permit an improved understanding of climate variability and long-term changes. Early records are particularly incomplete in the tropics, with implications for estimates of global and regional temperature. There is also a relatively low level of scientific understanding of how these early measurements were made and, as a result, of their homogeneity and comparability to more modern techniques and measurements. Herein we describe and analyse a newly rescued set of long-term, up to six-way parallel measurements undertaken over 1884–1903 in Mauritius, an island situated in the southern Indian Ocean. Data include (i) measurements from a well-ventilated room, (ii) a shaded thermograph, (iii) instruments housed in a manner broadly equivalent to a modern Stevenson screen, (iv) a set of measurements by a hygrometer mounted in a Stevenson screen, and for a much shorter period (v) two additional Stevenson screen configurations. All measurements were undertaken within an ∼ 80 m radius of each other. To our knowledge this is the first such multidecadal multi-instrument assessment of meteorological instrument transition impacts ever undertaken, providing potentially unique insights. The intercomparison also considers the impact of different ways of deriving daily and monthly averages. The long-term comparison is sufficient to robustly characterize systematic offsets between all the instruments and seasonally varying impacts. Differences between all techniques range from tenths of a degree Celsius to more than 1 ∘C and are considerably larger for maximum and minimum temperatures than for means or averages. Systematic differences of several tenths of a degree Celsius also exist for the different ways of deriving average and mean temperatures. All differences, except two average temperature series pairs, are significant at the 0.01 level using a paired t test. Given that all thermometers were regularly calibrated against a primary Kew standard thermometer maintained by the observatory, this analysis highlights significant impacts of instrument exposure, housing, siting, and measurement practices in early meteorological records. These results reaffirm the importance of thoroughly assessing the homogeneity of early meteorological records.


The earliest meteorological records, prior to global standardization, were sparsely distributed and undertaken by a range of individuals and groups using a broad variety of instrumentation, exposures, practices, and even temperature scales (Knowles Middleton, 1966; Parker, 1994; Venema et al., 2020). In the early 20th century, the advent of the International Meteorological Organization (IMO, the precursor to the modern-day World Meteorological Organization, WMO) strengthened the push toward standardization of surface meteorological station instrumentation and observing practices at national, regional, and international levels, as well as the expansion of networks to be more geographically complete. This served to greatly improve spatio-temporal comparability and, therefore, homogeneity of these latter measurements. In terms of our understanding of the long-term climate system evolution, it is hence critically important to rescue additional early data records that predate this push toward standardization and to better understand them. This is particularly so in regions of the world where data holdings in this early period are especially sparse, such as the tropics.
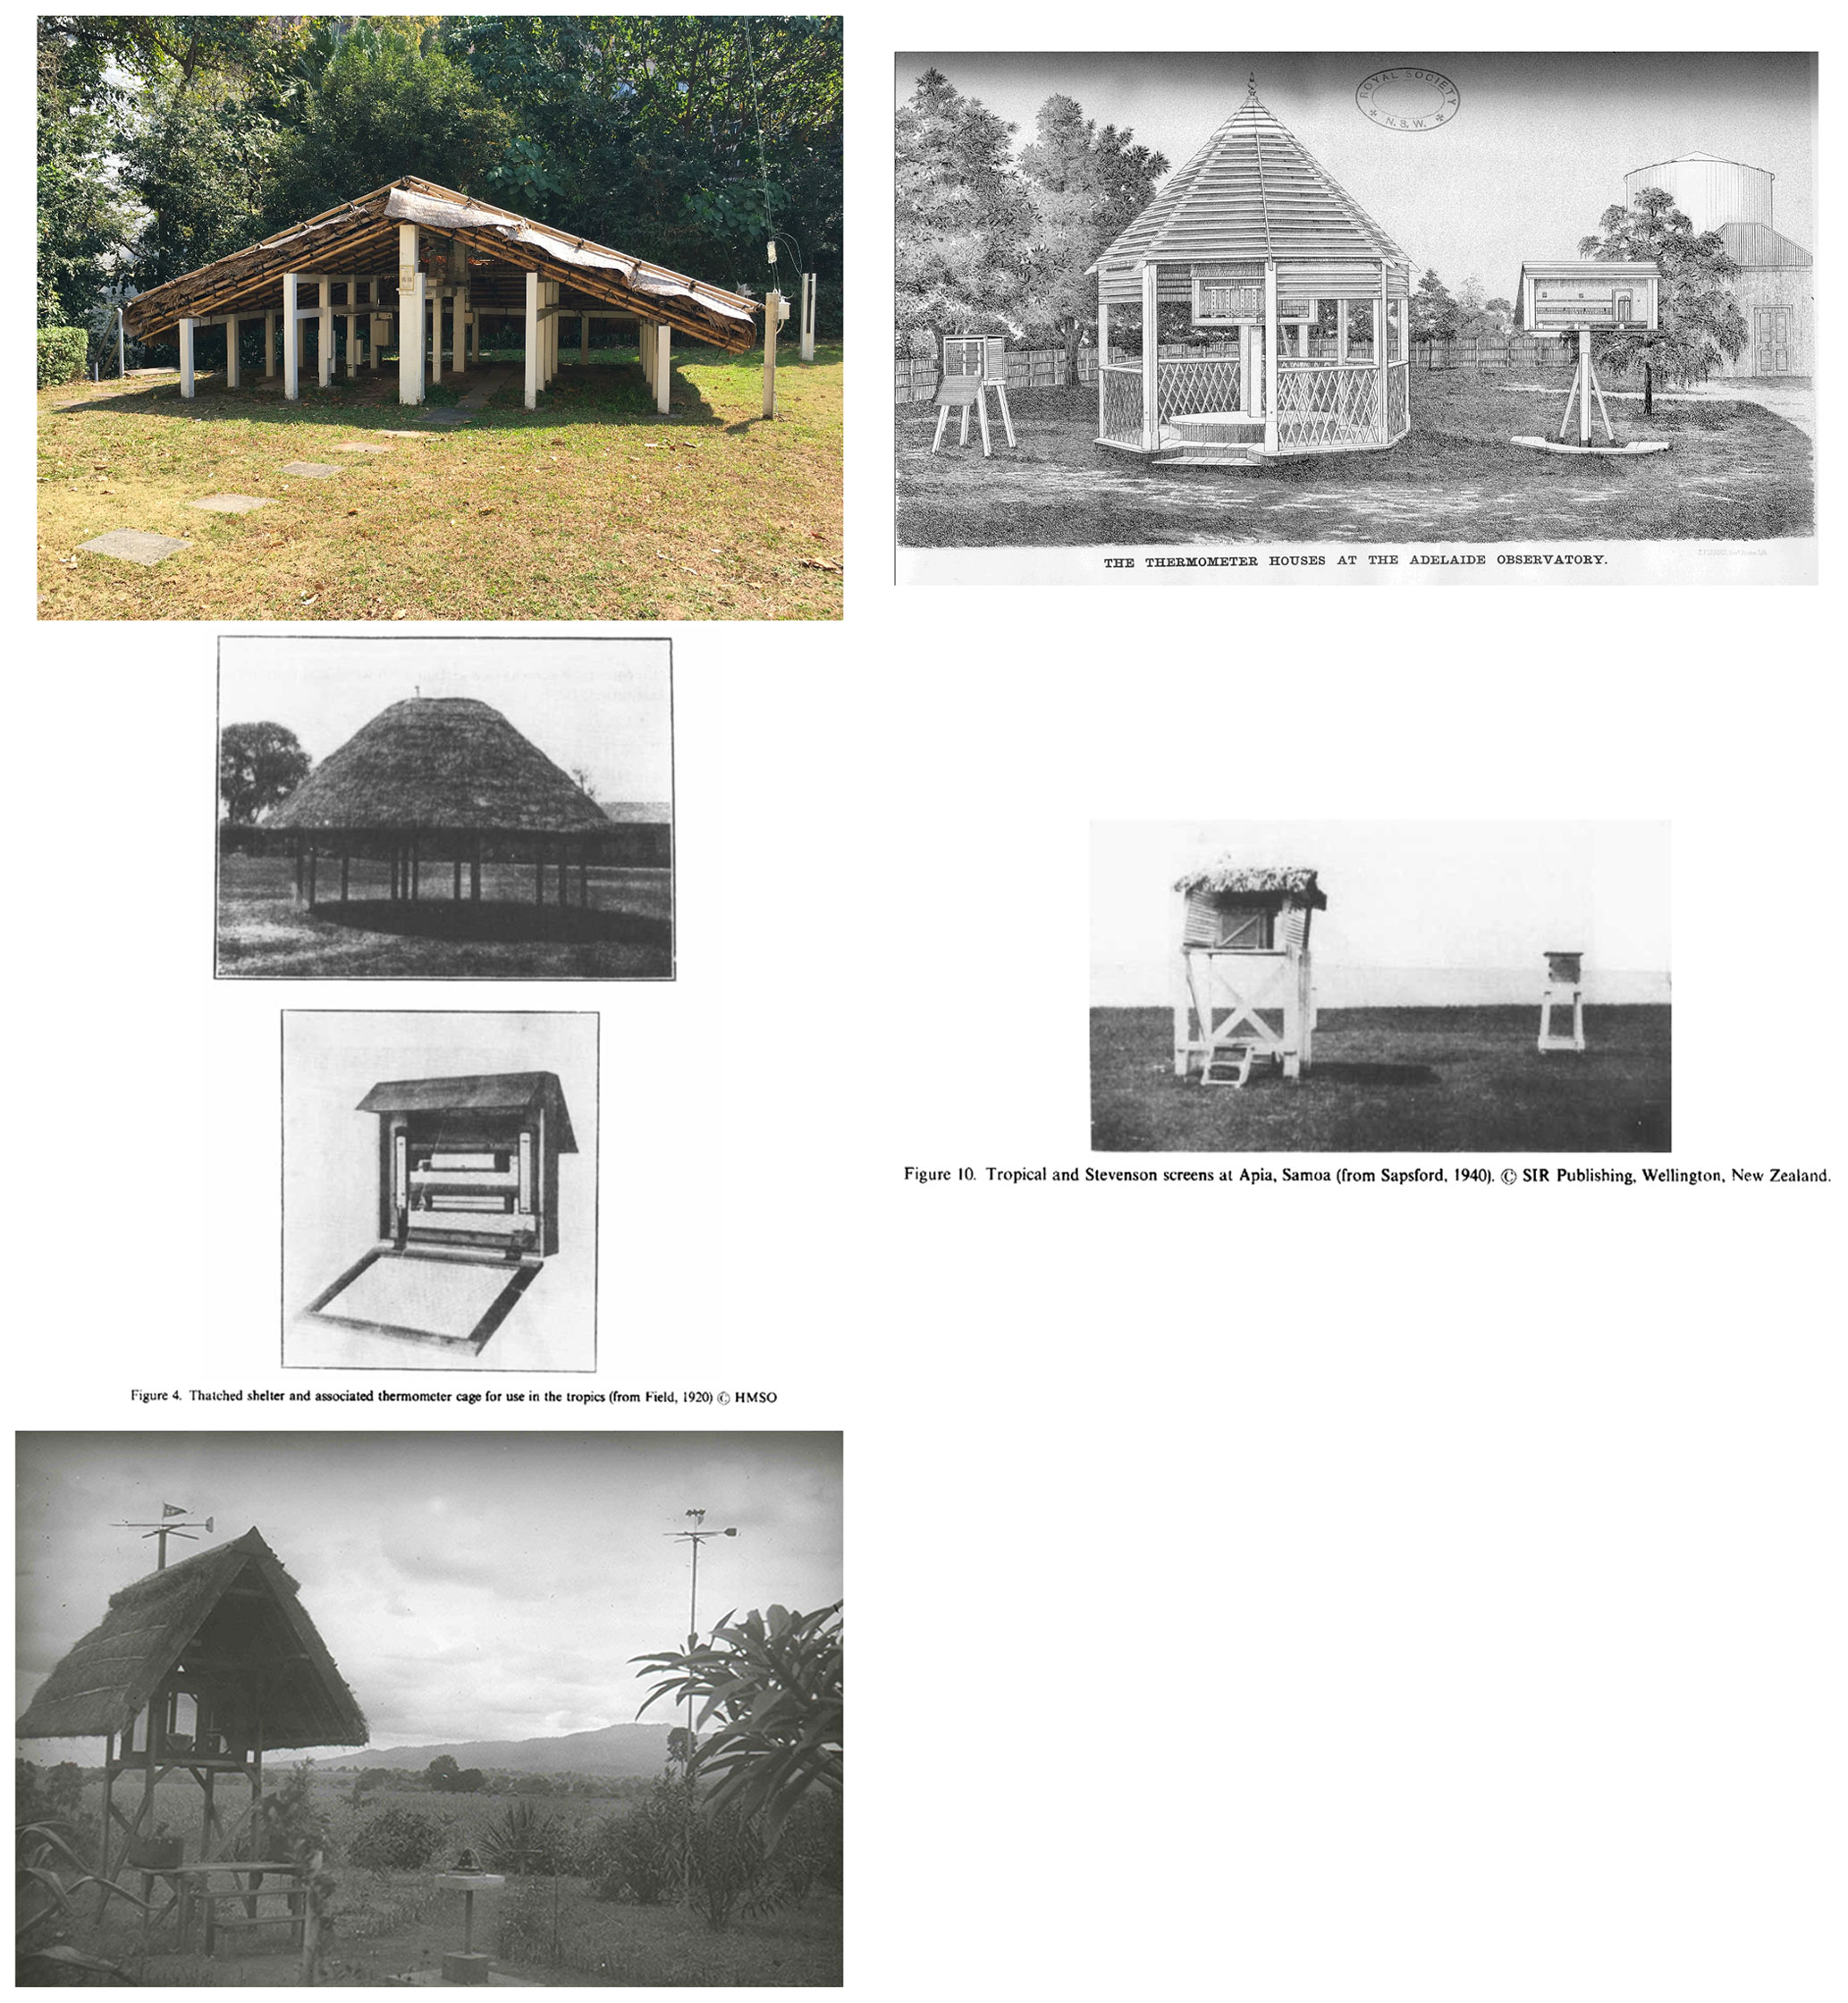
Figure 1Summary of a number of known early tropical–subtropical observational practices. The top left is a picture of the old exposure used at the Hong Kong observatory, which is no longer operational but still maintained (courtesy Philip Brohan). The top right shows three set-ups (a Stevenson screen, a thermometer shed, and a Glashier stand) at the Adelaide observatory which undertook 60 years of parallel measurements (Royal Society of New South Wales and discussed further in Ashcroft et al., 2021). The centre left (thatched shelter) and right (tropical thatched screen) are taken from Parker (1994) (Figs. 4 and 10, respectively) and are the only two tropical locations with photographic evidence of instrumental set-up shown therein. The bottom left image is of the meteorological observation station at Kizunguzi, Tanzania (source: DWD, Archive of the Deutsche Seewarte).
Knowledge of early instrumental set-ups and observing practices at individual sites is highly varied. Tropical and subtropical sites are known to have used a broad variety of approaches that generally, but far from exclusively, were some form of thatched pagoda screens, sheds, or well-ventilated rooms (Parker, 1994). Outside the tropics, window screens, poleward-facing walls, and garden stands were used. The basic scientific premise was to expose the thermometer to the ambient atmospheric conditions whilst simultaneously avoiding direct exposure to solar radiation. This was achieved with varying degrees of success. Figure 1 illustrates a number of tropical–subtropical exposures in Parker (1994) and uncovered in the present analysis via personal contacts. This shows the existence of significant heterogeneity in instrumental exposure in these early records. For most stations, these early designs were replaced by the Stevenson (1864) screen (also known as cotton region shelter; Quayle et al., 1991), which is much more enclosed and aims to maintain good ventilation but provide better protection against both direct and indirect solar and infrared radiation.
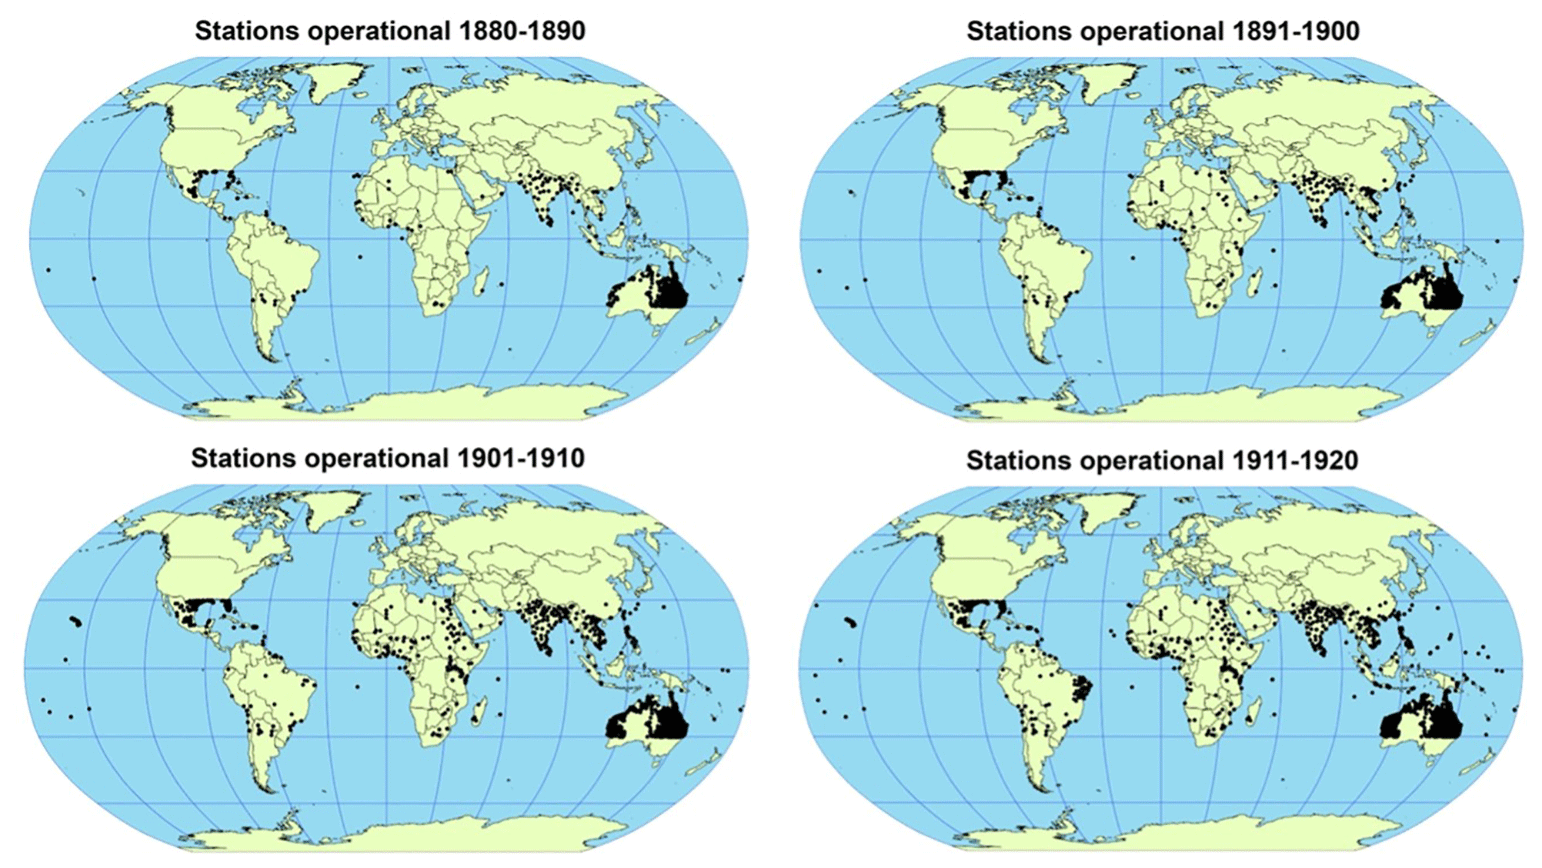
Figure 2Available monthly resolution temperature records between 30∘N and 30∘S over the period around the parallel measurement experiment analysed herein arising from the international efforts of the Copernicus Climate Change Service and NOAA's National Centers for Environmental Information (Thorne et al., 2017; Noone et al., 2021). Note that, to date, only non-continuous digitized data for Mauritius at Pamplemousses 1787–1974 are available in international repositories.
From a climate monitoring perspective, these “raw” early records suffer from potentially complex biases that are heterogeneous in nature and occurred across a geographically sparse network (Hartmann et al., 2013, and references therein). Prior to use in climate applications these records must be assessed for homogeneity and adjusted to remove apparent data artefacts. Modern state-of-the-art techniques generally use comparisons between nearby stations to identify and then adjust for non-climatic data artefacts (Conrad and Pollak, 1950; Aguilar et al., 2003; Trewin, 2010; Menne and Williams, 2009; Venema et al., 2020). The breakpoint detection step is inherently a signal-to-noise ratio (SNR) issue – the lower the noise in the series the smaller the breakpoints which can be robustly detected – which means the comparator stations should be close enough to yield a difference series with low variability (Williams et al., 2012; Gubler et al., 2017; Lindau and Venema, 2018a). Unfortunately, station sparsity is a particular issue for the tropics in the early record. There are vast swathes of the tropics with no information in current digitized archives over this period (Fig. 2), which may in part reflect incomplete data rescue and/or the presence of data policy issues rather than the lack of potential long-term records (Allan et al., 2011).
There are some insights into the potential limitations of neighbour-based homogenization approaches in such situations from a number of studies. Gubler et al. (2017) studied the influence of station density by comparing homogenization outcomes using all Swiss temperature stations to homogenization with a thinned-out network with a similar network density as that found in Peru. They found that when the network was thinned out the homogenization method HOMER could improve the homogeneity at a station level but could not reduce the network average trend errors, which is the most crucial task. Chimani et al. (2018) studied the homogenization of relative humidity observations in Austria, which have much lower cross-correlations between stations than temperature, and found that none of the homogenization techniques could achieve clear improvements in the homogeneity of the data. Lindau and Venema (2018a) helped understand the problem. They found that when the SNR is too low, the errors in the positions of break inhomogeneities are very large. Small errors in the break positions can lead to drastic under-adjustment of any network-wide trend biases due to inhomogeneities (Lindau and Venema, 2018b). The latter was also found by Williams et al. (2012) in their benchmarking exercise for the USA, which used scenarios of varying difficulty for the inhomogeneities. For easy scenarios well over 90 % of the network-wide trend errors could be removed by homogenization, but for the hardest scenario with many small breaks only about half of the trend error could be removed.
As a result of such challenges, a variety of novel techniques have been used to assess the homogeneity of these early records. These variously rely upon intra-station characteristics, available parallel measurements, or meteorological covariates to adjust for apparent inhomogeneities (Hubbard et al., 2001; Camuffo, 2002; Böhm et al., 2010; Brunet et al., 2011; Auchmann and Brönnimann, 2012; Lindén et al., 2015; Kaspar et al., 2016; Acquaotta et al., 2016). Ultimately, however, trust in statistical and metadata-based homogenization techniques can only come from a fundamental measurement-based understanding. There has thus been increasing interest in recent years in ascertaining the differences arising from the systematic changes in instrumentation and methods of observation via direct comparison of modern and old instruments, exposures, and practices. To date these have primarily considered the impact on early mid-latitude records. For a site at Kremsmünster, Austria, the original instrumentation has remained, permitting a side-by-side comparison in the modern era (Böhm et al., 2010). For Spanish data, early screens were reconstructed from available metadata and a comparison was undertaken focusing on the effects of exposure differences (Brunet et al., 2011). Comparisons of various changes in Australia (Ashcroft et al., 2012) have recently been complemented by analysis of a 60-year set of parallel measurements at the Adelaide observatory over 1887–1947 (Ashcroft et al., 2021). These studies have collectively highlighted important and seasonally varying impacts of the distinct instrumentation and methods of observation in the early period records, relative to modern instrumentation and practices, in these specific cases. Two additional known analyses are ongoing: (i) an experiment by the Netherlands Met Service KNMI comparing a pagoda-housed instrument to a Stevenson screen using a similar philosophy as that in Brunet et al. and (ii) two comparisons of north wall measurements with Stevenson screens in Norway (Øyvind Nordli, personal communication, 2018). There have also been several long-running sets of parallel measurements associated with far more recent transitions, such as the US transition from cotton region shelters to the MMTS (maximum–minimum temperature sensor) with a side-by-side comparison now exceeding 30 years (figure in Cook, 2016). Parallel measurements tend to have not been shared as widely as long-term station records, and efforts are ongoing to build a database of such measurements, which has uncovered many such collections (Venema et al., 2018).
The issue of the verity of early instrumental temperature records matters not just scientifically, but also increasingly in terms of public policy following the adoption of the Paris Agreement, which, unlike prior international climate agreements, has a mitigation goal explicitly predicated upon avoiding specified warming levels relative to “pre-industrial”. Its focus upon efforts to keep global surface temperature warming below 2 ∘C above pre-industrial levels and strive to remain below 1.5 ∘C (“keep 1.5 alive” as it was termed at the recent COP-26) has led to a renewed focus upon early instrumental records given their importance in establishing estimates of the pre-industrial baseline and thus how close we are now to these levels of warming (e.g. Hawkins et al., 2017). Gulev et al. (2021, see their Table 2.4) conclude that global surface temperature change over 1850–1900 to 2011–2020 is 1.09 [0.95 to 1.20] ∘C, with most of the uncertainty in this estimate arising from divergence in available estimates of the global surface temperature prior to 1900. Any new insights that might enable these early period estimates to be better constrained therefore potentially have substantial policy implications if they lead to a shift in the central estimate or range of estimates of warming since 1850–1900.
Herein we recover and analyse a recently rediscovered contemporaneous set of parallel temperature measurements which was undertaken over a period of 20 years at the Royal Alfred Observatory in Mauritius around the turn of the 20th century (1884–1903). Perhaps uniquely, this set of measurements consists of up to six independent sets of temperature observations using distinct methods of observation. This enables a much more robust assessment than a typical long-term two-way comparison or short-term intense intercomparison campaign, permitting greater insights. It is also valuable in that there are few, if any, known sets of such parallel measurements from the tropics for these early measurement methods.
The remainder of the paper is structured as follows: Sect. 2 provides a brief history of the observatory and introduces the context of the parallel measurement series. Section 3 describes the rescue and collation of the records by the lead author as part of his Masters thesis. Section 4 analyses the set of parallel measurements for annual and seasonal effects and the impacts of monthly averaging choices. Section 5 provides a discussion, and Sect. 6 concludes.
2.1 History and key personnel involved
Mauritius is a remote island location in the southern Indian Ocean (20∘10′′ S, 57∘31′′ E) (Fig. 3). Given its strategic position, colonial control of Mauritius was highly contested, with control changing hands from the Dutch (1598–1710), to the French (1710–1810), and then the British (1810–1968) before gaining independence. Mauritius has played a key, but often unrecognized, role in the development of meteorological research. A comprehensive review is given in Mahony (2018), with a focus on understanding of tropical cyclones, and is based upon extensive archival research. A brief history of meteorological research in Mauritius is also given by the National Meteorological Service at http://metservice.intnet.mu/about-us/historical-background/ (last access: 20 September 2021). Here we concentrate solely on those aspects directly germane to the present analysis, providing the remarkable context in which these measurements were made.

Figure 3Zoomed-out and zoomed-in imagery from OpenStreetMap (© OpenStreetMap contributors 2021; distributed under the Open Data Commons Open Database License – ODbL – v1.0) showing the position and local geography of Mauritius, including the various locations referred to in the text superposed on the inset map.
The very first temperature measurements on Mauritius using thermometers were made by Mr. Cere of the Jardin du Roy (now Botanical Gardens) in Pamplemousses in 1774 under a shaded office veranda. Later, Mr. Lislet Geoffroy, an engineer, astronomer, botanist, and cartographer, started measurements in Port Louis with a thermometer under his resident veranda, and as a scientist he began publishing his observations locally from 1830. In 1832 a public observatory was opened in Port Louis on the wharf in the harbour and started temperature measurements on a 12-hourly basis in the morning and afternoon. The Royal Engineers Observatory in 1852 also made such observations on a regular basis (Henry James Scheme) until 1856 when all instruments were transferred to the public observatory due to the demolition of the Royal Engineers Observatory. The observations continued in Port Louis until 1869 when a new site was located in Pamplemousses to build the Royal Alfred Observatory in 1870, where operations commenced in November 1874 under Dr. Meldrum's directorship.
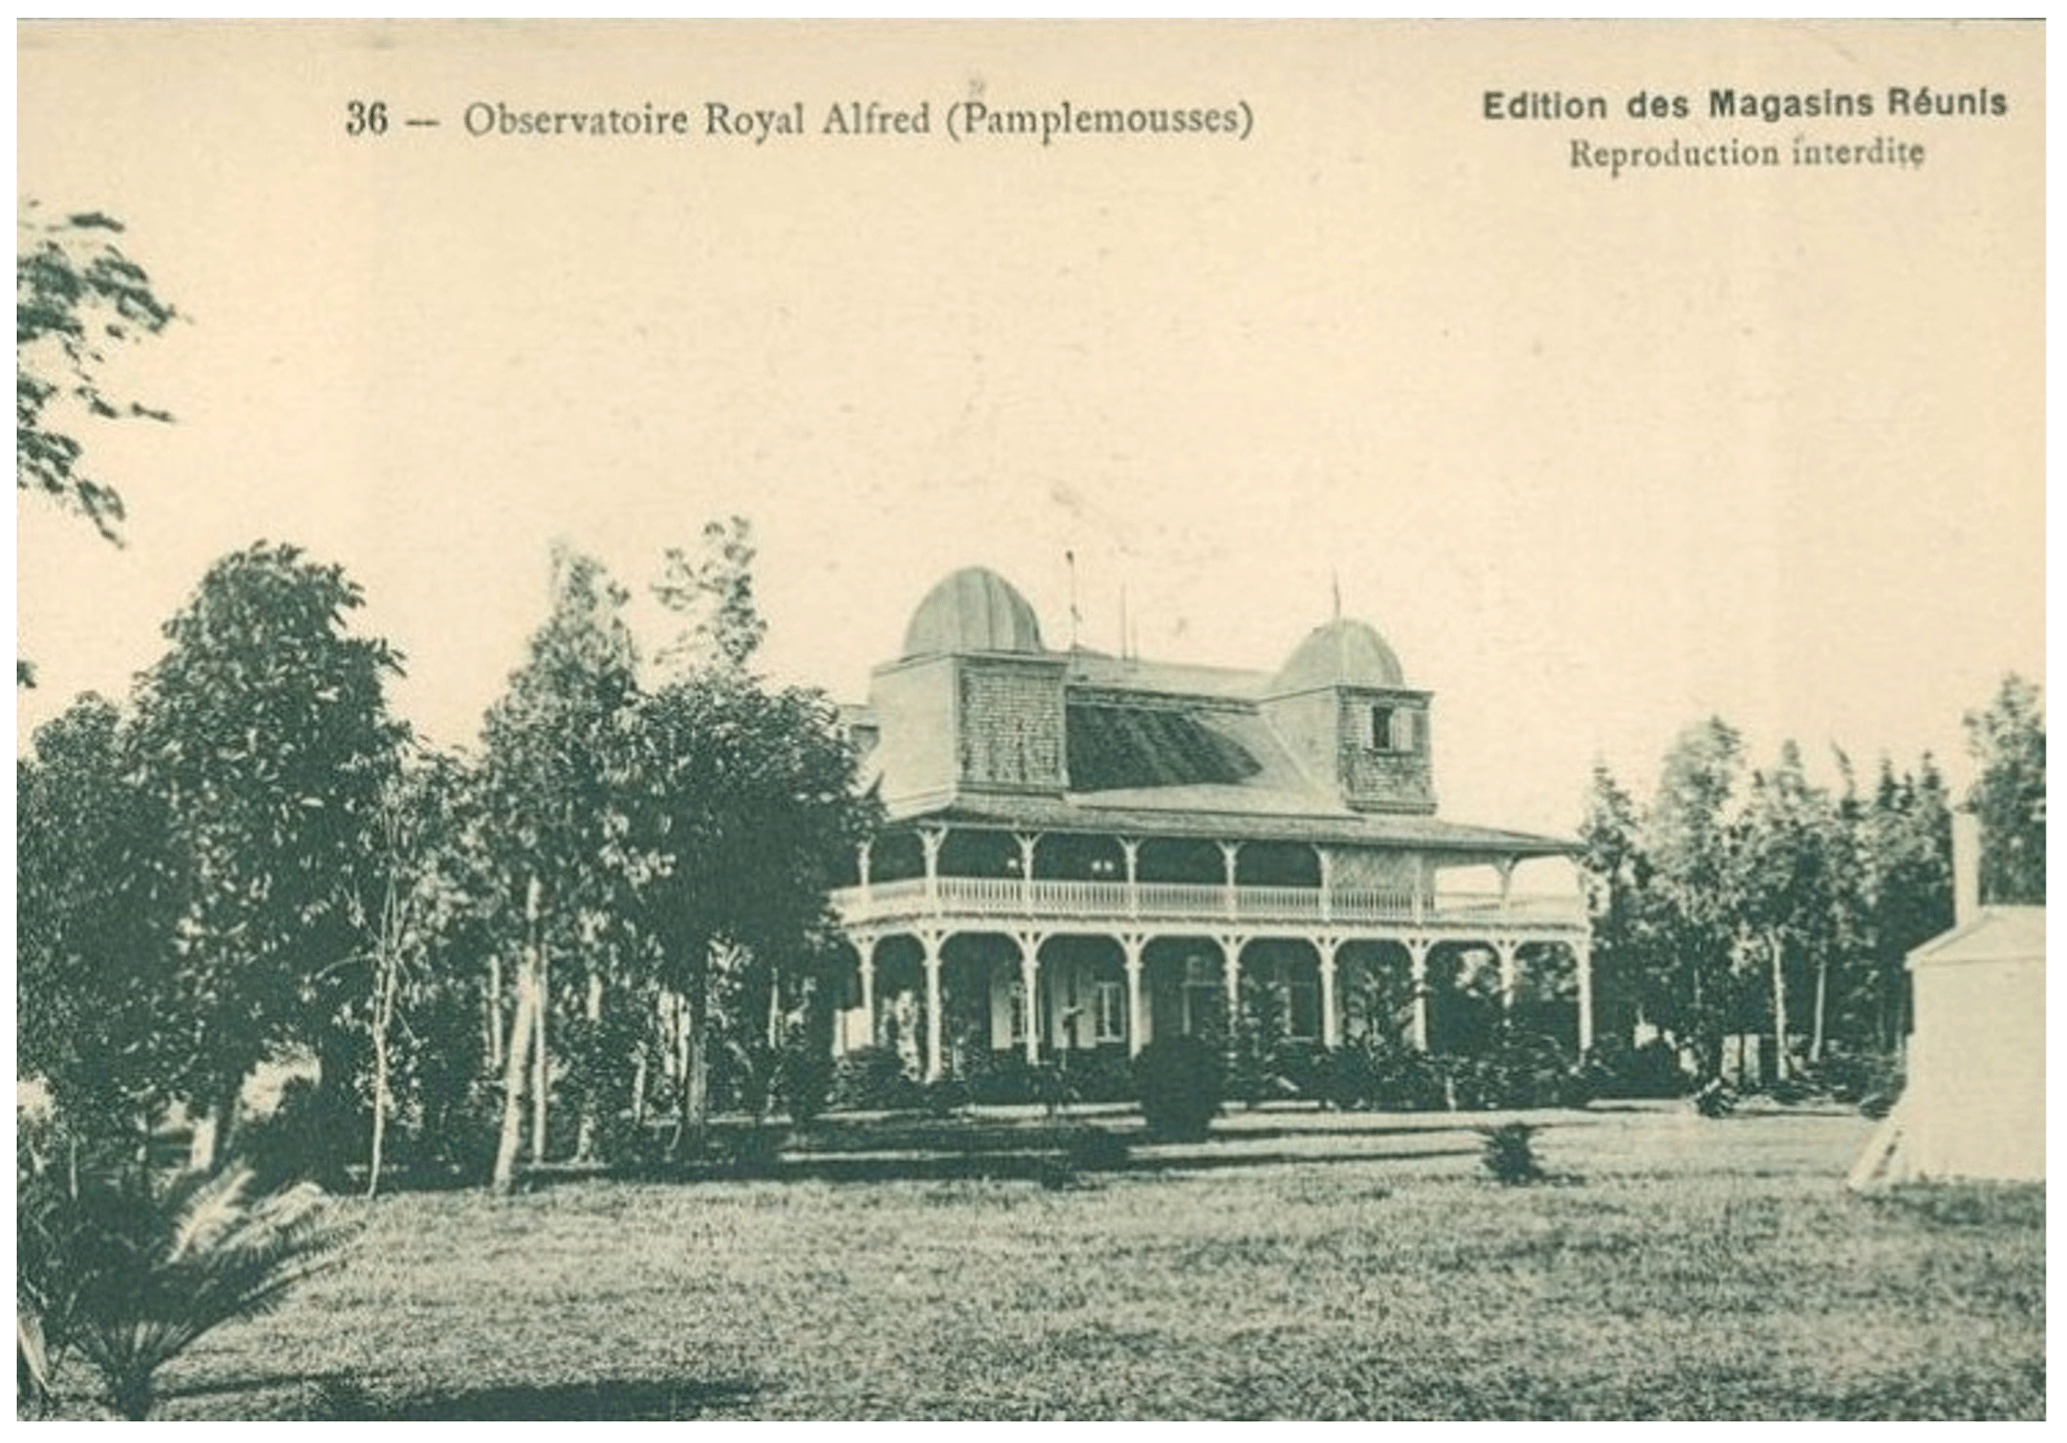
Figure 4Photo of the Royal Alfred Observatory building from a contemporaneous postcard estimated to have been taken around 1909 that was sold by Magasins Réunis, which was a chain of department stores. A very similar photograph (which we think is identical but with a different crop) was published in Walter's 1910 Sugar Industry of Mauritius but is of lower quality. No photos are known to exist of the actual equipment used in the parallel measurement programme analysed herein, although the metadata describe the relative positioning in some detail in later editions of the blue book series (Sect. 2.2, Fig. 6).
The Royal Alfred Observatory (RAO henceforth) plays a pivotal role in the overall history of Mauritian meteorology over the late 19th and early 20th centuries. The RAO was conceived in 1860 and opened in the early 1870s, attaining the status of a government department in 1874. The observatory provided meteorological services to the then colony and oversaw the gradual development of a network of observing sites across Mauritius from the beginning of the 20th century. The meteorological service headquarters was relocated in 1925, although observations continued at the site. The building was eventually closed in 1961 and pulled down to make way for the construction of a hospital. Figure 4 shows a contemporary photo of the building and surroundings. The two sets of annual reports of the observatory imaged by NOAA NCEI (Sect. 3) highlight a broad range of measurements being undertaken, which may be of interest to many investigators. In addition to meteorological measurements there are, for example, some measurements of ozone reported in at least some of the “blue book” series (Sect. 3), and the meteorological observations are collated alongside magnetic observations after 1898.
Brief sketches of key personnel who may have had a role in the measurement programme being analysed herein are as follows.
Charles Meldrum arrived in Mauritius in 1848 to teach mathematics at the Royal College, having previously spent a number of years teaching in Bombay. In 1851 he helped launch a meteorological society, and in 1861 he was made government observer. He was director of the RAO from its opening in 1874 until 1896, so it most likely would have been him who started, or at least approved, the experiment. His big interest, and that which he is now mainly known for, was “cyclonology”. He spent much of his time as society secretary compiling data from ships' logs and stitching together pictures of cyclones in the southern Indian Ocean (many of these records are preserved in the annual logs used herein). With these, he was able to confirm the hypothesis that the winds blow in a spiral towards the centre – “Meldrum's rules” for navigating in a storm thereafter became a key reference for mariners. Like many at the time he was committed to cyclical understandings of climatic variability and keenly sought out correlations between sunspots and local weather. He also took an interest in the broader environmental state of the island, particularly the relationships between climate, deforestation, disease, and population growth. Again, this interest is clearly reflected in the composition of the annual summary logbooks.
While his major contributions to meteorology (e.g. those for which he was made fellow of the Royal Society in 1876) did not necessarily come from observatory-based work, we have evidence from the 1850s of a very “modern” concern for careful and precise instrumentation. This was not to be taken for granted at the time – the officer Meldrum replaced as government observer was using his own homemade instruments, for instance. Further details on Charles Meldrum are given in Michaud (2000).
Thomas F. Claxton – slightly less is known about Claxton, beyond a few publications and some second-hand information from Albert Walter, his successor (see below). He had been a computer at Royal Greenwich Observatory from 1890, having previously won prizes at school in mathematics, geometrical drawing, navigation, astronomy, and French. He was recruited from Greenwich by Meldrum in 1895, to the post of first assistant director and director designate. When Claxton took over as director in 1896, Albert Walter was likewise recruited from the Greenwich ranks. Claxton published a little on cyclones and astronomy, and he was clearly more interested in the latter than Meldrum had been. He seems to have been very mathematically minded and a precise observer, although not such an effective director – he frequently created trouble with volunteer observers on outlying islands, as well as quarrelling frequently with the government and the press over cyclone warnings. While Meldrum was known as a great “savant” and a trusted forecaster, Claxton was regularly accused of missing approaching cyclones (this was “single-station forecasting”, an art developed in part on the basis of Meldrum's earlier theoretical work), and in 1910 he left Mauritius for a position in Hong Kong.
Albert Walter – in the meantime, Walter had developed a reputation as a somewhat more reliable cyclone forecaster. He arrived in 1897 and spent much of his first year studying up on Meldrum's cyclone work. From around 1900 onwards he took up some of Meldrum's statistical interests, beginning work on the relationships between cyclones and the sugar crop, the island's chief export (Rouphail, 2019). He argued that by using statistical interpolation it was possible to infer with some accuracy, based on only a couple of point observations of wind, how much cane each estate would have lost with a passing cyclone more accurately than a visiting insurance inspector could. He was much more statistically minded (climatological perhaps) than Claxton and much more embedded in the life of the colony. He married into the French landowning elite, served their interests much more directly, and ended up doing varied statistical work for the government alongside his eventual RAO director duties. Indeed, when he eventually left for East Africa in 1925, it was to conduct statistical work primarily, although he did end up establishing a meteorological service there from 1929. Walter's later career was very much a product of the interwar burst of interest in agricultural meteorology.
Less can be said about the assistants who may well have been doing much of the day-to-day observing. We have found passing references to a few of them – mostly they were recruited from the Royal College and trained in making observations by the director or assistant director over a period of a few weeks. If they were deemed good enough, they would be kept on. They seem to have been mostly drawn from what was known as the “creole” community, which at that point meant French descent but born in Mauritius, although some of Indian descent were also recruited. How work was divided up and who was perceived as being capable of what was very racialized. One of the assistants who worked in the period of the experiment, a Mr. Figon, retired early in 1899 on account of the ill effects (including failing eyesight) of the routine observational work, which included spending a lot of time in the basement with photographic chemicals. His case, along with that of a number of assistants lost to malaria, is indicative of how physically demanding observatory work could be in this period, especially in tropical environments.
2.2 Particulars of the temperature intercomparison at the Royal Alfred Observatory
The parallel measurement documentation is a little ambiguous at times and is scattered across the so-called blue book series (1884–1909 but with gaps in the versions available from NOAA NCEI archives) and annual reports (1887–1973) as detailed in Table 1. Early reports contain only superficial metadata. The first annual summary report from the observatory imaged at NOAA NCEI (Sect. 3) mentions annual temperature series taken since 1875 (the first full year of operation) and compares 1887 to the 1875 to 1887 average (Fig. 5). Given that the initial observatory was based upon a visit by Charles Meldrum to the Royal Greenwich Observatory in 1866 to both acquaint himself with the layout and acquire initial instruments, it can be assumed that the instrumentation and set-up would have been broadly similar to those in use there. Details of instrumentation at Kew advocated for use elsewhere under UK auspices are given in a Royal Society report (Royal Society, 1868). Interestingly, this report alludes to a period of parallel measurements carried out at Kew in 1867, which may have been the inspiration for the longer-running programme of parallel measurements at RAO.
Table 1Brief summary of the two sets of image holdings archived by NOAA NCEI that pertain to the Royal Alfred Observatory. The first collection is of blue books, two of which were missing in the NOAA NCEI collection and were sourced from the NOAA Foreign Data Library. The second is the annual report series. Neither is continuous in the NCEI holdings. See Fig. 10 for indications as to availability of individual logbooks across the period of the present study.
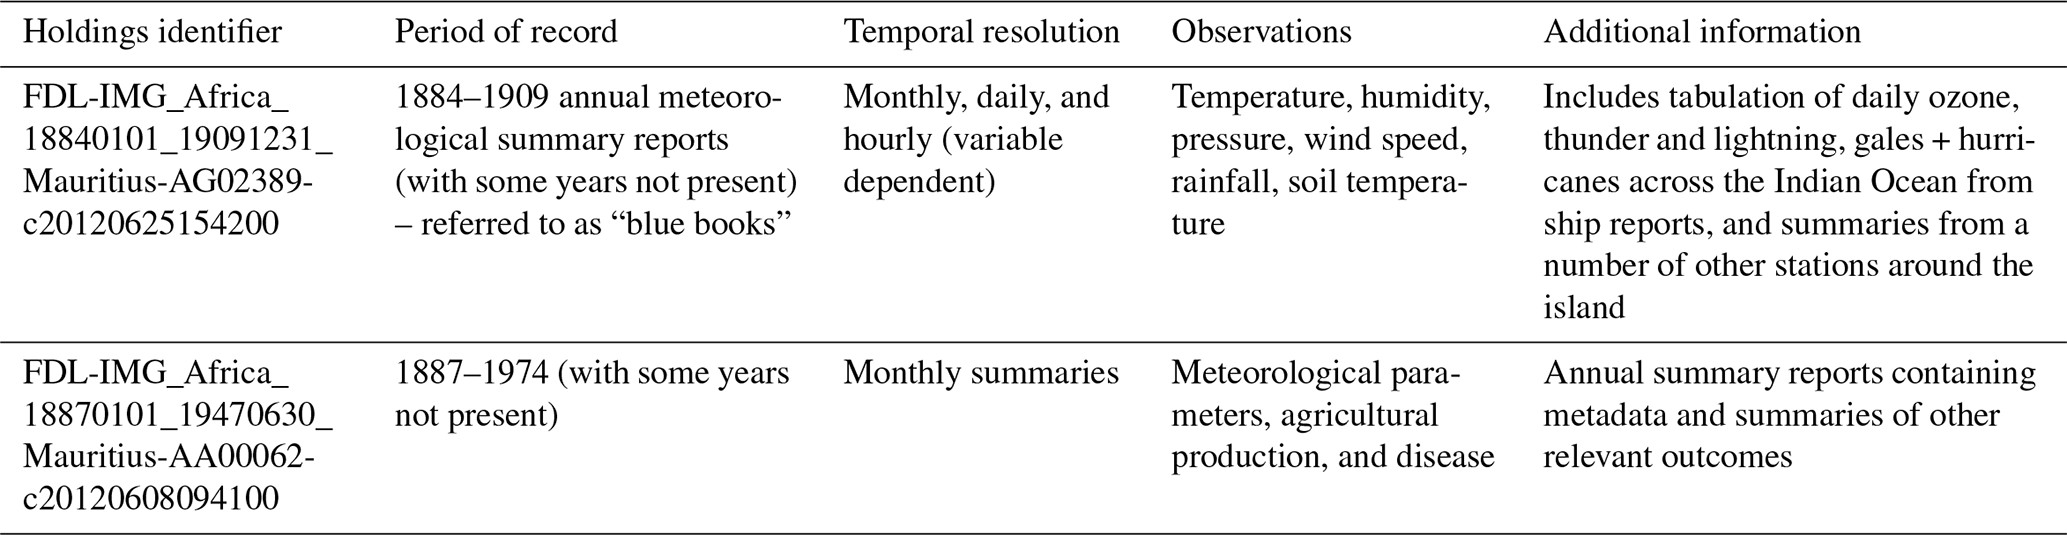

Figure 5From the first annual summary imaged by NOAA NCEI, a summary table in the front matter compares the period 1875 to 1887, implying continuous measurements of air temperature over that period. Units are Fahrenheit, and the image misalignment is as photographed.
Correspondence dated 30 March 1875 states that an anemometer and a thermograph (Kew pattern, by Adie) had been ordered but that the thermograph was yet to arrive. The thermograph seems to have arrived in December 1875, but as stated by Meldrum in his annual report drafted in October 1876, “this instrument has not been mounted, owing to the want of a building for it”. The blue book report for 1876 repeats that the thermograph is still not yet working and refers to the reported temperatures as arising from Casella maximum–minimum thermometers having a southern exposure and being mounted 6 ft (1.83 m) from the ground. A building which was under construction for the thermograph seems to have been damaged in a storm, further delaying the installation. The use of Casella thermometers with a southern exposure would be methodologically quasi-consistent with the earliest measurements on Mauritius taken under verandas (Sect. 2.1). It is unclear whether the originally sourced thermograph was ever actually installed because subsequent thermograph measurement series metadata in latter reports refer consistently to a Hicks thermograph, not an Adie thermograph.
It is clear across the series of reports that there were at least four distinct instrument set-ups in operation for periods of at least several years, each across varying subsets of the period 1883–1903:
-
in a well-ventilated room situated between open south- and east-facing windows, which some reports refer to as “the main (or principal) computing room”;
-
from a thermograph located in what is variously described as a “shed” or in later reports as a photoheliograph dome and thermograph room;
-
from a Stevenson screen located on the lawn; and
-
from a hygrometer located in a Stevenson screen on the lawn.
Starting with the 1899 blue book report (and then repeated in subsequent reports with some variations) the reports contain quite detailed metadata about both the relative positioning and manufacturers of much of the instrumentation as follows (with minimal editing).
-
The main building was built in 1875 and is described as facing north by west and as a stone structure of rectangular base 56 ft long by 38 wide (17 × 11.6 m) sheltered on all sides by a two storied veranda. On the ground floor are three rooms with the principal computing room on the eastern side. In the southeast corner of this room are self-registering maximum and minimum thermometers, dry bulb (Casella nos. 15447 and 1470) and wet bulb (Casella nos. 958 and 1464); they are between two open windows, one facing the east and the other the south. The 1900 report mentions that these were mounted on a wooden stand. This appears to constitute the original long-standing series referred to in the 1887 report. Later reports suggest replacement of the thermometers may have been necessary as the identifiers either change or are not stated. We note that earlier reports lack such detail, so instrument replacements in the prior period cannot be ruled out.
-
The photoheliograph dome and thermograph room are in a stone building built in 1878 some 240 ft (73 m) NE of the main building, which is 16 ft (4.9 m) in diameter. Adjoining are two rooms, one for photographic operations and the second of which, the “east room”, contains the registering parts of the Kew thermograph and was known as the thermograph room. The “stems” of the photographic thermometers projected southward into the thermograph screen, being held in position by a metal frame, which was also attached to the standard dry and wet bulb thermometers. The screen was 6 ft square by 6 to 7 ft high (1.83 × 1.83 × 1.83–2.13 m), with the roof sloping towards the south. The sides were double louvre boarding, and the planks of the floor were double with an air space between to ensure ventilation as well as protection against radiation from the ground. The bulbs of the thermometers were 2 ft (0.60 m) above the floor and 6 ft (1.83 m) above the ground (although the 1891 annual report implies they were 6 ft 4 in. (1.93 m) above the ground; it is unclear whether this represents a true adjustment of instrument mounting). As far as can be ascertained from available metadata, the thermograph was a photographic type by the well-known manufacturer James Hicks (although as noted before a further thermograph was ordered a decade prior). The 1902 blue book describes the thermograph as of the Kew pattern (although it is likely that it was first developed at Oxford's Radcliffe Observatory about 1849), being fully described in the Annual Report of the Meteorological Committee for the Royal Society for the Year 1867 (Royal Society, 1868) to which the interested reader is referred for full details of this instrumentation including figures of the likely instrumental configuration (although this cannot be absolutely verified). Further details on the set-up at Kew including further images are given in Anon (1892), Drummond (1947; Plate II), and Galvin (2003; Fig. 2). The recorder was located in the main building. Lenses were used to reflect the temperature and/or mercury level in the tube, and the image was shown on a specially prepared chart and later developed on a scale. The recorded temperature was therefore known on the next day.
While the fundamental measurement principle of provision of a continuous trace of changes in temperature is the same in modern-day thermographs, the specifics of the measurement system are very distinct. Modern-day thermographs consist of a small portable instrument housed in a Stevenson screen, with a bimetallic coil as the sensor, recording on daily or weekly paper charts wound around a clock drum.
-
The enclosure (we can only assume this means fenced area although the metadata are not specific) for thermometers was at a distance of about 40 yards (36.5 m) to the east of the main building in a circular enclosure 11 yards (10 m) in diameter. In it were placed (1) a Stevenson screen containing self-registering maximum and minimum thermometers (Negretti and Zambra nos. 40 450 and 40 467), which the 1891 annual report states is 4 ft (1.2 m) above the ground, and (2) a Stevenson screen containing a Mason hygrometer by Casella (thermometer nos. 81 524 and 81 525), being 4 ft (1.2 m) above the ground, amongst a range of additional meteorological equipment.
There are no metadata to suggest that any of these instrumentation combinations or locations changed over the period of record being considered here, although several thermometers are recorded as being replaced. Figure 4 implies that there is little in the way of relief at the observatory and its immediate surroundings, which means that all measurements are probably undertaken at broadly equivalent elevations, although precise elevation details are only given for the principal computing room, which hosted the barometer. The sun elevation is climatologically to the north of the Mauritius location except for a 2-month period from mid-November to mid-January, so the south-facing position of the well-ventilated room and thermograph serves to minimize potential solar radiation impacts.
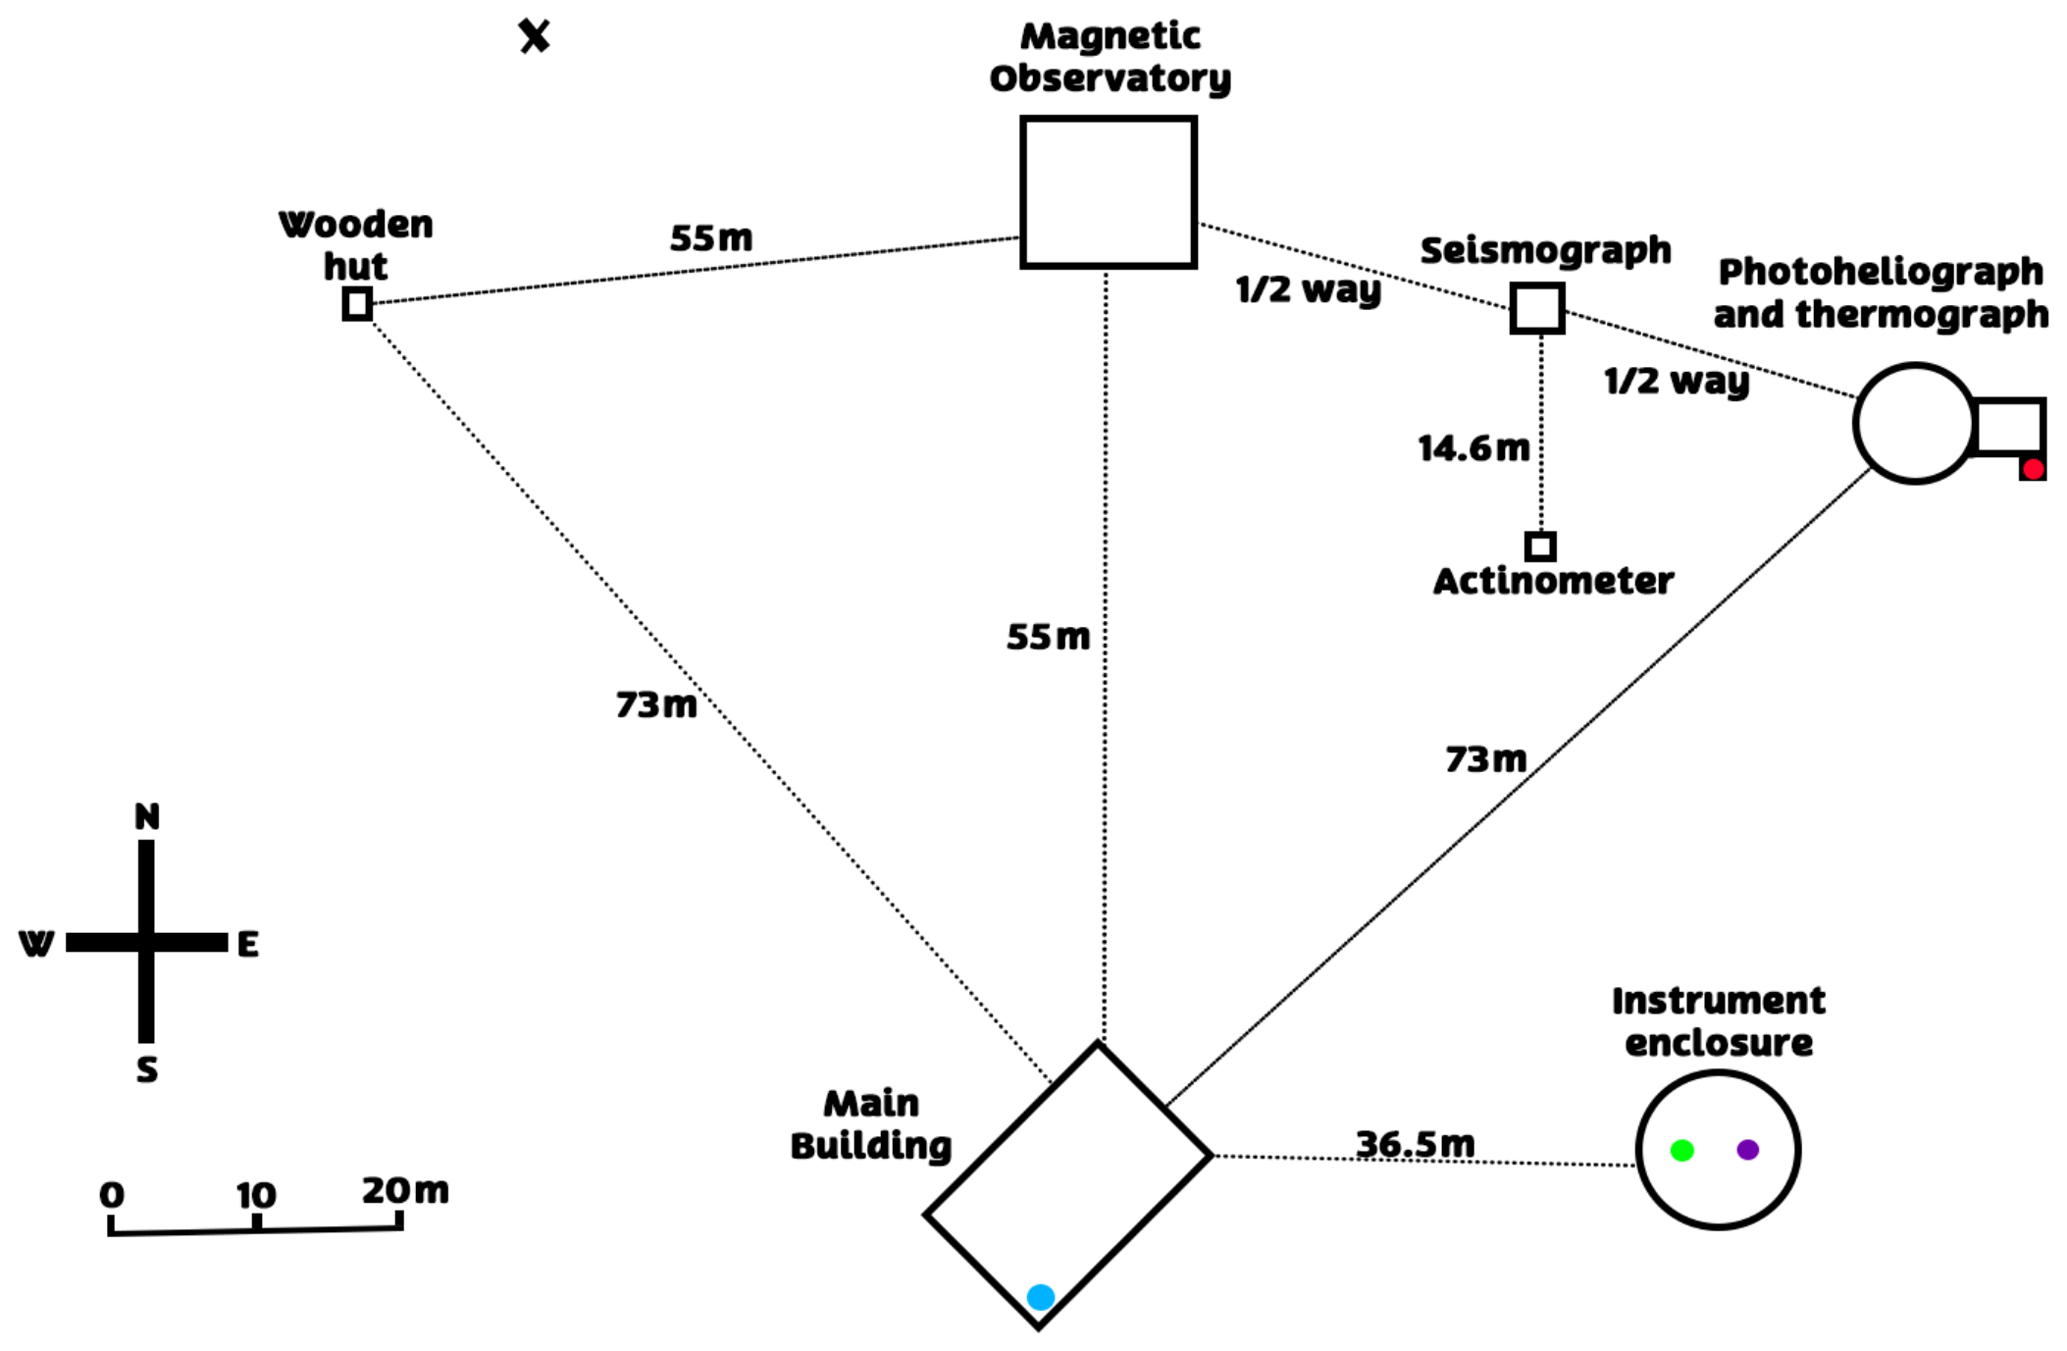
Figure 6Rough sketch based upon the available positional metadata in later blue book entries of the layout of the site. Coloured dots denote the position of the four principal instrument configurations. Light blue – well-ventilated room (main building), green – Stevenson screen (instrument enclosure), purple – hygrometer (instrument enclosure), and red – thermograph (photoheliograph and thermograph building). It is probable that the wooden hut is in the right of the frame in Fig. 4, placing the camera to the NNW of the main building and NE of the wooden hut (marked by X as an approximate estimate). Figure 4 highlights considerable vegetation, but metadata on vegetation positioning and change through time do not exist.
Additional buildings are noted in later blue books as follows:
-
a magnetic observatory constructed in 1874 situated 60 yards (55 m) to the north of the main building measuring 40 ft long and 34 ft wide (12.2 × 10.4 m);
-
a small wooden building built in 1875 for absolute magnetic observations situated 80 yards (73 m) to the NW of the main building and 60 yards (55 m) to the west of the magnetic observatory;
-
about midway between the photoheliograph dome and the magnetic observatory is a seismograph room, a wooden building of 12 ft square (3.7 m × 3.7 m) and some 18 ft (5.5 m) high built in 1894; and
-
some 16 yards (14.6 m) to the south of the seismograph room is a small wooden hut erected in 1885 for the Balfour Stewart actinometer.
A sketch of the layout based upon this information is provided in Fig. 6, which also denotes the assumed approximate location of the photo given in Fig. 4. It is apparent from this sketch that built infrastructure other than that in which the instrumentation was variously housed is unlikely to have had a substantial material effect on any of the measurement series.
From the metadata contained in the 1900 blue book, which contain specific dates of commencement for the Stevenson-screen-based measurements, in combination with the data being reported in each set of year books and blue books, the following timeline can be deduced (and is further summarized in Fig. 10): (i) the measurements in the principal control room (well-ventilated room) in the main building commenced in 1875 and until the installation of the thermograph (timing uncertain) were considered the principal measurement series; (ii) on 1 February 1883 the Stevenson screen was installed; (iii) tentatively, the thermograph started being explicitly used in reports from 1891, although the 1884 blue book talks about temperatures being measured by photography, implying the thermograph may have been in use at that time (note that metadata in the early blue books extend to one page, whereas later editions extend to 10 or more pages), and the 1887 annual report alludes to new thermometers being sourced for the thermograph. However, the 1888 annual report specifically states that the principal temperature records given relate to the well-ventilated-room-based measurements. The thermograph had a maximum and minimum thermometer added on 16 June 1900, and (iv) the hygrometer-screen-based measurements started on 16 August 1891, although there is some doubt on this timing as a set of annual hygrometer-screen-based measurements (screen type unstated) is given in the 1890 blue book report (see Sect. 3).
There are several allusions to other instrumentation scattered throughout the various reports. The 1887 annual report mentions a cage on the lawn being distinct from the Stevenson screen, but in the annual average measuring almost identical temperatures. Extreme daily values are reported for each month for the cage and the well-ventilated-room-based measurement in that report, but not the monthly averages. The only monthly averages reported arise from the thermograph. The cage is mentioned again in the 1888 annual report and then once again in the 1894 report, but not thereafter. For an unspecified period of time starting in April 1892 an experiment with the Stevenson screens was undertaken. Two additional screens were erected – one at 6.5 ft (19.5 m) high and the other of larger dimensions as laid out on p. 4 of the 1892 annual report (2 ft 4 in long, 15 in broad and 2 ft 10 in high – 71 cm × 38 cm × 86 cm), also set at 4 ft (1.2 m) high and compared to the long-standing Stevenson screen. The fact that the new screen was considered large perhaps points to the long-standing screen being considerably smaller than modern Stevenson screens, which may point to potential housing heating and ventilation issues in comparison to modern equivalent equipment. The difference in dimensions is considerably larger than that documented in a similar experiment (Mawley, 1884; Council of the Royal Meteorological Society, 1884), which also supports an assertion that “standard screens” at the time were smaller than modern screens. Modern “large” or double-width Stevenson screens did not appear until well after the period described in this paper – they were introduced in World War I to allow autographic instruments to be sited alongside conventional thermometry (Burt, 2021). Data from this Stevenson screen exposure experiment were presented in reports only for April to December 1892. It is unclear whether the experiment persisted beyond 1892 or not and, if so, whether the data potentially still remain in another set of reports.
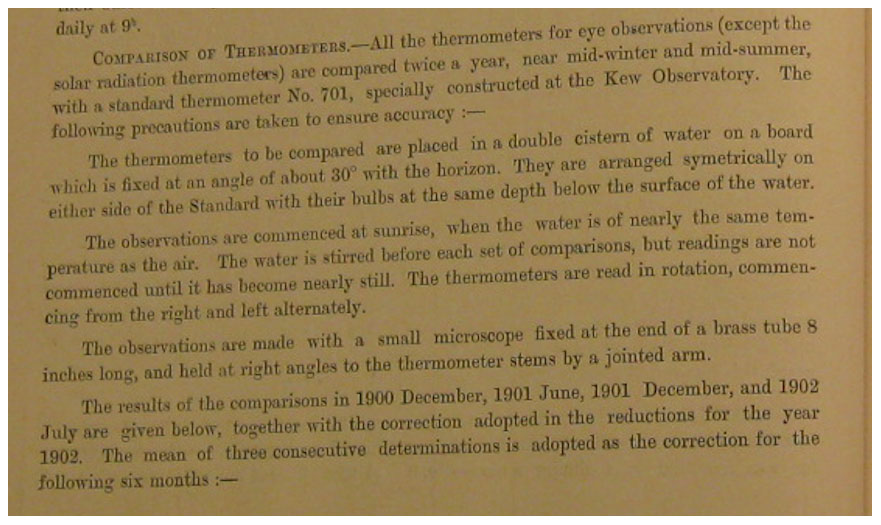
Figure 7Description of the biannual comparison of thermometers in the 1902 blue book imaged by NOAA NCEI, which is then accompanied by a further page of tabulated results pointing to good apparent stability of the instruments and further commentary on ensuring long-term stability of the standard via vicarious calibration against newly shipped thermometers that have been calibrated prior to shipment against the primary standard held at Kew.
Numerous reports point to the use of a suite of primary standard thermometers to perform regular calibration. A Kew standard 107, which had been constructed in 1853, was replaced in 1891 according to the annual report with a standard Kew thermometer no. 701 following cross-characterization of these standards. These standard thermometers were used in the early period monthly and then latterly at least twice a year to calibrate the various instruments, including a number of additional thermometers, which were used to calibrate a range of other instrumentation. Such careful calibration ensures comparability of instruments. These comparisons are tabulated in the blue book entries from 1901 onwards but are not reported prior to this. The calibration was quite involved and would have been state-of-the-art at the time (Fig. 7). The adjustments were applied to the reported series such that any differences in the annual reports relate principally to siting, radiation shielding, or observational practices such as times of observation. The 1903 blue book report discusses comparison with a new standard sent from Kew. Various reports mention this series of Kew standards also being used to characterize a range of additional thermometers on the island and on passing ships.
The 1901 blue book, starting on page xxc (30) and running over some seven pages, includes a significant analysis related to shortcomings of the maximum thermometer installed in the thermograph. An in-depth tabular comparison is shown that was too substantial to digitize in the current work. Results for the thermograph maximum temperatures over June 1900 to August 1901 should be accordingly treated with a degree of caution. Some of the issue appears to relate to the initial choice to position the thermometers horizontally instead of vertically.
It is somewhat unclear what happened after the cessation of the parallel measurement programme or why the programme was ceased, although reports leading up to 1903 increasingly lament the poor wages, the challenges of reaching the observatory, working conditions, and the rates of sickness, which seemingly increased sharply. The 1904 and 1905 blue book meteorological reports state unequivocally that “Observations of air and evaporation temperature in the Principal Computing Room, and in a Stevenson screen on the lawn, were discontinued on 1903 December 31”, implying that the thermograph was retained as it is this instrument that continues to be described in the metadata descriptive front matter. Other sources suggest that the operational measurements switched to being made using a Stevenson screen in a dedicated meteorological plot at the RAO in 1903. If so, it is unclear where these reports were filed or whether this Stevenson screen is the same screen as that used in the long-running intercomparison or a new screen was commissioned and whether the “dedicated plot” was the same enclosure. Reports from 1904 onwards from a non-exhaustive review consistently mention only one set of temperatures, so even if parallel measurements continued in some form they are not recorded in the available reports.
The lead author, Samuel Awe, expressed an interest in undertaking data rescue and analysis for his MSc in Climate Change at Maynooth University. The corresponding author, Peter Thorne, pointed him to the holdings that were imaged by NOAA NCEI in the summer of 2012 over a period of about 3 months. Considerable effort had been made by NCEI to index the international meteorological holdings lodged with them and preserved in their physical archives (Fig. 8). Identified records of interest were then imaged to the extent resources permitted, and these images were hosted as tar files at ftp://ftp.ncdc.noaa.gov/pub/data/globaldatabank/daily/stage0/FDL/ (last access: 20 September 2021). To date, little to no exploitation of these images has occurred, and it is unclear to what extent the imaged data represent data already digitized or which remain to be digitized. The holdings inventory has yet to be integrated fully into the WMO Data Rescue database to our knowledge at this time.

Figure 8Photo of a subset of the six rows of international hard-copy holdings held in the basement of NCEI that were fully indexed and a small subset of which was imaged in 2012. The inventory and imaged subset can be found at ftp://ftp.ncdc.noaa.gov/pub/data/globaldatabank/daily/stage0/FDL/.
The original aim of the research was to identify a set of holdings, which may extend the data record in a remote location of the globe, to provide the largest possible increment to our understanding of historical climate change from a Masters thesis. Via cross-checking with the ISTI databank (Rennie et al., 2014) and the then secured holdings of the Copernicus Climate Change Service Global Land and Marine Observations Database contract, it was identified that the early holdings at Mauritius imaged by NCEI were either entirely undigitized or yet to be integrated into these holdings (at any of monthly, daily, or synoptic resolutions). Subsequent investigations have highlighted the fact that discontinuous records are included in the CRUTEMv5 product (Osborn et al., 2021). The data contained in these images could therefore have augmented existing digital holdings held by NOAA NCEI, which extended back only to the middle of the 20th century. There are two directories of images for this location that are summarized in Table 1. Both pertain to the Royal Alfred Observatory. The original intent was simply to mine these repositories and digitize relevant meteorological data to extend the data records as far back as possible. The presented reports vary stylistically throughout the period of record. The annual summary reports contain a wealth of metadata, meteorological data, and observations on agricultural production and disease. Additional meteorological parameters include pressure, humidity, wind, and rainfall. More broadly these reports provide very valuable insights in both contemporary science and society on the island at this time. The blue book series are more data-rich and contain many observations with daily- and report-level granularity. Later blue books incorporate additional magnetic observations, and many contain annexes.

Figure 9Example of the annual summary sheets found in the logbooks detailing results for three independent measurement techniques aggregated to monthly averages imaged by NOAA NCEI. Temperatures were reported in Fahrenheit to a precision of 0.1∘. Note that each technique had averages measured from both daily maximum and minimum as well as native measurement resolution (hourly for the thermograph screen and 06:00 and 15:00 LST for the others). There are no obviously available metadata pertaining as to whether maxima and minima were calculated in a consistent manner.
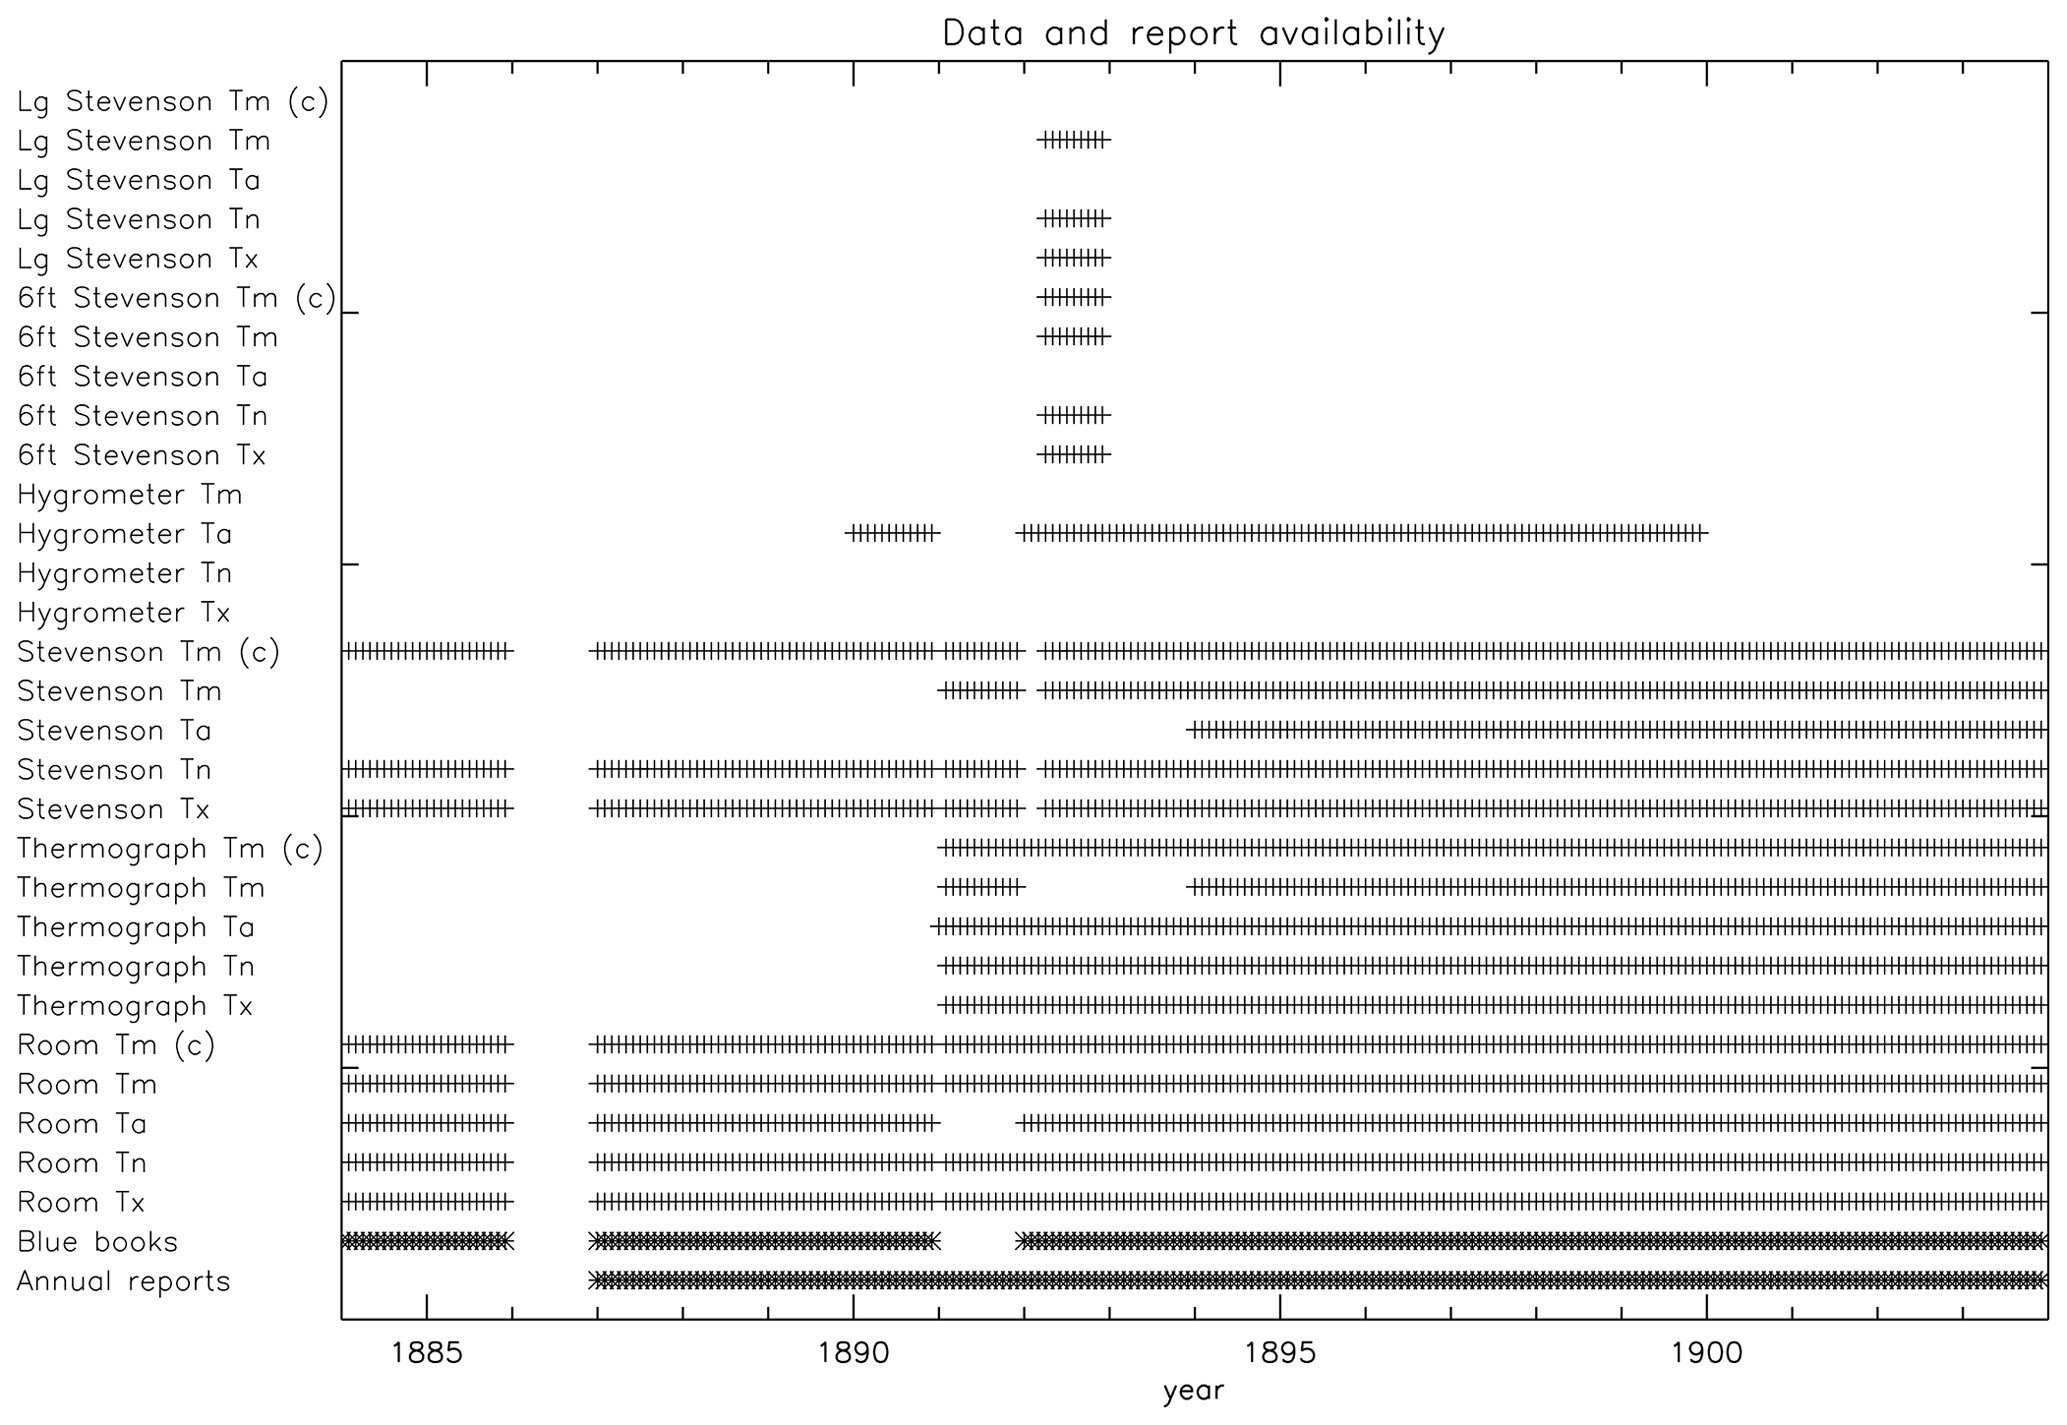
Figure 10Availability summary of reports (bottom two rows) in the form of annual reports from the observatory and so-called “blue book” reports of meteorological as well as magnetic observations, along with monthly reports of temperatures from the various instruments discussed in Sect. 2.2. Tx is maximum temperatures, Tn is minimum temperatures, Ta is the reported averages, and Tm is monthly means from the average of Tx and Tn sometimes reported but also calculated for this study – denoted by (c) upon digitization. There may be additional records also able to further fill gaps herein. Ta is calculated distinctly for the different instruments as follows: room-based 06:00 and 15:00 LST; thermograph 24-hourly values; Stevenson 06:00 and 15:00 LST; hygrometer 06:00 and 15:00 LST.
As the work progressed the interesting intercomparison of temperature measurement methods was discovered. This led to a reprioritization of the work to concentrate upon this valuable long-term series of parallel measurements. The monthly parallel measurements digitized and analysed herein are contained in annual summary sheets, as shown, for example, in Fig. 9 as well as the blue books. The paper records available in imaged form from NOAA NCEI, supplemented by two absent blue books sourced from the NOAA Foreign Data Library, provide results from the parallel measurements over a combined period of 1884 to 1903 (Fig. 10). Data availability depends upon whether both the annual reports and the blue books were available or just one or the other. The reports start with a period from 1884 to 1889 of parallel measurements solely between the Stevenson screen and the thermometers in the well-ventilated room, but with 1886 missing as neither report type is available (the sole year of such an occurrence). Starting in 1890 the hygrometer in a Stevenson screen begins to be reported, and from 1891 the thermograph temperature measurements appear in the reports. Thermograph, Stevenson screen, and well-ventilated-room-based measurements then continue through the end of 1903. The Stevenson screen experiment measurements make a brief appearance in 1893. The report format varies through time. What is tabulated varies by instrument and year, with the thermograph records generally containing the most data. Some instruments are only ever recorded as monthly summaries. Temperatures were digitized in the originally reported Fahrenheit scale and subsequently converted to Celsius as part of the analysis. All monthly resolution intercomparison data were digitized by Samuel O. Awe and Peter W. Thorne and are available at https://doi.org/10.1594/PANGAEA.935684 (Thorne, 2021a, original units) and https://doi.org/10.1594/PANGAEA.935683 (Thorne, 2021b, converted to Celsius).
4.1 Maximum and minimum temperatures
Maximum and minimum temperatures (Tx and Tn, respectively, henceforth) are available for a substantive period of overlap across the three principal measurement series (Fig. 10). Were the blue books to be available from other sources for 1886 it is very likely that almost 20 years of continuous records could be reconstructed for the well-ventilated-room-based and Stevenson screen records. Even with this gap there are almost 19 years of records from the well-ventilated room and Stevenson screen and 13 years from the thermograph – more than sufficient to enable a robust comparison of these series.
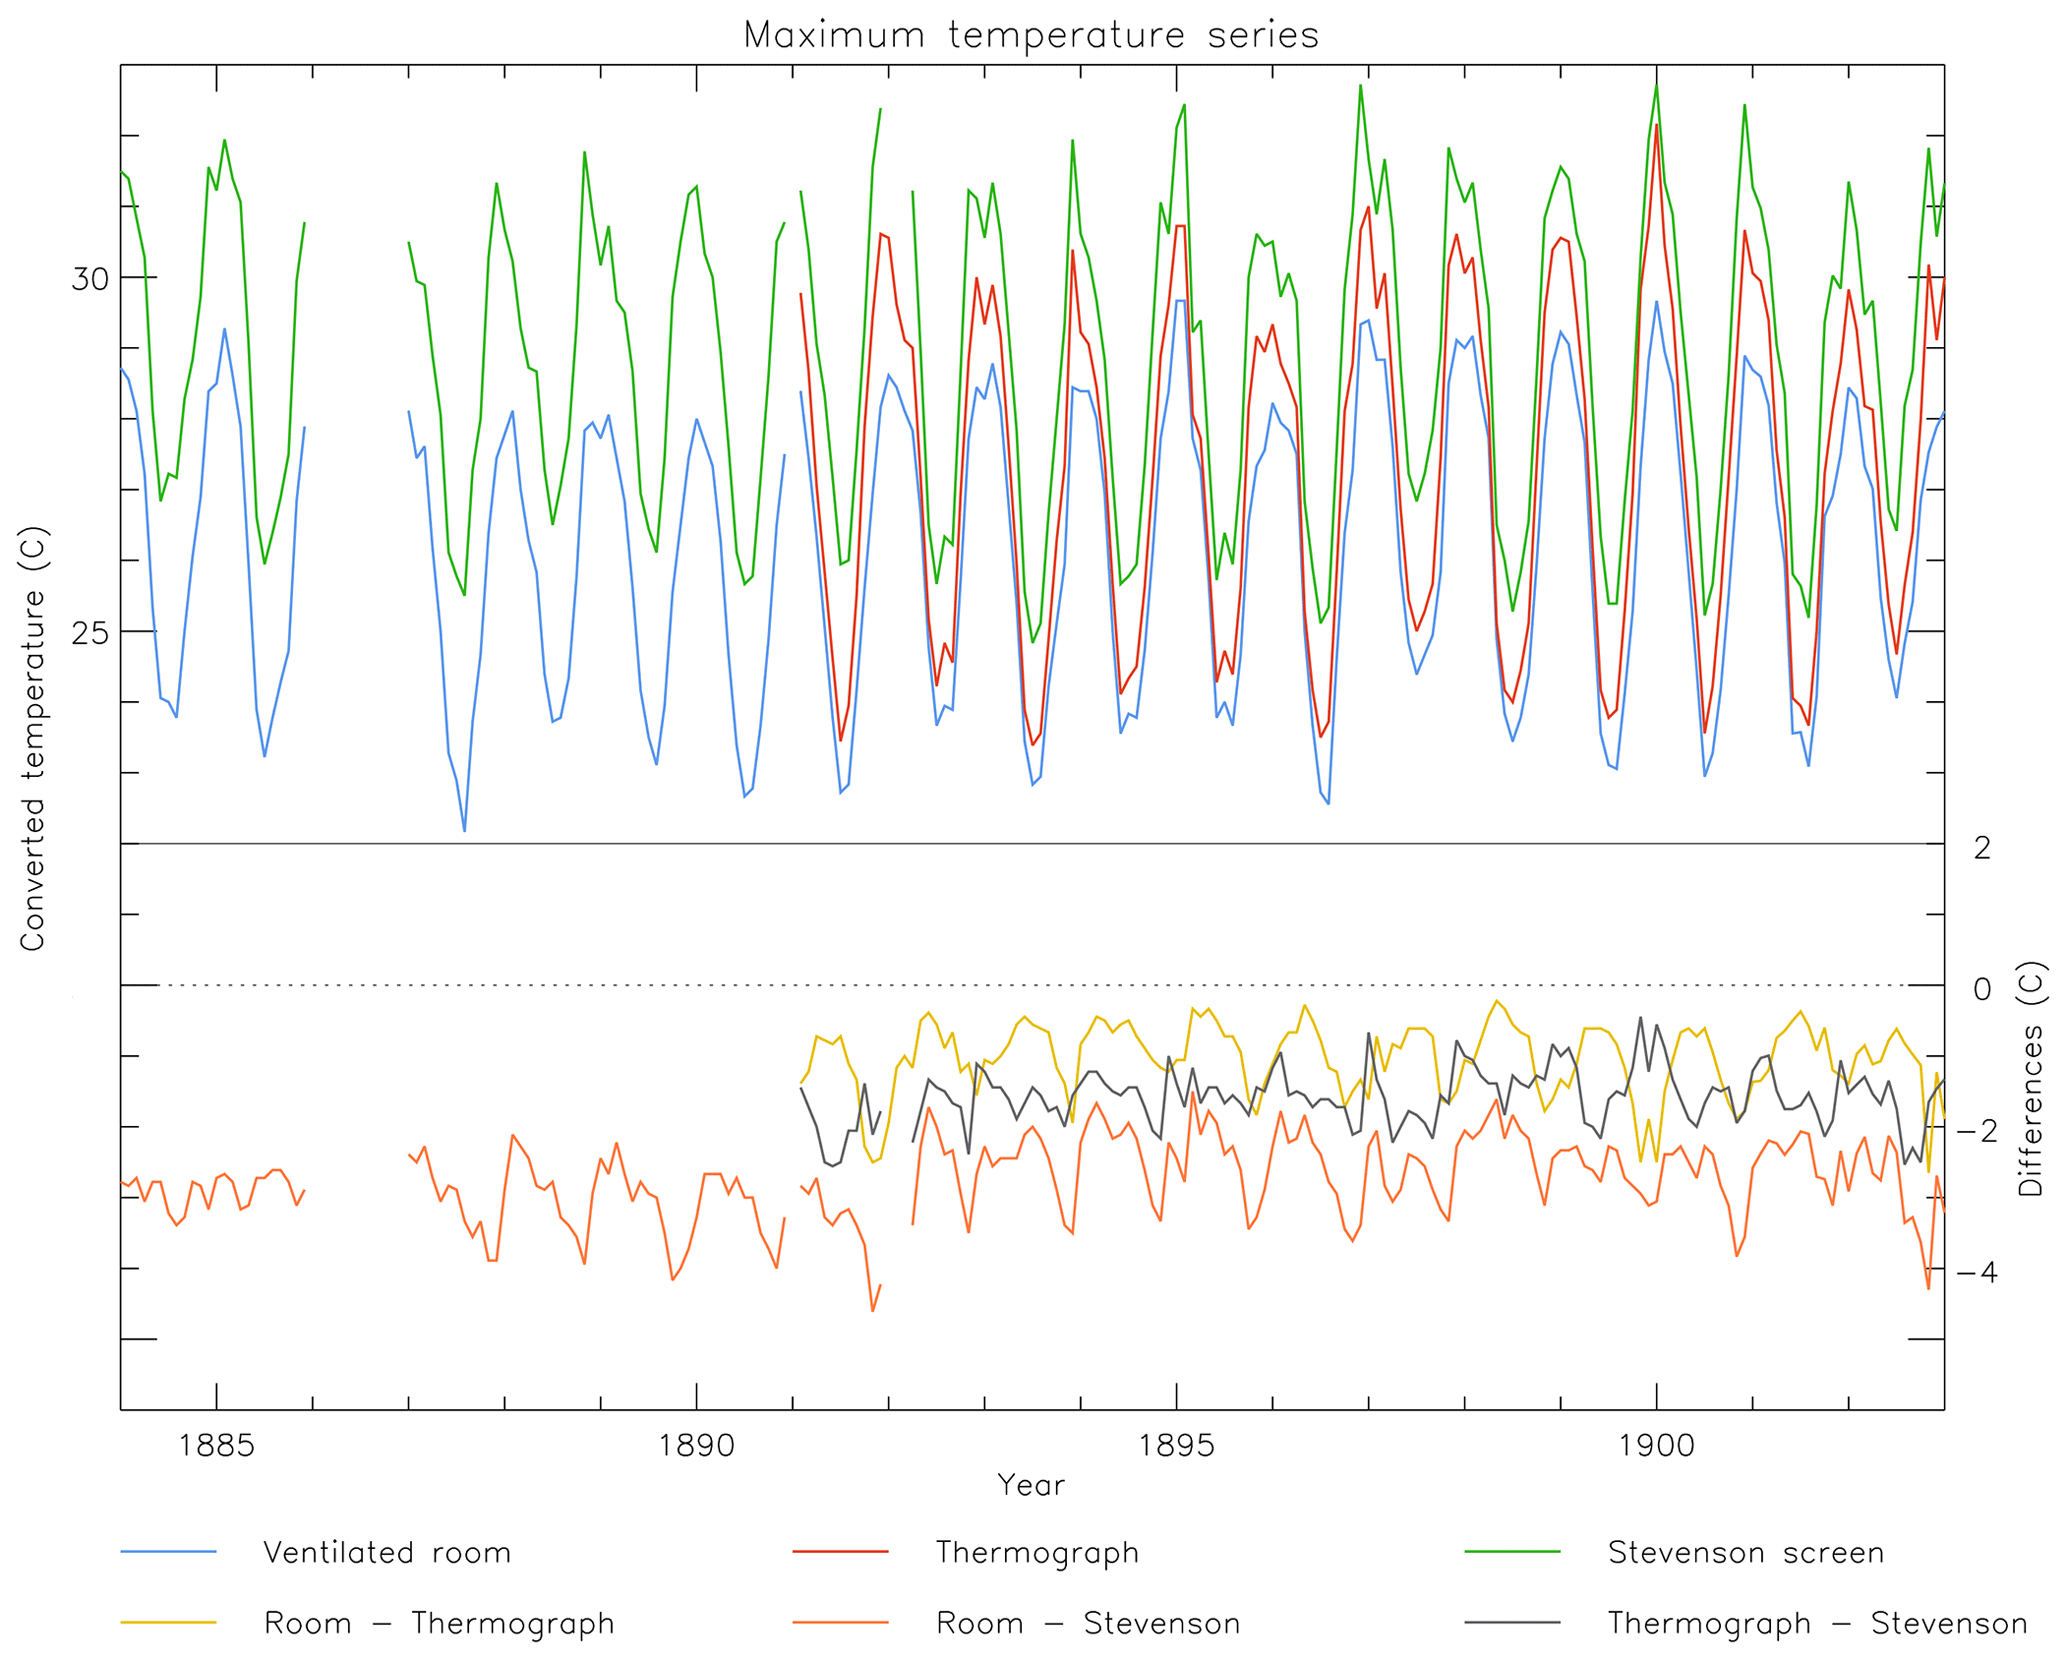
Figure 11Monthly series for maximum temperatures as reported in the annual report series over the period of parallel measurements (1884–1903) from the three principal instrument series. The lower panel shows time series of the offsets between the measurements (in all cases first instrument minus the latter instrument).
The Tx time series are clearly distinct from one another (Fig. 11), with the Stevenson screen reading the warmest and the well-ventilated room the coolest. Differences are substantial, being of the order of 3 ∘C between the well-ventilated room and the Stevenson screen, with the thermograph about half-way between once it becomes available. The differences are broadly stable throughout the period of record, with the exception of the well-ventilated room–Stevenson screen series, which appears to have a relatively small step change associated with the break in data availability in early 1892 (just after the thermograph series appears), and also a marked change in seasonality of the difference series between 1884–1885 and all subsequent years. The earliest period has effectively no seasonal cycle, whereas subsequent series show a marked seasonality, with differences being the largest in late austral winter–early austral spring. For this change in seasonality in the early record there are only the two instruments available, and, combined with the cursory metadata recorded, it is impossible to ascertain why this shift in behaviour may have occurred. For the shift around 1892, the thermograph (starting in 1891) is also available, permitting a three-way comparison. The room–thermograph series shifts more than the thermograph–Stevenson series and in the same direction as the well-ventilated room–Stevenson series, suggesting that this shift may principally relate to a change in the well-ventilated room measurements. It is possible that the major cyclone of April 1892 that is documented in the reports may have impacted operations, although this event arises in the period when the reports, relative to later volumes, contained scant metadata, and there is no obvious record of the impacts from the material to hand. Overall, the short period, taken together with the temporary break in Stevenson screen measurement series availability, precludes a robust quantification and assignment of the break to one or the other of the well-ventilated room or the Stevenson screen.
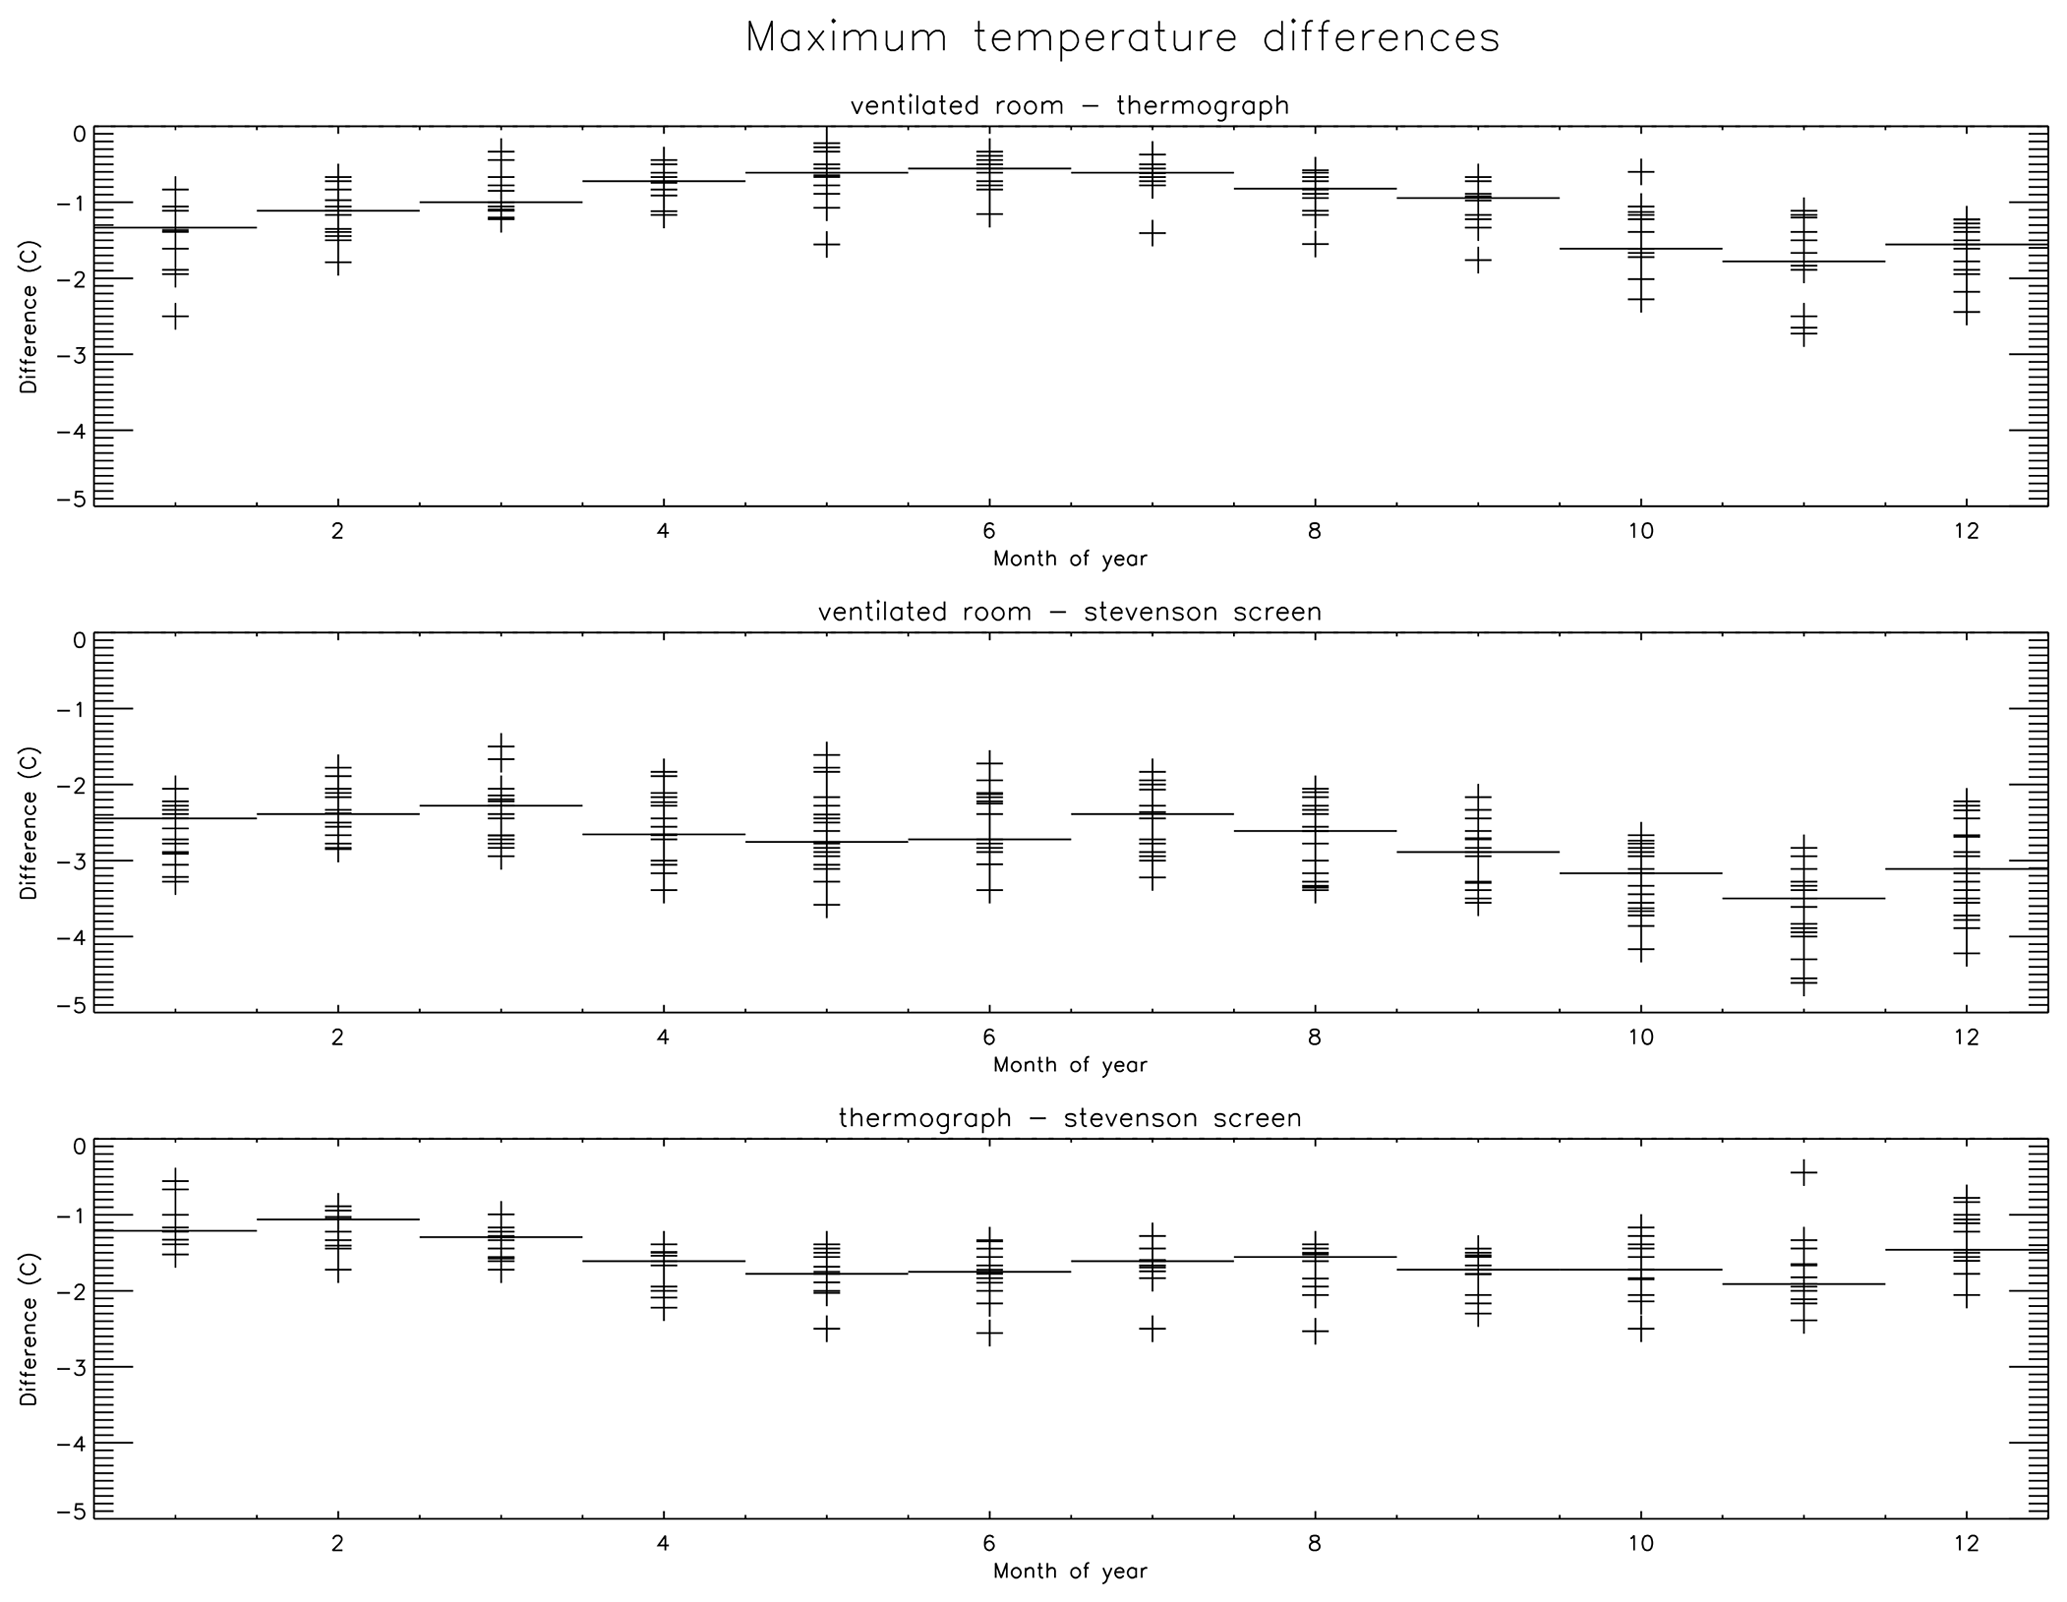
Figure 12Monthly distribution of the differences between the different instrument pairs to the extent each series is available (Figs. 9 and 10). Each individual value is specified by a cross, and the median of all values is denoted by the solid horizontal line for each calendar month. Vertical axes are kept identical between panels for comparison purposes.
Seasonality of the Tx differences (Fig. 12) exhibits a marked annual cycle for the well-ventilated room minus thermograph comparison. The difference in Tx between the well-ventilated room and the thermograph peaks in austral summer and is at a minimum in austral winter. For the two remaining comparisons involving the Stevenson screen there is relatively little obvious structure to the differences. For all months the differences in all comparisons are non-zero distributed. All paired Tx differences are highly significant under a paired t test (Table 2).
Table 2The t-test results for various comparisons using a paired t test. With the exceptions of the calculated averages for the well-ventilated room (06:00 and 15:00 LST) and thermograph (average of 24 h) as well as the Stevenson screen and hygrometer (both 06:00 and 15:00 LST) (both bolded), all remaining comparisons of individual temperature indicators across instruments are highly significant. Also significant are the differences between average temperatures (06:00 and 15:00 LST or 24 h) and mean temperatures (average of Tx and Tn) for the three instruments that report both.

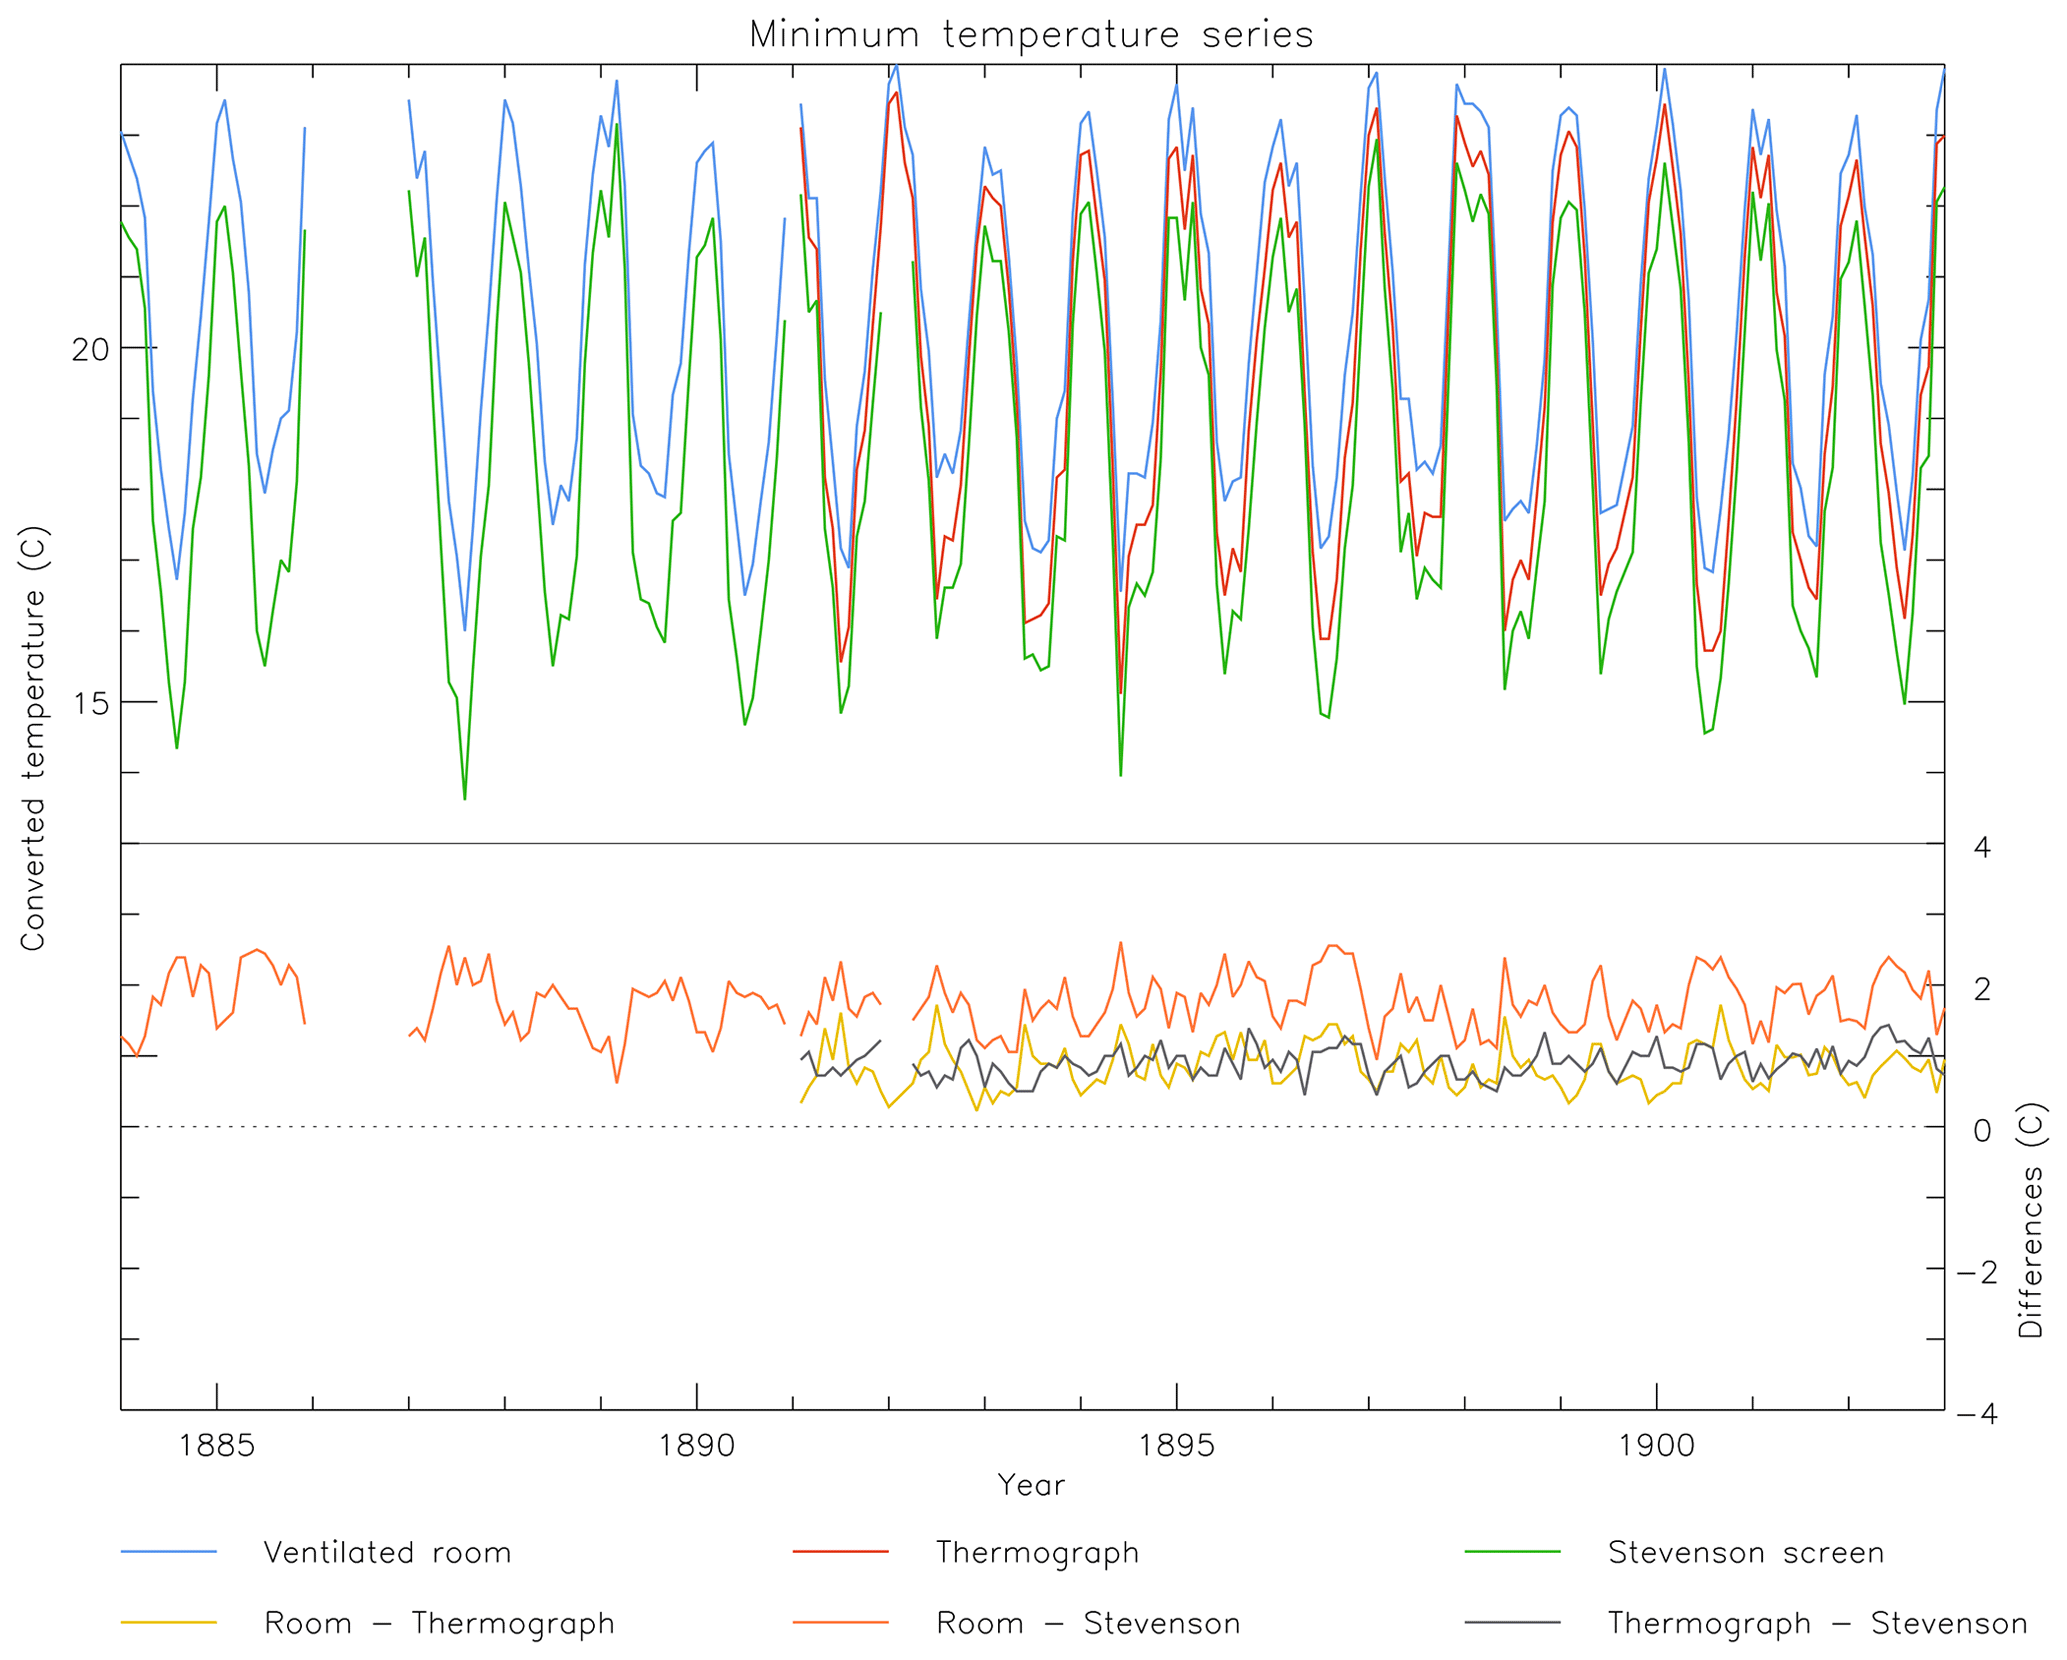
The Tn time series are, again, clearly distinct from one another (Fig. 13), but now with the Stevenson screen reading the coolest and the well-ventilated room the warmest. There are no obvious breaks in the apparent behaviour of the difference series between instruments. The opposite sign of the differences as those for Tx means that differences between instruments in Tx and Tn are much larger than in Tm (Sect. 4.2). This is consistent with the contention in Thorne et al. (2016) that differences will tend to be maximal in Tx, Tn, or their difference (DTR, which is not analysed further here) and smallest in Tm. The Tn series are about 2 ∘C cooler at the Stevenson screen than the well-ventilated room with, again, the two remaining difference series coming in at about half that magnitude.
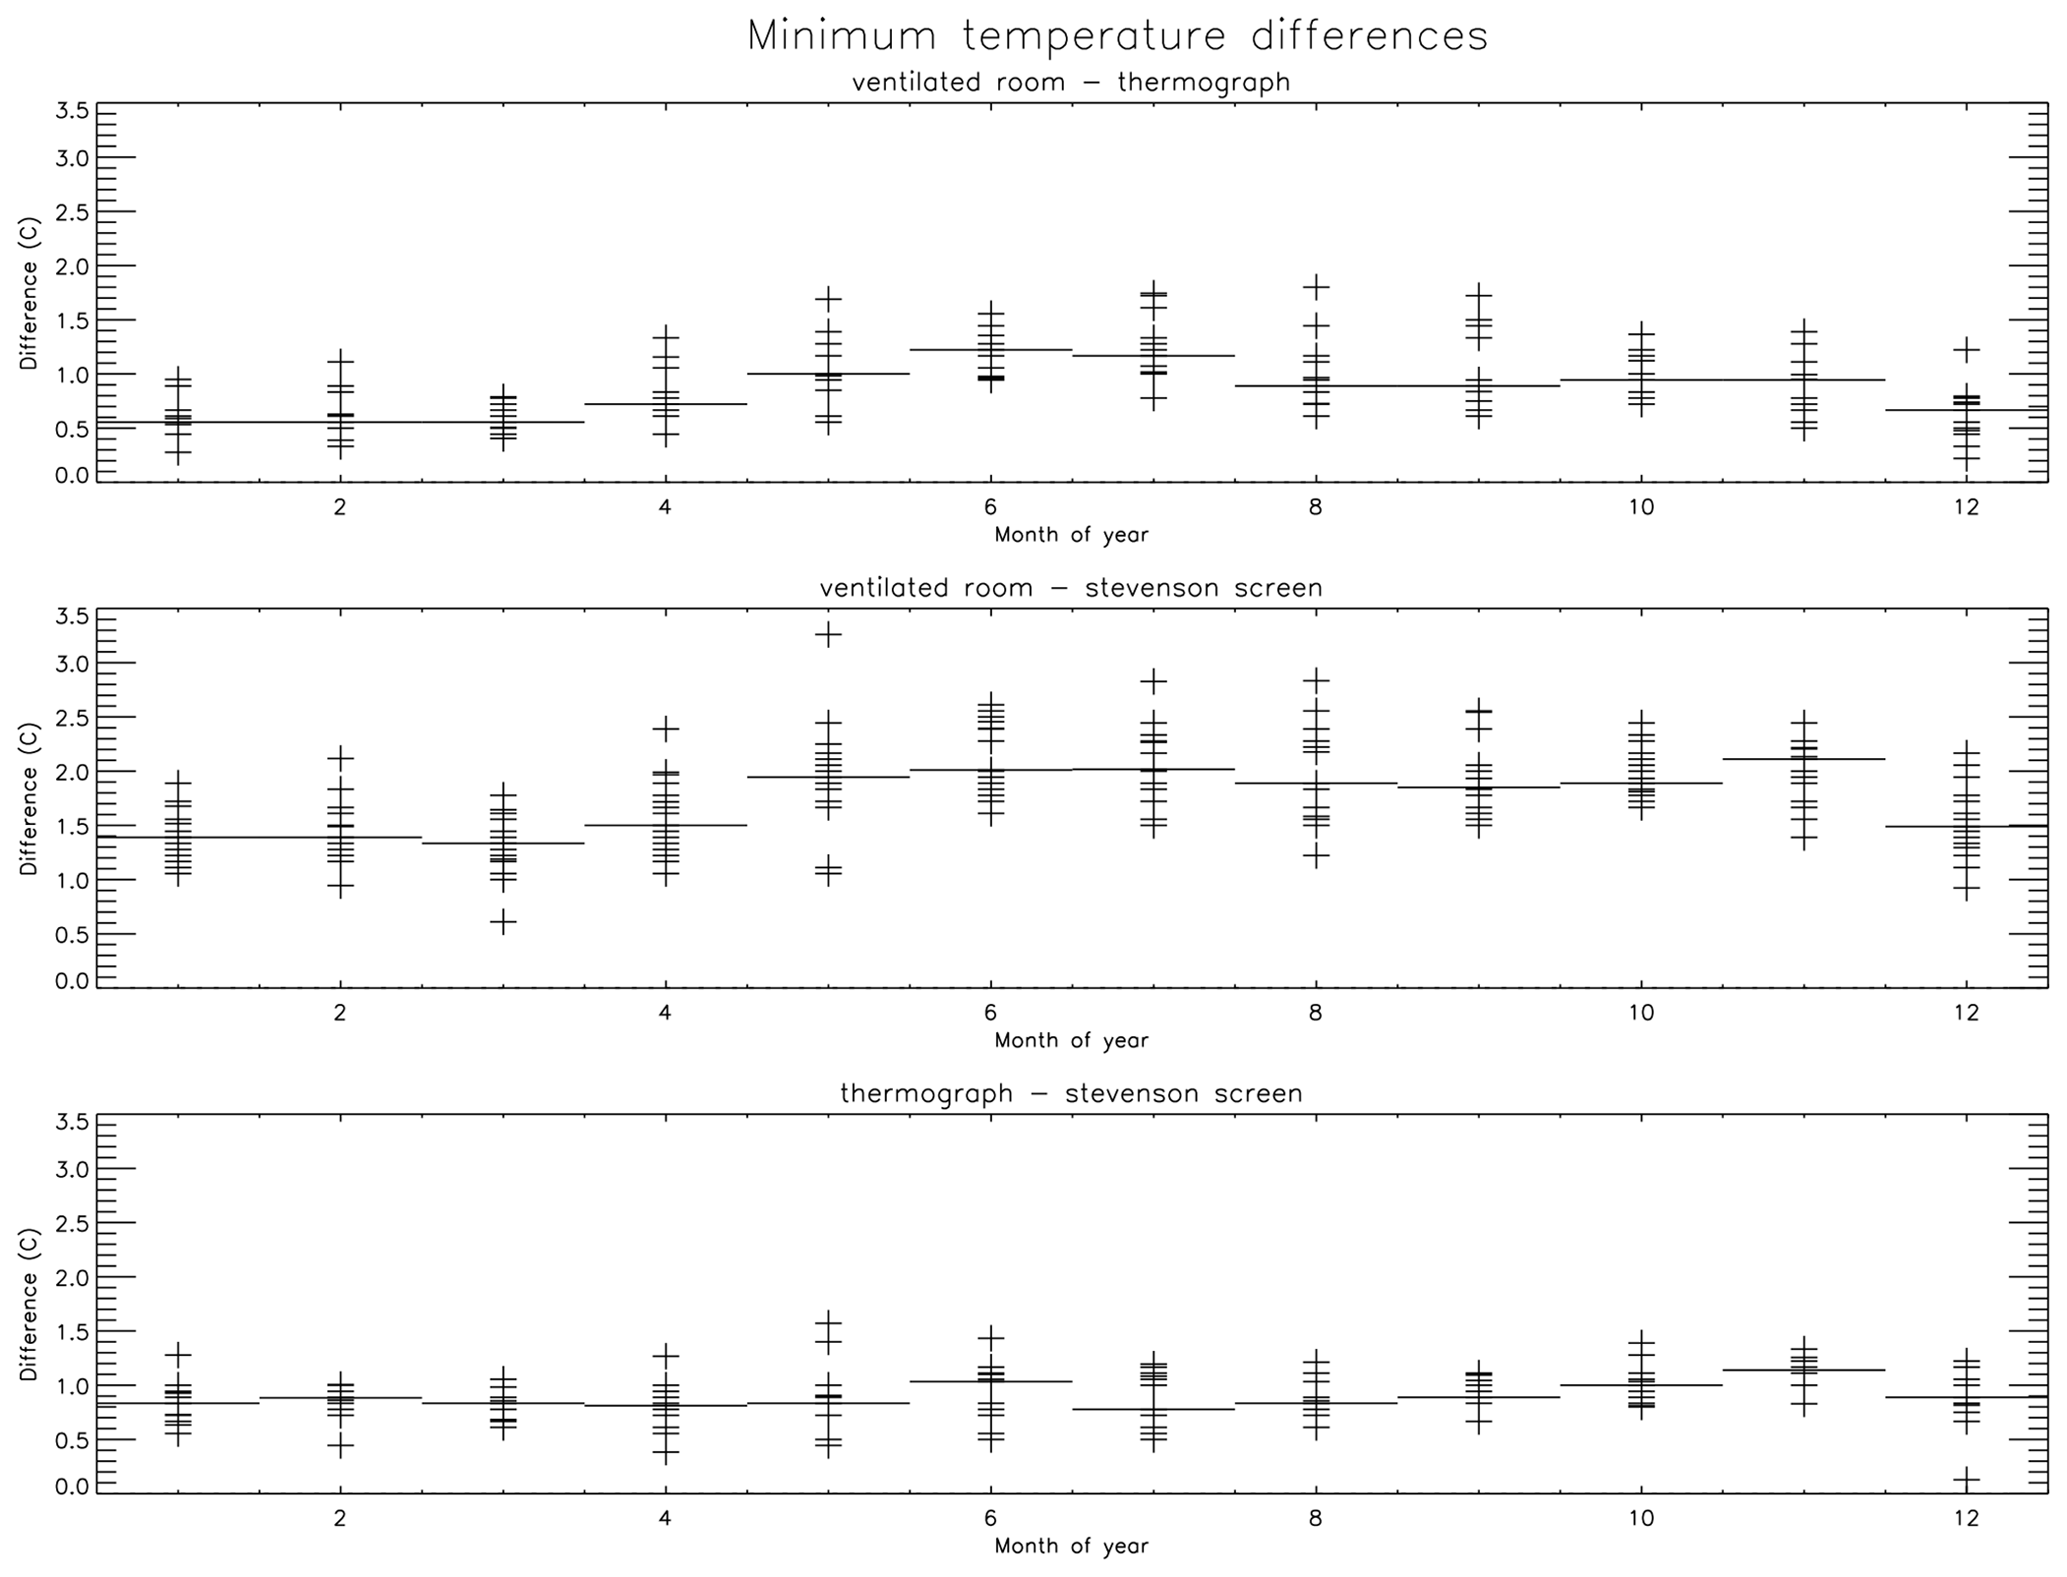
Figure 14As Fig. 12 but for Tn. Axis ranges are identical between panels but differ from those in Fig. 12.
The time series of differences between Tn instrument pairs are less variable than for Tx, as might be expected given the lack of direct solar radiative effects on Tn (compare lower panels of Figs. 11 and 13). Unlike Tx, there is no change in variability after 1884–1885 between the well-ventilated room and the Stevenson screen, implying that this effect solely pertained to daytime measurements. Seasonally, the two Tn difference series with the well-ventilated room show an apparent seasonal cycle in their differences, which are smallest in austral summer and largest in austral winter, whereas the thermograph–Stevenson screen pair exhibits minimal seasonality (Fig. 14). The seasonal cycle is somewhat smaller than that for Tx. Again, for all months the differences are non-zero, and thus all the differences in Tn between the three long-term series are highly significant (Table 2).
4.2 Average temperatures
The “average temperatures” are herein the reported averages, which were preferred as the monthly diagnostic at the time, and are different from the “mean temperatures” (Tx + Tn 2), which is nowadays the standard across much, but by no means all, of the globe (WMO, 2017). Use of the average of a selection of observing hours was standard practice in very many early records (e.g. Camuffo, 2002; Böhm et al., 2010). For the thermograph this is stated in the metadata to be the average of 24 h from 00:00 to 23:00 LST. For all remaining techniques, the average, when explicitly documented, is the mean of 06:00 and 15:00 LST values, even though for the well-ventilated-room-based instrument there is evidence that observations were often taken more frequently. Early metadata until the 1890s are insufficiently detailed to determine absolutely whether the earliest averages from the well-ventilated room were 06:00 and 15:00 LST or departed from this. The Stevenson screen only reported maximum and minimum temperatures until 1894 when average temperatures were also tabulated in the annual reports and documented as arising from 06:00 and 15:00 LST readings. For average temperatures for 1890–1900, albeit discontinuously, there are also reports from the Stevenson-screen-housed hygrometer read at the same times.
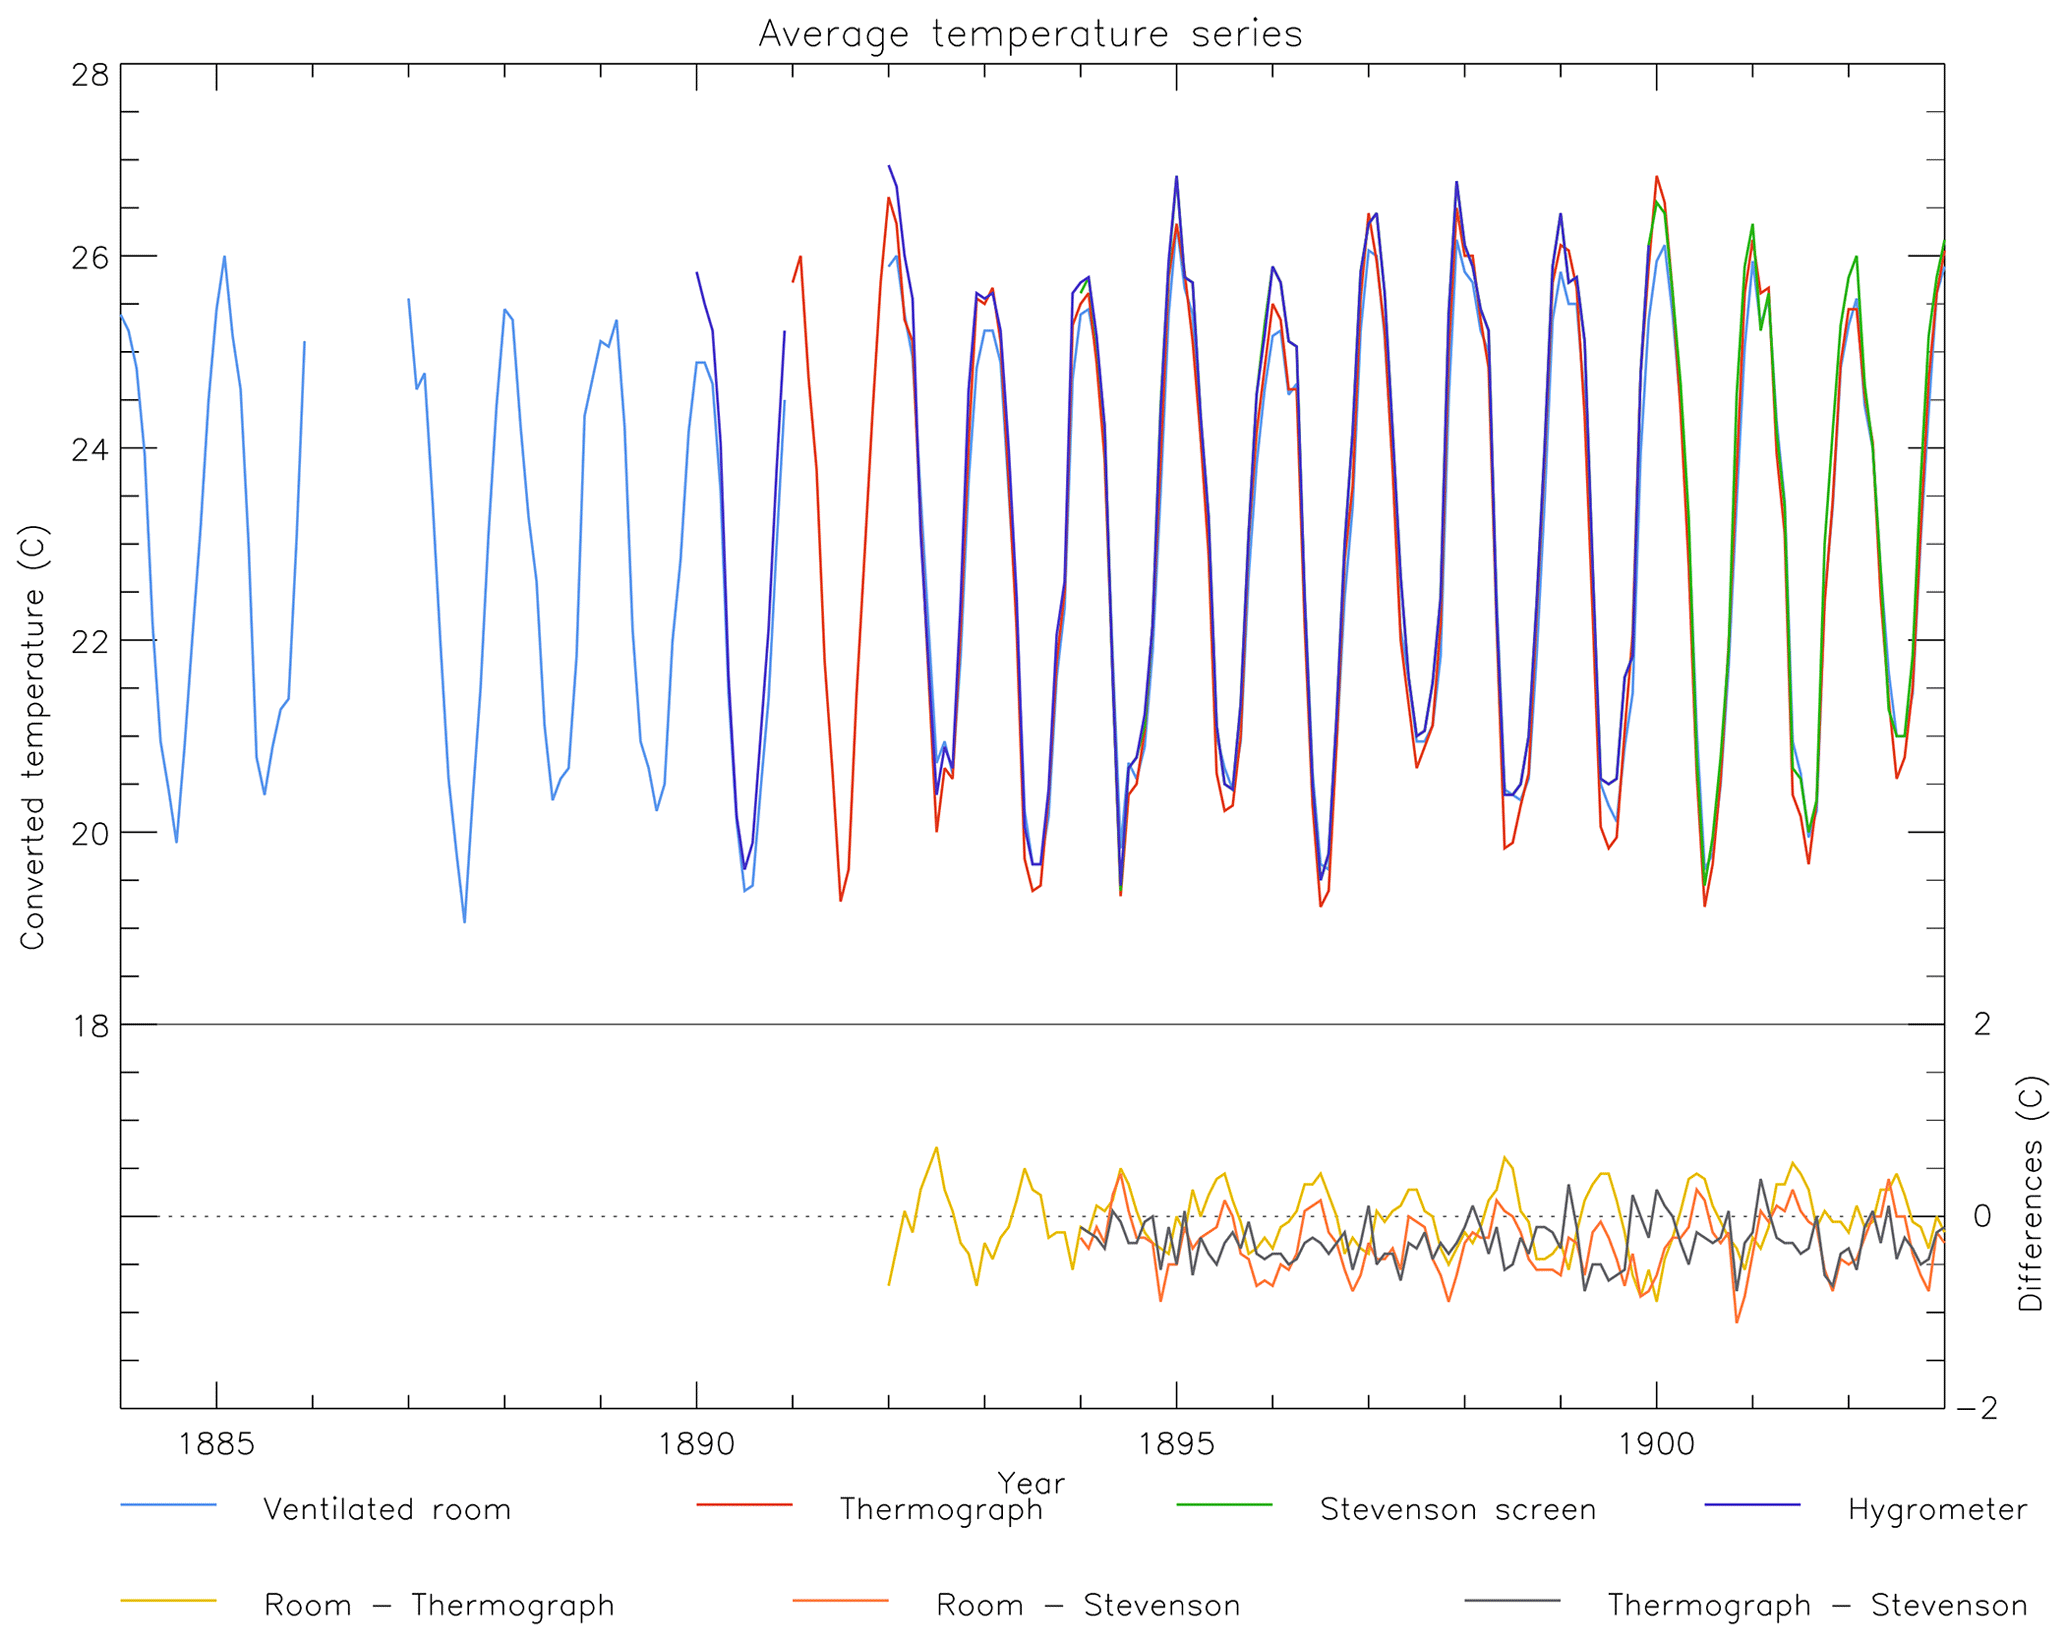
Figure 15As Fig. 11, but for monthly average temperatures (Ta) that extend for longer and are more contiguously available from all four techniques (including the hygrometer). For all techniques except the thermograph, Ta is calculated from the mean of observations at 06:00 and 15:00 LST. For the thermograph it is the mean of the 24-hourly observations. The hygrometer series is relatively short, and it is shown only in the top panel. Significance of differences is assessed in Table 2 for this instrument.
The average temperatures (Ta) series are considerably closer to one another than maximum or minimum temperatures (Fig. 15, see also Figs. 11 and 13). Differences are generally smaller than 1 ∘C. Hygrometer difference series are not shown given the relative brevity of that series and for presentational consistency with other similar figures. Given the similarities between the hygrometer and Stevenson screen series, the difference series would be very small (low variance, almost zero difference) for the Stevenson screen–hygrometer and similar to the shown differences to the Stevenson screen for the two other set-ups. The closeness of Ta series is perhaps unsurprising given that these constituted the primary reporting metric and that, entirely reasonably, it can be implied that efforts may have been made by the observatory staff to maximize the comparability of the different set-ups deployed based upon this metric.
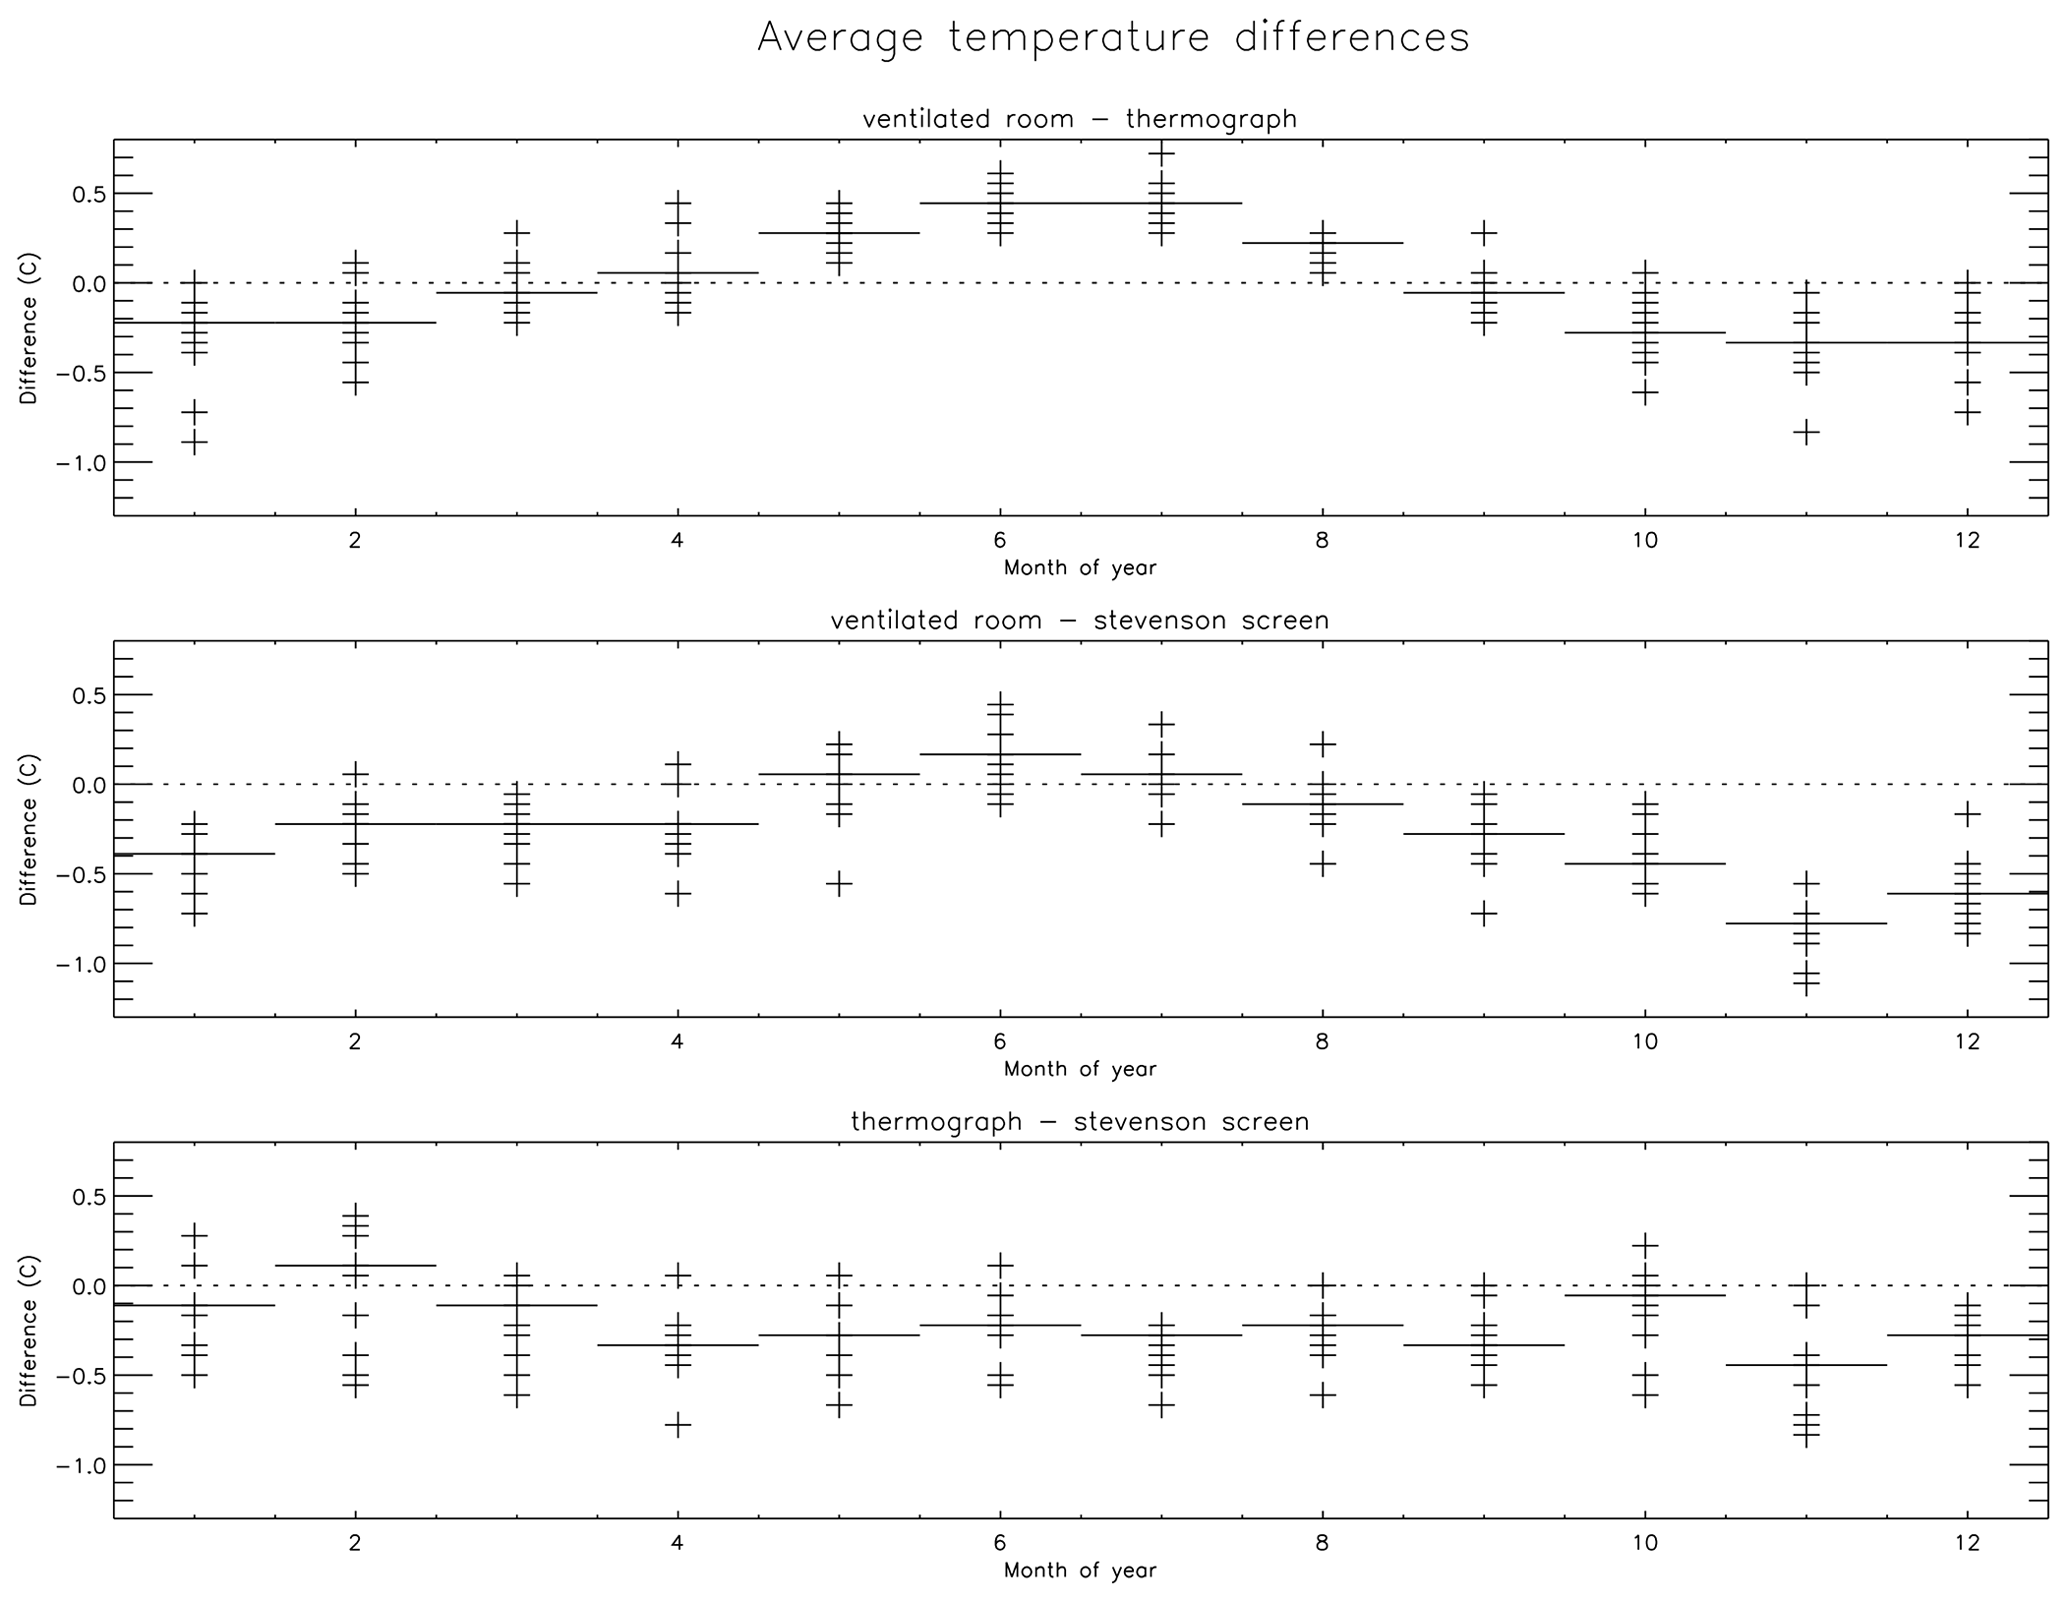
Figure 16As Fig. 12 but for Ta. Axis labels are identical across the three panels but differ from those in Figs. 12 and 14.
There is marked seasonality in the difference series for the well-ventilated room minus thermograph in the lower panel of Fig. 15, which is readily evident in the monthly departures shown in Fig. 16. The average temperatures from the well-ventilated room are warmer than the thermograph in austral winter and cooler in austral summer. The seasonal effect also exists in the well-ventilated room–Stevenson screen pair, although the Stevenson screen is warmer than the well-ventilated room measurements for all except austral mid-winter, and then not consistently so. The thermograph–Stevenson screen differences exhibit little seasonal structure, with the Stevenson screen generally being 0.3 ∘C (0.1–0.5 ∘C) warmer, although purely visually the behaviour in both February and, to a lesser extent, October is distinct from all other months. In February the thermograph records higher temperatures than the Stevenson screen, and in October the mean difference is zero. Given that solar elevation would be similar in these two months, this might point to a physical effect in one or the other of the instruments instead of noise. The well-ventilated room differences for each instrument would suggest that the effect may most plausibly arise from the Stevenson screen as the well-ventilated room–thermograph series varies smoothly, whereas the well-ventilated room–Stevenson screen series similarly shows two peaks in November and February, in which case vegetation shading may be the possible cause given the evidence in Fig. 4 for ample vegetation in the direction of the enclosure (Fig. 6). Later, in 1917, metadata point to RAO getting into trouble with the sanitary inspector for not keeping the garden and grounds in good order, in part because apparently the gardener kept falling ill. Whether these issues existed prior to this is unclear. Regardless, the scientific takeaway here is that the availability of three distinct series shows the value that a multi-way comparison can bring over a two-way comparison, from which differences can be diagnosed but never unpicked.
Formal statistical testing highlights the fact that both the well-ventilated room–thermograph pair and Stevenson screen–hygrometer pair are not statistically different under a paired t test, whereas all other differences are highly significant (Table 2). The Stevenson screen and hygrometer measurements are highly similar to one another, whereas the well-ventilated room–thermograph pair non-significance must arise from the cancellation of relatively large seasonal effects across the annual cycle apparent in Fig. 16.
4.3 Mean temperatures
Mean temperatures (Tm) here are a combination of values directly calculated from Tx and Tn reports and, where available in the reports, directly reported values to maximize the available series duration. Sometimes, for some instruments, only one or the other approach is available. With the exception of the final 3 years, whenever both are available, these are identical within reporting precision. In the final three years the means by which maximum and minimum temperatures were reported changed (no rationale or justification is given), and this leads to a disconnect between the means reported in the annual report and the values inferred from the blue book maximum and minimum temperature reports. The values based upon the blue book are used by preference in the present analysis, but the effect is of the order tenths of a degree Fahrenheit, so the choice should not have a substantial impact upon the present analysis. Mean temperature series are only available for the three long-standing measurement techniques and not the hygrometer, which only ever appeared as Ta and instantaneous temperatures at 06:00 and 15:00 LST.
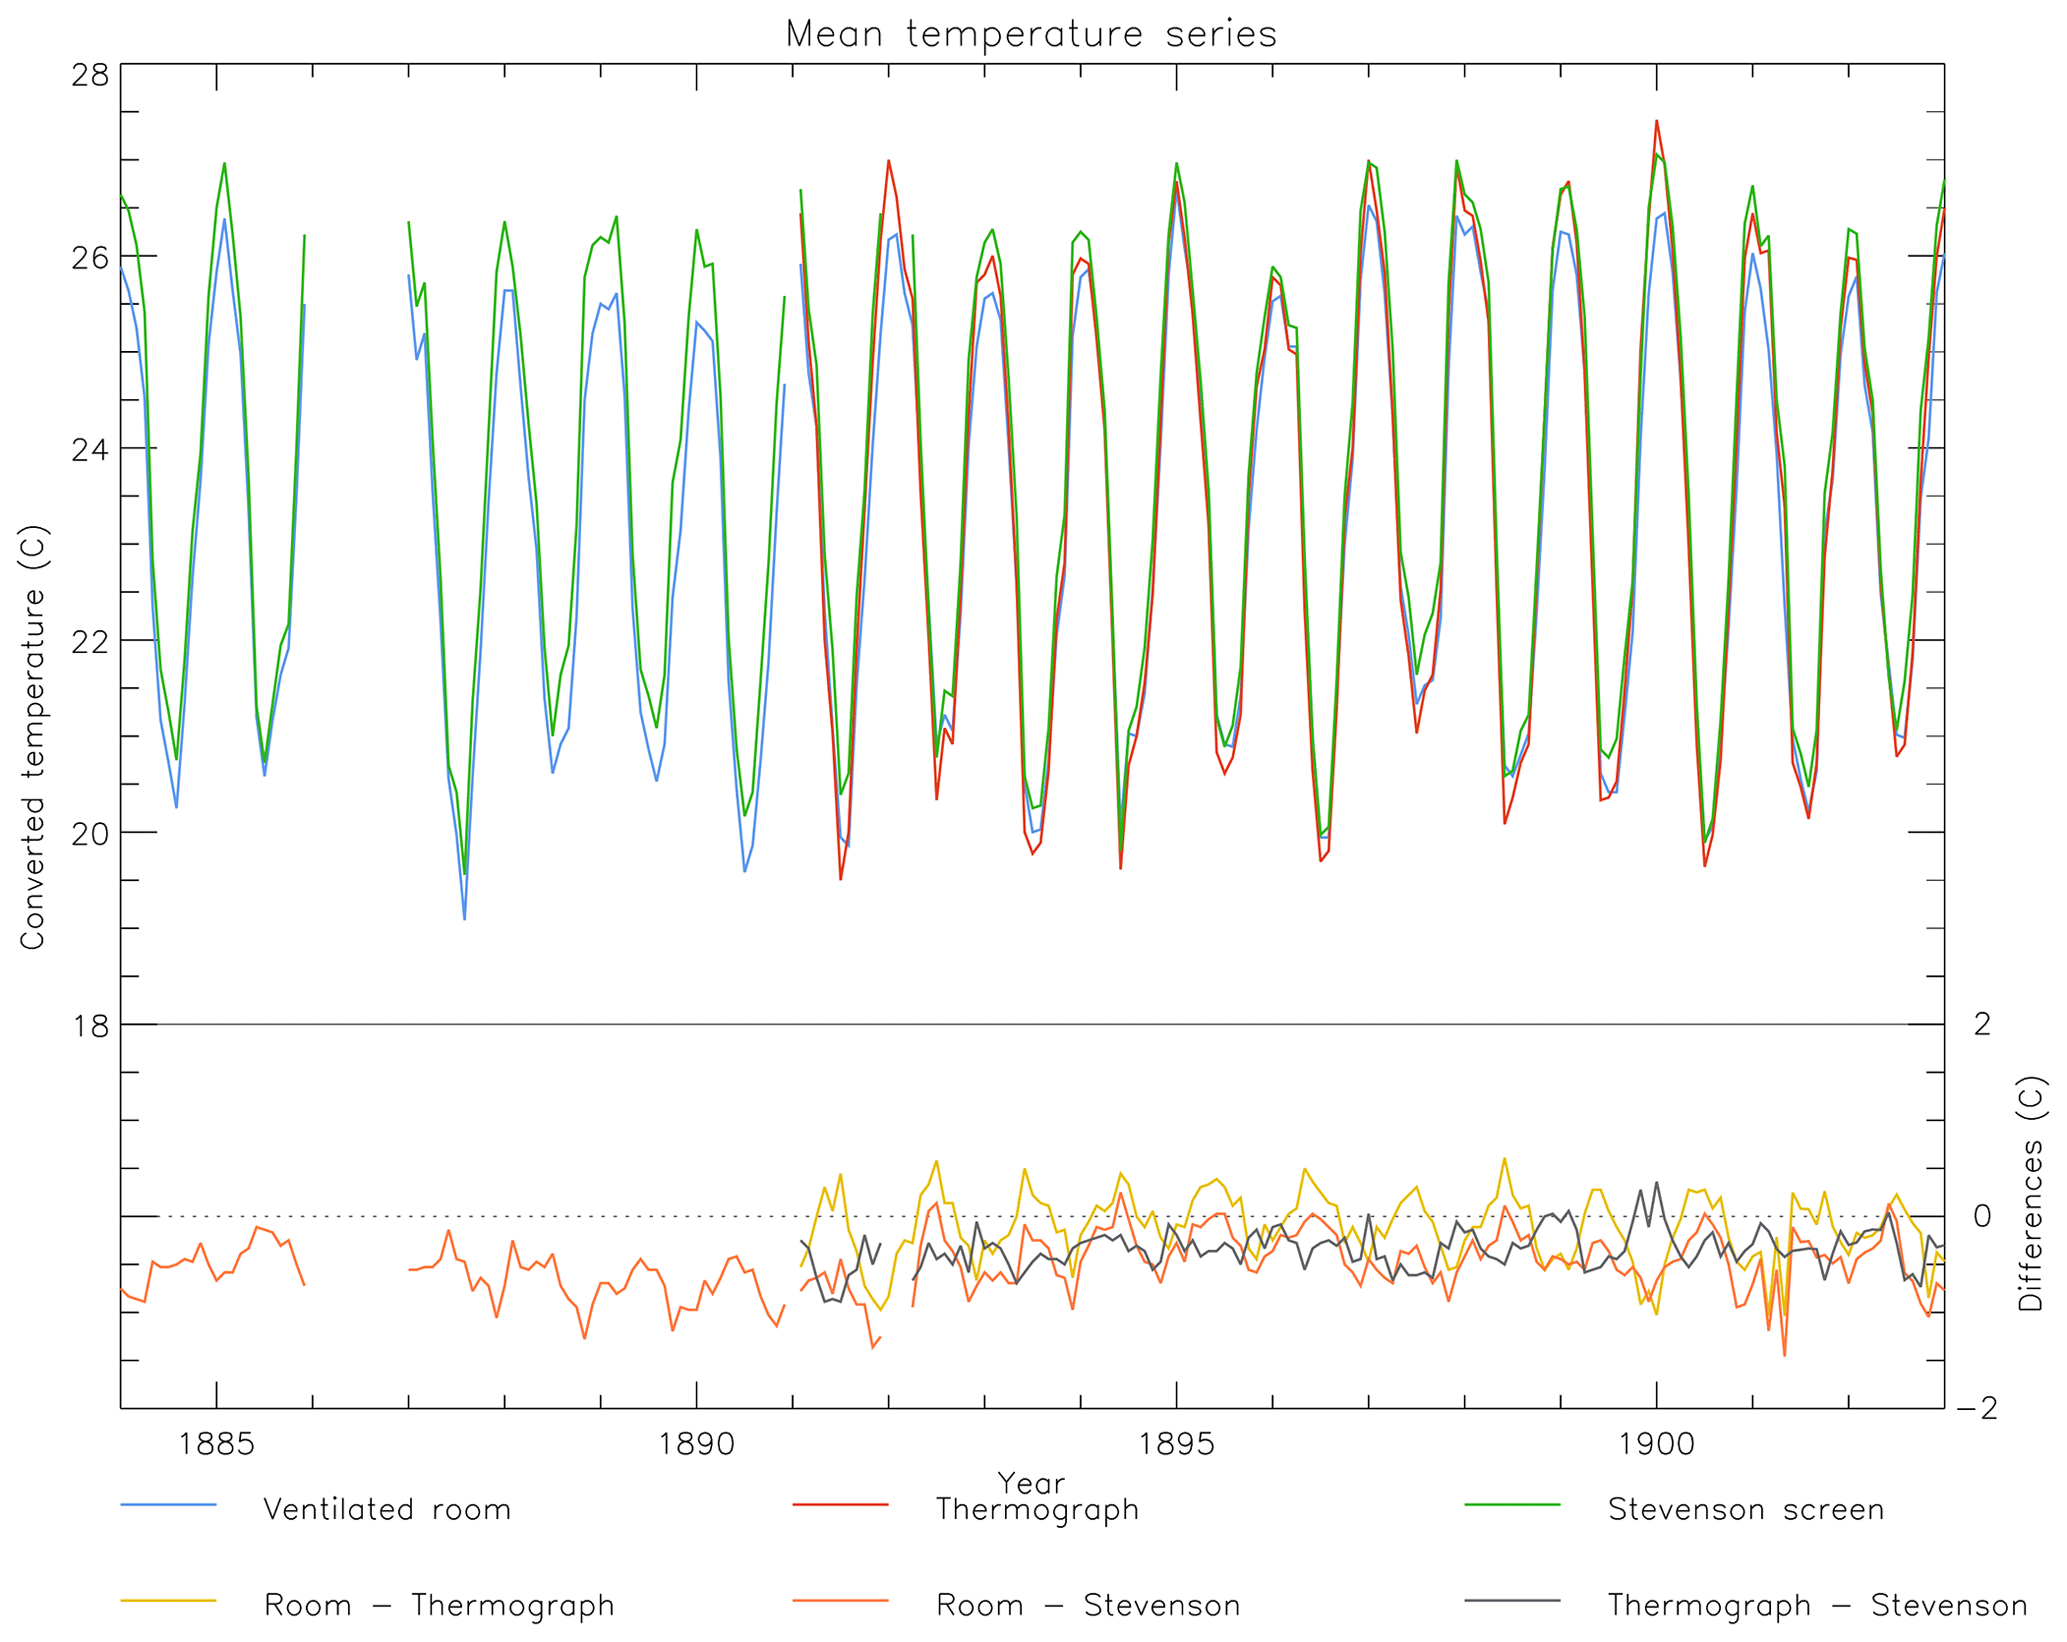
Figure 17As Fig. 11, but for mean temperature (the average of Tx and Tn). To make the record as complete as possible a combination of directly reported and self-calculated estimates has been used. Where both numbers exist they match entirely except for the period 1901–1903 when the method of tabulation of averages changes, introducing a disconnect of the order tenths of a degree Fahrenheit between the series in the blue book and the annual report prior to their conversion here to ∘C.
Mean temperature series are more similar to one another than the underlying Tx and Tn series owing to partial cancellation of marked differences between instruments for Tx and Tn (Fig. 17, see also Figs. 11 and 13). The well-ventilated room series is consistently cooler than remaining series in austral summer, with any differences in austral winter being less obvious. Offsets between the different series are somewhat larger for Tm than for Ta (lower panel of Fig. 17, see also Fig. 15) but are still generally within 1 ∘C. The well-ventilated room–Stevenson screen pair carries through, with reduced magnitude, the apparent break in series behaviour in 1892 in Tx that is assessed in Sect. 4.1.
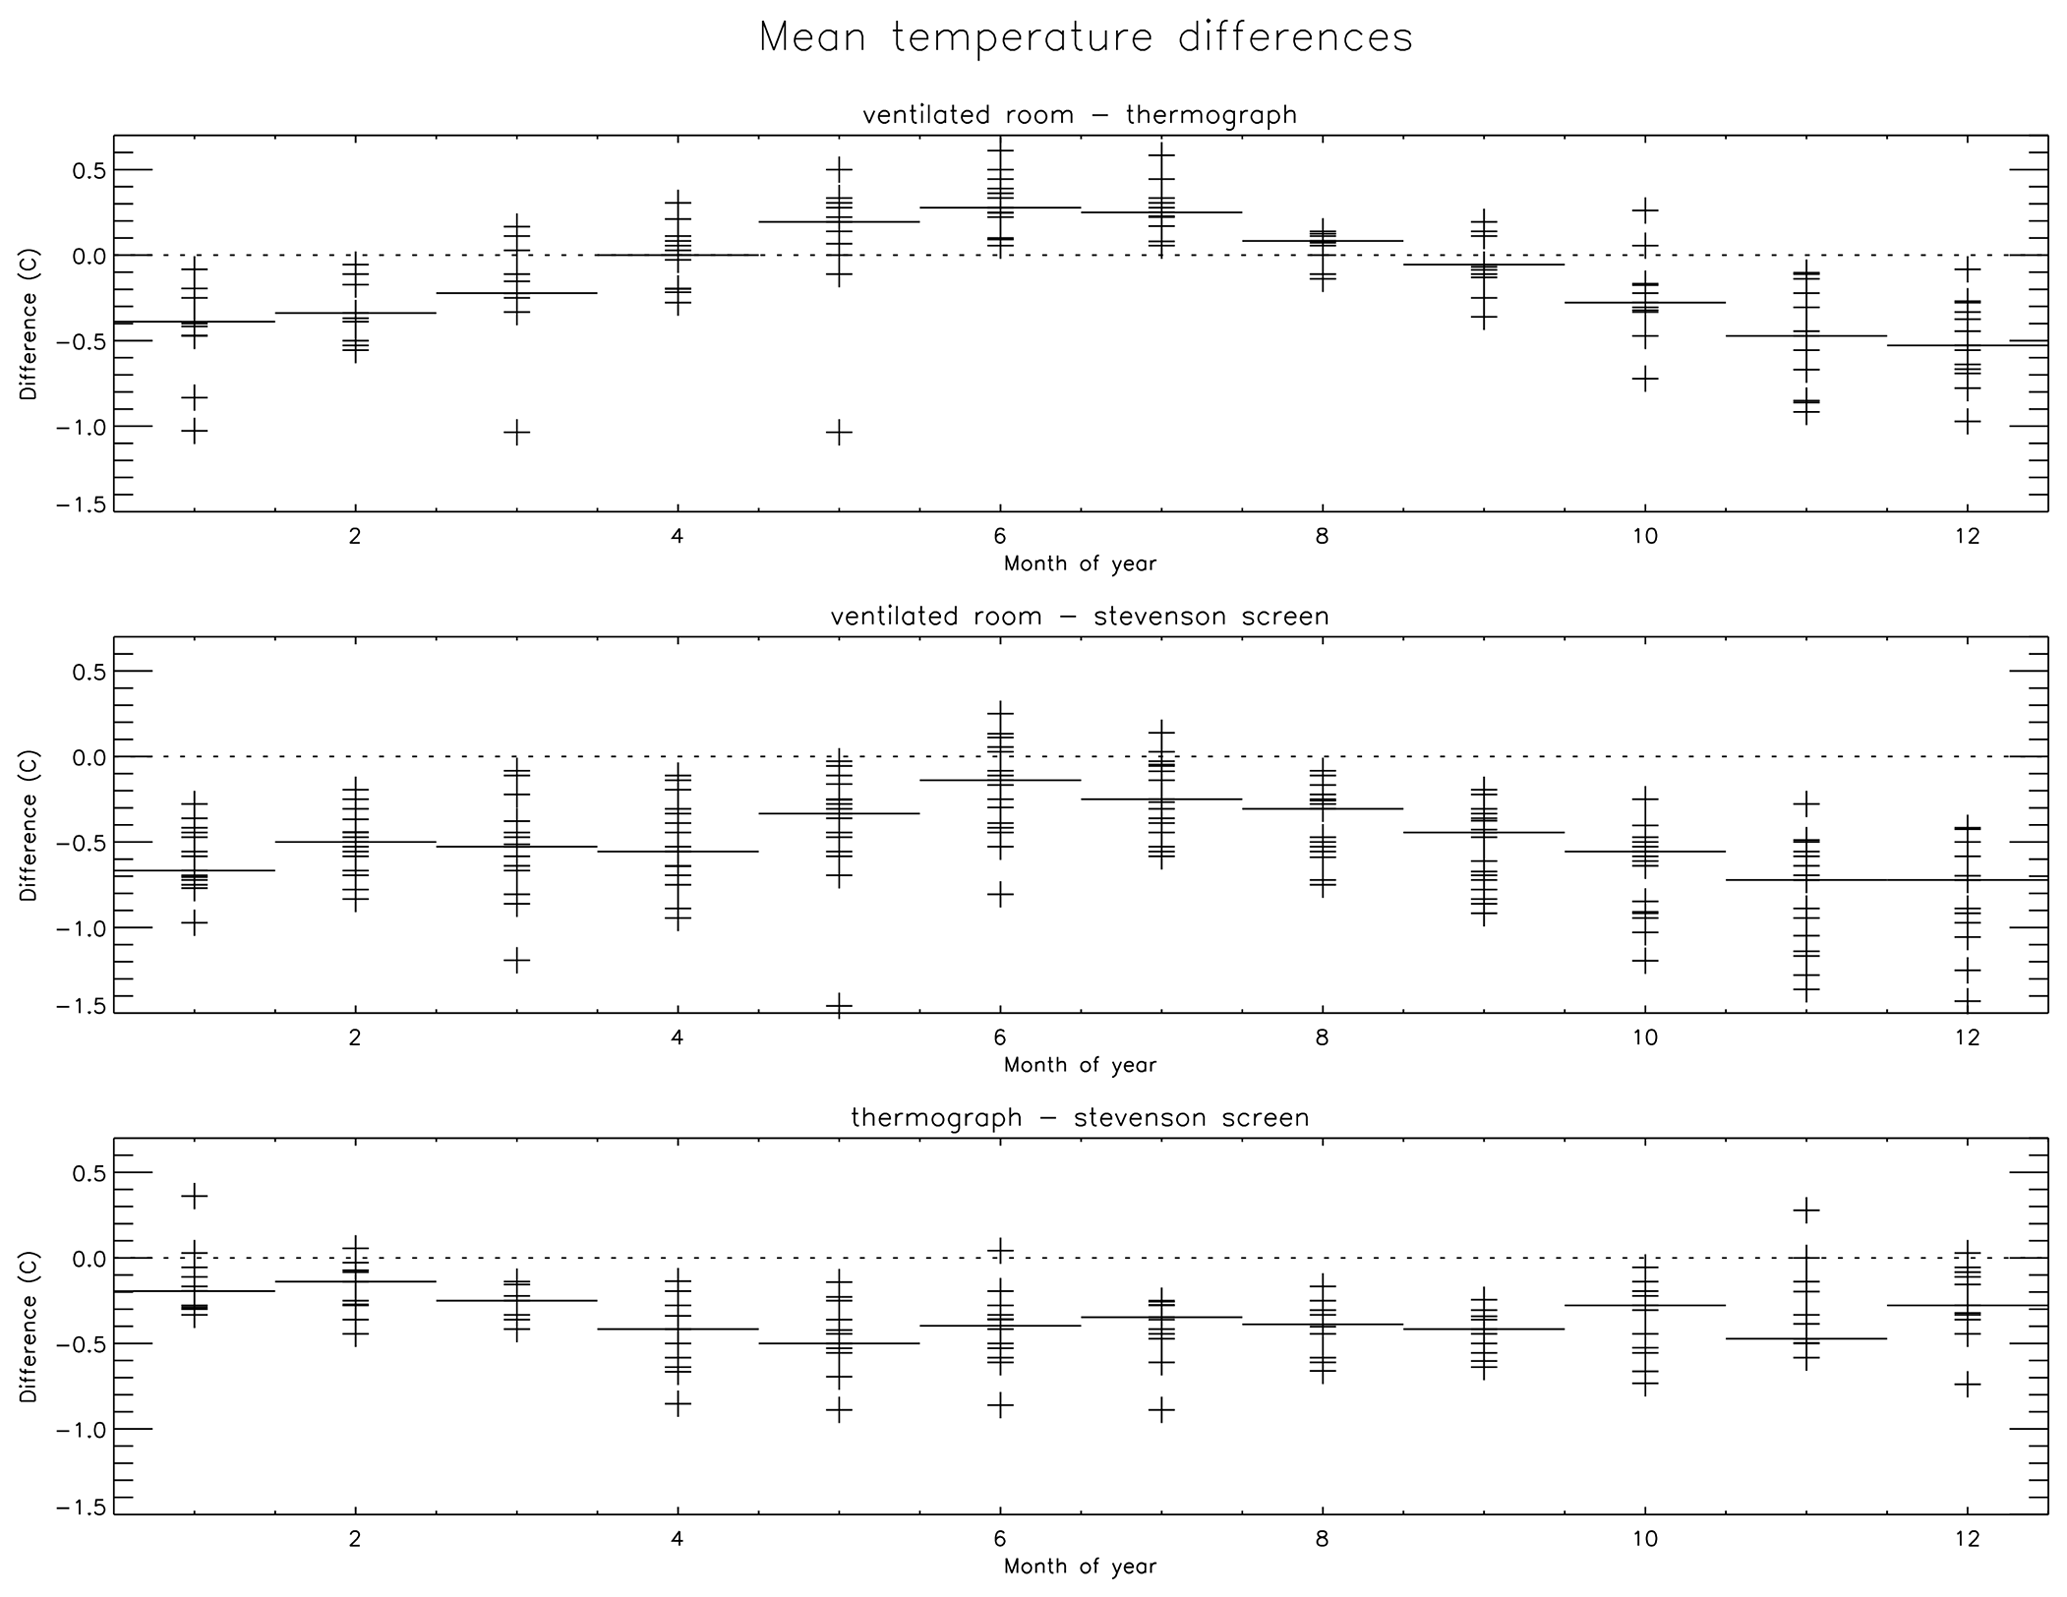
Figure 18As Fig. 12 but for Tm. All axes are the same range but differ from those given in Figs. 12, 14, and 16. As in Fig. 17 the series utilizes a combination of self-calculated and reported values for Tm.
Seasonality of the differences is marked for the two comparisons that include the well-ventilated room, as was the case for Ta (Fig. 18, see also Fig. 16). The differences for each calendar month range over ±1 ∘C – somewhat broader than the similar set of differences for Ta. Both comparisons involving the well-ventilated room, similarly to Ta, have a very marked seasonal cycle with differences being largest in austral summer. The well-ventilated room is warmer than the thermograph in the austral winter but remains cooler than the Stevenson screen throughout the year. The thermograph–Stevenson screen pair exhibits a roughly constant offset of 0.2–0.4 ∘C across the seasonal cycle. The outliers for October and February in the thermograph to Stevenson screen comparison in Ta no longer exist in Tm (compare lowest panels in Figs. 15 and 17), pointing to a potential non-climatic effect in the 06:00 or 15:00 LST instantaneous temperature in the Stevenson screen measurements which does not impact the Tx and Tn measurements. Initial intuition might suggest 15:00 LST as the prime candidate as radiation effects would be maximal then, but the sun would be nearly overhead, making this less plausible as a transient impact than 06:00 LST measurements, which might have transient shadow effects from quite distant obstacles given the low solar elevation at that hour. Without additional metadata, however, this is impossible to unpick further. All comparisons between Tm series are statistically significant (Table 2).
4.4 The differences between mean and average temperatures for each instrument configuration
The availability of more than a decade's worth of Ta and Tm measurements for the three long-standing measurement series permits an assessment of the impacts of the choice of daily and monthly averaging. As outlined previously, the norm in early records was for the monthly mean to be based upon the average of a number of instantaneous measurements taken across the day (Böhm et al., 2010; Camuffo, 2002), whereas many countries now calculate the monthly average as the mean of the daily maxima and minima. It is well documented that this choice can have a substantial impact upon the resulting series (Camuffo, 2002; Trewin, 2010; Böhm et al., 2010). The availability of over a decade's worth of concurrent Tm and Ta measurements for each instrumental set-up enables a quantification of the impacts of this choice and also the sensitivity to instrumental set-up. Recall that for the Stevenson screen and well-ventilated room Ta is the average of 06:00 and 15:00 LST measurements, whereas for the thermograph it is the average of 24-hourly values between 00:00 and 23:00 LST.
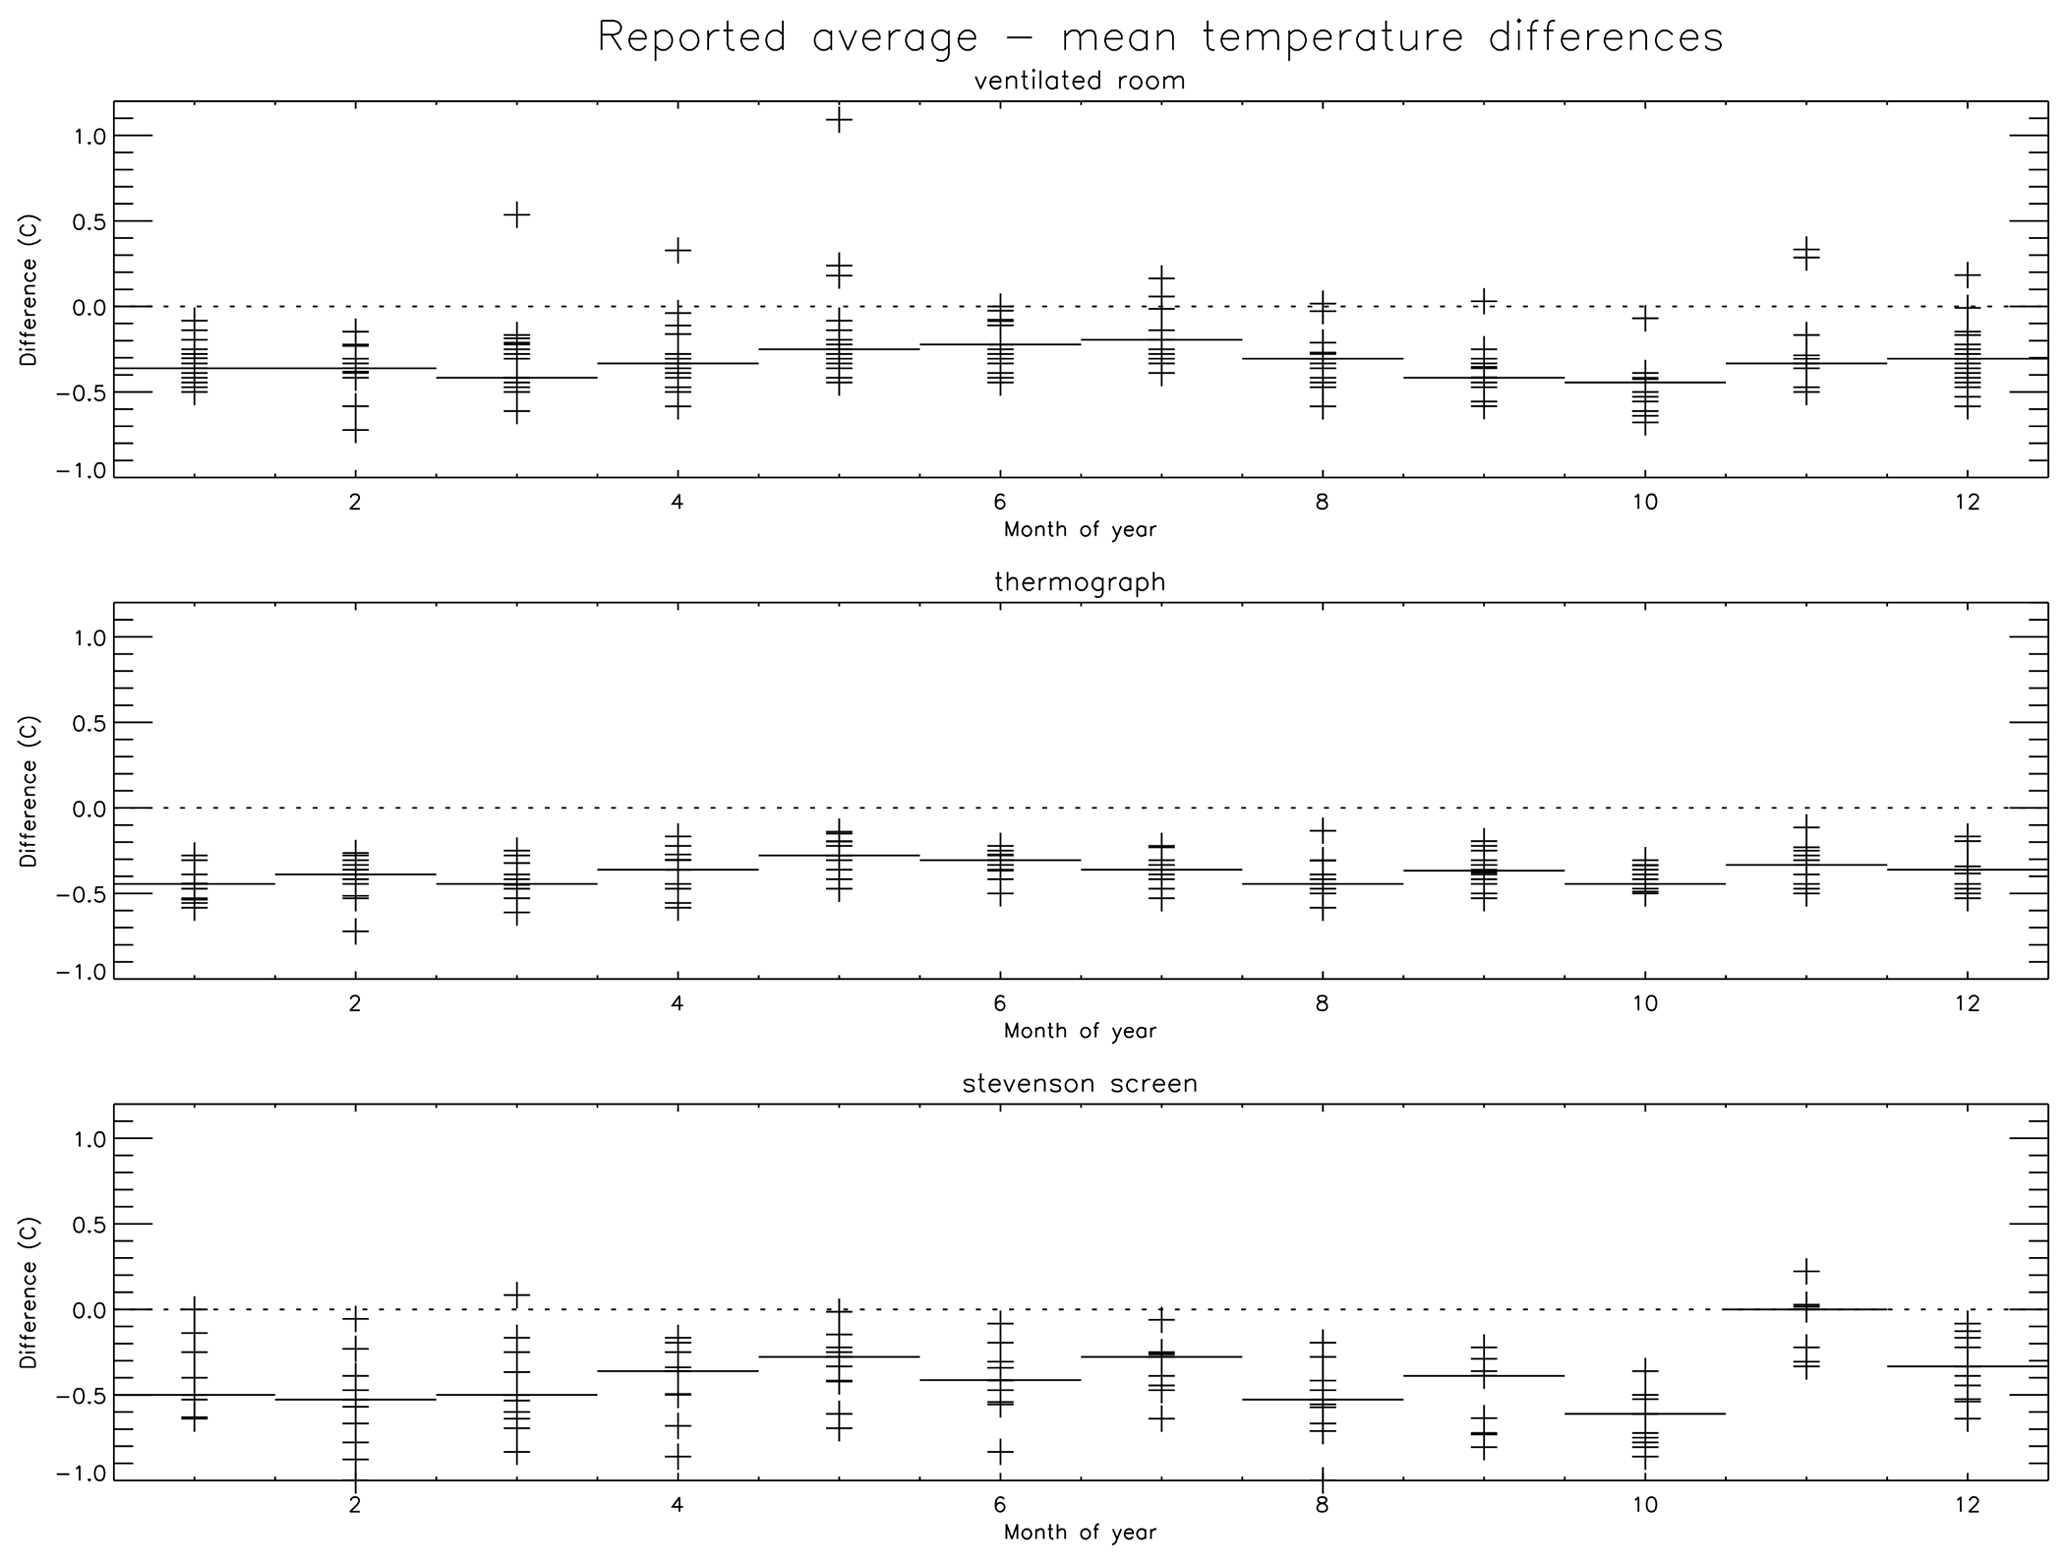
Figure 19As Fig. 12 but for the differences between reported average and mean temperatures for each individual instrument configuration. All axis ranges are identical to aid comparability.
Differences between Ta and Tm per instrument over the seasonal cycle are shown in Fig. 19. For all three distinct measurement set-ups, Ta is consistently cooler than Tm throughout the annual cycle. Differences always exhibit lower variance (evidenced by the dispersion of points around the median) from the thermograph than the other two instrumental set-ups. Presumably the use of 24-hourly values in the derivation of Ta, instead of 2, reduces the noise and makes the two measurements more consistently equivalent to one another. The thermograph differences are also remarkably stable across the seasonal cycle, ranging between about 0.3 and 0.5 ∘C warmer in Tm than Ta. The well-ventilated room also tends to sit within a slightly broader range of 0.2–0.5 ∘C warmer in Tm than Ta. There is some very slight seasonality in the well-ventilated room differences, with differences being largest in austral summer and smallest in austral winter. The Stevenson screen differences are much more dispersive, and there is marked month-to-month variation in the differences, with the median difference in November being 0 ∘C and October being 0.6 ∘C. This may relate to the effects discussed in Sect. 4.3. There is no obvious seasonality to the pattern of differences beyond this. All three sets of differences between Tm and Ta are highly significant (Table 2).
4.5 The Stevenson screen comparison
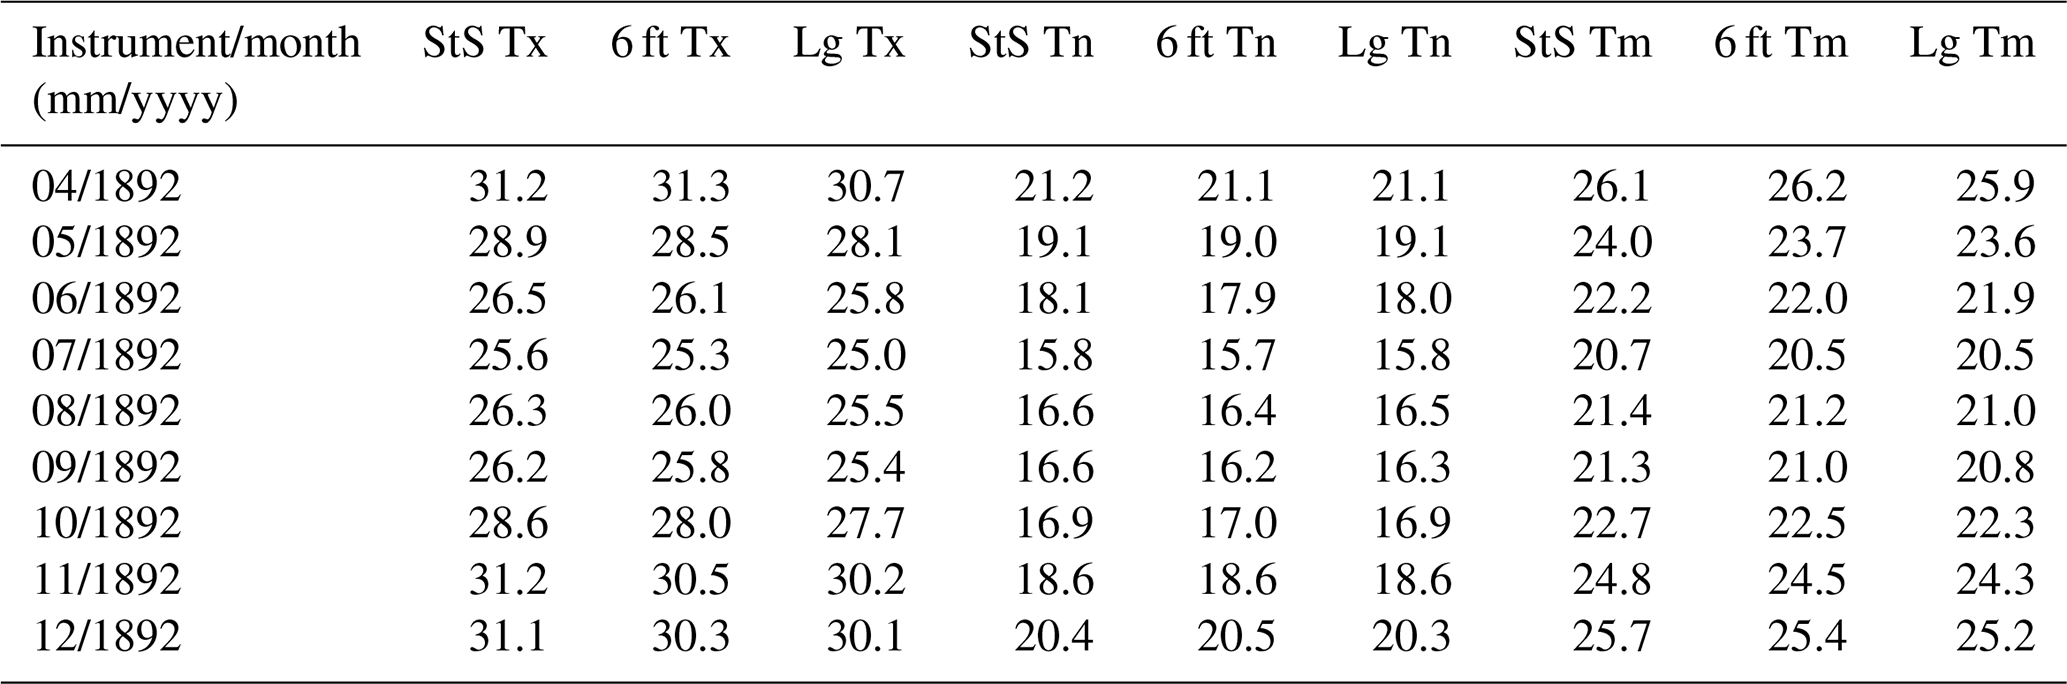
The Stevenson screen comparison was, as noted in Sect. 2.2, recorded solely for 8 months during 1892. As such the substantive analyses performed for other aspects of the comparison are not appropriate and, instead, a simple tabulation of the observations is presented in Table 3. As noted in Sect. 2.2 the “large” Stevenson screen was perhaps more akin to present-day Stevenson screen sizes (although the standard screen size is not, as far as we can tell, ever explicitly documented) and the 6 ft (1.8 m) screen height is also closer to modern standard heights, which tend to be 1.5 or 2 m rather than the 1.2 m height of the standard screen at the time. Available documentation implies that all thermometers were calibrated such that any differences would arise due to the height or housing distinctions between the three sets of instrumentation. Differences between the standard screen and 6 ft screen are minimal until October 1892 when the 6 ft screen Tx readings depart systematically to read cooler than the standard Stevenson screen. The large Stevenson screen Tx readings are consistently lower than the standard Stevenson screen throughout, whereas the Tn values are consistent. Taken together, these results are suggestive of issues in the Tx with the standard Stevenson screen (the long-standing configuration). This may result from the relatively small screen size relative to modern-day screen designs, yielding estimates that are warm-biased. This would certainly be supported by the large screen comparisons. There has been some limited analysis in this regard elsewhere, with Buisan et al. (2015) reporting overheating in small screens, particularly in summer, but this is contested by Yosef et al. (2018). Regardless, the seasonal variation of the 6 ft versus standard Stevenson screen Tx behaviour would require an additional reason. Seasonality in leaf cover or vegetation shading effects is one potential explanation, and the timing potentially also matches apparent effects in seasonality discussed in Sect. 4.3 and 4.4. The series is, however, too short to draw any firm conclusions in this regard.
Table 3Comparison of the three Stevenson screen set-ups undertaken in the latter part of calendar year 1892. Original values in ∘F have been converted here to ∘C. StS stands for the standard long-running Stevenson screen measurements – taken at a height of 4 ft (1.2 m). The 6 ft screen is mounted instead at 6 ft (1.8 m), which is closer to the typical range of screens today that tend to be at 1.5 to 2 m. Lg refers to the larger screen size, which is perhaps more comparable to the size of today's screens. The size of the two standard screens has not been able to be ascertained from the available metadata (see Sect. 2.2).
The series of measurements undertaken at the RAO are quite remarkable. Such a series of experiments, even today, is very much exceptional and undertaken only at a handful of national observatories globally. To see such a set of measurements undertaken in what was, at the time, an outpost of the then British empire, against noted struggles of factors such as conditions, salaries, and ill health, shows enormous scientific fortitude. The set of measurements is very informative. The main initial scientific takeaways are as follows.
-
Differences in Tx and Tn between the different instrument configurations are substantial and highly significant but are of opposite sign, so they tend to partially cancel for both Tm and Ta.
-
There are potentially large seasonality effects, which are most marked for the measurements taken in the well-ventilated room.
-
Differences between Ta (average over fixed hours) and Tm (the mean of Tx and Tn) for each instrument are on the order of a few tenths of a degree and systematic, with limited seasonality. Many early instrumental series used the Ta approach, whereas most modern data are reported as Tm. The Tm series are systematically warmer by up to 0.5 ∘C depending upon the instrumental configuration.
-
Because of robust and regular comparisons to a primary standard, the fact that most differences between series are highly significant points irrefutably to the non-negligible impacts of both instrumental set-ups and choice of averaging approaches.
-
Assuming that the well-ventilated room and thermograph are indicative of early measurement techniques, then these recorded colder values than the Stevenson screen measurements, at least at this location and for the particular Stevenson screen set-up.
-
However, questions around the size and height of the Stevenson screen are highlighted by a short-term three-way comparison of three distinct screens, pointing to potential biases in Tx measurements in particular.
The differences between the well-ventilated room and the remaining instrumental set-ups, with the well-ventilated room exhibiting a muted diurnal and annual cycle, suggest that the thermal capacity of the building leads to biases in these measurements that partially cancel in the daily and annual means. Figure 4 suggests the building is at least partially stone-built, as do available blue book metadata. The thermograph and the well-ventilated room are both overall cold-biased relative to the Stevenson screen. However, a short period of overlap between three distinct Stevenson screen configurations in the middle of the period implies that the Stevenson screen may suffer from biases, in particular in Tx arising from potentially being too small to avoid heating effects from the screen. Monthly outlier values in Stevenson screen differences also indicate potential impacts from shading effects which impact Ta (06:00 and 15:00 LST) in October and February and, given the location relative to vegetation (Figs. 4 and 6), would most logically imply issues of either early morning (perhaps more plausibly) or early afternoon shading.
The comparison is highly informative around the very substantial magnitude of possible biases in early instrumental records. However, there are substantial unresolved questions regarding how representative the findings around instrumental set-up transitions at this single locale, for this single experimental set-up may be and, hence, how they may apply more broadly to the transition from early meteorological records to Stevenson-screen-based measurements in the tropics. Firstly, it is unclear how broadly the thermograph and/or well-ventilated room set-ups in use at the RAO were in use across former UK colonies. Based upon the Royal Society report (Royal Society, 1868) and its drive toward standardization, it is reasonable to assume that, at least at similarly staffed facilities, it may have been encouraged and thus that the predominant transition in such cases may have been from one of a well-ventilated room or thermograph set-up eventually to a Stevenson screen, which by the 1930s was the pre-eminent measurement technique (Parker, 1994). But, equally, the RAO facility, undoubtedly a proverbial scientific shining beacon on the hill of its time (Mahony, 2018), may have been quasi-unique. Secondly, even if the techniques were broadly adopted then presumably they would have been sensitive to details such as site aspect, instrument positioning, climatological sunshine, precipitation and wind, and the latitude of the site. The effect of such covariates may be large compared to any instrumental set-up effects and would be unique per site. To address these issues, further efforts toward metadata recovery for early tropical measurement series would be necessary, pointing to the need for renewed data rescue efforts, including efforts to rescue and manage available metadata.
The finding that the observations in the well-ventilated room, and to a lesser extent in the thermograph screen, result in lower values than the Stevenson screen is an interesting finding. In the seminal paper comparing Stevenson screen measurements to earlier observational methods, Parker (1994) finds the opposite: earlier methods tended to record similar or warmer temperatures than Stevenson screens. In northwestern Europe these biases tend to be smaller than 0.2 ∘C. The paper presents three tropical screen comparisons, suggesting biases can be larger in the tropics: (1) at Agra Observatory in India the mean annual temperature of a thatched shed is 0.42 ∘C warmer than the Stevenson screen (Field, 1920); (2) at Colombo in Sri Lanka the mean annual temperature is 0.37 ∘C warmer in an early felted shed than a Stevenson screen with an open bottom (Bamford, 1928); and (3) at Apia, Samoa, a tropical screen (which seems to be a Stevenson screen with a thatched roof) is 0.08 ∘C cooler than a normal Stevenson screen (Sapsford, 1940). Furthermore, based on a comparison of land temperatures and marine temperatures Parker estimated that tropical measurements are 0.2 ∘C too warm for the period before the Stevenson screen.
After Parker (1994), considerable warm biases have also been found in screens used before the Stevenson screen. In two locations in Spain Brunet et al. (2011) found a warm bias in French screens of 0.35 ∘C compared to Stevenson screens (only comparing screens, using modern sensors). In Kremsmünster, Austria, Böhm et al. (2010) found a warm bias in north wall measurements of 0.2 ∘C compared to Stevenson screens (again only comparing screens). Nicholls et al. (1996) found a warm bias in the Glaisher's revolving screen in Adelaide, Australia, of 0.2 ∘C; for comparison Parker had reported on four Glaisher screen parallel measurements in the cloudy and windy UK with on average no bias (although one of them also had a 0.2 ∘C warm bias). Ashcroft et al. (2021) extended the Nicholls et al. (1996) analysis with newly rescued long-term daily series to highlight differential biases for maxima and minima that, for maxima, showed considerable seasonality. A recent comparison of a Wild screen and a Stevenson screen in Basel, Switzerland, found no bias in the average temperature, but a 0.2 ∘C warm bias in the mean temperature of the Wild screen (Auchmann and Brönnimann, 2012). Care must be taken in these comparisons, which are predominantly mid-latitude analyses. The radiation errors of large Stevenson screens in a subtropical desert climate were found to be less than other types of screens in a WMO trial in Algeria (Lacombe et al., 2011). In mid-latitudes, it is well known that strong solar radiation can result in considerable heating of the louvred sides of the screen and result in screen temperature warming over “true” air temperature (as measured by, for instance, an aspirated sensor); but in tropical latitudes, with a higher or overhead solar angle, the radiation errors did not appear to be as great as might have been expected, probably owing to shadowing of the louvres from the screen roof. The roof being more important relative to the sides may extrapolate to other tropical measurement set-ups. Mid-latitude screen comparisons may thus not be representative of tropical sites for this reason.
Furthermore, while these prior studies all considered early observational methods, none of these constituted well-ventilated room or thermograph measurements. That may explain the difference between the current study and earlier studies on early observations. Modelling suggests that Stevenson screens still have a warming bias due to radiation errors (Lin et al., 2001), and this could on a physical basis have been greater for these early screens that were smaller than modern screens. Thus, either the well-ventilated room measurements or the thermograph measurements may well constitute more faithful estimates of the true early temperatures in Mauritius, although the well-ventilated room measurements come at the expense of thermal inertia impacting their apparent ability to describe diurnal and seasonal cycles. Given the set-up of the thermograph with relatively large bulbs relative to modern instruments and its attachment to a building, it may well also suffer from these impacts to a lesser extent.
Significant further value would be realized if the parallel measurement data were available at daily or even sub-daily resolution alongside meteorological covariates that may allow a more physical interpretation of the causes of the differences we have found. From our inspection of the blue book series only one set of numbers is ever present for daily records, and in many years it is unclear from what combination of instruments this arises. It is also possible that the thermograph readings are available for a considerable period prior to their inclusion in the blue book and annual report series as monthly averages. Unfortunately, as unfunded work, it was not possible for us to pursue these avenues of potential research further at this time, and it would require access to additional records, which it cannot be certain have been preserved. On the other hand, it is very likely that blue book and annual report series entries do exist continuously. If those missing from NCEI's archives and not backfilled from the NOAA Foreign Data Library could be procured from other sources (Fig. 10), that would fill some gaps in the records recovered here.
We would caution that there is presently no direct impact of the findings herein upon the major global datasets estimating surface temperature. This is in part because data from Mauritius prior to the mid-20th century have yet to be incorporated into at least some of the databases upon which these datasets are built. But, more importantly, how representative the instrument transition at the RAO is to changes that were more broadly undertaken across the tropics is unknown. It is therefore not possible to determine how broadly applicable the findings may be. Nor is it known how sensitive any transition might be to site-specific covariates.
There is clearly a long-term and semi-continuous record between the RAO observations and observations taken at a range of earlier locations (Mahony, 2018; Sect. 2 and blue book entries), and there would be great value in their recovery and use, which is an activity ongoing under ACRE (Rob Allan, personal communication, 2020). Herein we have clearly only scratched the surface in uncovering the potential scientific value of this lost treasure trove of early meteorological holdings from RAO, which provide a unique window into climate in the southern Indian Ocean from 1875 to the mid-20th century. The subset of reports held by and imaged from NOAA NCEI contains not only meteorological observations from the island of Mauritius, but also early information on Indian Ocean tropical cyclones and many other relevant aspects of island life (Mahony, 2018; Table 1). Records were well kept and there is a rich set of contextual and societal metadata in the annual reports (less so in the meteorological reports, which mainly contain measurement system metadata). It is also possible to extract valuable additional metadata from institutional correspondence. Digitization and exploitation of these well-managed meteorological observations and correspondence would clearly constitute a valuable addition to our knowledge of climate change in the region for which exploitable directly observed climate data in the period are presently scant to non-existent. Several activities in this area are known to be ongoing (Gil Compo and Rob Allan, personal communication, 2020).
A recently rediscovered and recovered set of long-term parallel measurements undertaken over 1884 to 1903 at the Royal Alfred Observatory in Mauritius has provided valuable insights into early instrumental transitions. The principal measurements consisted of a well-ventilated room, a thermograph, and a Stevenson screen, supplemented by a hygrometer and, for a short period, parallel Stevenson screen measurements.
The instruments used were regularly calibrated against a primary standard thermometer, meaning that any differences principally relate to instrumental configuration, housing, and averaging effects. Differences between instrumental configurations are large for maximum, minimum, average (average of specified hours), and mean (average of max and min) temperatures, and almost all comparisons are highly statistically significantly distinct.
The findings reinforce existing literature that points to the likely presence of significant biases that may have complex seasonal fingerprints in transitioning from early measurement techniques to modern globally standardized meteorological records. But it is unclear how representative the different configurations are of early instrumental practices, nor is it clear whether site-specific effects may dominate. Thus, while the analysis highlights the potential presence of large biases associated with transitions from early instrumentation in the tropics, it cannot, absent further information on other site instrumentation changes, elucidate upon the likely overall nature of any tropic-wide biases arising.
The original imaged copies of reports are available from NOAA NCEI and the NOAA Foreign Data Library as outlined in the main text. The keyed rescued data are available at https://doi.org/10.1594/PANGAEA.935684 (Thorne, 2021a, original units) and https://doi.org/10.1594/PANGAEA.935683 (Thorne, 2021b, converted to Celsius). The IDL code (single programme) to produce all tables and plots is available at https://github.com/peterwthorne/Mauritius_code (last access: last access: 7 April 2022; https://doi.org/10.5281/zenodo.6451187, Thorne, 2022) and uses the original unit version of the data files.
SOA conceived of the analysis and undertook primary digitization and initial analysis. PWT undertook secondary digitization efforts and redrafted the analysis into a paper from the MSc thesis of SOA. SJN provided Figs. 1 and 3, and VKCV contributed text for the introduction and discussions around historical analyses and parallel measurements. MM and EM provided pen sketches and history in Sect. 2.1. TGT provided Fig. 6. SOA, MM, EM, CM, SJN, VKCV, TGT, and PWT reviewed and improved the draft text.
The contact author has declared that neither they nor their co-authors have any competing interests.
Publisher's note: Copernicus Publications remains neutral with regard to jurisdictional claims in published maps and institutional affiliations.
The staff of NOAA NCEI, who performed the indexing and imaging of the data, are thanked for their efforts without which these data would remain a hidden treasure. Blair Trewin (Australian Bureau of Meteorology) and Philip Brohan (UK Met Office) are thanked for providing information on some historical instrumental practices. Rob Allan (UK Met Office) and ACRE colleagues helped source two blue books held at the NOAA Foreign Data Library to make a more complete series. We thank Stephen Burt and Linden Ashcroft for perceptive and constructive reviews, some material from which we used directly in revising the paper.
This paper was edited by Chantal Camenisch and reviewed by Linden Ashcroft and Stephen Burt.
Acquaotta, F., Fratianni, S., and Venema, V.: Assessment of parallel precipitation measurements networks in Piedmont, Italy, Int. J. Climatol., 36, 3963–3974, https://doi.org/10.1002/joc.4606, 2016.
Aguilar, E., Auer, I., Brunet, M., Peterson, T. C., and Wieringa, J.: Guidelines on climate metadata and homogenization. World Meteorological Organization, WMO-TD No. 1186, WCDMP No. 53, Geneva, Switzerland, p. 55, https://library.wmo.int/index.php?lvl=notice_display&id=11635#.Yk8SJ25KiFw (last access: 7 April 2022), 2003.
Allan, R., Brohan, P., Compo, G. P., Stone, R., Luterbacher, J., and Bronnimann, S.: The International Atmospheric Circulation Reconstructions over the Earth (ACRE) initiative, B. Am. Meteorol. Soc., 92, 1421–1425, https://doi.org/10.1175/2011BAMS3218.1, 2011.
Anon: Weather watchers and their work, The Strand Magazine, London, 3, 182–189, 1892.
Ashcroft, L., Karoly, D., and Gergis, J.: Temperature variations of southeastern Australia, 1860–2011, Aust. Meteorol. Ocean., 62, 227–245, 2012.
Ashcroft, L., Trewin, B., Benoy, M., Ray, D., and Courtney, C.: The world's longest known parallel temperature dataset: a comparison between daily Glaisher and Stevenson Screen temperature data at Adelaide, Australia, 1887–1947, Int. J. Climatol., 42, 2670–2687, https://doi.org/10.1002/joc.7385, 2021.
Auchmann, R. and Brönnimann, S.: A physics-based correction model for homogenizing sub-daily temperature series, J. Geophys. Res.-Atmos., 117, D17119, https://doi.org/10.1029/2012JD018067, 2012.
Bamford, A. J.: On the exposure of thermometers in Ceylon, Ceylon J. Sci., Sect. E, I, 153–167, +3 plates, 1928.
Böhm, R., Jones, P. D., Hiebl, J., Frank, D., Brunetti, M., and Maugeri, M.: The early instrumental warm-bias: a solution for long central European temperature series 1760–2007, Climatic Change, 101, 41–67, https://doi.org/10.1007/s10584-009-9649-4, 2010.
Brunet, M., Asin, J., Sigro, J., Banon, M., Garcia, F., Aguilar, E., Palenzuela, J., Peterson T. C., and Jones P. D.: The minimization of the screen bias from ancient Western Mediterranean air temperature records: an exploratory statistical analysis, Int. J. Climatol., 31, 1879–1895, https://doi.org/10.1002/joc.2192, 2011.
Buisan, S. T., Azorin-Molina, C., and Jimenez, Y.: Impact of two different sized Stevenson screens on air temperature measurements, Int. J. Climatol., 35, 4408–4416, https://doi.org/10.1002/joc.4287, 2015.
Burt, S.: Referee comment on “Insights from 20 years of temperature parallel measurements in Mauritius around the turn of the 20th Century” by Samuel O. Awe et al., Clim. Past Discuss., https://doi.org/10.5194/cp-2021-127-RC1, 2021.
Camuffo, D.: Errors in Early Temperature Series Arising from Changes in Style of Measuring Time, Sampling Schedule and Number of Observations, Climatic Change, 53, 331–352, https://doi.org/10.1023/A:1014962623762, 2002.
Chimani, B., Venema, V., Lexer, A., Andre, K., Auer, I., and Nemec, J.: Inter-comparison of methods to homogenize daily relative humidity, Int. J. Climatol., 38, 3106–3122, https://doi.org/10.1002/joc.5488, 2018.
Conrad, V. and Pollak, C.: Methods in climatology, Harvard University Press, Cambridge, MA, p. 459, https://doi.org/10.4159/harvard.9780674187856, 1950.
Cook, T.: Toward a reassessment of daily temperature range trends, Eos, 97, https://doi.org/10.1029/2016EO052735, 2016.
Council of the Royal Meteorological Society: Report of the council for the year 1883: Appendix 1, Report of the thermometer screen committee, Q. J. Roy. Meteor. Soc., 10, 92–94, 1884.
Drummond, A. J.: Kew Observatory, Weather, 2, 69–76, 1947.
Field, J. H.: On exposures of thermometers in India, lndia Meteorol. Mem., XIV, 21–73, 1920.
Galvin, J. F. P.: Kew Observatory, Weather, 58, 478–484, 2003.
Gubler, S., Hunziker, S., Begert, M., Croci-Maspoli, M., Bronnimann, S., Schwierz, C., Orla, C., and Rosas, G.: The influence of station density on climate data homogenization, Int. J. Climatol., 37, 4670–4683, https://doi.org/10.1002/joc.5114, 2017.
Gulev, S. K., Thorne, P. W., Ahn, J., Dentener, F. J., Domingues, X. M., Gerland, S., Gong, D., Kaufman, D. S., Nnamachi, H. C., Quass, J., Rivera, J. A, Sathyendranath, S., Smith, S. L., Trewin, B., Von Schuckmann, K., and Vose, R. S.: Changing State of the Climate System, in: Climate Change 2021: The Physical Science Basis, Contribution of Working Group I to the Sixth Assessment Report of the Intergovernmental Panel on Climate Change, edited by: Masson-Delmotte, V., Zhai, P., Pirani, A., Connors, S. L., Pean, C., Berger, S., Caud, N., Chen, Y., Goldfarb, L., Gomis, M. I., Huang, M., Leitzell, K., Lonnoy, E., Matthews, J. B. R., Maycock, T. K., Waterfield, T., Yelekci, O., Yu, R., and Zhou, B., Cambridge University Press, Cambridge, UK, New York, NY, USA, in press, 2021.
Hartmann, D. L., Klein Tank, A. M. G., Rusticucci, M., Alexander, L. V., Bronnimann, S., Abdul-Rahman Charabi, Y., Dentener, F. J., Dlugokencky, E. J., Easterling, D. R., Kaplan, A., Sode, B. J., Thorne, P. W., Wild, M., and Zhai, P.: Observations: Atmosphere and Surface, in: Climate Change 2013: The Physical Science Basis. Contribution of Working Group I to the Fifth Assessment Report of the Intergovernmental Panel on Climate Change, edited by: Stocker, T. F., Qin, D., Plattner, G.-K., Tignor, M., Allen, S. K., Boschung, J., Nauels, A., Xia, Y., Bex, V., and Midgley, P. M., Cambridge University Press, Cambridge, United Kingdom, New York, NY, USA, 159–254, https://doi.org/10.1017/CBO9781107415324.008, 2013.
Hawkins, E., Ortega, P., Suckling, E., Schurer, A., Hegerl, G., Jones, P., Joshi, M., Osborn, T. J., Masson-Delmotte, V., Mignot, J., Thorne, P., and van Oldenborgh, G. J.: Estimating Changes in Global Temperature since the Preindustrial Period, B. Am. Meteorol. Soc., 98, 1841–1856, https://doi.org/10.1175/BAMS-D-16-0007.1, 2017.
Hubbard, K. G., Lin, X., and Walter-Shea, E. A.: The Effectiveness of the ASOS, MMTS, Gill, and CRS Air Temperature Radiation Shields, J. Atmos. Ocean. Tech., 18, 851–864, https://doi.org/10.1175/1520-0426(2001)018<0851:TEOTAM>2.0.CO;2, 2001.
Kaspar, F., Hannak, L., and Schreiber, K.-J.: Climate reference stations in Germany: Status, parallel measurements and homogeneity of temperature time series, Adv. Sci. Res., 13, 163–171, https://doi.org/10.5194/asr-13-163-2016, 2016.
Knowles Middleton, W. E.: A history of the thermometer and its uses in meteorology, The Johns Hopkins Press, Baltimore, https://doi.org/10.1002/qj.49709440024, 1966.
Lancombe, M., Bousri, D, Leroy, M., and Mezred, M.: Instruments and observing methods report no. 106: WMO field intercomparison of thermometer screens/shields and humidity measuring instruments, Ghardaïa, Algeria, November 2008–October 2009. Instruments and Observing Methods Report No. 106, WMO/TD-No. 1579, Geneva, Switzerland, https://library.wmo.int/index.php?lvl=notice_display&id=15530#.YlSX327MJzU (last access: 11 April 2022), 2011.
Lin, X., Hubbard, K. G., and Walter-Shea, E. A.: Radiation loading model for evaluating air temperature errors with a non-aspirated radiation shield, T. ASAE, 44, 1299–1306, 2001.
Lindau, R. and Venema, V. K. C.: The joint influence of break and noise variance on the break detection capability in time series homogenization, Adv. Stat. Clim. Meteorol. Oceanogr., 4, 1–18, https://doi.org/10.5194/ascmo-4-1-2018, 2018a.
Lindau, R. and Venema, V. K. C.: On the Reduction of Trend Errors by the ANOVA Joint Correction Scheme Used in Homogenization of Climate Station Records, Int. J. Climatol., 38, 5255–5271, https://doi.org/10.1002/joc.5728, 2018b.
Lindén, J., Grimmond, C. S. B., and Esper, J.: Urban warming in villages, Adv. Sci. Res., 12, 157–162, https://doi.org/10.5194/asr-12-157-2015, 2015.
Mahony, M.: The “genie of the storm”: Cyclonic reasoning and the spaces of weather observation in the southern Indian Ocean, 1851–1925, Brit. J. Hist. Sci., 51, 607–633, https://doi.org/10.1017/S0007087418000766, 2018.
Mawley, E.: Report on temperatures in two different patterns of Stevenson screens, Q. J. Roy. Meteor. Soc., 10, 1–7, 1884.
Menne, M. J. and Williams, C. N.: Homogenization of Temperature Series via Pairwise Comparisons, J. Climate, 22, 1700–1717, https://doi.org/10.1175/2008JCLI2263.1, 2009.
Michaud, E.: Meteorologist's profile – Charles Meldrum, Weather, 55, 15–17, 2000.
Nicholls, N., Tapp, R., Burrows, K., and Richards, D.: Historical thermometer exposures in Australia, Int. J. Climatol., 16, 705–710, https://doi.org/10.1002/(SICI)1097-0088(199606)16:6<705::AID-JOC30>3.0.CO;2-S, 1996.
Noone, S., Atkinson, C., Berry, D. I., Dunn, R. J. H., Freeman, E., Perez Gonzalez, I., Kennedy, J. J., Kent, E. C., Kettle, A., McNeill, S., Menne, M., Stephens, A., Thorne, P. W., Tucker, W., Voces, C., and Willett, K. M.: Progress towards a holistic land and marine surface meteorological database and a call for additional contributions, Geosci. Data J., 8, 103–120, https://doi.org/10.1002/gdj3.109, 2021.
Osborn, T. J., Jones, P. D., Lister, D. H., Morice, C. P., Simpson, I. R., Winn, J. P., Hogan, E., and Harris, I. C.: Land surface air temperature variations across the globe updated to 2019: the CRUTEM5 dataset, J. Geophys. Res.-Atmos., 126, e2019JD032352, https://doi.org/10.1029/2019JD032352, 2021.
Parker, D. E.: Effects of changing exposure of thermometers at land stations, Int. J. Climatol., 14, 1–31, https://doi.org/10.1002/joc.3370140102, 1994.
Quayle, R. G., Easterling, D. R., Karl, T. R., and Hughes, P. Y.: Effects of Recent Thermometer Changes in the Cooperative Station Network, B. Am. Meteorol. Soc., 72, 1718–23, http://www.jstor.org/stable/26228755 (last access: 11 April 2022), 1991.
Rennie, J. J., Lawrimore, J. H., Gleason, B. E., Thorne, P. W., Moricce, C. P., Menne, M. J., Williams, C. N., Gambi de Almedia, W., Christy, J. R., Flannery, M., Ishihara, M., Kamiguchi, K., Klein Tank, A. M. G., Mhanda, A., Lister, D. H., Razuvaev, V., Renom, M., Rusticucci, M., Tandy, J., Worley, S. J., Venema, V., Angel, W., Brunet, M., Dattore, B., Diamond, H., Lazzara, M. A., Le Blancq, F., Luterbacher, J., Machel, H., Revadekar, J., Vose, R. S., and Yin, X.: The international surface temperature initiative global land surface databank: monthly temperature data release description and methods, Geosci. Data J., 1, 75–102, https://doi.org/10.1002/gdj3.8, 2014.
Rouphail, R. M.: Cyclonic ecology: Sugar, Cyclone Science and the Limits of Empire in Mauritius and the Indian Ocean World, 1870s–1930s, Isis, 110, 48–68, 2019.
Royal Society: Report of the Meteorological Committee of the Royal Society for the year ending 31 December 1867, 27–54, HMSO, 1868.
Sapsford, H.: Exposure of thermometers in Samoa. N. 2, J. Sci. Technol, 22, 136B–143B, 1940.
Stevenson, T. C. E.: New Description of Box for Holding Thermometers, Journal of the Scottish Meteorological Society, 1, 122 pp., June 1864.
Thorne, P. W.: Mauritius Royal Alfred Observatory parallel temperature measurements 1884–1903, original file in ∘Fahrenheit, PANGAEA [data set], https://doi.org/10.1594/PANGAEA.935684, 2021a.
Thorne, P. W.: Mauritius Royal Alfred Observatory parallel temperature measurements 1884–1903, PANGAEA [data set], https://doi.org/10.1594/PANGAEA.935683, 2021b.
Thorne, P. W.: Mauritius analysis code, Zenodo [code], https://doi.org/10.5281/zenodo.6451187, 2022.
Thorne, P. W., Donat, M. G., Dunn, R. J. H., Williams, C. N., Alexander, L. V., Caesar, J., Durre, I., Harris, I., Hausfather, Z., Jones, P. D., Menne, M. J., Rohde, R., Vose, R. S., Davy, R., Klein-Tank, A. M. G., Lawrimore, J. H., Peterson, T. C., and Rennie, J. J.: Reassessing changes in Diurnal Temperature Range: Intercomparison and evaluation of existing global dataset estimates, J. Geophys. Res.-Atmos., 121, 5138–5158, https://doi.org/10.1002/2015JD024584, 2016.
Thorne, P. W., Allan, R. J., Ashcroft, L., Brohan, P., Dunn, R. J. H., Menne, M. J., Pearce, P. R., Picas, J., Willett, K. M., Benoy, M., Bronnimann, S., Canziani, P. O., Coll, J., Crouthamel, R., Compo, G. P., Cuppett, D., Curley, M., Duffy, C., Gillespie, I., Guijarro, J., Jourdain, S., Kent, E. C., Kubota, H., Legg, T. P., Li, G., Matsumoto, J., Murphy, C., Rayner, N. A., Rennie, J. J., Rustemeir, E., Slivinski, L. C., Slonosky, V., Squintu, A., Tinz, B., Valente, M. A., Walsh, S., Wang, X. L., Westcott, N., Wood, K., Woodruff, S. D., and Worley, S. J.: Towards an integrated set of surface meteorological observations for climate science and applications, B. Am. Meteorol. Soc., 98, 2689–2702, https://doi.org/10.1175/BAMS-D-16-0165.1, 2017.
Trewin, B.: Exposure, instrumentation, and observing practice effects on land temperature measurements, WIREs Clim. Change, 1, 490–506, https://doi.org/10.1002/wcc.46, 2010.
Venema, V. K. C., Auchmann, R., Aguilar, E., Auer, I., Azorin-Molina, C., Brandsma, T., Brunetti, M., Delitala, A., Dienst, M., Domonkos, P., Erell, E., Gilabert, A., Lin, X., Linden, J., Lundstadt, E., Milewska, E., Nordli, O., Prohom, M, Rennie, J., Stepanek, P., Trewin, B., Vincent, L., Willett, K., and Wolff, M.: A global database with parallel measurements to study non-climatic changes, Joint 25th AMOS National Conference and 12th International Conference for Southern Hemisphere Meteorology and Oceanography, UNSW, Sydney, Australia, 5–9 February 2018, AMOS-ICSHMO 2018, https://uni-bonn.viven.org//articles/2018/2018_AMOS_POST.pdf (last access: 12 April 2022), 2018.
Venema, V. K. C., Trewin, B., Wang, X. L., Szentimrey, T, Lakatos, M., Aguilar, E., Auer, I., Guijarro, J. A., Menne, M., Oria, C., Louamba, W. S. R. L., Rasul, G., Argriou, A., Hechler, P., Vertacnik, G., and Yousef, Y.: Guidelines on Homogenization, WMO report WMO-No. 1245, Geneva, Switzerland, ISBN 978-92-63-11245-3, 2020.
Williams, C. N., Menne, M. J., and Thorne, P. W.: Benchmarking the performance of pairwise homogenization of surface temperatures in the United States, J. Geophys. Res., 117, D05116, https://doi.org/10.1029/2011JD016761, 2012.
WMO: WMO Guidelines on the Calculation of Climate Normals, WMO, https://library.wmo.int/index.php?lvl=notice_display&id=20130#.Ye_Dh1j7RzU (last access: 25 January 2022), 2017.
Yosef, Y., Aguilar, E., and Alpert, P.: Detecting and adjusting artificial biases of long-term temperature records in Israel, Int. J. Climatol., 38, 3273–3289, https://doi.org/10.1002/joc.5500, 2018.
- Abstract
- Introduction
- History of meteorological observations on Mauritius, the Royal Alfred Observatory, and specifics of the experiment
- Data discovery and digitization of monthly data
- Analysis of the rescued parallel measurements
- Discussion
- Conclusion
- Code and data availability
- Author contributions
- Competing interests
- Disclaimer
- Acknowledgements
- Review statement
- References