the Creative Commons Attribution 4.0 License.
the Creative Commons Attribution 4.0 License.
 | 01 Aug 2023
How well does ramped thermal oxidation quantify the age distribution of soil carbon? Assessing thermal stability of physically and chemically fractionated soil organic matter
Marion Schrumpf
Alison Hoyt
Carlos A. Sierra
Sebastian Doetterl
Valier Galy
Susan Trumbore
Carbon (C) in soils persists on a range of timescales depending on physical, chemical, and biological processes that interact with soil organic matter (SOM) and affect its rate of decomposition. Together these processes determine the age distribution of soil C. Most attempts to measure this age distribution have relied on operationally defined fractions using properties like density, aggregate stability, solubility, or chemical reactivity. Recently, thermal fractionation, which relies on the activation energy needed to combust SOM, has shown promise for separating young from old C by applying increasing heat to decompose SOM. Here, we investigated radiocarbon (14C) and 13C of C released during thermal fractionation to link activation energy to the age distribution of C in bulk soil and components previously separated by density and chemical properties. While physically and chemically isolated fractions had very distinct mean 14C values, they contributed C across the full temperature range during thermal analysis. Thus, each thermal fraction collected during combustion of bulk soil integrates contributions from younger and older C derived from components having different physical and chemical properties but the same activation energy. Bulk soil and all density and chemical fractions released progressively older and more 13C-enriched C with increasing activation energy, indicating that each operationally defined fraction itself was not homogeneous but contained a mix of C with different ages and degrees of microbial processing. Overall, we found that defining the full age distribution of C in bulk soil is best quantified by first separating particulate C prior to thermal fractionation of mineral-associated SOM. For the Podzol analyzed here, thermal fractions confirmed that ∼ 95 % of the mineral-associated organic matter (MOM) had a relatively narrow 14C distribution, while 5 % was very low in 14C and likely reflected C from the < 2 mm parent shale material in the soil matrix. After first removing particulate C using density or size separation, thermal fractionation can provide a rapid technique to study the age structure of MOM and how it is influenced by different OM–mineral interactions.
- Article
(2502 KB) -
Supplement
(15101 KB) - BibTeX
- EndNote


Soil organic matter (SOM) consists of a complex and diverse collection of organic molecules containing C that can persist in soil for timescales ranging from hours to millennia (Schuur et al., 2016). Plant tissue chemistry, soil environmental conditions, soil mineral characteristics, physical aggregation, and microbial communities have all been demonstrated to impact the stability of SOM (Lehmann and Kleber, 2015; Basile-Doelsch et al., 2020; Kleber et al., 2021). These factors collectively influence the age of carbon (C) in SOM and the age of C in microbial respiration, making it challenging to link the timescales of OM stabilization and destabilization to the various mechanisms that allow C to persist in soils.
The measurement of soil radiocarbon (14C) has been used for decades to describe mean SOM ages. However, the mean 14C values measured on bulk SOM integrate different pools and stabilization mechanisms and thereby obscure critical information on the distribution of SOM age. By combining timescales from years to millennia, the interpretation of bulk 14C measurements is made more difficult due to the integration of 14C from both natural sources affected by radioactive decay (natural 14C, integrating multiple centuries to millennia) and 14C produced by atomic weapons (“bomb” 14C) that reflect short-term cycling (annual to century) (Trumbore, 2000; Baisden and Canessa, 2013). Disentangling these signals is complex and requires the integration of 14C data with models to estimate SOM transit times and ages (Sierra et al., 2018; Metzler et al., 2018).
In an effort to better describe the distribution of age and cycling rates in bulk SOM, a number of physical and chemical fractionation methods have been developed to elucidate how the bulk 14C can be broken into pools with different amounts of 14C depending on physical or chemical characteristics (Trumbore et al., 1990; Paul et al., 1997; Castanha et al., 2008; Sollins et al., 2009; Lavallee et al., 2020). In particular, density fractionation, a method that separates SOM associated with denser minerals from low-density “free” particulate organic matter (FPOM), has demonstrated success in distinguishing faster (low-density) from slower (mineral-associated) cycling C (Gregorich et al., 2006; Cotrufo et al., 2019; Heckman et al., 2022). However, mineral-associated organic matter (MOM) fractions themselves have been shown by many studies to be comprised of both faster and slower cycling C as evidenced by the change in 14C content after chemical extraction or oxidation (examples include Anderson and Paul, 1984; Balesdent, 1987; Trumbore and Zheng, 1996; Jagadamma et al., 2010; Schrumpf et al., 2021) or from tracking bomb 14C into mineral fractions (examples include Trumbore, 1993; Torn et al., 1997; von Lützow et al., 2007, and more recently Schrumpf et al., 2013; Rasmussen et al., 2018; Heckman et al., 2018b). Despite their widespread use and demonstrated utility for separating organic C by age as well as physical and chemical properties, most fractionation methods consume significant laboratory time and resources (Lavallee et al., 2020; Heckman et al., 2022). Further, some treatments, such as dense sodium polytungstate solution, remove C that cannot be easily recovered or analyzed for C or 14C content, meaning that the isotopic signature of removed C must be solved using mass balance constraints.
Ramped pyrolysis/oxidation (RPO), or thermal fractionation, is a relatively new method to functionally fractionate OM in sediments and soils (Rosenheim et al., 2008; Plante et al., 2013; Hemingway et al., 2017). This process applies increasing temperature of thermal decomposition as a proxy for the activation energy (Ea) required to oxidize C, with the assumption that this provides a comparable measure of its resistance to decomposition in the soil environment. The result is a reproducible profile of CO2 released as a function of increasing temperature (thermogram), from which Ea distributions can be calculated (Hemingway et al., 2017). By collecting the CO2 released over specified intervals as temperatures are continuously increased, “pools” of C with distinct thermal stability can be isolated, collected, and analyzed isotopically (Rosenheim and Galy, 2012). Because all C is released as CO2, it is possible to characterize all of the C in a sample rather than inferring losses from the analysis of the residual material. A further advantage of such “thermal fractionation” is that it can be compared with pyrolysis gas chromatography–mass spectrometry (py-GC/MS) of SOM to evaluate how the chemistry of combusted SOM also changes with Ea. Previous studies have shown that the breakdown of lipids and polysaccharides releases C at lower temperatures, while thermal decomposition of phenolic and aromatic compounds dominate at higher temperatures (Quénéa et al., 2006; Grandy et al., 2009; Sanderman and Grandy, 2020). Thus, thermal fractionation has the potential to define the 14C (age) distribution of organic C and relate that to the Ea and chemistry of the OM in a soil sample.
Several studies have investigated soils using oxidative thermal fractionation (Plante et al., 2013; Grant et al., 2019; Hemingway et al., 2019). Compared to sediments, where these methods have been more widely applied, soil thermograms release a greater proportion of the total C over a narrower temperature range and have lower variation in age across thermal fractions (Hemingway et al., 2019). This may reflect a broader set of OM sources in sediments that can include eroded soil containing very old and highly processed C, as well as fresh material from aquatic organisms.
Typically, C released from both sediments and soils by thermal oxidation also increases in age with the temperature of combustion, i.e., Ea, confirming linkages between SOM persistence and the mechanisms of C stabilization (Plante et al., 2011; González-Pérez et al., 2012). However, different SOM stabilization mechanisms or local environments can complicate the interpretation of Ea–age relationships; for example, the same chemical compound sorbed to different mineral substrates can have very different activation energies (Feng and Simpson, 2008). Thermal oxidation of OM not associated with minerals, such as dissolved organic C (DOC), oxidizes at narrow but relatively high temperature ranges, possibly contributing young C at high temperatures that would be mixed with C released from mineral fractions at the same temperature (Grant et al., 2019; Hemingway et al., 2019). Given the wide range of 14C ages measured in various physical and chemical fractions, as well as the potential for recycling of C in soils through microbial processing, we expect some range of C age within each bulk soil thermal fraction.
Here, we apply oxidative thermal fractionation to SOM previously separated using physical (density) and chemical (extraction and oxidation) methods. Using mass balance approaches, we describe the contribution of each fraction to bulk soil thermograms and 14C signatures. We also present thermal fractionation results using a commercially available instrument only recently applied to characterize SOM thermal stability distributions (Natali et al., 2020; Rennert and Herrmann, 2020, 2022). Our goals were (1) to determine the degree to which the physically and chemically separated fractions represent mixtures of OM with different activation energies and 14C distributions, (2) to determine the 14C distribution of C contained in physically or chemically separated fractions, and (3) to assess the viability of thermal fractionation as an alternative to more time intensive lab methods in determining the 14C distribution of SOM.
2.1 Site description and density fractionation
Soil material used in this study was sampled from a Podzol developed on granitic parent material under spruce forest in central Germany (Schrumpf et al., 2013, 2021). This soil was selected because it was already known to have large differences in 14C content between density fractions (Schrumpf et al., 2021) and because of strong depth-dependent differences in stabilization processes in Podzol A and B horizons (De Coninck, 1980). Surface (0–10 cm) and subsoil (30–50 cm) samples were subjected to laboratory fractionations described in detail by Schrumpf et al. (2013). Briefly, soils first underwent density separation using dense sodium polytungstate solution (SPT) (1.6 g cm−3). Suspended OM was separated from denser material that did not float using centrifugation. The floating free particulate OM (FPOM) fraction was collected and rinsed to remove remaining SPT solution. The sinking fraction was dispersed again in 1.6 g cm−3 solution, sonicated to disrupt aggregates, and then centrifuged. After centrifugation, floating material from the supernatant was collected, rinsed, and designated as occluded particulate organic matter (OPOM). The remaining dense material in the sediment was repeatedly rinsed to remove SPT solution and is designated mineral-associated organic matter (MOM).
2.2 Chemical fractionation
Two chemical fractionations were performed in parallel on the MOM fraction, as described by Schrumpf et al. (2021). The first subsample was extracted with NaF–NaOH to solubilize and remove all potentially desorbable SOM complexed with minerals through pH increase and competition with OH and F anions (Kaiser et al., 2007; Mikutta and Kaiser, 2011). Briefly, 125 mL of a NaF–NaOH solution was added to 25 g MOM material, agitated overnight, and centrifuged. The supernatant was extracted, and an additional 125 mL of NaF–NaOH was added to repeat this process four times in total. Then, each extraction was filtered through glass fiber filters and combined. The remaining soil material was washed with deionized water and freeze-dried.
The second chemically treated MOM underwent strong oxidation in heated hydrogen peroxide (H2O2) to isolate the most resistant and oldest OM (Helfrich et al., 2007; Jagadamma et al., 2010). In this procedure, 60 mL H2O2 was added to a mixture of 2 g MOM and 20 mL deionized water. Samples were then heated and periodically stirred in a 50 ∘C water bath for a total of 120 h. Samples were then centrifuged, washed with deionized water, freeze-dried, and homogenized with a ceramic ball mill.
2.3 Thermal fractionation and method development
Oxidative thermal fractionation of bulk SOM and physically and chemically separated fractions was performed using an Elementar soli TOC cube carbon analyzer. Samples were not analyzed under pyrolytic conditions, as pyrolysis can produce charring artifacts, and 14C distributions have been shown to be comparable between operational modes (Williams et al., 2014; Grant et al., 2019). The design of the instrument used is very similar to those used in previous thermal fractionation publications (Rosenheim and Galy, 2012; Bianchi et al., 2015). Primarily, it consists of two ovens in sequence, a mechanical arm to hold and manipulate the sample container, and a non-dispersive infrared analyzer (NDIR) to measure the CO2 concentration in the gas exiting the ovens. The sample is introduced to the first oven, which is heated at a constant rate under a constant flow of carrier gas supplied through the sampler arm (78 % N2, 22 % O2). The second oven contains a Pt catalyst held at 800 ∘C that ensures all C released from the sample is oxidized to CO2. The carrier gas then passes through a glass tube filled with brass wire at 20 ∘C to remove HCl from acidified samples (note that no samples were acidified in this experiment) followed by a glass tube containing magnesium perchlorate to remove water vapor. Finally, the CO2 concentration in the gas mixture is measured by the NDIR (DIN 19539).
Several additional procedures were required to adapt the use of the commercial device for the collection of C released by thermal fractionation. Due to the relatively large sample size (> 1g of dried soil or fraction) required to collect small thermal fractions with sufficient C for radiocarbon measurement, as well as the high flow rate of carrier gas in this instrument, samples with high C content (such as standards or FPOM/OPOM fractions) were diluted to ∼ 2 % (by weight) C with pre-combusted sand (1000 ∘C for 10 h) to prevent ignition and charring during heating. An artificial soil standard was analyzed with different sand dilutions to ensure that thermograms were not altered by dilution with sand (Fig. S1). Further, the sample oven was designed for rapid heating (up to 110 ∘C min−1), and temperatures were observed to be less stable at slower heating rates. To reduce the cycles of on/off oven cycling while ensuring thermogram consistency (with sand dilution), samples were heated at 15 ∘C per minute.
To collect CO2 for isotope analysis, a custom collection manifold was attached to the instrument outflow port (Figs. S2–S4). The manifold consists of parallel glass CO2 traps submerged in LN2 under vacuum. Exhaust gas released within a desired temperature range (thermal fraction) flows through a cold trap until the desired upper temperature is reached. Then, the trap is closed and the next opened to collect the next CO2 fraction. This process is repeated for each thermal fraction (F1 (first thermal fraction) − Fmax (highest temperature thermal fraction); see Supplement Tables S1 and S2). A vacuum pump together with a capillary restriction upstream of the manifold was used to reduce the overall pressure in the manifold system to < 6 mbar to improve cryotrapping efficiency and to prevent condensation of O2 in the LN2 traps.
Traps with CO2 samples were subsequently transferred to a vacuum line where the CO2 was further purified (see below) and measured volumetrically for comparison (calibration) of the NDIR CO2 analysis. An aliquot was taken for analysis of δ13C using a modified GasBench inlet to a continuous flow isotope ratio mass spectrometer (IRMS; Wendeberg et al., 2013). In addition to CO2, we noticed that nitrogen oxide gasses (including N2O3, which is dark blue when frozen) were visibly trapped. These gasses are produced by the reaction of N2 and O2 at high temperatures. As these, as well as S oxides that also freeze with CO2 at liquid nitrogen temperatures, can cause graphitization failure, we used an additional purification procedure to remove them. An amount of sample CO2 representing approximately 0.5 mg C was transferred cryogenically and then sealed under vacuum in a pre-combusted borosilicate tube containing ∼ 50 mg CuO and ∼ 10 mg Ag (Hemingway et al., 2017) and baked at 525 ∘C for 1 h. Purified CO2 released after breaking this tube was graphitized using zinc reduction (Xu et al., 2007) and measured at the Keck AMS lab at the University of California Irvine. Resulting radiocarbon data are expressed as fraction modern (Fm).
Thermograms and activation energy (Ea) were analyzed using the open-source “rampedpyrox” Python package (Hemingway, 2017; Hemingway et al., 2017). For each thermogram, a distributed Ea model derived from time–temperature C-release data is solved inversely to produce a continuous distribution of Ea (in kJ mol−1). It assumes a finite set of n components (thermal fractions) in order of increasing temperature, referred to as F1−Fmax, where Fmax is thermal Fn, the highest temperature range collected (Supplement Tables S1 and S2) in superposition to construct the bulk soil E distribution. Each of these components can thus be mathematically assigned a mean Ea (μE) and standard deviation (σE). Here, standard deviation describes the variance of distribution of E or the heterogeneity of the bonding environment within a thermal fraction or sample rather than data variance. Thus, direct comparisons can be made between the E distribution within a thermal fraction and its isotopic composition. However, it should be noted that such Ea descriptors derived from thermograms are not necessarily comparable to other methods of measuring Ea (Feng and Simpson, 2008; Hemingway et al., 2019).
We describe data on SOM decomposition as a function of temperature, modeled Ea, and isotopic signatures of thermal fractions within and between density and chemical fractions and compare these to thermal fractionation of the bulk soil. To our knowledge, this was the first thermal fractionation procedure performed using a commercial C analyzer. Results on the performance and reliability of this setup to demonstrate the viability of this method for future researchers are presented in Supplement Text S1.
3.1 Thermograms and activation energy of physically and chemically fractionated organic matter
We compared the thermograms and the isotopic (14C and 13C) signatures of CO2 released as a function of temperature for each physical and chemical fraction individually and then compared the summed contribution of each physical and chemical fraction to the bulk soil (for density fractions) or MOM (for chemical fractions) to assess (1) the behavior of each of the different fractions and (2) how much each fraction contributes to the bulk thermogram at different temperature intervals.
All density and chemical fractions and bulk soil released 90 %–98 % of their total C between 150 and 500 ∘C. No fraction had a unique thermal signature (Fig. 1a, b), and the thermograms mostly overlapped, with some C released across the whole temperature range of combustion. However, differences were observed among density fraction thermograms. For particulate fractions (FPOM and OPOM), C release displayed one or two muted peaks and most of the C was oxidized between 250 and 450 ∘C. MOM and chemical residues released most of their C between 250 and 350 ∘C but also released more C at temperatures > 500 ∘C compared to FPOM and OPOM fractions. Since most bulk soil C is in the MOM fraction (Table 1), thermograms for the bulk soil resemble those of the MOM fractions in both depths (Fig. 1a).
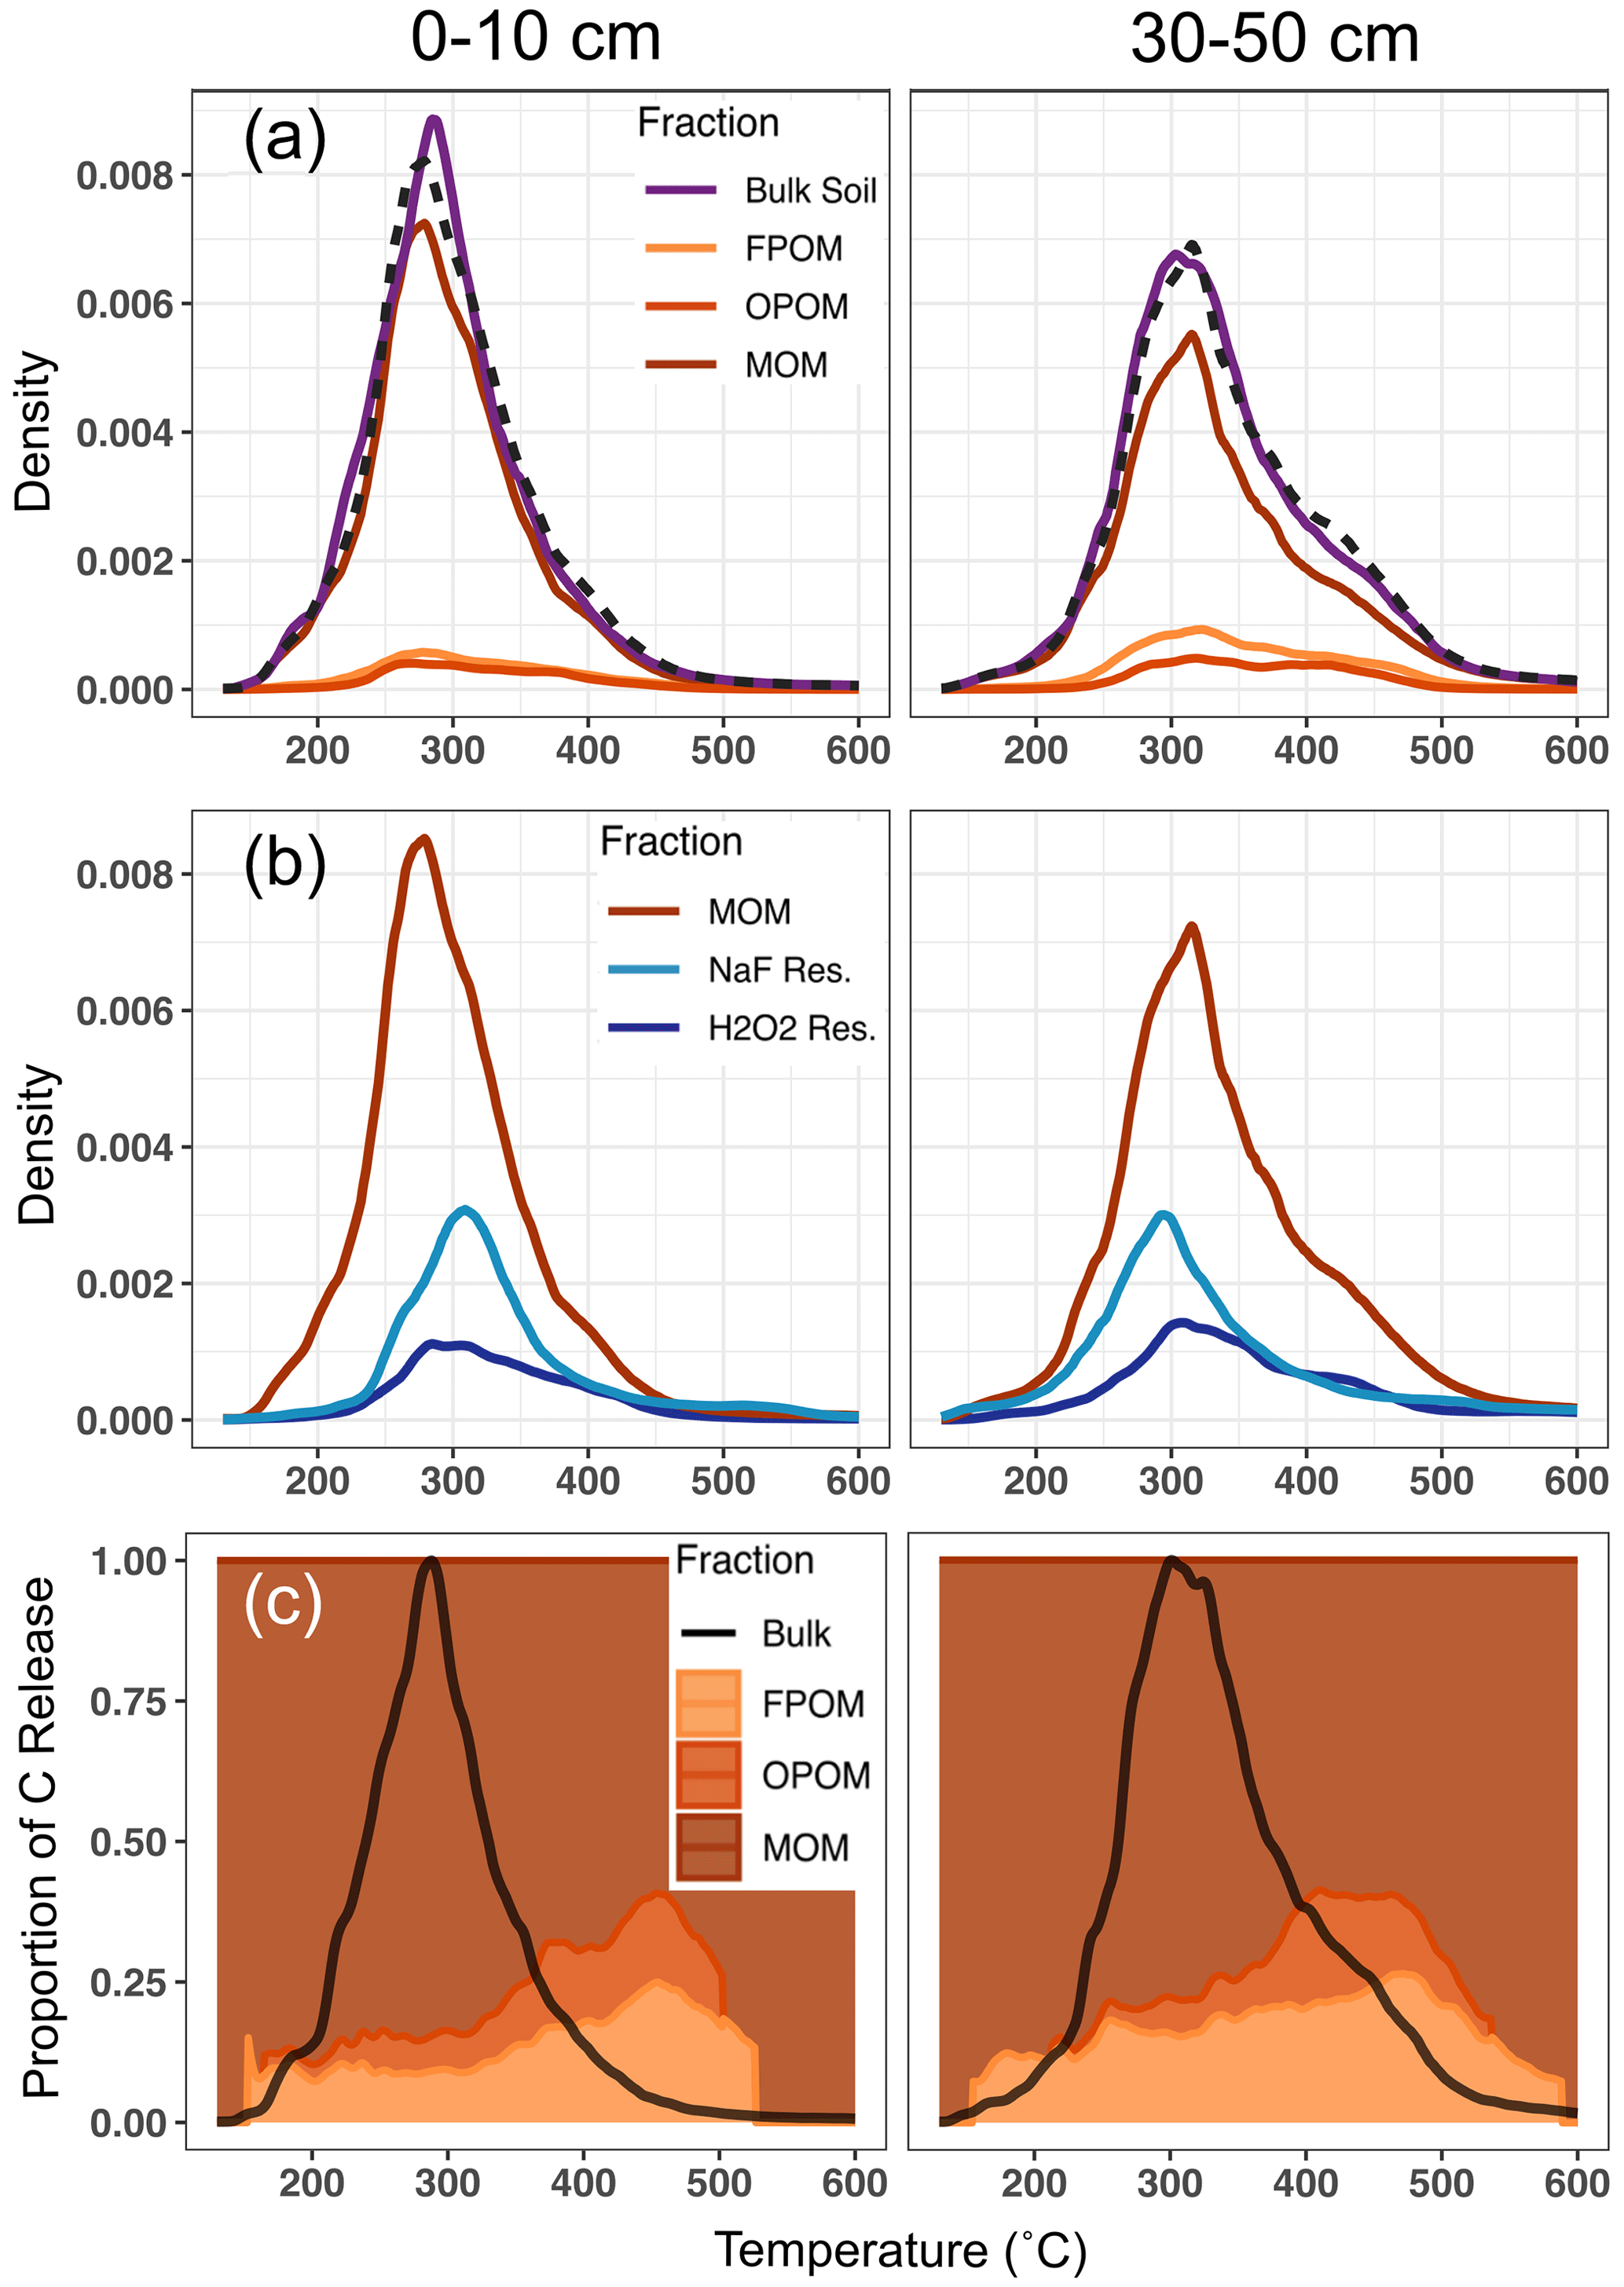
Figure 1Relative magnitudes of thermograms, as C released as a function of temperature, with fractions scaled by their relative contribution to the total C in each panel. (a) Bulk soil and density fraction thermograms for 0–10 and 30–50 cm, respectively. Density fraction (FPOM, OPOM, MOM) thermograms are scaled to their relative contribution to total bulk soil C (Table 1). Dashed lines represent summed thermograms of the three density fractions. Comparisons of summed and bulk thermograms show good agreement and suggest that fractionation procedures do not significantly alter the thermal stability of component fractions. (b) Thermograms of MOM and chemical fractionation residues. The differences between MOM and given chemical fraction thermograms represent the thermal profile of C removed by the chemical treatment (NaF–NaOH or H2O2). Chemical fraction residue thermograms are scaled to their relative residual C content of the MOM fraction. (c) Proportional contribution of density fractions to bulk soil C released across collection temperature range (colored fill). Solid black line represents bulk soil thermogram to highlight total C release from bulk soil at each temperature. Density fractions are cut off when C release is no longer discernible from instrument IR-detector background.
Mean activation energy (μE) estimated from thermograms of bulk soil and fractions ranged from 133.5 to 137.8 kJ mol−1 in surface soil and 137.9 to 144.3 kJ mol−1 in subsoil (Table 1, Supplement Figs. S1 and S2, Tables S1 and S2). Between depths, μE was greater in subsoil than surface soil on average by 5.2 kJ mol−1 (p=0.01, paired t test) for all samples except NaF extraction residues, which showed no difference. In subsoil, particulate fractions FPOM and OPOM μE values were ∼ 3–6 kJ mol−1 greater than bulk soil and MOM but showed little difference in surface soils. The standard deviation of E (σE), a metric of bond strength heterogeneity, only varied with depth among chemical fraction residues which were ∼ 5–6 kJ mol−1 greater in subsoil, suggesting greater diversity of bonds in the subsoil fractions (Hemingway et al., 2017). Thus, despite large differences in the chemistry and relationship to mineral surfaces, the Ea range was similar across all chemical and physical fractions. It is puzzling that NaF and H2O2 residues had lower activation energies than might be expected given that they represent the most “recalcitrant” C resistant to harsh chemical treatments.
3.2 Radiocarbon
The mean radiocarbon (14C, expressed as Fm) differed for each density or chemical residue fraction (Table 1). For a given soil depth, the FPOM had the highest 14C content, consisting mostly of C fixed since the 1960s (Fm > 1.0), while the lowest 14C was in the residue after H2O2 treatment of the MOM. The 14C of the bulk soil and each fraction decreased from the 0–10 to 30–50 cm depth, and the overall pattern of Fm for the different physical and chemical fractions (FPOM > OPOM > MOM> NaF residue > H2O2 residue) remained the same.
Within all fractions, the Fm of released CO2 stayed similar or declined as the temperature increased (Fig. 2; temperatures of combustion are converted to Ea in Fig. 3). In both Figs. 2 and 3, the large differences in 14C between the other FPOM density and chemical fractions far exceed the range of Fm released across temperatures during combustion of the individual fractions. Indeed, as reported by Schrumpf et al. (2021), much of the combusted C from MOM fractions had very similar 14C signatures (small range of Fm), except for the highest Ea fractions of MOM and bulk soil.
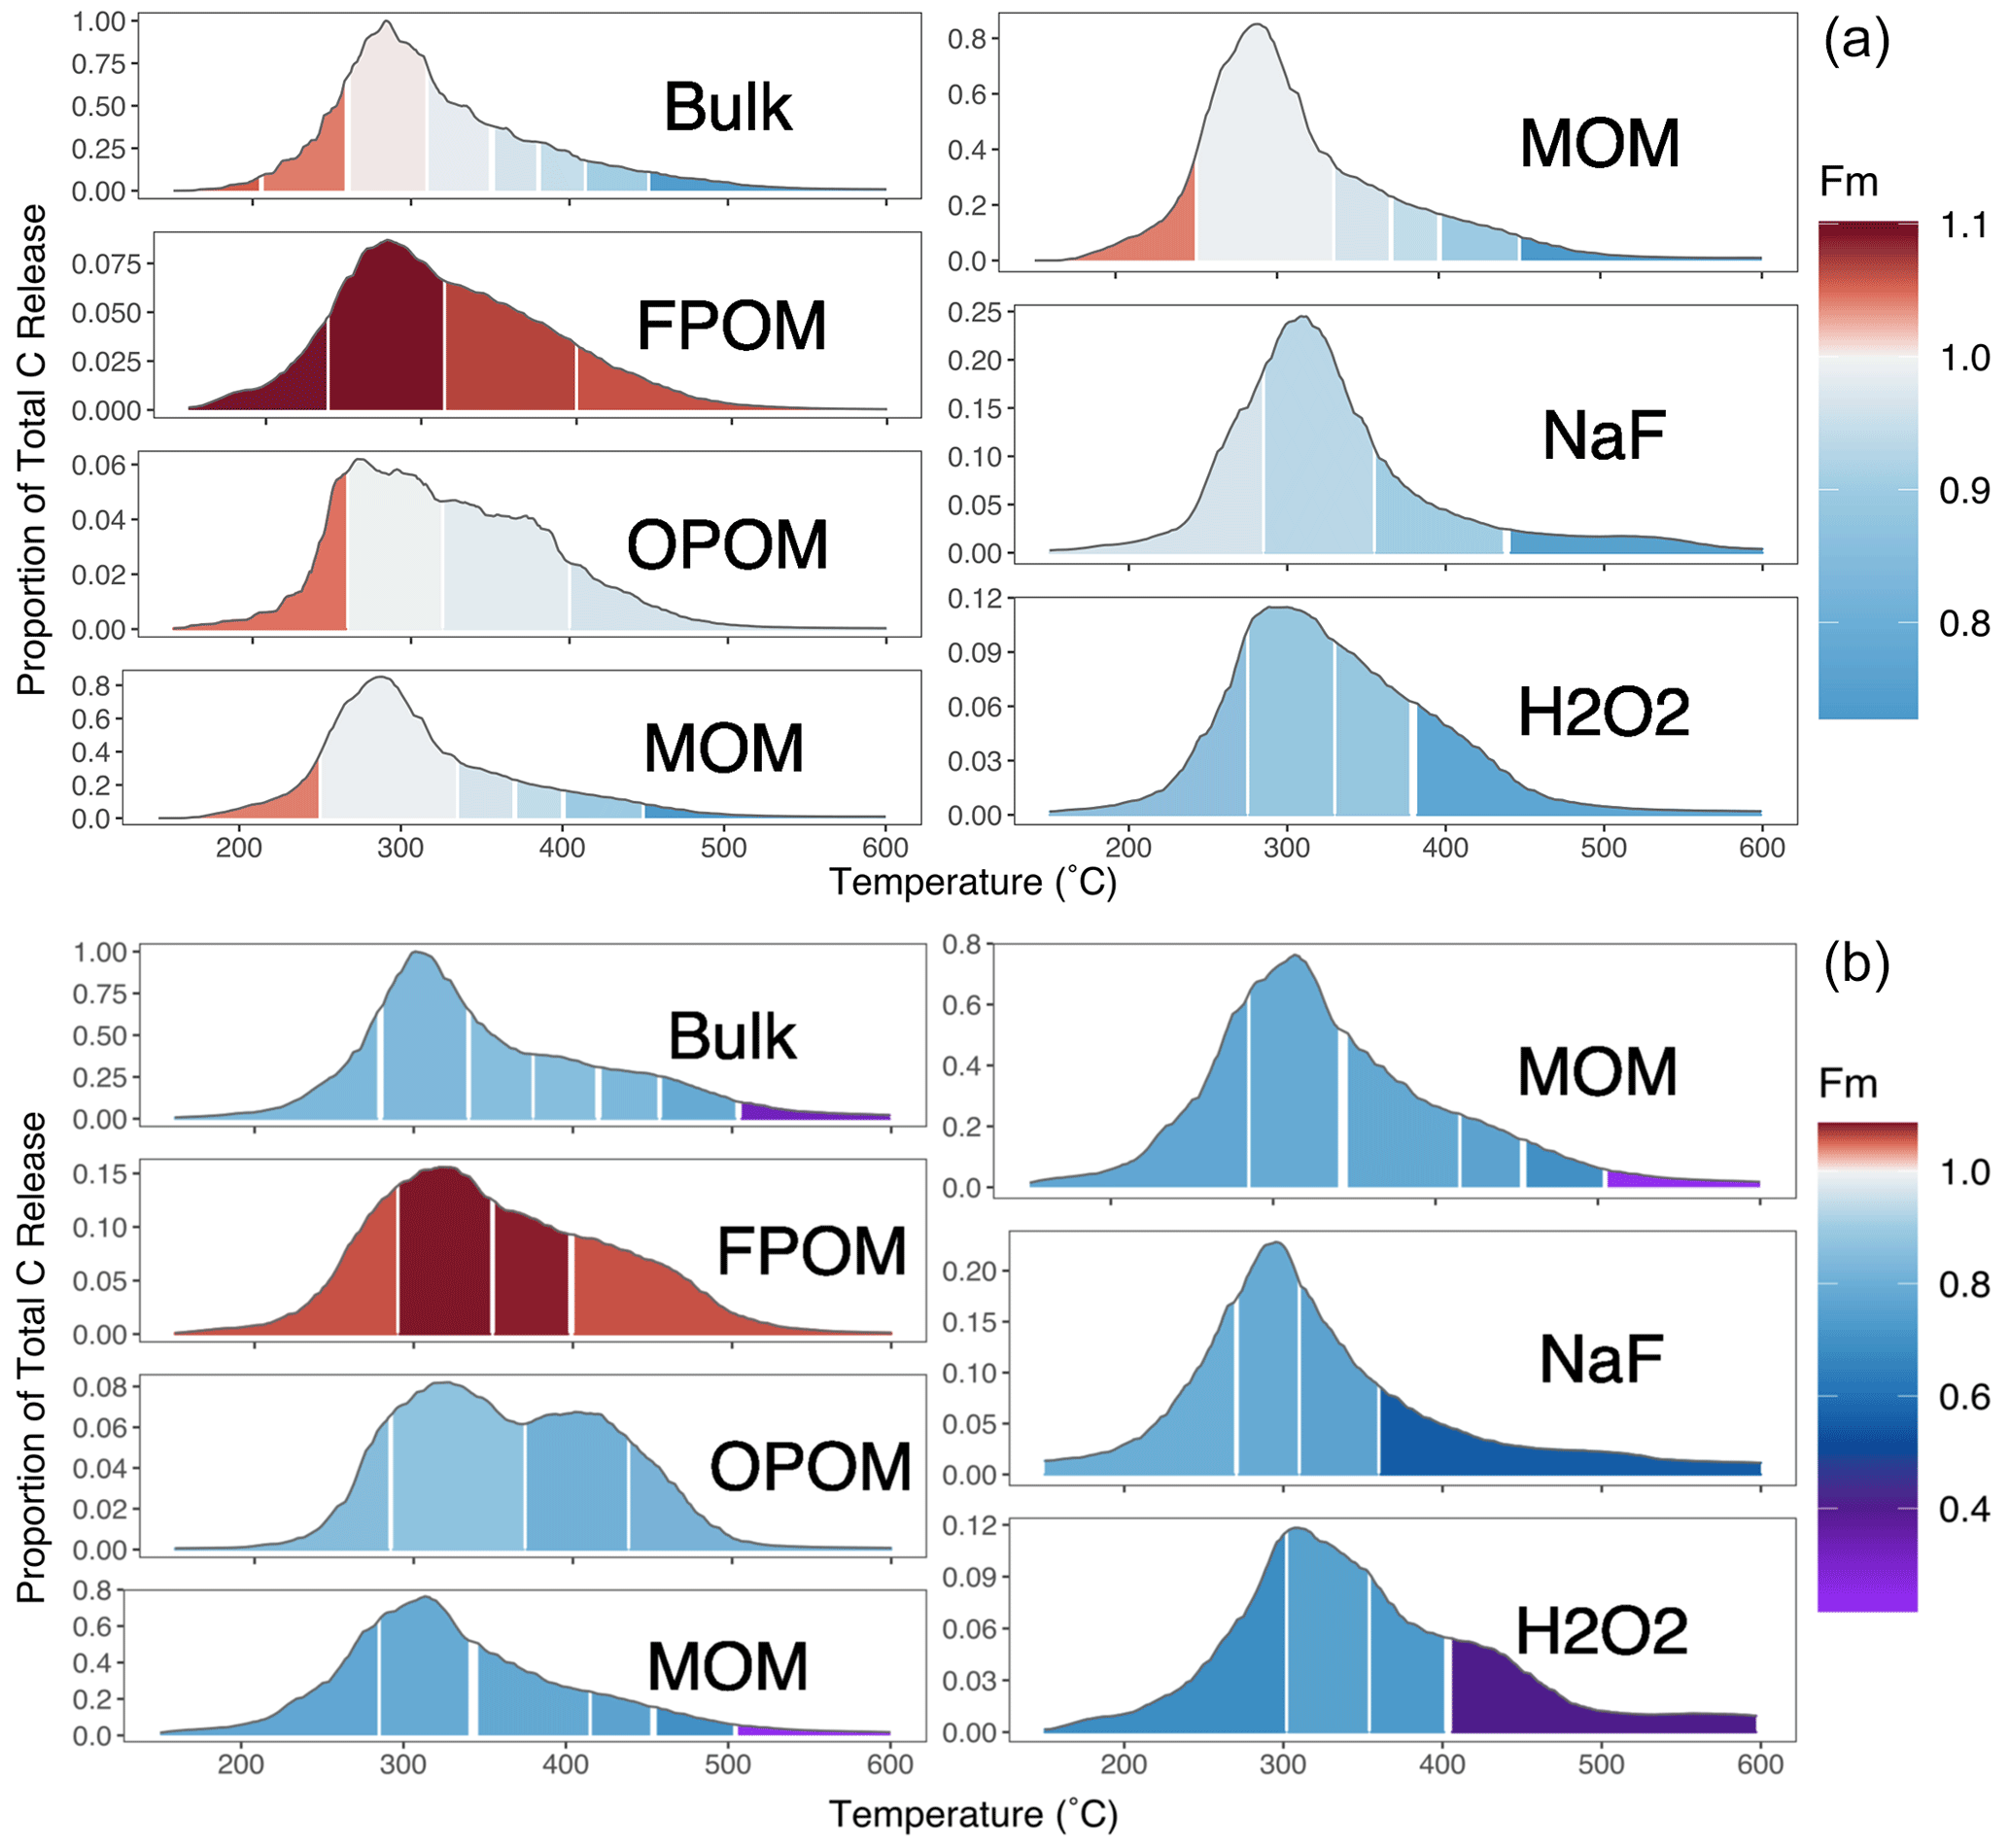
Figure 2Thermograms with radiocarbon measurements: (a) 0–10 and (b) 30–50 cm. Left-hand column y-axis values represent contribution to the total (bulk soil) C. NaF Res. and H2O2 Res. panels are scaled in proportion to their total C contribution to MOM. Color scale indicates the fraction modern (Fm) of the C released in each temperature range; the scale is doubled above Fm 1 to emphasize differences between post-bomb 14C (Fm > 1.0) and 14C that has undergone significant radioactive decay (Fm < 1).
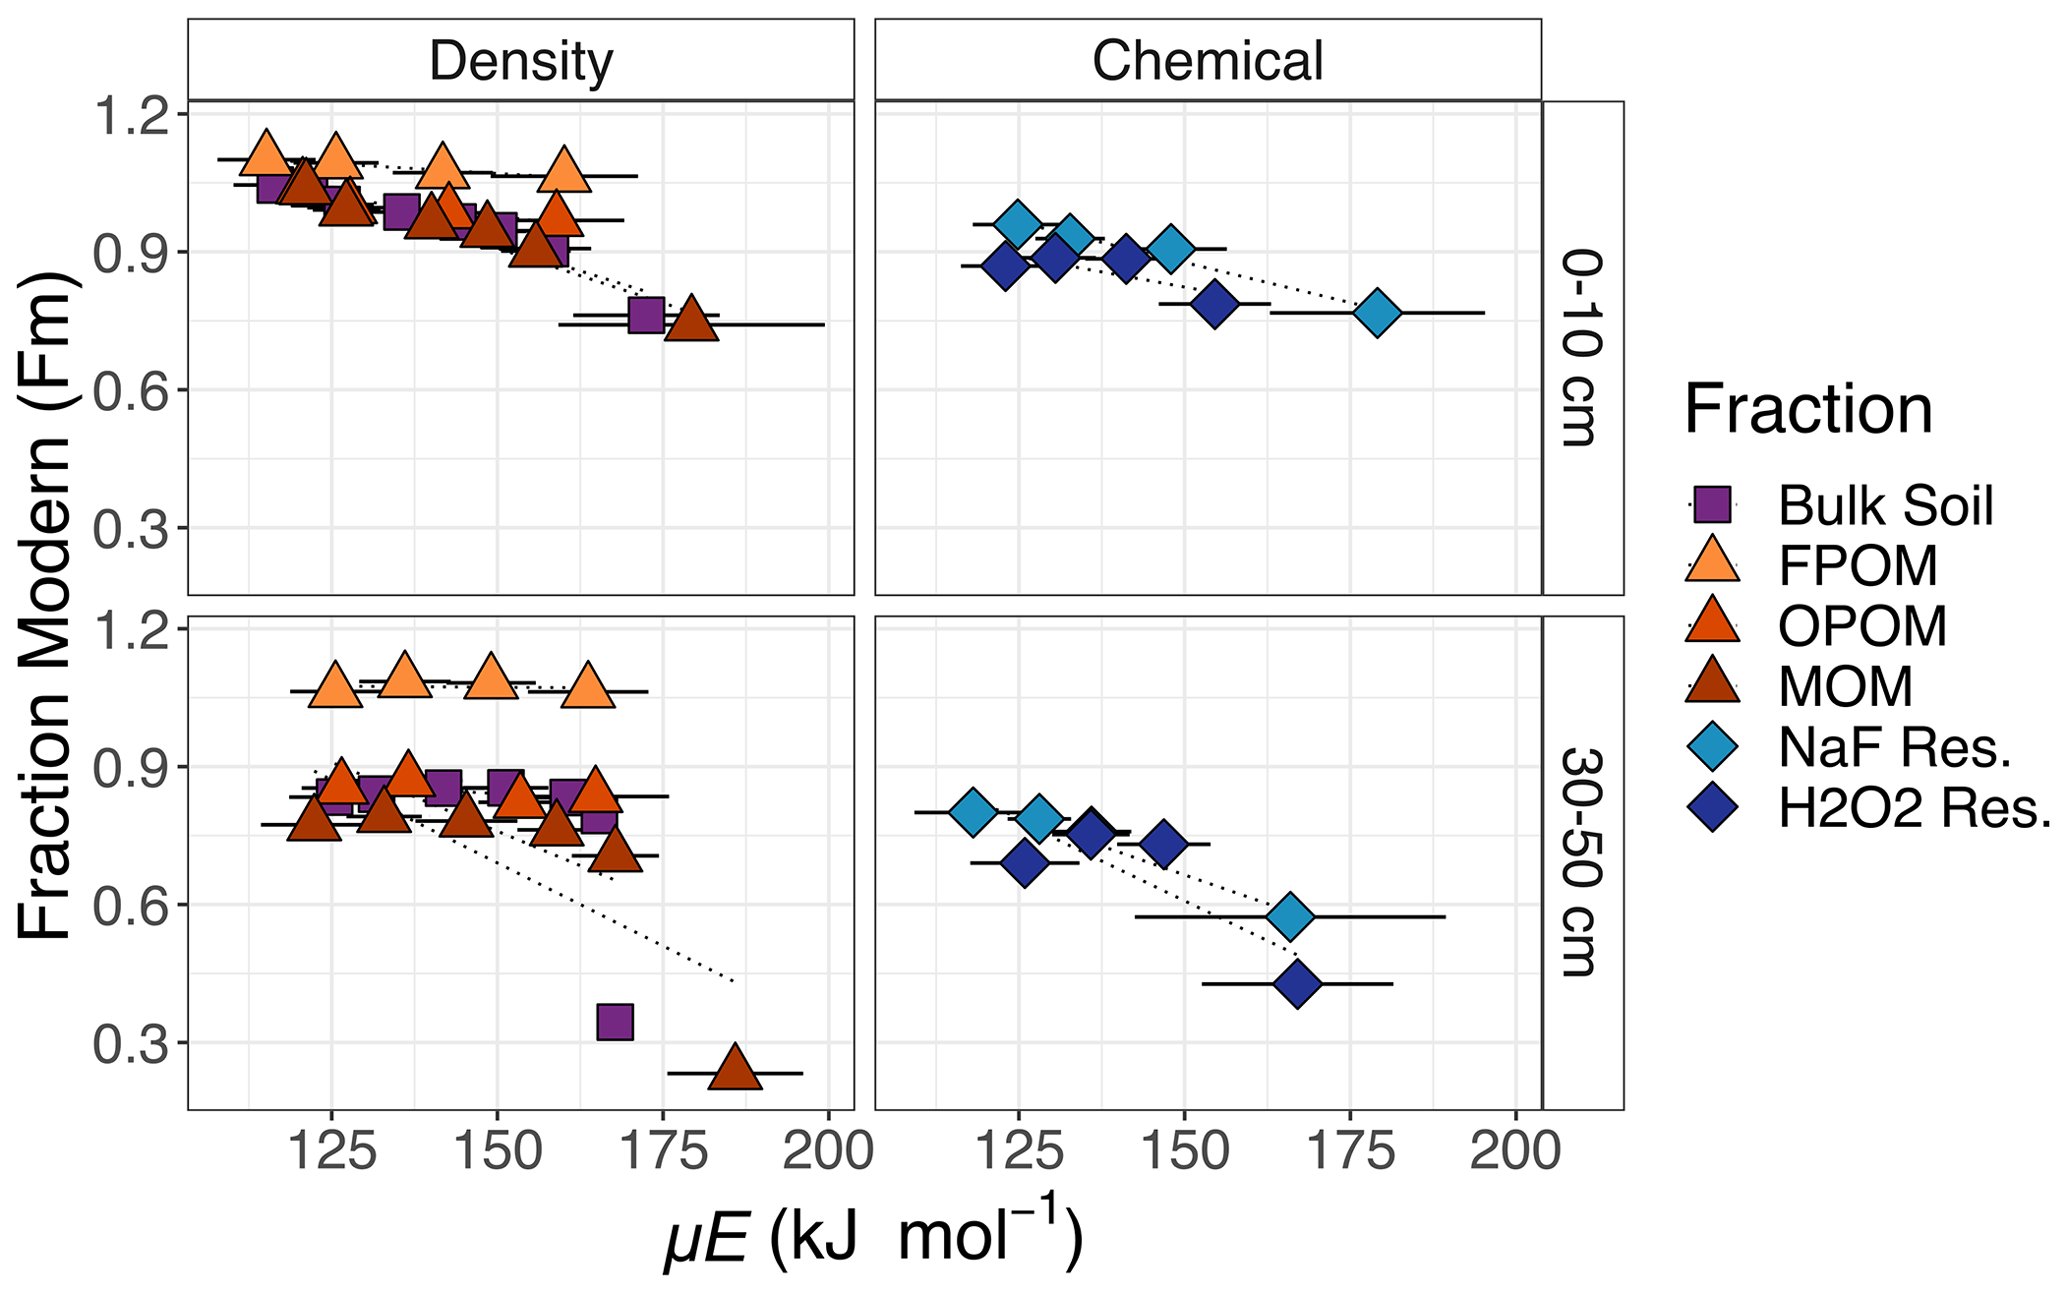
Figure 3Radiocarbon (Fm) as a function of mean activation energy (μE) for C collected across different temperature intervals from combustion of bulk soil, compared with those of combusted component density and chemical fractions. Horizontal bars represent σE for each thermal fraction, which indicates the range of activation energies represented by a given thermal fraction.
For the bulk soil and MOM fraction in the surface sample and FPOM fractions at both depths, the C oxidized at the lowest temperature had Fm > 1, indicating that a portion of the C in the fraction was fixed mostly in the last 60 years. For the FPOM fractions with Fm > 1, 14C values are not as simply related to the “age” of the C. For example, the most recently fixed C could have lower values than the mean but so could older C if that is a mixture of pre- and post-bomb C. For all samples other than FPOM, the decline in Fm 14C indicates a clear trend of increasing age (decreasing Fm, indicating more time for radioactive decay of 14C) especially at temperatures above that where most C was released (Fig. 2). The highest-temperature thermal fractions (Fmax, mostly 450–800 ∘C; Supplement Tables S1 and S2) of surface bulk soil and MOM were similarly depleted in 14C and much older than any other values measured (Fig. 2).
In subsoils (30–50 cm), bomb 14C was found only in the FPOM fractions, so the decline in 14C with energy was determined mostly by the much lower 14C of C released at high temperatures (Fig. 3). All fractions except the NaF residue (NAF Res.) increased in Fm from the C collected in F1 and F2 (and F3 in bulk soil) temperature ranges (140–375 ∘C), followed by decreases at increasingly higher temperatures. Excluding FPOM and OPOM, all fractions decreased significantly in Fm in Fmax compared to the temperature range previous.
The chemical fractionation residues contained C with lower Fm than the unextracted MOM at all temperature ranges except in the highest temperature range collected. However, the highest temperature fraction collected for the MOM was greater (505–750 ∘C) because insufficient C evolved from the chemical fraction residues in this range (Fig. 3). Thermograms for the chemical residues follow a similar pattern to those of MOM, with a small amount of younger but chemically resistant C released at low temperatures and much older C released in Fmax. As noted above, although the chemical residues contained less than 30 % of the total MOM C (Table 1), their thermograms were very similar. The very old Fmax thermal fractions in the chemical residues represent only a small amount (1 %–4 %) of the total bulk soil C (Supplement Tables S1 and S2).
3.3 δ13C
The δ13C of CO2 released from SOM generally increased with temperature in bulk soil and all fractions. The range of δ13C values from F1 to Fmax was the greatest (increasing by 4 ‰–5 ‰) for the chemical residues and smaller (3 ‰–4 ‰) for the density fractions. Across density fractions, the range of values and the differences in δ13C between different fractions was greater in the deeper soil layer. Interestingly, the FPOM at 30–50 cm was more enriched in 13C than OPOM. At high temperatures subsoil δ13C was generally more enriched than surface soil.
3.4 Contributions of different physical fractions to the thermal oxidation of bulk SOM
Thermograms (Fig. 1) demonstrate that C released by the bulk sample at all temperatures contains C contributed from all physical and chemical fractions. For example, of the bulk C released in the temperature range where most C was released (250 to 325 ∘C), FPOM and OPOM contributed 9 % and 6 %, respectively, of total C released in surface soil and 16 % and 8 % in subsoil (Table 1, Fig. 1a). However, at higher temperature ranges, while the total C released was small (< 5 % of the total C) the proportional contribution from FPOM and OPOM fractions increased to ∼ 40 % in surface soil and 30 % in subsoil (Fig. 1c).
Thus, each thermal fraction from a combusted bulk soil contains C with a broad range of Fm and 13C, with variable contributions from the different physically fractionated components. Figure 5 summarizes the Fm distribution of C across the density and thermal fractions and emphasizes that the difference in Fm between density fractions (especially FPOM versus MOM) is greater than the range of Fm within any individual density fraction (excluding a small amount of very old MOM) released as a function of temperature or Ea (Fig. 5).
The measured distribution of 14C for C released with increasing temperature from the bulk soil clearly does not capture the contribution of FPOM with high Fm because its young C is released across the same temperature ranges as other density and chemical fractions (Figs. 1a, 1c, 3, 4). Thus, the surface soil age distribution misses the ∼ 9 % of total C in FPOM that has a much higher 14C signature than bulk soil; instead, its contributions skew the bulk soil thermal 14C (Fig. 5, wide bars in the middle of the distribution) higher than the separated MOM thermal fractions (green). This difference is even more pronounced in the subsoil.
With a sufficient number of thermal fractions at high temperatures, thermal analysis of the bulk soil C captured the small percentage of C with very depleted 14C signatures better than the chemical fractions that still mixed younger and older constituents. In surface soil, bulk soil Fmax 14C values (Fm 0.75) were comparable to Fmax fractions of NaF Res. and H2O2 Res. (Fm 0.76 and 0.78, respectively) and represented similar amounts of C (2.6 %, 2.7 %, and 3.0 % of total C, respectively) (Supplement Table S1). Bulk subsoil Fmax isolated older C (Fm 0.32, 5 % of total C) than Fmax values of NaF and H2O2 residues (Fm 0.56, 8.1 % total C and Fm 0.41, 3.8 % total C, respectively), but high-temperature samples were not collected for these fractions because of low C yield (Supplement Table S2).
Table 1Summary information of bulk soil and fraction thermal stability and isotopic compositions, including activation energy indices. Fm signifies fraction modern 14C.
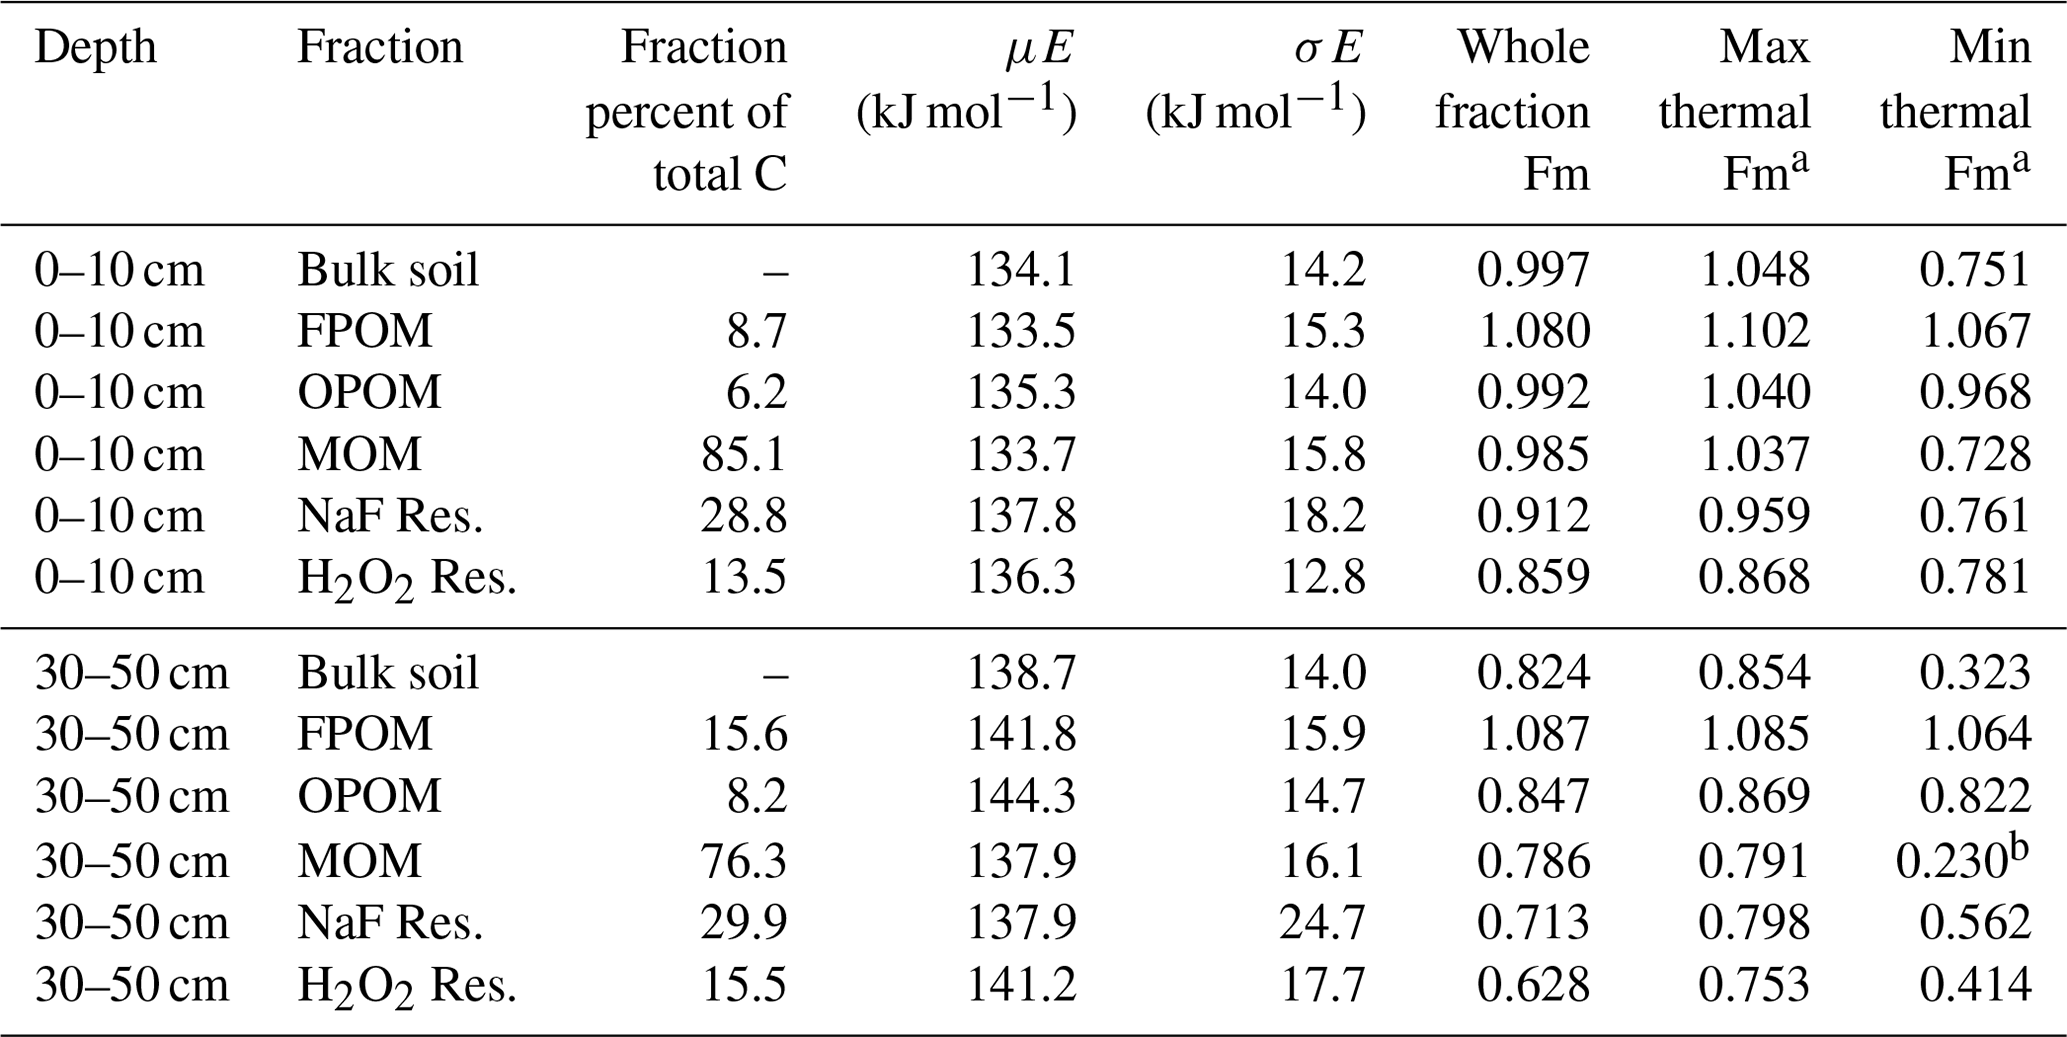
a Maximum and minimum 14C content collected via thermal fractionation within the sample. b Value calculated by mass balance, ± 0.02 Fm.
A main goal of this work is to compare the thermal oxidation profiles and 14C age structures of thermally fractionated SOM with more frequently applied physical (density) and chemical separation methods in a Podzol at two depths. It is critical to find methods to quantify the age distribution of C in SOM, both to relate its persistence to processes operating in soil and to provide better constraints for testing models of soil C cycling. While density and chemical fractions have proved useful, thermal fractionation offers the advantages of being less expensive and allowing for rapid analysis of the total sample C content. Based on our results, we suggest that the separation of FPOM followed by thermal analysis provides the best characterization of the 14C (age) distribution of C in SOM.
4.1 Activation energy can predict age within a fraction but not between fractions
Thermal fractionation of bulk soils and component physically and chemically separated SOM fractions demonstrate that increased thermal stability (i.e., higher Ea) is associated with lower radiocarbon (14C) content (i.e., older C ages; Fig. 3) and more enriched 13C content (i.e., more microbially processed; Fig. 4). This supports the general assumptions of thermal analysis, which is that older and more microbially processed/degraded C will be released with increasing temperatures, even among fractions like FPOM that are not associated with minerals (Plante et al., 2009). Because there are large differences in Fm between the physically and chemically separated fractions, C released with similar activation energies (i.e., in a given thermal fraction of bulk soil) therefore can mix C with a very different chemistry and 14C age.
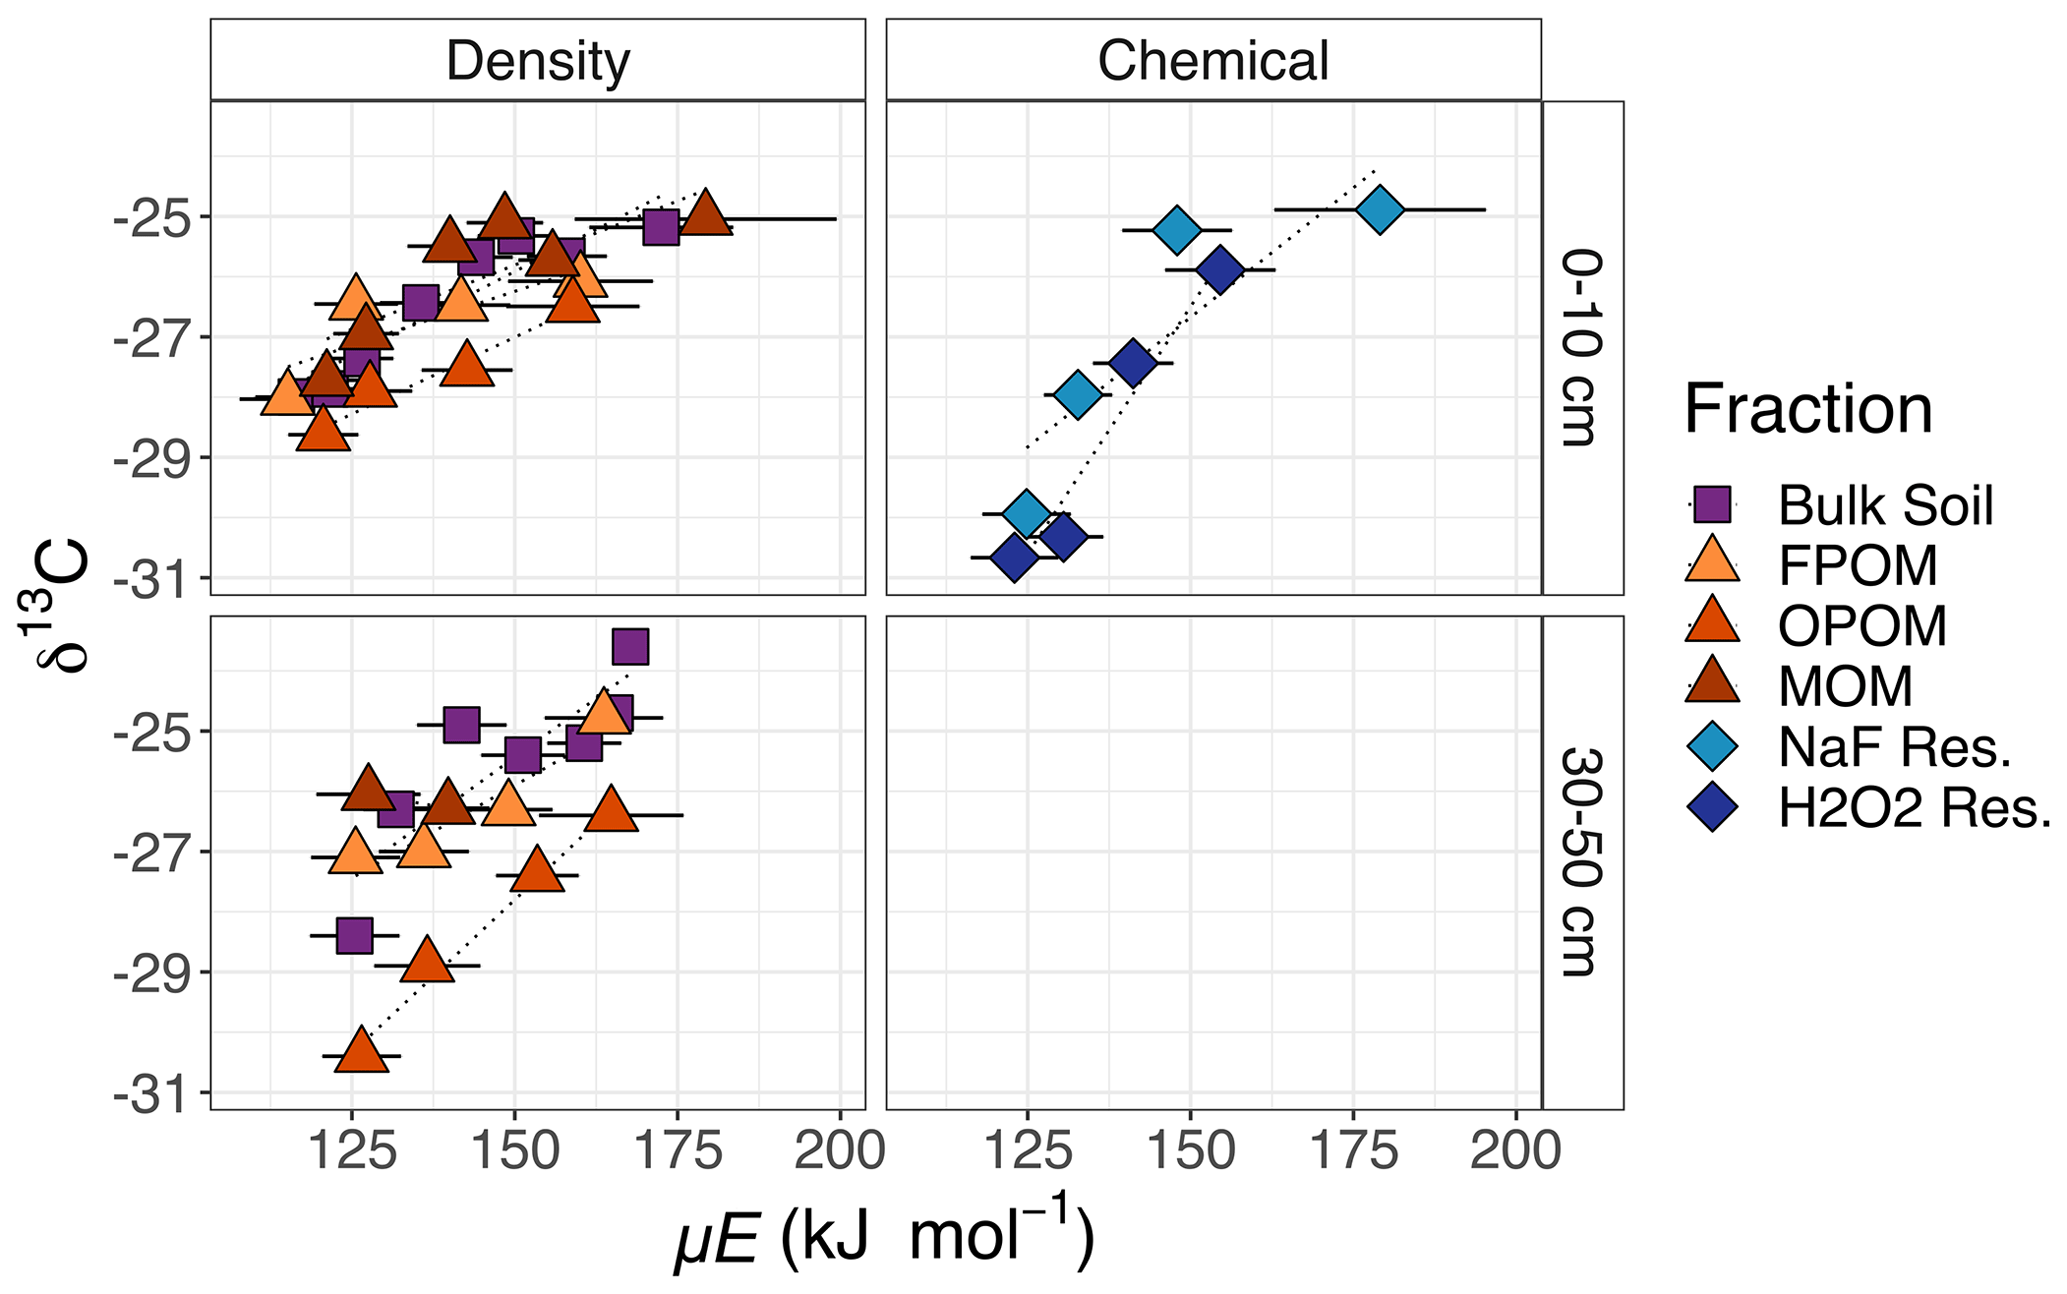
Figure 4δ13C measured for each fraction as in Fig. 3. Low C content and limited sample material prevented data collection from some fractions (MOM, NaF Res., H2O2 Res. in subsoil). Right-hand labels denote depth in centimeters.
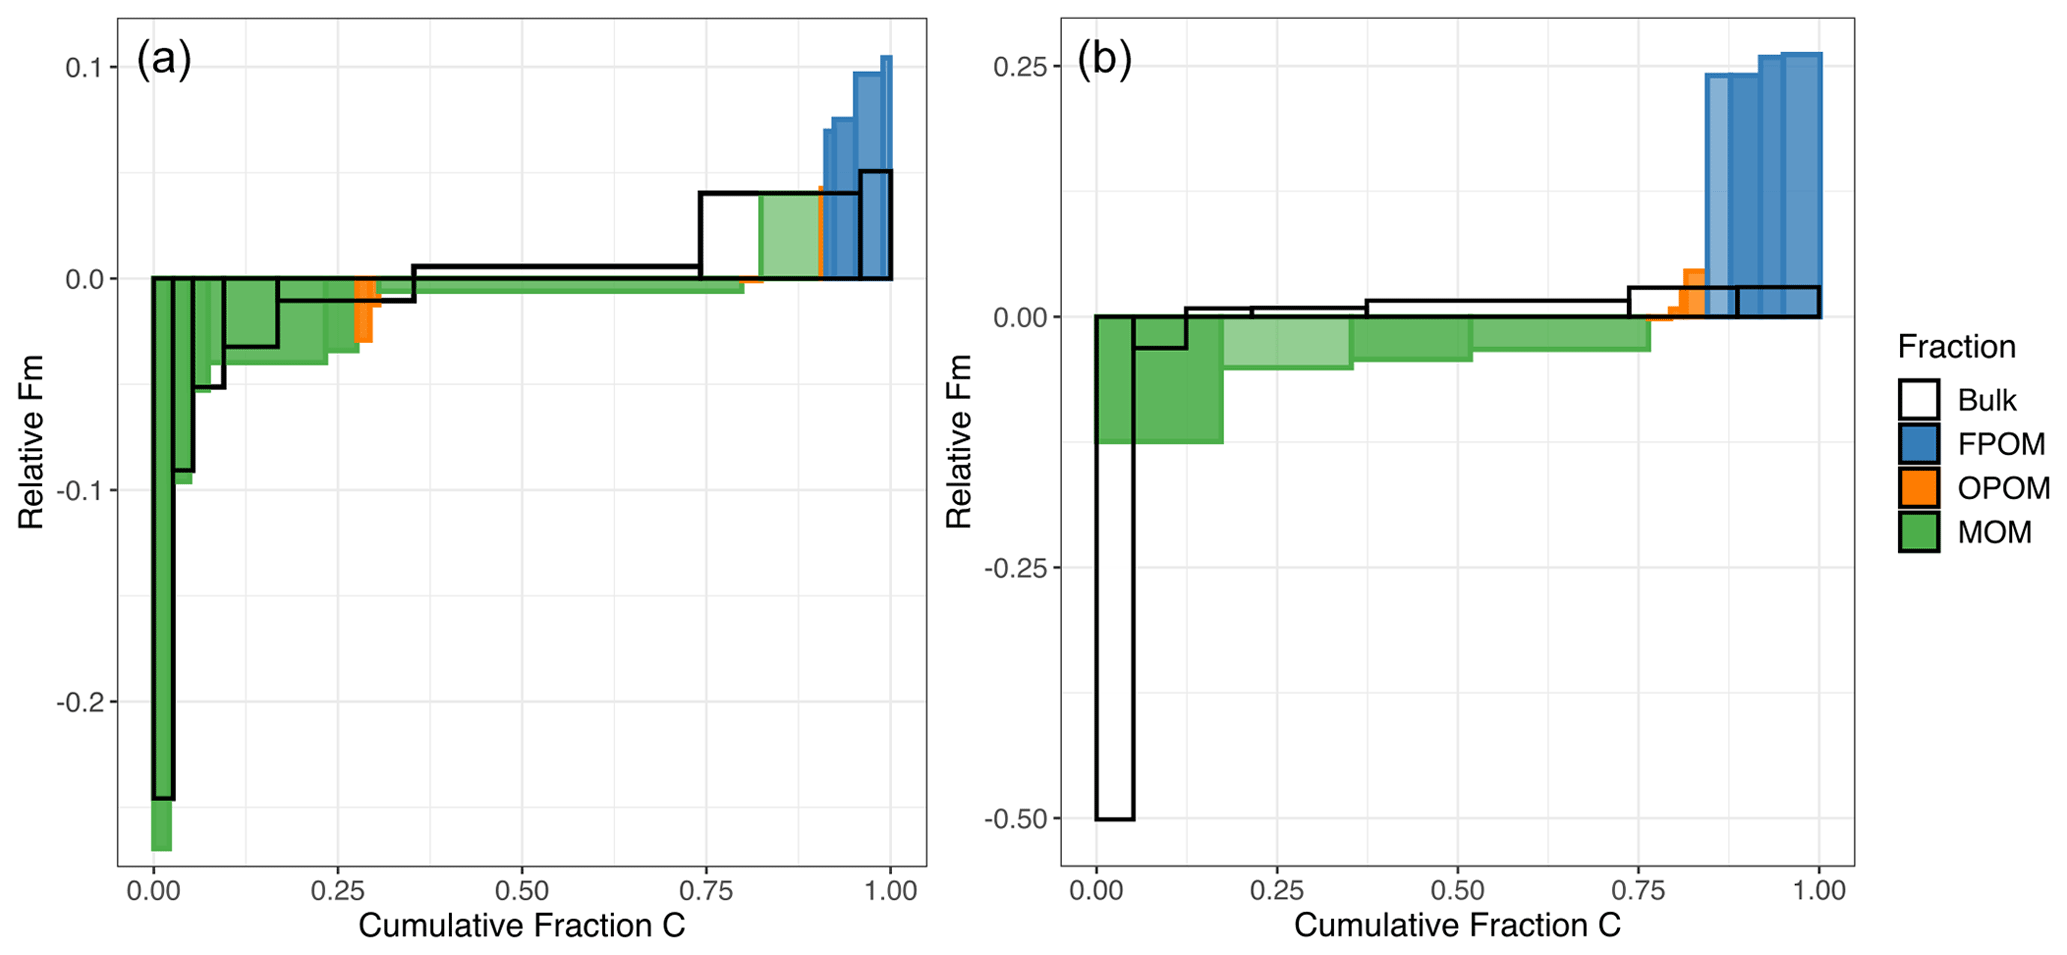
Figure 5Comparison of the cumulative Fm distribution of C released during thermal fractionation of bulk soil versus oxidation of physically and chemically separated density fractions in the topsoil (a; 0–10 cm) and subsoil (b; 30–50 cm). The height of each histogram element represents the Fm 14C, normalized to the overall bulk Fm value. Effectively, values above 0 contain more 14C than bulk soil, and values below 0 contain less. The width of bars corresponds to the proportion of total soil C in the fraction. The unfilled histogram elements (no color) represent thermal fractions from the bulk soil, while the colored bars represent the thermally fractionated FPOM, OPOM, and MOM fractions shown in previous figures. Darker colors within a fraction correspond to higher Ea fractions, and lighter colors reflect cooler/lower Ea fractions. Both are ordered by the 14C content, with the lowest on the left and highest on the right.
For example, particulate fractions FPOM and OPOM that contain fresh plant material, as well as microbial residues (Castanha et al., 2008; Angst et al., 2021), release C across a similar temperature range as MOM. While presumably “labile”, FPOM releases C between 300–500 ∘C, reflecting the temperatures required to oxidize molecules like cellulose that make up plant material (Dahiya and Rana, 2004; Plante et al., 2009). Despite a range of activation energies, δ13C signatures (Fig. 4), and high σE (Table 1) all suggesting chemical diversity, FPOM in this soil is all recent in origin (post-bomb, Fm > 1.0; Fig. 3) and typically breaks down within decades. Because of the temporal dynamics of the bomb spike, an increase or decrease in Fm is more difficult to associate directly to specific age for FPOM, and it is difficult to associate Ea directly to 14C values.
Mineral-associated organic matter (MOM) fractions demonstrated larger though mostly overlapping ranges of Ea but released 14C-depleted and 13C-enriched C above 165 kJ mol−1 (Figs. 2–4). For most MOM thermal fractions, Fm less than 1.0 reflects the loss of 14C due to radioactive decay and therefore indicates an increase in age. Thus, within a given fraction there are predictable patterns of increasing age and δ13C with Ea. However, as found in other studies (Leifeld and von Lützow, 2014; Williams et al., 2018; Hemingway et al., 2019), these patterns do not allow the prediction of age from Ea alone, highlighting fundamental differences in the processes controlling Ea, 14C content, and age in each fraction. While Ea can either increase or decrease over time as C transforms with decomposition and recycling, the age of the involved C atoms can only increase.
4.2 Age structure of MOM
Both chemical and thermal fractionation methods for MOM indicate the presence of two distinct components with very different Fm, one representing > 95 % of the C and having Fm similar to that of the bulk MOM but decreasing in 14C with increasing Ea, as well as a small amount (< 5 %) of much older C. In this Podzol, the main stabilization mechanisms are likely the interactions between percolating dissolved organic matter and pedogenic (oxy-)hydroxides that could explain the large amount of relatively younger C (decades to centuries) removed by NaF and H2O2 (Fig. 1b) that represents the largest thermal fraction of the MOM (F2). As shown by Schrumpf et al. (2021), the chemical extraction and oxidation of MOM using NaF and H2O2, respectively, removed C that was slightly higher in 14C concentration than the MOM overall, leaving smaller but much older residues that resist destabilization. The majority of MOM C removed through chemical fractionation had similar, younger ages that could reflect SOM more weakly associated with mineral surfaces, while the small proportion remaining could have been trapped within the mineral structure (e.g., in clays on formation) or represent elemental C. Both methods support the idea put forward by Schrumpf et al. (2021) that much of the MOM was cycling on decadal timescales, while a small amount (< 10 %) was much older (Fm 0.628). However, thermal methods demonstrate that the 3 % of subsoil MOM oxidized at temperatures greater than 505 ∘C was even older (Fm 0.23; Fig. 3, Table A1).
While NaF and H2O2 treatments removed younger C, combustion of the residues showed that they still contained C with a range of activation energies and ages. The chemical methods used here are believed to only remove sorbed C that likely has higher Fm (i.e., is younger) than the residue (Kaiser et al., 2007; Mikutta and Kaiser, 2011). These results are somewhat puzzling, as particularly the H2O2 treatment is expected to remove all easily oxidizable C, leaving behind C that is either isolated or highly “recalcitrant”. We therefore expected that the H2O2 residue would not only be older but also on average have higher Ea. On the contrary, there was actually proportionally less C in Fmax for both residues compared to the unextracted MOM (Figs. 1, 3) such that the oldest C in the residues was likely mixed with younger C. The observation that H2O2 residues had a range of activation energies and 14C ages could indicate incomplete chemical oxidation or interaction of the OM associated with dissolved pedogenic phases with the remaining mineral phases. Alternatively, the presence of low Ea material with very low 14C could reflect the incorporation of sedimentary shale parent material C into microbial food webs with long-term stabilization of microbial residues (Seifert et al., 2013).
Understanding the nature of the small amount of very old C found in MOM and bulk soil and explaining the age and δ13C structure of the NaF and H2O2 residue thermal fractions require additional information. One possibility is that the oldest C persists in the form of charcoal (Cusack et al., 2012; Sanderman et al., 2016) or is derived from the shale parent material of the Wetzstein site (Schrumpf et al., 2011; Grant et al., 2023). Unpublished 14C data collected from the surface of rock fragments found in the soil indicate a Fm of 0.27, similar to values calculated for subsoil MOM Fmax fractions (Table 1). The thermal alteration of sedimentary parent material during metamorphosis could also explain the chemical recalcitrance, heavier δ13C, and higher activation energies of this very old C. A second possibility is the presence of non-crystalline minerals that are often correlated with the amount of very old C found in soil (Huang et al., 2016; Khomo et al., 2017; Heckman et al., 2018a). The investigated soils have moderate oxalate extractable Fe contents of 9.2 (0–10 cm) and 17.4 (30–50 cm) g kg−1 (Schrumpf et al., 2021). Dithionite extractable Fe concentrations (including both crystalline and non-crystalline components) were 17 and 27.4 g kg−1, respectively. However, quantifying such effects would require investigation of soils with varying amounts of non-crystalline minerals. A third explanation of long SOM persistence is the stochastic nature of the decomposition process. Available C is not uniformly decomposed, and some substrate may persist in soil on much longer timescales (Bolin and Rodhe, 1973; Bosatta and Ågren, 1985; Sierra et al., 2018). Through random chance associated with biological, chemical, and physical processes, a small portion of total SOM remains in soil for centuries to millennia. Such persistent C may be associated with the high activation energies measured here.
4.3 Suggested procedure for measuring the 14C distribution of organic C in bulk soils
The goal of any fractionation scheme for 14C analysis is to provide clearer delineation of C ages in soil, which integrates multiple types of SOM and stabilization mechanisms. Combining operationally defined fractionation methods can further isolate distinct pools of C with varying 14C ages. Such age distributions can be used to constrain models of SOM dynamics (Sierra et al., 2014; Metzler et al., 2018; Chanca et al., 2022) and test hypotheses linking stabilization mechanisms with rates of C cycling. Overall, Fig. 5 demonstrates that density fractionation alone cannot quantify the age structure of bulk SOM, especially of MOM, while thermal fractionation of bulk SOM fails to capture the youngest part of the age distribution. This is because the youngest component of the soil C, the low-density FPOM, releases C across nearly the entire range of combustion temperatures (Fig. 1c), making the C released from bulk soil at the lowest temperature reflect 14C ages that are too old and the C released at higher temperatures too young. At the highest temperatures, however, thermal oxidation methods can isolate C even older than what can be found via aggressive chemical extractions (Fig. 3). At the very highest temperatures, the contributions of C from oxidation of FPOM and OPOM are relatively small (Figs. 1c, 2) but may skew data with much younger C.
In order to best capture the age distribution of C in SOM, we therefore recommend first separating the low-density fraction, then applying thermal fractionation of the heavy fraction with attention to C liberated at very high temperatures to constrain and describe the age structure of MOM. As removal of the FPOM can also be accomplished using size separation, density separation may not be necessary if the main goal is to remove relatively fresh plant material (Castanha et al., 2008; Lavallee et al., 2020). However, the presence of charcoal that would be removed by density but not size could complicate the interpretation of thermal fractions, and further work is needed to resolve this special circumstance.
Describing the distribution of ages in SOM is a powerful tool for testing hypotheses about the timescales of different C stabilization mechanisms in soils and for comparison with age distributions produced by multi-compartment models (Metzler et al., 2018; Chanca et al., 2022). Our results are for a single soil, a Podzol that likely has one major mechanism for stabilizing C on mineral surfaces: interaction with pedogenic oxides. To explore other mineral stabilization mechanisms and timescales, it would be useful to compare thermograms and age distributions for soils with different mineral composition – e.g., allophane, 2:1 clays, 1:1 clays, sands, and mixed mineralogy soils. Additionally, a comparison with temperature-resolved spectra (e.g., py-GC/MS; Sanderman and Grandy, 2020; DRIFTS; Nkwain et al., 2018) that associate SOM chemistry with thermal stability may help in determining the roles that OM chemistry and mineralogy play in controlling C age and persistence in soil.
Each density and chemical fraction contained a spectrum of SOM ages. FPOM and OPOM displayed more homogeneous ages, while the MOM fraction displayed two distinct age components in this Podzol, identified in both topsoil and subsoil: likely the younger component that represents the majority of MOM stabilized by association with pedogenic (oxy-)hydroxides, as well as the much older component possibly inherited from shale parent material.
We conclude that thermal fractionation cannot completely replace standard fractionation methods to connect SOM properties (e.g., activation energy) to age distributions. Fresh FPOM contributes young C of homogenous age across temperatures up to 550 ∘C and thus dilutes the signal of older C from other fractions. This method was effective at identifying multiple stabilization timescales on the MOM fraction, suggesting complex dynamics that may react across multiple timescales including those relevant to climate and management change. We thus recommend separating and measuring 14C of FPOM and then analyzing thermal fractions of MOM to help distinguish faster- and slower-cycling mineral-associated components. This additional fractionation helps us to go beyond using mean 14C values towards characterizing 14C distributions that can provide a more comprehensive description of SOM cycling and potentially a more stringent test for models. Further efforts are needed to explore the effects of diverse mineral stabilization mechanisms on thermograms and 14C distributions of MOM fractions.
Data sets used in this paper are available at Zenodo (https://doi.org/10.5281/zenodo.7998659, Stoner, 2023).
The supplement related to this article is available online at: https://doi.org/10.5194/bg-20-3151-2023-supplement.
SWS and ST designed, constructed, and tested method hardware and protocols. Data were collected by SWS and analyzed by SWS and MS with input from all authors. SWS led the writing of the manuscript with significant contribution from ST and input from all authors.
The contact author has declared that none of the authors has any competing interests.
Publisher’s note: Copernicus Publications remains neutral with regard to jurisdictional claims in published maps and institutional affiliations.
This work was funded by the European Research Council (Horizon 2020 Research and Innovation Program; grant no. 695101; 14Constraint) and the Max Planck Society. We gratefully acknowledge our reviewers who helped improve the manuscript. We thank Axel Steinhof and Xiaomei Xu for their invaluable assistance in developing the equipment and methods used in this study. We also thank the staff of the Max Planck Institute for Biogeochemistry, UC Irvine, and the Woods Hole Oceanographic Institute for their assistance in radiocarbon sampling and data preparation. Finally, we thank the CarboEurope Project for access to the archived soils used in this study.
This research has been supported by the European Research Council, H2020 European Research Council (grant no. 695101).
The article processing charges for this open-access publication were covered by the Max Planck Society.
This paper was edited by Edzo Veldkamp and reviewed by Alain F. Plante and one anonymous referee.
Anderson, D. W. and Paul, E. A.: Organo-Mineral Complexes and Their Study by Radiocarbon Dating, Soil Sci. Soc. Am. J., 48, 298–301, https://doi.org/10.2136/sssaj1984.03615995004800020014x, 1984.
Angst, G., Mueller, K. E., Nierop, K. G. J., and Simpson, M. J.: Plant- or microbial-derived? A review on the molecular composition of stabilized soil organic matter, Soil Biol. Biochem., 156, 108189, https://doi.org/10.1016/j.soilbio.2021.108189, 2021.
Baisden, W. T. and Canessa, S.: Using 50 years of soil radiocarbon data to identify optimal approaches for estimating soil carbon residence times, Nucl. Instrum. Method. Phys. Res. B, 294, 588–592, https://doi.org/10.1016/j.nimb.2012.06.021, 2013.
Balesdent, J.: The turnover of soil organic fractions estimated by radiocarbon dating, Sci. Total Environ., 62, 405–408, https://doi.org/10.1016/0048-9697(87)90528-6, 1987.
Basile-Doelsch, I., Balesdent, J., and Pellerin, S.: Reviews and syntheses: The mechanisms underlying carbon storage in soil, Biogeosciences, 17, 5223–5242, https://doi.org/10.5194/bg-17-5223-2020, 2020.
Bianchi, T. S., Galy, V., Rosenheim, B. E., Shields, M., Cui, X., and Van Metre, P.: Paleoreconstruction of organic carbon inputs to an oxbow lake in the Mississippi River watershed: Effects of dam construction and land use change on regional inputs, Geophys. Res. Lett., 42, 7983–7991, https://doi.org/10.1002/2015GL065595, 2015.
Bolin, B. and Rodhe, H.: A note on the concepts of age distribution and transit time in natural reservoirs, Tellus, 25, 58–62, https://doi.org/10.1111/j.2153-3490.1973.tb01594.x, 1973.
Bosatta, E. and Ågren, G. I.: Theoretical analysis of decomposition of heterogeneous substrates, Soil Biol. Biochem., 17, 601–610, https://doi.org/10.1016/0038-0717(85)90035-5, 1985.
Castanha, C., Trumbore, S., and Amundson, R.: Methods of separating soil carbon pools affect the chemistry and turnover time of isolated fractions, Radiocarbon, 50, 83–97, https://doi.org/10.1017/S0033822200043381, 2008.
Chanca, I., Trumbore, S., Macario, K., and Sierra, C. A.: Probability Distributions of Radiocarbon in Open Linear Compartmental Systems at Steady-State, J. Geophys. Res.-Biogeo., 127, 1–23, https://doi.org/10.1029/2021JG006673, 2022.
Cotrufo, M. F., Ranalli, M. G., Haddix, M. L., Six, J., and Lugato, E.: Soil carbon storage informed by particulate and mineral-associated organic matter, Nat. Geosci., 12, 989–994, https://doi.org/10.1038/s41561-019-0484-6, 2019.
Cusack, D. F., Chadwick, O. A., Hockaday, W. C., and Vitousek, P. M.: Mineralogical controls on soil black carbon preservation, Global Biogeochem. Cy., 26, 1–10, https://doi.org/10.1029/2011GB004109, 2012.
Dahiya, J. B. and Rana, S.: Thermal degradation and morphological studies on cotton cellulose modified with various arylphosphorodichloridites, Polym. Int., 53, 995–1002, https://doi.org/10.1002/pi.1500, 2004.
De Coninck, F.: Major mechanisms in formation of spodic horizons, Geoderma, 24, 101–128, 1980.
Feng, X. and Simpson, M. J.: Temperature responses of individual soil organic matter components, J. Geophys. Res.-Biogeo., 113, 1–14, https://doi.org/10.1029/2008JG000743, 2008.
González-Pérez, J. A., Chabbi, A., de la Rosa, J. M., Rumpel, C., and González-Vila, F. J.: Evolution of organic matter in lignite-containing sediments revealed by analytical pyrolysis (Py-GC-MS), Org. Geochem., 53, 119–130, https://doi.org/10.1016/j.orggeochem.2012.08.001, 2012.
Grandy, A. S., Strickland, M. S., Lauber, C. L., Bradford, M. A., and Fierer, N.: The influence of microbial communities, management, and soil texture on soil organic matter chemistry, Geoderma, 150, 278–286, https://doi.org/10.1016/j.geoderma.2009.02.007, 2009.
Grant, K. E., Galy, V. V., Chadwick, O. A., and Derry, L. A.: Thermal oxidation of carbon in organic matter rich volcanic soils: insights into SOC age differentiation and mineral stabilization, Biogeochemistry, 144, 291–304, https://doi.org/10.1007/s10533-019-00586-1, 2019.
Grant, K. E., Hilton, R. G., and Galy, V.: Global patterns of radiocarbon depletion in subsoil linked to rock-derived organic carbon, Geochem. Perspect. Lett., 25, 36–40, 2023.
Gregorich, E. G., Beare, M. H., McKim, U. F., and Skjemstad, J. O.: Chemical and Biological Characteristics of Physically Uncomplexed Organic Matter, Soil Sci. Soc. Am. J., 70, 975–985, https://doi.org/10.2136/sssaj2005.0116, 2006.
Heckman, K., Lawrence, C. R., and Harden, J. W.: A sequential selective dissolution method to quantify storage and stability of organic carbon associated with Al and Fe hydroxide phases, Geoderma, 312, 24–35, https://doi.org/10.1016/j.geoderma.2017.09.043, 2018a.
Heckman, K., Throckmorton, H., Horwath, W., Swanston, C., and Rasmussen, C.: Variation in the Molecular Structure and Radiocarbon Abundance of Mineral-Associated Organic Matter across a Lithosequence of Forest Soils, Soil Syst., 2, 36, https://doi.org/10.3390/soilsystems2020036, 2018b.
Heckman, K., Hicks Pries, C. E., Lawrence, C. R., Rasmussen, C., Crow, S. E., Hoyt, A. M., von Fromm, S. F., Shi, Z., Stoner, S., McGrath, C., Beem-Miller, J., Berhe, A. A., Blankinship, J. C., Keiluweit, M., Marín-Spiotta, E., Monroe, J. G., Plante, A. F., Schimel, J., Sierra, C. A., Thompson, A., and Wagai, R.: Beyond bulk: Density fractions explain heterogeneity in global soil carbon abundance and persistence, Glob. Change Biol., 28, 1178–1196, https://doi.org/10.1111/gcb.16023, 2022.
Helfrich, M., Flessa, H., Mikutta, R., Dreves, A., and Ludwig, B.: Comparison of chemical fractionation methods for isolating stable soil organic carbon pools, Eur. J. Soil Sci., 58, 1316–1329, https://doi.org/10.1111/j.1365-2389.2007.00926.x, 2007.
Hemingway, J. D.: rampedpyrox: Open-source tools for thermoanalytical data analysis, https://github.com/FluvialSeds/rampedpyrox (last access: 20 June 2022), 2016.
Hemingway, J. D., Rothman, D. H., Rosengard, S. Z., and Galy, V. V.: Technical note: An inverse method to relate organic carbon reactivity to isotope composition from serial oxidation, Biogeosciences, 14, 5099–5114, https://doi.org/10.5194/bg-14-5099-2017, 2017.
Hemingway, J. D., Rothman, D. H., Grant, K. E., Rosengard, S. Z., Eglinton, T. I., Derry, L. A., and Galy, V. V.: Mineral protection regulates long-term global preservation of natural organic carbon, Nature, 570, 228–231, https://doi.org/10.1038/s41586-019-1280-6, 2019.
Huang, X., Jiang, H., Li, Y., Ma, Y., Tang, H., Ran, W., and Shen, Q.: The role of poorly crystalline iron oxides in the stability of soil aggregate-associated organic carbon in a rice-wheat cropping system, Geoderma, 279, 1–10, https://doi.org/10.1016/j.geoderma.2016.05.011, 2016.
Jagadamma, S., Lal, R., Ussiri, D. A. N., Trumbore, S. E., and Mestelan, S.: Evaluation of structural chemistry and isotopic signatures of refractory soil organic carbon fraction isolated by wet oxidation methods, Biogeochemistry, 98, 29–44, https://doi.org/10.1007/s10533-009-9374-0, 2010.
Kaiser, K., Mikutta, R., and Guggenberger, G.: Increased Stability of Organic Matter Sorbed to Ferrihydrite and Goethite on Aging, Soil Sci. Soc. Am. J., 71, 711–719, https://doi.org/10.2136/sssaj2006.0189, 2007.
Khomo, L., Trumbore, S., Bern, C. R., and Chadwick, O. A.: Timescales of carbon turnover in soils with mixed crystalline mineralogies, Soil, 3, 17–30, https://doi.org/10.5194/soil-3-17-2017, 2017.
Kleber, M., Bourg, I. C., Coward, E. K., Hansel, C. M., Myneni, S. C. B., and Nunan, N.: Dynamic interactions at the mineral–organic matter interface, Nat. Rev. Earth Environ., 1, 0123456789, https://doi.org/10.1038/s43017-021-00162-y, 2021.
Lavallee, J. M., Soong, J. L., and Cotrufo, M. F.: Conceptualizing soil organic matter into particulate and mineral-associated forms to address global change in the 21st century, Glob. Change Biol., 26, 261–273, https://doi.org/10.1111/gcb.14859, 2020.
Lehmann, J. and Kleber, M.: The contentious nature of soil organic matter, Nature, 528, 60–68, https://doi.org/10.1038/nature16069, 2015.
Leifeld, J. and von Lützow, M.: Chemical and microbial activation energies of soil organic matter decomposition, Biol. Fertil. Soils, 50, 147–153, https://doi.org/10.1007/s00374-013-0822-6, 2014.
Metzler, H., Müller, M., and Sierra, C. A.: Transit-time and age distributions for nonlinear time-dependent compartmental systems, P. Natl. Acad. Sci. USA, 115, 1150–1155, https://doi.org/10.1073/pnas.1705296115, 2018.
Mikutta, R. and Kaiser, K.: Organic matter bound to mineral surfaces: Resistance to chemical and biological oxidation, Soil Biol. Biochem., 43, 1738–1741, https://doi.org/10.1016/j.soilbio.2011.04.012, 2011.
Natali, C., Bianchini, G., and Carlino, P.: Thermal stability of soil carbon pools: Inferences on soil nature and evolution, Thermochim. Ac., 683, 178478, https://doi.org/10.1016/j.tca.2019.178478, 2020.
Nkwain, F. N., Demyan, M. S., Rasche, F., Dignac, M. F., Schulz, E., Kätterer, T., Müller, T., and Cadisch, G.: Coupling pyrolysis with mid-infrared spectroscopy (Py-MIRS) to fingerprint soil organic matter bulk chemistry, J. Anal. Appl. Pyrolysis., 133, 176–184, https://doi.org/10.1016/j.jaap.2018.04.004, 2018.
Paul, E. A., Follett, R. F., Leavitt, S. W., Halvorson, A., Peterson, G. A., and Lyon, D. J.: Radiocarbon Dating for Determination of Soil Organic Matter Pool Sizes and Dynamics, Soil Sci. Soc. Am. J., 61, 1058–1067, https://doi.org/10.2136/sssaj1997.03615995006100040011x, 1997.
Plante, A. F., Fernández, J. M., and Leifeld, J.: Application of thermal analysis techniques in soil science, Geoderma, 153, 1–10, https://doi.org/10.1016/j.geoderma.2009.08.016, 2009.
Plante, A. F., Fernández, J. M., Haddix, M. L., Steinweg, J. M., and Conant, R. T.: Biological, chemical and thermal indices of soil organic matter stability in four grassland soils, Soil Biol. Biochem., 43, 1051–1058, https://doi.org/10.1016/j.soilbio.2011.01.024, 2011.
Plante, A. F., Beaupré, S. R., Roberts, M. L., and Baisden, T.: Distribution of Radiocarbon Ages in Soil Organic Matter by Thermal Fractionation, Radiocarbon, 55, 1077–1083, https://doi.org/10.1017/s0033822200058215, 2013.
Quénéa, K., Derenne, S., González-Vila, F. J., González-Pérez, J. A., Mariotti, A., and Largeau, C.: Double-shot pyrolysis of the non-hydrolysable organic fraction isolated from a sandy forest soil (Landes de Gascogne, South-West France): Comparison with classical Curie point pyrolysis, J. Anal. Appl. Pyrolysis., 76, 271–279, https://doi.org/10.1016/j.jaap.2005.12.007, 2006.
Rasmussen, C., Throckmorton, H., Liles, G., Heckman, K., Meding, S., and Horwath, W. R.: Controls on soil organic carbon partitioning and stabilization in the California Sierra Nevada, Soil Syst., 2, 1–18, https://doi.org/10.3390/soilsystems2030041, 2018.
Rennert, T. and Herrmann, L.: Sea spray and land use effects on clay minerals and organic matter of soils on machair (Harris, Scotland), Geoderma Reg., 23, e00339, https://doi.org/10.1016/j.geodrs.2020.e00339, 2020.
Rennert, T. and Herrmann, L.: Thermal-gradient analysis of soil organic matter using an elemental analyser – A tool for qualitative characterization?, Geoderma, 425, 116085, https://doi.org/10.1016/j.geoderma.2022.116085, 2022.
Rosenheim, B. E. and Galy, V.: Direct measurement of riverine particulate organic carbon age structure, Geophys. Res. Lett., 39, 1–6, https://doi.org/10.1029/2012GL052883, 2012.
Rosenheim, B. E., Day, M. B., Domack, E., Schrum, H., Benthien, A., and Hayes, J. M.: Antarctic sediment chronology by programmed-temperature pyrolysis: Methodology and data treatment, Geochem. Geophy. Geosy., 9, 1–16, https://doi.org/10.1029/2007GC001816, 2008.
Sanderman, J. and Grandy, S. A.: Ramped thermal analysis for isolating biologically meaningful soil organic matter fractions with distinct residence times, Soil, 6, 131–144, https://doi.org/10.5194/soil-6-131-2020, 2020.
Sanderman, J., Baisden, W. T., and Fallon, S.: Redefining the inert organic carbon pool, Soil Biol. Biochem., 92, 149–152, https://doi.org/10.1016/j.soilbio.2015.10.005, 2016.
Schrumpf, M., Schulze, E. D., Kaiser, K., and Schumacher, J.: How accurately can soil organic carbon stocks and stock changes be quantified by soil inventories?, Biogeosciences, 8, 1193–1212, https://doi.org/10.5194/bg-8-1193-2011, 2011.
Schrumpf, M., Kaiser, K., Guggenberger, G., Persson, T., Kögel-Knabner, I., and Schulze, E. D.: Storage and stability of organic carbon in soils as related to depth, occlusion within aggregates, and attachment to minerals, Biogeosciences, 10, 1675–1691, https://doi.org/10.5194/bg-10-1675-2013, 2013.
Schrumpf, M., Kaiser, K., Mayer, A., Hempel, G., and Trumbore, S.: Age distribution, extractability, and stability of mineral-bound organic carbon in central European soils, Biogeosciences, 18, 1241–1257, https://doi.org/10.5194/bg-18-1241-2021, 2021.
Schuur, E. A. G., Trumbore, S. E., and Druffel, E. R. M.: Radiocarbon and Climate Change: Mechanisms, Appl. Laborat. Tech., 1, 1–315, https://doi.org/10.1007/978-3-319-25643-6, 2016.
Seifert, A. G., Trumbore, S., Xu, X., Zhang, D., and Gleixner, G.: Variable effects of plant colonization on black slate uptake into microbial PLFAs, Geochim. Cosmochim. Ac., 106, 391–403, https://doi.org/10.1016/j.gca.2012.12.011, 2013.
Sierra, C. A., Müller, M., and Trumbore, S. E.: Modeling radiocarbon dynamics in soils: SoilR version 1.1, Geosci. Model. Dev., 7, 1919–1931, https://doi.org/10.5194/gmd-7-1919-2014, 2014.
Sierra, C. A., Hoyt, A. M., He, Y., and Trumbore, S. E.: Soil Organic Matter Persistence as a Stochastic Process: Age and Transit Time Distributions of Carbon in Soils, Global Biogeochem. Cy., 32, 1574–1588, https://doi.org/10.1029/2018GB005950, 2018.
Sollins, P., Kramer, M. G., Swanston, C., Lajtha, K., Filley, T., Aufdenkampe, A. K., Wagai, R., and Bowden, R. D.: Sequential density fractionation across soils of contrasting mineralogy: Evidence for both microbial- and mineral-controlled soil organic matter stabilization, Biogeochemistry, 96, 209–231, https://doi.org/10.1007/s10533-009-9359-z, 2009.
Stoner, S.: ShaneStoner/BGS_ThermalFractionation: Publication, v1.0, Zenodo [data set and code], https://doi.org/10.5281/zenodo.7998659, 2023.
Torn, M. S., Trumbore, S. E., Chadwick, O. A., Vitousek, P. M., and Hendricks, D. M.: Mineral control of soil organic carbon and storage and turnover, Nature, 389, 3601–3603, 1997.
Trumbore, S.: Age of soil organic matter and soil respiration: Radiocarbon constraints on belowground C dynamics, Ecol. Appl., 10, 399–411, https://doi.org/10.1890/1051-0761(2000)010[0399:AOSOMA]2.0.CO;2, 2000.
Trumbore, S. E.: Comparisons of carbon dynamics in tropical and temperate soils using radiocarbon measurements, Measurement, 7, 275–290, 1993.
Trumbore, S. E. and Zheng, S.: Comparison of fractionation methods for soil organic matter 14C analysis, Radiocarbon, 38, 219–229, https://doi.org/10.1017/S0033822200017598, 1996.
Trumbore, S. E., Bonani, G., and Wolfli, W.: The rates of carbon cycling in several soils from AMS14C measurements of fractionated soil organic matter, in: Soils and the greenhouse effect, Vol. 23, 407–414, John Wiley and Sons Inc, New York, USA, 575 pp., ISBN 0-471-92358-8, 1990.
von Lützow, M., Kögel-Knabner, I., Ekschmitt, K., Flessa, H., Guggenberger, G., Matzner, E., and Marschner, B.: SOM fractionation methods: Relevance to functional pools and to stabilization mechanisms, Soil Biol. Biochem., 39, 2183–2207, https://doi.org/10.1016/j.soilbio.2007.03.007, 2007.
Wendeberg, M., Richter, J. M., Rothe, M., and Brand, W. A.: Jena Reference Air Set (JRAS): A multi-point scale anchor for isotope measurements of CO2 in air, Atmos. Meas. Tech., 6, 817–822, https://doi.org/10.5194/amt-6-817-2013, 2013.
Williams, E. K., Fogel, M. L., Berhe, A. A., and Plante, A. F.: Distinct bioenergetic signatures in particulate versus mineral-associated soil organic matter, Geoderma, 330, 107–116, https://doi.org/10.1016/j.geoderma.2018.05.024, 2018.
Xu, X., Trumbore, S. E., Zheng, S., Southon, J. R., McDuffee, K. E., Luttgen, M., and Liu, J. C.: Modifying a sealed tube zinc reduction method for preparation of AMS graphite targets: Reducing background and attaining high precision, Nucl. Instrum. Method. Phys. Res. B, 259, 320–329, https://doi.org/10.1016/j.nimb.2007.01.175, 2007.