the Creative Commons Attribution 4.0 License.
the Creative Commons Attribution 4.0 License.
 | 31 Jul 2023
Potassium limitation of forest productivity – Part 1: A mechanistic model simulating the effects of potassium availability on canopy carbon and water fluxes in tropical eucalypt stands
Nicolas Delpierre
Jean-Paul Laclau
Joannès Guillemot
Yann Nouvellon
Otavio Campoe
Jose Luiz Stape
Vitoria Fernanda Santos
Guerric le Maire
The extent of the potassium (K) limitation of forest productivity is probably more widespread than previously thought, and K limitation could influence the response of forests to future global changes. To understand the effects of K limitation on forest primary production, we have developed the first ecophysiological model simulating the K cycle and its interactions with the carbon (C) and water cycles. We focused on the limitation of the gross primary productivity (GPP) by K availability in tropical eucalypt plantations in Brazil. We used results from stand-scale fertilisation experiments as well as C flux measurements in two tropical eucalypt plantations to parameterise the model. The model was parameterised for fertilised conditions and then used to test for the effects of contrasting additions of K fertiliser. Simulations showed that K deficiency limits GPP by more than 50 % during a 6-year rotation, a value in agreement with estimations in K-limited eucalypt stands. Simulations showed a decrease of modelled canopy transpiration of around 50 % and a decrease in modelled water-use efficiency WUEGPP of 10 %. Through a sensitivity analysis, we used the model to identify the most critical processes to consider when studying K limitation of GPP. The inputs of K to the stands, such as the atmospheric deposition and weathering fluxes, and the regulation of the cycle of K within the ecosystem were critical for the response of the system to K deficiency. Litter leaching processes were of lower importance, since residence time of K in litter was low. The new forest K-cycle model developed in the present study includes multiple K processes interacting with the carbon and water cycles, and strong feedbacks on GPP were outlined. This is a first step in identifying the source or sink limitation of forest growth by K.
- Article
(2670 KB) - Full-text XML
- Companion paper
-
Supplement
(3980 KB) - BibTeX
- EndNote


Nutrient limitation of plant growth has been well established since the 19th century (von Liebig, 1840). Several macro- (N, K, P) or micro-nutrients can limit the growth of plants (Townsend et al., 2011). The nitrogen (N), phosphorus (P), and potassium (K) limitation of plant growth is a well established phenomenon, as demonstrated by the widespread use of NPK fertilisers in agriculture. It has however less extensively been studied in natural ecosystems. This probably stems from the fact that, contrary to agrosystems where field trials are currently set up to select the best fertilisation regimes, natural ecosystems, and particularly forests, are rarely fertilised. Counter-examples in forestry include lime application trials (Bonneau, 1972; Guitton et al., 1988; Rocha et al., 2019) and other fertilisation trials (Hyvönen et al., 2008). This limitation of primary production by nutrients will get more palpable as the atmospheric concentration of CO2, one of the substrates limiting photosynthesis, increases (Ellsworth et al., 2022).
N and P are generally considered to be the most limiting elements for global forest growth, with no clear geographical pattern for either N nor P limitation (Du et al., 2020; Cunha et al., 2022; Manu et al., 2022; Hou et al., 2020). This paradigm neglects other macro- and micro-nutrients as causes of limitation or co-limitation. In the tropics, evidence from eucalypt plantations in Brazil suggests that K and micro-nutrients are often the primary limiting elements for productivity (Silveira et al., 2000; Cornut et al., 2021). More generally, the K limitation of forest growth appears to be a widespread phenomenon, which has been overlooked so far (Tripler et al., 2006; Sardans and Peñuelas, 2015). Beyond its role on forest growth, K is also an element of geopolitical importance (Nardelli and Fedorinova, 2021), since it is an essential component of most agricultural fertilisers, and potash sources are spread among few countries (Prakash and Verma, 2016).
Despite its importance for forest ecosystems, few models have so far been developed to investigate the K cycle in forest ecosystems. Some models focused on the impact of anthropogenic perturbations and management on multiple nutrient cycles in plants (e.g. wheat; Johnson et al., 2000) and, among them, on the cycle of K in temperate forests (e.g. models NuCM; Liu et al., 1992; ForNBM; Zhu et al., 2004). Potassium models for annual crops have also been developed and have focused mainly on the K dynamics in soils and uptake by the plants (Seward et al., 1990; Silberbush and Barber, 1984). To the best of our knowledge, only one K model, developed for arable crops, has to date formalised the link between K availability and plant productivity, through an empirical relationship (Greenwood and Karpinets, 1997). This feedback had previously been deemed necessary to predict K uptake more accurately (Seward et al., 1990). Beside these studies, which explicitly modelled the ecosystem K cycle at a broad scale, some papers have quantified through ecophysiological modelling the sensitivity of ecosystem functioning to the availability of K. For example, the influence of K on the gross primary productivity (GPP) (Christina et al., 2015) and water fluxes (Christina et al., 2018) of tropical eucalypt plantations has been quantified with the MAESPA model, using a specific parameter set for each of the K fertilised and non-fertilised treatments. In these works, the K cycle was not explicitly modelled.
Modelling the various aspects of the ecosystem cycle of K is a worthwhile endeavour, since K influences the ecosystem water and carbon cycles in many ways in tropical eucalypt plantations (Cornut et al., 2021) as well as in other forest types (Sardans and Peñuelas, 2015; Tripler et al., 2006). Indeed, K availability has a strong influence on the canopy photosynthesis (i.e. the source of carbon for the plant) through its role on leaf development and senescence. Under low K availability, leaf expansion is reduced by up to 30 % (Battie-Laclau et al., 2013) and leaf lifespan is strongly reduced, with estimated reductions from 25 % (Laclau et al., 2009) up to 50 % (Battie-Laclau et al., 2013). The resulting loss in leaf area, combined with K-deficiency anthocyanic (purple) symptoms that diminish the leaves' photosynthetic capacity (Battie‐Laclau et al., 2014a), leads to a strong reduction of GPP (Epron et al., 2012). While it is more challenging to study the activity of the plant's carbon sinks (i.e. the transport and use of carbohydrate molecules for the maintenance of tissues, growth, the constitution of reserves, and defence; Körner, 2015), there is evidence that assimilates' transport processes are also influenced by the availability of K. For example, the loading and unloading of sugars from the phloem are affected by K deficiency (Marschner et al., 1996), and, more generally, the K nutritional status of the tree has an impact on phloem sap mobility (Epron et al., 2016). Anthocyanic symptoms that develop on leaf margins could in particular be the consequence of the lower ability of K-deficient leaves to export sugars into the phloem sap (Landi et al., 2015). This body of evidence points towards a strong sink limitation (mostly through the alteration of phloem export capacity) of GPP under K limitation in addition to a source limitation due to a reduced leaf area. More details relating to the influence of K on these sink and source processes can be found in Cornut et al. (2021). On the topic of the water cycle, it has been shown that K concentration in the xylem sap has an effect on the xylem conductivity (through a change of xylem pit conductivity; Nardini et al., 2010). Potassium deficiency also impacts stomatal functioning (Marschner, 2011), but an absence of effect of K deficiency on intrinsic WUE has been shown in tropical eucalypt stands (Epron et al., 2012; Battie-Laclau et al., 2016).
The combined influences of K on C-source and C-sink processes explain the K limitation of productivity. The present study focuses on modelling the influence of K on the C source (i.e. on GPP), which is based on the assumption that C-source modelling would be the most straightforward step to start modelling the K limitation on productivity. Indeed, process-based models of the C-source activity have been developed for more than 4 decades (Farquhar et al., 1980), which contrasts with models representing the activity of C sinks (e.g. Hölttä et al., 2006), which, while relevant (e.g. Guillemot et al., 2017; Körner, 2015), are relatively new and have not been validated at a large scale. While the N and P limitation of GPP have been considered in models at scales from the leaf to the globe (Thum et al., 2019; Goll et al., 2012, 2017; Yang et al., 2014), no process-based model simulating the K cycle and its influence on GPP has been published so far.
The objectives of the present study were thus to:
-
develop a model of the K biogeochemical cycle, coupled to the carbon and water cycles, in forest ecosystems;
-
evaluate the model using carbon and water flux data measured at an eddy covariance site installed in a fertilised (+K) tropical eucalypt plantation;
-
quantify the influence of K availability on the carbon (gross primary productivity, GPP) and water (evapotranspiration) ecosystem–atmosphere fluxes and on the water-use efficiency of a tropical eucalypt stand, through simulations in non-limited +K stands and stands with omission of K fertiliser (oK),
-
conduct a sensitivity analysis of the model, with the aim to identify the main processes responsible for the response of GPP to the availability of K at the stand level.
To this end, we have developed a new K circulation module in an existing ecophysiological forest model and represented the response of different physiological processes to the availability of K in the plant. The model was parameterised and tested on two tropical eucalypt plantations in Brazil. Because those ecosystems have a continuous phenology, it required the creation of a leaf cohort model (see e.g. Sainte-Marie et al., 2014) that explicitly takes into account the effect of K on different leaf-level processes (leaf expansion, lifespan, etc.).
2.1 Study sites
2.1.1 Eddy covariance site (EUCFLUX)
The EUCFLUX site is located within a 200 ha plantation located in south-eastern Brazil (São Paulo State; 22∘58′04′′ S and 48∘43′40′′ W, 750 m a.s.l.) and is managed under a cooperative project of the IPEF (Instituto de Pesquisas e Estudos Florestais) (Nouvellon et al., 2019). The precipitation was on average 1536 mm yr−1 (from 2008 to 2017), with a drier season between June and September, and the mean annual temperature was 19.3 ∘C. Soils are deep Ferralsols (> 15 m). A clonal plantation of a fast-growing Eucalyptus grandis × urophylla hybrid was established in November 2009 and harvested in June 2017. At the centre of the stand, a flux tower continually measured meteorological variables as well as the fluxes of CO2 and water vapour between the plantation and the atmosphere, with the eddy covariance method (Baldocchi, 2003). The study area was described in detail in Christina et al. (2017), Nouvellon et al. (2010), Nouvellon et al. (2019), and Vezy et al. (2018). The stand was fertilised in November 2019 with 3.0 g m−2 of K2O, 3.3 g m−2 of P2O5, 1.8 g m−2 of N, 400 g m−2 of dolomitic lime, and trace elements; then at 3 months with 3.6 g m−2 of K2O and 3.12 g m−2 of N; at 10 months with 6.72 g m−2 of K2O and 3.08 g m−2 of N; and at 20 months of age with 15.12 g m−2 K2O. This amounted to a total of 23.60 gK m−2 from fertilisation and resulted in non-limiting nutrient availability for tree growth during a rotation cycle. This value was higher than the typical 12 gK m−2 added on average in commercial plantations during a rotation cycle (Cornut et al., 2021).
2.1.2 Fertilisation experiments (Itatinga)
A 2 ha split-plot fertilisation trial (three blocks with three fertilisation treatments per block) was installed at the Itatinga experimental station (23∘02′49′′ S and 48∘38′17′′ W, 860 m a.s.l.; University of São Paulo–ESALQ). It is located 12 km next to the EUCFLUX site, under similar climate and soil conditions. A fast-growing Eucalyptus grandis clone was planted in June 2010, and the soil–tree relationships were studied over the entire rotation of 6 years (from planting to harvesting). The experimental design was described in detail in Battie‐Laclau et al. (2014b). Six treatments (three fertilisation regimes and two water supply regimes) were applied in three blocks. In the present study, we focus on the +K and oK treatments with the undisturbed rainfall regime, which consisted of a non-limiting fertilisation +K (17.55 gK m−2 applied as KCl at planting, with 3.3 gP m−2 and 200 g m−2 of dolomitic lime and trace elements as well as 12 gN m−2 at 3 months of age) and an oK omission treatment where the same fertilisers as in the +K treatment were applied except for the K fertiliser. The area of each individual plot in the experiment was 864 m2.
The concentrations of different elements (N, P, K) in the organs (leaves, trunks, branches, and roots) were measured at an annual time step in eight individuals of each fertilisation treatment and upscaled to the whole stand using allometric relationships (not shown). Biomass and nutrient contents were calculated (using upscaling) from inventories, biomass, and nutrient concentration measurements conducted at 1, 2, 3, 4, 5, and 6 years in each fertilisation treatment. Atmospheric deposition (0.55 gK m−2 yr−1) and canopy leaching fluxes (0.42 gK m−2 yr−1) were measured in a nearby experiment from Laclau et al. (2010).
The clones that were planted at the Eucflux and Itatinga stands were different. This has an impact on the response of the trees to environmental conditions, canopy functioning (Attia et al., 2019; Le Maire et al., 2019), and more importantly stand GPP (Attia et al., 2019; Epron et al., 2012). Distinct model parameter values were used for the more sensitive parameters in the model, when differences were observed in their measurements.
2.2 Complementary foliar measurements
Area, mass, and K-deficiency symptom development of individual leaves were measured for the studied sites to parameterise the new leaf cohort sub-model and the K-deficiency-symptom area sub-model described below. To this aim, we used the scanned pictures (tabletop scanner device model HP ScanJet G4050; 300 dpi) of leaves collected during the biomass samplings at both sites (every 6 months at EUCFLUX and annually at Itatinga), on at least six trees per date and treatment, and at three crown levels. Individual leaf areas as well as the proportion of anthocyanic symptoms on individual leaves were automatically computed from the images based on a colour threshold calibrated by photointerpretation and automatised in a MATLAB® script (le Maire, 2023). The leaf-scale metrics of each canopy third were upscaled to stand averages using linear regressions with individual tree D2H (i.e. the product of squared diameter with tree height). Regressions were done using the scikit-learn Python library (Pedregosa et al., 2011). The resulting parameters and functions were then applied to the D2H of trees using inventories of diameter and height of plots. This allowed the upscaling of leaf individual area and symptomatic leaf area in order to compute their plot averages.
2.3 CASTANEA-MAESPA general model presentation
The soil–vegetation–atmosphere carbon and water balance were simulated with the CASTANEA-MAESPA model for the EUCFLUX and Itatinga eucalypt plantations. CASTANEA-MAESPA was the merging of the CASTANEA model (Dufrêne et al., 2005) with the MAESPA model (Duursma and Medlyn, 2012), the latter being modified as in Christina et al. (2017). CASTANEA is an ecophysiological model simulating the fluxes of carbon and water between a forest stand (average tree) and the atmosphere at a half-hourly time step. In its basic version, it includes no representation of the hydraulic soil–plant–atmosphere continuum, which is however critical in the context of a coupled carbon–water–potassium model. The MAESPA model (Duursma and Medlyn, 2012) was developed using the above-ground components of the MAESTRA model (Wang and Jarvis, 1990) and the water balance components of the SPA model (Williams et al., 1996). MAESPA is a three-dimensional model of light interception, energy balance, photosynthesis, and evapotranspiration. These fluxes are computed from prescribed description of individual trees along time and at the scale of small volumes of leaves within each tree crown. The soil–plant–atmosphere water continuum is explicitly simulated by MAESPA.
It was not possible to adapt the CASTANEA model, initially developed on temperate Beech (Fagus sylvatica) forests (Dufrêne et al., 2005), to the particular study case of tropical eucalypt plantations, as we did previously for several temperate and Mediterranean species (e.g. Delpierre et al., 2012; Davi et al., 2006; Le Maire et al., 2005). Indeed, tropical eucalypt plantations can grow roots down to a depth of 6 m the first year after planting (Christina et al., 2011), which violates the CASTANEA assumption of a constant rooting depth over the simulation period and the use of a simple soil water bucket model. The MAESPA model does not have this constraint and can easily be adapted to simulate an increasing amount of extractable water (Christina et al., 2017). Moreover, MAESPA had already been parameterised and applied at the EUCFLUX and Itatinga sites (Christina et al., 2015, 2017). However, although it simulates fluxes of carbon and water, MAESPA is not a full carbon balance model, in the sense that it does not simulate the carbon allocation within the plant, litterfall, and soil organic matter decomposition, etc. As such, contrary to CASTANEA, MAESPA does not alone provide the structure required to simulate the K balance. Therefore, the merging of both models into the CASTANEA-MAESPA model aimed to offer a relevant and extensive ecophysiological model for C and water cycles in eucalypt plantations, prior to the implementation of the K processes as described below.
The modules of CASTANEA simulating light interception, water interception, carbon allocation and the growth of organs, and organ respiration were coupled with the modules of MAESPA simulating soil water dynamics, leaf photosynthesis, transpiration, and plant hydraulics (Fig. S1). More precisely, the coupled version includes the following points:
-
CASTANEA computes the diffuse and direct incoming radiation reaching sun and shade leaves of a canopy layer (25 canopy layers of varying surface).
-
This radiation is used in MAESPA to compute leaf-scale carbon and water processes (half-hourly time step), based on what is done usually at voxel scale in MAESPA.
-
Net photosynthesis is calculated by MAESPA per canopy layer and summed up at canopy scale (half-hourly time step), then CASTANEA simulates the carbon allocation to the different organs, the organ respiration, and their resulting growth (daily time step).
-
CASTANEA computes the rainfall interception and throughfall, and therefore the water entering in the soil. MAESPA continues the water cycle simulation with water infiltration in the soil; evaporation; water uptake from different soil layers (50 soil layers of 50 cm) and the water table; transpiration; water potential in the soil, roots, and leaves; and impact of leaf water potential on stomatal conductance
Note that the model description of all processes listed above are described in the reference papers of Dufrêne et al. (2005) for CASTANEA and Duursma et al. (2012) for MAESPA (adapted to eucalypts in Christina et al., 2017 and Vezy et al., 2018).
2.4 Model of eucalypt canopy dynamics
2.4.1 Overview of the leaf cohort model
Highly productive tropical eucalypt plantations in Brazil grow from seedlings to 25–30 m high trees in the span of 6–7 years. The plantations present a continuous foliar phenology with leaf production and leaf fall throughout the year. This has previously led to the development of a canopy dynamics model (Sainte-Marie et al., 2014). While this model was sufficient to explain leaf production and leaf fall dynamics, we found it necessary to develop a new cohort-based canopy dynamics model (summarised in Fig. 1), as there was a need for the simulation of both K cycling in the canopy and the effects of K on foliar ontogeny (Laclau et al., 2009; Battie-Laclau et al., 2013). A daily time step was necessary for the simulation of expansion and fall of the leaves of each cohort. All leaves within a cohort were considered to have the same physiological characteristics, growth, and lifespan. A cohort was characterised by a number of leaves per square metres of ground, individual leaf area, and mass. Leaf fall occurred when leaves reached a certain K minimum threshold or the end of their lifespan. This new leaf cohort model is described in the next sections, in the case of no limitation by K.
2.4.2 Leaf cohort production
A new cohort was initialised daily. The number of leaves N produced in the cohort was a function of the height increase of the trees. Indeed, in these fast-growing plantations, most of the new leaves are produced in the top-most part of the crown. The increase in tree height can be computed in the CASTANEA-MAESPA model as the result of increase in trunk biomass and with allometric parameters relating stand biomass and stand height (see the following companion paper: Cornut et al., 2022).
The relationship between daily height increase and leaf production was corrected by a flattening factor. This means that even if the daily height increase was close to zero or even null, leaf production would still happen at a slower but positive rate. The model generated a number of new leaves per m2 at a daily time step following this function:
where N was the daily number of leaves produced in number of leaves per metre squared of ground, and ΔH (m) was the increase in tree height. fp was the flattening factor, meaning that if fp=0, then leaf production was linearly related to height increase, and as fp increased, N tended towards a constant function. κ (nleaves m m) is a conversion factor from height increment to number of new leaves. The parameters used here were fitted using experimental data from the fully fertilised stand. The calibration was a systematic exploration of parameter space using multiple normalised RMSE (addition of the normalised RMSE for multiple variables; see Eq. S1) as a goodness-of-fit indicator. The data used for calibration were destructive leaf biomasses (eight trees and upscaling using a stand inventory at a yearly time step over the rotation), leaf area (same as leaf biomass), and leaf fall (12 L traps at a monthly time step over the rotation) measurements. The calibration was done on cumulative leaf production and leaf fall to maintain consistency in the long-term carbon fluxes rather than focusing on their instantaneous changes.
2.4.3 Leaf cohort lifespan
As long as K was not limiting, the lifespan of a cohort was considered to be constant, since the leaf lifespan deduced from leaf biomass and leaf fall measurements in fully fertilised stand did not show major trends along the rotation, and the amplitude of seasonal changes in lifespan was limited (Fig. S4e). Since no mechanistic explanation was available, we refrained from implementing it in the model. For the sake of simplicity, we did not consider in the present simulations the fall of leaves resulting from extreme events (drought, frost, or heatwave). Indeed, in the studied sites, no large leaf fall due to extreme events was observed. Hence, the leaf lifespan (days), LLS, in non-limiting K conditions was fixed to the average measured value of 480. This average leaf lifespan was estimated as the ratio of the measured annual average leaf biomass (measured annually on eight trees and upscaled using whole-stand inventories) and the annual sum of litterfall (measured monthly).
2.4.4 Leaf expansion in area in the cohort
For a given cohort, individual leaf area (LA) expands from a virtually null area at initialisation of the cohort up to an area of LAmax (mm2). The leaf area dynamics followed a sigmoid function (Fig. 2a; Battie-Laclau et al., 2013). Leaf area was a function of time and not thermal time (as for instance in the original CASTANEA model), since no calibration data were available and it was not deemed necessary for this model. Therefore, the daily leaf area expansion was forced to follow the sigmoid derivative function as
where (mm2 d−1) was the daily growth in the area of an individual leaf within a given cohort; t (days) was the number of days since leaf cohort creation; LAmax (mm2) was the (non-limited) maximum leaf area; kLA (d−1) was a slope parameter; and t50LA (days) was the inflexion point of the original sigmoid of leaf area increase, meaning that it was the date on which leaves increased the most and on which the leaf area (LA) reached half of the maximum leaf area (LAmax). The parameters LAmax, kLA, and t50LA were fitted from 70 measured expanding leaves (Battie-Laclau et al., 2013) in non-limited fertilisation conditions using RMSE as a goodness-of-fit indicator. Parameters kLA and t50LA were assumed not to vary along the stand rotation. LAmax was also assumed to be constant, since the leaf scans did not show any explainable trends of mean leaf area during the rotation (Fig. S5).
The total leaf area of a given cohort was given by the product of LA, the area of an individual leaf, and N, the number of leaves in the cohort. The total leaf area of the stand at a given date was calculated by adding up all the cohort areas.
2.4.5 Leaf expansion in mass in the cohort
Individual leaf mass increase within a cohort was similar in shape to the leaf area increase but with a temporal shift, since leaf mass per area continues to increase when the maximum leaf area is attained as follows:
where (g d−1) was the daily growth in mass of an individual leaf in a given cohort, t (days) was the number of days since leaf cohort creation, BFmax (g) was the maximum individual leaf mass, kBF (d−1) was a slope parameter, and t50BF (days) was the inflexion point of the original sigmoid of leaf mass increase; therefore it was the date of maximum leaf area increase and also the date when half BFmax was reached. The parameters kBF and t50BF were calibrated using individual leaf biomass data and results from Laclau et al. (2009).
Specific leaf area (SLA) of individual leaves showed a decreasing relationship with tree height (Fig. S6a), while LAmax was more constant as described before (Fig. S5). We thus assumed that BFmax increased with tree height:
where BFmax (gC) was the maximal mass of an individual leaf of a cohort at the end of leaf expansion in mass, BF (gDM) was the maximum mass of an individual leaf throughout the rotation, sBF and P were the parameters of the power function between leaf mass and tree height H (m), and TC (gC gDM−1) was the leaf carbon content.
2.4.6 Leaf water content
In non-limited nutrient conditions, leaf cell expansion in area was associated with a leaf water inflow in order to maintain an optimum leaf turgor. This water inflow was computed as
where Wxylem→leaf (mL d−1) was the water inflow into the expanding leaf (this was “structural” water associated to the creation of new tissues, not to be confounded with the water used for leaf transpiration), S the leaf area of the cohort (mm2), computed in Eq. (2), and Γ (mL mm−2) was the surfacic water content, i.e. the amount of leaf water per leaf area at full turgor. Γ was assumed to be a constant.
Experimental data have shown that at the end of leaf area expansion, when the leaf has reached its maximum area, there was some water outflow, defined hereafter as water expulsion. This is an assumption made from observations of a slight decrease in K leaf content following the end of leaf expansion (Laclau et al., 2009). This leaf water (containing ions) expulsion, probably corresponding to a loss of cell wall extensibility (Pantin et al., 2012) during the maturation of leaf tissue, was limited in quantity and in duration. Hence, the overall leaf water content dynamic starts increasing until a maximum at the end of the leaf area expansion, followed by a small decrease until a constant plateau. This plateau corresponds to the water content necessary to maintain a constant leaf turgor in optimal conditions. The water expulsion flux was computed as
where Wleaf→phloem (mL d−1) was the flux of water leaving the leaf at the end of leaf expansion, α (mL d−1) was the constant rate of water expulsion fitted using fine-scaled leaf K concentrations (Laclau et al., 2009), Wleaf (mL) was the amount of water in an individual leaf on the previous day, and (mL) was the amount of water found in the leaf at the final plateau. was computed as Γ×LAmax.
Finally, the variation of leaf water content for an individual leaf in a cohort (Wleaf; mL) was computed by adding the daily net flow given by
2.5 Ecosystem model of the K cycle
We now introduce the CASTANEA-MAESPA-K model, which simulates K cycling in the plantation, and its interactions with the ecosystem carbon and water cycles (Fig. 1). K remains in its ionic (K+) form throughout the ecosystem cycle (Marschner, 2011). Modelling the circulation of K within the plants as well as between the plant and the soil was deemed necessary, since K+ cations show great mobility in the ecosystem (Marschner, 2011). Similarly to the leaf cohort model, a daily time step was used for the K-cycle sub-model. The K cycle was modelled using seven explicit K pools (Fig. 1): soil K (subdivided in the fractions of soil K available and not available for root uptake), soil K fertiliser added (the fertiliser before dissolution), litter K, xylem sap K, phloem sap K, leaf K, and other plant organs K (see the following companion paper: Cornut et al., 2022). These K pools were connected by fluxes (root uptake, resorption, and leaching, etc.), and K inputs (fertilisation, atmospheric deposition, and rock weathering) entered this open system (Fig. 1).
K entered into the soil through fertiliser inputs, atmospheric deposition, and rock weathering. After uptake by roots, K circulated throughout the plant through the xylem sap and the phloem sap, which provided the K necessary to the leaves and organs (Cornut et al., 2022) as well as the K needed for phloem functioning. Part of the K in the phloem was recirculated back into the xylem and thus created a feedback for K uptake by roots. Indeed, soil K uptake by roots depends on the gradient between soil and xylem K. Leaves contribute to the cycle through resorption, canopy leaching, and litterfall. The flux of K from branch, bark, and fine root to litter was simulated but is not described here (see Cornut et al., 2022). The K in the litter was leached following a rate that depended on throughfall precipitation amount. It then entered the soil, to be once again available for uptake. There was no simulated biologically mediated K release from the litter, since no reference to this process was found in the literature. Moreover, measures of K concentration in the litter of leaves, branches, and bark all decreased exponentially at the same rate (Maquère, 2008). This was not the case for N and P (known for their biologically mediated release), indicating that K release from the litter is indeed mainly the result of leaching. The only outgoing flux from the system is the amount of K lost by deep leaching and the trunk K exported from the stand at harvest. Deep leaching was not simulated here, since there was no evidence of any losses by deep leaching at these sites owing to the soils' cationic exchange capacity and depth (Maquère, 2008; Caldeira Filho et al., 2023). K was accumulated in organs (trunk, branches, roots), but this allocation sub-model will be presented in the companion paper (Cornut et al., 2023). This K cycle allowed us to create a feedback between K availability and GPP through the effect it has on leaf expansion, leaf lifespan, and photosynthetic parameters (see below).
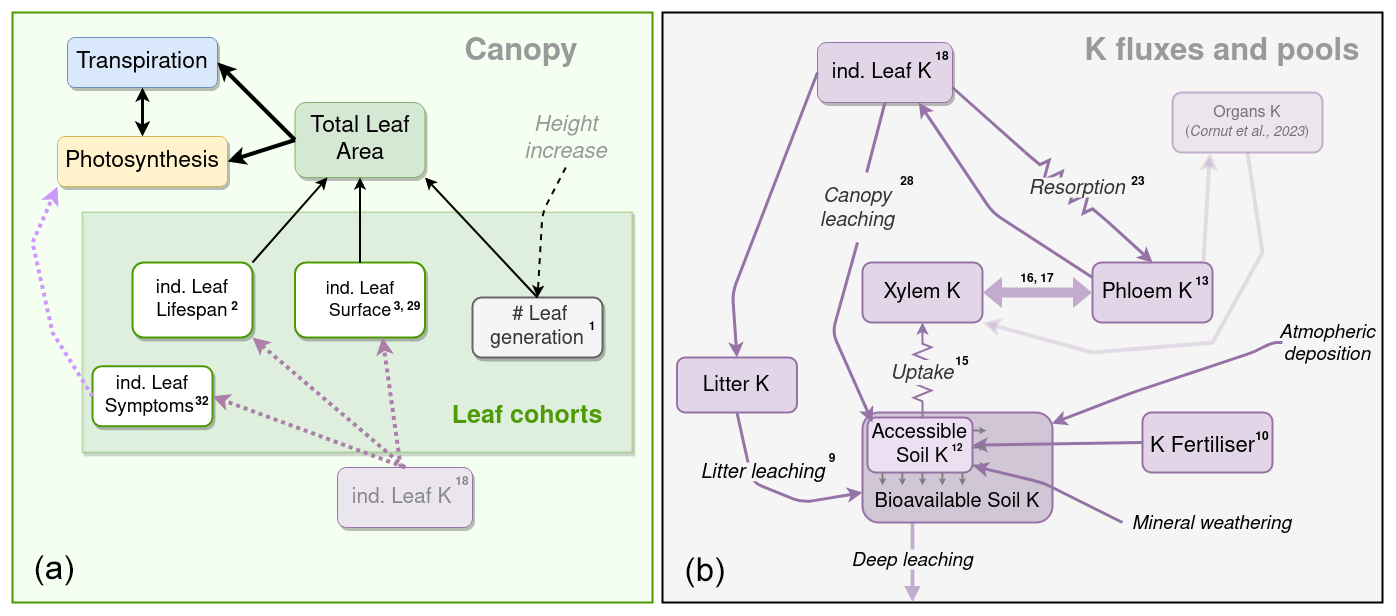
Figure 1Schematic representation of the soil and plant components of the K cycle, and their links with the leaf cohort model and other sub-models. On the left is a schematic representation of the canopy leaf cohort sub-model. Black arrows represent a functional link a variable has with another variable or process. Dashed lines represent an influence of one process (black), pool (purple), or state (light purple) over a process or pool. On the right a schematic representation of the K flux and pool sub-model. Purple boxes are K state variables, and purple arrows are K fluxes. K fluxes simulated with a simple Ohm's law form are represented with resistance symbols. The numbers in exponential form correspond to the numbers of the equation in the text. The K pools of other organs (woody and roots) and their link to the K circulation model are semi-transparent, since they are described in the companion paper (Cornut et al., 2023).
2.5.1 Soil K
Soil K content (Ksoil; gK m−2) was initialised in the model at the tree-planting date (EUCFLUX: 7 October 2009, Itatinga: 1 June 2010) with a measured value , calculated using K concentration in soil, and soil bulk density at different depths (Maquère, 2008). Then, this value was updated daily with incoming and outgoing fluxes.
The K that is added daily to the K litter pool (Klitter) is the K reaching to the ground through leaf fall (Eq. 27), bark fall (Cornut et al., 2023), branch fall (Cornut et al., 2023), and entering the soil litter pool through fine root turnover (Cornut et al., 2023). Instead of a fixed decomposition rate of K in litter, the model considered K release from litter to be mainly coming from leaching with water, since K is a cation that is not strongly adsorbed on organic surfaces. Litter K release measurements done at the experimental site (Maquère, 2008) showed very similar K release rates for branches, bark, and leaves, further confirming this hypothesis. Moreover, K is released faster than either C, N, or P contained in the litter, suggesting a leaching process independent of litter decomposition. Since we assumed the leaching rate was independent of the litter type, all simulated K litter has been pooled into a unique K litter compartment (Klitter). The following equation was used for K leaching from the litter to the soil:
where Klitter→soil (gK m−2 d−1) was the litter K leaching flux, Pground (mm d−1) was the daily amount of precipitation reaching the ground, σ (mm−1) was the conversion factor between the K litter leaching rate and throughfall precipitation, and Klitter (gK m−2) was the amount of K in the litter. σ was estimated on annual data by dividing the measured K leaching rate (Maquère, 2008) by the annual precipitation that falls on the ground (throughfall).
K fertilisation was applied at the beginning of the rotation at several dates, in a solid form (crystals of KCl), and located close to the Eucalyptus plants. The flux of K from this solid fertiliser compartment (Kfertiliser; gK m−2) to the soil K compartment was simulated using the following equation:
where Kfertiliser→soil (gK m−2 d−1) was the flux of K from the fertiliser compartment to the accessible soil K pool, and sfertiliser was the decomposition rate of K fertiliser in d−1. Observations in the fields showed that the KCl fertiliser dissolved quickly at EUCFLUX and Itatinga (less than 2 months).
Atmospheric K deposition is modelled as a constant flux. We used the values measured at Itatinga (Laclau et al., 2010). They amounted to a mean input of Katmosphere→soil of 0.55 gK m−2 yr−1 distributed uniformly throughout the year. This amount feeds directly into the total Ksoil pool.
Deep soil K leaching was included in the model but was parameterised to be a null flux, as was measured in the plantations under study (Maquère, 2008). The K entrance to the soil pool from mineral weathering was simulated as a constant flux. K flux from weathering is directly added to the accessible soil, since this process mainly takes place in the rhizosphere (Pradier et al., 2017). However, as for deep leaching, there is no clear evidence of this flux in the soils under study, where values between 0 and 0.3 gK m−2 yr−1 are given (Cornut et al., 2021): we therefore also set this flux to zero.
Only a portion of Ksoil was accessible to the roots at the beginning of the rotation because of the time spent for root horizontal and vertical expansion. Because K was mainly located in the top soil layers (Maquère, 2008), and because root growth in depth was very fast (Christina et al., 2011), only the horizontal root exploration was considered in the model. An empirical relationship between tree height and area root radius around individual trees was described in Gonçalves (2000) as follows:
where rootradius (m) was the average radius of the horizontal root front around a tree, and H (m) was the tree height (Cornut et al., 2023). Since the planting density was 1666 trees per hectare, a full exploration of the soil was obtained when tree had explored a circle of 6 m2 area:
where (gK m−2) was the soil K accessible for plant uptake, and Ksoil (gK m−2) was the total bioavailable soil K. The fraction is the ratio of root accessible soil to total soil, bounded between 0 and 1.
Because of the root exploration dynamics, the initial K in the system was progressively available to roots, at a proportion following the increase in the root explored area. Following the same logic, the amount of K coming from the litter decomposition and atmospheric deposition entered the total soil K pool Ksoil, but only a part of this Ksoil was available for plant uptake (called ). However, the three other incoming fluxes of K to the soil were considered to be directly accessible for root uptake (i.e. they enter directly in the pool) as follows: (1) the fertiliser flux, since fertilisers are applied close to trees at planting or when the root system is exploring the whole volume of the upper soil layers for other fertiliser applications, (2) the K flow coming from soil weathering because most of the weathering takes place in the rhizosphere (Pradier et al., 2017; de Oliveira et al., 2021), and (3) the canopy leaching flux because it enters the soil mostly below the crown foliage. K foliar leaching (Kleaves→soil) was computed within the leaf K sub-model, described below (Eq. 28).
2.5.2 Uptake of soil K and cycling in xylem and phloem
To calculate the K uptake by trees in the soil and the fluxes of K in the plant, it was necessary to calculate the optimal quantity of K in the phloem sap. Furthermore, K in phloem sap is essential to a wide range of processes (e.g. loading and unloading of sugars) (Cornut et al., 2023). For these processes, the plant maintains a fairly constant K phloem sap concentration [K]phloem. To compute this K quantity in the phloem, values of optimal K concentration in the phloem sap (), minimum K concentration in the phloem sap (), and phloem sap volume (Vphloem) per unit surface were needed.
was considered to be the maximum concentration of K in the phloem sap measured in the fully fertilised stand (Battie‐Laclau et al., 2014b). was assumed to be the minimum concentration of K in the phloem sap measured in the K omission stand of the same experiment (Battie‐Laclau et al., 2014b).
Estimating Vphloem was done through relationships between phloem sap volume and xylem sap volume, since no direct measurements or estimates were available. Xylem sap volume was considered to be a function of basal area, sapwood area at DBH (Guillemot et al., 2021), height of the tree, and branch and root biomasses. The trunk cross section was divided into sapwood area and heartwood area. The trunk (respectively heartwood) volume was modelled as a cone with a base disc of area equal to the basal area (respectively equal to the heartwood area). Trunk sapwood volume was estimated as the difference between trunk volume and heartwood volume. Branch and root sapwood volume were deduced from their biomass, considering that branches and root biomass are entirely composed of sapwood. Their volume were computed using the density of eucalypt sapwood. The lumen volume of the xylem (i.e. the xylem sap volume) was considered to be 13.6 % of total xylem volume as reported in general for angiosperms (Zanne et al., 2010), since no eucalypt-specific data were available. Following Hölttä et al. (2013), and considering the relatively similar lumen proportion between both xylem and phloem (Nobel, 2005), phloem sap volume was considered to be 2 % of the total xylem sap volume.
Uptake of K from the soil by the trees was a function of demand by growing organs, remobilisation of K from senescent organs, and soil supply. The amount of K available for uptake was computed in Eq. (11). K demand by the trees needs to be calculated. To that end, the following was calculated.
First, the target amount of K in the phloem was calculated as
where was the target amount of K in the phloem sap (gK m−2), was the optimal K concentration in the phloem sap (gK L−1), Vphloem was the volume of phloem sap (dm 3 m−2), KNPP was the optimal quantity of K needed for organ growth, and was the optimal quantity of K needed for leaf development.
Finally the demand for K uptake from the soil is the following:
where (gK m−2 d−1) was the quantity of K uptake necessary for optimal tree functioning, was from Eq. 12, (gK m−2) was the target amount of K in the xylem sap, Kphloem (gK m−2) was the amount of K in the phloem sap, Kremob (gK m−2) was the amount of K remobilised from the woody organs (Cornut et al., 2023), and Kxylem (gK m−2) was the amount of K in the xylem.
Uptake of K from the soil to the xylem sap is the minimum between the soil “offer”, i.e. what can be taken up from the soil knowing the soil K content and the soil-to-root K resistance, and the xylem K “demand”:
where Ksoil→xylem (gK m−2 d−1) was the uptake flux, Ksoil (gK m−2) was the amount of K in the accessible soil, Rsoil→xylem (days) was the resistance to absorption by plant roots, and (gK m−2 d−1) was the uptake demand from Eq. (13).
In the model, internal K cycling (Marschner et al., 1996) was a necessary process that provides feedback for the uptake of K from the soil, maintaining K homeostasis in the phloem sap, and linking organ remobilisation and allocation of K for growth. In the K circulation model (Fig. 1), two K fluxes are represented, one from the phloem sap to the xylem sap (representing a flux mainly happening in roots in plants) and one from xylem sap to phloem sap (mainly happening in the shoots). These representations allowed the phloem sap to maintain a K content of phloem close to optimal values (Eq. 12).
Firstly, the flux of K from the xylem sap to the phloem sap was calculated. It was a function of phloem “demand” and xylem sap K of the previous time step. We assumed that all the K available in the xylem sap could potentially be transferred to the phloem sap the next day as follows:
where Kxylem→phloem (gK m−2 d−1) was the flux of K from the xylem to the phloem, Kxylem (gK m−2) was the amount of K in the xylem sap, Kxylem (gK m−2) was the amount of K in the phloem sap, and was from Eq. (12).
The transport of K from the phloem to the xylem took place if K concentration in the phloem sap was higher than its optimal value (e.g. following leaf resorption) as follows:
where Kphloem→xylem (gK m−2 d−1) was the flux of K from the phloem to the xylem, and was from Eq. (12).
2.5.3 K cycling in the leaves
The leaf K balance equation of the individual leaf of each leaf cohort was given by the following sum of fluxes:
where (gK d−1) was the daily variation of the quantity of K in an individual leaf of a given cohort; Kphloem→leaf was the amount of K entering the leaf during leaf expansion (see Eq. 22); Kleaf→soil was the canopy leaching flux (see Eq. 28); Kleaf→phloem was the sum of K following water expulsion at the end of leaf expansion (Eq. 24), the maximum between K resorption driven by the phloem demand (Eq. 25), and the K resorption at leaf senescence (Eq. 26); and Kleaf→litter was the K flux occurring the last day of the cohort, when the leaf was simulated to fall. Leaf K inflow (Kphloem→leaf) was computed as a function of the K offer by the phloem and K demand for leaf growth at the canopy scale and organ growth at the tree scale.
The calculation of the water inflow in the leaf during leaf expansion was calculated first in the case of no K limitation (Wxylem→leaf in Eq. 5). This allowed the calculation of a theoretical optimal K flux entering the expanding leaf, , computed considering an optimal concentration of K in the water entering the leaf, (gK mL−1). This value was approximated as the maximum concentration found in the leaf water on different measurement campaigns (Battie-Laclau et al., 2013; Laclau et al., 2009). The resulting K flux was the non-limited rate of K entrance in the expanding leaf:
where (gK d−1) was the maximum entrance of K+ ions in the expanding leaf.
However, restriction of this flux occurs due to the phloem limitation of K supply at canopy scale that may not attain the K demand for optimal growth. A reduction of the K inflow in the leaf was therefore applied if the leaf demand at canopy scale was higher than the available Kphloem (the “offer”).
(gK m−2) was the K demand of all expanding leaves of the stand and was computed as the sum of for all leaf cohorts (with N the number of leaves of each cohort; see Eq. 1) as follows:
To calculate the phloem sap “offer”, the following relationship was used:
where Kphloem→organs (gK m−2) was the amount of K available for leaf expansion and organ growth in the phloem sap, Kphloem (gK m−2) was the total amount of K in the phloem sap, (gK L−1) was the minimal concentration of K in the phloem sap, Vphloem (L) was the phloem sap volume, KNPP (gK m−2) was the optimal amount of K for organ growth (Cornut et al., 2023), and (gK m−2) was the demand for optimal leaf expansion.
Then the limitation of K for leaf expansion was calculated as a ratio of available (“offer”) K-to-K demand:
where LK was the ratio of available K in the phloem sap to demand of K from organ growth and leaf expansion, Kphloem→organs (gK m−2) was available phloem K (Eq. 20), and KNPP and were organ growth and leaf expansion demands respectively (both gK m−2; see above).
The quantity of K entering the expanding leaf was thus defined as the following:
where Kphloem→leaf (gK d−1) was the amount of K+ ions that enter the expanding leaf in limited K conditions, was computed in Eq. (18), and LK was computed in Eq. (21).
The K outgoing flux from leaf to phloem (Fig. 2b) can be decomposed into
where Kexpulsion (gK m−2 d−1) was the K flux leaving the leaf during leaf maturation (Eq. 24), (gK m−2 d−1) was the resorption flux driven by phloem sap demand (Eq. 25), and (gK m−2 d−1) was the resorption flux driven by leaf senescence (Eq. 26).
Here, Wleaf→phloem was calculated in Eq. (6); Wleaf was the previous day's leaf water content, calculated in Eq. (7); and Kleaf was the previous day's leaf K content of the cohort.
The K resorption flux Kresorption from the leaf to the phloem could be activated by low phloem K content. This was a mechanism to maintain homeostasis in the phloem, since K was essential for many phloem functions (Cornut et al., 2021). Evidence was also provided by leaves losing K during their lifespan, especially in K-deficient trees (Battie-Laclau et al., 2013). Another piece of evidence was the high concentrations of K in the petiole compared to other leaf parts (Fig. S9d). This was not the case for N (Fig. S9c) and suggests an intense circulation of K to and from the leaf. The resorption of the leaf towards the phloem was
where (gK d−1) was the cohort phloem-driven resorption, Kleaf (gK) was the K content of leaves in the cohort, Rleaf→phloem (days) was the resistance to resorption, and LK was the K limitation computed in Eq. (21).
The leaf K resorption flux during leaf senescence followed a sigmoid function:
where (gK d−1) was the resorption flux occurring at leaf senescence, just before leaf fall. LLS (days) was the leaf lifespan, which was also the inflexion point of the sigmoid, and kr was the parameter corresponding to the speed of the resorption flux at the inflexion point. We approximated the time it took for active K resorption to be 1 w, as K+ ions are highly mobile, and evidence from chlorophyll degradation at senescence suggests extremely fast dynamics (Mattila et al., 2018).
The K flux from leaves to litter was the sum of each falling cohort multiplied by the K content of the respective leaf cohort at leaf fall:
where Kleaves→litter (gK m−2 d−1) was the K flux from leaves to litter, n was the total number of falling leaf cohorts, i was the number of each individual falling leaf cohort, and (gK m−2 d−1) was the amount of K from each cohort that fell and reached the K litter pool.
We assumed that the daily canopy leaching flux strength was proportional to the throughfall that occurs during precipitation as observed previously in a eucalypt forest (Crockford et al., 1996):
where λ (mm) was the fraction of leaf K that was leached per millimetre of daily throughfall, Wtip (mm) was the throughfall, and Kleaf (gK) was the amount of K in the leaf. λ was calibrated considering the leaf area index and leaf K content of a well fertilised canopy as well as canopy K leaching measurements (Laclau et al., 2010).
Finally, the K flux accompanying the leaf fall, Kleaf→litter, happened following one of the two conditions: when leaf cohort lifespan LLS was reached, or when the K concentration in leaf water () was below a threshold value [K]min of 9.25e−5 gK mL−1. At one of these dates, the leaf cohort was shed and . This [K]min threshold value was either reached after resorption during senescence or through other processes (phloem demand, Eq. 25; leaching, Eq. 28) thus diminishing the leaf lifespan in K-deficient trees. Indeed, leaf fall was related to strong K deficiency in several studies (Laclau et al., 2009; Battie-Laclau et al., 2013).
2.6 Impact of K limitation on the cohort growth model
2.6.1 Number of leaves produced at cohort initialisation
Since leaf production was a function of tree height which itself is a function of tree trunk biomass, K availability could have an indirect impact on leaf production through its impact on tree trunk production. Briefly, tree trunk production could be affected by a reduced allocation of C due to either a decrease in GPP or an increase in the share of C partitioned to other organs (for more details on trunk production, see Cornut et al., 2023). No specific impact of K deficiency on the number of new leaves generated was included in the model, since experiments have shown that leaf generation speed at the branch level is not impacted by K availability, and leaf biomass production is not substantially different between oK and fully K fertilised stands (Cornut et al., 2021).
2.6.2 Impact of K limitation on individual leaf area
When there was no K limitation, in optimal conditions, leaf expansion in area was computed as in Eq. (2), and the water inflow was simply simulated to follow this leaf expansion as in Eq. (5). However, under K limitation, individual leaf area was strongly affected by K availability (Battie-Laclau et al., 2013). Mechanistically, the increase of leaf area was driven by a water flux entering the leaf, because the turgor pressure participates to the cell expansion, following the logic of the Lockhart model (Lockhart, 1965). The Lockhart model was simplified in the present study due to the important number of parameters of the original model that had not been measured in our context and the difficulty regarding their calibration. This model allowed to relate the K availability in the phloem sap and the expansion of leaves at the individual leaf level on a daily time step. Using the dynamic water content of leaves during expansion, K demand for the cohort at each time step was calculated. The availability of K in the phloem sap then determined a K-limited water flux and thus the leaf expansion rate (Fig. 2d).
First, K availability controls the water entrance flux (Wxylem→leaf; Eq. 5) in the leaf during leaf expansion, since there was a lower limit of osmotic potential required for the entrance of water in the leaf cells.
Here, (mL d−1) was the flux of water entering the leaf during leaf expansion reduced with K limitation, Kphloem→leaf was from Eq. (22), was from Eq. (18), and r was a parameter of the same order of magnitude as the ratio of K-limited individual leaf area compared to non-limited leaf area.
Secondly, leaf water content Wleaf was recalculated using an updated value for the expansion ( instead of Wxylem→leaf).
Finally, the non-limited leaf area expansion increment computed in Eq. (2) was updated with a new K-limited leaf area expansion increment, considered to be directly proportional to the water flux entering the leaf:
where (mm2 d−1) was the area increase of the expanding leaf computed after accounting for K limitation, was obtained from Eq. (29), and Γ (mL mm−2) was the leaf surfacic water content.
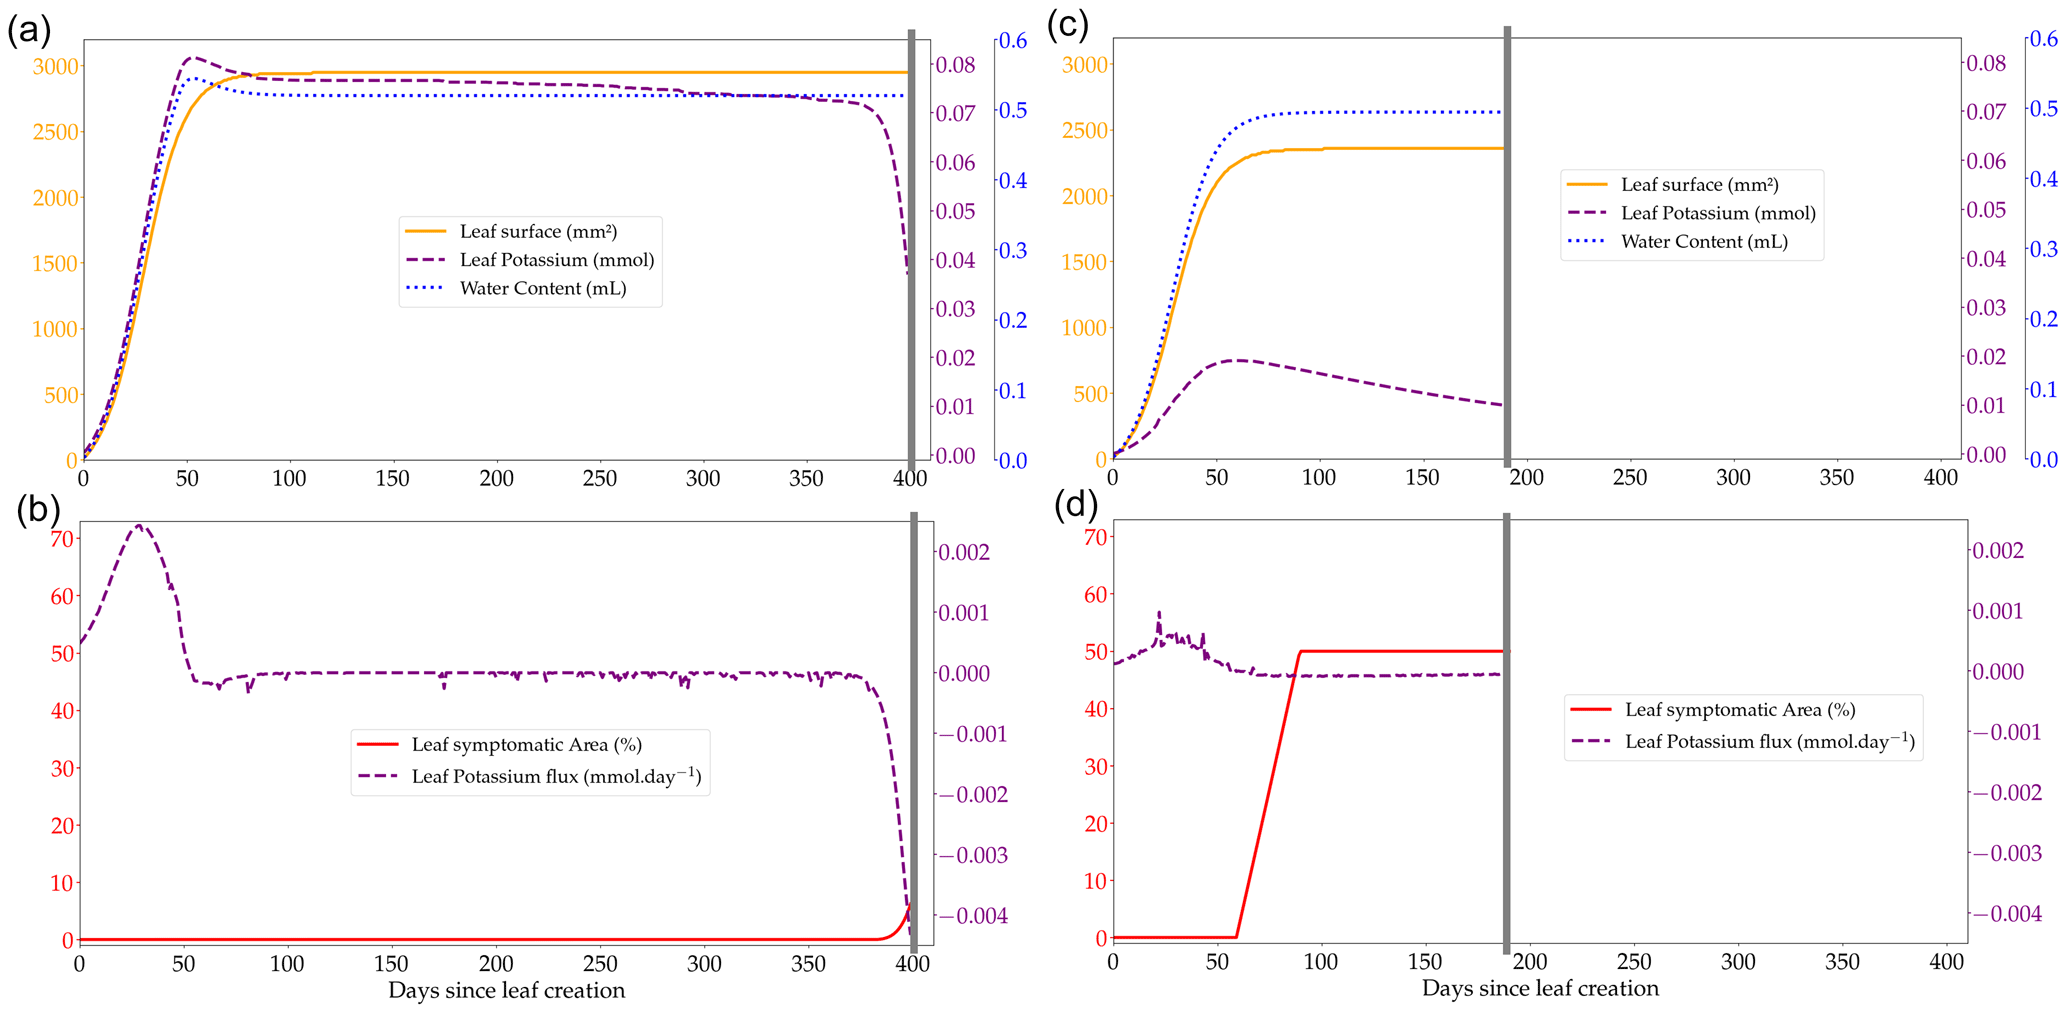
Figure 2Outputs of the leaf cohort expansion model over the course of the lifespan of a single leaf from a cohort (produced on day 504 of the rotation at the Itatinga site) in two contrasted K availabilities, +K (a, b) and oK (c, d); leaf water content, leaf K, and leaf surface at the individual leaf scale (a, c); total flux of K at the leaf scale showing the transition from K sink (positive flux to the leaf) to K source (negative flux from the leaf) (b, d). Small negative K fluxes (corresponding to a loss of K from the leaf) during the leaf's existence are K foliar leaching fluxes during precipitation events. The grey line represents the fall of the leaf cohort. The quantity of K that is in the leaf at the moment of leaf fall is added to the K litter pool.
2.7 Leaf K-deficiency symptoms and implication for leaf photosynthesis
2.7.1 Leaf K-deficiency symptoms
When leaves experience strong K deficit, they display anthocyanic symptoms (i.e. they turn purple from the leaf margins; Gonçalves, 2000). This has a strong impact on the photosynthetic capacity of affected areas (Battie‐Laclau et al., 2014a). We assumed that leaf K-deficiency symptom area results from the history of K deficiency the leaf has experienced since the beginning of its growth. This was modelled as function of the accumulation of K deficit in the leaves over time, called “deficit days” (DDs). The daily increase in DD was computed as
where (g) was the daily increase of the deficit days, [Kleaf]max (gK mL−1) was the optimal (maximal) foliar concentration of K, Wleaf (mL) was the amount of water in the individual leaf (after K limitation; Eq. 7), and Kleaf (gK) was the leaf K content.
The proportion of symptoms in a leaf (Fig. 2b, d) was then computed as
where SP was the leaf surfacic symptom proportion, DD was the accumulated deficit days computed in Eq. (31), Θ was a conversion factor from deficit days to symptom proportion, and SPmax was the maximum proportion of symptom area on a single leaf, with .
2.7.2 Impact of symptoms on leaf photosynthesis
Leaves, even with symptoms, continue to intercept radiations. In the model, it means that the light interception sub-model was not affected by symptom area; i.e. the total leaf area of each cohort was not affected by leaf K symptoms. Note that the total leaf area under K deficiency was reduced through various processes such as lower number of produced leaves because of lower growth in height (Eq. 1), reduction of individual leaf sizes (Eq. 30), and through the shorter lifespan of leaves because of K-deficiency-associated leaf fall (Sect. 2.5.3).
However, leaf symptoms have a strong effect on leaf-scale photosynthesis. Indeed, experimental results (Battie‐Laclau et al., 2014a) have demonstrated that the leaf-scale photosynthesis was strongly reduced when there was K-deficiency symptoms. This decrease was almost linear, suggesting that we could model leaf photosynthesis as fully active in the non-symptomatic areas of the leaves and null in the symptomatic area; i.e. the photosynthesis was reduced by the proportion of symptoms in the leaf.
For the sake of simplicity, this was implemented in the model by reducing the two leaf-scale photosynthetic parameters Vcmax and Jmax according to the leaf area proportion affected by symptoms as follows:
where Vcmax and Jmax were respectively the maximum carboxylation rate and the maximum rate of electron transport, and SP was described in Eq. (32).
2.8 Model parameterisation and initialisation
The photosynthetic, stomatal, and soil parameters of the model were obtained from Christina et al. (2017) and were measured at the EUCFLUX site. The parameters of the new cohort model and of the new K-cycle model were mostly measured at the Itatinga site either during the rotation simulated here (Battie‐Laclau et al., 2014b) or the previous K-omission (Laclau et al., 2009) experiment at the same site. The parameterisation was described along the equation descriptions of Sect. 2.4 to 2.7 and reported in Tables S1, S2, and S3. The calibration of the simulated processes was only done in the +K condition, since the responses of different processes to K deficiency were derived from measured or estimated parameters (except for the leaf expansion process which was calibrated in both +K and oK conditions using Battie-Laclau et al., 2013; see Tables S1 and S3). This meant that oK simulations were meant to act as tests for the model as a whole by seeing how the model was able to replicate the response of the canopy or fluxes to K deficiency. Either RMSE (single variable to fit) or multiple normalised RMSE (multiple variables to fit; Eq. S1) were used as goodness-of-fit indicators when calibrating the model.
The beginning of the simulation was considered to be the planting date. Tree height at planting was set at 10 cm. The canopy was initialised with a very small, but not null, amount of leaves: 10 leaves of 30 mm2 each per metre squared (equivalent to 0.0003 m2 leaf per metre squared of soil). The soil was divided into 50 layers of either 33 cm (for the three top layers of soil) or 50 cm (the 47 bottom layers) depth each, and soil properties for each layer were obtained from Christina et al. (2017). Initial values of water content of the soil on the planting day were set as measured at the EUCFLUX site (Christina et al., 2017). All model runs were initialised with the amounts of K present in the soil and in the litter compartment. The amounts of K present in the litter were determined using measurements of the mass and elemental dosages of the litter present on the ground at the beginning of the rotation in the Itatinga experiment, which amounted to 1.92 gK m−2 (Laclau et al., 2010). The amount of K present in the soil compartment at the start was deduced from exchangeable soil K concentrations and bulk soil density measurements from soil surface to a depth of 18 m (Maquère, 2008). It amounted to 0.507 gK m−2 (it was converted from gK m). The simulations were run on the EUCFLUX site.
2.9 Model intercomparison
The results of CASTANEA-MAESPA-K were compared to the MAESPA model (Christina et al., 2015). The simulations of MAESPA were conducted at the Itatinga site, on the same rotation as was simulated in this study. MAESPA does not dynamically simulate canopy dynamics or the effect of K on diverse processes. Instead the canopy structure and functioning of +K and oK stands were the result of a prescribed parameterisation using yearly values measured at the Itatinga experimental site (e.g. leaf area, photosynthetic parameters, and tree height). This model suffered the following shortcomings compared to CASTANEA-MAESPA-K: inability to simulate a gradient of K availability, inability to simulate different initial conditions, absence of C-allocation sub-model, absence of K fluxes, and increase in computation time. However, we considered that it was a good comparison point for stand fluxes of carbon and water due to both its fine description of canopy structure and functioning and its validation on soil water content at this site (Christina et al., 2018).
2.10 Sensitivity analysis
A sensitivity analysis was conducted with a one-at-a-time (OAT) approach, in both K-fertilised (+K) and K-omission (oK) conditions to test the sensitivity of GPP to the different processes. The sensitivity of GPP to all the parameters of the newly introduced sub-models was tested. The method used was the following: in each fertilisation condition (+K and oK), the parameter was increased and decreased by 10 %, except the fertilisation parameters which were fixed to their +K and oK treatment values. The model was then run for each combination of fertilisation and parameter values. The total average GPP of the simulated rotation was compared to the simulated average GPP of the rotation with the same fertilisation regime and the initially fixed value of the parameter. The percentage of difference between +K and oK simulations gave the response of the simulated GPP to the variation of the chosen parameters.
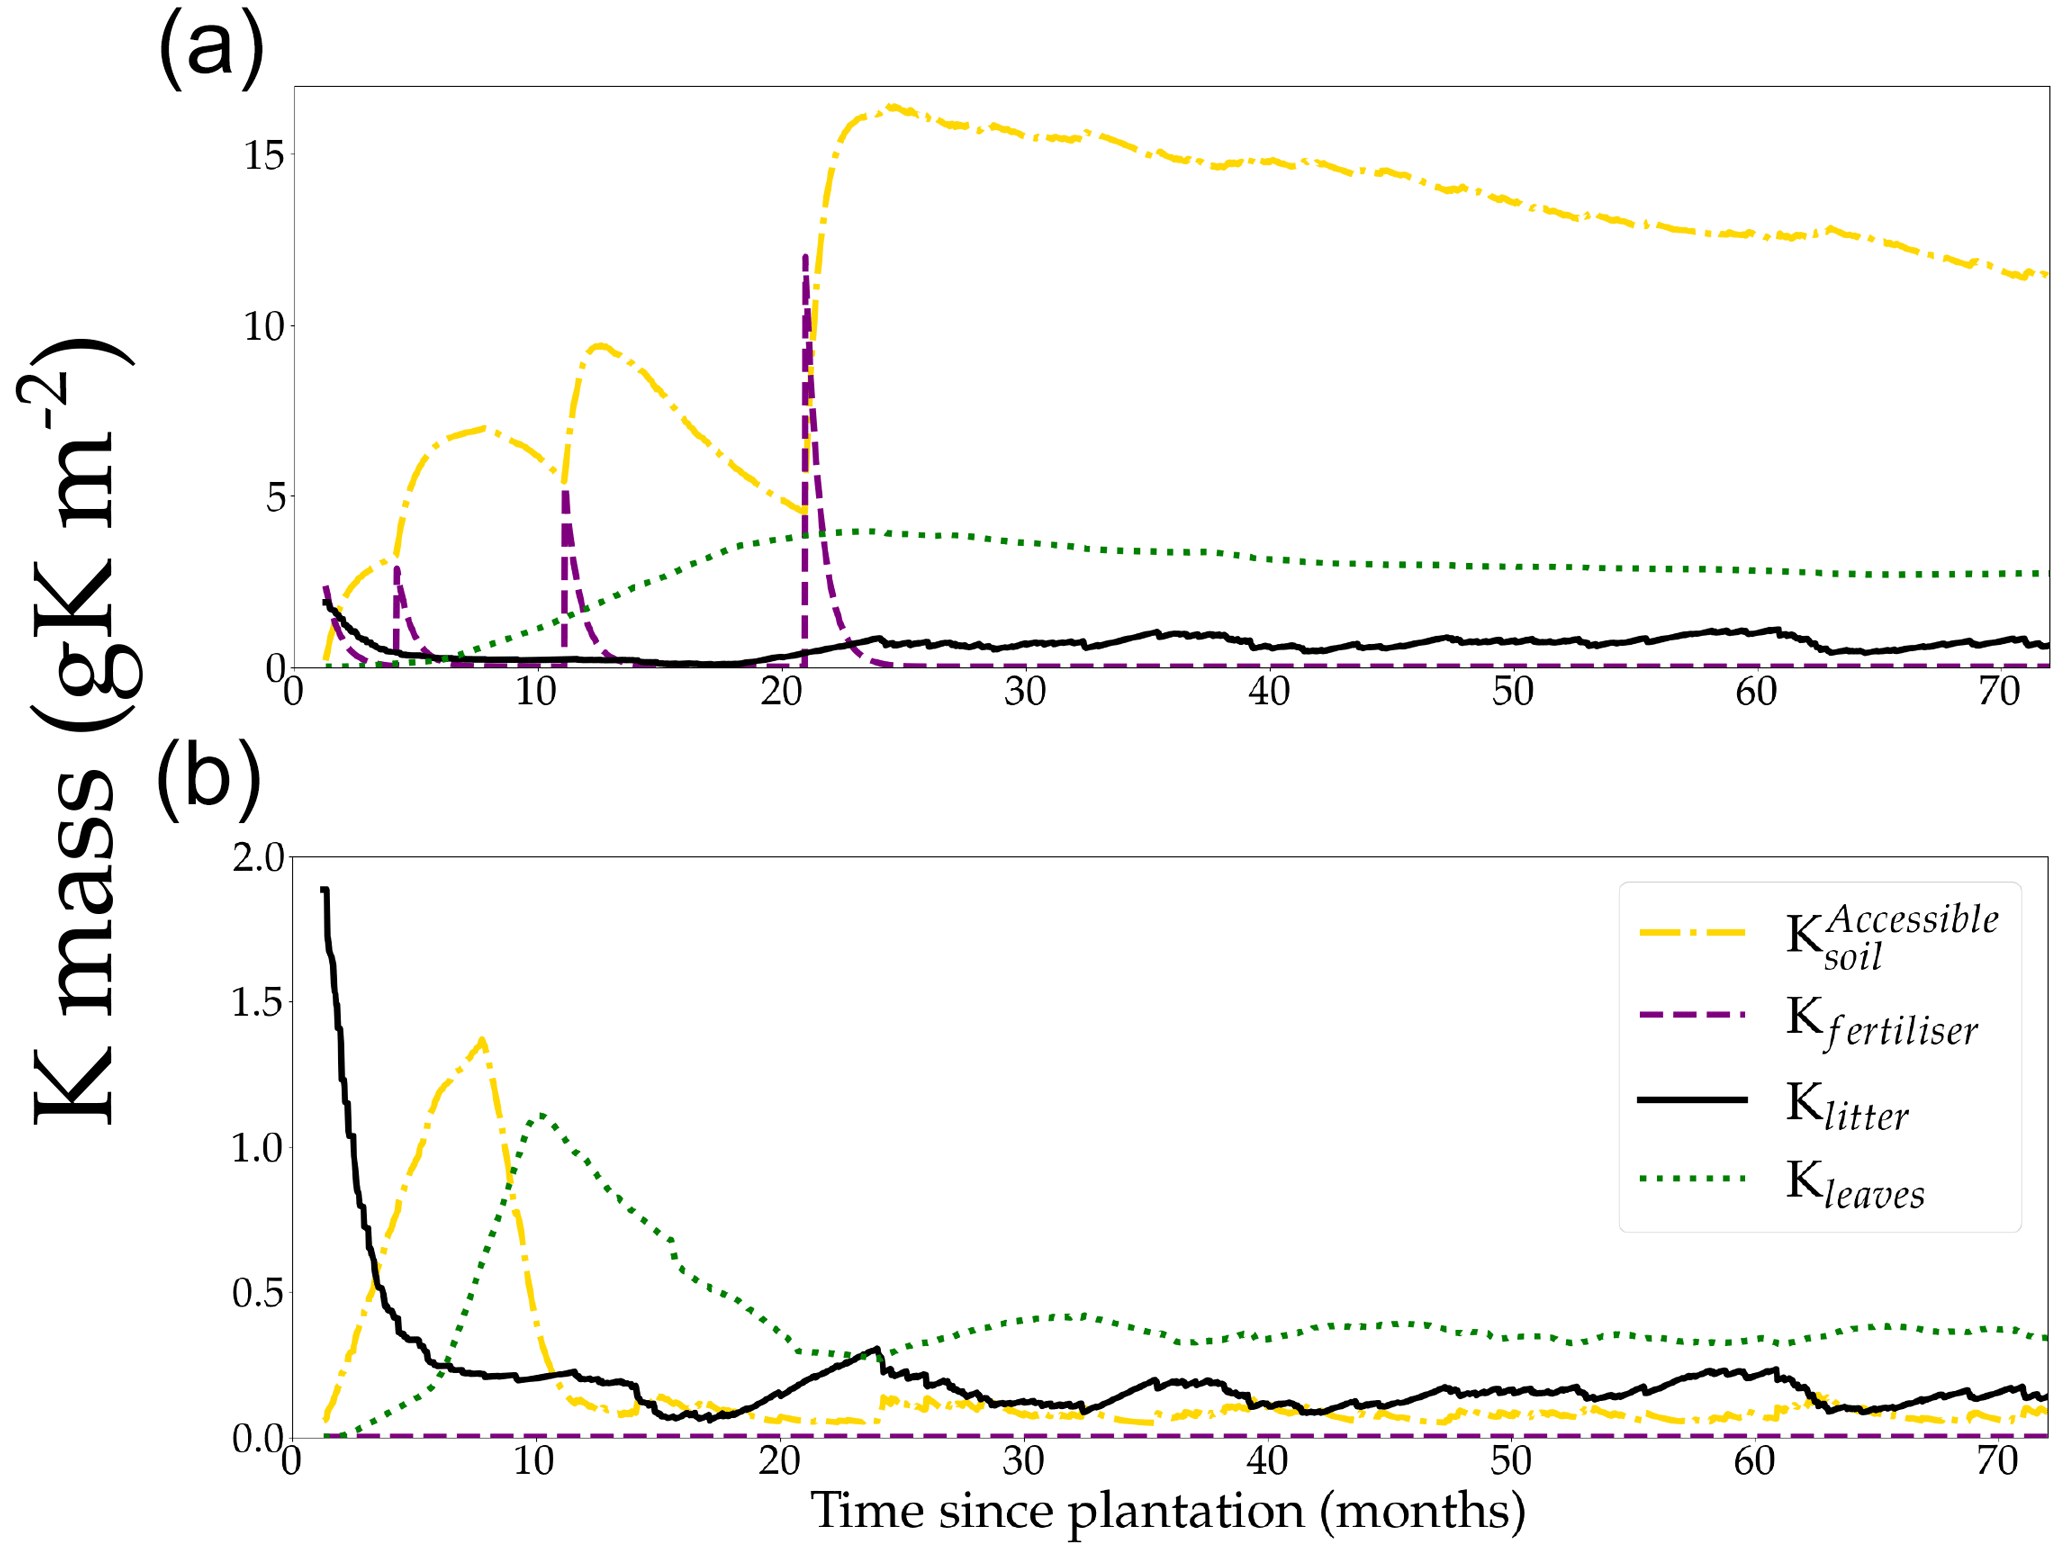
Figure 3Simulated stocks of K in the soil, litter, fertiliser, and canopy compartments in a non-K-limited (+K) stand (a) and in the same K-limited (oK) stand (b). Note differences of the y axis scales for better visualisation.
3.1 Ecosystem K cycle during a rotation
The quantity of K accessible in the soil for the plant was on average 62 times as high in the +K (Fig. 3a) compared to the oK fertilisation treatments (Fig. 3b). While the K stored in the canopy was only a small fraction (23 %) of the total K in the system in the +K stand, leaves accounted for more than half of the total K stock in the oK stand (52 %). In both stands, the quantity of K stored in the litter was small, representing 3.8 % of total K in +K treatment and 27 % in oK (Fig. 3,1). In the +K stand, the amount of K in the leaves increased until 2 years, after which it remained steady up to harvesting (Fig. 3a). By contrast, the increase only lasted for 1 year in the oK stand and was quickly followed by a strong decrease (Fig. 3b). The strong decrease in Kleaves was concurrent to an important decrease in , as the initial litter stock was depleted while the plant demand was still high and a lower leaf biomass in oK. In the +K stand, the fertiliser quickly compensates for the decrease in initial litter K, increasing the to high values.
Table 1Mean value of simulated K stocks over the entire rotation.
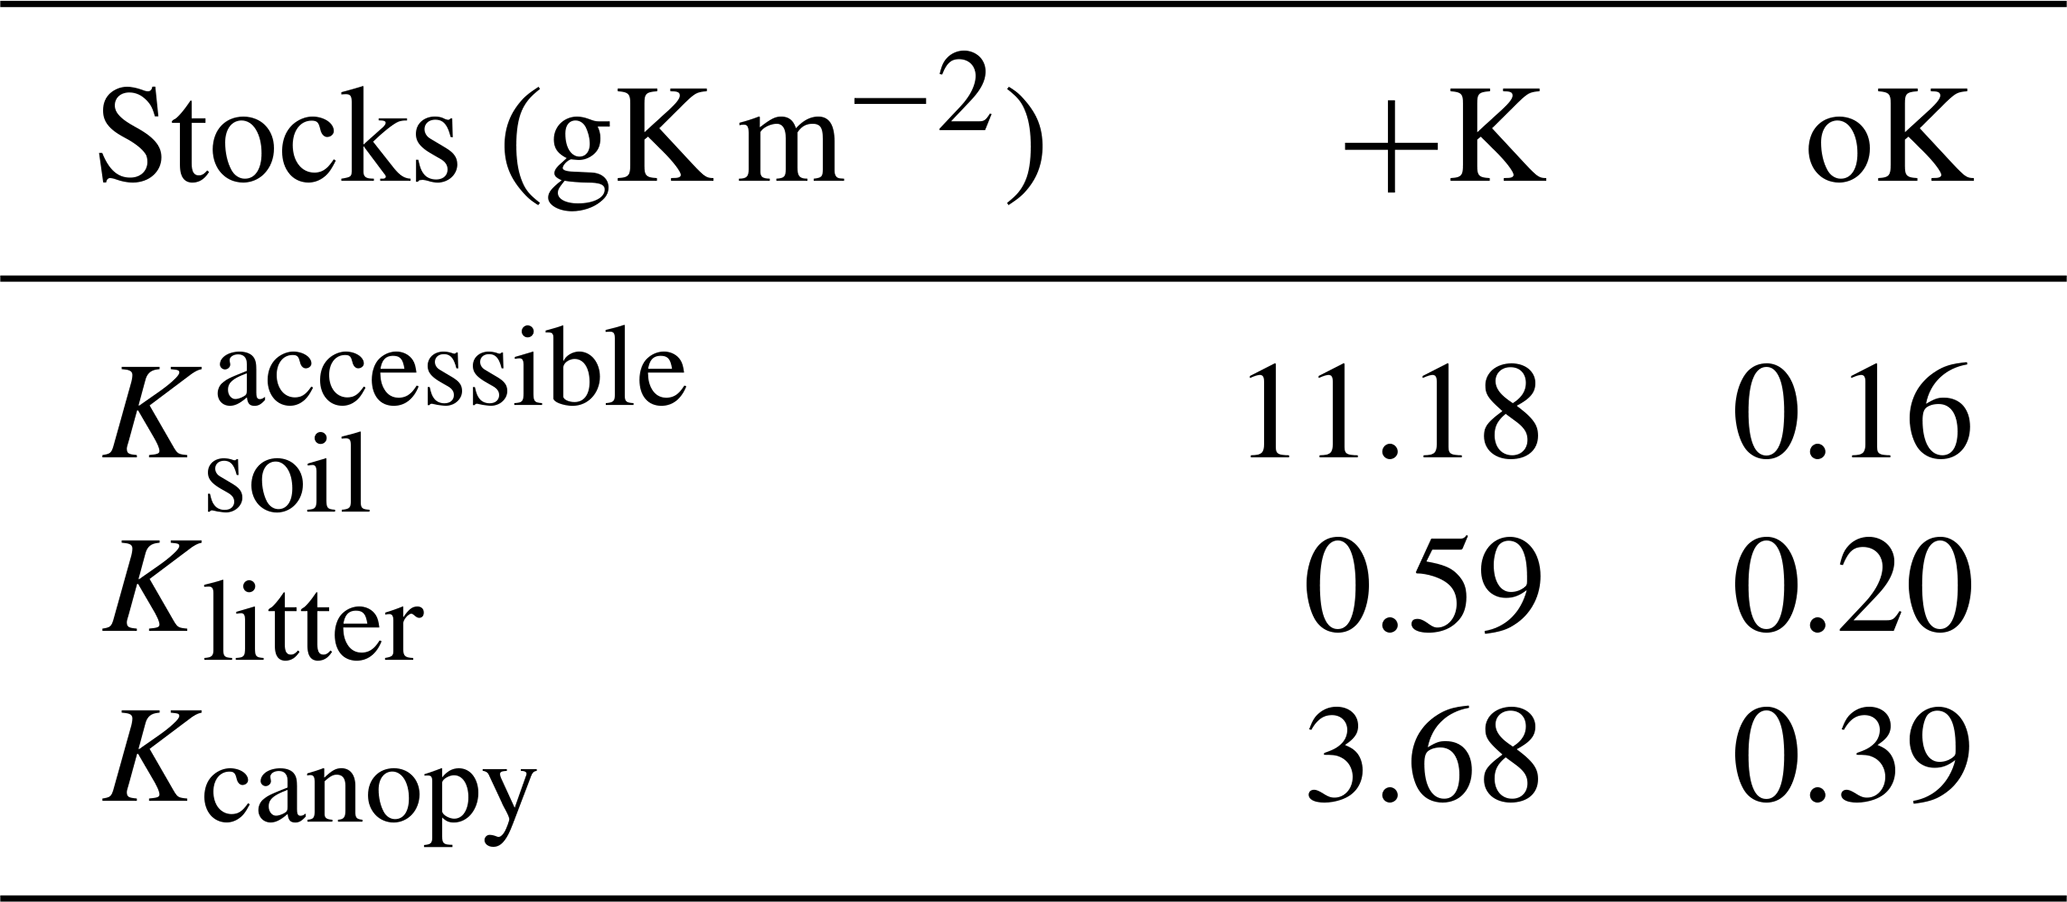
Table 2Mean value of simulated yearly fluxes of K for two contrasted fertilisation regimes: +K and oK.
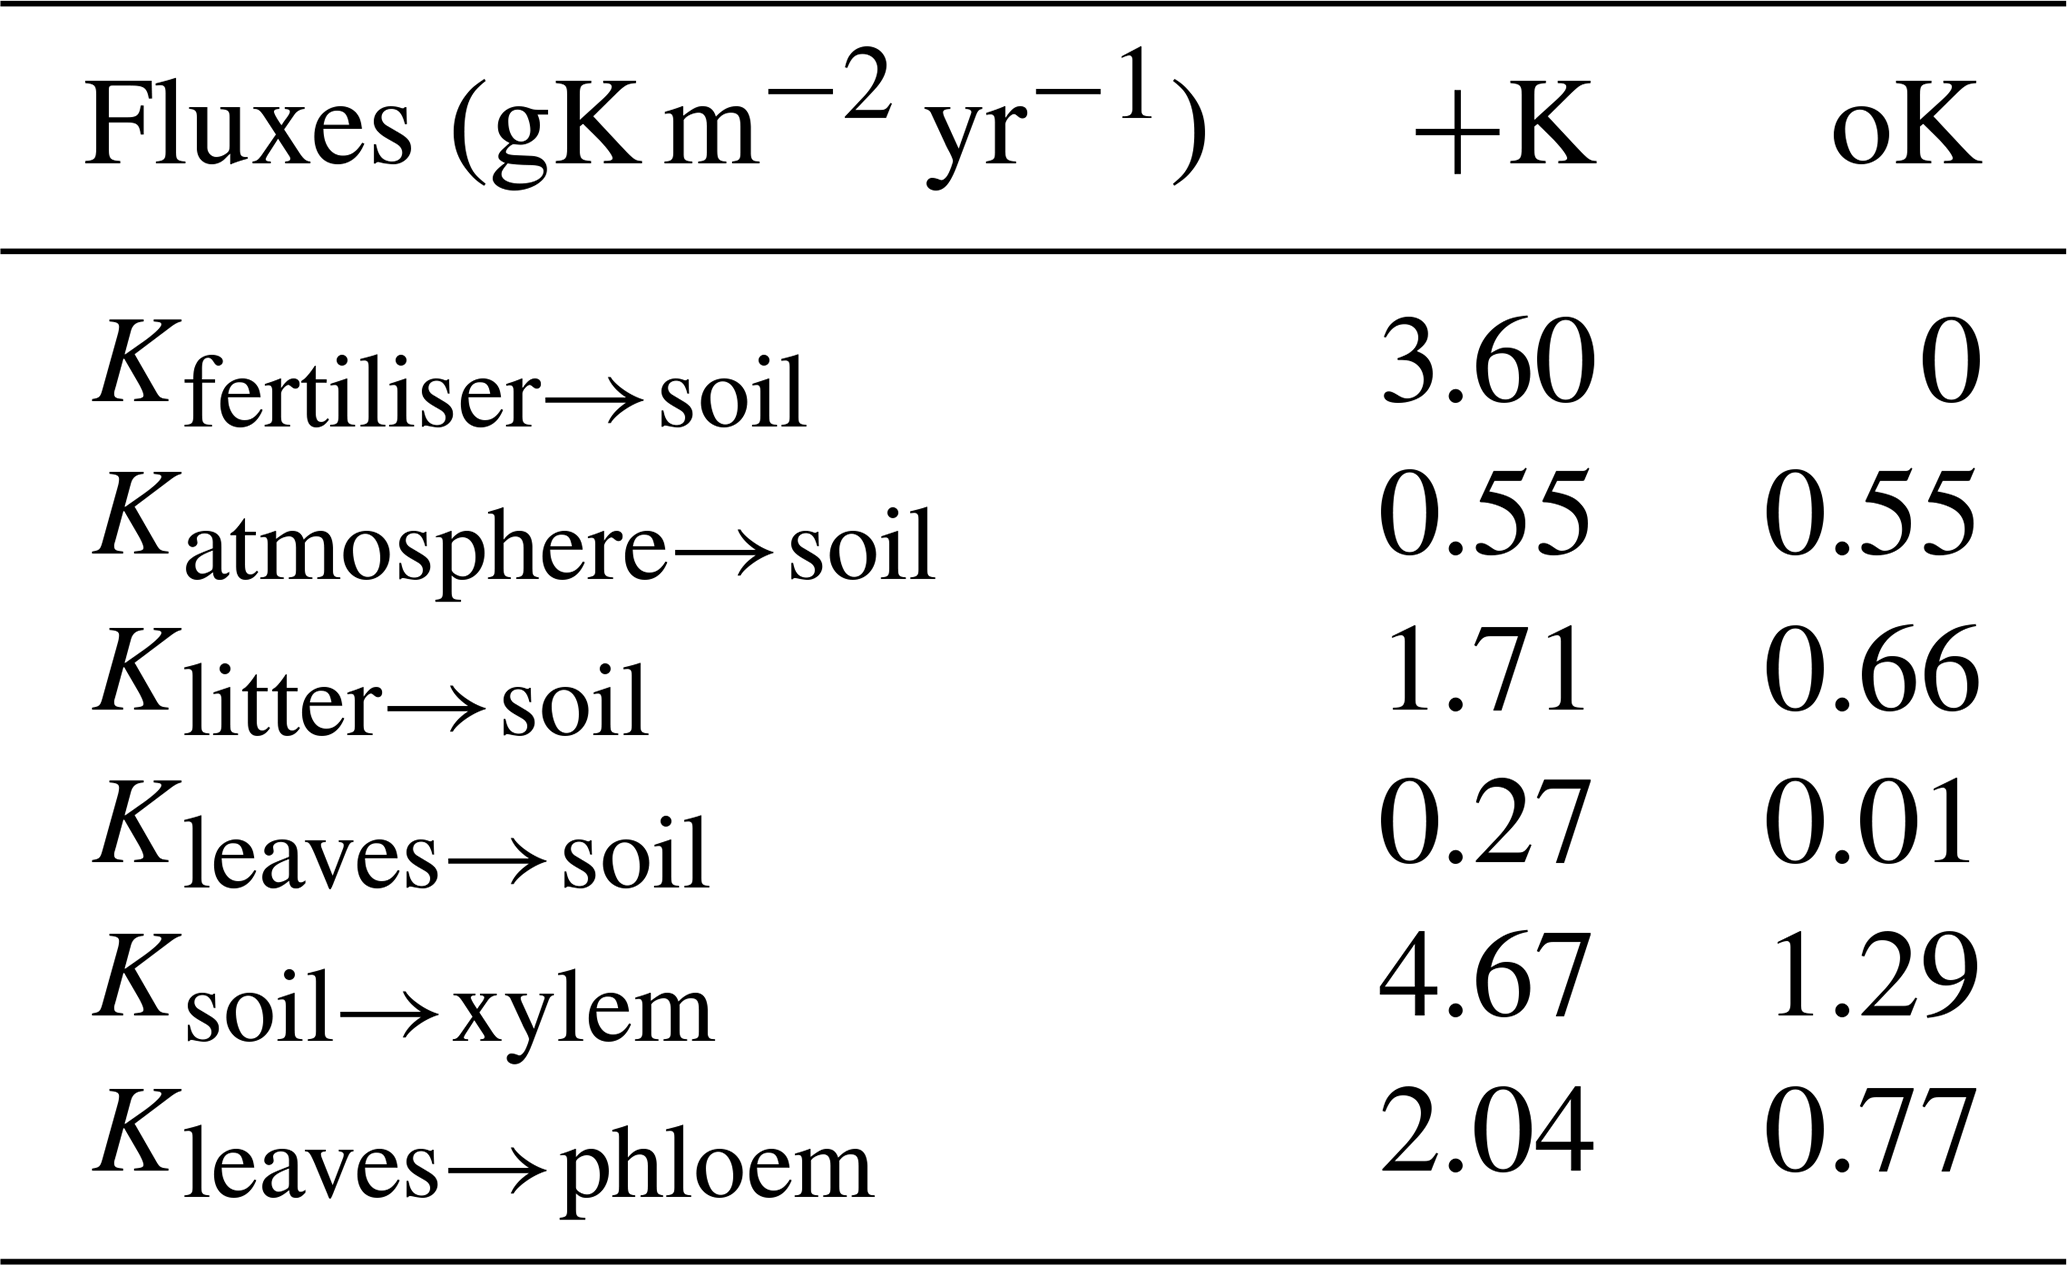
In the +K treatment, over the course of the rotation, the fluxes of fertiliser, atmospheric deposition, litter leaching (Eq. 8), and canopy leaching were respectively 59 %, 9 %, 28 %, and 4 % of the total amount of K that entered the soil (Table 2). In the oK stand, they were respectively 0 %, 43 %, 56 %, and 1 % (Table 2). So while the litter stock was small (Table 1), the cumulated flux of K from the litter to the soil was important for K cycling in both fertilisation regimes. In both stands, the resorption flux from leaves (Kleaf→phloem) was higher than the sum of canopy leaching (Kleaves→soil) and litter leaching flux (Klitter→soil, Table 2), highlighting the role of the tree internal K cycling.
In the +K treatment, leaf resorption (Kleaves→phloem) was equal to 43 % of the average uptake flux (Ksoil→xylem; Table 2). In the oK, this proportion was higher (60 %) thus showing the importance of the internal K recycling for the maintenance of a suitable K supply for growing organs.
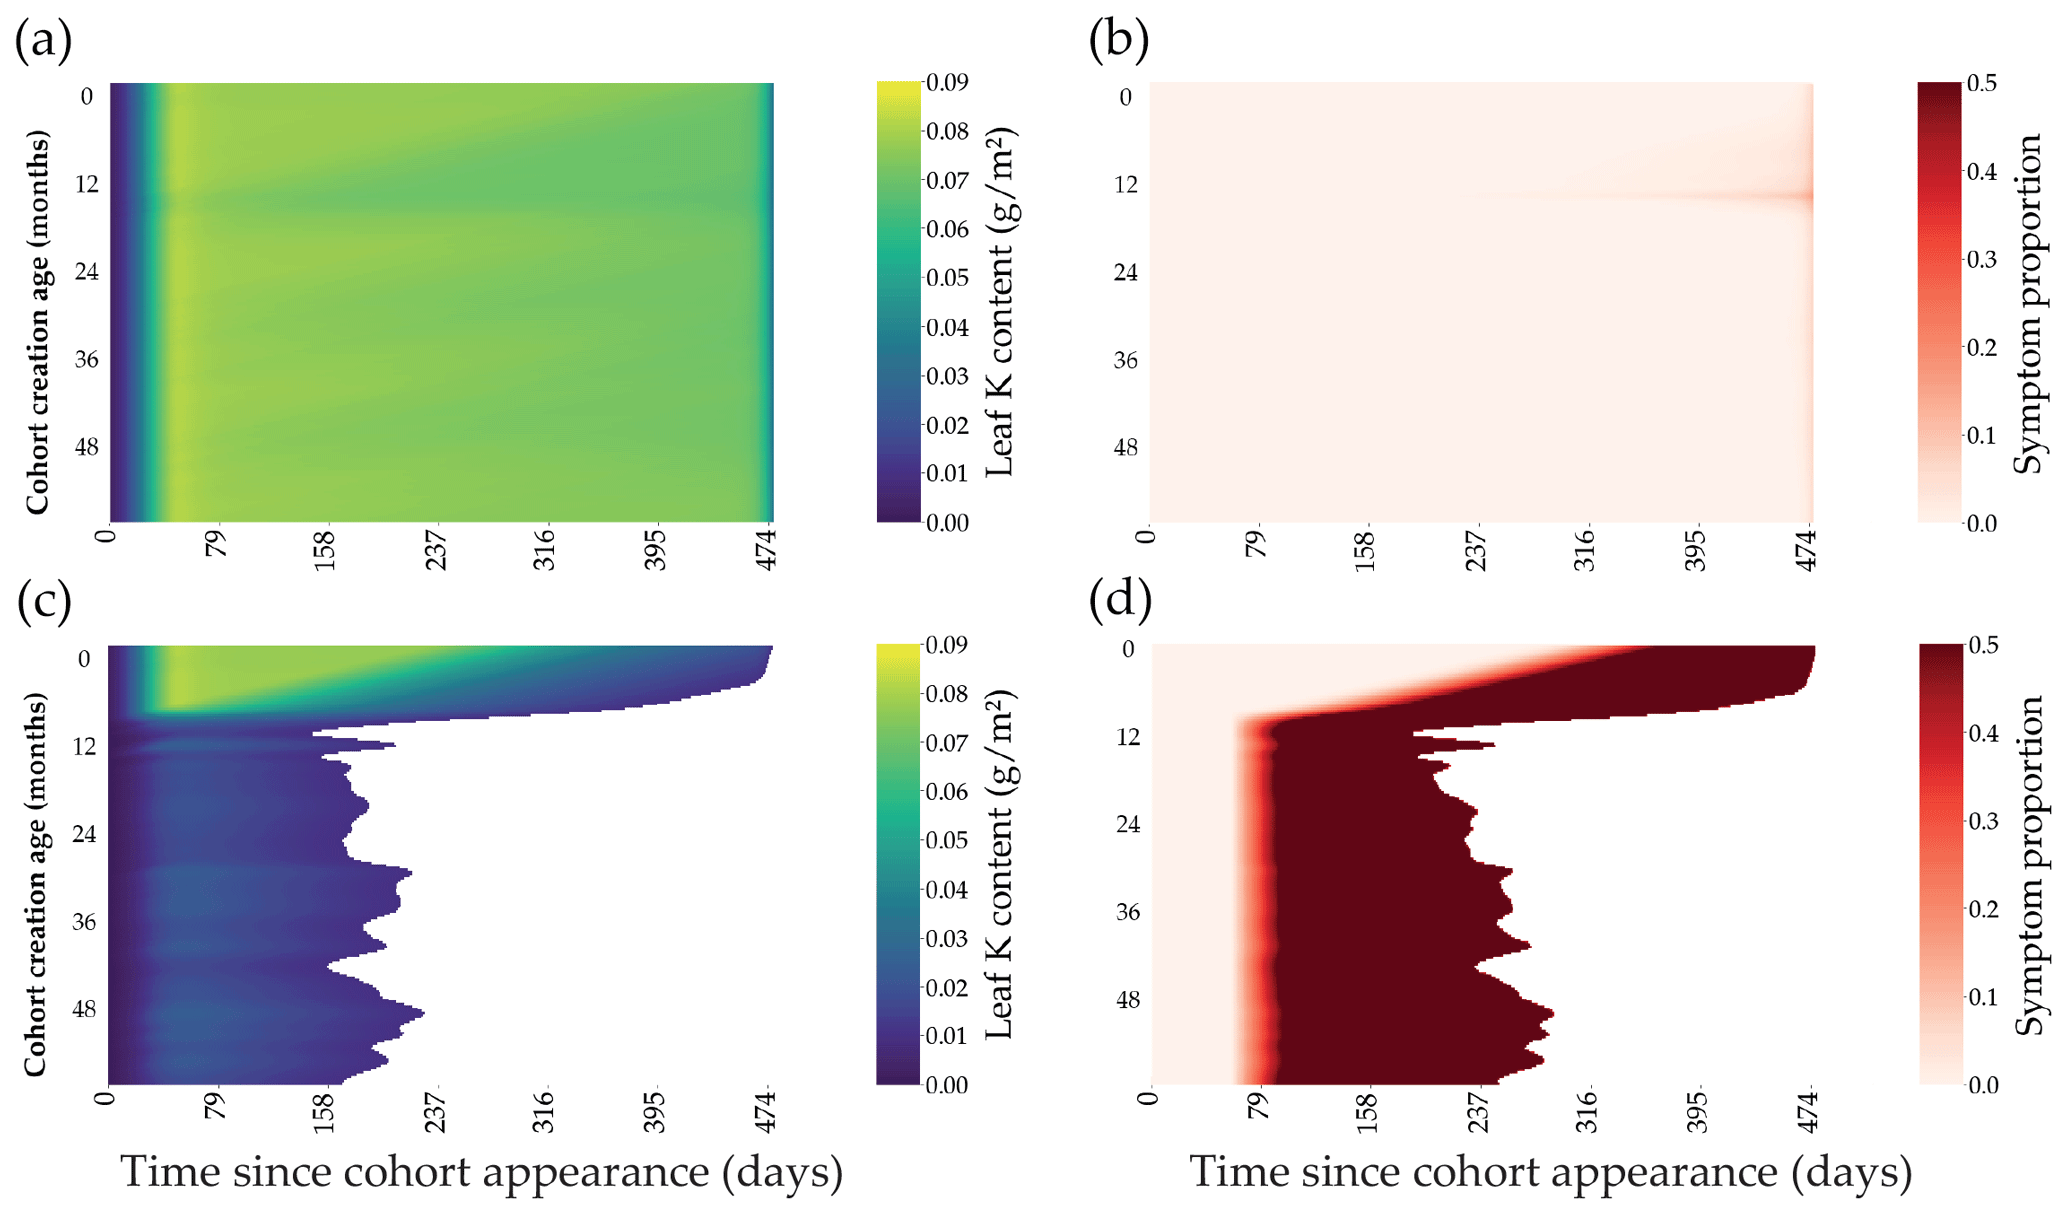
Figure 4Outputs of the leaf cohort model in two contrasted K fertilisation regimes. The K content present in each individual leaf of the cohort is represented through the lifespan of a cohort (x axis) for the different cohort created along the first 60 months of the rotation (a, c). The symptom area proportion for each leaf of the cohort is also represented (b, d). Top subplots (a, b) were simulated in +K conditions, while bottom subplots were oK simulations (c, d).
3.2 Leaf cohort model and canopy dynamics
The leaf expansion model was successful in simulating the influence of K on both the dynamics and maximum value of the individual leaf area (Fig. 2a, c; Battie-Laclau et al., 2013). Positive fluxes of K into the leaf took place during the expansion process (Fig. 2b, c). Foliar leaching, K expulsion after leaf expansion (Eq. 6), and resorption were responsible for fluxes of K going out of the leaf across its lifespan (Fig. 2b, d). This model allowed us to represent leaf K content in the leaves at the organ scale and also revealed the variation of K availability at the leaf level during the rotation. In +K condition, K availability was high during the whole rotation with the symptom area proportion of the canopy always below 2.5 % (Fig. 5b) throughout the leaf lifespan, reaching its maximum (LLS, fixed value). On the other hand, in oK simulations, leaf lifespan was greatly reduced (less than half of the leaf lifespan of fertilised stands; Fig. 4c), and symptom proportions reached more than 40 % during a major part of the rotation (Fig. 4d, 5b). The patterns of the leaf K content in the different cohorts during the oK rotation had two phases (Fig. 4c): a first phase of the rotation where soil K bioavailability was high and a second phase with very low K concentrations in leaves. This mirrors the K availability in the soil and litter sub-system (Fig. 3b). The first phase corresponds to a high initial litter decomposition flux (litter originating from the preceding rotation which was fertilised with K), in the second phase the only fluxes of K to the soil were the litter leaching flux (recycling) and atmospheric deposition (external input). These cumulated fluxes were not sufficient to satisfy the plant K demand.
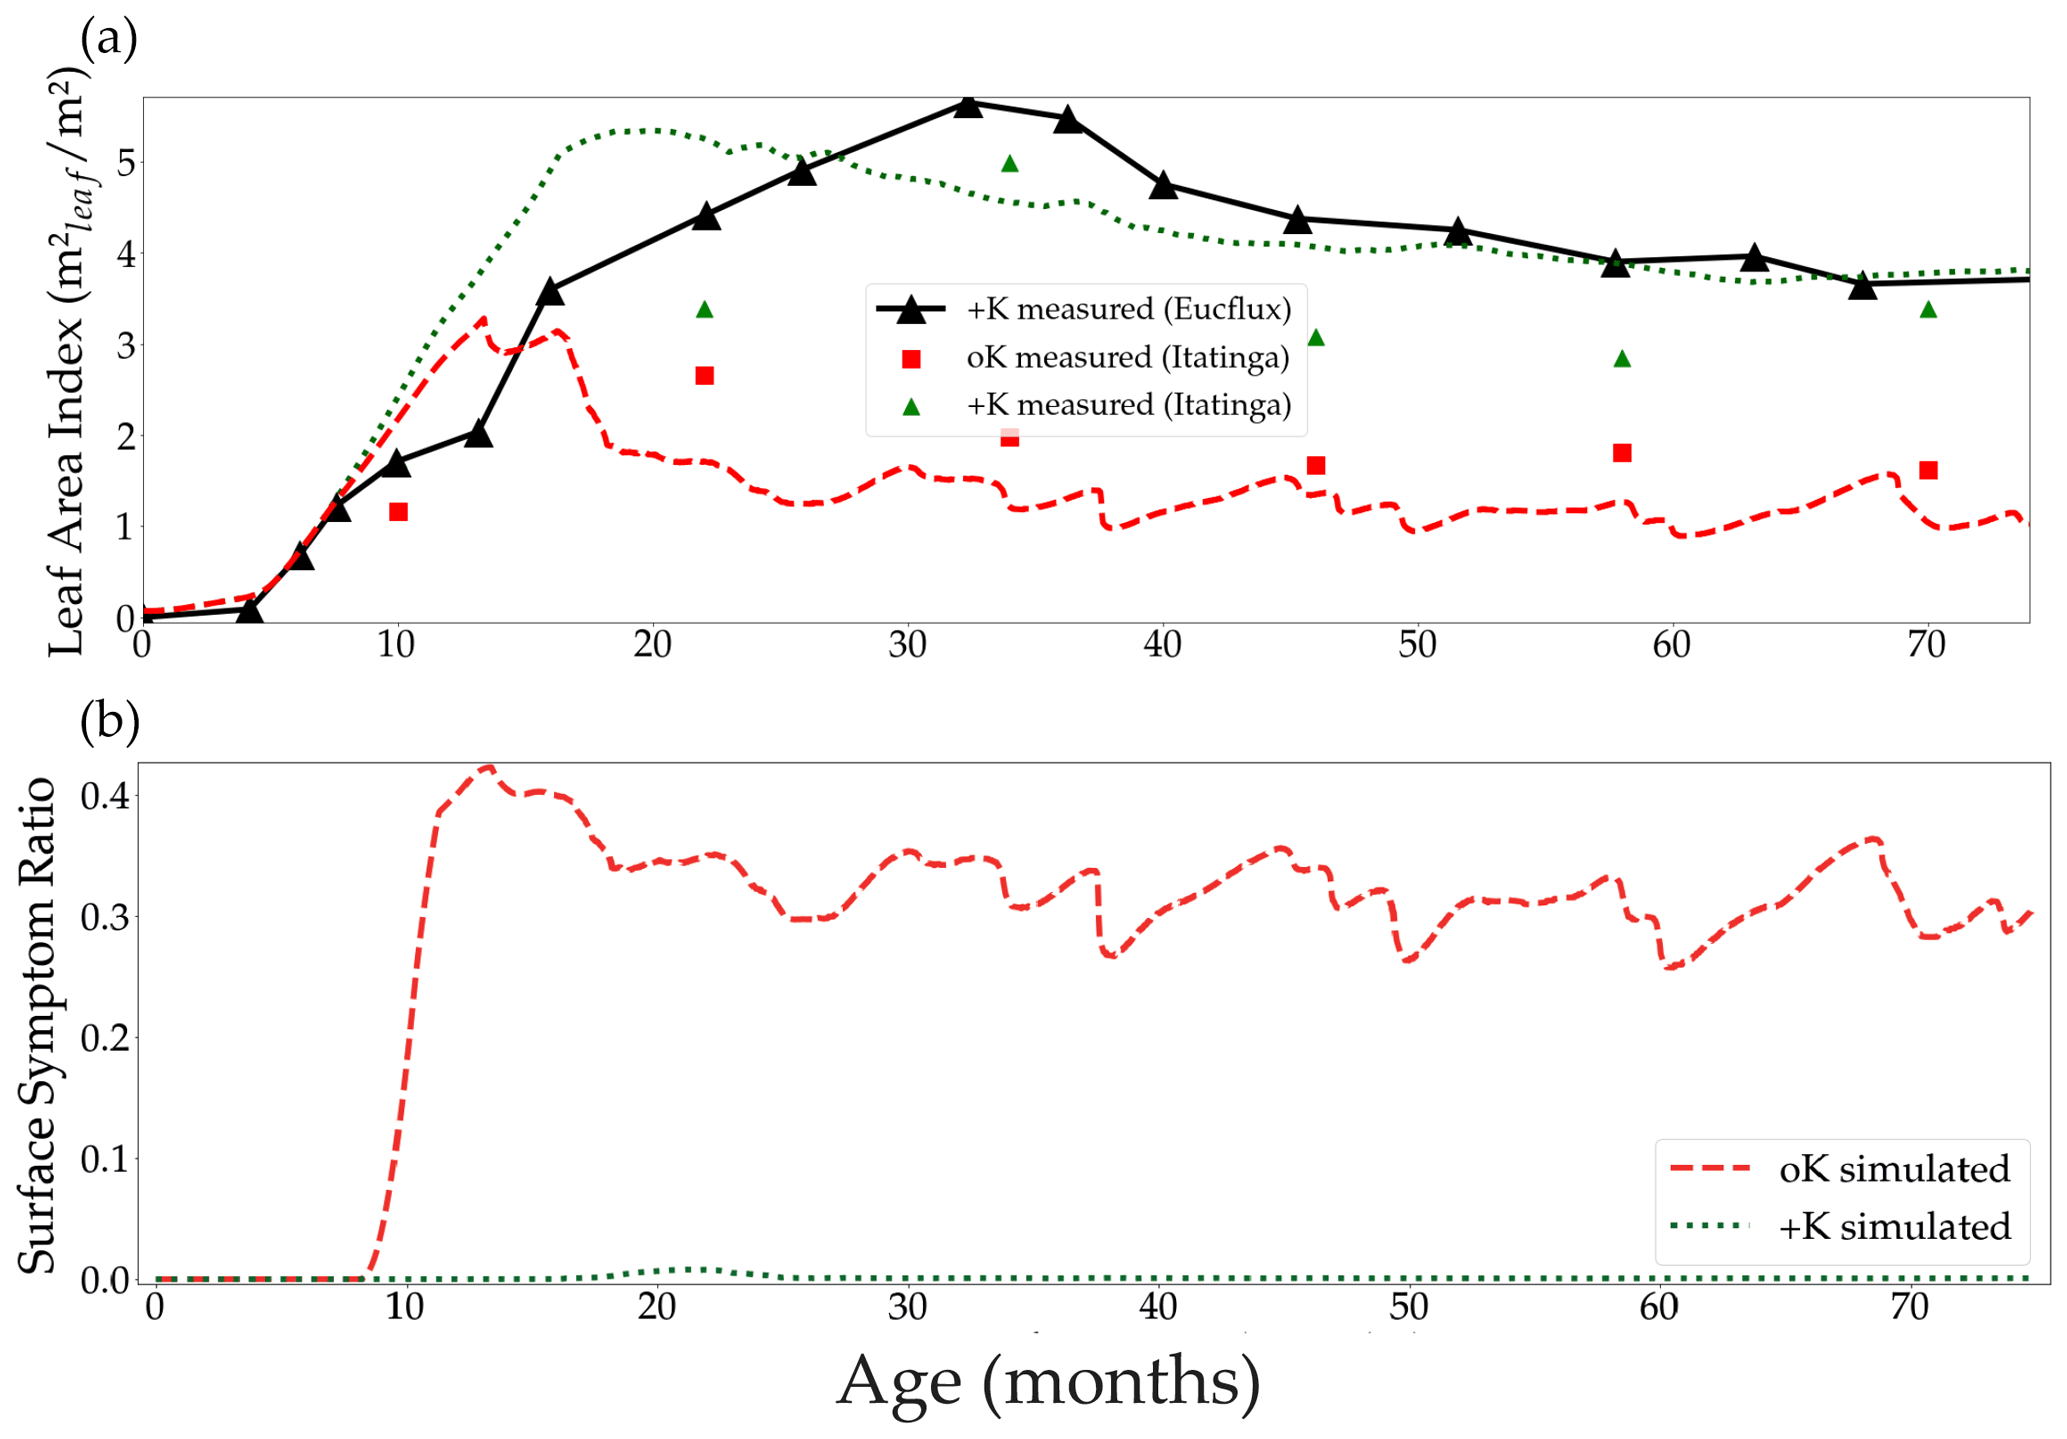
Figure 5Simulated leaf area index in both the fertilised +K and non-fertilised oK treatments, and the leaf area index measured at the Itatinga experiment and at the eddy covariance site EUCFLUX (a). Canopy average proportion of leaf area with symptoms in both fertilisation treatments (b).
The difference of leaf area between the +K and oK simulated stands was higher than observed in the +K and oK treatments of the Itatinga fertilisation experiments. The mean leaf area of the oK stands were 58 % of the leaf area of the +K stand in the experiment versus 43 % in the model (Fig. 5a). This could be explained by different response to K deficiency between the genetic material (different eucalypt clones) used at EUCFLUX and at Itatinga. Another possibility was an underestimation of K availability in the oK stand in our simulations. For example, a small change in the mineral weathering flux from 0 to a realistic value of 0.3 gK m−2 yr−1 (Cornut et al., 2021) led to the simulated leaf area in the oK stand being 53 % of the +K stand (not shown).
In the oK condition, symptoms appeared very early during the leaves' lifespan (Fig. 4d). The proportion of symptomatic leaf area was slightly higher in the simulations of the EUCFLUX site than measurements at the Itatinga site (Fig. S7). This could be due to an overestimation of the leaves' limitation by K or a difference in response of the genetic material to K availability.
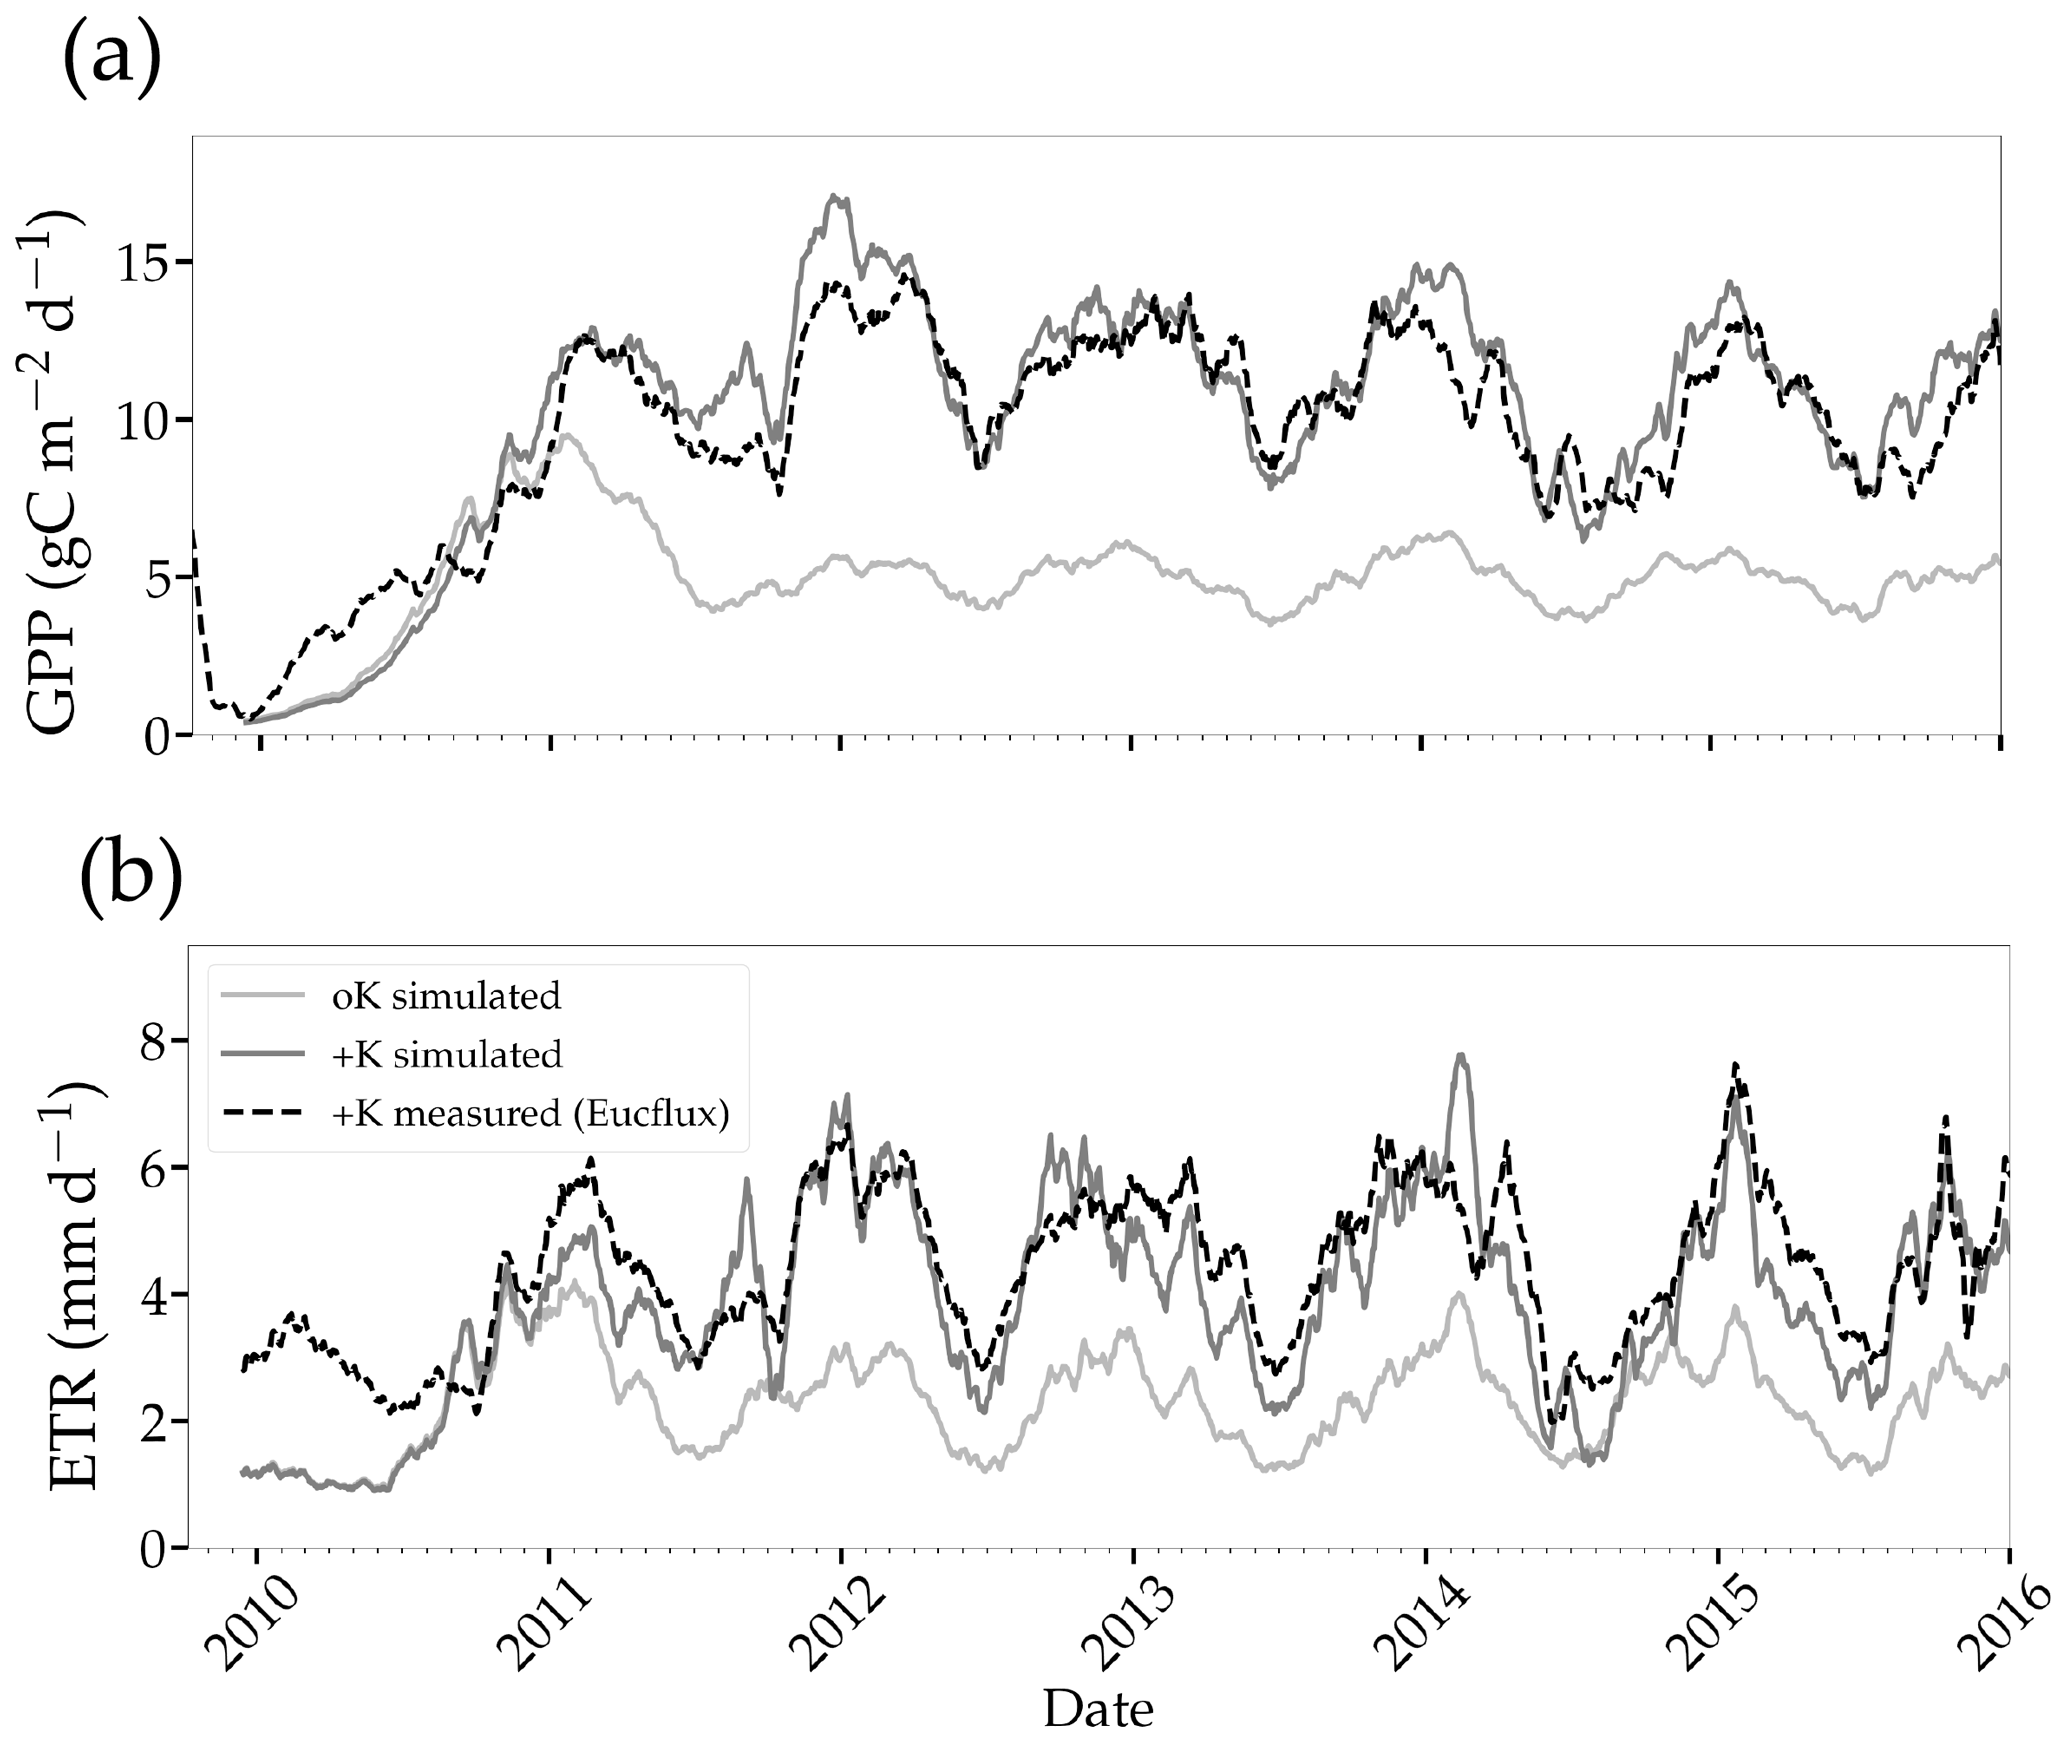
Figure 6Simulated and measured daily gross primary productivity (a) and evapotranspiration (b) fluxes simulated in two stands with contrasted fertilisation regimes. The measurements were performed continuously using the eddy covariance method at the EUCFLUX site (a +K stand, fully fertilised). A rolling average of 30 d was applied to the observed and simulated time series for the sake of clarity.
3.3 Carbon and water fluxes
Simulated GPP was greatly reduced under oK conditions (Fig. 6a), and the cumulated GPP in the oK stand was only 50 % of the +K stand on average (Table 3). Seasonal fluctuations of GPP between dry and wet seasons were clearly visible in both simulations; however the seasonal variability was higher in the +K stand (Fig. 6a) due to lower access to soil water in the +K stand as a result of higher ETR resulting in faster deep-soil water depletion (Fig. 6b). The difference of GPP between fertilisation regimes was not constant during the rotation. During the first phase (i.e. the first year), the difference was small due to similar low leaf areas in both fertilisation conditions resulting in low K demand, fulfilled by sufficient K availability for both treatments (Fig. 4a, c). The difference was also quite small during the major 2014 drought (Fig. 6a) where water limitation dominated in the +K stand. The simulated GPPs were similar to both measurements (Epron et al., 2012) and simulations conducted at Itatinga with the MAESPA model (Christina et al., 2015) (Table 3).
Epron et al. (2012)Christina et al. (2015)Table 3Annual GPP at the study sites, under contrasted K supply regimes. Values from Epron et al. (2012) were inferred from fluxes and biomass increment measurements obtained from a previous fertilisation experiment at the Itatinga site. Values from Christina et al. (2015) were simulated by the MAESPA model. Percentages in parentheses indicate the ratio of GPP between the oK and +K treatments for each experiment. The data presented are different from those on Fig. 6b that display evapotranspiration.
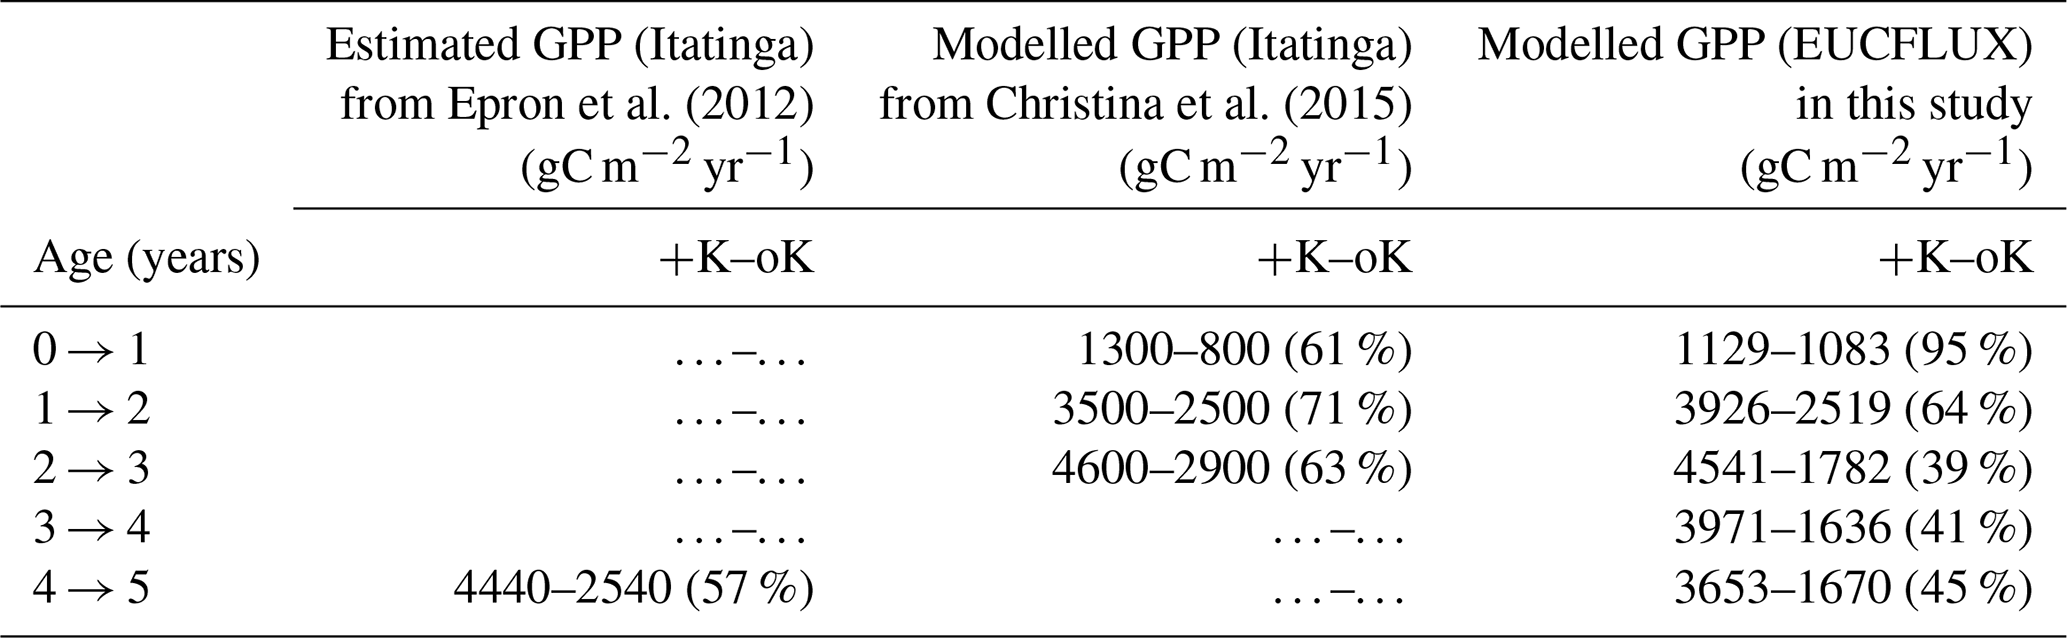
Table 4Annual transpiration fluxes for contrasting K supply regimes both in our study and in a previous modelling work that used the MAESPA model (Christina et al., 2018). Percentages between parentheses indicate the ratio of transpiration between the oK and +K treatments for each experiment.
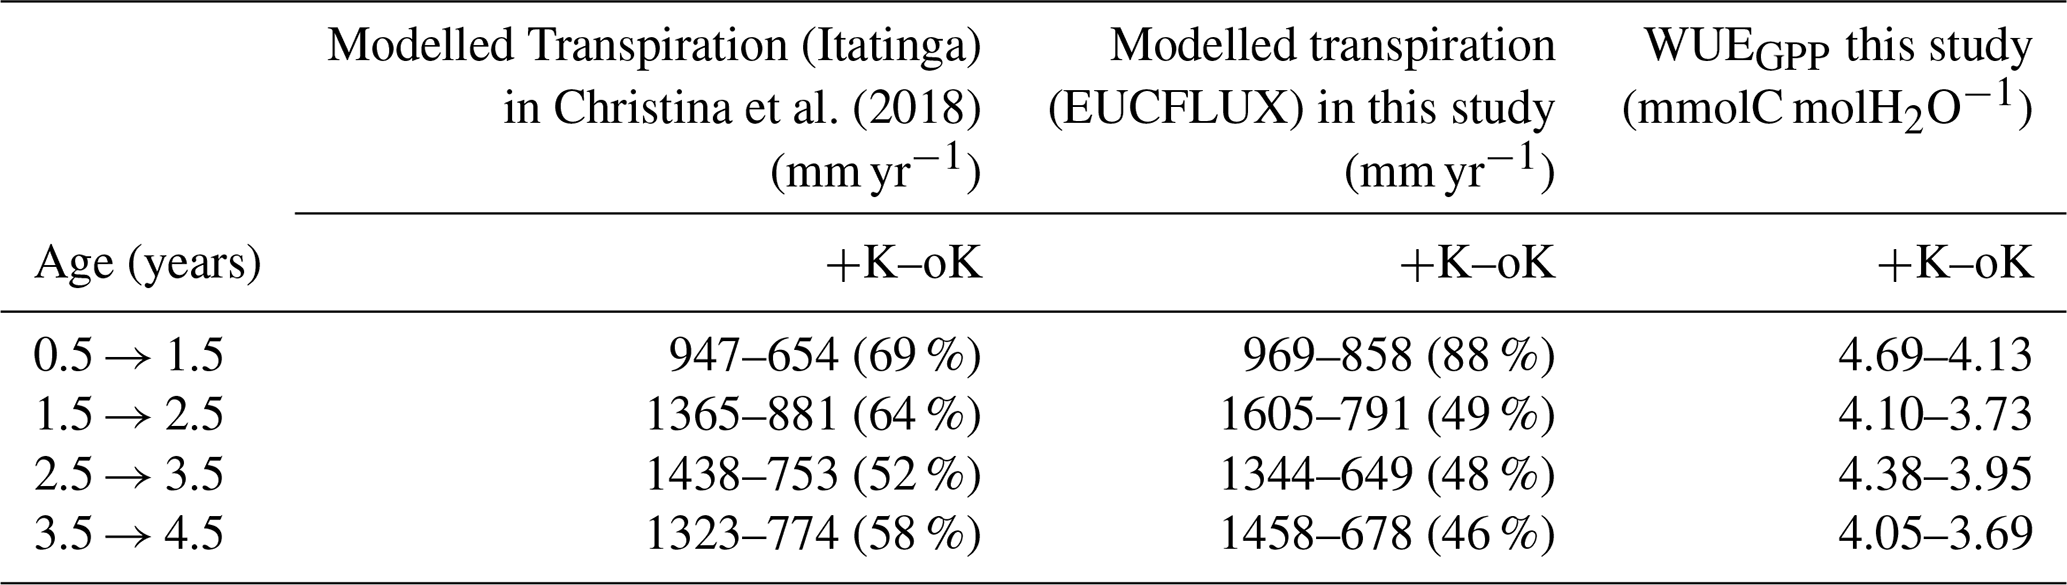
Our simulations showed reduced evapotranspiration under K deficiency (Fig. 6b), which was expected, since K deficiency had a strong impact on leaf area (Fig. 5a). We compared our transpiration simulation results with those obtained using the MAESPA model at the Itatinga oK stand. The MAESPA-simulated transpiration values had been validated using sap-flow measurements. While in the first part of the rotation the difference between treatments simulated by our model was lower than those simulated by MAESPA, in the following years our simulations were close to MAESPA results (Table 4). Total 5-year cumulated transpiration in the oK plot was 54 % of that of the +K plot in our simulation of the EUCFLUX site. This was a slightly higher proportion than for GPP; i.e. GPP was more impacted than transpiration by K deficit. As a consequence, the simulated WUE for GPP was higher in +K condition in our simulations (Table 4).
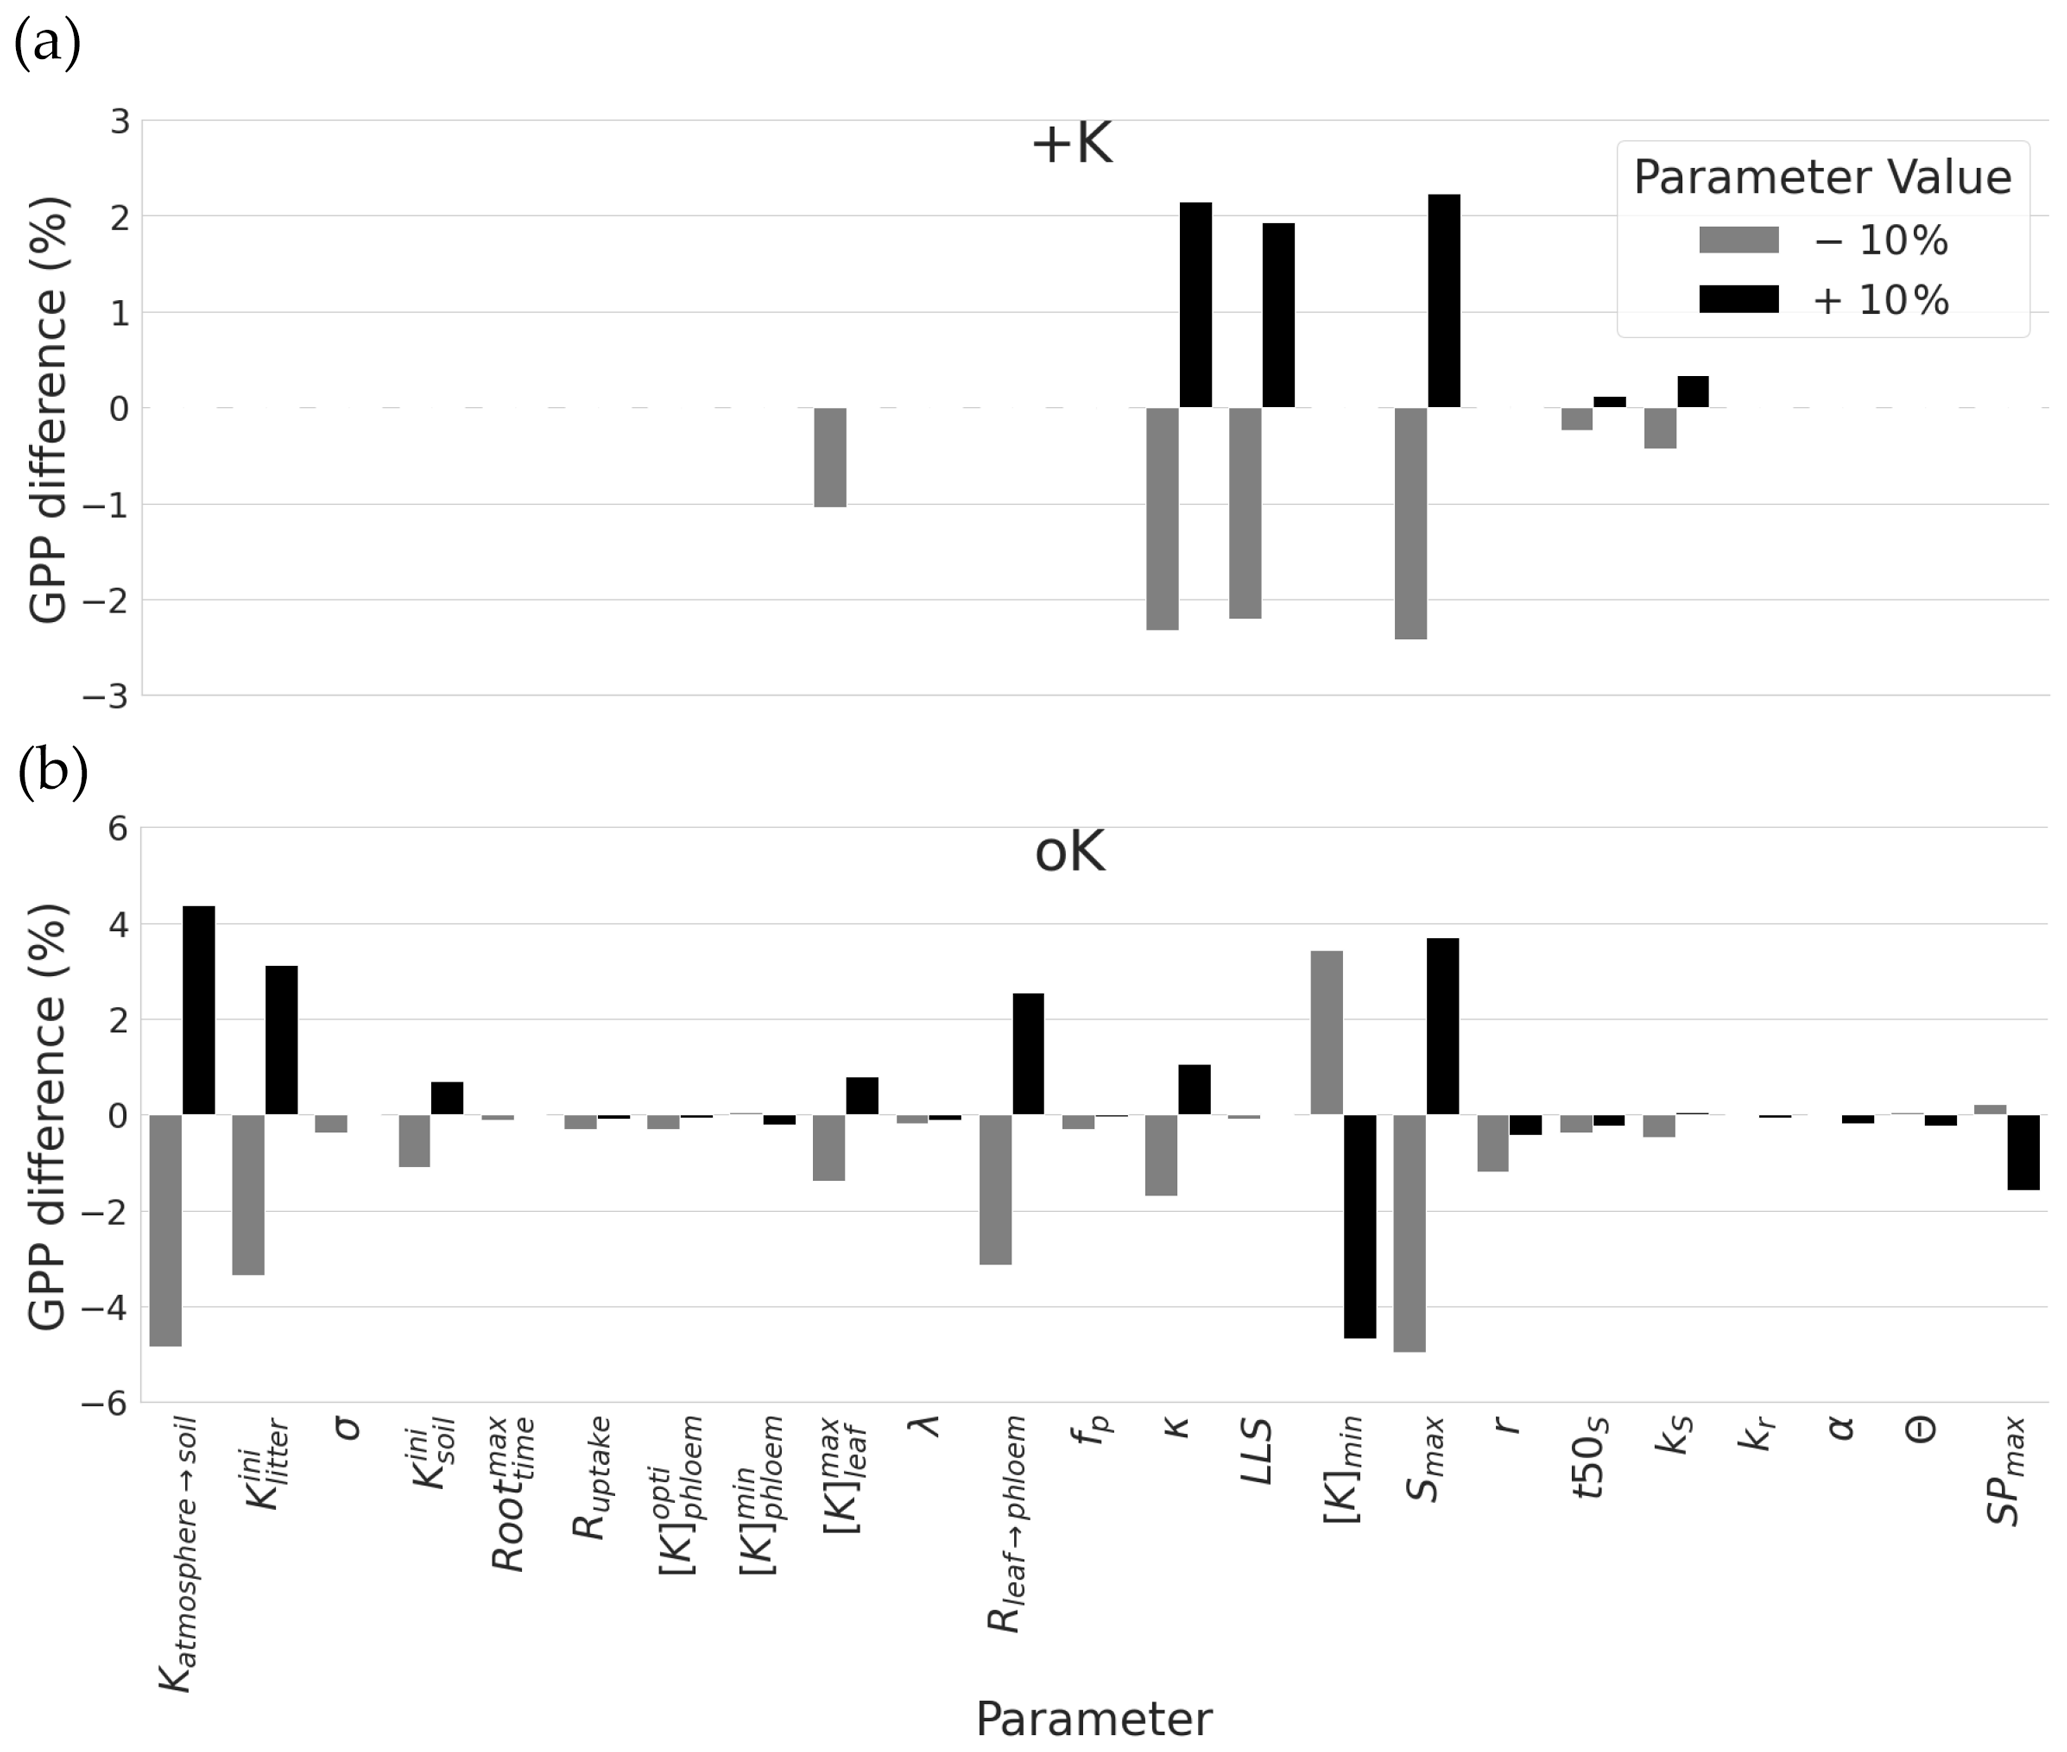
Figure 7Sensitivity of GPP cumulated over a rotation to a ± 10 % change in parameters related to soil availability, diffusion resistances, and response of leaves development to K. For each parameter, the sensitivity analysis was performed for the two contrasting K supply regimes (+K and oK). Note differences on the y axes scales for the sake of clarity.
3.4 Sensitivity analysis
Sensitivity analysis was done separately for a K fertilised and the K omission stand. The simulated GPP cumulated over the whole simulation period of 5 years was highly sensitive to few sub-model parameters, but this sensitivity was strongly dependent on the fertilisation treatment (Fig. 7a). Among the tested parameters, in the +K condition, GPP was sensitive to parameters related to the leaf phenology, especially the ones driving maximum leaf area and maximum leaf lifespan. Increase in maximum leaf area (LAmax), number of leaves produced by height increment (κ) and maximum lifespan (LLS) parameters resulted in GPP increases in the +K simulations. These parameters had an impact on the leaf area of trees thus directly affecting photosynthetic area. This shows that under non-limiting K availability (+K conditions), the simulated GPP was mainly limited by leaves developmental aspects among the parameters tested here, i.e. the ones directly involved in processes related to K cycling.
Under severe K deficiency (oK), simulated GPP was sensitive to a greater number of parameters, but a pattern was still visible. In this case, variations in the parameters controlling the values of K inputs to the ecosystem (Katmosphere→soil, , ) produced a strong response in simulated GPP, highlighting the strong limitation of GPP by K availability. The amplitude of the response was in line with their respective contribution to the total amount of K entering into the system throughout the rotation (Table 2). In the oK condition, contrary to +K, the model was not sensitive to the parameter controlling maximum leaf lifespan (LLS; Fig. 7). Indeed, the maximum leaf lifespan was almost never reached because of earlier leaf fall due to K limitation (Fig. 4c). Other parameters (t50LA, kLA) controlling maximum leaf growth also had a much lower impact for similar reasons. Sensitivity of simulated GPP to the leaf maximum individual area (LAmax) in the oK stand was high, as in the +K case. Indeed, this parameter was used both in the +K and oK case because the area increment, depending on this target value, was modulated when a leaf cohort experienced a K deficit (Eqs. 2 and 30). This led to a variation in leaf area of each cohort, which directly affected the GPP. The second most important leaf parameter in the oK stand was the resistance to K flux from the leaf to the phloem (Rleaf→phloem; Fig. 7b). This parameter was important, since it controlled the competition for the K resource between new leaves (demanding K) and old leaves (providing K through resorption). In our simulations, an increase (+10 % in Fig. 7b) in resistance to K flux between the leaves and the phloem had a positive impact on GPP, at least in the range of values considered. Indeed, increasing the resistance (Rleaf→phloem) led to a higher conservation of K in the leaves, which kept the leaf K concentration longer above the leaf shedding K threshold, which increased the leaf realised lifespan, which in turn increased canopy area. Since LAI in the oK stand was low (Fig. 6a), a small increase in LAI can have an important impact on stand GPP. [K]min is the K concentration value below which leaves start their senescence. An increase of this value caused earlier leaf fall because this value was reached sooner, and GPP therefore decreased. Finally, the parameter related to symptoms area SPmax was also sensible in the model; i.e. the GPP is reduced when the symptoms of area increase.
In this work, we developed a process-based model simulating the influence of K on the gross primary productivity and transpiration fluxes of tropical eucalypt plantations. Such models have rarely been published in the literature, and we identified it “a worthwhile endeavour” (Reed et al., 2015) owing to the importance of K limitation of productivity in forests around the world (Sardans and Peñuelas, 2015). We used tropical eucalypt plantations as our primary study system; since nutrient limitation has been extensively studied there, they are typically highly fertilised, and K-omission experiments show a very strong response of wood productivity to K deficiency (Laclau et al., 2010).
Our K model incorporates parts of the K cycle that were essential in determining K availability at the plant level. We focused on the modelling of the carbon-source activity on canopy processes and fluxes, starting with the demography of leaves and the impact of K availability on their functioning. In particular, we first considered the impacts of K on leaf development, photosynthetic capacity, and senescence. We included processes that we identified as central (Cornut et al., 2021) regarding the K limitation of GPP in these plantations. While adding processes to a mechanistic model is pertinent from a realism perspective, one must consider if the implementation of new processes increases or decreases the predictive power of the model in a given context (Famiglietti et al., 2021). Here, the model additions were clearly necessary, since the CASTANEA model, into which we developed the K modules, was initially incapable of reproducing the effect of K limitation on GPP, and no mechanistic model of the effect of K on plant productivity at the stand level existed. This development also broadly followed several of the guidelines posited by Famiglietti et al. (2021) in their paper addressing the question of models' structural complexity. These points are as follows: (1) we used datasets (here multiple experiments over multiple rotations) to constrain model parameters, (2) the new developments led to increased forecast ability (since no forecast of K deficiency was previously possible), and (3) we sought to calibrate unmeasured parameters. We adopted a reductionist approach, typical of the development of mechanistic model, by formulating and parameterising the model on dedicated experiments conducted at the organ scale. Only a few parameters were calibrated on carbon and water fluxes measured at the ecosystem scale. It is noticeable that the model was calibrated in a fully fertilised stand and then allowed to run in a virtual K omission stand with, as the only difference, a reduced amount of K fertiliser brought the first months after planting. The simulations showed a strong impact on C and water fluxes.
For K supplied trees, our model was able to simulate GPP and water fluxes close to the measured flux values at the EUCFLUX experimental site, both in terms of seasonality and magnitude (Fig. 6), with a calibration of the canopy generation model in fully fertilised conditions and the use of measured parameters (Table S3). Compared to our model, the MAESPA model uses a much finer spatial scale to model water and carbon fluxes (Christina et al., 2018, 2015) in both fertilisation regimes, but the parameterisation of the model is different in +K and oK; i.e. it does not simulate the K cycling and its impact on the parameters (which is a feature of CASTANEA-MAESPA-K). The MAESPA model has no leaf generation module, and the canopy structure is prescribed from measurements. It is possible that the CASTANEA-MAESPA-K model presented here lost some accuracy in the prediction of carbon and water fluxes compared to MAESPA alone, due to the inclusion of new processes linked both to canopy generation and to K cycle instead of a direct parameter forcing with measurements. It also did not use the 3D representation of trees of MAESPA, which had probably improved the simulation of fluxes during the first year of the rotation, before canopy closure (Christina et al., 2018). At the rotation scale however, the differences between the measured accumulated GPP and the simulated accumulated GPP flux are small (Fig. S2). While at a different scale, the new developments in the ORCHIDEE-MICT-BIOENERGY model (Li et al., 2018) resolved the issue of an overestimation bias on productivity of eucalypt plantations, the intersite variability was not well represented (see Fig. 11 in Li et al., 2018). Moreover, the ORCHIDEE-MICT-BIOENERGY presented no bias for fully fertilised sites, but there was an overestimation bias for sites with no known fertilisation regime. This strongly suggests that the model failed to account for nutrient limitation of productivity. CASTANEA-MAESPA-K is a first step in simulating the limitation of forest productivity by base cations. The importance of N (Du et al., 2020) and P (Hou et al., 2020) limitation of forest productivity has been recognised by their inclusion in terrestrial biosphere models (TBMs) (Goll et al., 2017). This has allowed for the estimation of the N and P limitation of net primary productivity at the global scale (Ellsworth et al., 2022). The importance of base cation limitation is increasingly recognised for tropical forests (Bauters et al., 2022), and the progressive inclusion of K, Mg, and Ca in TBMs could provide clues on the response of forest productivity to increasing CO2 levels.
The difference in cumulated GPP between the +K and oK stands simulated by the model was large on average but varied during the rotation. In the first year, the difference in GPP between oK and +K (Table 3) was underestimated in our model compared to Christina et al. (2015). The leaf cohort model also showed that leaves were not K-limited at the beginning of the oK stand rotation (Fig. 4c). Both leaf K content and symptomatic leaf area showed similar dynamics between the simulated oK and +K stands until around 1 year of age (Fig. 6b). These results suggest that until this time, K was not more limiting in oK than in +K. The simulated plant available K in the soil was similar in both treatments at the beginning of the rotations, which suggests that either K availability was in fact high at the beginning of the oK simulation (through litter remaining at harvest and K available in the soil from the previous rotation) and/or that our model overestimated K soil access in the first year.
The simulated water-use efficiencies (WUEs; Table 4) were in the range of the spectrum for C3 woody plants (Lambers and Oliveira, 2019) and resulted from simulated transpiration and GPP fluxes that compared well with observations (Tables 4 and 3). Our simulations showed a decrease of both GPP and transpiration in the oK stand that was consistent with evidence from the MAESPA model (Christina et al., 2015, 2018) and from experiments (Epron et al., 2012). WUEGPP was higher in the simulated +K treatment than in the oK treatment (Table 4). While not directly comparable, experimental data showed a similar pattern for wood WUE but differed on leaf intrinsic WUE, for which no effect was reported (Battie-Laclau et al., 2016). The observed difference was small, and in their study, Battie-Laclau et al. (2016) explained the difference between wood WUE and intrinsic leaf WUE by differences in the post-GPP processes of carbon allocation in +K vs. oK. This could suggest that our approach of restricting the effects of symptoms to the photosynthetic capacity was insufficient and that a direct effect on stomatal response or mesophyll conductance is necessary. Part of the effects of K on leaf functioning could also be ignored by our approach of direct proportionality between the area of symptoms and the reduction of leaf photosynthetic capacity. Studying the response of leaf functioning to a gradient of individual leaf K content (Basile et al., 2003; Shen et al., 2018) may be useful to diminish the uncertainty regarding this response (see Sect. 6.6) and increase model genericity.
The sub-model we implemented for the simulation of plant K uptake was a simple demand model, dampened by a resistance meant to represent diffusion and sorption/desorption processes that impede the uptake of K ions by the plant from the soil. It was similar to models used successfully in ForNBM (Zhu et al., 2003) and ForSVA (Arp and Oja, 1997) that are based on the law of diminishing returns (van den Driessche, 1974). Except for the soil access equation (Eq. 10), our model did not consider K-uptake kinetics to depend on root density. This was in part due to the highly dynamic growth of eucalypt trees that go from saplings to 25–30 m trees in less than 6 years (the same being true for roots down to 16 m depth; Christina et al., 2011). However, the sensitivity analysis showed that GPP was not greatly affected by the resistance to uptake in both fertilisation conditions. This is in accordance with results from the Itatinga site, where K+ ions appeared weakly sorbed to this sandy soil; hence the process of diffusion was probably not limiting (Cornut et al., 2021). Moreover, uptake of K by roots can take place directly in the litter (Laclau et al., 2004) thus bypassing the soil entirely. Taking K–soil interactions into account might however be necessary if one were studying leaching of K ions in the soil.
The absence of a sub-model for deep leaching of K in the soil, while a suitable assumption when applying CASTANEA-MAESPA-K to our two sites with very deep Ferralsols (Maquère, 2008; Caldeira Filho et al., 2023), might not hold in other ecosystems with shallower soils or less cationic exchange capacity. This process was not in the scope of this study due to the added complexity of representing K–soil exchange dynamics and the absence of sufficient measurement to successfully parameterise the sub-model. The importance of the accurate measurement of K sources in the system was underlined by the results of the sensitivity analysis. The simulated GPP of the oK stand was sensitive to variables relating to K inputs. The GPP showed a strong response to small changes in the yearly influx from atmospheric deposition. This mirrors, e.g. observations of the response of forest photosynthetic capacity to N deposition (Fleischer et al., 2013) and simulations of the response of GPP in Afrotropical forests to increases in P deposition (Goll et al., 2023). The response of GPP to initial K litter stock also underlined the importance of harvest residues in the maintenance of plot fertility.
It was apparent that the model shifted from developmental (leaf production, maximum leaf lifespan, leaf area) and pedoclimatic limitations of GPP in the +K treatment to biogeochemical limitations in oK. For example, the level of mineral weathering had an important impact on the GPP flux of the oK stand (not shown here; Cornut et al., 2022), but uncertainty regarding this flux is high (Cornut et al., 2021; de Oliveira et al., 2021; Pradier et al., 2017). We believe these results confirm the importance of studying biological weathering of minerals in situations of strong K limitation in forests.
The analysis of the model also showed the importance of internal K cycling, especially the resorption flux between the leaves and the phloem. The intense cycling of K in plants has been amply demonstrated (Marschner and Cakmak, 1989). Measurements are still lacking to evaluate whether our phloem demand simplification to explain the variation in leaf K content is true in different conditions.
This study is the first attempt to simulate the K cycle in a forest ecosystem and its link to the carbon and water balances at different time and space scales. It was developed based on data and processes observed in eucalypt fast-growing plantations under contrasting fertilisation regimes. The model was tested against stand-scale measurements and showed reliable results for both K-fertilised and K-omission simulations. First analyses show that K amounts present at the beginning of the rotation (in litter, soil, or fertilisation) and atmospheric deposition are essential to explain the overall amounts of K in foliage. Then the internal K cycling dominates the K availability to leaves, which in turn influence strongly leaf development, leaf area index, and GPP.
The coupled carbon–water–potassium forest process-based model developed in this study represents an important step in the endeavour to understand the nutrient limitation of forest productivity. This study, focusing on the canopy and C-source processes, is followed by a second part (in a companion paper) which will investigate the C-sink limitation of growth under low K availability. It also provides a framework for the development of modules that will incorporate other ionic nutrients such as Mg or Ca. The leaf cohort model developed is also a good starting point for accurately simulating nutrient fluxes in tropical forests that follow a continuous phenology. These modelling frameworks can then be adapted to other similar systems. This work was enabled by long-term omission experiments and detailed data collection at these sites (Cornut et al., 2021). This further underlines the necessity of these stand-scale manipulation experiments for nutrient modelling work.
Data are not freely available due to private funding of experimental sites but are available upon request.
The supplement related to this article is available online at: https://doi.org/10.5194/bg-20-3093-2023-supplement.
IC carried out the development of the model and wrote the original draft of the paper. GlM and ND supervised the work, participated in the conceptualisation of the model, and reviewed the original draft of the paper. JPL, YN, and JG participated in the acquisition of the data and reviewed the original draft of the paper. VFD carried out the photosynthesis experiments. All authors provided critical feedback and helped shape the research, analysis, and paper.
The contact author has declared that none of the authors has any competing interests.
Publisher’s note: Copernicus Publications remains neutral with regard to jurisdictional claims in published maps and institutional affiliations.
This article is part of the special issue “Ecosystem experiments as a window to future carbon, water, and nutrient cycling in terrestrial ecosystems”. It is not associated with a conference.
Ivan Cornut was funded by the ANR under the “Investissements d'avenir” programme and by the Centre de coopération Internationale en Recherche Agronomique pour le Développement (CIRAD). The data acquired on Eucalyptus stands at Itatinga station, Brazil, and partly re-analysed here, were funded by Universidade de São Paulo, CIRAD, Agence Nationale de la Recherche, the Agropolis Foundation, and from the support of the Brazilian state (Programa de Cooperacão internacional capes/Fundacão AGROPOLIS 017/2013). We are grateful to the staff at the Itatinga Experimental Station, in particular, Rildo Moreira e Moreira (ESALQ, USP) and Eder Araujo da Silva, for their technical support. The EUCFLUX 1 project was a cooperative programme with the participation of Arcelor Mittal, Cenibra, Bahia Specialty Cellulose, Duratex, Fibria, International Paper, Klabin, Suzano, and Vallourec Florestal, coordinated by the Forestry Science and Research Institute – IPEF (https://www.ipef.br/, last access: 16 March 2023). The data acquired on the response of photosynthesis to leaf K were funded and conducted by Suzano. We thank Daniel Goll and one anonymous reviewer for their very meticulous evaluation of the paper and relevant remarks that helped greatly in improving the article.
This research has been supported by the Agence Nationale de la Recherche (grant nos. ANR-16-CONV-0003, ANR-13-AGRO-0005, and ANR-10-LabX-0001-01).
This paper was edited by Silvia Caldararu and reviewed by Daniel Goll and one anonymous referee.
Arp, P. A. and Oja, T.: A forest soil vegetation atmosphere model (ForSVA), I: Concepts, Ecol. Model., 95, 211–224, https://doi.org/10.1016/S0304-3800(96)00036-1, 1997. a
Attia, A., Nouvellon, Y., Cuadra, S., Cabral, O., Laclau, J.-P., Guillemot, J., Campoe, O., Stape, J.-L., Galdos, M., Lamparelli, R., and le Maire, G.: Modelling carbon and water balance of Eucalyptus plantations at regional scale: Effect of climate, soil and genotypes, Forest Ecol. Manag., 449, 117460, https://doi.org/10.1016/j.foreco.2019.117460, 2019. a, b
Baldocchi, D. D.: Assessing the eddy covariance technique for evaluating carbon dioxide exchange rates of ecosystems: past, present and future, Glob. Change Biol., 9, 479–492, https://doi.org/10.1046/j.1365-2486.2003.00629.x, 2003. a
Basile, B., Reidel, E. J., Weinbaum, S. A., and DeJong, T. M.: Leaf potassium concentration, CO2 exchange and light interception in almond trees (Prunus dulcis (Mill) D.A. Webb), Sci. Hortic.-Amsterdam, 98, 185–194, https://doi.org/10.1016/S0304-4238(02)00214-5, 2003. a
Battie-Laclau, P., Laclau, J.-P., Piccolo, M. d. C., Arenque, B. C., Beri, C., Mietton, L., Muniz, M. R. A., Jordan-Meille, L., Buckeridge, M. S., Nouvellon, Y., Ranger, J., and Bouillet, J.-P.: Influence of potassium and sodium nutrition on leaf area components in Eucalyptus grandis trees, Plant Soil, 371, 19–35, https://doi.org/10.1007/s11104-013-1663-7, 2013. a, b, c, d, e, f, g, h, i, j
Battie-Laclau, P., Delgado-Rojas, J. S., Christina, M., Nouvellon, Y., Bouillet, J.-P., Piccolo, M. d. C., Moreira, M. Z., Gonçalves, J. L. d. M., Roupsard, O., and Laclau, J.-P.: Potassium fertilization increases water-use efficiency for stem biomass production without affecting intrinsic water-use efficiency in Eucalyptus grandis plantations, Forest Ecol. Manag., 364, 77–89, https://doi.org/10.1016/j.foreco.2016.01.004, 2016. a, b, c
Battie‐Laclau, P., Laclau, J.-P., Beri, C., Mietton, L., Muniz, M. R. A., Arenque, B. C., Piccolo, M. D. C., Jordan‐Meille, L., Bouillet, J.-P., and Nouvellon, Y.: Photosynthetic and anatomical responses of Eucalyptus grandis leaves to potassium and sodium supply in a field experiment, Plant Cell Environ., 37, 70–81, https://doi.org/10.1111/pce.12131, 2014a. a, b, c
Battie‐Laclau, P., Laclau, J.-P., Domec, J.-C., Christina, M., Bouillet, J.-P., Piccolo, M. d. C., Gonçalves, J. L. d. M., Moreira, R. M. E., Krusche, A. V., Bouvet, J.-M., and Nouvellon, Y.: Effects of potassium and sodium supply on drought-adaptive mechanisms in Eucalyptus grandis plantations, New Phytol., 203, 401–413, https://doi.org/10.1111/nph.12810, 2014b. a, b, c, d
Bauters, M., Janssens, I. A., Wasner, D., Doetterl, S., Vermeir, P., Griepentrog, M., Drake, T. W., Six, J., Barthel, M., Baumgartner, S., Van Oost, K., Makelele, I. A., Ewango, C., Verheyen, K., and Boeckx, P.: Increasing calcium scarcity along Afrotropical forest succession, Nat. Ecol. Evolut., 6, 1122–1131, https://doi.org/10.1038/s41559-022-01810-2, 2022. a
Bonneau, M.: Quelques résultats d'essai de fertilisation sur Épicéa dans le Massif central, Revue Forestière Française, 24, 354–363, https://doi.org/10.4267/2042/20633, 1972. a
Caldeira Filho, A., Krushe, A. V., Mareschal, L., da Silva, P., Nouvellon, Y., Campoe, O., Stape, J. L., Montebelo, A., Formaglio, G., le Maire, G., Guillemot, J., Ranger, J., and Laclau, J.-P.: Very Low Nutrient Losses by Deep Leaching after Clearcutting Commercial Eucalyptus Plantations in Brazil, Forest Ecol. Manag., 534, 120866, https://doi.org/10.2139/ssrn.4270148, 2023. a, b
Christina, M., Laclau, J.-P., Gonçalves, J. L. M., Jourdan, C., Nouvellon, Y., and Bouillet, J.-P.: Almost symmetrical vertical growth rates above and below ground in one of the world's most productive forests, Ecosphere, 2, 1–10, https://doi.org/10.1890/ES10-00158.1, 2011. a, b, c
Christina, M., Maire, G. L., Battie‐Laclau, P., Nouvellon, Y., Bouillet, J.-P., Jourdan, C., Gonçalves, J. L. d. M., and Laclau, J.-P.: Measured and modeled interactive effects of potassium deficiency and water deficit on gross primary productivity and light‐use efficiency in Eucalyptus grandis plantations, Glob. Change Biol., 21, 2022–2039, https://doi.org/10.1111/gcb.12817, 2015. a, b, c, d, e, f, g, h, i
Christina, M., Nouvellon, Y., Laclau, J.-P., Stape, J. L., Bouillet, J.-P., Lambais, G. R., and Maire, G. L.: Importance of deep water uptake in tropical eucalypt forest, Funct. Ecol., 31, 509–519, https://doi.org/10.1111/1365-2435.12727, 2017. a, b, c, d, e, f, g
Christina, M., le Maire, G., Nouvellon, Y., Vezy, R., Bordon, B., Battie-Laclau, P., Gonçalves, J. L. M., Delgado-Rojas, J. S., Bouillet, J. P., and Laclau, J. P.: Simulating the effects of different potassium and water supply regimes on soil water content and water table depth over a rotation of a tropical Eucalyptus grandis plantation, Forest Ecol. Manag., 418, 4–14, https://doi.org/10.1016/j.foreco.2017.12.048, 2018. a, b, c, d, e, f, g
Cornut, I., Le Maire, G., Laclau, J.-P., Guillemot, J., Mareschal, L., Nouvellon, Y., and Delpierre, N.: Potassium limitation of wood productivity: A review of elementary processes and ways forward to modelling illustrated by Eucalyptus plantations, Forest Ecol. Manag., 494, 119275, https://doi.org/10.1016/j.foreco.2021.119275, 2021. a, b, c, d, e, f, g, h, i, j, k, l
Cornut, I., le Maire, G., Laclau, J.-P., Guillemot, J., Nouvellon, Y., and Delpierre, N.: Potassium limitation of forest productivity – Part 2: CASTANEA-MAESPA-K shows a reduction in photosynthesis rather than a stoichiometric limitation of tissue formation, Biogeosciences, 20, 3119–3135, https://doi.org/10.5194/bg-20-3119-2023, 2023. a, b, c, d, e, f, g, h, i, j
Crockford, R. H., Richardson, D. P., and Sageman, R.: Chemistry of rainfall, throughfall and stemflow in a eucalypt forest and a pine plantation in south-eastern Australia: 2. Throughfall, Hydrol. Process., 10, 13–24, https://doi.org/10.1002/(SICI)1099-1085(199601)10:1<13::AID-HYP296>3.0.CO;2-5, 1996. a
Cunha, H. F. V., Andersen, K. M., Lugli, L. F., Santana, F. D., Aleixo, I. F., Moraes, A. M., Garcia, S., Di Ponzio, R., Mendoza, E. O., Brum, B., Rosa, J. S., Cordeiro, A. L., Portela, B. T. T., Ribeiro, G., Coelho, S. D., de Souza, S. T., Silva, L. S., Antonieto, F., Pires, M., Salomão, A. C., Miron, A. C., de Assis, R. L., Domingues, T. F., Aragão, L. E. O. C., Meir, P., Camargo, J. L., Manzi, A. O., Nagy, L., Mercado, L. M., Hartley, I. P., and Quesada, C. A.: Direct evidence for phosphorus limitation on Amazon forest productivity, Nature, 608, 558–562, https://doi.org/10.1038/s41586-022-05085-2, 2022. a
Davi, H., Dufrêne, E., Francois, C., Le Maire, G., Loustau, D., Bosc, A., Rambal, S., Granier, A., and Moors, E.: Sensitivity of water and carbon fluxes to climate changes from 1960 to 2100 in European forest ecosystems, Agr. Forest Meteorol., 141, 35–56, https://doi.org/10.1016/j.agrformet.2006.09.003, 2006. a
Delpierre, N., Soudani, K., François, C., Le Maire, G., Bernhofer, C., Kutsch, W., Misson, L., Rambal, S., Vesala, T., and Dufrêne, E.: Quantifying the influence of climate and biological drivers on the interannual variability of carbon exchanges in European forests through process-based modelling, Agr. Forest Meteorol., 154/155, 99–112, https://doi.org/10.1016/j.agrformet.2011.10.010, 2012. a
de Oliveira, F. B., Carneiro, S. H., de Souza, N. F., Horta, B. M., da Silva, I. R., Fontes, M. P. F., and Valadares, S. V.: Soil potassium dynamics in the eucalypt rhizosphere, Trees, 35, 1411–1415, https://doi.org/10.1007/s00468-021-02153-4, 2021. a, b
Du, E., Terrer, C., Pellegrini, A. F. A., Ahlström, A., van Lissa, C. J., Zhao, X., Xia, N., Wu, X., and Jackson, R. B.: Global patterns of terrestrial nitrogen and phosphorus limitation, Nat. Geosci., 13, 221–226, https://doi.org/10.1038/s41561-019-0530-4, 2020. a, b
Dufrêne, E., Davi, H., François, C., Maire, G. l., Dantec, V. L., and Granier, A.: Modelling carbon and water cycles in a beech forest: Part I: Model description and uncertainty analysis on modelled NEE, Ecol. Model., 185, 407–436, https://doi.org/10.1016/j.ecolmodel.2005.01.004, 2005. a, b
Duursma, R. A. and Medlyn, B. E.: MAESPA: a model to study interactions between water limitation, environmental drivers and vegetation function at tree and stand levels, with an example application to [CO2] × drought interactions, Geosci. Model Dev., 5, 919–940, https://doi.org/10.5194/gmd-5-919-2012, 2012. a, b
Ellsworth, D. S., Crous, K. Y., De Kauwe, M. G., Verryckt, L. T., Goll, D., Zaehle, S., Bloomfield, K. J., Ciais, P., Cernusak, L. A., Domingues, T. F., Dusenge, M. E., Garcia, S., Guerrieri, R., Ishida, F. Y., Janssens, I. A., Kenzo, T., Ichie, T., Medlyn, B. E., Meir, P., Norby, R. J., Reich, P. B., Rowland, L., Santiago, L. S., Sun, Y., Uddling, J., Walker, A. P., Weerasinghe, K. W. L. K., van de Weg, M. J., Zhang, Y.-B., Zhang, J.-L., and Wright, I. J.: Convergence in phosphorus constraints to photosynthesis in forests around the world, Nat. Commun., 13, 5005, https://doi.org/10.1038/s41467-022-32545-0, 2022. a, b
Epron, D., Laclau, J.-P., Almeida, J. C. R., Gonçalves, J. L. M., Ponton, S., Sette, C. R., Delgado-Rojas, J. S., Bouillet, J.-P., and Nouvellon, Y.: Do changes in carbon allocation account for the growth response to potassium and sodium applications in tropical Eucalyptus plantations?, Tree Physiol., 32, 667–679, https://doi.org/10.1093/treephys/tpr107, 2012. a, b, c, d, e, f, g
Epron, D., Cabral, O. M. R., Laclau, J.-P., Dannoura, M., Packer, A. P., Plain, C., Battie-Laclau, P., Moreira, M. Z., Trivelin, P. C. O., Bouillet, J.-P., Gérant, D., and Nouvellon, Y.: In situ 13CO2 pulse labelling of field-grown eucalypt trees revealed the effects of potassium nutrition and throughfall exclusion on phloem transport of photosynthetic carbon, Tree Physiol., 36, 6–21, https://doi.org/10.1093/treephys/tpv090, 2016. a
Famiglietti, C. A., Smallman, T. L., Levine, P. A., Flack-Prain, S., Quetin, G. R., Meyer, V., Parazoo, N. C., Stettz, S. G., Yang, Y., Bonal, D., Bloom, A. A., Williams, M., and Konings, A. G.: Optimal model complexity for terrestrial carbon cycle prediction, Biogeosciences, 18, 2727–2754, https://doi.org/10.5194/bg-18-2727-2021, 2021. a, b
Farquhar, G. D., Caemmerer, S. V., and Berry, J. A.: A biochemical model of photosynthetic CO2 assimilation in leaves of C3 species, Planta, 149, 78–90, https://doi.org/10.1007/BF00386231, 1980. a
Fleischer, K., Rebel, K. T., van der Molen, M. K., Erisman, J. W., Wassen, M. J., van Loon, E. E., Montagnani, L., Gough, C. M., Herbst, M., Janssens, I. A., Gianelle, D., and Dolman, A. J.: The contribution of nitrogen deposition to the photosynthetic capacity of forests, Global Biogeochem. Cy., 27, 187–199, https://doi.org/10.1002/gbc.20026, 2013. a
Goll, D. S., Brovkin, V., Parida, B. R., Reick, C. H., Kattge, J., Reich, P. B., van Bodegom, P. M., and Niinemets, U.: Nutrient limitation reduces land carbon uptake in simulations with a model of combined carbon, nitrogen and phosphorus cycling, Biogeosciences, 9, 3547–3569, https://doi.org/10.5194/bg-9-3547-2012, 2012. a
Goll, D. S., Vuichard, N., Maignan, F., Jornet-Puig, A., Sardans, J., Violette, A., Peng, S., Sun, Y., Kvakic, M., Guimberteau, M., Guenet, B., Zaehle, S., Penuelas, J., Janssens, I., and Ciais, P.: A representation of the phosphorus cycle for ORCHIDEE (revision 4520), Geosci. Model Dev., 10, 3745–3770, https://doi.org/10.5194/gmd-10-3745-2017, 2017. a, b
Goll, D. S., Bauters, M., Zhang, H., Ciais, P., Balkanski, Y., Wang, R., and Verbeeck, H.: Atmospheric phosphorus deposition amplifies carbon sinks in simulations of a tropical forest in Central Africa, New Phytol., 237, 2054–2068, https://doi.org/10.1111/nph.18535, 2023. a
Gonçalves, J. L. d. M.: Nutrição e fertilização florestal, IPEF, ISBN: 9788590135814, 2000. a, b
Greenwood, D. J. and Karpinets, T. V.: Dynamic model for the effects of K-fertilizer on crop growth, K-uptake and soil-K in arable cropping. 1. Description of the model, Soil Use Manag., 13, 178–183, https://doi.org/10.1111/j.1475-2743.1997.tb00582.x, 1997. a
Guillemot, J., Francois, C., Hmimina, G., Dufrêne, E., Martin‐StPaul, N. K., Soudani, K., Marie, G., Ourcival, J.-M., and Delpierre, N.: Environmental control of carbon allocation matters for modelling forest growth, New Phytol., 214, 180–193, https://doi.org/10.1111/nph.14320, 2017. a
Guillemot, J., Asensio, V., Bordron, B., Nouvellon, Y., Maire, G. l., Bouillet, J.-P., Domec, J.-C., Rojas, J. S. D., Abreu-Junior, C. H., Battie-Laclau, P., Cornut, I., Germon, A., Gonçalves, J. L. D. M., Robin, A., and Laclau, J.-P.: Increased hydraulic constraints in Eucalyptus plantations fertilized with potassium, Plant Cell Environ., 44, 2938–2950, https://doi.org/10.1111/pce.14102, 2021. a
Guitton, J., Bonneau, M., and Adrian, M.: Résultats de fertilisation minérale en région méditerranéenne, Revue Forestière Française, 60, 315–320, https://doi.org/10.4267/2042/25896, 1988. a
Hou, E., Luo, Y., Kuang, Y., Chen, C., Lu, X., Jiang, L., Luo, X., and Wen, D.: Global meta-analysis shows pervasive phosphorus limitation of aboveground plant production in natural terrestrial ecosystems, Nat. Commun., 11, 637, https://doi.org/10.1038/s41467-020-14492-w, 2020. a, b
Hyvönen, R., Persson, T., Andersson, S., Olsson, B., Ågren, G. I., and Linder, S.: Impact of long-term nitrogen addition on carbon stocks in trees and soils in northern Europe, Biogeochemistry, 89, 121–137, https://doi.org/10.1007/s10533-007-9121-3, 2008. a
Hölttä, T., Vesala, T., Sevanto, S., Perämäki, M., and Nikinmaa, E.: Modeling xylem and phloem water flows in trees according to cohesion theory and Münch hypothesis, Trees, 20, 67–78, https://doi.org/10.1007/s00468-005-0014-6, 2006. a
Hölttä, T., Kurppa, M., and Nikinmaa, E.: Scaling of xylem and phloem transport capacity and resource usage with tree size, Front. Plant Sci., 4, 496, https://doi.org/10.3389/fpls.2013.00496, 2013. a
Johnson, D. W., Sogn, T., and Kvindesland, S.: The nutrient cycling model: lessons learned, Forest Ecol. Manag., 138, 91–106, https://doi.org/10.1016/S0378-1127(00)00414-X, 2000. a
Körner, C.: Paradigm shift in plant growth control, Current Opinion in Plant Biology, 25, 107–114, https://doi.org/10.1016/j.pbi.2015.05.003, 2015. a, b
Laclau, J. P., Toutain, F., M'Bou, A. T., Arnaud, M., Joffre, R., and Ranger, J.: The Function of the Superficial Root Mat in the Biogeochemical Cycles of Nutrients in Congolese Eucalyptus Plantations, Ann. Bot., 93, 249–261, https://doi.org/10.1093/aob/mch035, 2004. a
Laclau, J.-P., Almeida, J. C. R., Gonçalves, J. L. M., Saint-André, L., Ventura, M., Ranger, J., Moreira, R. M., and Nouvellon, Y.: Influence of nitrogen and potassium fertilization on leaf lifespan and allocation of above-ground growth in Eucalyptus plantations, Tree Physiol., 29, 111–124, https://doi.org/10.1093/treephys/tpn010, 2009. a, b, c, d, e, f, g, h
Laclau, J.-P., Ranger, J., de Moraes Gonçalves, J. L., Maquère, V., Krusche, A. V., M’Bou, A. T., Nouvellon, Y., Saint-André, L., Bouillet, J.-P., de Cassia Piccolo, M., and Deleporte, P.: Biogeochemical cycles of nutrients in tropical Eucalyptus plantations, Forest Ecol. Manag., 259, 1771–1785, https://doi.org/10.1016/j.foreco.2009.06.010, 2010. a, b, c, d, e
Lambers, H. and Oliveira, R. S.: Plant Water Relations, in: Plant Physiological Ecology, edited by Lambers, H. and Oliveira, R. S., Springer International Publishing, Cham, 187–263, https://doi.org/10.1007/978-3-030-29639-1_5, 2019. a
Landi, M., Tattini, M., and Gould, K. S.: Multiple functional roles of anthocyanins in plant-environment interactions, Environ. Exp. Bot., 119, 4–17, https://doi.org/10.1016/j.envexpbot.2015.05.012, 2015. a
le Maire, G.: Code for computing Leaf Size, Shape and Symptoms traits from scans, DATAVERSE CIRAD, https://doi.org/10.18167/DVN1/PYAXSS, 2023. a
Le Maire, G., Davi, H., Soudani, K., François, C., Le Dantec, V., and Dufrêne, E.: Modeling annual production and carbon fluxes of a large managed temperate forest using forest inventories, satellite data and field measurements, Tree Physiol., 25, 859–872, https://doi.org/10.1093/treephys/25.7.859, 2005. a
Le Maire, G., Guillemot, J., Campoe, O., Stape, J. L., Laclau, J.-P., and Nouvellon, Y.: Light use efficiency and productivity of 16 genotypes of Eucalyptus along a 6-year rotation in Brazil, XXV IUFRO World Congress Forest Research and Cooperation for Sustainable Development, 2019. a
Li, W., Yue, C., Ciais, P., Chang, J., Goll, D., Zhu, D., Peng, S., and Jornet-Puig, A.: ORCHIDEE-MICT-BIOENERGY: an attempt to represent the production of lignocellulosic crops for bioenergy in a global vegetation model, Geosci. Model Dev., 11, 2249–2272, https://doi.org/10.5194/gmd-11-2249-2018, 2018. a
Liu, S., Munson, R., Johnson, D. W., Gherini, S., Summers, K., hudson, R., Wilkinson, K., and Pitelka, L. F.: The nutrient cycling cycling model (NuCM): overview and application, Ecol. Stud., 91, 583–609, 1992. a
Lockhart, J. A.: An analysis of irreversible plant cell elongation, J. Theor. Biol., 8, 264–275, https://doi.org/10.1016/0022-5193(65)90077-9, 1965. a
Manu, R., Corre, M. D., Aleeje, A., Mwanjalolo, M. J. G., Babweteera, F., Veldkamp, E., and van Straaten, O.: Responses of tree growth and biomass production to nutrient addition in a semi-deciduous tropical forest in Africa, Ecology, 103, e3659, https://doi.org/10.1002/ecy.3659, 2022. a
Maquère, V.: Dynamics of mineral elements under a fast-growing eycalyptus plantation in Brazil, Implications for soil sustaina bility, These de doctorat, AgroParisTech, 2008. a, b, c, d, e, f, g, h, i
Marschner, H.: Marschner's Mineral Nutrition of Higher Plants, Academic Press, https://doi.org/10.1016/C2009-0-63043-9, 2011. a, b, c
Marschner, H. and Cakmak, I.: High Light Intensity Enhances Chlorosis and Necrosis in Leaves of Zinc, Potassium, and Magnesium Deficient Bean (Phaseolus vulgaris) Plants, J. Plant Physiol., 134, 308–315, https://doi.org/10.1016/S0176-1617(89)80248-2, 1989. a
Marschner, H., Kirkby, E. A., and Cakmak, I.: Effect of mineral nutritional status on shoot – root partitioning of photoassimilates and cycling of mineral nutrients, J. Exp. Bot., 47, 1255–1263, 1996. a, b
Mattila, H., Valev, D., Havurinne, V., Khorobrykh, S., Virtanen, O., Antinluoma, M., Mishra, K. B., and Tyystjärvi, E.: Degradation of chlorophyll and synthesis of flavonols during autumn senescence – the story told by individual leaves, AoB PLANTS, 10, ply028, https://doi.org/10.1093/aobpla/ply028, 2018. a
Nardelli, A. and Fedorinova, Y.: Belgium Is Pushing to Dilute the EU’s Belarus Potash Sanctions, Bloomberg.com, https://www.bloomberg.com/news/articles/2021-10-19/belgium-is-pushing-to-dilute-the-eu-s-belarus-potash-sanctions (last access: 21 June 2023), 2021. a
Nardini, A., Grego, F., Trifilò, P., and Salleo, S.: Changes of xylem sap ionic content and stem hydraulics in response to irradiance in Laurus nobilis, Tree Physiol., 30, 628–635, https://doi.org/10.1093/treephys/tpq017, 2010. a
Nobel, P. S.: Physicochemical and Environmental Plant Physiology, Academic Press Elsevier, https://doi.org/10.1016/B978-0-12-374143-1.X0001-4, 2005. a
Nouvellon, Y., Stape, J. L., Laclau, J.-P., Bonnefond, J.-M., da Rocha, H., Campoe, O. C., Marsden, C., Bouillet, J.-P., Loos, R. A., Kinana, A., Le Maire, G., Saint-André, L., and Roupsard, O.: Water and energy fluxes above an Eucalyptus plantation in Brazil: environmental control and comparison with two eucalypt plantations in Congo, IUFRO Workshop, “Canopy processes in a changing climate”, Hobart, AUS, https://hal.inrae.fr/hal-02821072/document (last access: 21 June 2023), 2010. a
Nouvellon, Y., Stape, J. L., Le Maire, G., Bonnefond, J.-M., Guillemot, J., Christina, M., Bouillet, J.-P., Campoe, O., and Laclau, J.-P.: Full-rotation carbon, water and energy fluxes in a tropical eucalypt plantation, XXV IUFRO World Congress Forest Research and Cooperation for Sustainable Development, https://agritrop.cirad.fr/594409/ (last access: 21 June 2023), 2019. a, b
Pantin, F., Simonneau, T., and Muller, B.: Coming of leaf age: control of growth by hydraulics and metabolics during leaf ontogeny, New Phytol., 196, 349–366, https://doi.org/10.1111/j.1469-8137.2012.04273.x, 2012. a
Pedregosa, F., Varoquaux, G., Gramfort, A., Michel, V., Thirion, B., Grisel, O., Blondel, M., Prettenhofer, P., Weiss, R., Dubourg, V., Vanderplas, J., Passos, A., Cournapeau, D., Brucher, M., Perrot, M., and Duchesnay, E.: Scikit-learn: Machine Learning in Python, J. Mach. Learn. Res., 12, 2825–2830, 2011. a
Pradier, C., Hinsinger, P., Laclau, J.-P., Bouillet, J.-P., Guerrini, I. A., Gonçalves, J. L. M., Asensio, V., Abreu-Junior, C. H., and Jourdan, C.: Rainfall reduction impacts rhizosphere biogeochemistry in eucalypts grown in a deep Ferralsol in Brazil, Plant Soil, 414, 339–354, https://doi.org/10.1007/s11104-016-3107-7, 2017. a, b, c
Prakash, S. and Verma, J. P.: Global Perspective of Potash for Fertilizer Production, in: Potassium Solubilizing Microorganisms for Sustainable Agriculture, edited by: Meena, V. S., Maurya, B. R., Verma, J. P., and Meena, R. S., Springer India, New Delhi, 327–331, https://doi.org/10.1007/978-81-322-2776-2_23, 2016. a
Reed, S. C., Yang, X., and Thornton., P. E.: Incorporating phosphorus cycling into global modeling efforts: a worthwhile, tractable endeavor, New Phytol., 208, 324–329, https://doi.org/10.1111/nph.13521, 2015. a
Rocha, J. H. T., du Toit, B., and Gonçalves, J. L. d. M.: Ca and Mg nutrition and its application in Eucalyptus and Pinus plantations, Forest Ecol. Manag., 442, 63–78, https://doi.org/10.1016/j.foreco.2019.03.062, 2019. a
Sainte-Marie, J., Saint-André, L., Nouvellon, Y., Laclau, J. P., Roupsard, O., le Maire, G., Delpierre, N., Henrot, A., and Barrandon, M.: A new probabilistic canopy dynamics model (SLCD) that is suitable for evergreen and deciduous forest ecosystems, Ecol. Model., 290, 121–133, https://doi.org/10.1016/j.ecolmodel.2014.01.026, 2014. a, b
Sardans, J. and Peñuelas, J.: Potassium: a neglected nutrient in global change: Potassium stoichiometry and global change, Global Ecol. Biogeogr., 24, 261–275, https://doi.org/10.1111/geb.12259, 2015. a, b, c
Seward, P., Barraclough, P. B., and Gregory, P. J.: Modelling potassium uptake by wheat (Triticum aestivum) crops, Plant Soil, 124, 303–307, https://doi.org/10.1007/BF00009277, 1990. a, b
Shen, C., Huang, R., Tang, Y., and Wang, Z.: Potassium nutrition recover impacts on stomatal, mesophyll and biochemical limitations to photosynthesis in Carya cathayensis and Hickory illinoensis, bioRxiv, 425629, https://doi.org/10.1101/425629, 2018. a
Silberbush, M. and Barber, S. A.: Phosphorus and Potassium Uptake of Field-Grown Soybean Cultivars Predicted by a Simulation Model, Soil Sci. Soc. Am. J., 48, 592–596, https://doi.org/10.2136/sssaj1984.03615995004800030025x, 1984. a
Silveira, R., Higashi, E. N., Gonçalves, A. N., and Moreira, A.: Avaliação do estado nutricional do Eucalyptus: diagnose visual, foliar e suas interpretações, Nutrição e fertilização florestal, Piracicaba, IPEF, 79–104, ISBN: 9788590135814, 2000. a
Thum, T., Caldararu, S., Engel, J., Kern, M., Pallandt, M., Schnur, R., Yu, L., and Zaehle, S.: A new model of the coupled carbon, nitrogen, and phosphorus cycles in the terrestrial biosphere (QUINCY v1.0; revision 1996), Geosci. Model Dev., 12, 4781–4802, https://doi.org/10.5194/gmd-12-4781-2019, 2019. a
Townsend, A. R., Cleveland, C. C., Houlton, B. Z., Alden, C. B., and White, J. W.: Multi-element regulation of the tropical forest carbon cycle, Front. Ecol. Environ., 9, 9–17, https://doi.org/10.1890/100047, 2011. a
Tripler, C. E., Kaushal, S. S., Likens, G. E., and Walter, M. T.: Patterns in potassium dynamics in forest ecosystems, Ecol. Lett., 9, 451–466, https://doi.org/10.1111/j.1461-0248.2006.00891.x, 2006. a, b
van den Driessche, R.: Prediction of mineral nutrient status of trees by foliar analysis, Bot. Rev., 40, 347–394, https://doi.org/10.1007/BF02860066, 1974. a
Vezy, R., Christina, M., Roupsard, O., Nouvellon, Y., Duursma, R., Medlyn, B., Soma, M., Charbonnier, F., Blitz-Frayret, C., Stape, J.-L., Laclau, J.-P., de Melo Virginio Filho, E., Bonnefond, J.-M., Rapidel, B., Do, F. C., Rocheteau, A., Picart, D., Borgonovo, C., Loustau, D., and le Maire, G.: Measuring and modelling energy partitioning in canopies of varying complexity using MAESPA model, Agr. Forest Meteorol., 253/254, 203–217, https://doi.org/10.1016/j.agrformet.2018.02.005, 2018. a
von Liebig, J.: Die organische Chemie in ihrer Anwendung auf Agricultur und Physiologie, Vieweg, https://doi.org/10.5962/bhl.title.42117, 1840. a
Wang, Y. P. and Jarvis, P. G.: Description and validation of an array model – MAESTRO, Agr. Forest Meteorol., 51, 257–280, https://doi.org/10.1016/0168-1923(90)90112-J, 1990. a
Williams, M., Rastetter, E. B., Fernandes, D. N., Goulden, M. L., Wofsy, S. C., Shaver, G. R., Melillo, J. M., Munger, J. W., Fan, S.-M., and Nadelhoffer, K. J.: Modelling the soil-plant-atmosphere continuum in a Quercus – Acer stand at Harvard Forest: the regulation of stomatal conductance by light, nitrogen and soil/plant hydraulic properties, Plant Cell Environ., 19, 911–927, https://doi.org/10.1111/j.1365-3040.1996.tb00456.x, 1996. a
Yang, X., Thornton, P. E., Ricciuto, D. M., and Post, W. M.: The role of phosphorus dynamics in tropical forests – a modeling study using CLM-CNP, Biogeosciences, 11, 1667–1681, https://doi.org/10.5194/bg-11-1667-2014, 2014. a
Zanne, A. E., Westoby, M., Falster, D. S., Ackerly, D. D., Loarie, S. R., Arnold, S. E. J., and Coomes, D. A.: Angiosperm wood structure: Global patterns in vessel anatomy and their relation to wood density and potential conductivity, Am. J. Bot., 97, 207–215, https://doi.org/10.3732/ajb.0900178, 2010. a
Zhu, Z., Arp, P. A., Meng, F., Bourque, C. P. A., and Foster, N. W.: A Forest Nutrient Cycling and Biomass Model (ForNBM) based on year-round, monthly weather conditions: Part II: Calibration, verification, and application, Ecol. Model., 170, 13–27, https://doi.org/10.1016/S0304-3800(03)00284-9, 2003. a
Zhu, Z., Foster, N. W., Arp, P. A., Meng, F., and Bourque, C. P. A.: A test and application of the model ForNBM in a northeastern Ontario jack pine (Pinus banksiana lamb.) stand, Forest Ecol. Manag., 193, 385–397, https://doi.org/10.1016/j.foreco.2004.02.003, 2004. a