the Creative Commons Attribution 4.0 License.
the Creative Commons Attribution 4.0 License.
 | 19 Jun 2023
Hyperspectral imaging sediment core scanning tracks high-resolution Holocene variations in (an)oxygenic phototrophic communities at Lake Cadagno, Swiss Alps
Stefanie B. Wirth
Adrian Gilli
Sandro Peduzzi
Martin Grosjean
Pigments produced by anoxygenic phototrophic bacteria are valuable proxies of past anoxia in lacustrine and marine environments. Pigment measurement typically requires time-consuming and costly chemical extractions and chromatographic analyses, which limits the temporal resolution of paleoenvironmental reconstructions based on sedimentary pigments. Here, we evaluate the potential of in situ hyperspectral imaging (HSI) core scanning as a rapid, non-destructive method to document high-resolution changes in oxygenic and anoxygenic phototrophic communities at meromictic Lake Cadagno, Switzerland. Three distinct groups of pigments can be detected with the HSI method in the sediments of Lake Cadagno; each pigment group represents a different phototrophic community. Oxygenic phototrophs are indicated by total chloropigments (TChl; chlorophyll a, b, and derivatives). Two types of anoxygenic phototrophs were distinguished – purple sulfur bacteria (PSB), represented by bacteriochlorophyll a, and green sulfur bacteria (GSB), represented by bacteriochlorophyll c, d, and e. HSI pigment indices were validated by pigment measurements performed on extracted samples using spectrophotometer and high-performance liquid chromatography (HPLC). Bacteriochlorophylls were present throughout the past 10 kyr, confirming geochemical evidence of nearly continuous stratification and sulfidic conditions at Lake Cadagno. Major shifts in the anoxygenic phototropic communities are recorded at decadal to millennial scales. GSB and PSB communities coexisted from 10.2–8.8 kyr BP. Dominance of PSB over GSB from 8.8–3.4 kyr BP indicates strongly stratified conditions in the lake and strong light radiation at the chemocline. From 3.4–1.3 kyr BP, PSB were mostly absent, and GSB became dominant, implying lower light intensity at the chemocline due to a combination of factors including deforestation in the lake surroundings, increased flood frequency, cooler climatic conditions, and changes in groundwater solute concentrations. The high-resolution HSI data show that frequent flood events and mass movements disturbed the chemocline and the anoxygenic bacterial communities and that the PSB were particularly sensitive and slow to recover following these disturbance events. This study demonstrates for the first time that HSI can detect GSB-related pigments, making the method uniquely valuable as a rapid tool to study samples containing pigments of both oxygenic and anoxygenic phototrophs.
- Article
(5896 KB) -
Supplement
(745 KB) - BibTeX
- EndNote


Photosynthetic pigments preserved in sediments are a valuable source of information about past environmental conditions and can be used to track past variations in multiple environmental parameters including trophic levels, primary productivity, light availability, organic matter preservation, and redox conditions (Leavitt and Hodgson, 2002). Pigments derived from anoxygenic phototrophic bacteria are particularly valuable as indicators of anoxic and sulfidic conditions within the photic zone of aquatic environments (Sinninghe Damsté and Schouten, 2006). Phototrophic sulfur bacteria live at, or below, the chemocline in stratified water bodies and typically use reduced sulfur as an electron donor during photosynthesis (Van Gemerden and Mas, 1995). There are two main groups of anoxygenic phototrophic bacteria: green sulfur bacteria (GSB; Chlorobiaceae) and purple sulfur bacteria (PSB; Chromatiaceae and Ectothiorhodospiraceae) (Sinninghe Damsté and Schouten, 2006). These bacteria utilize bacteriochlorophyll (BChl) pigments to photosynthesize, and they also produce distinct accessory carotenoid pigments. PSB produce BChl a and b and the diagnostic carotenoid okenone. In contrast, GSB produce BChl c, d, or e and the carotenoids isorenieratene and chlorobactene. The light absorption of these pigments is strongly influenced by the ecological niche of these bacteria, that is deeper water with lower light intensity compared to oxygenic phototrophs in the near surface (mixolimnion). Therefore, the phototrophic sulfur bacteria utilize pigments that absorb light in the maxima of the light spectrum in deeper water and do not absorb light in the same range as algae and cyanobacteria living in the overlying oxygenated mixolimnion. Purple sulfur bacteria require higher levels of light and are tolerant of small amounts of oxygen. Consequently, PSB usually live above the GSB in the water column (Van Gemerden and Mas, 1995). The GSB, in contrast, are strict anaerobes and can grow in extremely light-limited environments (Repeta et al., 1989; Crowe et al., 2014). Pigments from these bacteria are particularly useful as paleo-redox proxies because these biomarkers provide an unambiguous signal of anoxic conditions within the water column, whereas many other geochemical indicators of anoxia can also be diagenetically produced by anoxic conditions within shallow sediments. Furthermore, the different light requirements of the two groups make it possible to reconstruct changes in light availability at the chemocline or chemocline depth (Fox et al., 2022).
Hyperspectral imaging (HSI) core scanning has recently emerged as a rapid, non-destructive method to determine the relative abundance of bulk pigment groups in sediments based on their distinct spectral signatures in the visible and near-infrared range of light (Butz et al., 2015). Compared to conventional techniques that rely on wet-chemical extractions and detailed chemical measurements, the HSI method is much more efficient in terms of time and cost, and it has the advantage of producing ultra-high-resolution data at sub-millimeter resolution, something that is not possible with wet-chemical methods. Studies have demonstrated that chlorophyll a (and its diagenetic products, hereafter referred to as TChl), as well as bacteriopheophytin a (a diagenetic product of BChl a), can be measured with the HSI technique and validated by conventional high-performance liquid chromatography (HPLC) measurements (Butz et al., 2015, 2017; Zander et al., 2022). However, to date, it has not been shown if GSB-related pigments (i.e., BChl c, d, and e) can also be detected using this technique. This would be a particularly useful methodological advance because BChl c, d, and e cannot be distinguished from TChl using spectrophotometric techniques on pigments extracted in solvents (Picazo et al., 2011), meaning there is currently no rapid method for assessing the abundance of TChl or BChl c, d, and e in samples that contain a mixture of both pigment groups.
In this study, we investigate the sediments of Lake Cadagno, a meromictic lake in the Swiss Alps with a well-studied sedimentary record (Wirth et al., 2013; Berg et al., 2022) and known for its dense populations of diverse phototrophic sulfur bacteria (Tonolla et al., 2017, 2005; Peduzzi et al., 2012, 2011). Therefore, it is an ideal site to test the feasibility of using HSI to measure GSB-related bacteriochlorophylls in sediments that contain a mixture of pigments from both oxic and anoxic phototrophs. Furthermore, we generate high-resolution records of pigment groups spanning the 12.5 kyr long sediment record in order to assess the factors that affected the relative abundances of different phototrophic communities on both short-term (event to decadal) and long-term (millennial) timescales.
2.1 Setting and modern physicochemical and ecological properties
Lake Cadagno is a small (0.26 km2) crenogenic meromictic lake located in the Piora Valley in the central Alps of Switzerland (46∘33′01′′ N, 8∘42′41′′ E) at an altitude of 1921 m a.s.l. (Fig. 1a). The 21 m deep lake basin was liberated by the glacier ∼ 13 kyr ago (Wirth et al., 2013). The catchment geology primarily consists of high- to ultra-high-grade metamorphic rocks such as paragneiss and orthogneiss, as well as amphibolites or hornblende schists (Bianconi et al., 2015). Particularly important for the lake's extraordinary characteristics are, however, Triassic gypsum-bearing dolomite and graywacke, the so-called Piora Zone, that outcrops at the southern border of the lake. Subaquatic springs within the Triassic rocks that dip below the lake maintain a flow of solute-rich groundwaters to the lake. As a result, a strong density gradient exists in the water column leading to permanent stratification with an oxic mixolimnion, an anoxic monimolimnion, and a chemocline at a depth of 10 to 14 m separating the two water masses (Del Don et al., 2001). Figure 1b shows water-column profiles of dissolved O2 and H2S, as well as the electrical conductivity and water temperature, demonstrating the contrasting chemical and physical properties of Lake Cadagno above and below the chemocline (Dahl et al., 2010). The oxic zone is fed primarily by surface waters flowing on the crystalline metamorphic bedrock, is poor in solute load, and is oligo- to mesotrophic. Primary production in the oxic epilimnion is dominated by diatoms, chlorophytes, and cyanobacteria (Bossard et al., 2001; Tonolla et al., 2017; Camacho et al., 2001). Sediment-trap data showed that only about one-third of this algal biomass passes through the chemocline to a depth of 13.5 m (Schanz and Stalder, 1998). The chemocline hosts dense populations of phototrophic sulfur bacteria of the families Chromatiaceae (purple sulfur bacteria; PSB) and Chlorobiaceae (green sulfur bacteria; GSB) (Danza et al., 2018). Despite representing approximately 20 % of the total lake volume, the chemocline is responsible for nearly half of the total carbon photo assimilation within the lake, indicating that the phototrophic sulfur bacteria play a significant role in the ecosystem functioning (Camacho et al., 2001). During the past 3 decades, investigations of the phototrophic bacteria populations in the chemocline and monimolimnion detected only brown-colored GSB (no green-colored strains) using both 16S rRNA gene clone library analysis and direct observations of lake samples (Tonolla et al., 2005; Halm et al., 2009; Gregersen et al., 2009; Ravasi et al., 2012). Since the GSB observed in the recent decades are from brown-colored strains, notably Chlorobium spp., they all contain isorenieratene and are considered typical for low light availability (Danza et al., 2018; Posth et al., 2017). In accordance with their low light tolerance, the GSB can also be found throughout the monimolimnion, though their energy pathways may shift to include fermentation of polyglucose as an energy source when they sink below 14 m depth (Danza et al., 2018; Habicht et al., 2011).

Figure 1(a) Study site location within Europe and Switzerland and a bathymetric map of Lake Cadagno, with simplified bedrock geology and hydrogeological features depicted. (b) Water-column physicochemical profiles highlighting the oxic mixolimnion, the chemocline, and the sulfidic monimolimnion (Dahl et al., 2010, measured in September 2006). Country borders from Natural Earth map data.
2.2 Sediment record and sediment properties
This section provides a short summary of sedimentological and stratigraphic work described in full and in detail in Wirth et al. (2013). The complete sedimentary record was retrieved for the first time in 2009 using a UWITEC piston coring system. To guarantee a complete sediment sequence without gaps in between sections, twin cores were taken with a vertical offset of 1.5 m. In addition, several gravity short cores were taken to recover an undisturbed sediment surface. Nevertheless, sediments are disturbed in the top 5 cm of the short core that was used for this study, corresponding approximately to the interval from the time of coring (2009) to 1963 AD, based on 137Cs dating published in Wirth et al. (2013). The modern conditions in the lake are, therefore, not represented in the sedimentary data. The core chronology is based on nine radiocarbon ages as well as on 137Cs dating for the most recent 60 years. The age–depth model was established using the regular sediments only (i.e., event deposits were removed) as event layers are deposited within hours to days (Sabatier et al., 2022). For age–depth modeling, a smoothed cubic spline interpolation between dating points using the Clam software was applied (Blaauw, 2010). We use the age–depth model published in Wirth et al. (2013) without modification.
XRF (X-ray fluorescence) core scanning was carried out using an Avaatech Core Scanner with a rhodium tube as the X-ray source. The vertical step resolution and slit opening was 1 mm, and the horizontal slit opening was 12 mm. Exposure time was 20 s, applied current 2000 µA, and applied voltage 30 kV. Semi-quantitative counts from XRF core scanning were calibrated to Mo concentrations measured via inductively coupled plasma mass spectrometry (ICP-MS) on 19 discrete samples.
The composite sediment record has a length of 10.5 m and spans about the past 12.5 kyr (Wirth et al., 2013). The lowermost meter of recovered sediments is of gray color and purely clastic, representing the end of the deglaciation sequence. Between 9.5 and 9 m core depth, the sedimentary facies is characterized by a decreasing amount of clastic material, and the organic content begins to increase. This section represents the redox transition interval from oxic to sulfidic conditions, which occurred around 9.8 kyr BP (Wirth et al., 2013). From 9 m core depth to the top of the sequence, the sediments are characterized by the alternation of three different lithologies: regular lacustrine sediments, flood deposits, and mass-movement deposits. Overall, only 2.3 m of the recovered sediment record consists of regular authigenic lacustrine sediments. This lithology is characterized by a high organic carbon content of 8 wt % to 19 wt % and a dark brown to blackish color with little structure. Only at a few stratigraphic levels in the younger half of the sequence are laminations visible in intervals of a few centimeters. The majority of the sediment record consists of event deposits. These deposits are produced by floods as a result of heavy precipitation in the lake's catchment or by subaquatic mass movements generated by the failure of the lake slopes due to earthquake-induced shaking or overloading (e.g., Schnellmann et al., 2002; Sabatier et al., 2022). Flood deposits represent sediments that are flushed into the lake. They are composed of allogenic mineral grains (primarily from gneiss) and are characterized by an only faintly expressed upwards grain-size grading. These deposits vary in thickness from about 1 mm to 13 cm. Mass-movement deposits (MMDs) represent sediments that were remobilized and redeposited within the lake and thus consist of a mix of regular sediments and flood deposits. These deposits are up to 70 cm thick. The average sedimentation rate in the regular sediments is 0.19 mm yr−1. However, rates are substantially lower in the older part (e.g., 0.07 mm yr−1 between 9 and 8 kyr BP) and become higher towards the top (e.g., 0.38 mm yr−1 between 2 and 1 kyr BP).
Based on the previous studies that investigated Lake Cadagno's sediment record, it is known that the lake has been meromictic with a sulfidic monimolimnion throughout the Holocene. These conditions are documented by elevated sedimentary molybdenum (Mo) concentrations of >26 ppm, Mo isotopic compositions characteristic for euxinic conditions, and the presence of phototrophic sulfur bacteria pigments (isorenieratene and okenone) and DNA (Dahl and Wirth, 2017; Ravasi et al., 2012; Wirth et al., 2013; Dahl et al., 2013).
3.1 Hyperspectral imaging core scanning
Hyperspectral imaging (HSI) core scanning was performed using a Specim PFD-CL-65-V10E line scan camera following the procedure developed by Butz et al. (2015). The spatial resolution of the images is 70 µm pixel size, and the spectral resolution is 1.6 nm. The resulting images were processed using ENVI (Exelis ENVI, Boulder, Colorado). Reflectance from 471–950 nm was normalized using a BaSO4 white reference plate as a white reference and an image taken with a closed camera shutter as a dark reference. Iterative testing was used to determine reflectance thresholds that were then applied to remove areas of the sediment core with cracks (pixels with less than 3.8 % reflectance in the range 600–800 nm) or unusually reflective minerals (pixels with greater than 28 % reflectance between 600–800 nm).
Relative absorption band depth (RABD) indices were calculated to estimate the relative abundance of pigment groups based on their diagnostic absorption troughs (Fig. 2). Spectral endmember analysis was used to identify troughs associated with three types of photosynthetic pigments: Chl a (absorption at 660–675 nm; Rein and Sirocko, 2002), BChl a (absorption at 840–845 nm; Butz et al., 2015; Oren, 2011), and BChl c, d, and e (absorption 710–745 nm; Hubas et al., 2011; Oren, 2011). Multiple index formulas (RABD and RABA indices; relative absorption band area) were tested to quantify pigment abundance, and these indices were compared with high-precision liquid chromatography (HPLC) measurements of pigment extracts from discrete samples to select the RABD formulas that effectively captured pigment abundance (Fig. S1, Table S1 in the Supplement). Based on this analysis, the following formulas were used:
where Rλ is the reflectance at the wavelength (λ); in Eq. (2), X is the number of spectral bands between R765 and the trough minimum (Ri), and Y is the number of spectral bands between the trough minimum and R695.
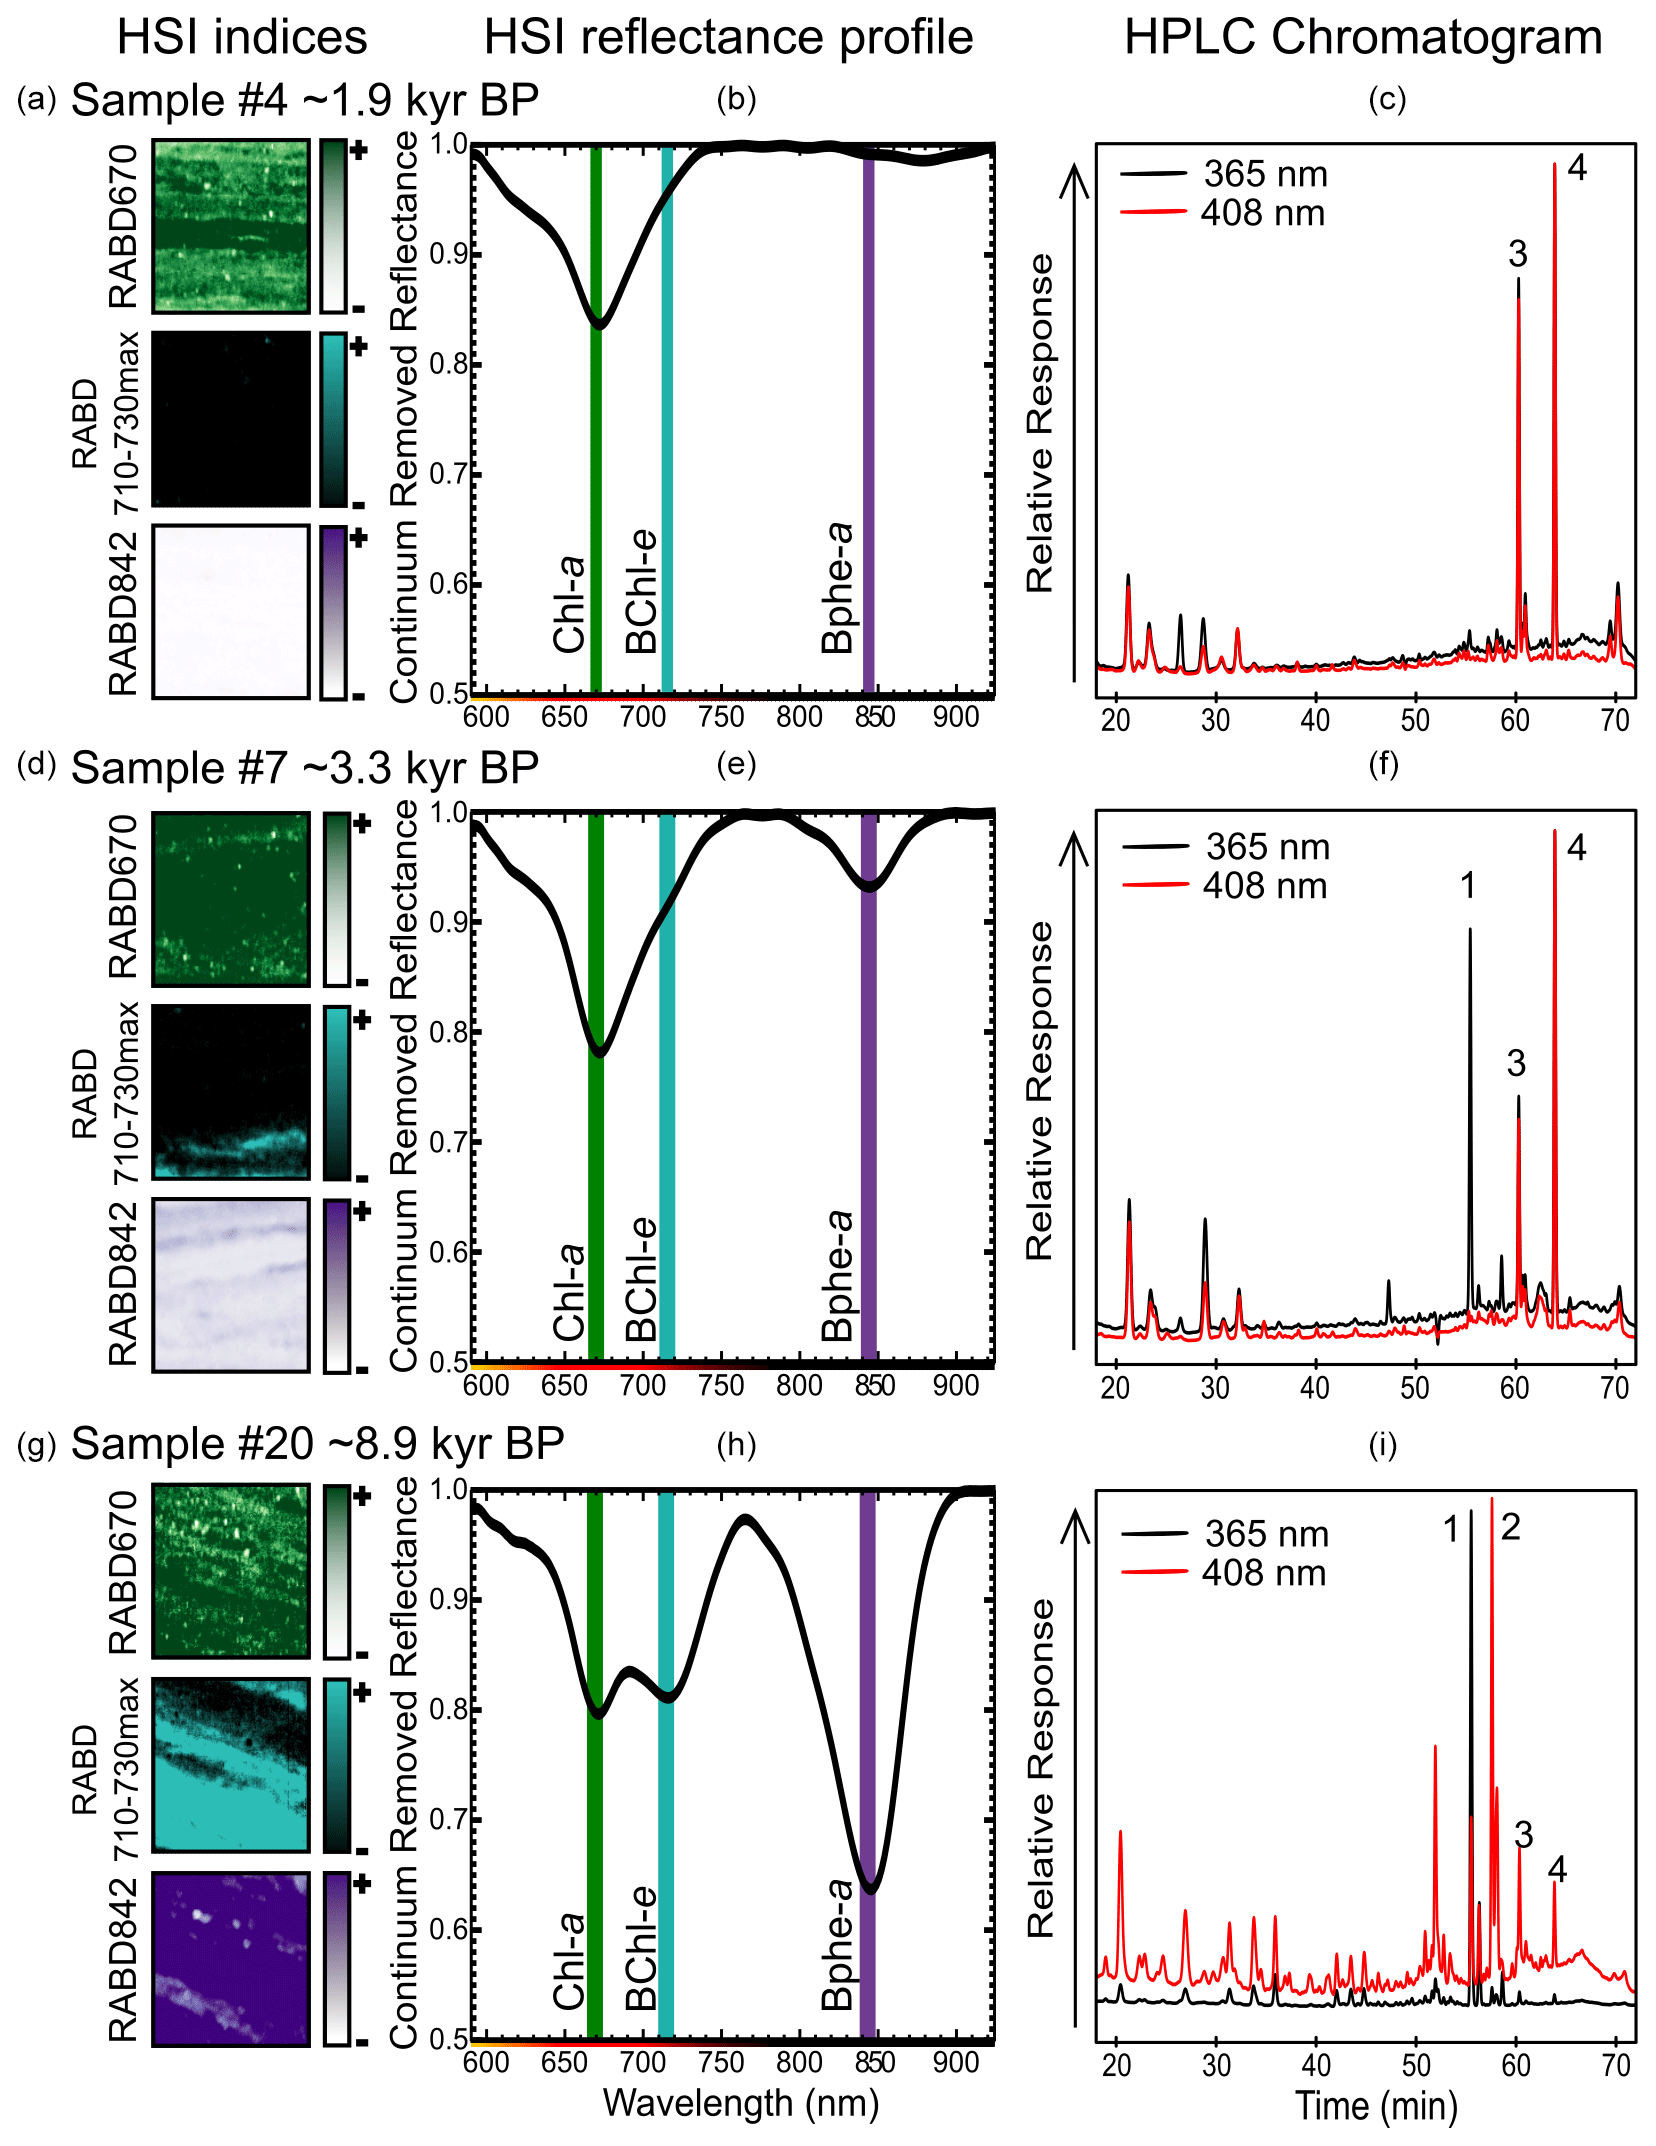
Figure 2Examples of sediment samples (1 cm2, a, d, g) taken for pigment calibration comparing RABD index maps, the mean reflectance profile over the 1 cm2 sample area (b, e, h, shown as continuum removed reflectance), and HPLC chromatograms (c, f, i). Absorption maxima for Chl a (green), BChl e (light blue), and Bphe a (purple) are labeled by vertical lines on the HSI reflectance profiles. Peaks in HPLC chromatograms are labeled as (1) bacteriopheophytin a, (2) isorenieratene, (3) pheophytin a (derivative of chlorophyll a), and (4) pyropheophytin a (derivative of chlorophyll a).
RABD670 represents the relative abundance of chlorophyll a, b, and derivatives (TChl) and thus is a proxy for primary production within the oxic mixolimnion of the lake. This index, or similar variations, has been widely used in investigations of lake sediments (Michelutti and Smol, 2016; Zander et al., 2022). RABD710–730max is reported here for the first time and represents the relative abundance of BChl c, d, and e, as well as their derivatives. Therefore, it is a proxy for the abundance of GSB. RABD842 represents the relative abundance of BChl a, which is preserved in sediments as bacteriopheophytin a (Bphe a). This index has been utilized as a proxy for PSB in several studies utilizing HSI on sediment cores (e.g., Butz et al., 2016; Makri et al., 2020).
Based on the stratigraphy established in Wirth et al. (2013), event deposits (floods and MMDs) were removed from the HSI dataset for downcore plots and subsequent analyses.
3.2 Pigment measurements for calibration of HSI indices
Pigments were extracted from 22 samples taken from the sediment core from stratigraphic levels that covered as wide a range of the RABD values as possible. Each sample represents approximately 1 cm2 on the core surface and contained approximately 0.2–0.6 g of dry sediments. Pigments were extracted with 100 % acetone using a modified version of the method described in Amann et al. (2014). A spectrophotometer (Shimadzu UV-1800) was used to measure Bphe a in extracts by applying the extinction coefficient from Fiedor et al. (2002). The same extracts were also measured using an Agilent Infinity 1260 series HPLC equipped with a G7117C Diode Array Detection detector using the method of Sanchini and Grosjean (2020). We used standards to identify and quantify concentrations of chlorophyll a, pheophytin a, pyropheophorbide a, pheophorbide a, and pyropheophytin a. All of these pigments were combined to estimate the concentration of TChl, which was used as the target of the RABD670 calibration. Bphe a concentrations were estimated using a calibration based on a BChl a standard, which yields results that are highly correlated with the concentrations obtained from the spectrophotometer method (r=0.97, p<0.001) but are overestimated due to the higher absorption coefficient of BChl a compared to Bphe a (Oelze, 1985). For this reason, we use the spectrophotometer data for calibration of the RABD842 index. Additionally, the spectrophotometer data track all bacteriopheopigments that absorb in the same band (745 nm in acetone), which is comparable to the in situ measurements of the HSI method. Finally, the carotenoid isorenieratene was identified in the HPLC chromatograms based on its retention time and spectral profile (Itoh et al., 2003; Fuciman et al., 2010). This carotenoid is produced by brown-colored strains of GSB (Sinninghe Damsté and Schouten, 2006; Hopmans et al., 2005) and thus serves as a proxy for their abundance. We report isorenieratene as a relative index (peak area per gram of dry sediment). We tested the correlation between isorenieratene and RABD710–730max to validate the new HSI index as a proxy for GSB. Unlike the other two HSI pigment indices, a quantitative concentration model for the RABD710–730max index was not calculated. This is because it was not possible to determine total BChl c, d, and e concentrations due to lack of commercially available standards, numerous homologues and degradation products, and the difficulty of distinguishing these GSB-derived bacteriochlorophylls from degradation products of chlorophyll a or other chloropigments with similar UV–VIS absorbance profiles in solvent.
Calibration models and statistics were calculated using R 4.2 (R Core Team, 2022). One sample, which was taken from the oldest clastic unit, contained no measurable pigments and thus was excluded from the data analysis. Linear regression was performed with data from the remaining 21 samples to calculate calibration models where the HSI RABD indices are the predictor and measured pigment concentrations are the response variables. The root mean square error of prediction (RMSEP) was estimated using a 10-fold cross validation method. The significance of correlations between pigment measurements and HSI indices was tested using a permutation test (10 000 permutations) that is appropriate for data with non-normal distributions (Bishara and Hittner, 2012). P values were subsequently adjusted for the false discovery rate of multiple hypothesis testing using the Benjamini–Hochberg procedure (Benjamini and Hochberg, 1995). In addition to our new pigment measurements, we compare our HSI indices for PSB and GSB to previously published data on DNA and carotenoid pigments for the two anoxygenic phototrophic bacteria groups (Wirth et al., 2013; Ravasi et al., 2012). The published data were reported as relative ratios of each group (GSB vs. PSB material). To compare our HSI data with these published data, we calculated a 100-year moving average of the HSI data and then the relative proportion of the PSB and GSB HSI indices by standardizing the range of each index and then calculating the ratio of the two indices.
4.1 Hyperspectral imaging as a tool to measure sedimentary pigments
The comparison between pigment measurements on extracted samples and the HSI indices validates the use of the HSI method to track abundances of the three pigment groups investigated here: TChl, Bphe a, and BChl c, d, and e (dataset – Zander et al., 2023). Correlations between all tested indices and pigment measurements are shown in Fig. S1 and Table S1. The concentration of Bphe a is highly correlated with RABD842 (Fig. 3a), and the calibration model is robust, with an estimated error of 10.4 %. This result is confirmed whether measurements from the spectrophotometer or HPLC are used (r=0.96 or r=0.92, respectively; p<0.001), which strengthens confidence in the interpretation. The concentration of TChl is significantly correlated with RABD670 (r=0.81, p<0.001), though the calibration model has greater error compared to the Bphe a model (Fig. 3b). The residuals of both calibration models are normally distributed, based on the results of a Shapiro–Wilk test. Diagnostic plots of residuals for the regression analyses are in the Supplement (Figs. S4, S5).
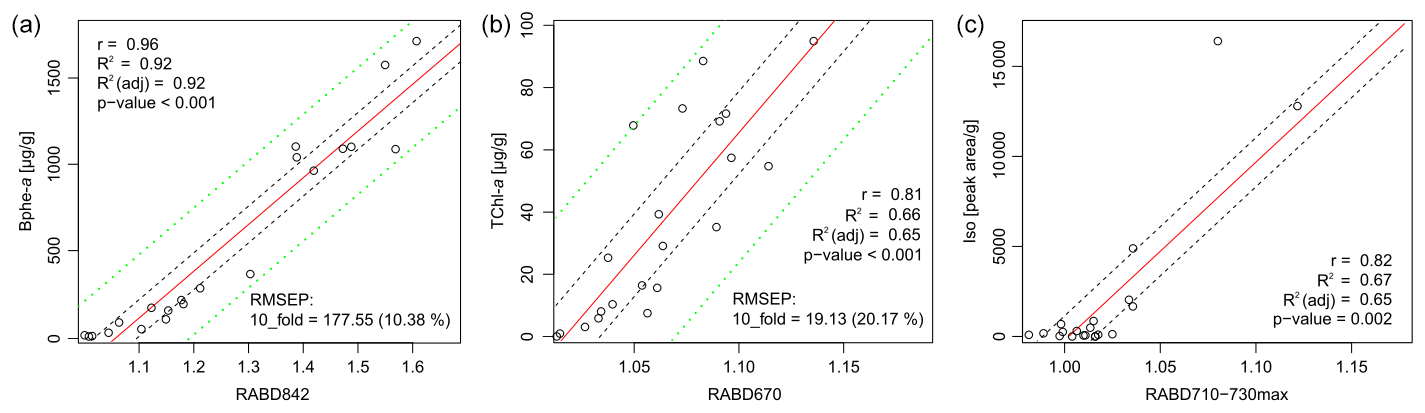
Figure 3Correlation of pigment measurements with HSI indices. Dashed black lines indicate the confidence interval of the regression line, dashed green lines indicate the confidence interval of the calibration model predictions. No calibration model was used for RABD710–730max (c).
Isorenieratene is significantly correlated with the new index, RABD710–730max (Fig. 3c; r=0.82, p=0.002), though the skewed distribution of concentrations increases uncertainty in interpreting whether or not the relationship is linear. Isorenieratene is a proxy for GSB abundance (Sinninghe Damsté and Schouten, 2006) and is found in all GSB strains in modern Lake Cadagno. Thus, the significant relationship with isorenieratene abundance validates the use of the RABD710–730max index as a proxy for GSB. However, because we could not quantify total BChl c, d, and e, a quantitative calibration of the RABD710–730max is not possible with our current dataset. The indirect relationship between isorenieratene (proxy for GSB) and RABD710–730max shows more scatter compared to the other pigment and HSI comparisons, likely because the absorption feature measured by RABD710–730max is attributed BChl c, d, and e rather than isorenieratene. Thus, this relationship could be affected by factors that change the ratio of sedimentary isorenieratene to BChl c, d, and e, such as changes in GSB communities or preservation conditions. Isorenieratene is specific to brown-colored GSB, which live in relatively dark conditions (Manske et al., 2005). If the population shifted towards green-colored GSB in the past, then isorenieratene would decrease (replaced by chlorobactene) and BChl c would also become more abundant, with declining portions of BChl e. Changes in the exact BChl pigments could affect the RABD710–730max index values because specific BChl pigments have different extinction coefficients (Namsaraev, 2009). Our index does account (to some extent) for shifts in the location of peak absorption wavelengths by using the flexible, maximized version of the RABD formula (Eq. 2 in Sect. 3.1) that uses the maximum trough depth from 710–730 nm. An additional factor that may weaken the relationship between the RABD710–730max index and isorenieratene is the fact that Chl a pigments also absorb light in the bands utilized by the RABD710–730max formula. We attempted to minimize the impact of Chl a on the GSB index by testing different RABD formulas and comparing the formula variations with the HPLC pigment data. In the HPLC data, isorenieratene and TChl are uncorrelated (r=0.01), and we used this information to select RABD formulas that also produced a low correlation between the GSB and TChl HSI indices (r=0.04 for the 21 sample locations, Fig. S1). The RABD formulas that use a trough endpoint located at 695 nm between the TChl and BChl c, d, and e absorption troughs show less correlation to one another, consistent with the HPLC pigment data, whereas formulas using a wider set of endpoints tended to show a positive correlation for the two troughs (Fig. S1). With the chosen RABD710–730max formula we anticipate that greater concentrations of Chl a would lead to a slight negative bias in the RABD710–730max value due to a more convex shape of the reflectance profile over the range 695–765 nm. It is noteworthy that the correlation between isorenieratene and RABD710–730max is strongly dependent on the samples with the highest concentrations. The correlation becomes statistically insignificant if the five highest values are removed, suggesting an approximate detection limit of RABD. Variations in the index below this level are not necessarily meaningful.
The HSI indices for PSB and GSB show a generally similar pattern over the past 12 kyr when compared with the DNA and carotenoid pigment data from Wirth et al. (2013) (Fig. 4). Some discrepancies between the HSI data and the previously published biomarker data could be explained by uncertainty in the stratigraphic correlations between the cores used for HSI scanning and the cores sampled for biomarkers. Additionally, some of the biomarker samples contain MMD layers, which were removed from the HSI data. Lastly, the previously published carotenoid and DNA data are reported only as relative percentages of GSB vs. PSB material, whereas the HSI indices scale with concentration but with relative units in the case of the GSB index. We attempted to account for this by standardizing the variance of the HSI indices before taking their ratio. Nonetheless, the major shifts (i.e., PSB dominance from 8.8–3.3 ka, GSB dominance or mixed communities otherwise) are recorded by all three methods (Fig. 4), further validating the HSI indices RABD710–730max and RABD842 as proxies for GSB and PSB, respectively.
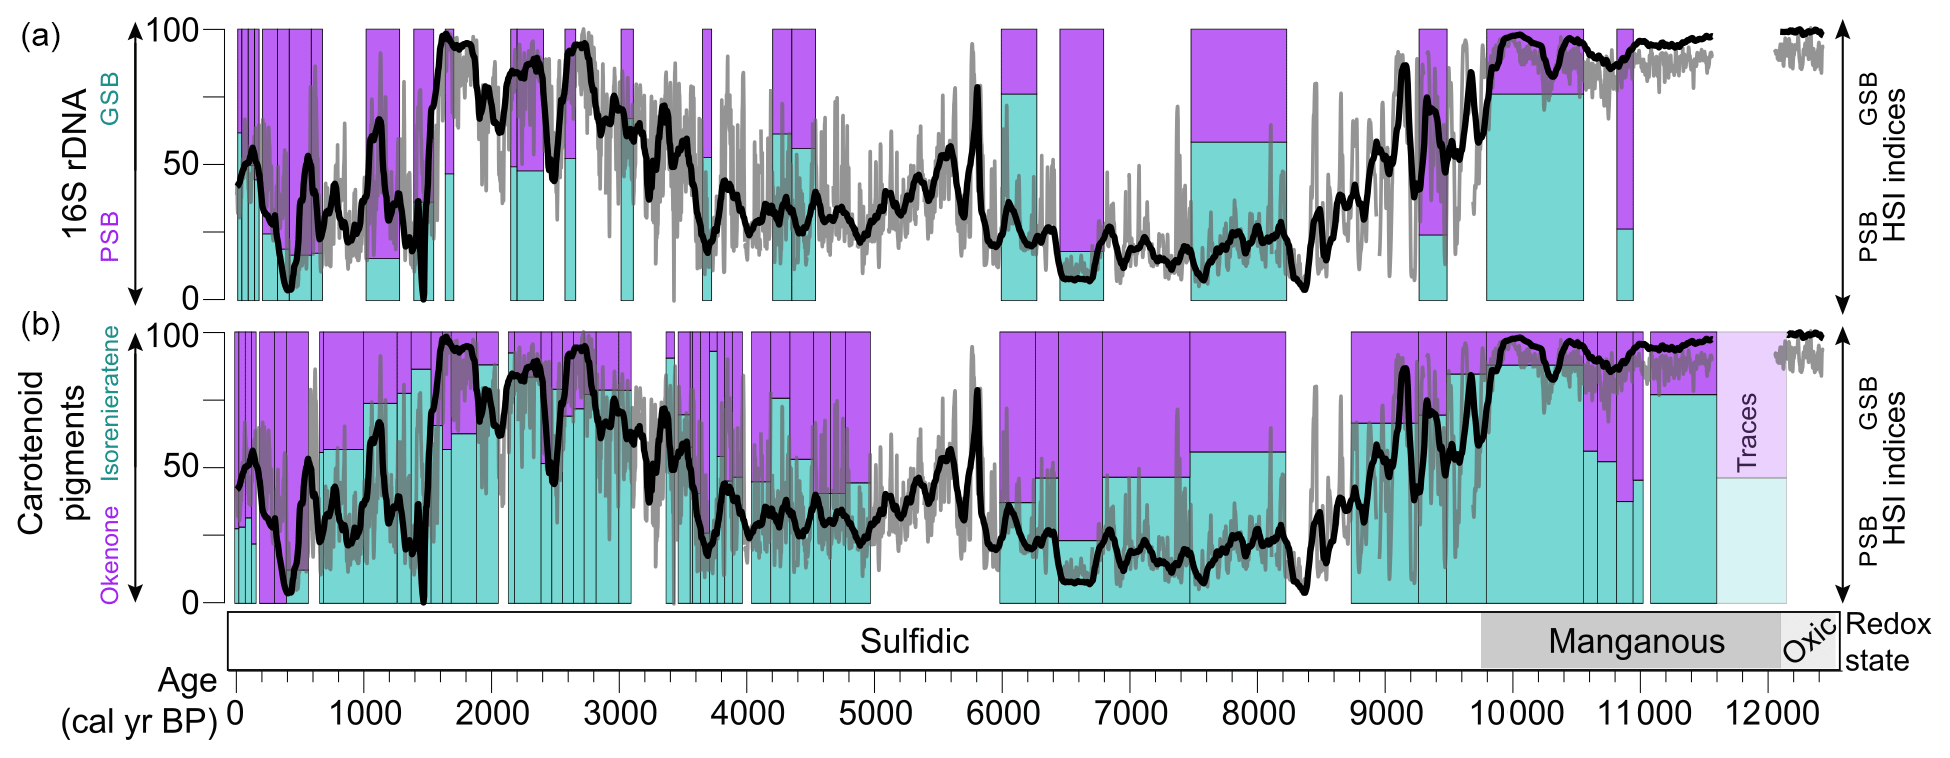
Figure 4Comparison of the HSI method with previously published biomarker and DNA measurements of the relative proportions of PSB and GSB (left-hand y axes; Wirth et al., 2013; Ravasi et al., 2012). The relative ratio of the HSI indices is plotted as a 100-year running mean (black line) and 5-year running mean (gray line) in both panels (right-hand axes, unitless index).
The close similarity of the spectral profiles of Chl a and BChl c, d, and e (and derivatives) when dissolved in organic solvent makes it difficult to measure these pigments in samples that contain a mixture of both groups (Taniguchi and Lindsey, 2021). In particular, formulas developed for spectrophotometer measurements of these pigments yield inaccurate results when applied to such mixed samples (Picazo et al., 2011). However, the absorption maximum of these pigment groups differ when they are in situ, with BChl c, d, and e shifted to 710–750 nm compared to the 660–675 nm absorption maxima of Chl a (Oren, 2011). This makes in situ HSI uniquely valuable as an efficient method to measure relative abundances of GSB-related pigments in sediments, especially those that contain pigments of both oxygenic and anoxygenic phototrophs.
The absorbance trough observed in our dataset at 710–730 nm fits most closely the absorbance spectra of BChl e (Fig. 2; Oren, 2011; Overmann et al., 1992); however, BChl d is likely also present and has an absorbance maximum at 715–745 nm that is overlapping. BChl c is likely not present in significant amounts because it is not synthesized by the main species present in the most recent decades (Halm et al., 2009), and its absorbance is greatest at 745–755 nm, which is typically near a reflectance maximum in the spectral endmembers. BChl e has already been identified as the main GSB pigment in Lake Cadagno's water column during recent decades (Habicht et al., 2011; Gregersen et al., 2009; Posth et al., 2017), as well as in the sediments (Naeher et al., 2016). The presence of isorenieratene throughout the sedimentary record (Fig. 4; Wirth et al., 2013) confirms that the GSB population has consistently included brown-colored strains of GSB throughout the lake history, and these strains of GSB tend to utilize BChl e for photosynthesis (Overmann et al., 1992; Sinninghe Damsté and Schouten, 2006). HPLC data also suggest the presence of Bphe e and homologues (Fig. S2); however, without a reference standard to compare to, this identification remains uncertain.
4.2 Long-term variations of phototrophic communities at Lake Cadagno
The downcore HSI-inferred pigments reveal a high-resolution record of variable aquatic phototrophic communities in Lake Cadagno during the past 12 500 years (Fig. 5; dataset – Zander et al., 2023) that is consistent with the lower-resolution results of previously published DNA and carotenoid pigment analyses (Fig. 4; Wirth et al., 2013; Ravasi et al., 2012). However, the high-resolution HSI data provide more precise information about the timing of changes and allow for a more detailed analysis of potential factors that might have driven community shifts. In this section, we compare the records of pigments with proxy data from Lake Cadagno and the region to possibly identify the main drivers of variations in the phototrophic groups over the Holocene.
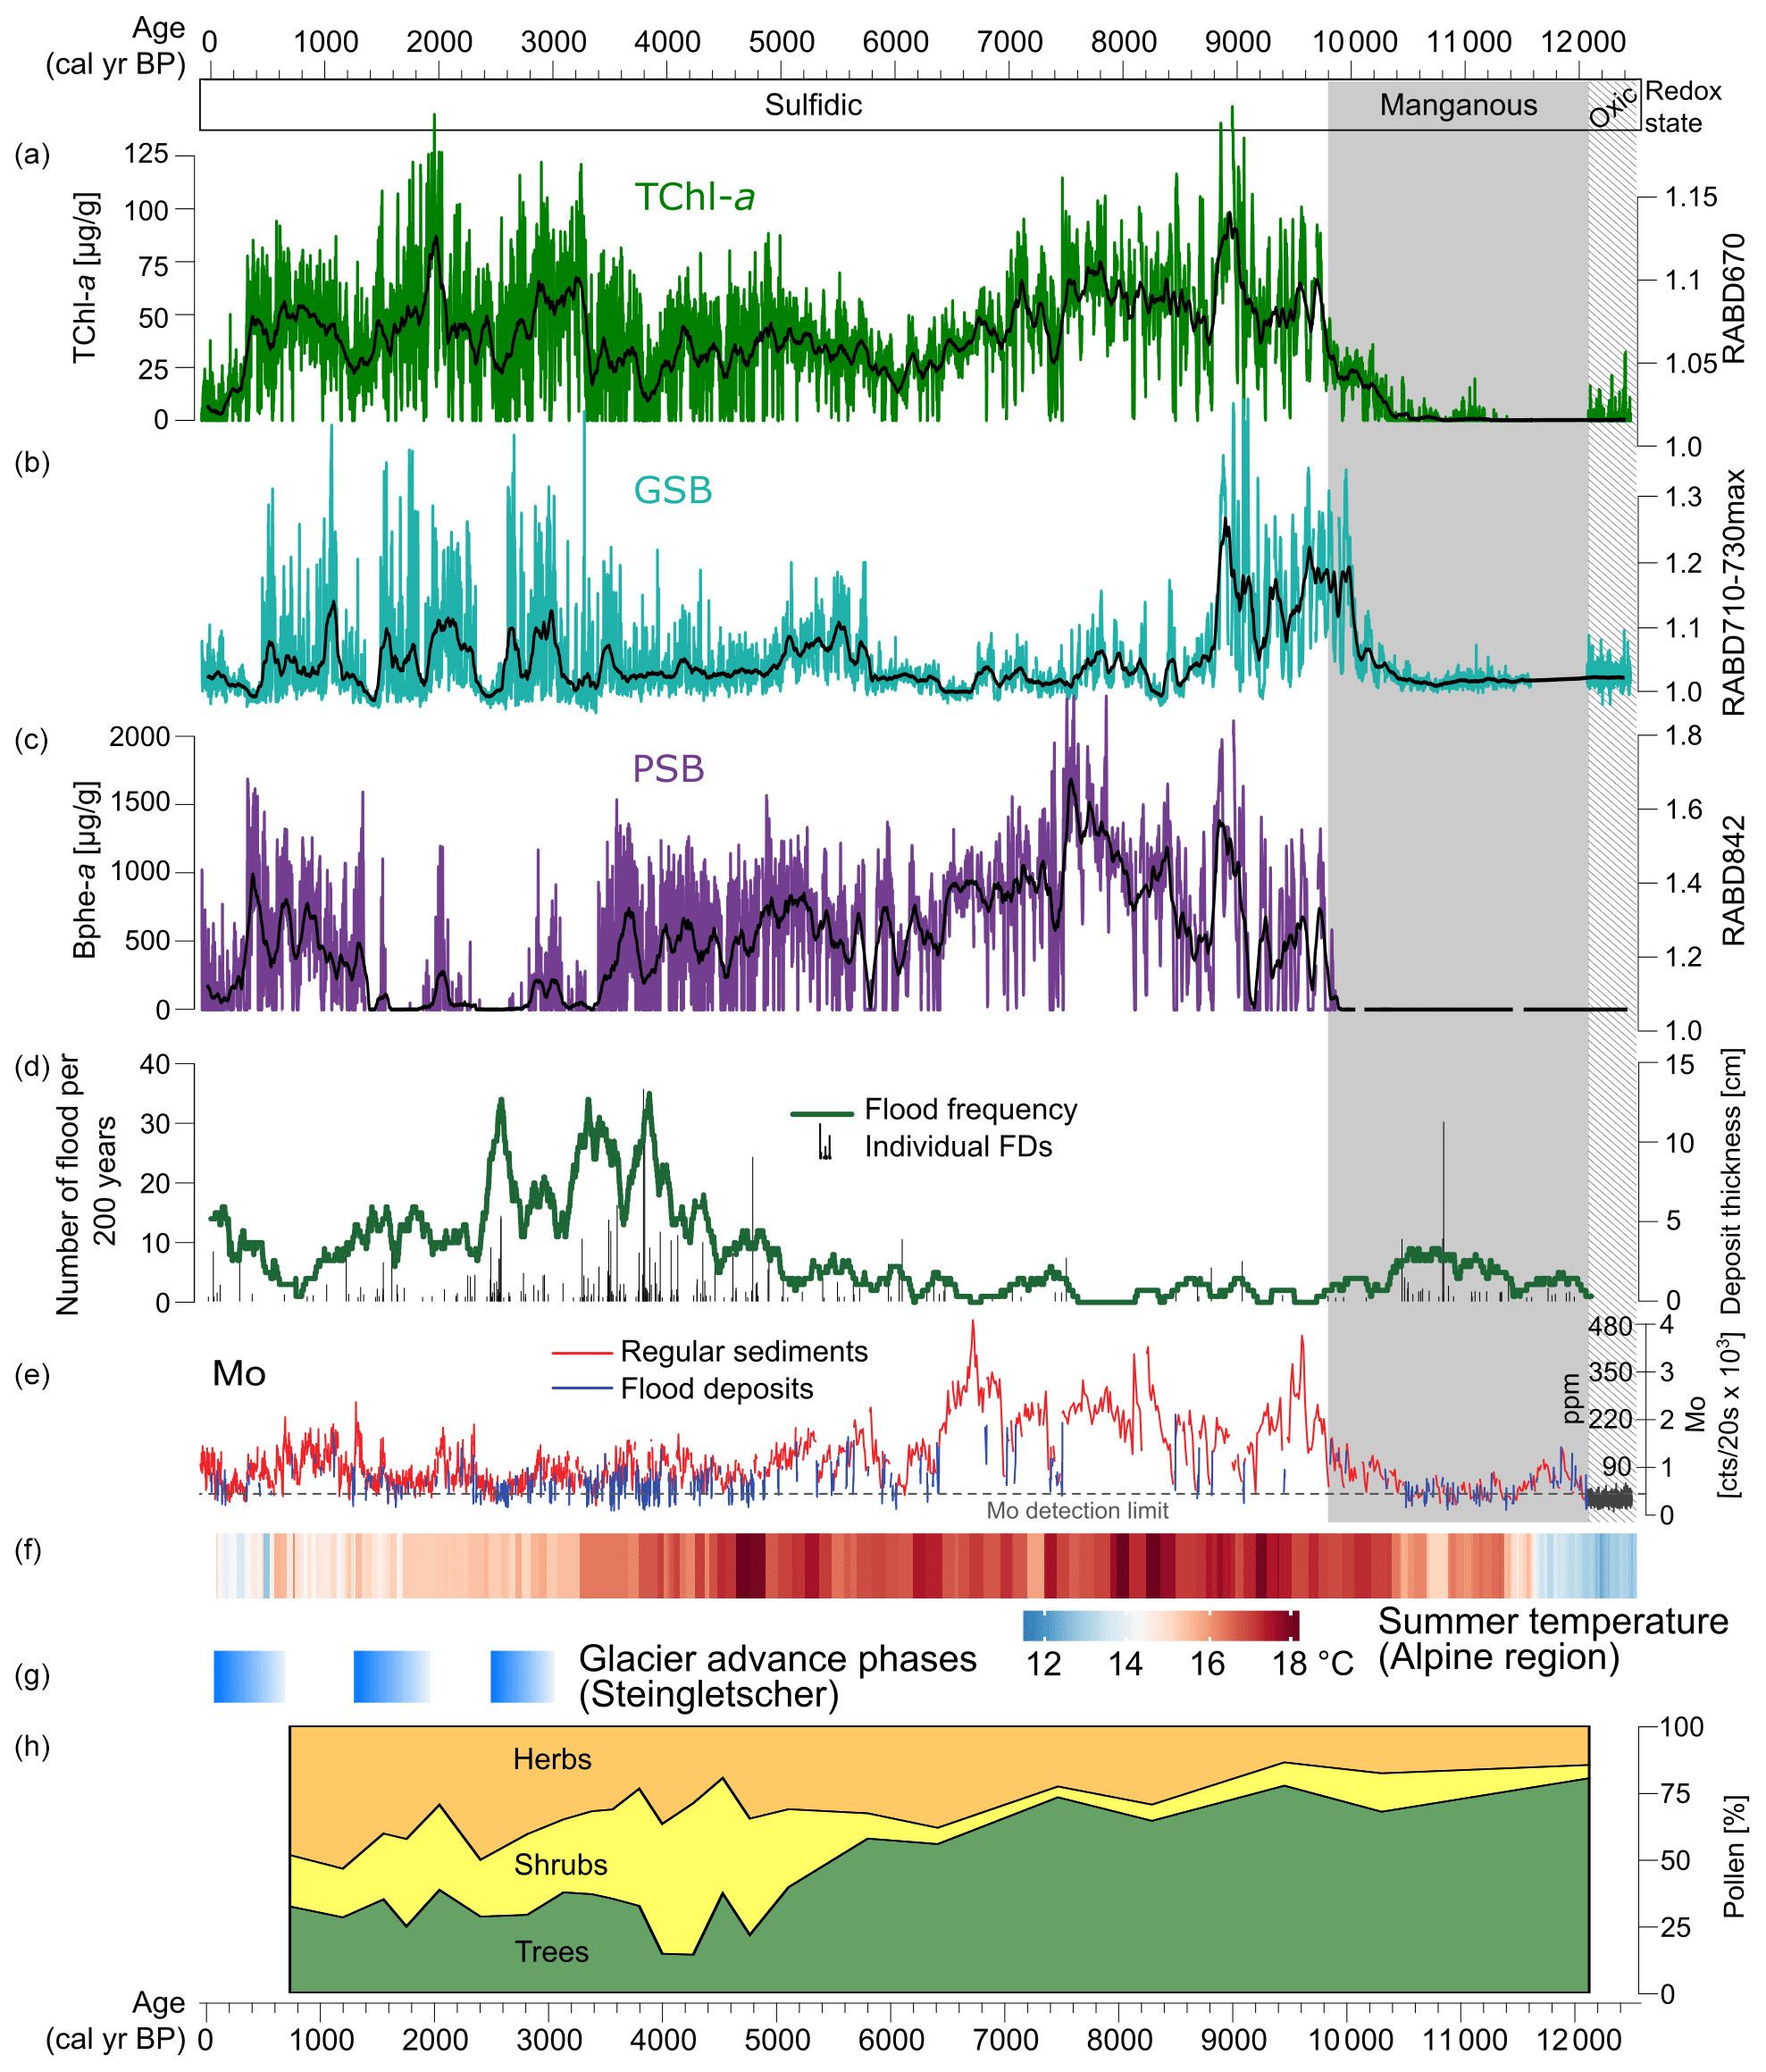
Figure 5Summary of proxies from Lake Cadagno and the alpine region. (a–c) HSI pigment records with data plotted as calibrated pigment concentrations for TChl and Bphe a (this study). (d–e) Flood frequency and Mo XRF data (Wirth et al., 2013). (f) Summer temperature reconstruction for the Alps based on a compilation of chironomid records (Heiri et al., 2015). (g) Phases of glacier advance at Steingletscher, Swiss Alps (Schimmelpfennig et al., 2022). (h) Pollen records of vegetation from Lake Cadagno (Vescovi et al., 2018).
In the early part of the record (12.5–10.2 kyr BP), sediments are dominantly clastic, and only traces of pigments are detected in the HSI data, making interpretations difficult. However, the more sensitive pigment measurement method used by Wirth et al. (2013) suggests that both PSB and GSB populations were already present over this interval, with a dominance of GSB (Fig. 4). Recent investigations of Lake Cadagno sediment porewater chemistry suggest that oxic groundwater is currently intruding into the lower lake sediments (Berg et al., 2022). Thus, it may be possible that pigments have been more degraded in this section compared to the rest of the profile, which has been continuously anoxic.
The redox transition from clastic, manganous sediments to sulfidic conditions at 10.5 to 9.8 kyr BP is particularly interesting to investigate at a high-resolution (Fig. 6a). Around 10.2 kyr BP, at the transition point from clastic-dominated sediments to increasingly organic-rich sediments, TChl becomes consistently detectable. Mo begins to increase at the same time as TChl, suggesting that the increase in oxygenic photosynthesis may have contributed to the onset of sulfidic conditions through increased oxygen consumption in the bottom layers due to organic matter remineralization. Approximately 2 cm (∼ 100 years) above this transition, the GSB index (RABD710–730max) increases substantially, indicating the onset of euxinic conditions within the lake. The GSB index appears to match the Mo profile at the redox boundary, suggesting a link between more sulfidic conditions and GSB development at this time. Another ∼ 150 years later, PSB pigments appear for the first time, most likely indicating a shallowing of the chemocline based on the higher light intensities required by PSB compared to GSB. These changes occurred during a time of relatively warm temperatures (Heiri et al., 2015; Fig. 5f), and forests were already established in the catchment for approximately 2000 years (Vescovi et al., 2018; Fig. 5h). Early Holocene warming and drier summers would have contributed to permafrost melting, soil stabilization, and more solute-rich groundwater flows to the lake, which led to the development of crenogenic meromixis. Decreasing frequency of flooding also enabled meromictic conditions.
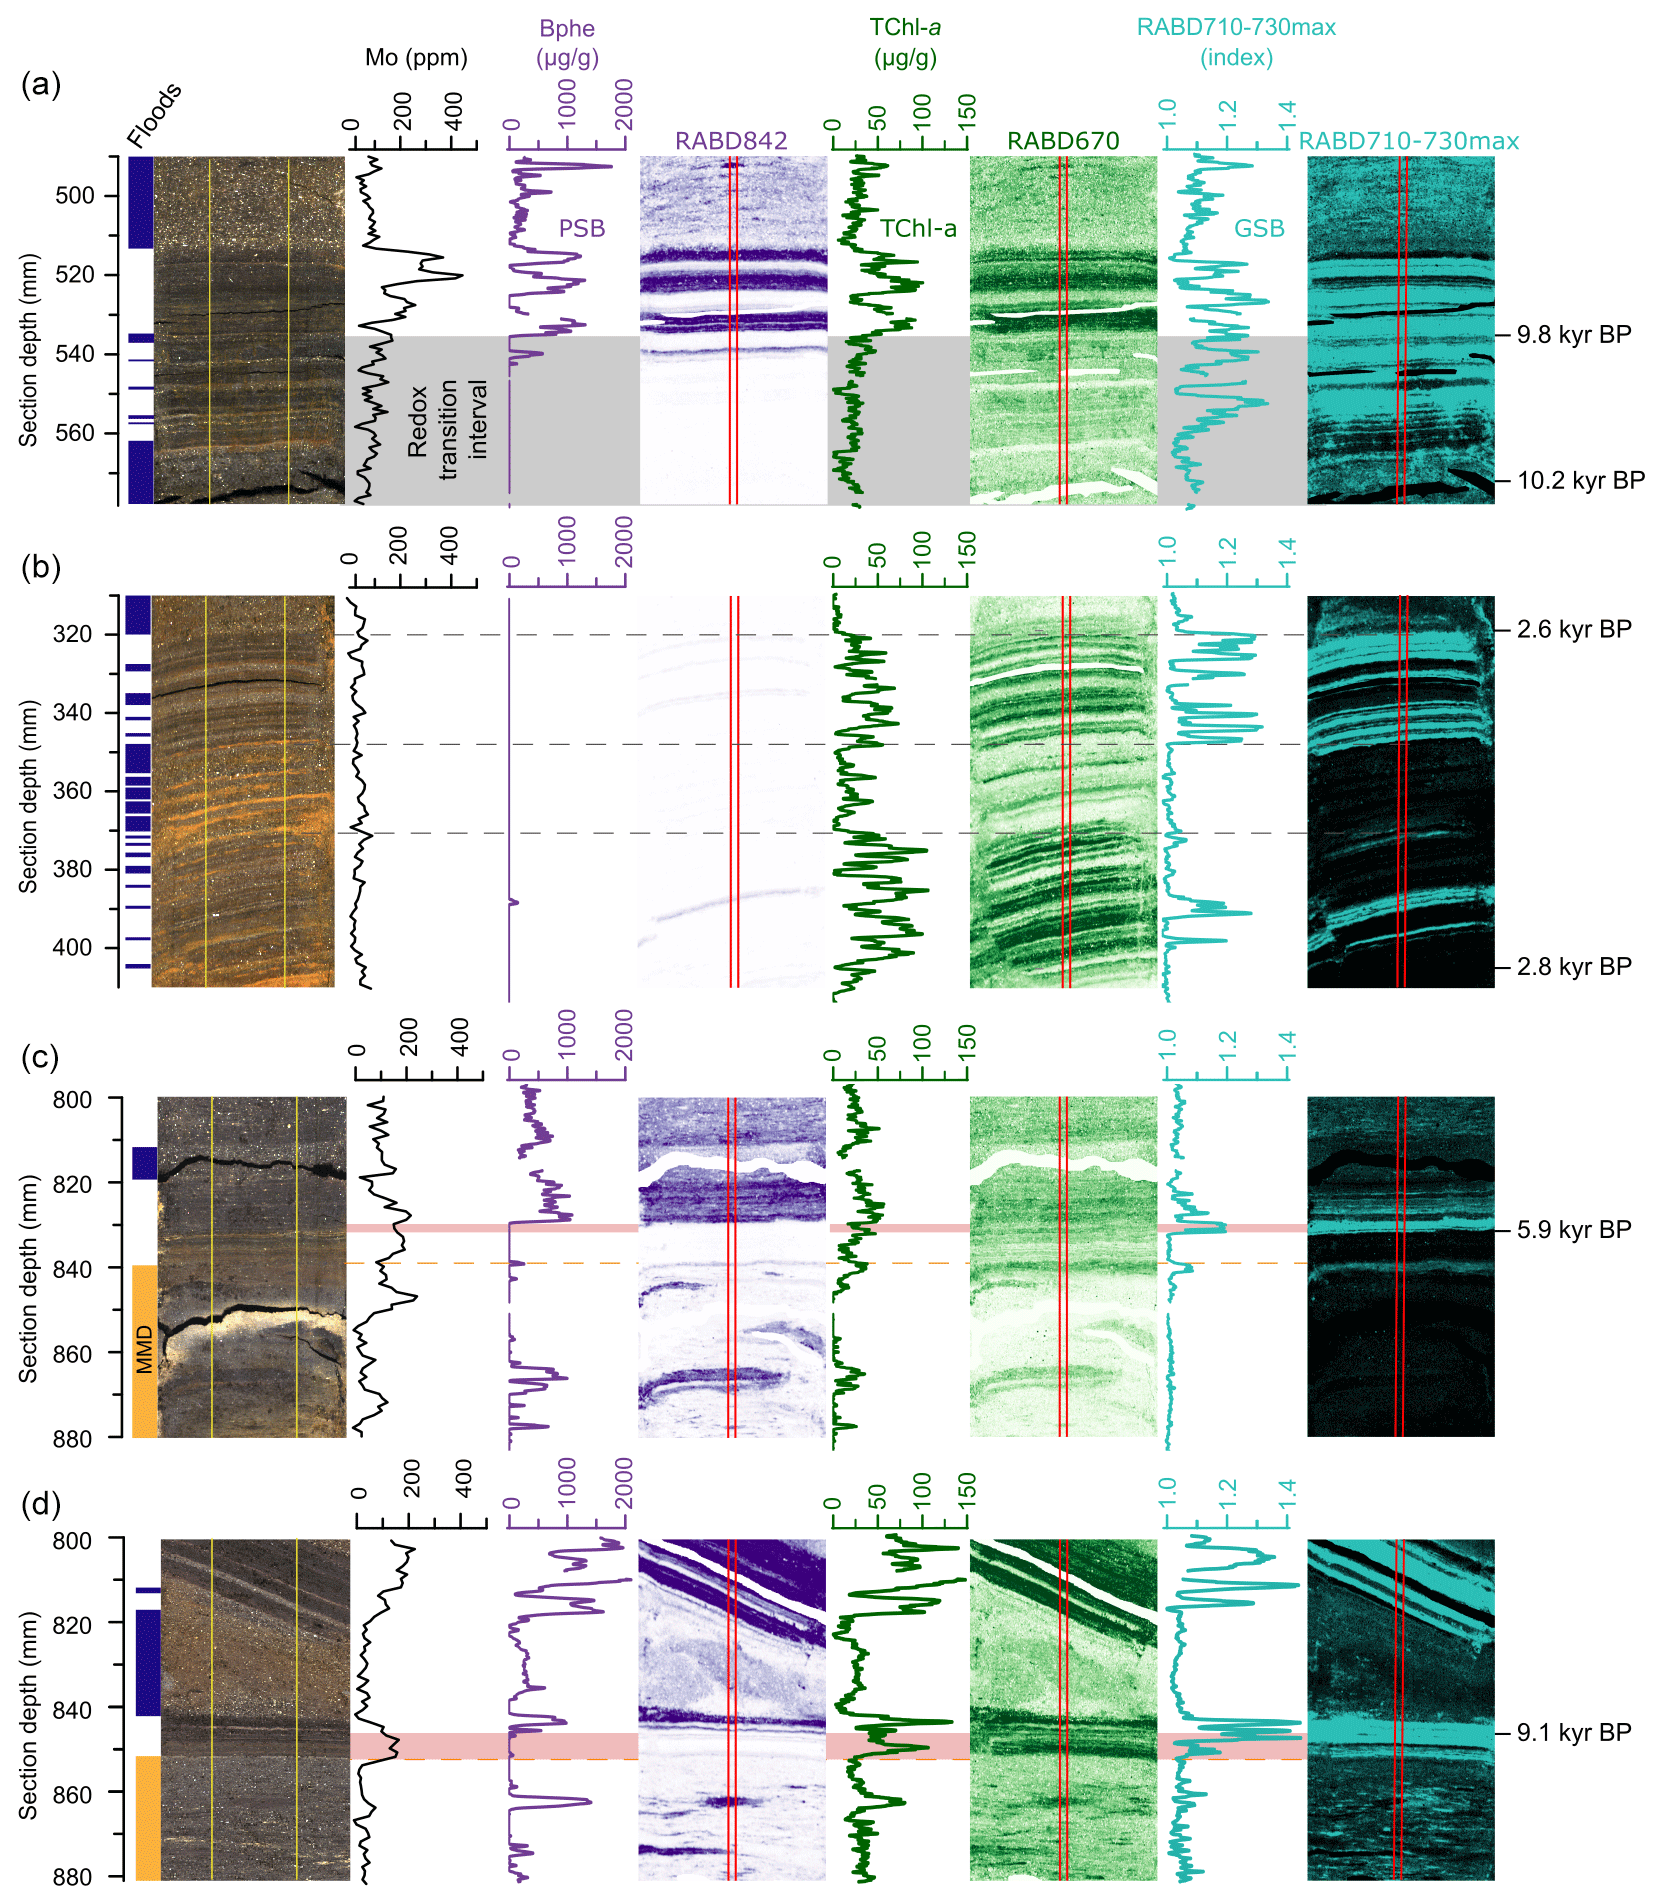
Figure 6Detailed views of (a) the redox transition interval 9.8 kyr BP, (b) an interval with frequent flood deposits (2.8–2.6 kyr BP), (c) the top of a mass-movement deposit (MMD 5.9 kyr BP), and (d) a second example of a MMD (9.1 kyr BP). Shown (from left to right) are core pictures, with flood deposits marked in dark blue and MMD marked in orange, Mo concentrations at 1 mm downcore resolution (black), Bphe a concentrations with spatial map (violet), TChl concentrations with spatial map (green), and RABD710–730max index (GSB index; light blue). The vertical red lines on the hyperspectral images mark the location of the plotted downcore profiles. Dashed yellow lines indicate the tops of MMD. The gray rectangle in panel (a) shows the redox transition zone. Pink rectangles in panels (c) and (d) highlight lags between re-establishment of GSB and PSB following event deposits.
Wirth et al. (2013) concluded that Lake Cadagno was continuously meromictic with a sulfidic monimolimnion during the past ∼ 10 kyr, and this result is confirmed by our high-resolution record of bacterial pigments (Fig. 5). Nonetheless, the pigment records show substantial shifts in the phototrophic communities during this period. From 10.2–8.8 kyr BP all three pigment groups have high concentrations, indicating productive communities of PSB, GSB, and oxic photosynthesizing algae. TChl and the GSB index reach maximal levels during this period. This period was likely defined by stable stratification with highly sulfidic conditions at the chemocline. Relatively high productivity in the mixolimnion may have shaded the chemocline enough to favor GSB dominance over PSB.
The next phase, from 8.8 to 3.4 kyr BP, is dominated by PSB. GSB remain present throughout most of this interval, however at much lower concentrations than the previous phase. TChl decreases slightly compared to the previous phase. Decreased oxygenic productivity, likely driven by nutrient limitations, may have increased light availability at the chemocline enough to favor PSB over GSB. GSB production could have continued in extremely low light conditions (due to dense PSB populations), but growth rates are substantially slowed under such conditions (Overmann et al., 1992), leading to lower values of our GSB index. At approximately 5.8 kyr BP, the GSB index increases slightly. The timing of this shift matches with changes in several other proxies from Cadagno: tree pollen decreases due to Neolithic human disturbance (Vescovi et al., 2018; Fig. 5h), Mo counts decrease to a lower level, and the frequency of flood deposits increases. Together, these changes suggest increased mixing of the lake due to greater wind shear on the lake and more frequent flooding, which apparently led to more favorable conditions for GSB. Several studies have documented an increase in lake mixing due to early-human deforestation and a consequent decrease in PSB; this dynamic occurs often in small deep lakes (Makri et al., 2020; Tu et al., 2021; Zander et al., 2021).
At ∼ 3.4 kyr BP, Bphe a concentrations drop to near zero, remaining at low values with occasional short-duration spikes until 1.3 kyr BP. During this time interval, the GSB index reaches higher levels but is highly variable. TChl also increases, indicating an increase in algal productivity. The shift from PSB dominance to GSB dominance implies less light penetration at the chemocline either due to chemocline lowering or increased turbidity above the chemocline. This shift occurred during a period of high flood frequencies, and a peak in flood frequency at 2.5 kyr BP is associated with low levels of both PSB and GSB, suggesting frequent mixing and oxygenation of the water column by floods. However, equally high flood frequencies occurred around 3.9 kyr BP, when PSB were still abundant, suggesting that additional factors may be needed to explain the very low Bphe a from 3.4–1.3 kyr BP. One hypothesis may be that climate changes (mainly cooler summers) following the onset of the Neoglacial period in the Alps led to a less stable stratification within the lake. Summer temperature reconstructions for the Alps from chironomids show a drop in temperature at approximately the same time as the sudden decline in PSB (Fig. 5f; Heiri et al., 2015). Additionally, glacial advances are recorded around 3–3.5 kyr BP at several sites in the Alps, such as the Steingletscher (Fig. 5g), Rhone Glacier, and Grindelwald Glacier (Schimmelpfennig et al., 2022). Cooler summers would have weakened thermal stratification, making the chemocline more susceptible to disturbance. Furthermore, groundwater input to the lake may have become more dilute in solute concentrations due to increased flow in the subsurface under neoglacial conditions, which may have also driven weaker stratification and lower sulfide availability. This could occur due to wetter conditions or increased snow cover, which would increase groundwater flow. Most likely, the low abundance of PSB from 3.4 to 1.3 kyr BP was driven by a combination of factors, including cooler temperatures, deforestation, and increased flood frequency, all of which increased water-column disturbance in the lake and led to less light penetration at the chemocline.
From 600–1600 CE, during a period of relative warmth (Medieval Climate Anomaly; Büntgen et al., 2011), PSB returned to high levels, while GSB remained high and variable. This change aligns with an increase in Mo and a decline in flood frequency (Fig. 5), suggesting that the decrease in flood events led to a more stable water column and a shallowing of the chemocline (expansion of the sulfidic layer). During the past 400 years, concentrations of pigments decreased substantially, but evidence of all three phototrophic groups remain, with a slightly increasing portion of GSB. These changes could be due to increased flood frequency and summer cooling associated with the Little Ice Age (Büntgen et al., 2011).
To summarize, PSB and GSB communities are strongly affected by processes that impact their ecological requirements, i.e., anoxic and sulfidic conditions with light availability. PSB are more sensitive to changes in light availability and, therefore, were highly sensitive to processes that introduced turbidity or strengthened mixing in the mixolimnion and thereby weakened the chemical gradients (i.e., H2S and O2) at the chemocline. Correlation analyses shows a negative correlation between flood frequency and all three pigment groups, with the relationship being particularly strong for Bphe a (; Fig. S3). Mo is positively correlated with all three groups, suggesting a link between sulfidic conditions and primary production. Hydrological conditions (floods and groundwater), land cover, and climatic conditions appear to have been key drivers of millennial scale shifts in the composition of anoxygenic phototrophs community, likely causing cascading changes in biogeochemical cycles and ecosystem function (Bell et al., 2005).
4.3 Short-term response of phototrophic communities to floods and mass movements
High-resolution HSI pigment data enable a detailed investigation of the changes in the phototrophic communities in response to short-lived events such as floods and mass movements. Floods represent disturbance events that cause short-term changes in ecological conditions within the lake by injecting oxygen into the monimolimnion through undercurrents (Fink et al., 2016), by decreasing light penetration via delivery of suspended sediment in interflows and overflows, or by mixing the water column (Sabatier et al., 2022). Mass movements of previously deposited sediment may also decrease light penetration, mixing the water column or otherwise altering biogeochemical conditions in the water column. In this section, we analyze several example sections in detail to describe the changes in the phototrophic communities in response to floods and mass movements.
Frequent, but relatively thin (1 to 3 mm), flood deposits are found in the sedimentary record at 2.8 to 2.6 kyr BP (Fig. 6b), making this interval well suited for studying the recovery of the different phototrophic groups in between small flood events. The intervals from 405 to 372 mm and from 348 to 320 mm section depth (Fig. 6b) are characterized by flood deposits intercalated in background sediments, where 1 mm of background sediment corresponds to ∼ 3 years. Here, TChl reaches high values in the regular sediments in between flood deposits. No evidence of PSB is found in the HSI data, while GSB pigments are found in distinct layers. During the interval from 372 to 348 mm, virtually no background sediment is present in between flood deposits, and consequently all pigment indices are at low levels. The lack of PSB in this interval of frequent flooding suggests that there was persistently less light radiation at the chemocline either due to a lowering of the chemocline or increased turbidity above the chemocline. GSB are more tolerant of low light conditions (Van Gemerden and Mas, 1995) and, therefore, are present during this interval, however, not continuously. Discrete layers of regular lacustrine sediments (indicated by high TChl) that do not show evidence of anoxygenic phototrophs might represent periods of greater lake mixing when oxygenation of the water column limited growth of PSB and GSB. The response of the phototrophic communities to floods is, however, variable. In other parts of the record with less frequent flooding, there are instances where PSB and GSB pigments return immediately when normal lake sedimentation resumes, indicating no major impact of the flood event on these communities. The variable response of the bacterial communities to floods is likely controlled by the magnitude of the flood as well as how the flood interacts with the lake water, i.e., via underflows and turbidity currents, or interflows, which would result in suspended sediment and oxygen being delivered differently to the water column.
Examples of mass-movement deposits (MMDs) are shown in Fig. 6c and d; both are slumps composed mainly of previously deposited lake sediment (note the pigment-rich sediment within the MMD). At 5.9 kyr BP (Fig. 6c) a mass-movement deposit is overlain by 7 mm of in-place lacustrine sediments that first contain mainly low concentrations of TChl and a lack of PSB and GSB. This suggests that the MMD substantially disturbed the water column, leading to an extended period (approximately 60 years based on the estimated sedimentation rate in this section) of oxic conditions through the lake. High concentrations of manganese at the upper boundary of MMDs confirm that oxygen was introduced to the sediment water interface during these events (Wirth et al., 2013). GSB and PSB pigments both increase sharply after this period, but GSB lead the PSB pigments by about 2.5 mm (∼ 20 years), suggesting a delay in the re-establishment of PSB following the MMD, most likely due to a deeper chemocline with too little light penetration for PSB growth. The sharp increase in GSB likely represents a transition from seasonally oxic conditions to permanently anoxic conditions in the hypolimnion, whereas the sharp increase in PSB likely represents the time when the chemocline shallowed enough for there to be sufficient light to produce blooms of PSB. A similar pattern is observed for an older MMD illustrated in Fig. 6d. In this case, GSB production resumed immediately following the MMD, though at somewhat lower levels, perhaps due to a light limitation. After about 60 years (4.5 mm), PSB return to high levels, and GSB production also increases substantially, indicating a return to meromictic conditions with a stable and shallow chemocline.
These case studies of selected intervals show that floods and mass-movement events within the lake can cause significant disturbance to the anoxygenic phototrophic communities within the lake, with effects lasting several decades, though these temporal estimates are uncertain due to low sedimentation rates. Nonetheless, the observed delay between the re-establishment of PSB and GSB appears in several instances and is robustly measured by the high-resolution HSI data. Such information on a millimeter scale could not be observed through conventional pigment measurements. These findings are interesting to compare with a recent drastic change in the bacterial community from a dominance of PSB to a dominance of GSB in 2000 AD that was triggered by water-column mixing due to a storm (Tonolla et al., 2005). Following the storm, GSB biomass increased approximately threefold, while PSB biomass remained stable (Tonolla et al., 2017). One potential explanation for this shift could be increased availability of nutrients, carbon, and/or sulfide at the chemocline due to the mixing event (Decristophoris et al., 2009). As presented above, similar processes may have been associated with past flooding or mass movements that disturbed the water column and favored GSB over PSB.
Our results demonstrate that HSI core scanning is an effective technique for tracking the relative abundance of three different pigment groups: TChl (a proxy for oxygenic phototrophs), Bphe a (a proxy for purple sulfur bacteria; Chromatiaceae and Ectothiorhodospiraceae), and BChl c, d, and e (a proxy for green sulfur bacteria; Chlorobiaceae). Our study is the first, to our knowledge, to show that HSI core scanning can be used to detect GSB-related bacteriochlorophylls, and we show that the method works even in sediments containing pigments from oxygenic and anoxygenic phototrophs. The reflectance spectra of TChl and BChl c, d, and e are distinct using this in situ method, offering an advantage over spectrophotometric methods on pigments dissolved in solvents in which the spectra of these two pigment groups overlap and are essentially indistinguishable in mixed samples. The HSI pigment records confirm previous work showing nearly continuous meromictic conditions throughout the Holocene and substantial shifts in anoxygenic phototrophic bacteria communities (Wirth et al., 2013). The high-resolution data from the HSI method make it possible to investigate how disturbance events such as floods and mass movements might have impacted phototrophic communities with unprecedented detail. We suggest that flood and mass-movement events repeatedly disturbed the lake ecosystem during the Holocene and possibly disrupted the biogeochemical conditions required by anoxygenic phototrophic bacteria over seasonal to decadal timescales. Also, the inflow of groundwater into the lake and the solute concentration of these waters likely varied in the course of the Holocene. This certainly had an impact on the lake water properties and, therefore, on the phototrophic communities. Our results show that PSB are more sensitive to disturbance events, and their recovery to previous levels can take several decades longer than that of GSB and oxygenic phototrophs. Through comparison with other proxy records, we conclude that allogenic environmental factors, such as floods, air temperature, and land cover, drove major shifts in the structure of the Lake Cadagno phototrophic communities.
We expect the RABD710–730max index (or similar) will be an effective proxy for GSB abundance in sediments that have sufficient concentrations of GSB-derived pigments. Future work may refine this initial work to validate the use of in situ sediment reflectance for detecting GSB-related BChl. A quantitative calibration of our GSB index was not possible in the scope of this work but would be possible via a more detailed investigation of the sedimentary pigment assemblage to quantify total BChl c, d, and e. It may also be possible to improve the accuracy of HSI estimates of pigments in sediments with multiple pigment groups by using multivariate regression techniques or spectral deconvolution to isolate the signal of each pigment group.
Data generated for this paper (hyperspectral imaging indices and pigment measurements) are available at: https://doi.org/10.5281/Zenodo.7573508 (Zander et al., 2023). Code may be accessed upon request.
The supplement related to this article is available online at: https://doi.org/10.5194/bg-20-2221-2023-supplement.
PDZ: conceptualization, formal analysis, investigation, writing – original draft, visualization, writing – reviewing and editing. SBW: conceptualization, formal analysis, investigation, writing – original draft, visualization, writing – reviewing and editing. AG: investigation, writing – reviewing and editing. SP: writing – reviewing and editing. MG: conceptualization, writing – review and editing, resources, supervision.
The contact author has declared that none of the authors has any competing interests.
Publisher’s note: Copernicus Publications remains neutral with regard to jurisdictional claims in published maps and institutional affiliations.
We thank the Alpine Biology Centre Foundation for logistic support and coordination during fieldwork and sampling on Lake Cadagno. Andrea Sanchini, Patrick Neuhaus, Daniela Fischer, and René Nussbaumer assisted with the HPLC pigment measurements. We thank the two reviewers for their constructive comments.
This research has been supported by the Schweizerischer Nationalfonds zur Förderung der Wissenschaftlichen Forschung (grant nos. 200021_172586, P500PN_206731, and 200021-121909).
This paper was edited by Sebastian Naeher and reviewed by two anonymous referees.
Amann, B., Lobsiger, S., Fischer, D., Tylmann, W., Bonk, A., Filipiak, J., and Grosjean, M.: Spring temperature variability and eutrophication history inferred from sedimentary pigments in the varved sediments of Lake Żabińskie, north-eastern Poland, AD 1907–2008, Global Planet. Change, 123, 86–96, https://doi.org/10.1016/j.gloplacha.2014.10.008, 2014.
Bell, T., Newman, J. A., Silverman, B. W., Turner, S. L., and Lilley, A. K.: The contribution of species richness and composition to bacterial services, Nature, 436, 1157–1160, https://doi.org/10.1038/nature03891, 2005.
Benjamini, Y. and Hochberg, Y.: Controlling the False Discovery Rate: A Practical and Powerful Approach to Multiple Testing, J. Roy. Stat. Soc. B, 57, 289–300, https://doi.org/10.1111/j.2517-6161.1995.tb02031.x, 1995.
Berg, J. S., Lepine, M., Laymand, E., Han, X., Vogel, H., Morlock, M. A., Gajendra, N., Gilli, A., Bernasconi, S. M., Schubert, C. J., Su, G., and Lever, M. A.: Ancient and Modern Geochemical Signatures in the 13,500-Year Sedimentary Record of Lake Cadagno, Front. Earth Sci., 9, 754888, https://doi.org/10.3389/feart.2021.754888, 2022.
Bianconi, F., Beffa, F. A., Steiger, R. H., Günthert, A., Hasler, P., Baumer, A., and Huber, C. W.: Foglio 1252 Ambrì-Piotta – Atlante geologico della Svizzera 1 : 25000, Carta 138, ISBN 978-3-302-40061-7, 2015.
Bishara, A. J. and Hittner, J. B.: Testing the significance of a correlation with nonnormal data: Comparison of Pearson, Spearman, transformation, and resampling approaches, Psychol. Methods, 17, 399–417, https://doi.org/10.1037/a0028087, 2012.
Blaauw, M.: Methods and code for “classical” age-modelling of radiocarbon sequences, Quat. Geochronol., 5, 512–518, https://doi.org/10.1016/j.quageo.2010.01.002, 2010.
Bossard, P., Gammeter, S., Lehmann, C., Schanz, F., Bachofen, R., Bürgi, H.-R., Steiner, D., and Zimmermann, U.: Limnological description of the Lakes Zürich, Lucerne, and Cadagno, Aquat. Sci., 63, 225–249, https://doi.org/10.1007/PL00001353, 2001.
Büntgen, U., Tegel, W., Nicolussi, K., McCormick, M., Frank, D., Trouet, V., Kaplan, J. O., Herzig, F., Heussner, K.-U., Wanner, H., Luterbacher, J., and Esper, J.: 2500 Years of European Climate Variability and Human Susceptibility, Science, 331, 578–582, https://doi.org/10.1126/science.1197175, 2011.
Butz, C., Grosjean, M., Fischer, D., Wunderle, S., Tylmann, W., and Rein, B.: Hyperspectral imaging spectroscopy: a promising method for the biogeochemical analysis of lake sediments, J. Appl. Remote Sens., 9, 096031, https://doi.org/10.1117/1.jrs.9.096031, 2015.
Butz, C., Grosjean, M., Poraj-Górska, A., Enters, D., and Tylmann, W.: Sedimentary Bacteriopheophytin a as an indicator of meromixis in varved lake sediments of Lake Jaczno, north-east Poland, CE 1891–2010, Global Planet. Change, 144, 109–118, https://doi.org/10.1016/j.gloplacha.2016.07.012, 2016.
Butz, C., Grosjean, M., Goslar, T., and Tylmann, W.: Hyperspectral imaging of sedimentary bacterial pigments: a 1700-year history of meromixis from varved Lake Jaczno, northeast Poland, J. Paleolimnol., 58, 57–72, https://doi.org/10.1007/s10933-017-9955-1, 2017.
Camacho, A., Erez, J., Chicote, A., Florín, M., Squires, M. M., Lehmann, C., and Backofen, R.: Microbial microstratification, inorganic carbon photoassimilation and dark carbon fixation at the chemocline of the meromictic Lake Cadagno (Switzerland) and its relevance to the food web, Aquat. Sci., 63, 91–106, https://doi.org/10.1007/PL00001346, 2001.
Crowe, S. A., Maresca, J. A., Jones, C., Sturm, A., Henny, C., Fowle, D. A., Cox, R. P., Delong, E. F., and Canfield, D. E.: Deep-water anoxygenic photosythesis in a ferruginous chemocline, Geobiology, 12, 322–339, https://doi.org/10.1111/gbi.12089, 2014.
Dahl, T. W. and Wirth, S. B.: Molybdenum isotope fractionation and speciation in a euxinic lake – Testing ways to discern isotope fractionation processes in a sulfidic setting, Chem. Geol., 460, 84–92, https://doi.org/10.1016/J.CHEMGEO.2017.04.018, 2017.
Dahl, T. W., Anbar, A. D., Gordon, G. W., Rosing, M. T., Frei, R., and Canfield, D. E.: The behavior of molybdenum and its isotopes across the chemocline and in the sediments of sulfidic Lake Cadagno, Switzerland, Geochim. Cosmochim. Ac., 74, 144–163, https://doi.org/10.1016/J.GCA.2009.09.018, 2010.
Dahl, T. W., Chappaz, A., Fitts, J. P., and Lyons, T. W.: Molybdenum reduction in a sulfidic lake: Evidence from X-ray absorption fine-structure spectroscopy and implications for the Mo paleoproxy, Geochim. Cosmochim. Ac., 103, 213–231, https://doi.org/10.1016/j.gca.2012.10.058, 2013.
Danza, F., Ravasi, D., Storelli, N., Roman, S., Lüdin, S., Bueche, M., and Tonolla, M.: Bacterial diversity in the water column of meromictic Lake Cadagno and evidence for seasonal dynamics, PLOS ONE, 13, e0209743, https://doi.org/10.1371/journal.pone.0209743, 2018.
Decristophoris, P. M. A., Peduzzi, S., Ruggeri-Bernardi, N., Hahn, D., and Tonolla, M.: Fine scale analysis of shifts in bacterial community structure in the chemocline of meromictic Lake Cadagno, Switzerland, J. Limnol., 68, 16–24, https://doi.org/10.4081/jlimnol.2009.16, 2009.
Del Don, C., Hanselmann, K. W., Peduzzi, R., and Bachofen, R.: The meromictic alpine Lake Cadagno: Orographical and biogeochemical description, Aquat. Sci., 63, 70–90, https://doi.org/10.1007/PL00001345, 2001.
Fiedor, J., Fiedor, L., Kammhuber, N., Scherz, A., and Scheer, H.: Photodynamics of the Bacteriochlorophyll–Carotenoid System. 2. Influence of Central Metal, Solvent and β-Carotene on Photobleaching of Bacteriochlorophyll Derivatives, Photochem. Photobiol., 76, 145–152, https://doi.org/10.1562/0031-8655(2002)0760145POTBCS2.0.CO2, 2002.
Fink, G., Wessels, M., and Wüest, A.: Flood frequency matters: Why climate change degrades deep-water quality of peri-alpine lakes, J. Hydrol., 540, 457–468, https://doi.org/10.1016/j.jhydrol.2016.06.023, 2016.
Fox, C. P., Whiteside, J. H., Olsen, P. E., Cui, X., Summons, R. E., Idiz, E., and Grice, K.: Two-pronged kill mechanism at the end-Triassic mass extinction, Geology, 50, 448–453, https://doi.org/10.1130/G49560.1, 2022.
Fuciman, M., Chábera, P., Župčanová, A., Hříbek, P., Arellano, J. B., Vácha, F., Pšenčík, J., and Polívka, T.: Excited state properties of aryl carotenoids, Phys. Chem. Chem. Phys., 12, 3112–3120, https://doi.org/10.1039/B921384H, 2010.
Gregersen, L. H., Habicht, K. S., Peduzzi, S., Tonolla, M., Canfield, D. E., Miller, M., Cox, R. P., and Frigaard, N.-U.: Dominance of a clonal green sulfur bacterial population in a stratified lake: Clonal dominance in microbial lake community, FEMS Microbiol. Ecol., 70, 30–41, https://doi.org/10.1111/j.1574-6941.2009.00737.x, 2009.
Habicht, K. S., Miller, M., Cox, R. P., Frigaard, N. U., Tonolla, M., Peduzzi, S., Falkenby, L. G., and Andersen, J. S.: Comparative proteomics and activity of a green sulfur bacterium through the water column of Lake Cadagno, Switzerland, Environ. Microbiol., 13, 203–215, https://doi.org/10.1111/j.1462-2920.2010.02321.x, 2011.
Halm, H., Musat, N., Lam, P., Langlois, R., Musat, F., Peduzzi, S., Lavik, G., Schubert, C. J., Sinha, B., LaRoche, J., and Kuypers, M. M. M.: Co-occurrence of denitrification and nitrogen fixation in a meromictic lake, Lake Cadagno (Switzerland), Environ. Microbiol., 11, 1945–1958, https://doi.org/10.1111/j.1462-2920.2009.01917.x, 2009.
Heiri, O., Ilyashuk, B., Millet, L., Samartin, S., and Lotter, A. F.: Stacking of discontinuous regional palaeoclimate records: Chironomid-based summer temperatures from the Alpine region, Holocene, 25, 137–149, https://doi.org/10.1177/0959683614556382, 2015.
Hopmans, E. C., Schouten, S., Rijpstra, W. I. C., and Sinninghe Damsté, J. S.: Identification of carotenals in sediments, Org. Geochem., 36, 485–495, https://doi.org/10.1016/j.orggeochem.2004.10.001, 2005.
Hubas, C., Jesus, B., Passarelli, C., and Jeanthon, C.: Tools providing new insight into coastal anoxygenic purple bacterial mats: Review and perspectives, Res. Microbiol., 162, 858–868, https://doi.org/10.1016/j.resmic.2011.03.010, 2011.
Itoh, N., Tani, Y., Nagatani, T., and Soma, M.: Phototrophic activity and redox condition in Lake Hamana, Japan, indicated by sedimentary photosynthetic pigments and molybdenum over the last ∼ 250 years, J. Paleolimnol., 29, 403–422, https://doi.org/10.1023/A:1024407210928, 2003.
Leavitt, P. R. and Hodgson, D. A.: Sedimentary Pigments, in: Tracking environmental change using lake sediments, Springer, Dordrecht, 295–325, https://doi.org/10.1007/0-306-47668-1_15, 2002.
Makri, S., Rey, F., Gobet, E., Gilli, A., Tinner, W., and Grosjean, M.: Early human impact in a 15,000-year high-resolution hyperspectral imaging record of paleoproduction and anoxia from a varved lake in Switzerland, Quaternary Sci. Rev., 239, 106335, https://doi.org/10.1016/j.quascirev.2020.106335, 2020.
Manske, A. K., Glaeser, J., Kuypers, M. M. M., and Overmann, J.: Physiology and Phylogeny of Green Sulfur Bacteria Forming a Monospecific Phototrophic Assemblage at a Depth of 100 Meters in the Black Sea, Appl. Environ. Microbiol., 71, 8049–8060, https://doi.org/10.1128/AEM.71.12.8049-8060.2005, 2005.
Michelutti, N. and Smol, J. P.: Visible spectroscopy reliably tracks trends in paleo-production, J. Paleolimnol., 56, 253–265, https://doi.org/10.1007/s10933-016-9921-3, 2016.
Naeher, S., Suga, H., Ogawa, N. O., Takano, Y., Schubert, C. J., Grice, K., and Ohkouchi, N.: Distributions and compound-specific isotopic signatures of sedimentary chlorins reflect the composition of photoautotrophic communities and their carbon and nitrogen sources in Swiss lakes and the Black Sea, Chem. Geol., 443, 198–209, https://doi.org/10.1016/j.chemgeo.2016.04.029, 2016.
Namsaraev, Z. B.: Application of extinction coefficients for quantification of chlorophylls and bacteriochlorophylls, Microbiology, 78, 794–797, https://doi.org/10.1134/S0026261709060174, 2009.
Oelze, J.: Analysis of bacteriochlorophylls, Meth. Microbiol., 18, 257–284, https://doi.org/10.1016/S0580-9517(08)70478-1, 1985.
Oren, A.: Characterization of Pigments of Prokaryotes and Their Use in Taxonomy and Classification, Meth. Microbiol., 38, 261–282, https://doi.org/10.1016/B978-0-12-387730-7.00012-7, 2011.
Overmann, J., Cypionka, H., and Pfennig, N.: An extremely low-light adapted phototrophic sulfur bacterium from the Black Sea, Limnology and Oceanography, 37, 150–155, https://doi.org/10.4319/lo.1992.37.1.0150, 1992.
Peduzzi, S., Welsh, A., Demarta, A., Decristophoris, P., Peduzzi, R., Hahn, D., and Tonolla, M.: Thiocystis chemoclinalis sp. nov. and Thiocystis cadagnonensis sp. nov., motile purple sulfur bacteria isolated from the chemocline of a meromictic lake, Int. J. Syst. Evol. Micr., 61, 1682–1687, https://doi.org/10.1099/ijs.0.010397-0, 2011.
Peduzzi, S., Storelli, N., Welsh, A., Peduzzi, R., Hahn, D., Perret, X., and Tonolla, M.: Candidatus “Thiodictyon syntrophicum”, sp. nov., a new purple sulfur bacterium isolated from the chemocline of Lake Cadagno forming aggregates and specific associations with Desulfocapsa sp., Syst. Appl. Microbiol., 35, 139–144, https://doi.org/10.1016/j.syapm.2012.01.001, 2012.
Picazo, A., Rochera, C., Vicente, E., Miracle, M. R., and Camacho, A.: Spectrophotometric methods for the determination of photosynthetic pigments in stratified lakes: a critical analysis based on comparisons with HPLC determinations in a model lake, Limnetica, 32, 139–158, https://doi.org/10.23818/limn.32.13, 2011.
Posth, N. R., Bristow, L. A., Cox, R. P., Habicht, K. S., Danza, F., Tonolla, M., Frigaard, N.-U., and Canfield, D. E.: Carbon isotope fractionation by anoxygenic phototrophic bacteria in euxinic Lake Cadagno, Geobiology, 15, 798–816, https://doi.org/10.1111/gbi.12254, 2017.
Ravasi, D. F., Peduzzi, S., Guidi, V., Peduzzi, R., Wirth, S. B., Gilli, A., and Tonolla, M.: Development of a real-time PCR method for the detection of fossil 16S rDNA fragments of phototrophic sulfur bacteria in the sediments of Lake Cadagno, Geobiology, 10, 196–204, https://doi.org/10.1111/j.1472-4669.2012.00326.x, 2012.
R Core Team: R: A language and environment for statistical computing, R Foundation for Statistical Computing, Vienna, Austria, https://www.R-project.org/ (last access: 15 June 2023), 2022.
Rein, B. and Sirocko, F.: In-situ reflectance spectroscopy – Analysing techniques for high-resolution pigment logging in sediment cores, Int. J. Earth Sci., 91, 950–954, https://doi.org/10.1007/s00531-002-0264-0, 2002.
Repeta, D. J., Simpson, D. J., Jorgensen, B. B., and Jannasch, H. W.: Evidence for anoxygenic photosynthesis from the distribution of bacterio-chlorophylls in the Black Sea, Nature, 342, 69–72, https://doi.org/10.1038/342069a0, 1989.
Sabatier, P., Moernaut, J., Bertrand, S., Van Daele, M., Kremer, K., Chaumillon, E., and Arnaud, F.: A Review of Event Deposits in Lake Sediments, Quaternary, 5, 34, https://doi.org/10.3390/quat5030034, 2022.
Sanchini, A. and Grosjean, M.: Quantification of chlorophyll a, chlorophyll b and pheopigments a in lake sediments through deconvolution of bulk UV–VIS absorption spectra, J. Paleolimnol., 64, 243–256, https://doi.org/10.1007/s10933-020-00135-z, 2020.
Schanz, F. and Stalder, S.: Phytoplankton summer dynamics and sedimentation in the thermally stratified Lake Cadagno, in: Lake Cadagno: a meromictic alpine lake, edited by: Peduzzi, R., Bachofen, R., and Tonolla, M., Documenta dell'Istituto di Idrobiologia 63, 71–76, 1998.
Schimmelpfennig, I., Schaefer, J. M., Lamp, J., Godard, V., Schwartz, R., Bard, E., Tuna, T., Akçar, N., Schlüchter, C., Zimmerman, S., and Team, A.: Glacier response to Holocene warmth inferred from in situ Be and 14C bedrock analyses in Steingletscher's forefield (central Swiss Alps), 18, 23–44, https://doi.org/10.5194/cp-18-23-2022, 2022.
Schnellmann, M., Anselmetti, F. S., Giardini, D., McKenzie, J. A., and Ward, S. N.: Prehistoric earthquake history revealed by lacustrine slump deposits, Geology, 30, 1131–1134, 2002.
Sinninghe Damsté, J. S. and Schouten, S.: Biological markers for anoxia in the photic zone of the water column, in: Handbook of Environmental Chemistry, Volume 2: Reactions and Processes, Springer-Verlag, Berlin, Heidelberg, 127–163, https://doi.org/10.1007/698_2_005, 2006.
Taniguchi, M. and Lindsey, J. S.: Absorption and Fluorescence Spectral Database of Chlorophylls and Analogues, Photochem. Photobiol., 97, 136–165, https://doi.org/10.1111/PHP.13319, 2021.
Tonolla, M., Peduzzi, R., and Hahn, D.: Long-Term Population Dynamics of Phototrophic Sulfur Bacteria in the Chemocline of Lake Cadagno, Switzerland, Appl. Environ. Microb., 71, 3544–3550, https://doi.org/10.1128/AEM.71.7.3544-3550.2005, 2005.
Tonolla, M., Storelli, N., Danza, F., Ravasi, D., Peduzzi, S., Posth, N. R., Cox, R. P., Jørgensen, M. F., Gregersen, L. H., Daugbjerg, N., and Frigaard, N.-U.: Lake Cadagno: Microbial Life in Crenogenic Meromixis, in: Ecology of Meromictic Lakes, edited by: Gulati, R. D., Zadereev, E. S., and Degermendzhi, A. G., Springer International Publishing, Cham, 155–186, https://doi.org/10.1007/978-3-319-49143-1_7, 2017.
Tu, L., Gilli, A., Lotter, A. F., Vogel, H., Moyle, M., Boyle, J. F., and Grosjean, M.: The nexus among long-term changes in lake primary productivity, deep-water anoxia, and internal phosphorus loading, explored through analysis of a 15,000-year varved sediment record, Global Planet. Change, 103643, https://doi.org/10.1016/j.gloplacha.2021.103643, 2021.
Van Gemerden, H. and Mas, J.: Ecology of phototrophic sulfur bacteria, in: Anoxygenic photosynthetic bacteria, edited by: Blankenship, R. E., Madigan, M. T., and Bauer, C. E., Springer, Dordrecht, 49–85, https://doi.org/10.1007/0-306-47954-0, 1995.
Vescovi, E., Tinner, W., Beer, R., Van Leeuwen, J. F. N., Steinhauser, U., Ziegler, S., Gilli, A., Wirth, S. B., Samartin, S., Jacquat, C., and Carraro, G.: Vegetation History of the Upper Leventina Valley from Neolithic to Roman Times, Recorded by Pollen, Spores, Plant Macrofossils, and Charcoal, in: The Leventina Prehistoric Landscape (Alpine Ticino Valley, Switzerland), Vol. 12, edited by: Della Casa, P., Chronos, Zurich, Switzerland, 372, https://doi.org/10.7892/BORIS.117142, 2018.
Wirth, S. B., Gilli, A., Niemann, H., Dahl, T. W., Ravasi, D., Sax, N., Hamann, Y., Peduzzi, R., Peduzzi, S., Tonolla, M., Lehmann, M. F., and Anselmetti, F. S.: Combining sedimentological, trace metal (Mn, Mo) and molecular evidence for reconstructing past water-column redox conditions: The example of meromictic Lake Cadagno (Swiss Alps), Geochim. Cosmochim. Ac., 120, 220–238, https://doi.org/10.1016/j.gca.2013.06.017, 2013.
Zander, P. D., Żarczyński, M., Vogel, H., Tylmann, W., Wacnik, A., Sanchini, A., and Grosjean, M.: A high-resolution record of Holocene primary productivity and water-column mixing from the varved sediments of Lake Żabińskie, Poland, Sci. Total Environ., 755, 143713, https://doi.org/10.1016/j.scitotenv.2020.143713, 2021.
Zander, P. D., Wienhues, G., and Grosjean, M.: Scanning Hyperspectral Imaging for In Situ Biogeochemical Analysis of Lake Sediment Cores: Review of Recent Developments, Journal of Imaging, 8, 58, https://doi.org/10.3390/jimaging8030058, 2022.
Zander, P. D., Wirth, S. B., Gilli, A., Peduzzi, S., and Grosjean, M.: Lake Cadagno sediment core hyperspectral imaging and pigment data tables (Version 1), Zenodo [data set], https://doi.org/10.5281/zenodo.7573508, 2023.