the Creative Commons Attribution 4.0 License.
the Creative Commons Attribution 4.0 License.
 | 15 May 2024
A survey of methane point source emissions from coal mines in Shanxi province of China using AHSI on board Gaofen-5B
Zhonghua He
Miao Liang
Satellite-based detection of methane (CH4) point sources is crucial in identifying and mitigating anthropogenic emissions of CH4, a potent greenhouse gas. Previous studies have indicated the presence of CH4 point source emissions from coal mines in Shanxi, China, which is an important source region with large CH4 emissions, but a comprehensive survey has remained elusive. This study aims to conduct a survey of CH4 point sources over Shanxi's coal mines based on observations of the Advanced Hyperspectral Imager (AHSI) on board the Gaofen-5B satellite (GF-5B/AHSI) between 2021 and 2023. The spectral shift in centre wavelength and change in full width at half-maximum (FWHM) from the nominal design values are estimated for all spectral channels, which are used as inputs for retrieving the enhancement of the column-averaged dry-air mole fraction of CH4 (ΔXCH4) using a matched-filter-based algorithm. Our results show that the spectral calibration on GF-5B/AHSI reduced estimation biases of the emission flux rate by up to 5.0 %. We applied the flood-fill algorithm to automatically extract emission plumes from ΔXCH4 maps. We adopted the integrated mass enhancement (IME) model to estimate the emission flux rate values from each CH4 point source. Consequently, we detected CH4 point sources in 32 coal mines with 93 plume events in Shanxi province. The estimated emission flux rate ranges from 761.78 ± 185.00 to 12 729.12 ± 4658.13 kg h−1. Our results show that wind speed is the dominant source of uncertainty contributing about 84.84 % to the total uncertainty in emission flux rate estimation. Interestingly, we found a number of false positive detections due to solar panels that are widely spread in Shanxi. This study also evaluates the accuracy of wind fields in ECMWF ERA5 reanalysis by comparing them with a ground-based meteorological station. We found a large discrepancy, especially in wind direction, suggesting that incorporating local meteorological measurements into the study CH4 point source are important to achieve high accuracy. The study demonstrates that GF-5B/AHSI possesses capabilities for monitoring large CH4 point sources over complex surface characteristics in Shanxi.
- Article
(16404 KB) - Full-text XML
- BibTeX
- EndNote


Due to its potent radiative forcing and relatively short lifespan of about a decade, methane (CH4), the second most significant anthropogenic greenhouse gas after atmospheric carbon dioxide, is an effective target that attracts increasing attention for emission reduction and climate change mitigation (IPCC, 2021). Human-activity-related sources of atmospheric CH4 primarily include agricultural activities like livestock farming and rice cultivation, industrial products and processes such as petroleum, natural gas, and coal extraction, as well as landfills and waste management (Lu et al., 2022). Among these, industrial activities related to fossil fuel production contribute nearly 35 % to global anthropogenic CH4 emissions (Saunois et al., 2020), not only triggering the greenhouse effect but also leading to significant energy wastage (Chen et al., 2023). Methane emissions escaping from energy production activities primarily stem from industrial infrastructure emissions, such as wells, collection and compression stations, storage tanks, pipelines, and processing plants, easily forming “point sources” of CH4 emissions (Varon et al., 2019). With the destruction of geological processes involved in mining activities, the release of coalbed methane captured in coal seams and surrounding rock strata forms the point source of CH4 emission from coal mines (Zheng et al., 2019). These emission plumes of gas release from point sources contain high concentrations of CH4 over relatively small surface areas (Duren et al., 2019). The overall plumes formed by point source emissions exhibit a notable heavy-tailed distribution (Irakulis-Loitxate et al., 2021). However, due to the comprehensive effect of the emission magnitude, land cover types, and wind speed and direction, these plumes often show different characteristics across different time and space changes (Sánchez-García et al., 2022), which makes the plume detection and emission estimation challenging. Given that such emissions contribute significantly to regional CH4 emissions (Frankenberg et al., 2016), it is important to have accurate detection and estimation. As atmospheric CH4 is colourless and odourless, coupled with the strong uncertainty in the temporal and spatial distribution of point source emissions, satellite remote sensing using high-resolution spectroscopy has become a crucial means for detecting CH4 point source emissions due to its high sensitivity, wide coverage, and high revisit capabilities (Pandey et al., 2021).
Satellite observations for detecting global atmospheric CH4 concentrations with high spatiotemporal resolution provide data support for accounting and assessing reduction measures (Jacob et al., 2022). Satellite detection and quantification of CH4 super-emitters were first demonstrated in the 2015 Aliso Canyon blowout incident using the Hyperion Imaging Spectrometer on board EO-1 (Thompson et al., 2016). Satellites with high spatial resolution but with moderate spectral resolution have successfully detected and traced CH4 point source emissions. The current in-orbit satellites include GHGSat operated by a private company in Canada (2016–present; Jervis et al., 2021), Italy's PRISMA (2019–present; Guanter et al., 2021), China's Gaofen-5B (GF-5) and ZY-1 satellites (Irakulis-Loitxate et al., 2021), NASA's EMIT (Thorpe et al., 2023), and the German EnMAP mission (Guanter et al., 2015). While multispectral (Landsat 8/9, Sentinel-2, and WorldView-3) and coarse-resolution, high-spectral satellites (Sentinel-5P TROPOMI) have also been widely validated for detecting extra-large CH4 plumes (Ehret et al., 2022; Varon et al., 2021; Sánchez-Garcia et al., 2022; Lauvaux et al., 2022), limitations in spectral or spatial resolution result in differences in detection sensitivity, estimation uncertainty, and tracing capabilities. The first-generation Advanced Hyperspectral Imager (AHSI) on board China's GF-5A (GF-5A/AHSI) exhibits high capabilities in detecting CH4 point source emissions. As shown in Irakulis-Loitxate et al. (2021), 37 unexpected emission point sources exceeding 500 kg h−1 can be identified in the Permian Basin oil and gas fields using a total of 30 images from GF-5A and PRISMA satellites during several days in 2019 and 2020, illustrating the potential of AHSI in regional CH4 point source survey. To estimate emissions from CH4 point source, these studies typically employ spectral matching filtering method to derive CH4 increment (XCH4) and then estimate flux rate using integrated mass enhancement (IME) model (Varon et al., 2018). These studies have previously provided available techniques in the identification of point sources on local or national scales (e.g. Algeria, Permian, China, and USA) and flux estimation and uncertainty analyses for these point sources (Guanter et al., 2021; Irakulis-Loitxate et al., 2021).
As the world's largest coal producer, China contributes 50.7 % of the global coal production in 2020, making it one of the largest emitters of CH4 from coal mining (Z. Chen et al., 2022), especially in Shanxi province, where most underground coal mines are located (Qin et al., 2023). However, due to the influence of complex surface conditions on the background spectral characteristics, satellite observations exhibit notably lower sensitivity in the detection of CH4 point source emissions in Shanxi compared to other regions with more homogeneous land surfaces (Sánchez-García et al., 2022; Guanter et al., 2021). In addition, the wind fields from reanalysis datasets may be subject to high uncertainty due to the complex terrain in Shanxi, leading to highly uncertain emission flux rate estimation (Jongaramrungruang et al., 2021). Although TROPOMI (TROPOspheric Monitoring Instrument) imagery and convolutional neural networks have been shown to effectively detect potential large CH4 emission point sources globally (Schuit et al., 2023), the specific localisation and tracing of CH4 emission point sources in China remain difficult due to the limitations of coarse spatial resolution and complex regional backgrounds, warranting further surveying efforts.
This study aims to conduct a survey of the CH4 point source plumes in Shanxi by developing a framework to detect and estimate emissions flux rate using the latest hyperspectral observations from GF-5B/AHSI from 2021 to 2023. Specifically, this study focuses on (1) quantifying the impact of the shift in spectral wavelength and the change in spectral instrument line shape (ILS) from the nominal design values for the spectral channels of GF-5/AHSI on CH4 retrieval and emission estimation, (2) identifying CH4 point source plumes using the matched-filter method, (3) automating the segmentation of emission plumes from the retrieved CH4 enhancement maps, (4) estimating emissions flux rate from point sources using IME method, and (5) understanding the spatial and temporal patterns of CH4 emissions from point sources in Shanxi.
2.1 Study area
Shanxi province is the most extensively mined region in China, harbouring nearly half of the nation's suspected point sources based on TROPOMI observations (Schuit et al., 2023). It stands as a typical area for CH4 point source emissions in China and has been a focal point in prior comparative studies on point source emissions (Sánchez-Garcia et al., 2022; Guanter et al., 2021). Shanxi province (Fig. 1), situated in northern China, experiences a temperate continental monsoon climate characterised by cold, dry winters and hot, humid summers. The region boasts diverse topography, comprising mountains, plateaus, and basins. Consequently, the stable atmospheric conditions during winter can lead to the accumulation of pollutants closer to the ground, impacting the detection of CH4 emissions. Although the region has strict rules in regulating the process of CH4, a byproduct of coal mining, underground coal mines in Shanxi release CH4 to the atmosphere from mine venting. Therefore, the identification of these plumes will help mitigate CH4 emissions over this region.
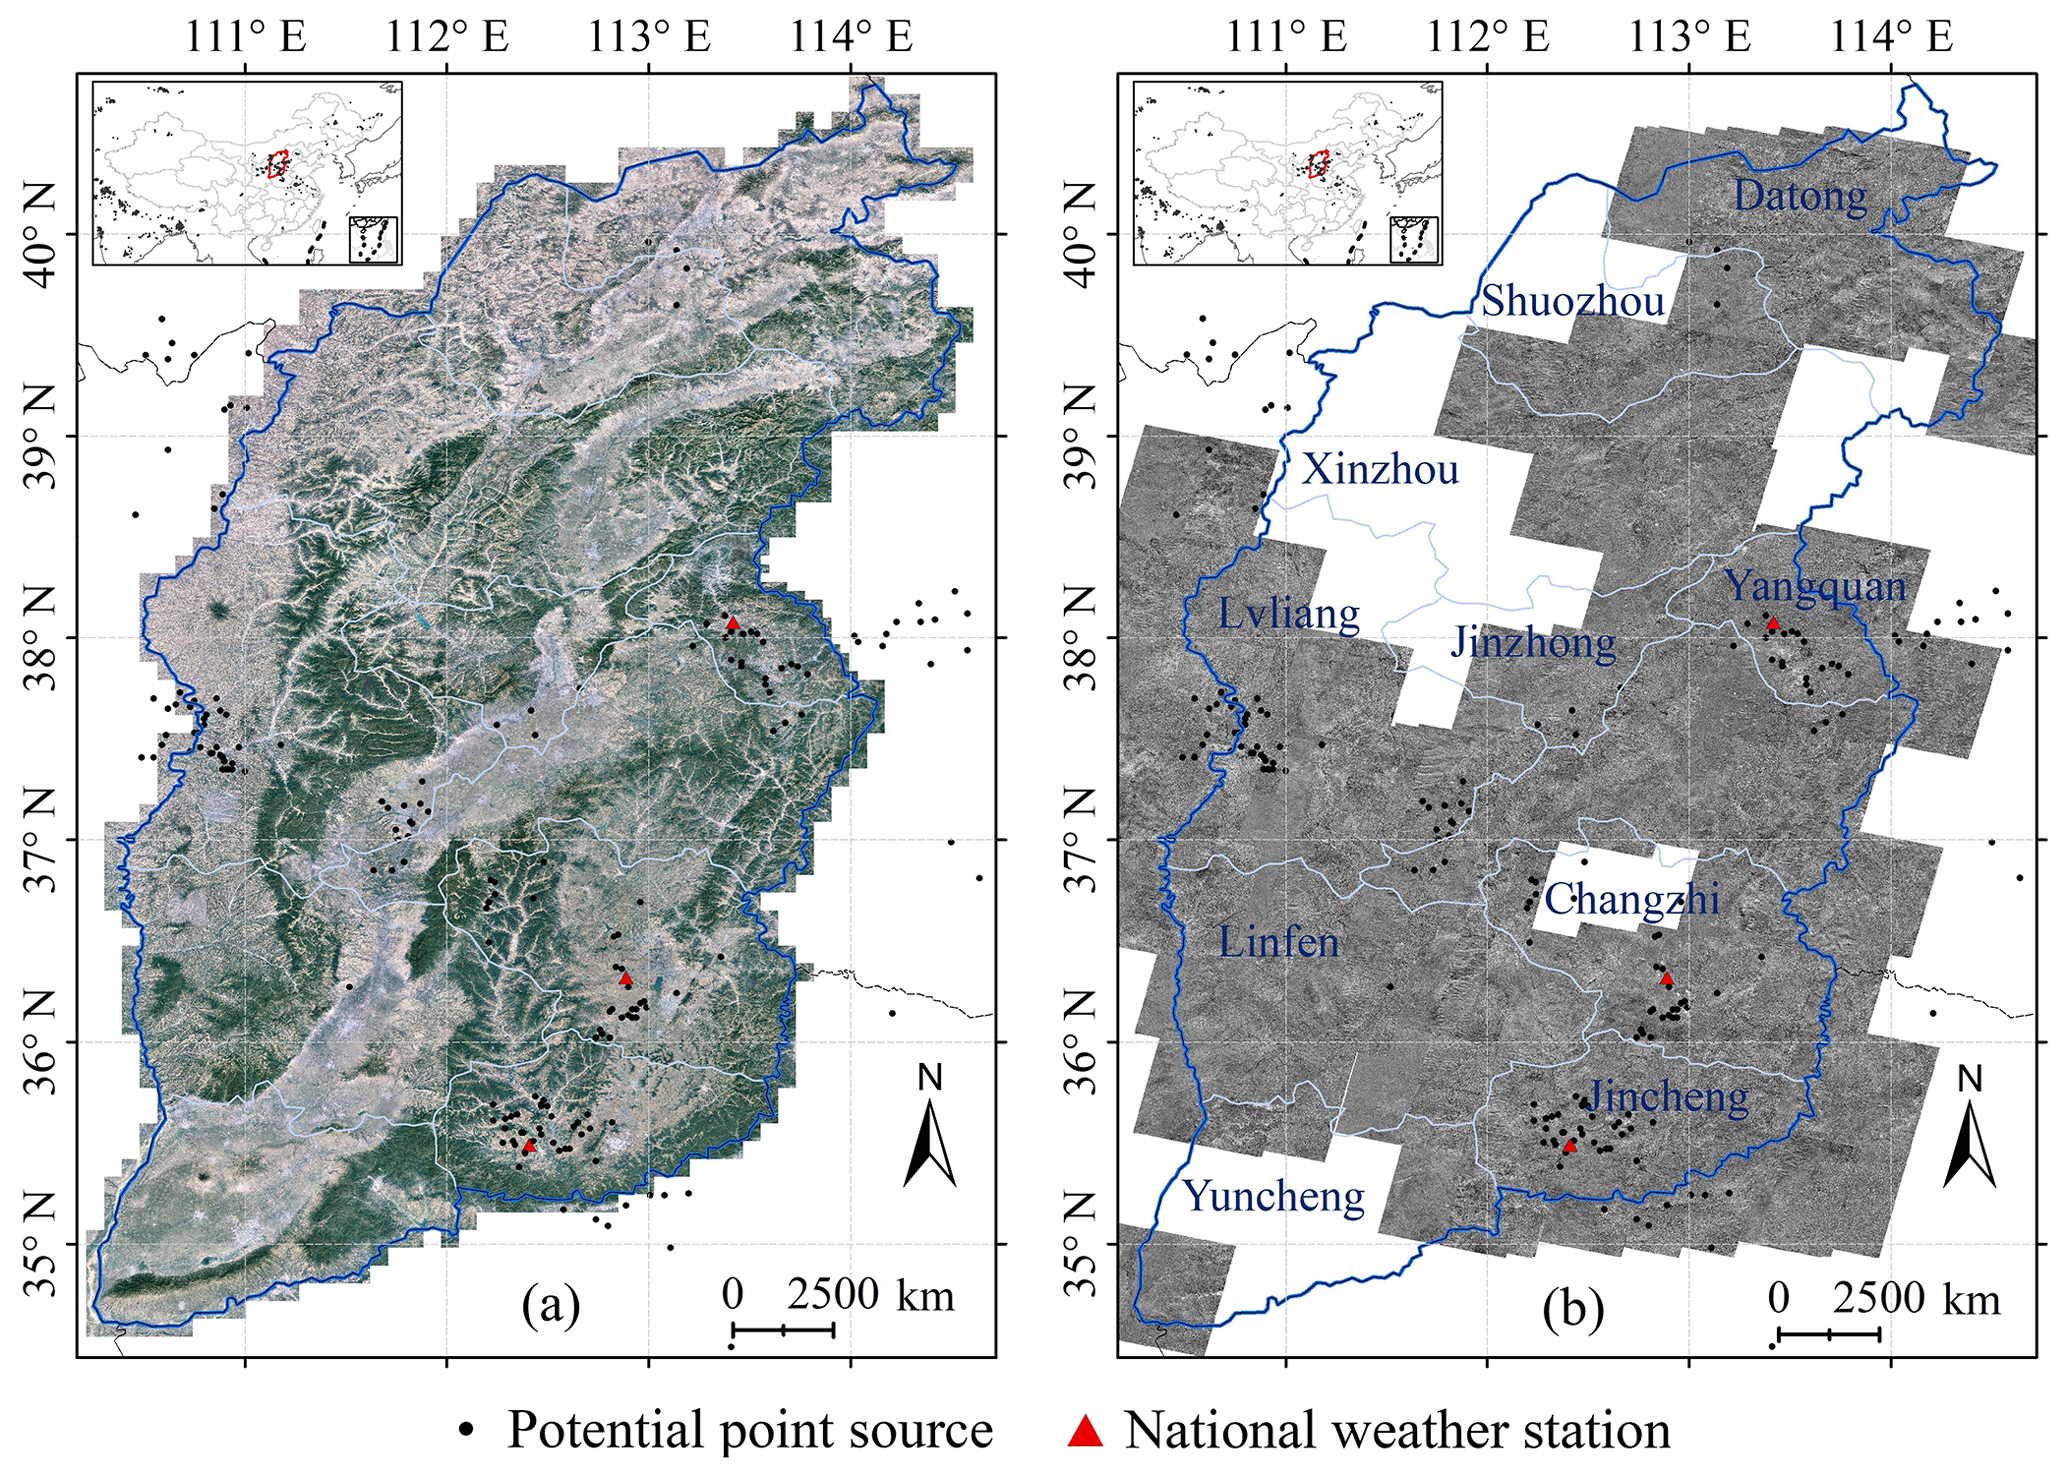
Figure 1(a) The study area in Shanxi enclosed by the blue boundary, with the background image from © Google Maps. (b) Gaofen-5B observed scene images used for the CH4 plume survey. The black dots represent the potential point sources detected by TROPOMI (Schuit et al., 2023). The red dots represent the three national weather stations for monitoring meteorological variables in Yangquan, Changzhi, and Jincheng that are used for the wind field comparison with ERA5 reanalysis (Sect. 4.3).
2.2 GF-5B/AHSI dataset
The GF-5B satellite is the second satellite of the Gaofen-5 series and was launched on 7 September 2021. It has accumulated over 2 years' worth of global observational data to date. Equipped with the Advanced Hyperspectral Imager (AHSI), it can capture spectral information spanning 400 to 2500 nm, with a spatial resolution of 30 m over a 60 km swath, encompassing 330 spectral channels with spectral resolutions of 5 and 10 nm in the visible near-infrared (VNIR) and short-wave infrared (SWIR) spectroscopy, respectively (Y.-N. Liu et al., 2019). Its relatively high signal-to-noise ratio (around 500 in the SWIR) presents notable advantages in detecting CH4 point source emissions (Irakulis-Loitxate et al., 2021). The retrieval of the enhancement of column-averaged dry-air mole fraction of CH4 (ΔXCH4) relies primarily on strong CH4 absorption features near 2300 nm, while the 2100 to 2450 nm spectral window of the GF-5B/AHSI demonstrates higher sensitivity to XCH4 variations, thereby possessing enhanced capabilities for precise CH4 concentration inversion. This study focuses on Shanxi province, using images from 111 GF-5B/AHSI scenes covering suspected point sources from September 2021 to September 2023, with a cloud cover of less than 10 %, employed for ΔXCH4 inversion and point source identification (Fig. 1b). These images cover the major emission hotspots, as identified by TROPOMI data (Schuit et al., 2023). Noted that, in Shanxi, the overpassing time of GF-5/AHSI is around 11:00–12:00 Beijing time (BJT).
The SWIR imagery in the AHSI band employs a strategic arrangement of four strips. Each SWIR strip corresponds to a 15 km ground swath, resulting in a continuous 60 km swath width across the satellite orbit with four images combined. This configuration yields a total of 2012 px (including 36 overlapped pixels) along the spatial dimension of the SWIR detectors (Y.-N. Liu et al., 2019). Therefore, the target inside the overlapped pixels could be observed twice in 8 s.
2.3 Auxiliary data
Methane point source detection and emission estimation involve various auxiliary datasets, mainly including (1) ultra-high-resolution surface imagery for checking false positive in point source detection, (2) wind fields information for estimate emissions from point source plumes, and (3) digital elevation model (DEM) data for the geometric correction of AHSI imagery. High-resolution surface imagery is an indispensable dataset in point source identification and serves as direct evidence for distinguishing interference signals. The high-resolution imagery used in this study primarily comes from Google Earth. Wind speed data are a critical parameter for calculating emission flux rates. The study utilised U10 hourly wind speed reanalysis products from ECMWF ERA5, with a spatial resolution of 0.25° × 0.25° (Muñoz-Sabater et al., 2021). Terrain data are crucial for the geometric correction of AHSI imagery, directly impacting the positioning and identification of ΔXCH4 plume signals. The study used DEM data from SRTM (Farr et al., 2007) with a spatial resolution of 30 m. Additionally, the study obtained hourly meteorology monitoring data, including wind speed and wind direction, from January 2021 to September 2023 from three national meteorological stations in Yangquan, Changzhi, and Jincheng (Fig. 1), obtained from the China Meteorological Administration Data Centre. These data were compared with ERA5's U10 hourly wind speed reanalysis products to investigate the uncertainty in the ERA5's wind field.
The retrieval of ΔXCH4 and estimation of emission flux rate from high-resolution hyperspectral data have been implemented in many previous studies (e.g. Cusworth et al., 2020; Guanter et al., 2021; Huang et al., 2020; Varon et al., 2018; Frankenberg et al., 2016) using a combination of matched-filter method and the IME model. This study primarily applies this combined approach to survey the CH4 point source emissions in Shanxi using GF-5B/AHSI. In addition, this study focuses on the quantification the impact of the spectral shift and the change in spectral ILS on the point source emission estimation, the automation of the segmentation of emission plumes from the retrieved CH4 enhancement maps, and the analysis of the spatial and temporal patterns of CH4 emissions from point sources in Shanxi.
3.1 ΔXCH4 retrieval using matched-filter method
3.1.1 Spectral calibration of GF-5B/AHSI
Spectral shift in the centre wavelength and change in full width at half-maximum (FWHM) relative to the nominal spectral calibration for spectral channels significantly affects the retrieval results of ΔXCH4 using the spectral matched-filter method (e.g. Guanter et al., 2021). The spectral shift and FWHM change vary distinctly between different image scenes. It is therefore important to re-calibrate the spectra for all channels before further analysis using the observed spectra. While GF-5B AHSI imagery has been utilised in CH4 point source detection experiments in various regions, estimation regarding its spectral offset and associated correction in FWHM has not yet been undertaken. In this study, we conduct this spectral calibration for the short-wave infrared (SWIR) channels from 2110 to 2455 nm of GF-5B/AHSI data (Guanter et al., 2009). The basic idea of the spectral calibration is to retrieve the wavelength shift and FWHM change that would lead to the best fit between observed GF-5B/AHSI spectra and the simulated spectra based on radiative transfer model. In practice, we used the forward radiative transfer model and optimal estimation method in GFIT3 (Zeng et al., 2021) to iteratively derive the spectral calibration parameters. Similar to Guanter et al. (2021), we applied the calibration to the averaged top-of-the-atmosphere radiance from all observations of each across-track detector and derive the wavelength shift and FWHM change. This calibration is repeated for all detectors and over all GF-5B/AHSI images. Eventually, the updated spectral centre wavelength and FWHM, instead of the nominal values, for all channels are used as inputs in the ΔXCH4 retrieval when the high-resolution CH4 absorption spectra is convolved with Gaussian ILS.
3.1.2 Spectral matched filter for retrieving ΔXCH4
Spectral matched-filter method derives the ΔXCH4 by calculating the difference between the “polluted” spectra over a source region with background spectra of the ambient atmosphere and expressing the difference by the number of target absorption spectrum from one unit of XCH4 (e.g. 1 ppm of XCH4; Guanter et al., 2021). The retrieval using matched filter is depicted in Eq. (1):
where x denotes a vector of the observed SWIR hyperspectral spectra from a target pixel. In this study, the CH4 strong absorption band (2110–2455 nm) is used; μ and Σ represent the mean and covariance of the SWIR hyperspectral observation over background regions, respectively. t is the target spectrum, representing the disturbance vector of SWIR hyperspectral due to enhanced XCH4 relative to the background. It can be derived from an element-wise multiplication of μ and the unit XCH4 absorption spectrum κ, which is generated from GFIT3 (Zeng et al., 2021), as shown in Fig. 2, assuming a perturbation of 1 ppm XCH4.
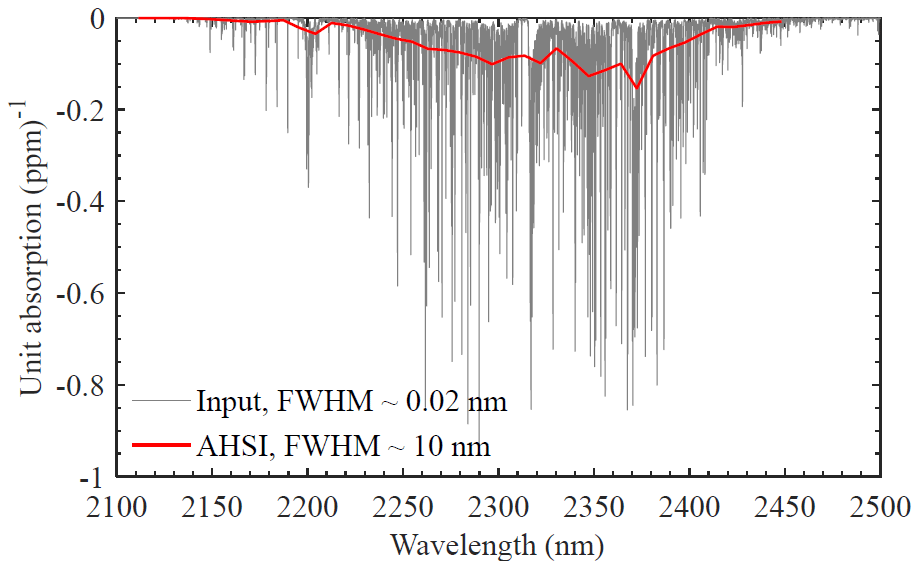
Figure 2Example of unit XCH4 absorption spectrum used as target signature in the matched-filter retrieval method. The high-resolution target signature (in grey) represents absorptivity induced by 1 ppm XCH4 enhancement, which is calculated using GFIT3 (Zeng et al., 2021). The high-resolution absorptions are then convolved with a Gaussian ILS with nominal FWHM from GF-5B/AHSI to derive the spectra (in red) that can be compared with that observed from AHSI.
3.2 Identifying point source plumes from ΔXCH4 maps
After data pre-processing, including spectral re-calibration and ΔXCH4 retrieval, we implemented a geometric localisation to change the GF-5B/AHSI imagery index for row and column pixels to latitude and longitude under WGS84 projection. The detailed description of this geometric localisation is in Appendix A. Then, this study compares the ΔXCH4 maps with high-resolution Google Earth imagery to visually inspect and preliminarily identify the CH4 point source plumes. The identification criteria include: (1) high ΔXCH4 values displaying plume characteristics, (2) the presence of ground facilities such as factories or pipelines representing potential CH4 emission sources, and (3) plume distribution characteristics not caused by terrain features that may impact short-wave infrared strong absorption in surface features. Although wind conditions directly affect plume features, however, the reanalysis data (e.g. ERA5) of the wind direction may be very different from the plume structure. Several factors could contribute to this mismatch, including the temporal and spatial resolution of the reanalysis data, local topographical features, and microscale meteorological phenomena that are not fully captured by the reanalysis data. Therefore, this study temporarily refrains from utilising wind direction from ERA5 reanalysis as a direct criterion for point source identification.
3.3 Estimation of emission flux rates
3.3.1 Automatic segmentation of ΔXCH4 plumes using flood-fill algorithm
The segmentation of ΔXCH4 plumes in previous studies has often been manually drawn, which is a laborious and time-consuming process highly influenced by subjective human judgement, leading to possible bias in IME calculations. Hence, there is a need to introduce a statistically based, relatively objective, and easy-to-implement method for ΔXCH4 plume segmentation. The flood-fill algorithm has been widely employed for segmenting and extracting continuous abnormal signals (He et al., 2018; Zscheischler et al., 2013), showing potential for ΔXCH4 plume automatic segmentation. Specifically, this study uses statistical parameters, including ΔXCH4 mean and 1 standard deviation, within the study area to segment and identify concentration-enhanced signals of ΔXCH4. It employs the flood-fill algorithm to recognise abnormal pixels in the vicinity of eight directions, merging spatially connected pixels into a plume pattern by considering the spatial continuity of plumes. To carry out the flood-fill method in plume extraction, a background region needs to be defined to calculate the mean and standard deviation of ΔXCH4, which set the basis for identifying anomalously high ΔXCH4 in the plume relative to the background. In this study, for a specific plume, the origin is first pinpointed through visual interpretation. Then a background region is defined as a square using the source origin as the centre for calculating the mean (μ) and standard deviation (σ) of ΔXCH4. Finally, a threshold defined based on μ and σ is used for the flood-fill algorithm to effectively segment the point source plume. The exact numbers for the background square length, μ and σ, are introduced in Sect. 3.3.3.
3.3.2 Estimation of CH4 point source emission flux rates
For the emission flux rate estimation, this study employs the IME model (Eq. 2; Frankenberg et al., 2016; Varon et al., 2018; Guanter et al., 2021) to calculate the excess mass of CH4 in the plumes relative to the background from the retrieved ΔXCH4 plume maps. Then the emission flux rate (Q) is calculated using Eq. (3) with inputs of wind speed and the length of the plume. These equations are
where np denotes the number of pixels in the plume; ΔXCH4(i) represents the XCH4 enhancement in pixel i; and k is the scaling factor converting ΔXCH4 from volume mixing ratio to mass based on Avogadro's law, considering the pixel resolution of GF-5B/AHSI to be 30 m. In Guanter et al. (2021), k is defined as 5.155 × 10⁻³ kg ppb−1, as derived from the surface pressure of one standard atmosphere. However, the average elevation of the identified plumes is 942.41 m (Fig. B1), whose surface pressure (900.64 hPa) is about 10 % less than one standard atmosphere. Therefore, we calculated a new k based on the derived averaged surface pressure for all the identified plumes. The derived k value (4.565 × 10⁻³ kg ppb−1) is then used for estimating IME in this study. Q denotes the point source emission rate, in unit of mass per unit time, obtained from IME calculation; () denotes the effective wind speed derived from wind speed at 10 m from ERA5 reanalysis; and L is the plume length, defined as the square root of the plume mask area (Varon et al., 2018). α and β can be determined through large-eddy simulation, based on the spatial resolution of satellite observation and ΔXCH4 retrieval accuracy from GF-5B/AHSI. In this study, we adopted the estimates (α=0.37 and β=0.64) from Li et al. (2023) derived for the Changzhi region in Shanxi. Globally, the values of α and β do not change significantly. For example, the values adopted for PRISMA (Guanter et al., 2021; Irakulis-Loitxate et al., 2021) were 0.34 and 0.44 and for GF-5B in the Permian basin (Li et al., 2023) were 0.38 and 0.41, respectively.
3.3.3 Estimation uncertainty in the point source emission flux rate
The uncertainty in point source emission flux rate typically involves two primary aspects: the IME calculation and wind speed. For the IME calculation based on the statistically driven method of flood-fill in plume extraction, the square background region and the threshold setting for plume enhancement segmentation are the main factors involved. Referring to the uncertainty assessment method by Cusworth et al. (2020), we first assess the uncertainty in the IME and then propagate the random errors in the IME and wind speed (U10) to the flux rate Q, thereby evaluating the uncertainty in the estimated emission flux rate. In practice, for estimating IME and its uncertainty for a certain plume, we used six different background square lengths (from 12 to 24 km with an interval of 2.4 km) and six different segmentation thresholds (from μ+0.45σ to μ+0.55σ, with an interval of 0.02σ) for the flood-fill segmentation method (Fig. C1). Different values of μ and σ are calculated for different background regions. This process enabled the extraction of 36 reasonable plume values, defining their mean and standard deviation as the IME estimation and its uncertainty, respectively. For the wind speed uncertainty, to be consistent with the previous study, we set it at 50 % for U10 (Cusworth et al., 2020; Guanter et al., 2021). To further understand the uncertainty in the used wind fields, in Sect. 4.3, we have carried out an evaluation of wind speeds and wind directions from ERA5 reanalysis by comparison with observations from meteorological sites in Shanxi.
4.1 Detection and estimation of emission flux rate for single CH4 point source using GF-5B/AHSI
Figure 3 demonstrates the retrieval results of point sources ΔXCH4 based on multiple capturing of the same point source using GF-5B/AHSI from January 2022 to August 2023. Under different emission flux rates and wind conditions, the emission plumes exhibited various characteristics. Six observations occurred during the winter–spring seasons (Fig. 3b–g), showing ΔXCH4 plumes spreading northeastward, while the observation in summer (Fig. 3h) displayed a plume drifting northwestward. An intriguing aspect is the occurrence of two repeated observations of the same point source within an 8 s interval (Fig. 3d, e and f, g). Theoretically, CH4 emissions from the same point source within an 8 s interval should exhibit very similar patterns. However, using the full-scene image as the background region for the background spectra calculation for each plume, similar to previous studies, the ΔXCH4 of the plumes from the same point source showed large differences, especially for Fig. 3f and g. The notable difference primarily arises from the different background used, suggesting the importance of selecting appropriate background regions. Note that the difference may also be slightly caused by the different signal-to-noise ratio (SNR), as the plumes appear at different locations in the imaging scene. The plumes appear at the bottom of the scene in Fig. D1f and at the top in Fig. D1g. They may be observed by different detectors with different SNR of the instrument that affect the detection accuracy of the plumes.
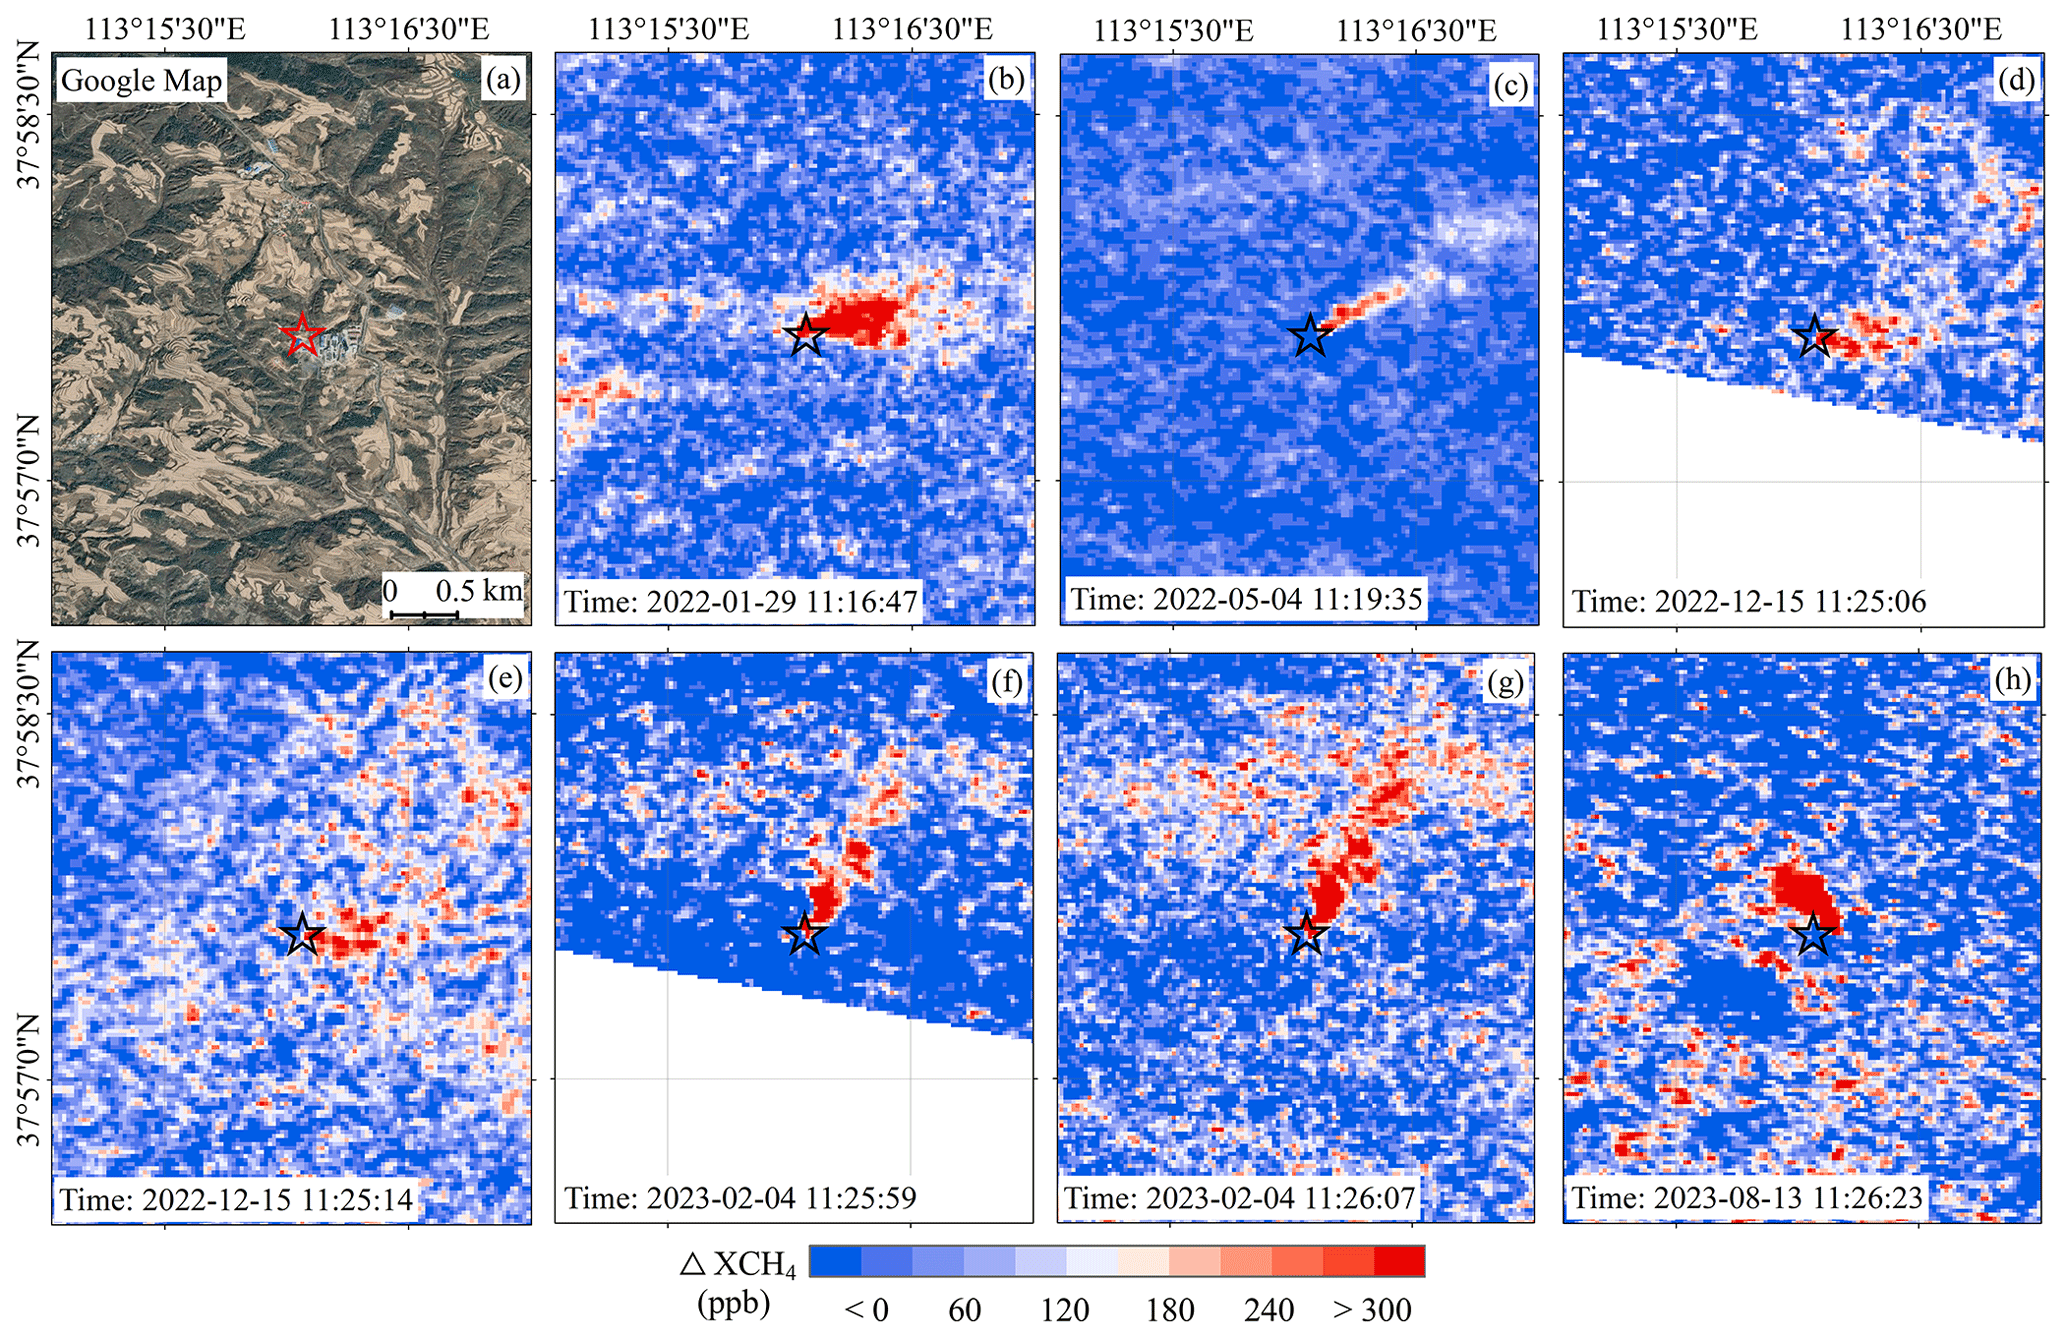
Figure 3Example of ΔXCH4 retrievals from one typical point source with multiple overpasses by GF-5B/AHSI, with its origin (lat 37°57′36′′, long 113°16′04′′) marked with a red/black star. The detected plumes from the seven overpasses shown in panels (b)–(h). The observation times (in UTC + 8, standard Beijing time) are shown for each plume event, which are close to local time. The background image in panel (a) is adopted from © Google Maps.
Based on the ΔXCH4 retrieval and the flood-fill plume segmentation method, we obtained the plume characteristics and emission flux rate of the seven detections, as shown in Fig. 4. The results indicate the following: (1) differences exist between the extracted plume features and visual segmentation. For instance, in Fig. 4c, the elaborate plume automatically extracted using flood-fill would be challenged for manually drawing; (2) the point source emission flux rate varies between 2834.79 ± 1330.98 kg h−1 in Fig. 4e and 6678.66 ± 2316.49 kg h−1 in Fig. 4g (excluding incomplete observations in Fig. 4d). Among these observations, four fall within a similar range between 2834.79 and 3247.22 kg h−1; (3) the uncertainty in the IME ranges from 5.07 % to 66.38 %, with the majority being below 30 %, which is lower than the uncertainty caused by wind speed (∼ 50 %) in the emission flux rate calculation. (4) Significant differences are evident in the plumes from adjacent detections of the same point source (e.g. Fig. 4f and g), indicating the different backgrounds chosen for different imagery scenes are not optimal to monitoring the same emission plumes.
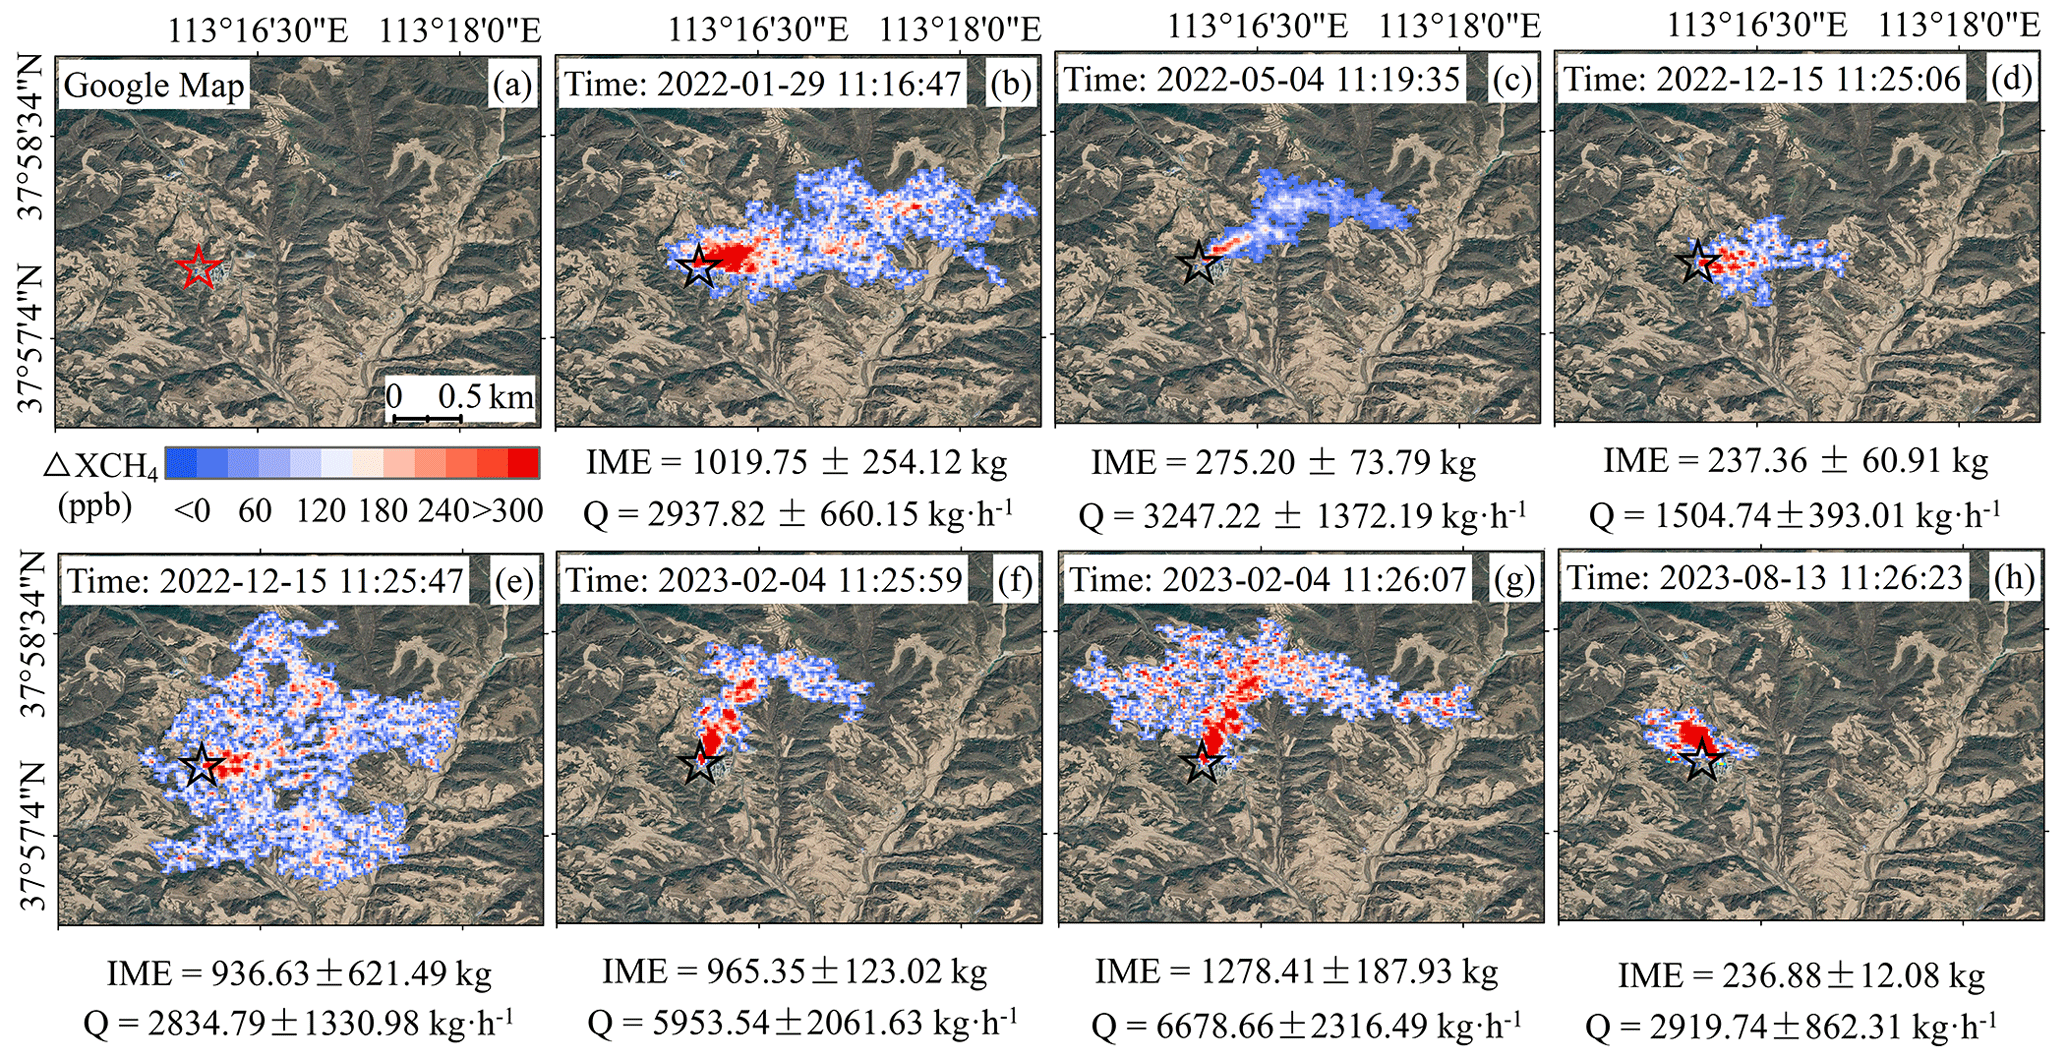
Figure 4Examples of the extracted CH4 point source, marked with red/black star (lat 37°57′36′′, long 113°16′04′′), with the plume using flood-fill method based on the retrieved ΔXCH4 maps, as shown in Fig. 3, from a single point source with multiple overpasses by GF-5B/AHSI. The plume mass from IME model and the estimated emission flux rates are also indicated at the bottom of each map. The observation time in Beijing time is shown for each plume event. All background images in panels (a)–(h) are from © Google Maps.
In order to eliminate the impact of background selection on estimating emission flux rate from the same point source, this study conducted a ΔXCH4 retrieval experiment using overlapping area in the imagery maps of Fig. 3f and g as the new background. The results based on the new backgrounds shown in Fig. 5 demonstrate highly similar ΔXCH4 plume features between the two observations that are 8 s apart (Fig. 5a and b). The extracted plume distribution and emission flux rate calculations shown in Fig. 5c and d are almost identical. The integrated enhanced masses were 1001.59 ± 13.98 and 1046.86 ± 15.20 kg, respectively, with emission flux rates of 5477.44 ± 1839.08 and 5730.52 ± 1925.58 kg h−1. This reduced estimation discrepancy between the two by 485.11 kg h−1, which is about 8.5 % of the emission flux rate. Therefore, for the calculation of emissions from all plumes in Shanxi, we adopted a two-step approach to identify CH4 plumes and estimate emissions. In step 1, the whole image is used to calculate ΔXCH4 and identify plumes; in step 2, when implementing the flood-fill method with the strategy of selecting background regions as described in Sect. 3.3.3, the ΔXCH4 is re-calculated using the same background regions for the flood-fill method. In other words, the chosen background regions are used for calculating ΔXCH4 using Eq. (1), segmenting plumes using flood-fill method, and estimating IME using Eq. (2).
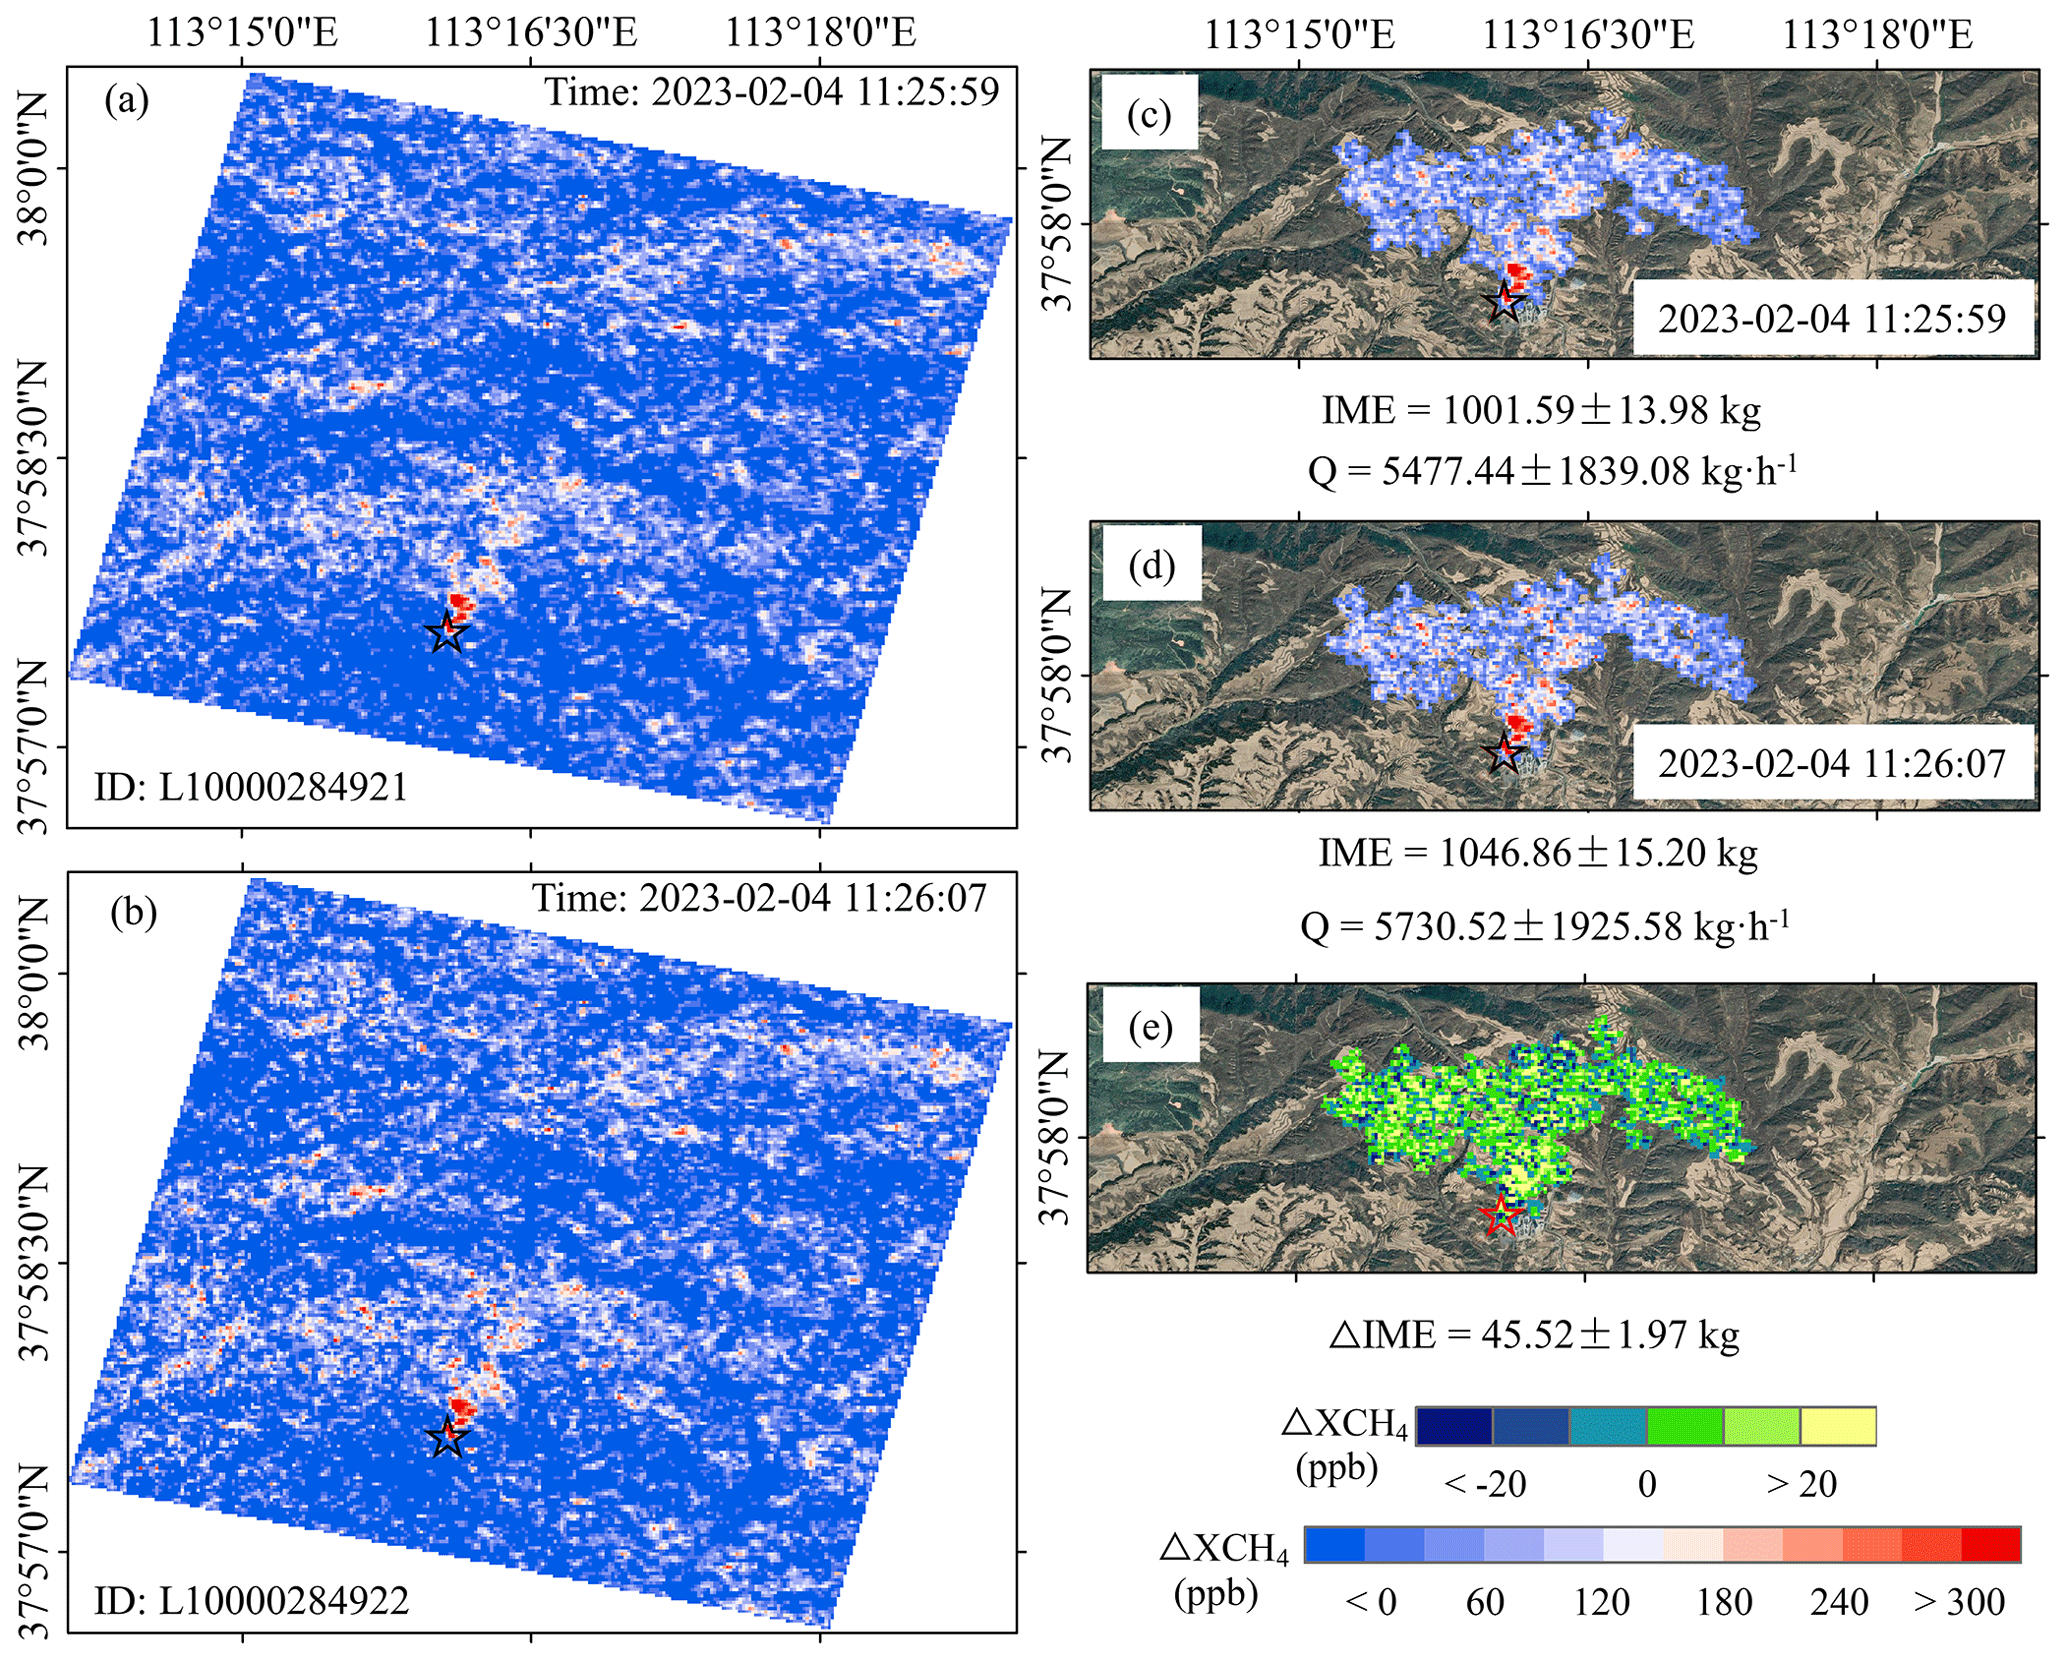
Figure 5ΔXCH4 retrievals from GF-5B/AHSI observations that are 8 s apart in panels (a) and (b) over the same point source and marked with red/black star (lat 37°57′36′′, long 113°16′04′′). The retrievals are carried out using the same background region. The corresponding IME values and emission flux rates (Q) based on the extracted ΔXCH4 maps are shown in panels (c) and (d), respectively. The difference between the two IME values is shown in panel (e). All background images in panels (c)–(e) are from © Google Maps.
4.2 Spatial distribution of point sources and their emission rates in Shanxi
Based on the methods described above for estimating the CH4 emission flux rate of point sources, we conducted a survey of all detectable point source emissions using all available imagery of GF-5B/AHSI from 2021 to 2023. In total, 93 point source plumes were identified. After averaging repetitive observations over the same point sources, a total of 32 point sources were identified, and their spatial distribution is depicted in Fig. 6. Figure 6a–i exhibit typical plume extraction results around three typical cities of Yangquan, Changzhi, and Jincheng. The emission flux rates range from 2147.08 ± 427.42 to 9198.03 ± 2059.18 kg h−1. This result demonstrates a reasonably good consistency between the spatial locations of the actual CH4 emission point sources identified in this study (red dots in Fig. 6) and those extracted based on TROPOMI data (black dots in Fig. 6), which are primarily concentrated around the three cities of Yangquan, Changzhi, and Jincheng. Given its high spatial resolution, the spatial locations derived from GF-5B/AHSI are expected to be more accurate. We found that the number of identified point sources is much fewer than those extracted from TROPOMI. This is primarily attributed to the much denser observations with daily global coverage and its different overpass time from TROPOMI (∼ 13:30 LT, local time). In addition, the high-resolution of the ΔXCH4 retrieval results helped eliminate false positive signals due to surface interference elements like photovoltaic panels (further details are discussed in Sect. 4.3.2) and greenhouse cultivation structures that are ubiquitous in Shanxi. Driven by wind speed and topography, different plumes from various point sources show distinctly varying dispersion distances, ranging from less than 1.0 km (e.g. Fig. 6h) to 5.0 km (e.g. Fig. 6d). In the calculation of emission flux rate, the plume length plays an important role in the background region selection, which affects both the inversion of ΔXCH4 (background spectra) and plume segmentation using the flood-fill algorithm (statistical parameters).
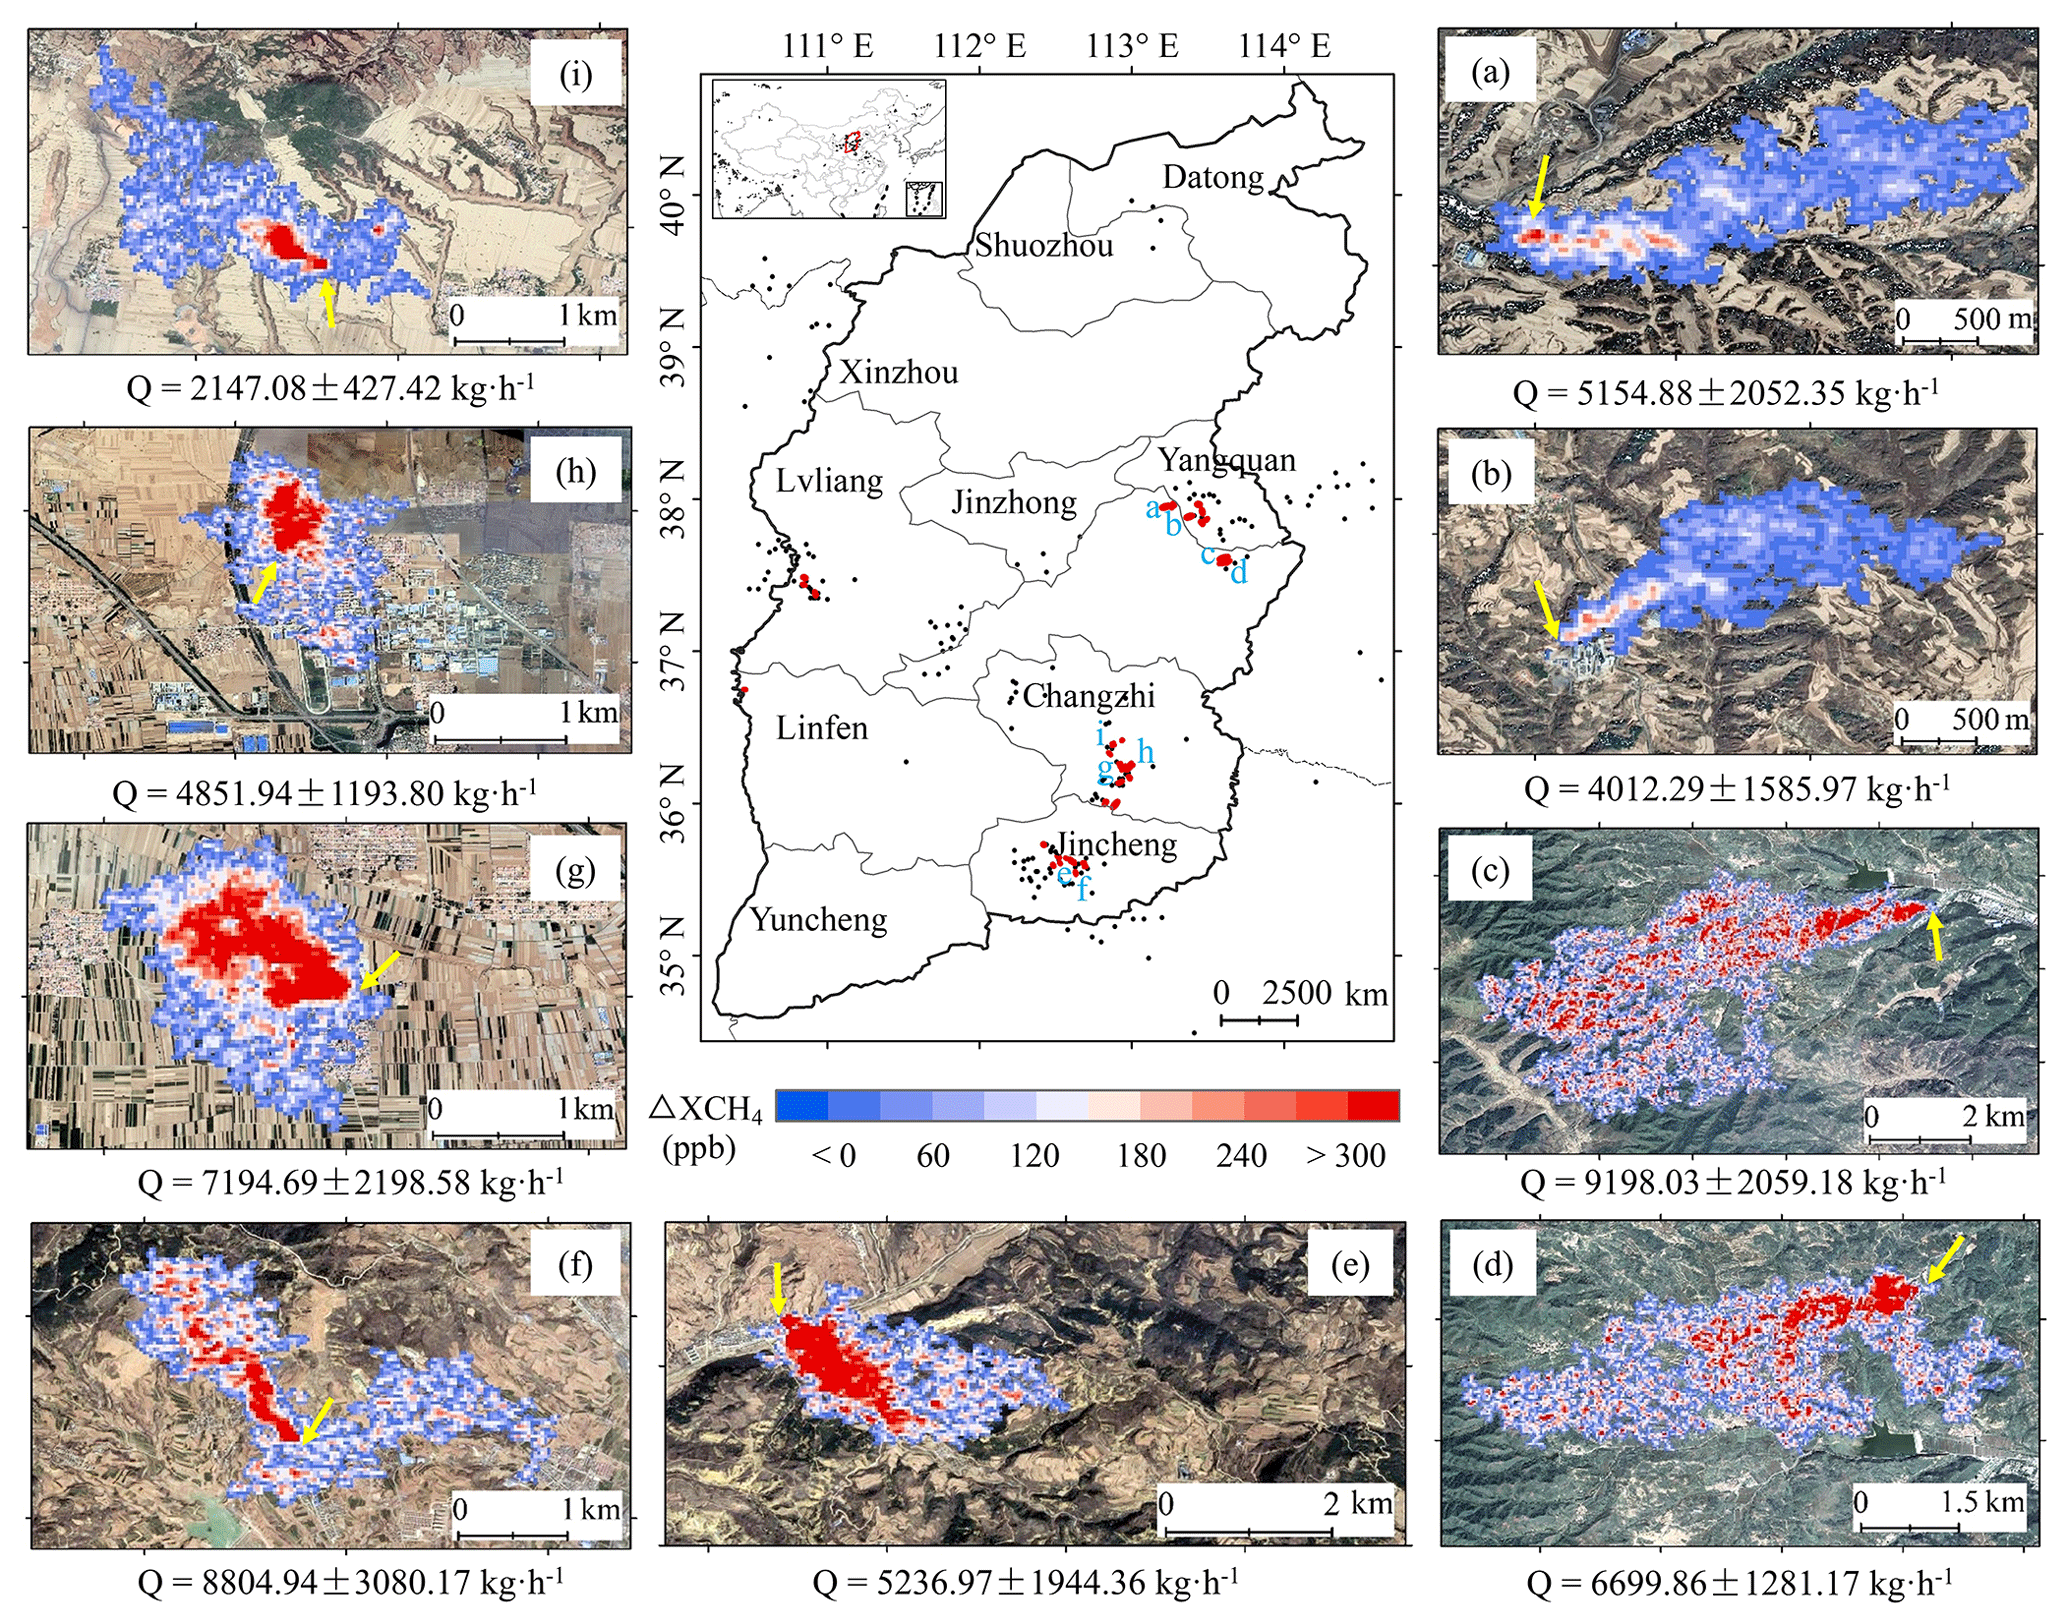
Figure 6The spatial distribution of the identified CH4 plumes (in red dots; in total 93) in Shanxi using GF-5B/AHSI observations, as shown in the centre panel. The black dots represent the potential point sources detected by TROPOMI (Schuit et al., 2023). CH4 plumes (a–i) are examples of the identified ΔXCH4 plumes in Shanxi, and the yellow arrow points to the origins of the identified point sources. All background images in panels (a)–(i) are adopted from © Google Maps.
We further conducted IME calculations and emission flux rate estimations for the 93 plumes extracted from GF-5B/AHSI (Fig. 7a and c). Additionally, based on multiple observations (from two to eight times) of the same point source, we provided the highest and lowest emission flux rates and IME for the same point source (Fig. 7b and d). The survey results revealed a diverse range of point source emission flux rates, varying from 761.78 ± 185.00 (minimum) to 12 729.12 ± 4658.13 kg h−1 (maximum), with an average of approximately 4040.30 kg h−1. The range of IME from point source emissions spans from 33.58 ± 6.27 (minimum) to 6587.50 ± 1925.31 kg (maximum). This discrepancy in the range of IME and the emission flux rates is indeed notable and can be attributed to the variability in wind conditions. Moreover, assuming a 50 % uncertainty in U10 (wind speed at 10 m), in the uncertainty calculation of Q (emission flux rate), the impact of wind speed and IME uncertainties accounts for approximately 84.84 % and 15.16 %, respectively. While it is evident that wind speed is the predominant factor contributing to the uncertainty in estimating CH4 point source emissions, it is crucial to acknowledge the significance of IME-related uncertainties. Because the wind uncertainty could be decreased significantly with accurate weather observations from high-density sites from China Meteorological Administration in theory. In addition, we should acknowledge that low wind speeds may also lead to uncertain dispersion of methane plumes, potentially biasing emission estimates, which need deeper analysis in future studies.
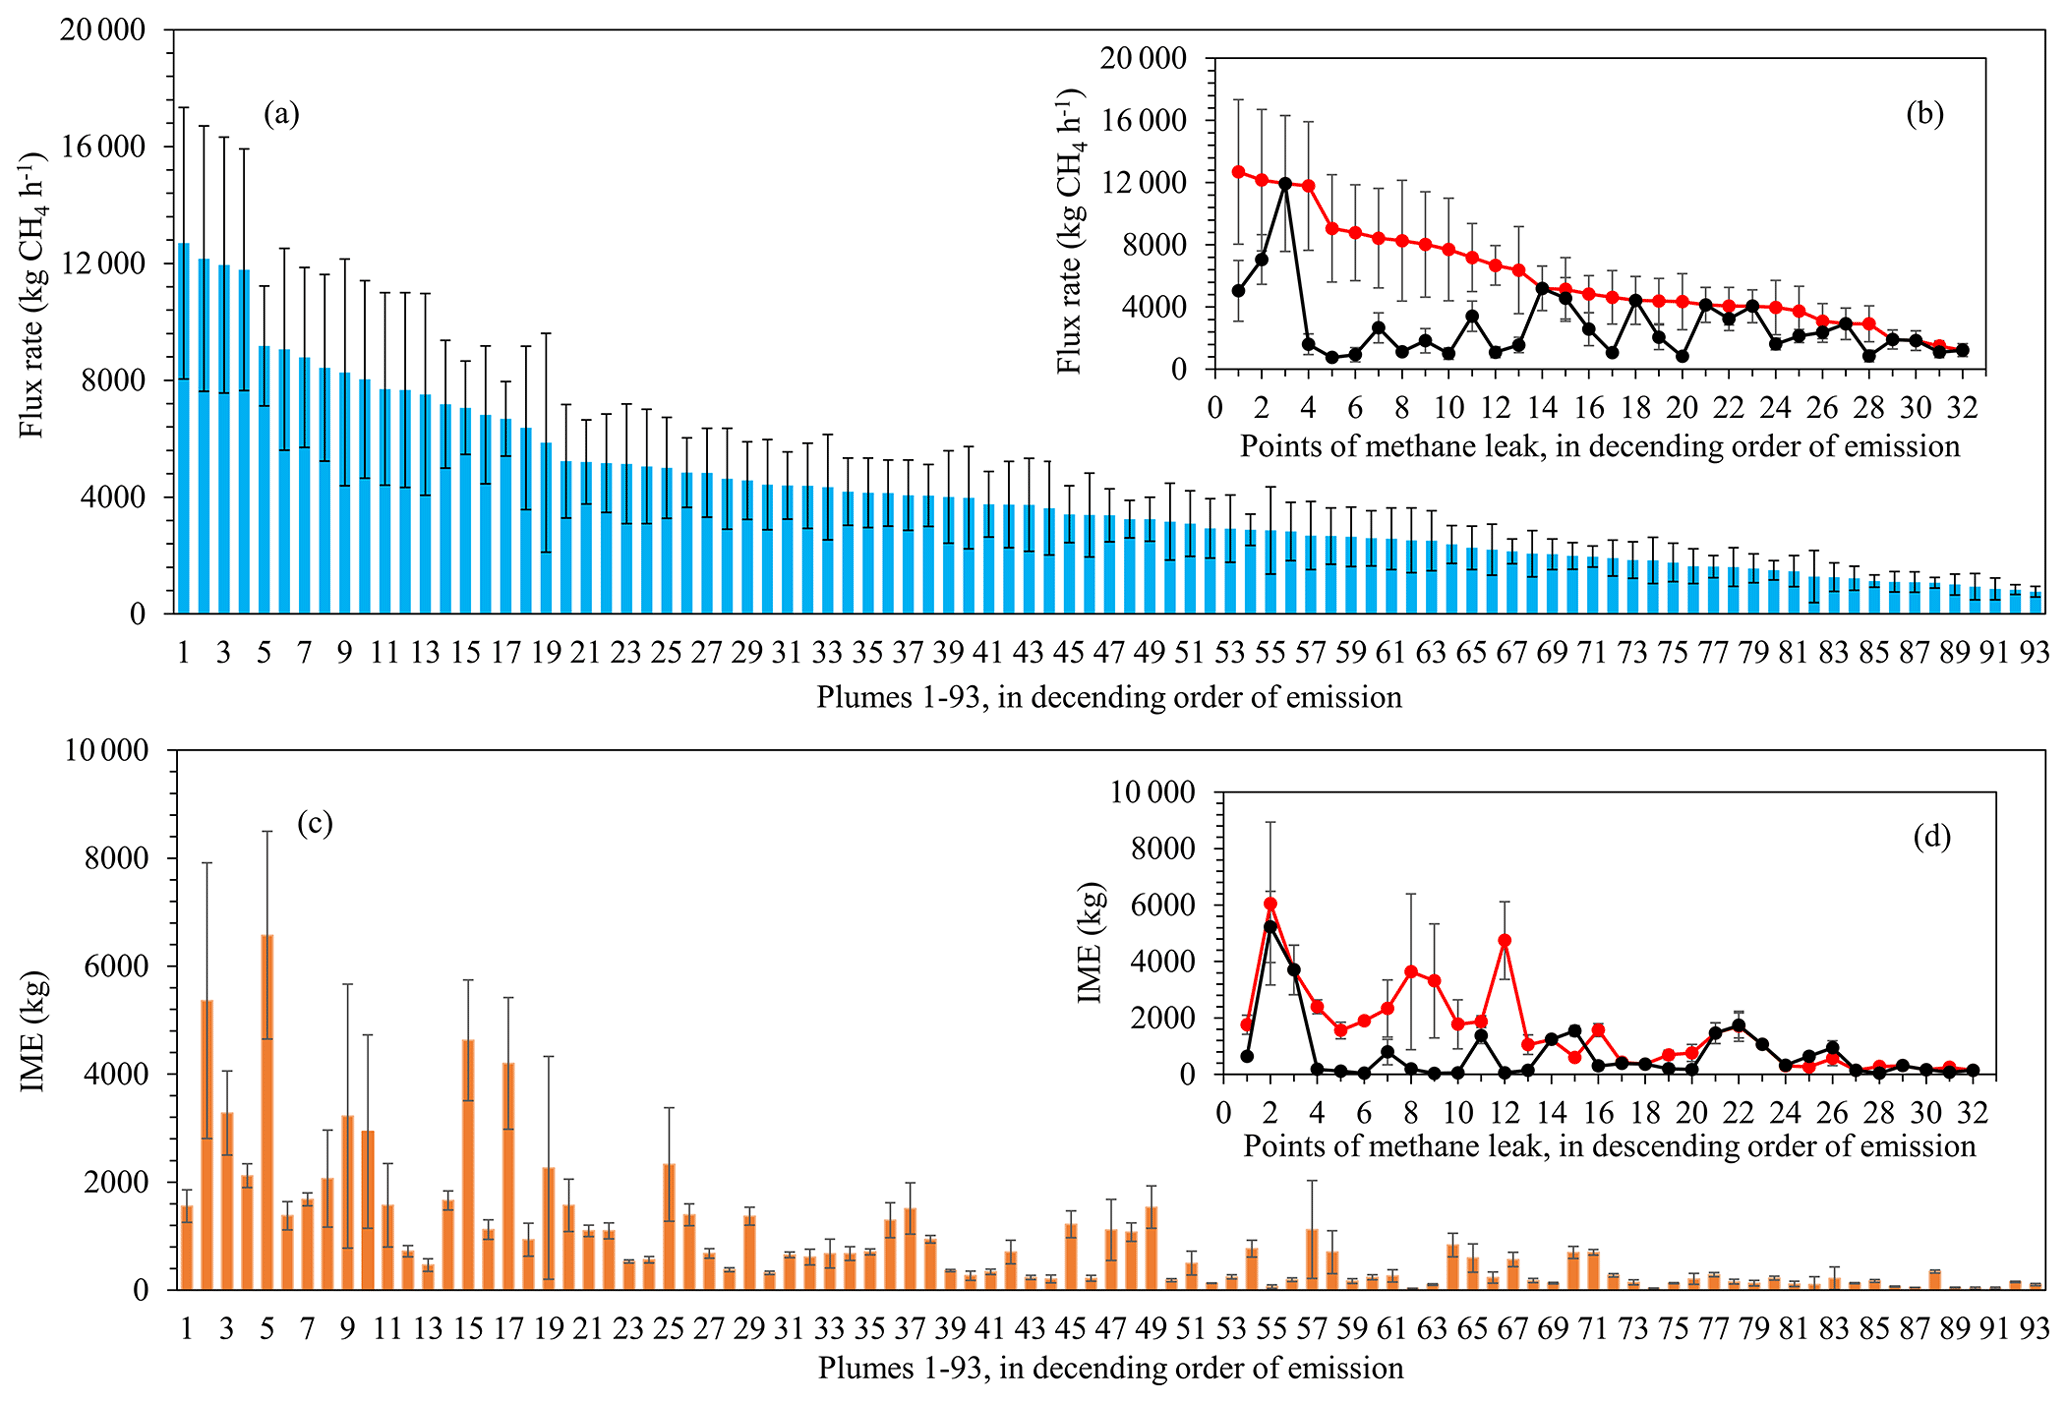
Figure 7(a) CH4 emission flux rate from point source plumes nos. 1–93 in descending order of emissions, with the error bars representing the estimation uncertainty. (b) The maximum and minimum emission flux rates for each point source with more than two observations. (c) The corresponding IME estimates for plume nos. 1–93, following the order in panel (a). (d) The maximum of the minimum emission flux rates for each point source with more than two observations.
Furthermore, multiple observations of the same point source indicate significant variations in CH4 emissions over time. The difference is as large as 10 204.71 kg h−1, which is about 7 times the amount between the maximum and the minimum, as shown in Fig. 7d. This difference suggests that a single observation does not adequately represent the overall or averaged emission scenario for any point source. Because the specific emission law of each emission point is unclear, more coal mine emission time series detection experiments (Qin et al., 2023) are needed for the overall emission rate evaluation. Although, Y. Chen et al. (2022) used high-density (26 292 active wells) and highly repeated (115 flight days) measurements from an aerial instrument to quantify methane emissions from the whole regional study area of the New Mexican Permian Basin with the persistence-averaged method. The persistent emission rate from a single point source was calculated with the emission detection probability derived from highly repeated observations. In this study, this may not be feasible because the observations are too few to calculate the possibility of emission detection. As the emission rates of the detected plume in this study (Fig. 7), the detection limit based on GF-5B AHSI and our current method could be 761.78 ± 185.00 kg h−1. However, there might be some smaller point source emissions in Shanxi, which could be detected with the inversion method improved.
4.3 Improvements on ΔXCH4 retrieval and emission flux rate estimation
4.3.1 Spectral calibration of GF-5B/AHSI observations
The impact of the wavelength shift and changes in FWHM of the spectral observations from GF-5B/AHSI on deriving ΔXCH4 is demonstrated in Figs. 8 and 9. Figure 8 illustrates an example of the cross-track pixel variations in the estimated centre wavelength in Fig. 8a and FWHM in Fig. 8b in a single-scene image collected on 29 January 2022. The results reveal the distinct deviations from the nominal centre wavelength and FWHM among different track pixels during satellite imaging. Figure 8c displays the ΔXCH4 of the corrected image, capturing plumes seen in Figs. 3b and 6c, d, among others. Figure 8d and e show the evident striping differences and spectral calibration's impact on calculating ΔXCH4 of individual plume. The difference can reach up to 100 ppb. To further assess the spectral calibration's influence on CH4 point source estimation, this study analysed the shift in centre wavelength and changes in FWHM in 111 representative scenes with potential point source emissions using GF-5B/AHSI, as shown in Fig. 9a and b. The results indicate that the average shift in centre wavelength of GF-5B/AHSI is approximately −0.05 nm, mostly ranging between −0.2 and 0.1 nm. The ratio of change in FWHM averages around 1.1, predominantly falling between 1.0 and 1.25 times (between 0 and 2.13 nm). Furthermore, the study evaluated the impact of spectral shift and FWHM change on the estimation of point source emission flux rate, as shown in Fig. 9c and d. The results indicate that the caused difference in the point source emission flux rate ranges from 0.43 to 500.96 kg h−1. The average percentage of change is (1.78 ± 1.39)%. The maximum difference reaches up to about 5.0 %. By considering the shift in central wavelength and change in FWHM in the spectral observations, it exhibits a potential to reduce the uncertainty in the XCH4 emission rate estimation using GF-5B/AHSI.
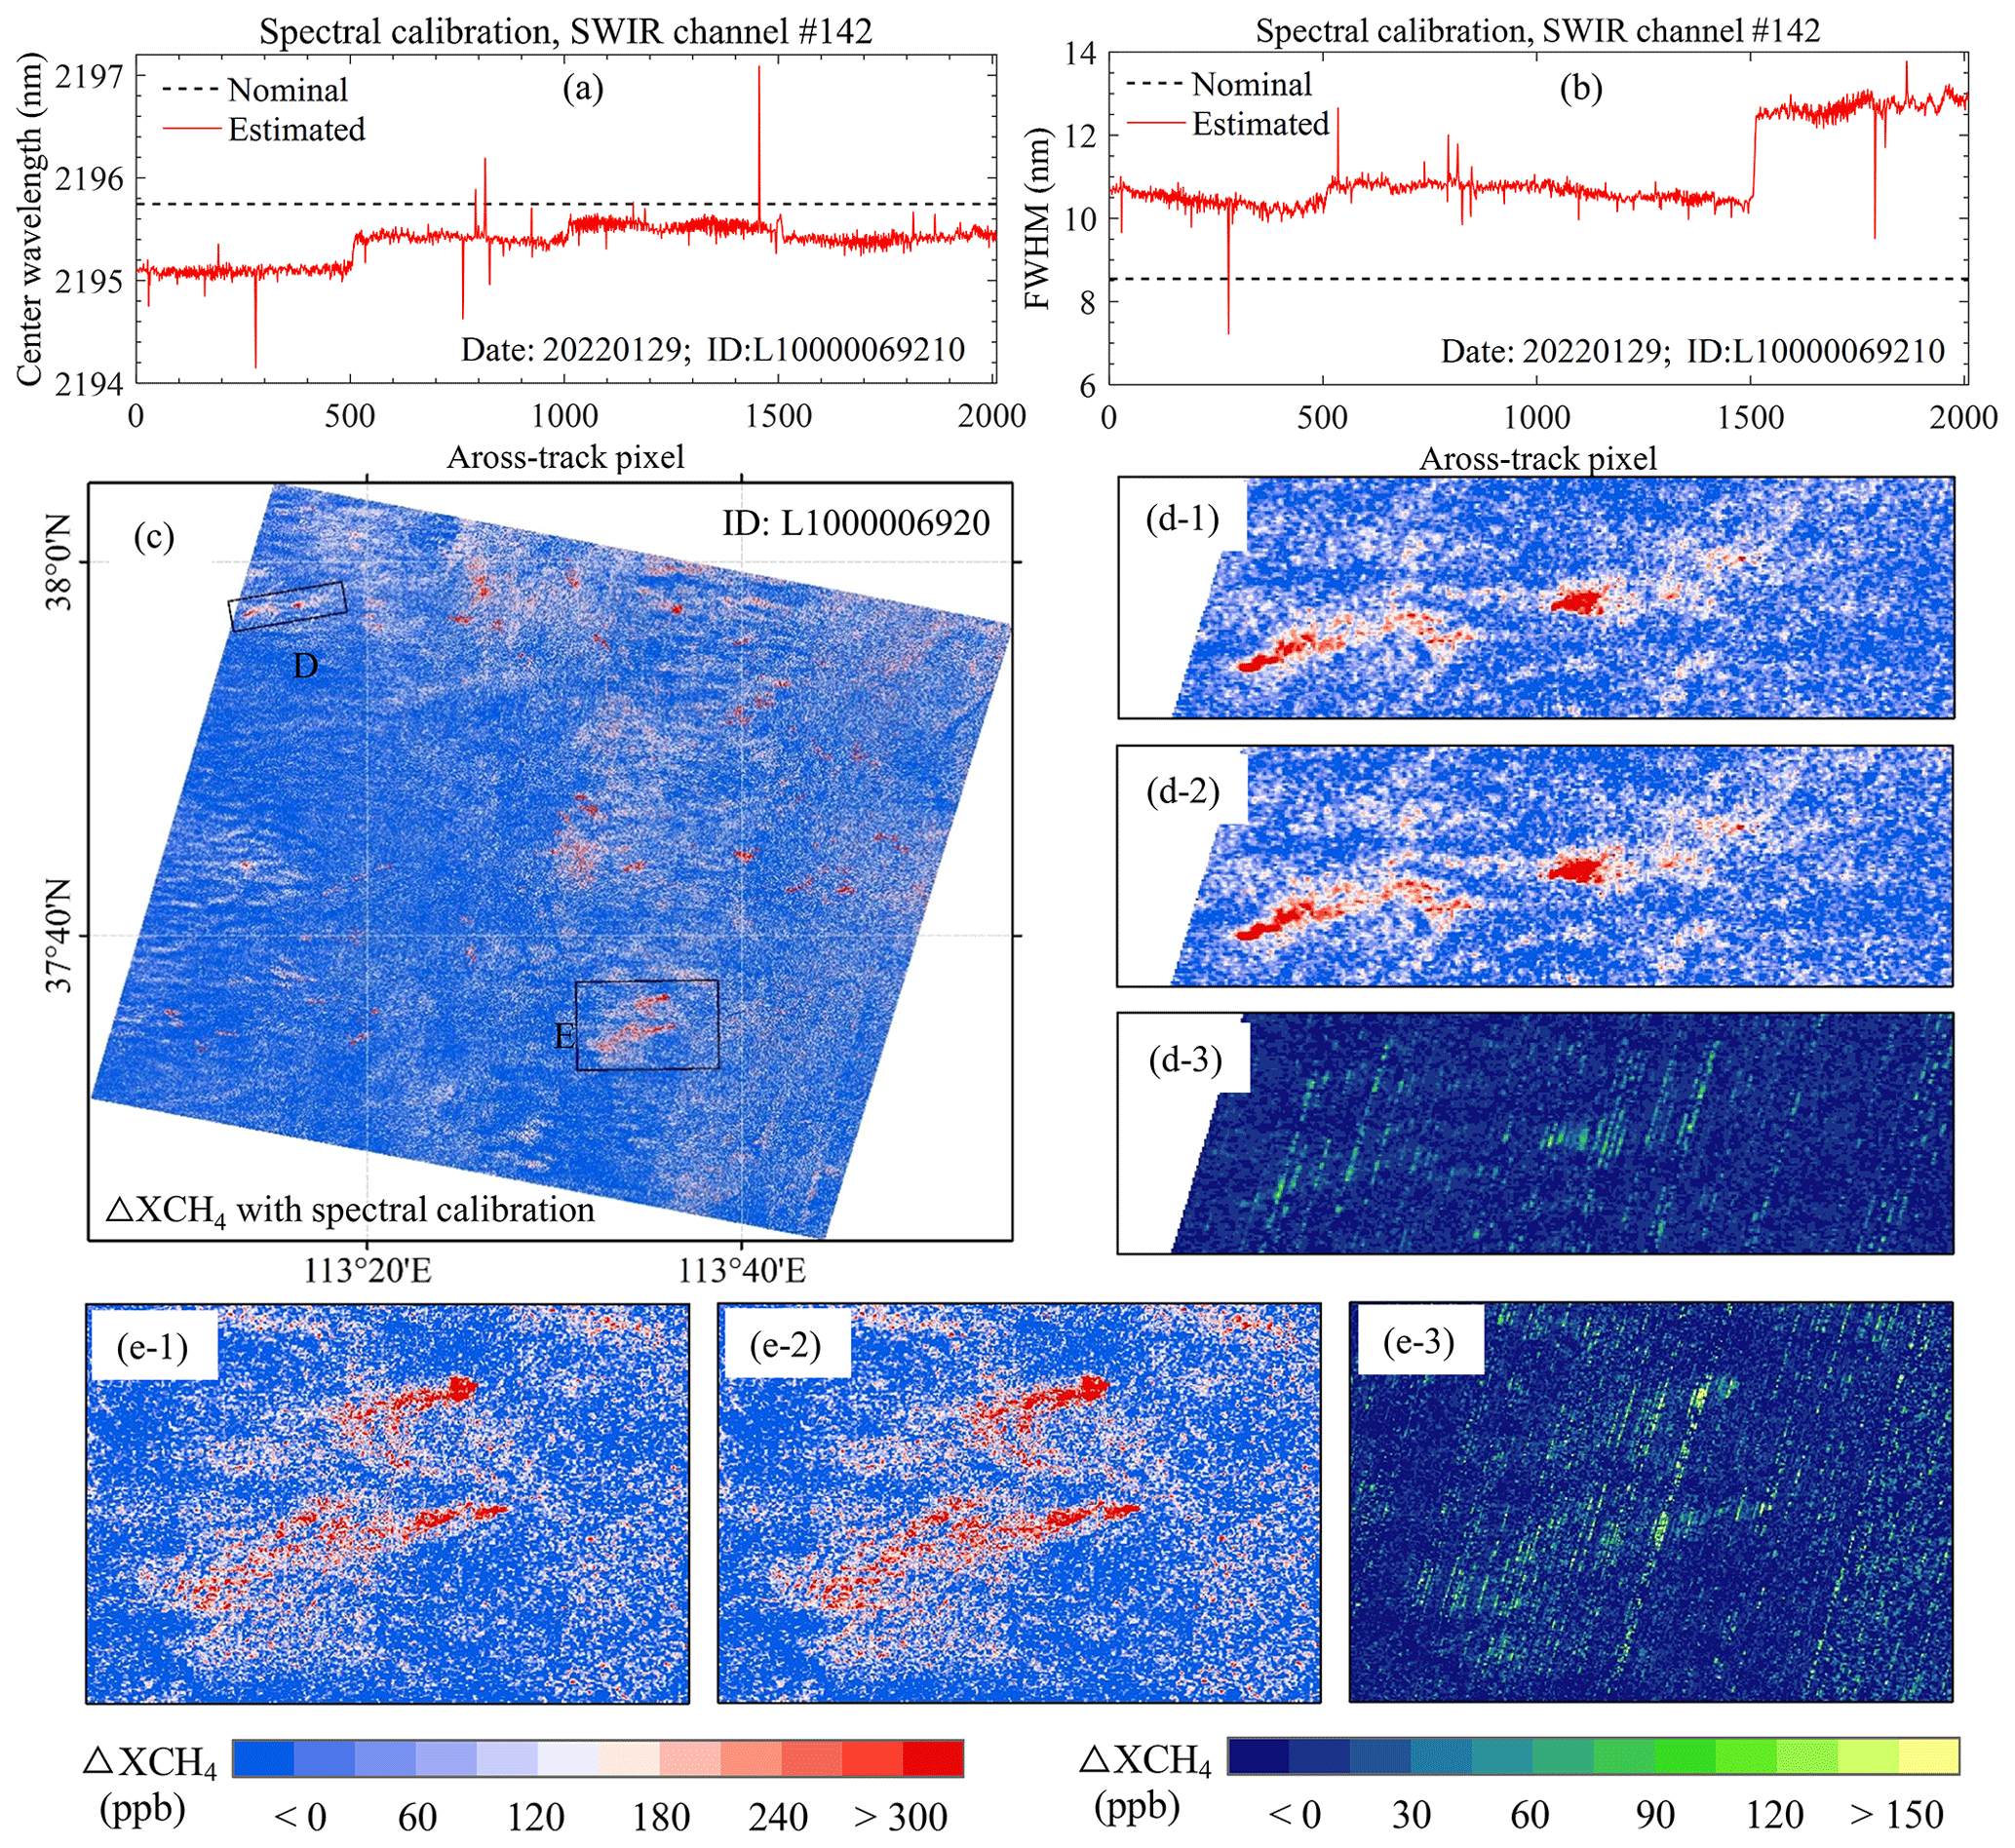
Figure 8Example of the shift in the centre wavelength and FWHM change for across-track pixels of channel no. 142 from GF-5B/AHSI SWIR imagery and their impacts for ΔXCH4 retrieval. Panel (a) shows the shift in the centre wavelength for across-track pixels. Panel (b) shows the FWHM variation ratio for across-track pixels. Panel (c) shows the ΔXCH4 retrieval of a single image with inputs of updated spectral calibration parameters. Panels (d) and (e) are the comparison of zoomed-in plumes with and without the inputs of updated spectral calibration parameters, in which panels (d-1) and (e-1) are results without calibration, panels (d-2) and (e-2) are results with calibration, and panels (d-3) and (e-3) are the corresponding difference in ΔXCH4 retrieval.
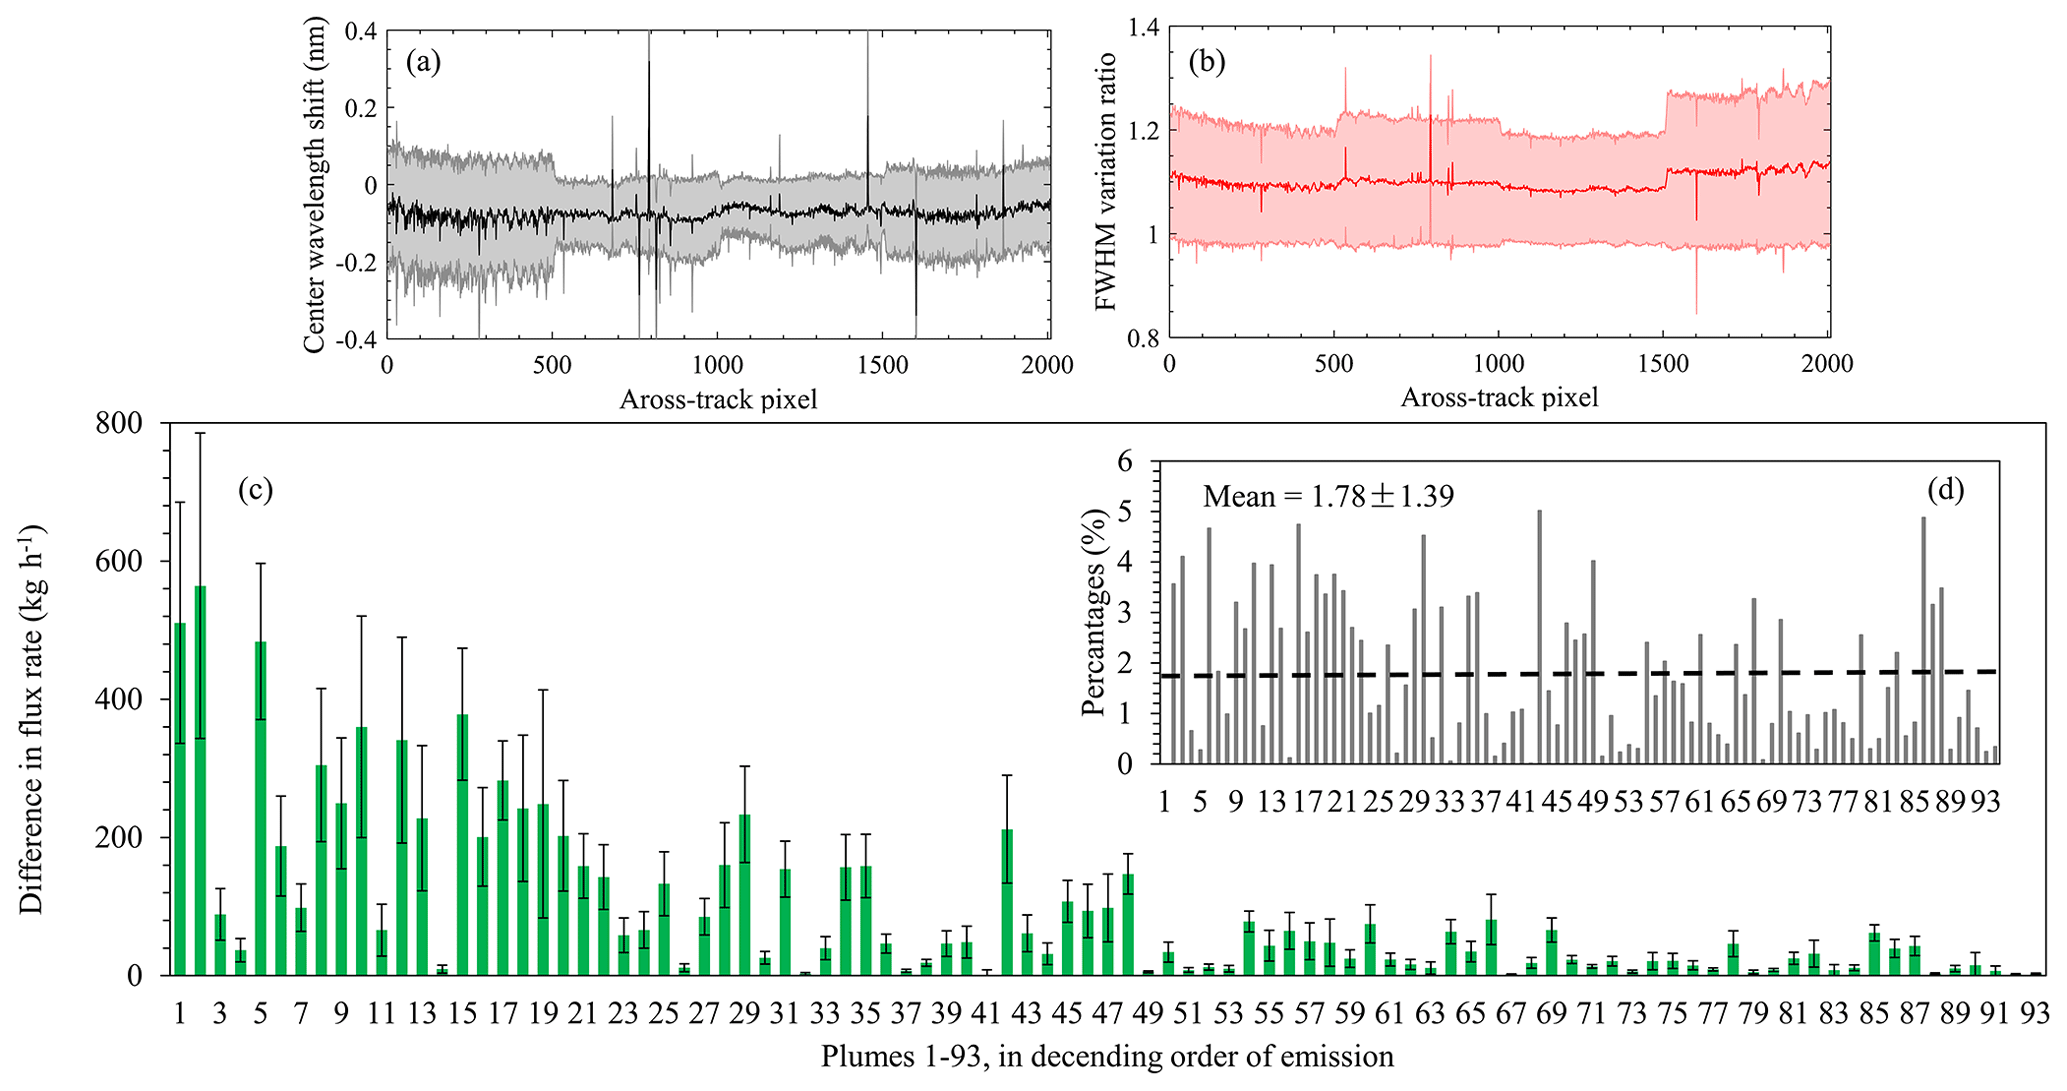
Figure 9(a) Statistics of the shift in centre wavelength and (b) FWHM variation ratio of all 111 GF-5B/AHSI SWIR images with potential CH4 point sources. (c) The difference in the estimations of emission flux rates and (d) the corresponding difference in percentages for all detected CH4 plumes shown in Figs. 6 and 7.
4.3.2 Impact of heterogeneous surface features
Complex surface features significantly affect the identification of suspected point sources based on ΔXCH4 maps and the derivation of point source emissions. In this study, we originally observed 219 instances of 113 suspicious point sources. In a more refined identification of these sources, we cross-checked and confirmed their positions using ΔXCH4 retrievals from GF-5B/AHSI against high-resolution Google Earth imagery. Our findings revealed that the identification of point sources was significantly affected by the complex surfaces that exhibit strong SWIR absorption similar to CH4 and therefore result in false positive signal. Notably, the array of solar panels that is widespread in Shanxi is the primary disruptor of the spectral matched-filter retrieval method. An example of solar panel arrays is shown in Fig. 10. Moreover, we found that surface features such as greenhouse structures, certain buildings, waterbodies with plume-like distributions, and moist cultivated lands (like paddy fields) also generated noticeable high-value ΔXCH4 interference signals. Therefore, in CH4 point source detection using GF-5B image, it is essential to consider combining with high-resolution images to filter out false positive signals.
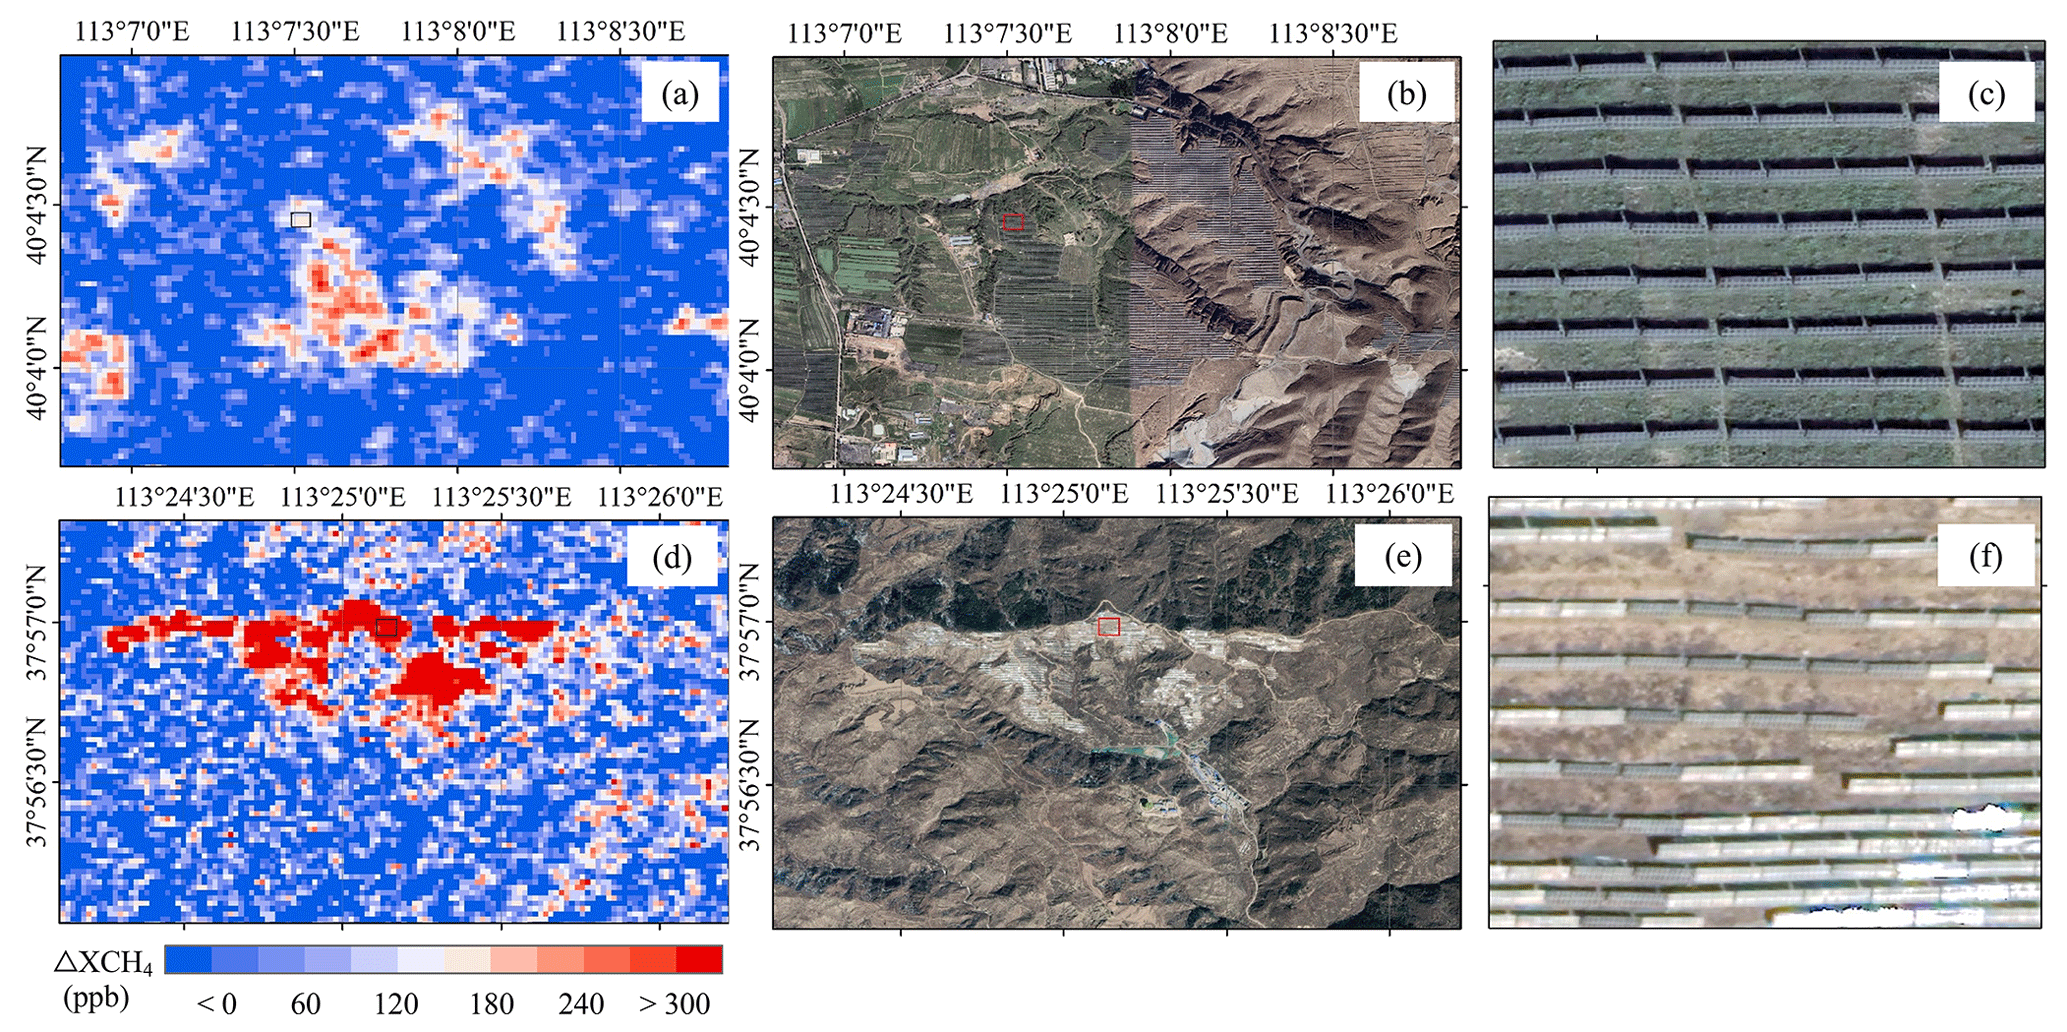
Figure 10Examples of the impact of array of solar panels, which generates false positive signals, on the ΔXCH4 retrieval in Shanxi. ΔXCH4 retrievals with high values are similar to plume shapes in panels (a) and (d). The false positive signals are caused by the similar patterns of solar panel arrays, which can be seen from high resolution of the ©Google maps in panels (b) and (e). Zoomed-in details of solar panels in the red boxes in panels (b) and (e) can be found in panels (c) and (f), respectively.
4.3.3 Evaluating wind fields from ERA5 reanalysis using observations from meteorological stations in Shanxi
Wind fields, including wind speed and direction, are the primary drivers of uncertainty in estimating point source emissions, especially in plume segmentation and flux rate calculations. For plume segmentation, instead of visual interpretation, this study introduces the flood-fill method. Instead of searching in eight directions in the current study, accurate wind direction information could enable us to precisely narrow down the flood-fill search directions, thereby removing abnormal signals from non-point source emissions, enhancing the reliability of plume segmentation. In the emission flux rate estimation, aligning with previous studies, this study defined an uncertainty in ERA5 wind speed as 50 %, thus leading to a significant uncertainty in the estimated emission rate. To evaluate the uncertainty in the wind fields from ERA5 reanalysis, which is widely used in many previous studies, this study compared them with data from three ground-based meteorological sites in Shanxi over the concentrated point source areas (Fig. 11). The comparison results indicate that from 2021 to 2023, the overall bias in the ERA5 wind speed was approximately 1.30 m s−1, which is close to 100 % of bias on average. It has been recognised that the wind speed should be in a moderate range to allow detectable plumes from space. A wind speed that is too small may hamper the development of the plume, while a wind speed that is too large may dilute the plume. It is observed in our cases that the wind speeds roughly fall within 0.5 to 2.5 m s−1 for most days with detectable point source plumes. If we assume this is the suitable wind speed range for satellite detection, as shown in black dots in the upper panel of Fig. 11, the deviation is about 0.45–0.54 m s−1, which is close to about 50 % of the wind speed from ERA5. This uncertainty is consistent with the assumption of wind speed uncertainty (50 %) in this study. In terms of wind direction, there are significant differences between ERA5 and the observations from meteorological sites. While ERA5 reanalysis data (at a height of 10 m) show relatively constant wind direction, the measurements of wind direction from meteorological stations show a much larger range. This discrepancy indicates significant deviations between ERA5 reanalysis wind fields and actual wind conditions, challenging their direct application in point source plume identification and emission estimation. Consequently, leveraging high-density and high-precision meteorological observations from automatic meteorological monitoring stations, especially over regions with complex surface properties, could reduce the uncertainty and enhance the accuracy of satellite-based detection and estimation of CH4 point source emissions.
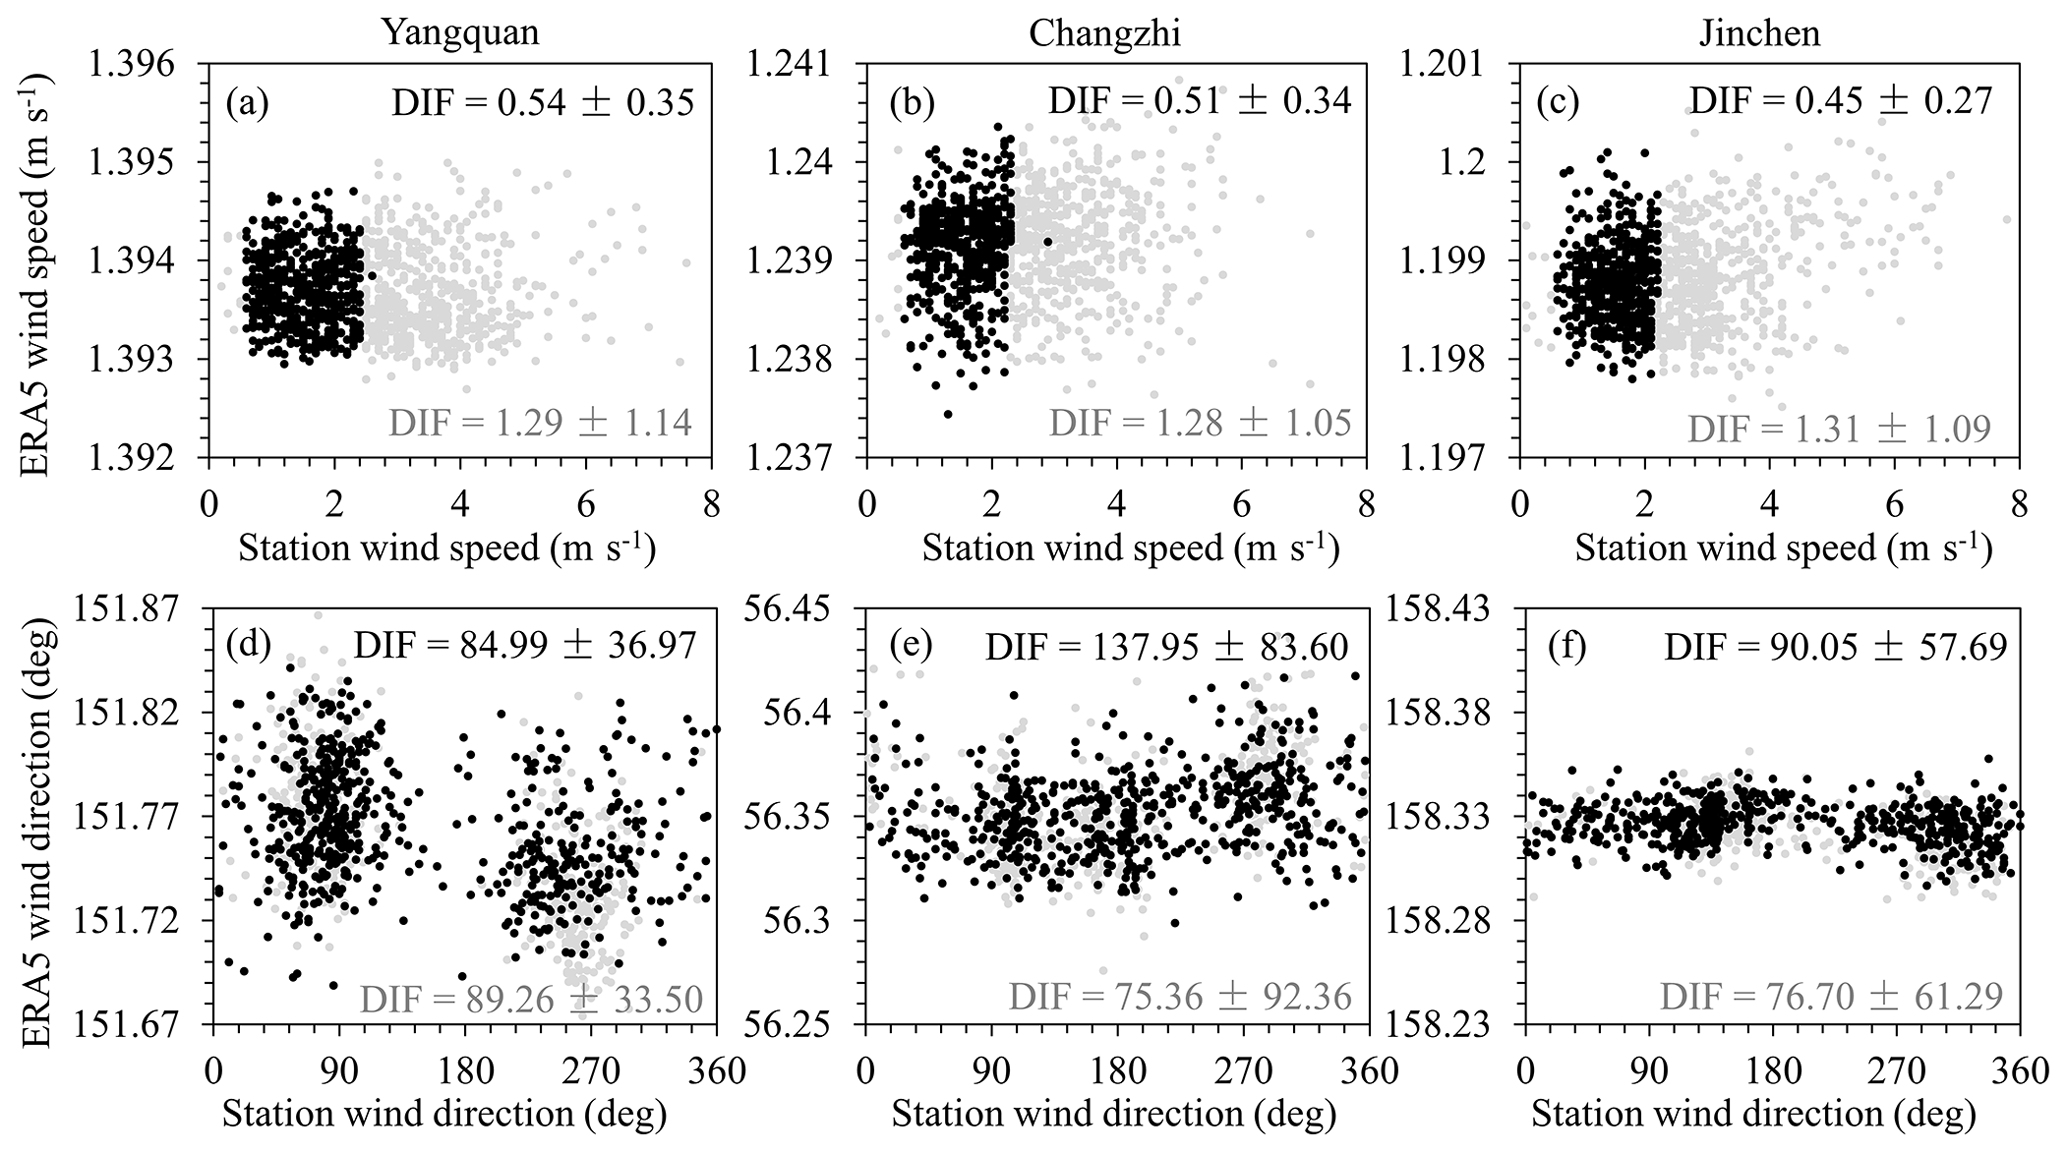
Figure 11Comparison of wind speeds (a–c) and directions (d–f) between ERA5 reanalysis and meteorological stations located in Yangquan, Changzhi, and Jincheng cities in Shanxi, as indicated in Fig. 1. Wind field data from 2021 to 2023 are extracted in the daytime and correspond to the GF-5B overpass time. Black dot data are selected according to the wind speed range of 0.5 to 2.5 m s−1.
A flat 50 % wind error could underestimate uncertainty for slow winds and overestimate uncertainty for fast winds. Therefore, we carried out an evaluation of the plume emission uncertainty using the absolute wind error (1.297 m s−1 on average) estimated by comparing wind speeds from EAR5 and local meteorological stations in Shanxi. The results of CH4 flux rates and their uncertainty are shown in Fig. E1. As we expected, the uncertainty in the flux decreased/increased at high/low wind speed, respectively. In addition, the impact of wind speed uncertainties accounts for approximately 86.31 %, which is similar to the previous result based on a flat 50 % wind error. This result supports the fact that wind speed remains the dominant factor contributing to the uncertainty in estimating CH4 point source emissions.
In this study, we conducted a survey of CH4 point sources emissions from coal mines in Shanxi, China, using hyperspectral observations of GF-5B/AHSI. We first carried out the spectral calibration based on the estimates of the across-track changes in channel centre wavelength and FWHM, which are approximately −0.05 nm and 10 %, respectively. We adopted the widely used matched-filter method to calculate the enhancement ΔXCH4. Based on the enhancement, the emission plumes are extracted using the fill-flood method, which is an automated plume segmentation method. The emission flux rate and the associated uncertainty are eventually estimated using IME method. Our results show that the errors caused by spectral calibration (wavelength shift and FWHM change) and the selection of different background can reach up to 5.0 % and 8.5 %, respectively. Simultaneously, this study presents the spatial distribution and emission flux rates of 32 point sources and 93 observed plumes in Shanxi province from 2021 to 2023. The findings indicate that coal mine sources in Shanxi are primarily located around Yangquan, Changzhi, and Jincheng areas, with plume emission flux rates ranging from 761.78 ± 185.00 (the minimum) to 12 729.12 ± 4658.13 kg h−1 (the maximum). Multiple repeated observations show significant differences in emission flux rates from the same source. The difference can reach to 10 204.71 kg h−1 with a different by a factor of more than 7 times between the maximum and the minimum, indicating that a single overpass observation cannot represent the overall emissions of the point source. This study highlights that wind speed remains the primary factor contributing to uncertainty in point source emission estimation (approximately 84.84 %), yet the uncertainty in the IME (approximately 15.16 %) is also important.
It is important to note that the plume shapes detected based solely on the ΔXCH4 maps contains false positive signals due to surface interference. The strong absorption in SWIR by certain surface types significantly disrupts point source detection and flux rate emissions. In the future, a fusion of hyperspectral spectra and multispectral image with high spatial resolution could effectively filter out false positive signals and remove surface covering interference. In addition, the uncertainty in the wind field data remains significant sources of uncertainty in CH4 point source emission flux rate estimation. From the evaluation of the accuracy of wind fields in ECMWF ERA5 reanalysis by comparing with ground-based meteorological station, we found a large discrepancy, especially in wind directions. For regions with complex terrain like Shanxi, incorporating local meteorological measurements into the detection of the CH4 point source are important to achieve high accuracy.
The identification of CH4 point sources using high-resolution satellite imagery is closely linked to land cover, while the accurate calculation of ΔXCH4 is significantly affected by spectral differences in the background within the study area. Hence, precise geometric localisation (Eqs. 4–6) of the GF-5B satellite images is crucial. The retrieval of ΔXCH4 involves both forward and inverse computations of the rational polynomial coefficients (RPCs) in high-resolution imagery (Q. Liu et al., 2019). The forward-computation entails transforming the row and column indices (Rowi, Coli) of the image data into geographical coordinates (Lati, Longi), aiding in detecting and identifying ΔXCH4 point sources. Conversely, the reverse computation aims to optimise background concentration calculations by transforming detected point source geographical coordinates back to the image's row and column indices.
where a1…a20, b1…b20, c1…c20, d1…d20, Lat_off, Lat_scale, Lon_off, Lon_scale, Heigh_off, and Heigh_scale are rational polynomial coefficients (RPCs) which can be obtained from the incidental data of the GF-5B images.
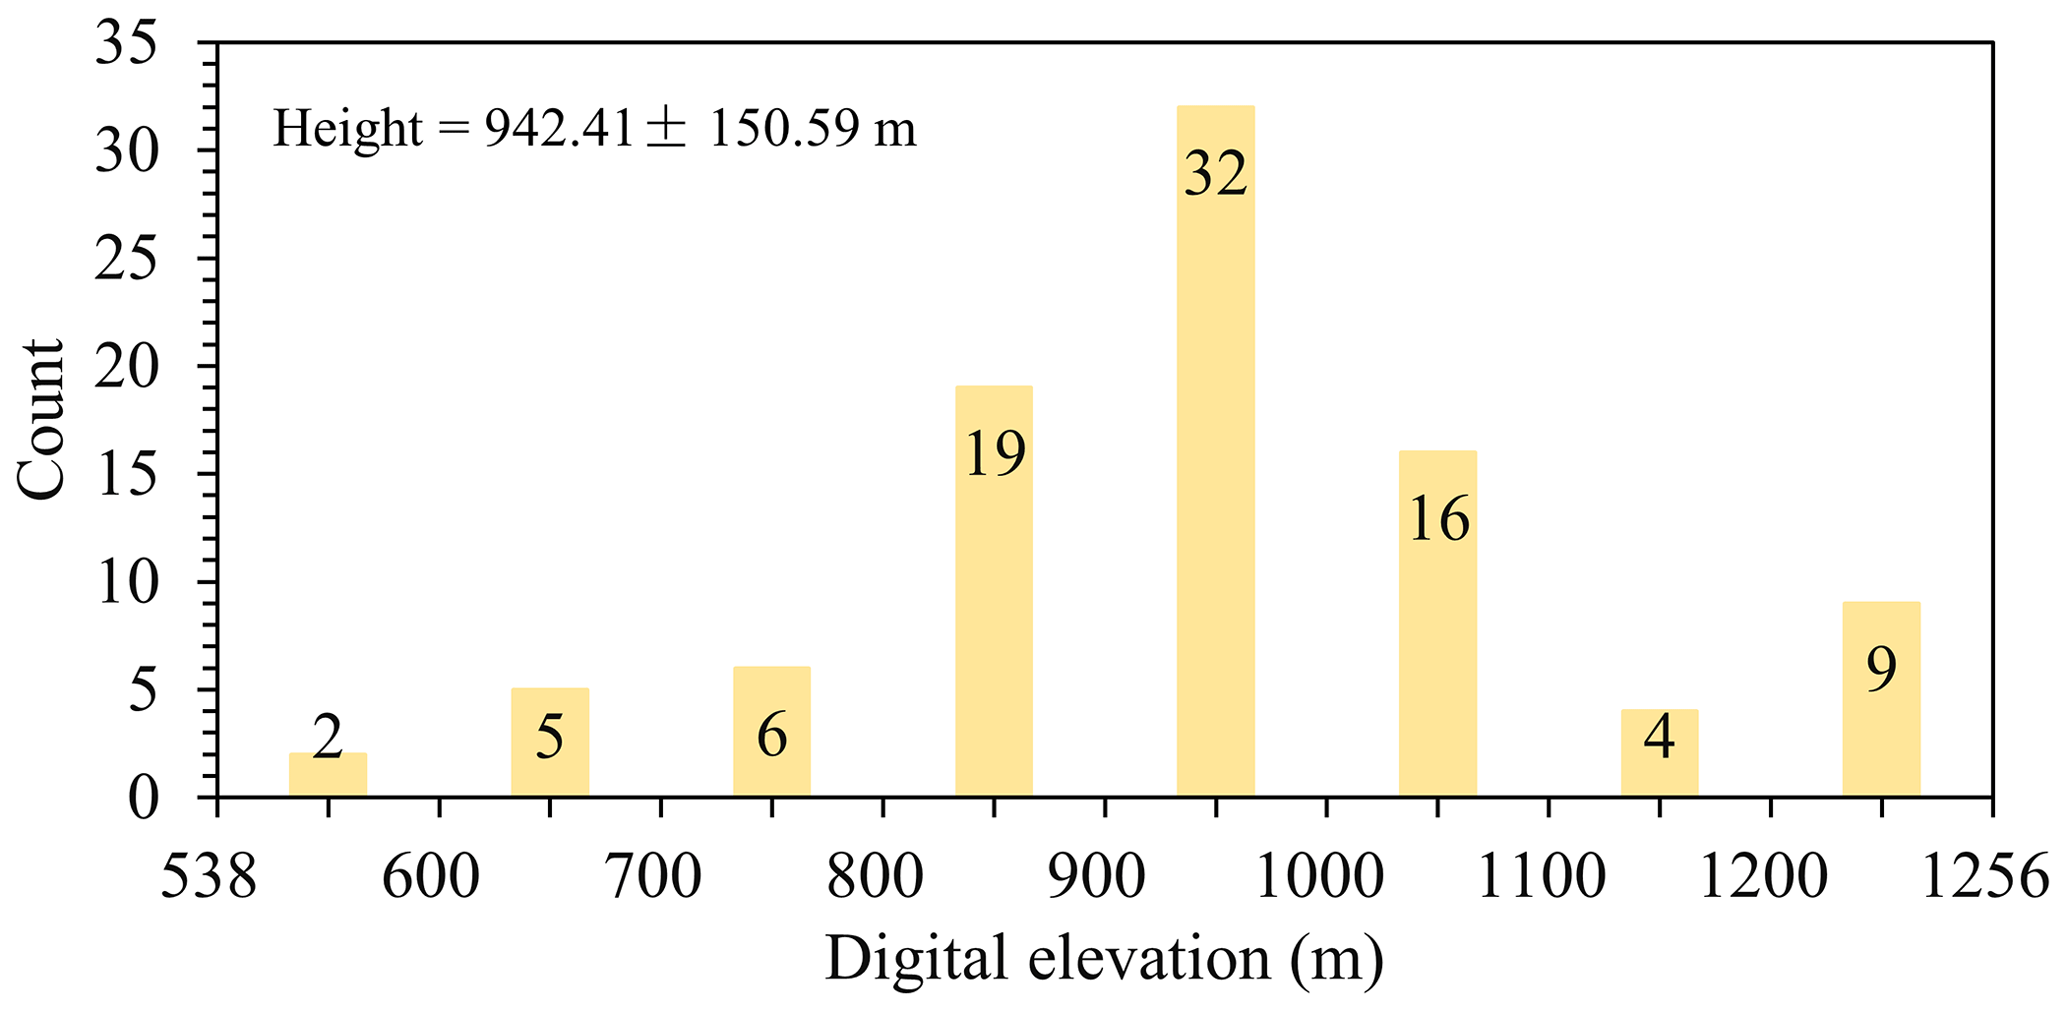
Figure B1Histogram of the elevation for the detected plumes in Shanxi. The elevation data are from the DEM shown in Sect. 2.3.
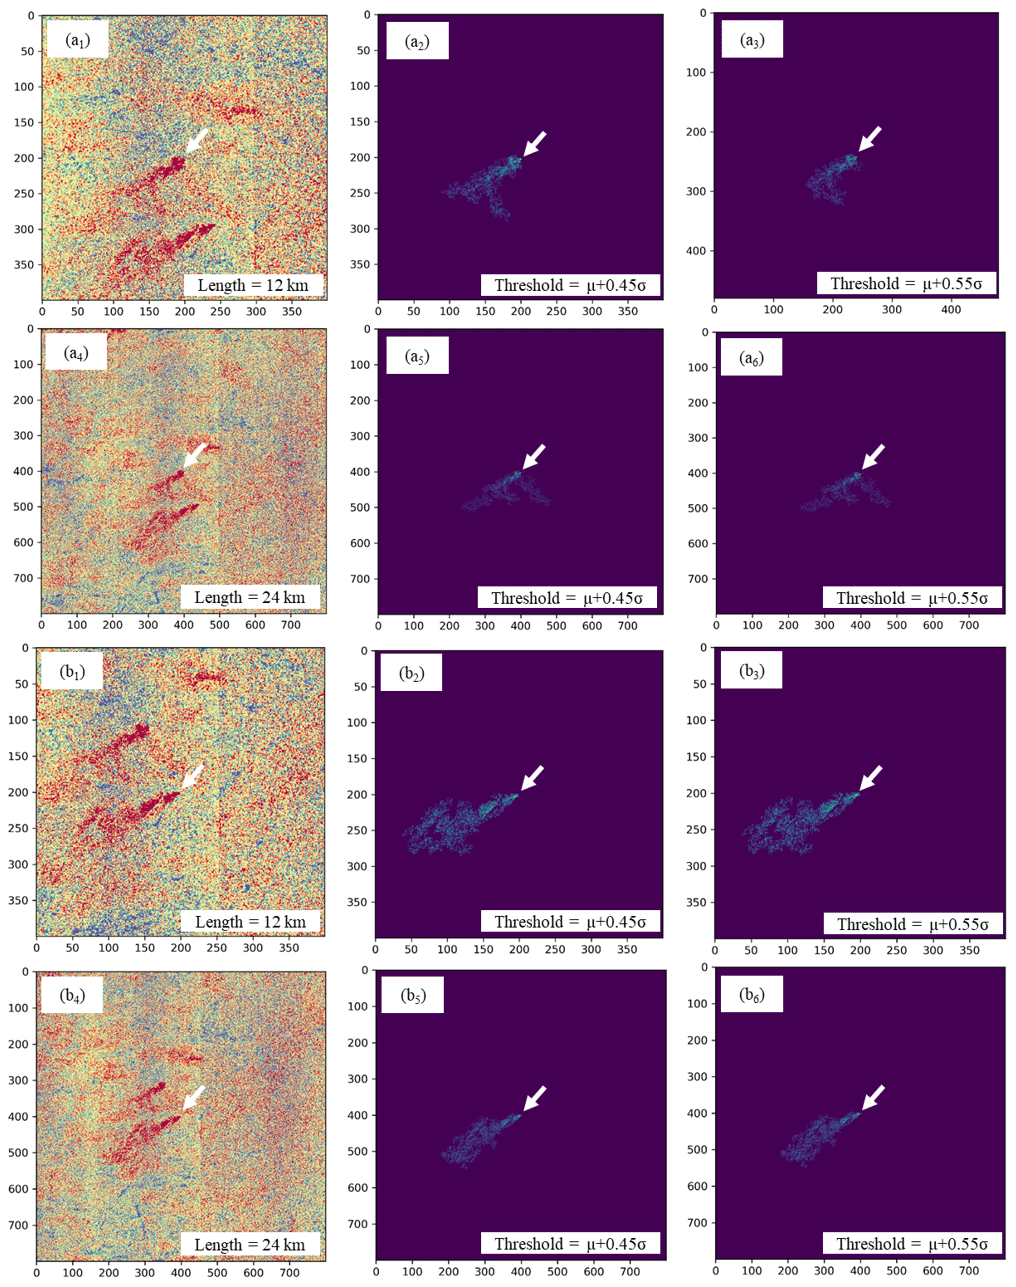
Figure C1Examples of plume segmentation in the flood-fill method using different lengths for the background square and different segmentation thresholds. Two plumes are given in panels (a1)–(a6) and (b1)–(b6) as examples, in which panels (a1)–(a3) and (b1)–(b3) are for the length of 12 km and panels (a4)–(a6) and (b4)–(b6) are for the length of 24 km. Two different thresholds, μ+0.45σ and μ+0.55σ, are given for the two plume examples.
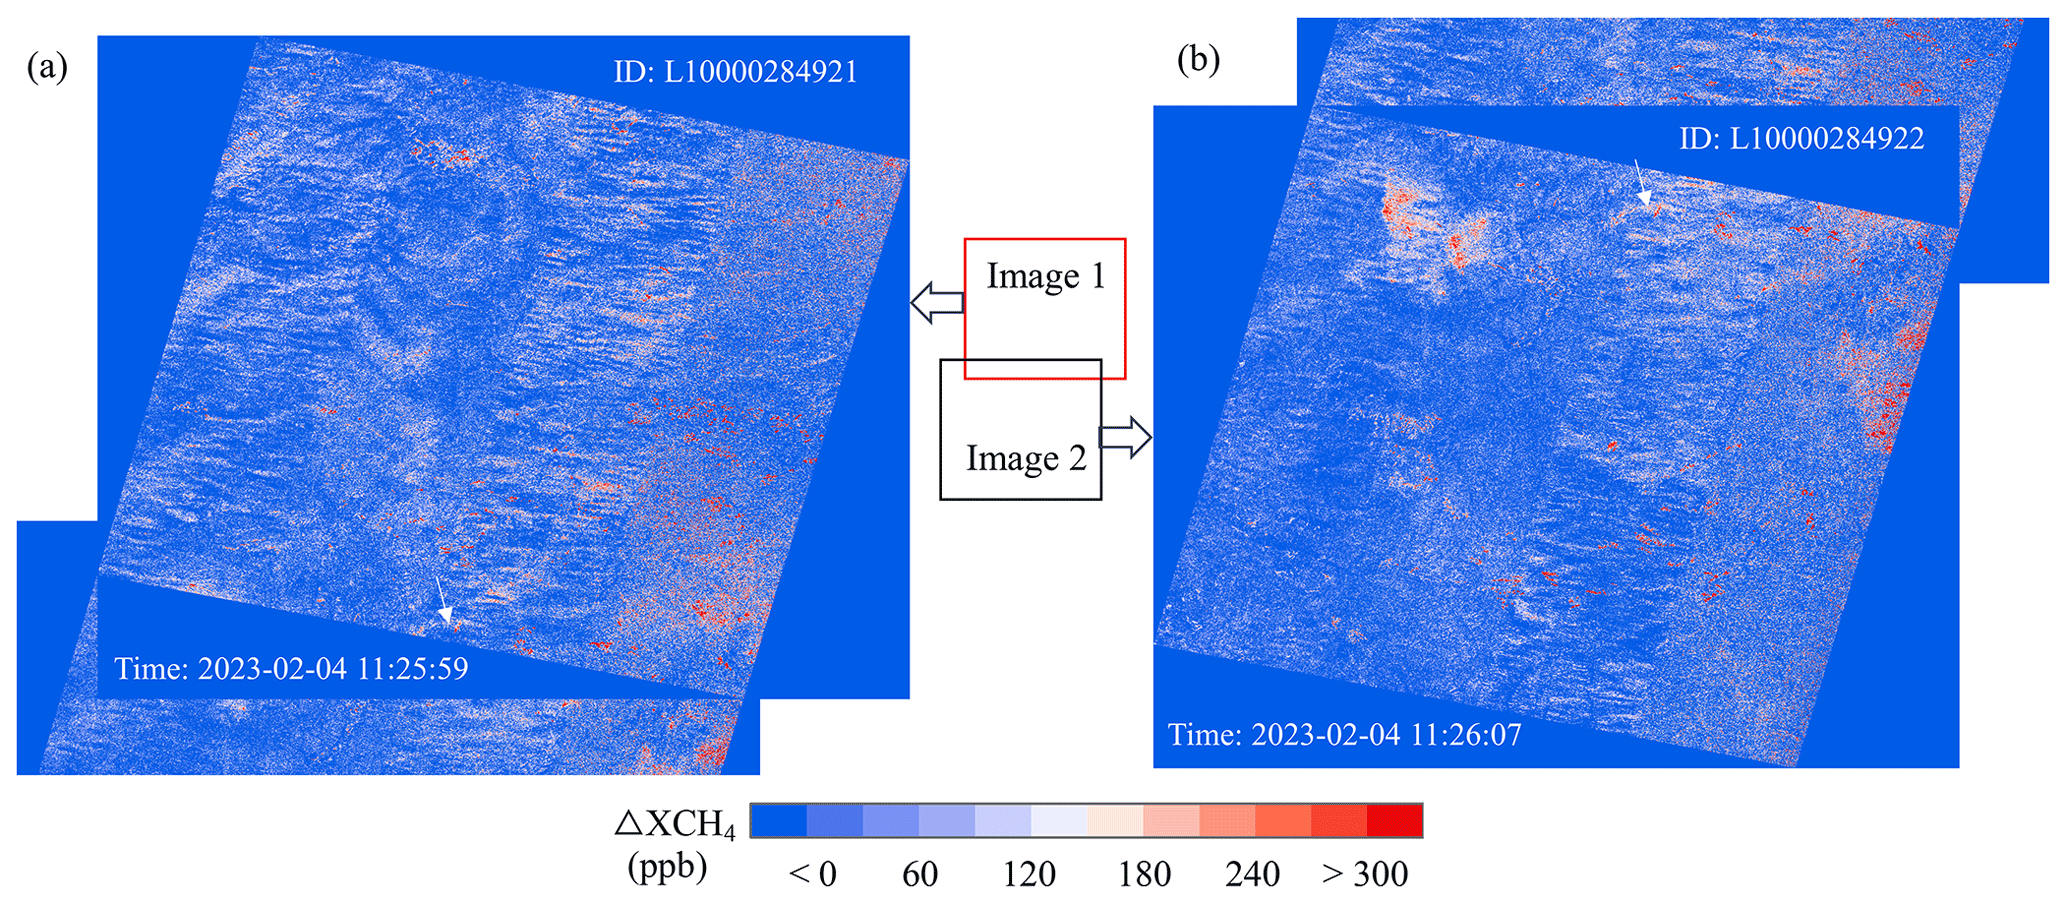
Figure D1The full images of ΔXCH4 for Fig. 3f (a) and Fig. 3g (b). The plume target (indicated by the white arrow) appears in the overlapping region of the two images.
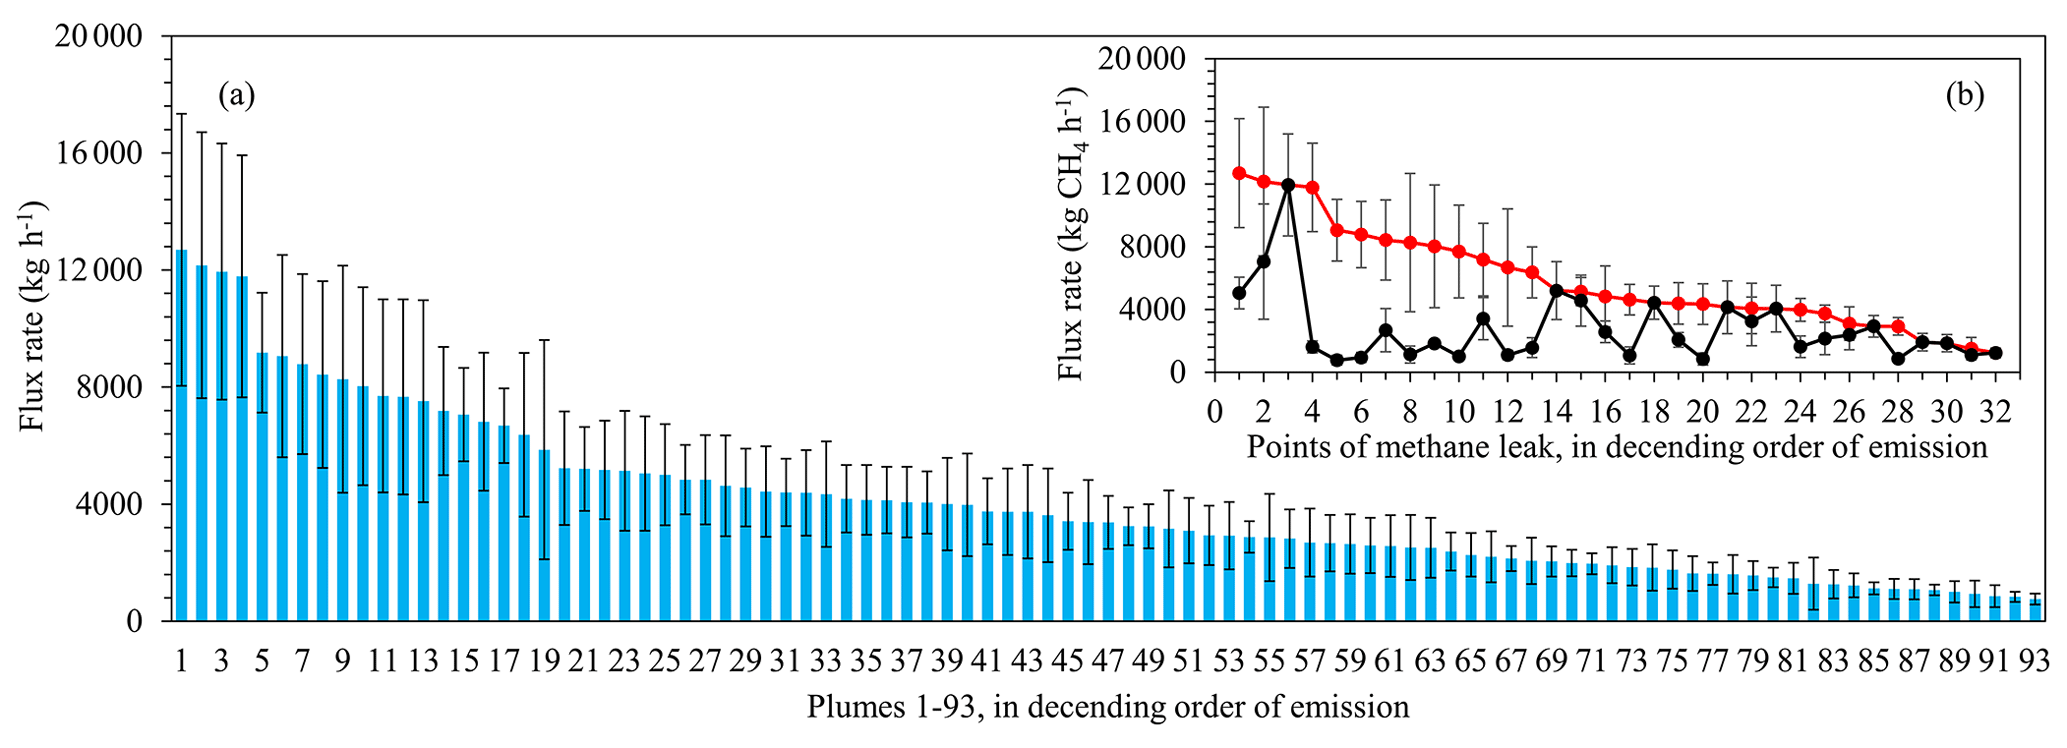
Figure E1Uncertainty in the CH4 emission flux rates using an absolute wind speed uncertainty. (a) CH4 emission flux rates from point source plume nos. 1–93 in descending order of emissions, with the error bars representing the estimation uncertainty. The uncertainty in the wind speed (1.297 m s−1) is estimated by comparing wind speeds from EAR5 and local meteorological stations, as described in Sect. 4.3.3. (b) The maximum and minimum emission flux rates for each point source with more than two observations.
Gaofen-5B AHSI images are downloaded from China Centre for Resources Satellite Data and Application and accessed from https://data.cresda.cn/#/home (China Centre for Resources Satellite Data and Application, 2024). Official applications are required for accessing the GF-5B/AHSI spectra. ERA5 reanalysis data from ECMWF can be accessed from https://cds.climate.copernicus.eu/cdsapp#!/home (ECMWF, 2024). Observations from national weather station data are from China Meteorological Administration Data Centre, accessed from http://data.cma.cn/en (China Centre for Resources Satellite Data and Application, 2024). The dataset of detected plumes in Shanxi province of China during 2021–2023 using Gaofen-5B AHSI data is available at https://doi.org/10.5281/zenodo.11118337 (He et al., 2024).
ZZ designed the study. ZH prepared all datasets, carried out the retrieval, and did the result analysis. ZZ developed the retrieval codes. ZH wrote the first draft. LG and ML contributed to the data acquisition and results analysis. All authors reviewed and proofread the paper.
The contact author has declared that none of the authors has any competing interests.
Publisher's note: Copernicus Publications remains neutral with regard to jurisdictional claims made in the text, published maps, institutional affiliations, or any other geographical representation in this paper. While Copernicus Publications makes every effort to include appropriate place names, the final responsibility lies with the authors.
We thank Luis Guanter, Yao Liu, and Chenxi Sun for helpful discussions during the early stage of this work. This work has also been supported by the High-Performance Computing Platform of Peking University and China Meteorological Administration for the project of “The major Technology R&D and Application of Greenhouse Gas Observation” Youth Innovation Team (team no. CMA2023QN13).
This research has been supported by the National Natural Science Foundation of Zhejiang Province (grant nos. LQ21d050001 and LZJMZ24D050008), the Research and Development Project of Zhejiang Province's “Jianbing” and “Lingyan” projects (grant no. 2023C03190), and the National Natural Science Foundation of China (grant nos. 42275142 and 12292981).
This paper was edited by Jian Xu and reviewed by two anonymous referees.
Chen, Y., Sherwin, E. D., Berman, E. S. F., Jones, B. B., Gordon, M. P., Wetherley, E. B., Kort, E. A., and Brandt, A. R.: Quantifying Regional Methane Emissions in the New Mexico Permian Basin with a Comprehensive Aerial Survey, Environ. Sci. Technol., 56, 4317–4323, https://doi.org/10.1021/acs.est.1c06458, 2022.
Chen, Z., Jacob, D. J., Nesser, H., Sulprizio, M. P., Lorente, A., Varon, D. J., Lu, X., Shen, L., Qu, Z., Penn, E., and Yu, X.: Methane emissions from China: a high-resolution inversion of TROPOMI satellite observations, Atmos. Chem. Phys., 22, 10809–10826, https://doi.org/10.5194/acp-22-10809-2022, 2022.
Chen, Z., Jacob, D. J., Gautam, R., Omara, M., Stavins, R. N., Stowe, R. C., Nesser, H., Sulprizio, M. P., Lorente, A., Varon, D. J., Lu, X., Shen, L., Qu, Z., Pendergrass, D. C., and Hancock, S.: Satellite quantification of methane emissions and oil–gas methane intensities from individual countries in the Middle East and North Africa: implications for climate action, Atmos. Chem. Phys., 23, 5945–5967, https://doi.org/10.5194/acp-23-5945-2023, 2023.
China Centre for Resources Satellite Data and Application: Gaofen-5B Advanced Hyperspectral Imager datasets, https://data.cresda.cn/#/home, last access: 1 May 2024.
China Meteorological Data Service Centre: National weather station data, http://data.cma.cn/en, last access: 1 May 2024.
Cusworth, D. H., Duren, R. M., Thorpe, A. K., Tseng, E., Thompson, D., Guha, A., Newman, S., Foster, K. T., and Miller, C. E.: Using remote sensing to detect, validate, and quantify methane emissions from California solid waste operations, Environ. Res. Lett., 15, 054012, https://doi.org/10.1088/1748-9326/ab7b99, 2020.
Duren, R. M., Thorpe, A. K., Foster, K. T., Rafiq, T., Hopkins, F. M., Yadav, V., Bue, B. D., Thompson, D. R., Conley, S., Colombi, N. K., Frankenberg, C., McCubbin, I. B., Eastwood, M. L., Falk, M., Herner, J. D., Croes, B. E., Green, R. O., and Miller, C. E.: California's methane super-emitters, Nature, 575, 180–184, https://doi.org/10.1038/s41586-019-1720-3, 2019.
ECMWF: ERA5 reanalysis data, https://cds.climate.copernicus.eu/cdsapp#!/home, last access: 1 May 2024.
Ehret, T., De Truchis, A., Mazzolini, M., Morel, J.-M., D'aspremont, A., Lauvaux, T., Duren, R., Cusworth, D., and Facciolo, G.: Global tracking and quantification of oil and gas methane emissions from recurrent sentinel-2 imagery, Environ. Sci. Technol., 56, 10517–10529, 2022.
Farr, T. G., Rosen, P. A., Caro, E., Crippen, R., Duren, R., Hensley, S., Kobrick, M., Paller, M., Rodriguez, E., Roth, L., Seal, D., Shaffer, S., Shimada, J., Umland, J., Werner, M., Oskin, M., Burbank, D., and Alsdorf, D.: The Shuttle Radar Topography Mission, Rev. Geophys., 45, RG2004, https://doi.org/10.1029/2005RG000183, 2007.
Frankenberg, C., Thorpe, A. K., Thompson, D. R., Hulley, G., Kort, E. A., Vance, N., Borchardt, J., Krings, T., Gerilowski, K., Sweeney, C., Conley, S., Bue, B. D., Aubrey, A. D., Hook, S., and Green, R. O.: Airborne methane remote measurements reveal heavy-tail flux distribution in Four Corners region, P. Natl. Acad. Sci. USA, 113, 9734–9739, https://doi.org/10.1073/pnas.1605617113, 2016.
Guanter, L., Segl, K., Sang, B., Alonso, L., Kaufmann, H., and Moreno, J.: Scene-based spectral calibration assessment of high spectral resolution imaging spectrometers, Opt. Express, 17, 11594–11606, https://doi.org/10.1364/OE.17.011594, 2009.
Guanter, L., Kaufmann, H., Segl, K., Foerster, S., Rogass, C., Chabrillat, S., Kuester, T., Hollstein, A., Rossner, G., Chlebek, C., Straif, C., Fischer, S., Schrader, S., Storch, T., Heiden, U., Mueller, A., Bachmann, M., Mühle, H., Müller, R., Habermeyer, M., Ohndorf, A., Hill, J., Buddenbaum, H., Hostert, P., Van der Linden, S., Leitão, P. J., Rabe, A., Doerffer, R., Krasemann, H., Xi, H., Mauser, W., Hank, T., Locherer, M., Rast, M., Staenz, K., and Sang, B.: The EnMAP Spaceborne Imaging Spectroscopy Mission for Earth Observation, Remote Sens.-Basel, 7, 8830–8857, 2015.
Guanter, L., Irakulis-Loitxate, I., Gorroño, J., Sánchez-García, E., Cusworth, D. H., Varon, D. J., Cogliati, S., and Colombo, R.: Mapping methane point emissions with the PRISMA spaceborne imaging spectrometer, Remote Sens. Environ., 265, 112671, https://doi.org/10.1016/j.rse.2021.112671, 2021.
He, Z., Lei, L., Welp, L., Zeng, Z.-C., Bie, N., Yang, S., and Liu, L.: Detection of Spatiotemporal Extreme Changes in Atmospheric CO2 Concentration Based on Satellite Observations, Remote Sens.-Basel, 10, 839, https://doi.org/10.3390/rs10060839, 2018.
He, Z., Gao, L., Liang, M., and Zeng, Z.-C.: Datasets for “A survey of methane point source emissions from coal mines in Shanxi province of China using AHSI on board Gaofen-5B”, Version v1, Zenodo [data set], https://doi.org/10.5281/zenodo.11118337, 2024.
Huang, Y., Natraj, V., Zeng, Z.-C., Kopparla, P., and Yung, Y. L.: Quantifying the impact of aerosol scattering on the retrieval of methane from airborne remote sensing measurements, Atmos. Meas. Tech., 13, 6755–6769, https://doi.org/10.5194/amt-13-6755-2020, 2020.
IPCC: Climate Change 2021: The Physical Science Basis, Contribution of Working Group I to the Sixth Assessment Report of the Intergovernmental Panel on Climate Change, Cambridge University Press, Cambridge, UK and New York, NY, USA, https://doi.org/10.1017/9781009157896, 2021.
Irakulis-Loitxate, I., Guanter, L., Liu, Y.-N., Varon, D. J., Maasakkers, J. D., Zhang, Y., Chulakadabba, A., Wofsy, S. C., Thorpe, A. K., and Duren, R. M.: Satellite-based survey of extreme methane emissions in the Permian basin, Science Advances, 7, eabf4507, https://doi.org/10.1126/sciadv.abf4507, 2021.
Jacob, D. J., Varon, D. J., Cusworth, D. H., Dennison, P. E., Frankenberg, C., Gautam, R., Guanter, L., Kelley, J., McKeever, J., Ott, L. E., Poulter, B., Qu, Z., Thorpe, A. K., Worden, J. R., and Duren, R. M.: Quantifying methane emissions from the global scale down to point sources using satellite observations of atmospheric methane, Atmos. Chem. Phys., 22, 9617–9646, https://doi.org/10.5194/acp-22-9617-2022, 2022.
Jervis, D., McKeever, J., Durak, B. O. A., Sloan, J. J., Gains, D., Varon, D. J., Ramier, A., Strupler, M., and Tarrant, E.: The GHGSat-D imaging spectrometer, Atmos. Meas. Tech., 14, 2127–2140, https://doi.org/10.5194/amt-14-2127-2021, 2021.
Jongaramrungruang, S., Matheou, G., Thorpe, A. K., Zeng, Z.-C., and Frankenberg, C.: Remote sensing of methane plumes: instrument tradeoff analysis for detecting and quantifying local sources at global scale, Atmos. Meas. Tech., 14, 7999–8017, https://doi.org/10.5194/amt-14-7999-2021, 2021.
Lauvaux, T., Giron, C., Mazzolini, M., d'Aspremont, A., Duren, R., Cusworth, D., Shindell, D., and Ciais, P.: Global assessment of oil and gas methane ultra-emitters, Science, 375, 557–561, 2022.
Li, F., Sun, S., Zhang, Y., Feng, C., Chen, C., Mao, H., and Liu, Y.: Mapping methane super-emitters in China and United States with GF5-02 hyperspectral imaging spectrometer, National Remote Sensing Bulletin, 0, 1–15, https://doi.org/10.11834/jrs.20232453, 2023.
Liu, Q., Yu, T., and Zhang, W.: Validation of GaoFen-1 Satellite Geometric Products Based on Reference Data, Journal of the Indian Society of Remote Sens.-Basel, 47, 1331–1346, https://doi.org/10.1007/s12524-019-01017-2, 2019.
Liu, Y.-N., Sun, D.-X., Hu, X.-N., Ye, X., Li, Y.-D., Liu, S.-F., Cao, K.-Q., Chai, M.-Y., Zhang, J., and Zhang, Y.: The advanced hyperspectral imager: aboard China's GaoFen-5 satellite, IEEE Geoscience and Remote Sensing Magazine, 7, 23–32, 2019.
Lu, X., Jacob, D. J., Wang, H., Maasakkers, J. D., Zhang, Y., Scarpelli, T. R., Shen, L., Qu, Z., Sulprizio, M. P., Nesser, H., Bloom, A. A., Ma, S., Worden, J. R., Fan, S., Parker, R. J., Boesch, H., Gautam, R., Gordon, D., Moran, M. D., Reuland, F., Villasana, C. A. O., and Andrews, A.: Methane emissions in the United States, Canada, and Mexico: evaluation of national methane emission inventories and 2010–2017 sectoral trends by inverse analysis of in situ (GLOBALVIEWplus CH4 ObsPack) and satellite (GOSAT) atmospheric observations, Atmos. Chem. Phys., 22, 395–418, https://doi.org/10.5194/acp-22-395-2022, 2022.
Muñoz-Sabater, J., Dutra, E., Agustí-Panareda, A., Albergel, C., Arduini, G., Balsamo, G., Boussetta, S., Choulga, M., Harrigan, S., and Hersbach, H.: ERA5-Land: A state-of-the-art global reanalysis dataset for land applications, Earth system science data, 13, 4349–4383, 2021.
Pandey, S., Houweling, S., Lorente, A., Borsdorff, T., Tsivlidou, M., Bloom, A. A., Poulter, B., Zhang, Z., and Aben, I.: Using satellite data to identify the methane emission controls of South Sudan's wetlands, Biogeosciences, 18, 557–572, https://doi.org/10.5194/bg-18-557-2021, 2021.
Qin, K., Hu, W., He, Q., Lu, F., and Cohen, J. B.: Individual Coal Mine Methane Emissions Constrained by Eddy-Covariance Measurements: Low Bias and Missing Sources, EGUsphere [preprint], https://doi.org/10.5194/egusphere-2023-1210, 2023.
Sánchez-García, E., Gorroño, J., Irakulis-Loitxate, I., Varon, D. J., and Guanter, L.: Mapping methane plumes at very high spatial resolution with the WorldView-3 satellite, Atmos. Meas. Tech., 15, 1657–1674, https://doi.org/10.5194/amt-15-1657-2022, 2022.
Saunois, M., Stavert, A. R., Poulter, B., Bousquet, P., Canadell, J. G., Jackson, R. B., Raymond, P. A., Dlugokencky, E. J., Houweling, S., Patra, P. K., Ciais, P., Arora, V. K., Bastviken, D., Bergamaschi, P., Blake, D. R., Brailsford, G., Bruhwiler, L., Carlson, K. M., Carrol, M., Castaldi, S., Chandra, N., Crevoisier, C., Crill, P. M., Covey, K., Curry, C. L., Etiope, G., Frankenberg, C., Gedney, N., Hegglin, M. I., Höglund-Isaksson, L., Hugelius, G., Ishizawa, M., Ito, A., Janssens-Maenhout, G., Jensen, K. M., Joos, F., Kleinen, T., Krummel, P. B., Langenfelds, R. L., Laruelle, G. G., Liu, L., Machida, T., Maksyutov, S., McDonald, K. C., McNorton, J., Miller, P. A., Melton, J. R., Morino, I., Müller, J., Murguia-Flores, F., Naik, V., Niwa, Y., Noce, S., O'Doherty, S., Parker, R. J., Peng, C., Peng, S., Peters, G. P., Prigent, C., Prinn, R., Ramonet, M., Regnier, P., Riley, W. J., Rosentreter, J. A., Segers, A., Simpson, I. J., Shi, H., Smith, S. J., Steele, L. P., Thornton, B. F., Tian, H., Tohjima, Y., Tubiello, F. N., Tsuruta, A., Viovy, N., Voulgarakis, A., Weber, T. S., van Weele, M., van der Werf, G. R., Weiss, R. F., Worthy, D., Wunch, D., Yin, Y., Yoshida, Y., Zhang, W., Zhang, Z., Zhao, Y., Zheng, B., Zhu, Q., Zhu, Q., and Zhuang, Q.: The Global Methane Budget 2000–2017, Earth Syst. Sci. Data, 12, 1561–1623, https://doi.org/10.5194/essd-12-1561-2020, 2020.
Schuit, B. J., Maasakkers, J. D., Bijl, P., Mahapatra, G., van den Berg, A.-W., Pandey, S., Lorente, A., Borsdorff, T., Houweling, S., Varon, D. J., McKeever, J., Jervis, D., Girard, M., Irakulis-Loitxate, I., Gorroño, J., Guanter, L., Cusworth, D. H., and Aben, I.: Automated detection and monitoring of methane super-emitters using satellite data, Atmos. Chem. Phys., 23, 9071–9098, https://doi.org/10.5194/acp-23-9071-2023, 2023.
Thompson, D. R., Thorpe, A. K., Frankenberg, C., Green, R. O., Duren, R., Guanter, L., Hollstein, A., Middleton, E., Ong, L., and Ungar, S.: Space-based remote imaging spectroscopy of the Aliso Canyon CH4 superemitter, Geophys. Res. Lett., 43, 6571–6578, https://doi.org/10.1002/2016gl069079, 2016.
Thorpe, A. K., Green, R. O., Thompson, D. R., Brodrick, P. G., Chapman, J. W., Elder, C. D., Irakulis-Loitxate, I., Cusworth, D. H., Ayasse, A. K., Duren, R. M., Frankenberg, C., Guanter, L., Worden, J. R., Dennison, P. E., Roberts, D. A., Chadwick, K. D., Eastwood, M. L., Fahlen, J. E., and Miller, C. E.: Attribution of individual methane and carbon dioxide emission sources using EMIT observations from space, Science Advances, 9, eadh2391, https://doi.org/10.1126/sciadv.adh2391, 2023.
Varon, D. J., Jacob, D. J., McKeever, J., Jervis, D., Durak, B. O. A., Xia, Y., and Huang, Y.: Quantifying methane point sources from fine-scale satellite observations of atmospheric methane plumes, Atmos. Meas. Tech., 11, 5673–5686, https://doi.org/10.5194/amt-11-5673-2018, 2018.
Varon, D. J., McKeever, J., Jervis, D., Maasakkers, J. D., Pandey, S., Houweling, S., Aben, I., Scarpelli, T., and Jacob, D. J.: Satellite Discovery of Anomalously Large Methane Point Sources From Oil/Gas Production, Geophys. Res. Lett., 46, 13507–13516, https://doi.org/10.1029/2019gl083798, 2019.
Varon, D. J., Jervis, D., McKeever, J., Spence, I., Gains, D., and Jacob, D. J.: High-frequency monitoring of anomalous methane point sources with multispectral Sentinel-2 satellite observations, Atmos. Meas. Tech., 14, 2771–2785, https://doi.org/10.5194/amt-14-2771-2021, 2021.
Zeng, Z.-C., Natraj, V., Xu, F., Chen, S., Gong, F.-Y., Pongetti, T. J., Sung, K., Toon, G., Sander, S. P., and Yung, Y. L.: GFIT3: a full physics retrieval algorithm for remote sensing of greenhouse gases in the presence of aerosols, Atmos. Meas. Tech., 14, 6483–6507, https://doi.org/10.5194/amt-14-6483-2021, 2021.
Zheng, C., Jiang, B., Xue, S., Chen, Z., and Li, H.: Coalbed methane emissions and drainage methods in underground mining for mining safety and environmental benefits: A review, Process Safe. Environ., 127, 103–124, https://doi.org/10.1016/j.psep.2019.05.010, 2019.
Zscheischler, J., Mahecha, M. D., Harmeling, S., and Reichstein, M.: Detection and attribution of large spatiotemporal extreme events in Earth observation data, Ecol. Inform., 15, 66–73, https://doi.org/10.1016/j.ecoinf.2013.03.004, 2013.
- Abstract
- Introduction
- Study area and used datasets
- Methods
- Results
- Summary
- Appendix A: Geometric localisation of GF-5B/AHSI images
- Appendix B: Statistics of the digital elevation for the origin from GF-5B AHSI detected plumes
- Appendix C: Examples of the integrated mass enhancement (IME) uncertainty calculation
- Appendix D: An example of the same plume target inside the nearest two full images
- Appendix E: CH4 emission flux rates from point source plumes in Shanxi, with an absolute wind speed uncertainty estimated by comparing wind speeds from EAR5 and local meteorological stations
- Data availability
- Author contributions
- Competing interests
- Disclaimer
- Acknowledgements
- Financial support
- Review statement
- References