 | 27 Nov 2023
Storm Franz: Societal and energy impacts in northwest Europe on 11–12 January 2007
Anthony J. Kettle
January 2007 was a bad storm month for much of central and northern Europe with a series of extratropical cyclones bringing high winds and precipitation to highly populated areas between Ireland and Russia. Although Storm Kyrill on 18–19 January 2007 was the most serious for its infrastructure damage and insurance costs, Storm Franz from the preceding week on 11–12 January 2007 was actually more serious for its maritime impacts in western Europe. This contribution takes a closer look at Storm Franz with an overview of its wind field and its impact on energy infrastructure, transportation networks and building damage. Maritime casualties are reviewed with respect to met-ocean conditions. The storm was notable for a series of wave-related accidents off southeast Ireland, the English Channel, and German Bight. An analysis is carried out on water level recorders around the North Sea to assess the storm surge and short period oscillations that may reveal harbour seiches or meteotsunamis. The results are compared with wave recorders, which had a fairly good coverage across the North Sea in 2007. The issue of wave damage to offshore infrastructure was highlighted in events associated with Storm Britta on 31 October–1 November 2006. Offshore wind energy in northwest Europe was in a growth phase during this time, and there were questions about the extreme met-ocean conditions that could be expected in the 20 year lifetime of an offshore wind turbine.
- Article
(7330 KB) - Full-text XML
-
Supplement
(14036 KB) - BibTeX
- EndNote


Storm Franz (name assigned by the Free University of Berlin) was a severe extratropical winter cyclone that impacted northern Europe on 11–12 January 2007. It was part of a storm series that passed across Europe during the month, starting with Storm Karla on 1 January 2007 and ending with Storm Lancelot on 20 January 2007 (Aktion Wetterpate, 2023; Kettle, 2023). Storm Kyrill on 18–19 January 2007 is considered the worst storm of the series for the magnitude of the damage costs and fatalities. However, it was not considered an important maritime storm mainly because its trajectory across the central North Sea led to extreme winds only in the southernmost area near the coasts of Belgium and the Netherlands (Kettle, 2023). Storm Hanno (or Storm Per as it is known in Norway and Sweden) on 14 January 2007 had a more northerly trajectory and was locally more important for Norway, Denmark, and Sweden (Air Worldwide, 2007b; Kvamme, 2007; SMHI, 2009). Storm Lancelot on 20 January 2007 occurred near the height of the monthly maximum tidal cycle and was significant for its maritime impacts in the central and northern North Sea. Storm Franz was important in the series because it was associated with a high North Sea storm surge and had a number of offshore accidents and fatal incidents.
The rise of offshore wind energy in northern Europe has focussed attention on environmental problems that were emerging for offshore operations. In the late 1990s, plans were formulated to establish large offshore wind farms in northern Europe, and this was facilitated by a knowledge base built up from shipping and petroleum operations starting in the late 1960s, and onshore wind energy from about 1980. The shipping and petroleum infrastructure was useful to construct and assemble the large offshore components of wind energy (e.g., DEA, 2005). However, the smaller wind turbines in near-shore areas had a different set of problems compared with large petroleum structures offshore. Sea salt corrosion damage turned out to be an important factor for turbine electrical components, and this required the replacement of all the turbine nacelles of the early Horn's Rev offshore wind farm in 2004 (ModernPowerSystems, 2004). The methods to attach wind turbines to sea floor foundations – using grout connections adopted from the petroleum industry – were not appropriate for the met-ocean turbulence conditions encountered and led to problems in early wind farms (Diamond, 2012). Also, sea bed scour was an important problem at most offshore wind farm sites, leading to exposed power transmission cables in some areas (Diamond, 2012). Kurth et al. (2022) clarify that export cable damage accounts for three quarters of the insurance claims related to damage at offshore wind farms. Damage from lightning strikes is a general problem for wind turbines, with at least 4 %–5 % of onshore turbines being hit by lightning annually (Sorensen et al., 2001). Extreme wind speeds are a threat to wind power, especially in cyclone prone areas of the US and Asia (Diamond, 2012; Rose et al., 2012), with a series of documented damage cases from India (Winther-Jensen and Jørgensen, 1999) and east Asia (Chen and Xu, 2016). In Europe, the potential winter storm threat for offshore wind energy had been highlighted by Fehrmann and Fackler (2010). However, winter storms in Europe infrequently reach the level of a category 1 hurricane. It is rare for multiple wind turbines to collapse on a single wind farm during strong winter storms in Europe, as has been documented for certain land falling cyclones in Asia. Waterspouts – tornadoes over extended water bodies – may represent a more serious threat to offshore wind farms based on prevalence statistics from eye-witness accounts (Dotzek et al., 2010), and the destructive impact of a tornado on a wind farm has been documented by an impact case in the U.S. (Wind-Watch, 2012; ErtekProjects, 2023).
In spite of the predicted problems, the accident track record for offshore wind turbines during routine operation in Europe outwardly appears good with only a few documented cases of major structural failures (4coffshore, 2015; Wind Action, 2018; Ørsted, 2022; The Journal, 2022; see also Sect. S17 in the Supplement), as opposed to construction accidents, start-up problems (Feng et al., 2010), or ship collisions (Recharge, 2022; Electrek, 2023). Lightning strike rates have emerged as a particular problem for offshore wind turbines in their exposed setting, but Becerra et al. (2018) highlight that actual strike rates on wind turbines are several times higher than theoretical predictions. Some evidence indicates that the North Sea during winter storms can yield extreme waves with the capacity to damage offshore wind infrastructure, as demonstrated by wave strikes on the FINO1 offshore meteorological tower during storms on 2006, 2007, 2009, and 2013 (Neumann and Nolopp, 2007; Outzen et al., 2008; Fischer et al., 2010; Pleskachevsky et al., 2012; FINO1, 2014). In particular, the wave strike on 1 November 2006 caused damage up to a level just below the main deck at 20 m above sea level, and high frequency water level recordings appear to reveal one of the largest waves ever documented in the region (Pleskachevsky et al., 2012).
To understand the storm wave threat to offshore wind infrastructure, it is important to review the evidence of extreme met-ocean conditions during past severe storms. This contribution reviews Storm Franz, which crossed Europe on 11–12 January 2007 and was known particularly for its maritime damage. An overview of the environmental conditions and societal impacts is presented (the Supplement gives a full literature list), followed by a detailed analysis of the storm surge, wave events, and maritime incidents. The contribution follows similar reports for Storm Anatol in 1999, Storm Britta in 2006, Storms Kyrill and Tilo in 2007, and Storm Xaver in 2013 (Kettle, 2018, 2019, 2020, 2021, 2023) with new approaches including available wave information.
Descriptions of the development and life history of Storm Franz are presented in the Unwetterzentrale (2007a) and FU-Berlin (2007) with additional information about its trajectory and central pressure development from the PRIMAVERA database (Lockwood et al., 2022). The storm was tracked from the western Atlantic Ocean near Newfoundland on 9 January 2007. It deepened rapidly during its eastward passage toward Europe, and there were time intervals during its development when the rate of pressure decrease exceeded 1 hPa per hour, the threshold of explosive cyclogenesis (Sanders and Gyakum, 1980). The storm reached its minimum pressure of 948 hPa south of Iceland at 21:00 UTC on 10 January 2007. The storm low pressure centre then split into two with the main part (Franz I) following a northeastward trajectory through the Norwegian Sea. A secondary low pressure centre (Franz II) moved rapidly eastward on high altitude wind currents (Unwetterzentrale, 2007a) and passed through the Skagerrak, southern Sweden, and the Baltic Sea before dissipating in Russia. The trajectories shown in this report have been constructed from two storm tracks from the PRIMAVERA database. Section S1 gives more information about the trajectory and development of the central pressure of the storm.
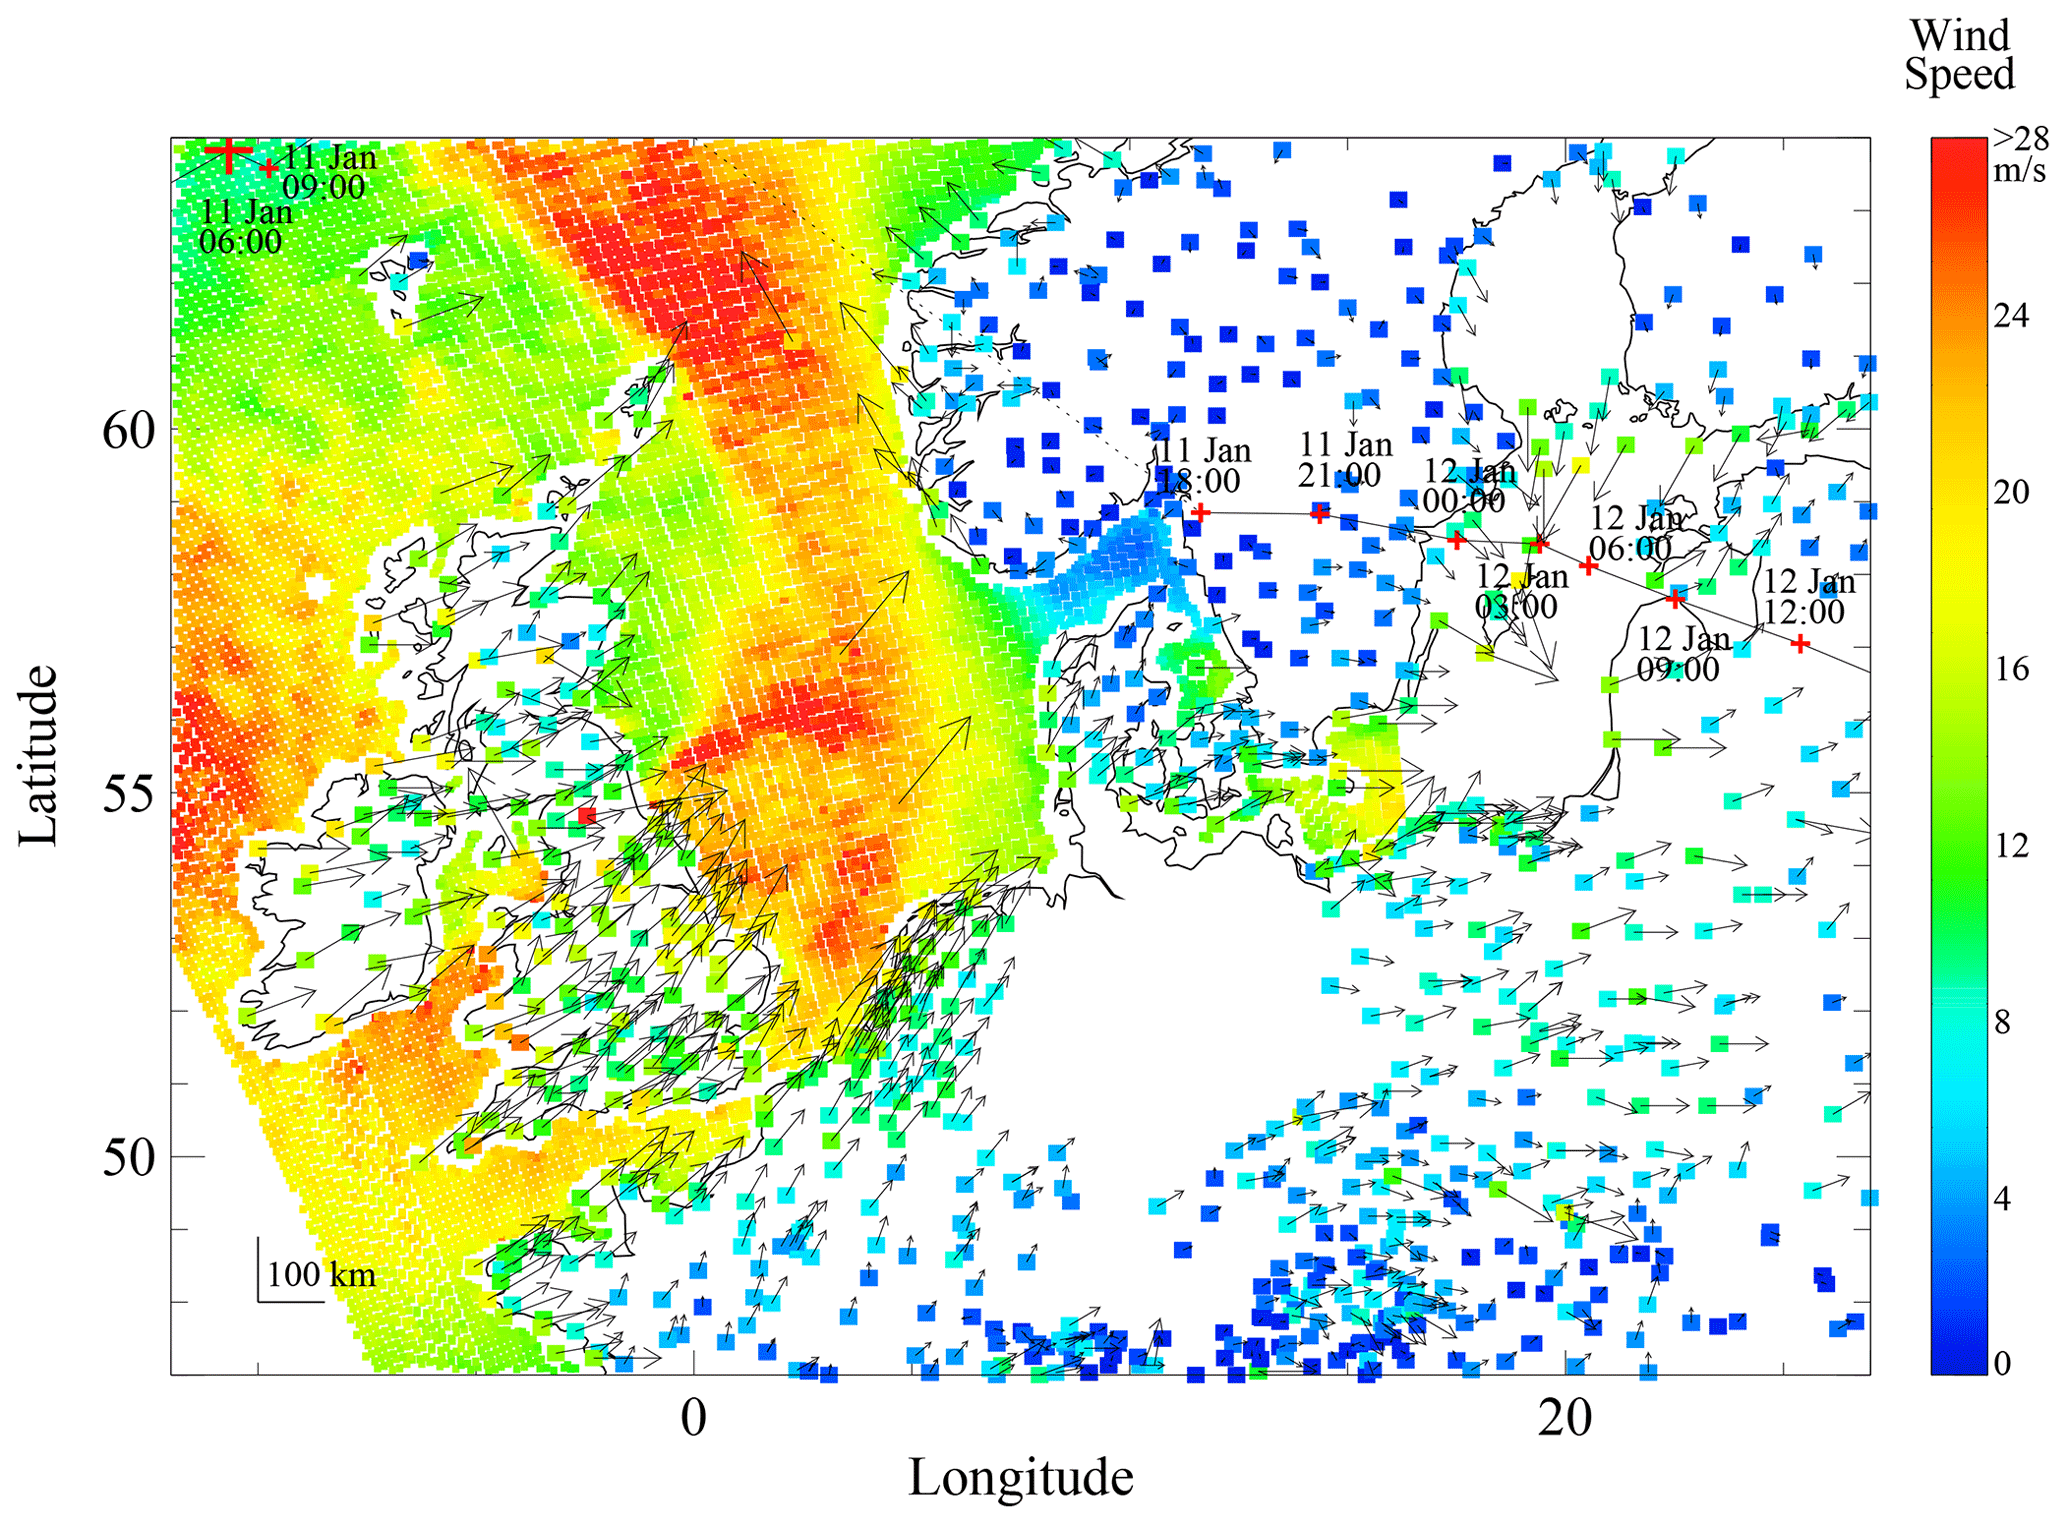
Figure 1Wind speed and direction for Storm Franz at 06:00 UTC, 11 January 2007 from selected stations of the USAF data set. The trajectory of the low pressure centre is indicated by the black line with red crosses at 3 h intervals (Lockwood et al., 2022). The location of the pressure centre at the time of wind field is shown by a larger cross. QuikSCAT sea surface wind speeds are shown for a satellite overpass at about 05:05 UTC or ∼55 min before the synoptic station reports.
The high winds associated with the storm were noted for European countries south of the path of the trajectory, stretching from Ireland and the UK in the west to Russia in the east and from Scotland and Denmark in the north to Switzerland and Austria in the south. The distribution of wind impacts indicates that the most serious gusts may have occurred in western Europe, particularly Ireland, Wales, and England in early 11 January 2007, and this is consistent with the culmination point of the storm south of Iceland. Reports from Germany and central Europe emphasized the presence of hurricane gusts associated with the southward passage of a cold front on 11 January 2007 (Unwetterzentrale, 2007a). Figure 1 shows a map of the surface wind field at 06:00 UTC on 11 January 2007 at the time when many wind-related damage incidents were occurring in England and Wales. Figures S2.1 to S2.12 in the Supplement show maps of the near surface wind at 3 h intervals between 10 January 2007, 21:00 UTC, and 12 January 2007, 06:00 UTC, when the storm was passing across northern Europe. There was one documented case of a tornado at the village of 't Veld on the north coast of Netherlands (ESWD, 2022), with possible indications of a waterspout at the German island of Borkum (Unwetterzentrale, 2007a). Reprocessed QuikSCAT data (Fore et al., 2013) from the early morning overpass of the satellite indicated strong south-westerly winds in the northern and central North Sea when the low pressure centre was moving into the southern Norwegian Sea (Figs. 1 and S3.2). Patchiness in the spatial wind speed fields was evident in the North Sea, and this is a possible indication of the travelling convective gust field that has been linked to rogue waves in certain circumstances (Pleskachevsky et al., 2012). The evening overpass of the QuikSCAT satellite on 11 January 2007 revealed the presence of continuing strong west winds in the north-western and central North Sea (Fig. S3.3).
Tropospheric upper air dynamics was an important consideration in understanding the impacts of the northern European storms of mid-January 2007. Pinto et al. (2014) indicate that the damaging low pressure systems during the period moved in close association with upper atmospheric wind-jets over the northeast Atlantic and western Europe as a connected chain of features. Some of the surface gust damage for Storm Franz (and particularly for Storm Kyrill) may have been linked with high wind speed jets in the middle troposphere. The available European radiosonde information from the period is summarized in Sect. S4 with Fig. S4.1 showing a map of the available radiosonde launches. Figures S4.2–S4.4 show time series plots of the vertical wind speed profiles for Valentia in southwest Ireland, Nottingham in central England, and De Bilt in the Netherlands. The stations are close to areas of severe damage and weather-related accident clusters during Storm Franz. They reveal the downward penetration of high wind speed jets to 5 km altitude from the normal Jet Stream tropopause height at 10 km during Storm Franz on 11 January 2007 and Storm Kyrill on 18 January 2007. Latitude-height sections of the radiosonde wind speed profiles on 00:00 and 12:00 UTC on 11 January 2007 and 00:00 UTC on 12 January 2007 (Figs. S4.5–S4.7) show that the mid-tropospheric wind jets were present especially in western Europe at 50–55∘ N.
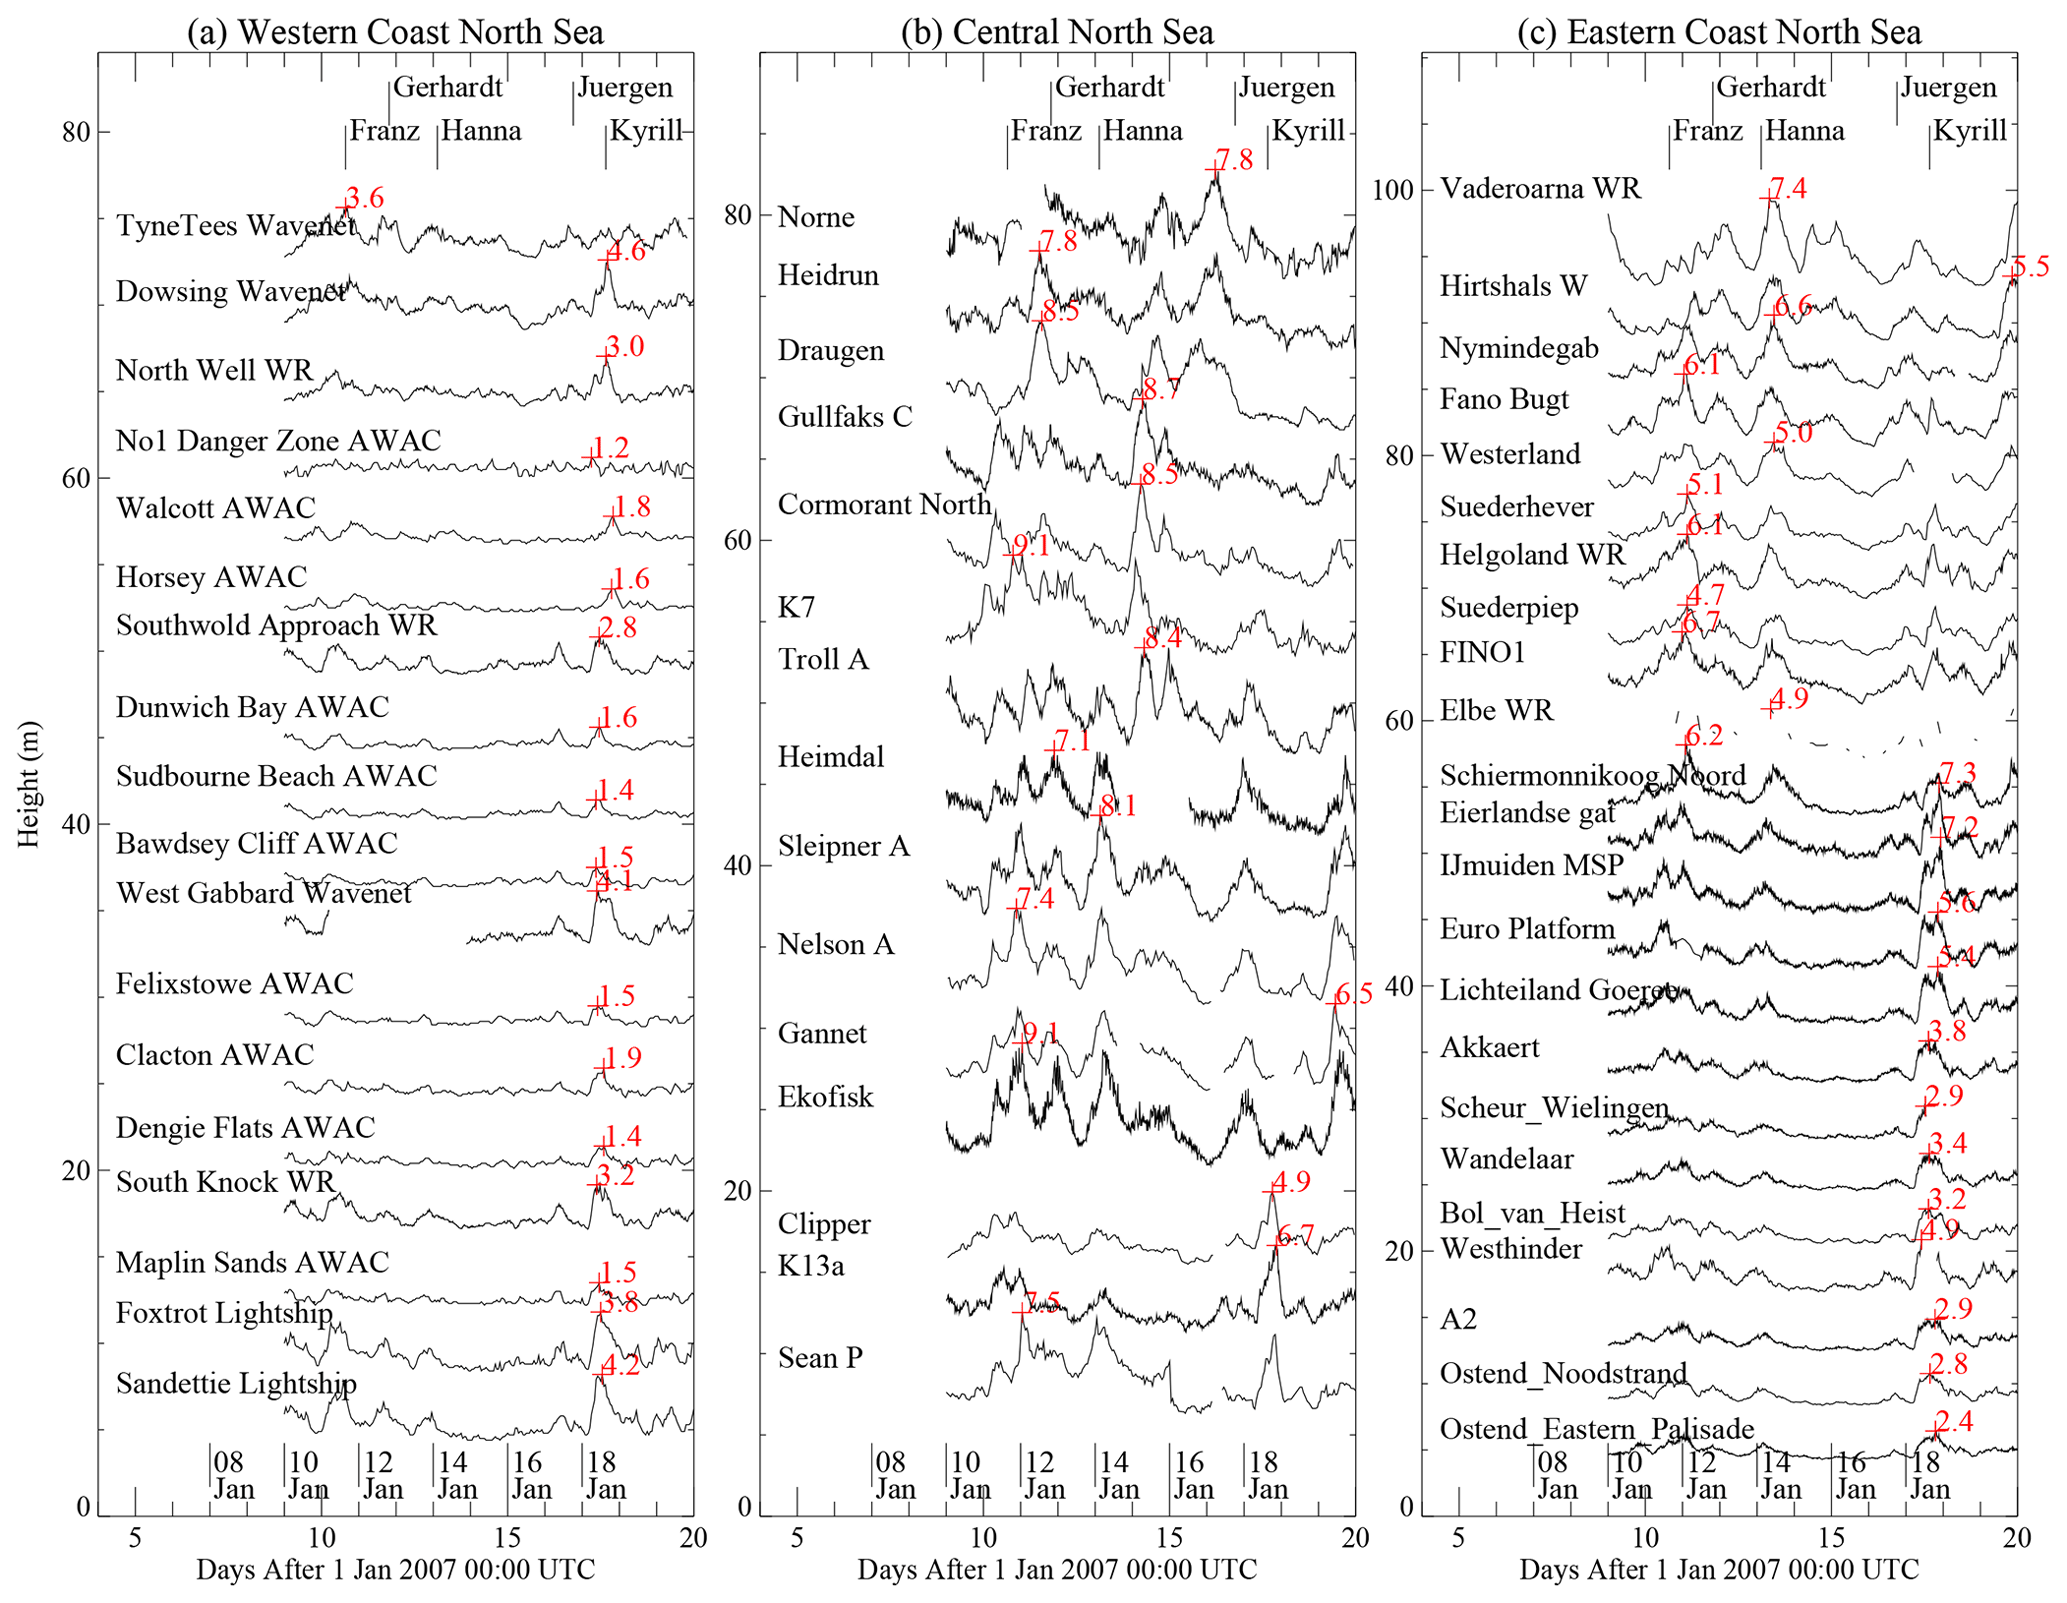
Figure 2Time series of significant wave height in North Sea for 10–20 January 2007: (a) western side (measurements near UK coast), (b) central (measurements at offshore platforms plus the K7 buoy west of Shetlands), (c) eastern side (measurements near the coasts of Belgium, the Netherlands, Germany, Denmark, and Sweden). The time series have been vertically offset for clarity, and the stations in each panel have been arranged according to latitude. The highest significant wave height of the time series is labelled in red.
The offshore wave field is linked to the wind field, and a summary of wave measurements in northwest Europe is presented in Fig. 2 with additional information in Sect. S5. Figure 2 shows time series of significant wave height for the period 10–20 January 2007 with panels showing stations grouped along the coast of the UK, central North Sea and Norwegian Sea, and the coast of mainland Europe between Belgium and Sweden. The information is presented to highlight the relative impact of the storms for different North Sea regions. While Storm Kyrill generated the highest significant wave heights in the southern North Sea along the coasts of England, Belgium, and the Netherlands, Storm Franz generated the highest significant wave heights along the North Sea coasts of Germany and southern Denmark, as well as offshore areas in the central North Sea. Storm Hanno – mainly linked with impacts in Scandinavia – had the largest significant wave heights of the period in northern Denmark and Sweden as well as offshore areas in the northern North Sea.
Storm Franz had important impacts on societal infrastructure. These are summarized in a series of thematic maps for power outages and other energy related impacts (Fig. S6.1), air transport impacts (Fig. S6.2), ferry and port interruptions (Fig. S6.3), rail transport interruptions (Fig. S6.4), road transport interruptions (Fig. S6.5), damage to buildings and monuments (Fig. S6.6), and fatalities and injuries (Fig. S6.7). Most of the information compiled in the maps has been taken from online media and insurance reports, and the European Severe Weather Database (ESWD, 2022) is an important source of information particularly for central Europe. Power outages affected thousands of people in the UK, Poland, Czech Republic, and Austria (Air Worldwide, 2007a). Within the UK, Wales was particularly hard hit with power cuts for 80 000 properties (BBC, 2007a, d). At the new UK offshore wind farms in the Irish Sea and North Sea, the strong winds from the January 2007 storms affected operations differently with some wind farms showing an increase in power production and one (Barrow) having downtime from high load faults (Feng et al., 2010). The Caithness Wind Farm (2023) database cites damage incidents for two wind turbines during the storm period, including the collapse of a large onshore turbine in Germany. The offshore wind energy research platform FINO1, north of Borkum, experienced some damage to a radar apparatus at the level of the main deck 20m above sea level (Hüppop et al., 2009), and tornado activity had been documented at nearby coastal locations. Media reports document some disruption to the air transport network, mainly in the British and Irish Isles (Air Worldwide, 2007a; Guardian, 2007). There were rail transport interruptions mainly in the UK that were associated with fallen trees on the rails (BBC, 2007b), and there were two reports of cut rail links in northern Germany also from fallen trees (Rheinische Post, 2007). Some of the rail problems in the UK were due to flooding, highlighting the large amounts of rainfall associated with this storm. The reports of road transport problems covered a greater area than the rail problems but still emphasized the UK as a focus area in western Europe. Fallen trees figure prominently in media reports of road closures, although there were several reports of road closures in Wales due to flooding and even landslips (BBC, 2007a). High winds led to a number of bridge closures or traffic warnings in the UK and Denmark (BBC, 2007a, b; Belfast Telegraph, 2007; DR, 2007; Herald, 2007), and there were reports of overturned trucks in England, Belgium and Germany. Ferry disruptions were extensive, including interrupted connections across the Irish Sea, English Channel, Isle of Wight, Friesland islands of Germany, and Baltic Sea (BBC, 2007b; DR, 2007; Lloyd's Casualty Week, 2007a). The high storm surge led to minor flooding at the port at Hamburg (FAZ, 2007; Ge et al., 2014), and dune collapse was registered at several barrier islands in the German Bight (see Fig. S7.1; NLWKN, 2007). Several storm protection barriers were closed in Germany (NLWKN, 2007), but not in the Netherlands (RWS, 2007). Building damage was registered between Wales in the west and Poland and Austria in the east (BBC, 2007a; ESWD, 2022). This was mainly associated with roofs damaged or lost by wind gusts with a few reports of houses damaged by fallen trees. While there were many media reports of fallen trees causing transport interruptions and infrastructure damage, the loss of whole stands of forest with its resultant economic impact was not an issue for this storm. Most of the fatalities during the storm occurred with the sinking of two trawlers off the southeast coast of Ireland (MCIB, 2008, 2009), and a ship steward was washed from an underway Russian cargo vessel in the English Channel (BBC, 2007b, c). These incidents occurred near the beginning of the storm on the evening of 10 January and morning of 11 January at about the time when the storm central pressure reached its lowest point near Iceland, over 1000 km to the north.
Water level data from tide gauges around the North Sea are analysed to trace the progress of the storm surge and to investigate the short period component of water level variation that may be linked with meteo-tsunamis or infragravity waves. The same procedure was followed as in the previous storm investigations of Kettle (2018, 2019, 2020, 2021, 2023) with minor modifications. Tide gauge water level data in the North Sea will typically contain a number frequency components comprising the semi-diurnal tide (∼12 h), longer period surge component (on the order of days), and a shorter period seiche component from harbour oscillations or meteotsunamis (on the order of minutes or 10s of minutes). For most locations around the North Sea, water level variations are dominated by the tidal component, although the tidal range depends on the section of coast. The tide must be modelled and subtracted from the measured water level time series to isolate the surge residual, which may be larger than the tidal range for bad winter storms (Pugh, 1987). The surge residual originates from high winds forcing water onto a leeward coast, from the possible effect of a travelling external surge entering the North Sea over Scotland, and from the rise of water under the storm low pressure area (i.e., inverted barometer effect). Wave setup can also augment storm surge water levels for wind waves breaking on the coast (US Army Corps of Engineers, 1984; Pugh, 1987).
The tide gauge data preparation is the same as for Storm Kyrill (Kettle, 2023), and the results for both storms were derived from the same 16 d data segment. Briefly, the data to investigate the surge originate from the national water level monitoring agencies of the UK, Belgium, the Netherlands, Germany, Denmark, and Norway. The data discretization for the different national authorities was either 1 (Germany), 5 (Belgium), 10 (Netherlands, Denmark, Norway), or 15 min (UK). The 1 min data for Germany were averaged onto a standard 10 min grid before analysis, but otherwise all the other datasets were used without modification. Preliminary checks were made to ensure that there were no extended data gaps or data irregularities across the 16 d period (from 8–23 January 1999, inclusive) encompassing the storm period. A few of the time series had minor data gaps that could be linearly interpolated, and this is described in further detail in Kettle (2023) . The source and key characteristics for the data sets are shown in Table S8.1 in the Supplement with a list of rejected stations in Table S8.2. Altogether, 93 stations were used in the analysis after the quality control steps. There was a high spatial density of stations, particularly along the coasts of the Netherlands and Germany.
The spectral analysis to separate the main frequency components is the same as Kettle (2023). The procedure uses a discrete Fourier transform to convert the detrended time series into a power spectrum (Stull, 1988) and is similar to earlier applications of the method by Gönnert et al. (2004) and Kettle (2018, 2019, 2020, 2021). Then the spectral plots are used to empirically assess the frequency thresholds for the different water level components: long period (mostly storm surge), short period (mostly harbour seiche or meteotsunami), and tidal (diurnal plus semidiurnal, combined). Figure S9.1 graphically shows the frequency thresholds that were used to define the spectral components for a sample station at Aberdeen. A Fourier filter was used to de-tide the time series; i.e., the time series were reconstructed from the spectral domain, clipping out the narrow spectral bands for the diurnal (∼24 h) and semidiurnal (∼12 h) tidal components. The 0.2 d (or 4.8 h) threshold was chosen to separate the long-period and short-period reconstructions. This choice of threshold is similar to previous studies that have aimed to isolate meteotsunami signals in water level data showing a strong tidal component (Monserrat et al., 2006; Pattiaratchi and Wijeratne, 2015). However, there is some subjectivity in the selection of this threshold, and Zemunik et al. (2021) used a 2 h cut-off threshold to isolate a meteotsunami signal in the high-resolution 1 min data sets in the MISELA database.
There is a potential tide gauge levelling problem that was identified in Kettle (2021, 2023). It originates from the observation that the average levels of most of the downloaded data sets (except for Belgium) were a few tens of centimetres above the official sea levels, and could not be resolved with the water level variations expected on a monthly or seasonal basis (Fig. S10.1). This issue had to be addressed to compare the results of the present study with literature reports. For the present investigation, values of skew surge and true surge are adjusted upward by the amount of their apparent sea level inconsistency to compare with literature reports. Figures S10.2 and S10.3 illustrate the impact of these corrections for the maximum true surge and skew surge in comparison with literature values. Literature reports of skew surge from Germany reference maximum water levels to the long-term average high tide and not the high tide value nearest the storm maximum water level. These stations are denoted with different symbols in the skew surge graph, but no corrections are otherwise applied.
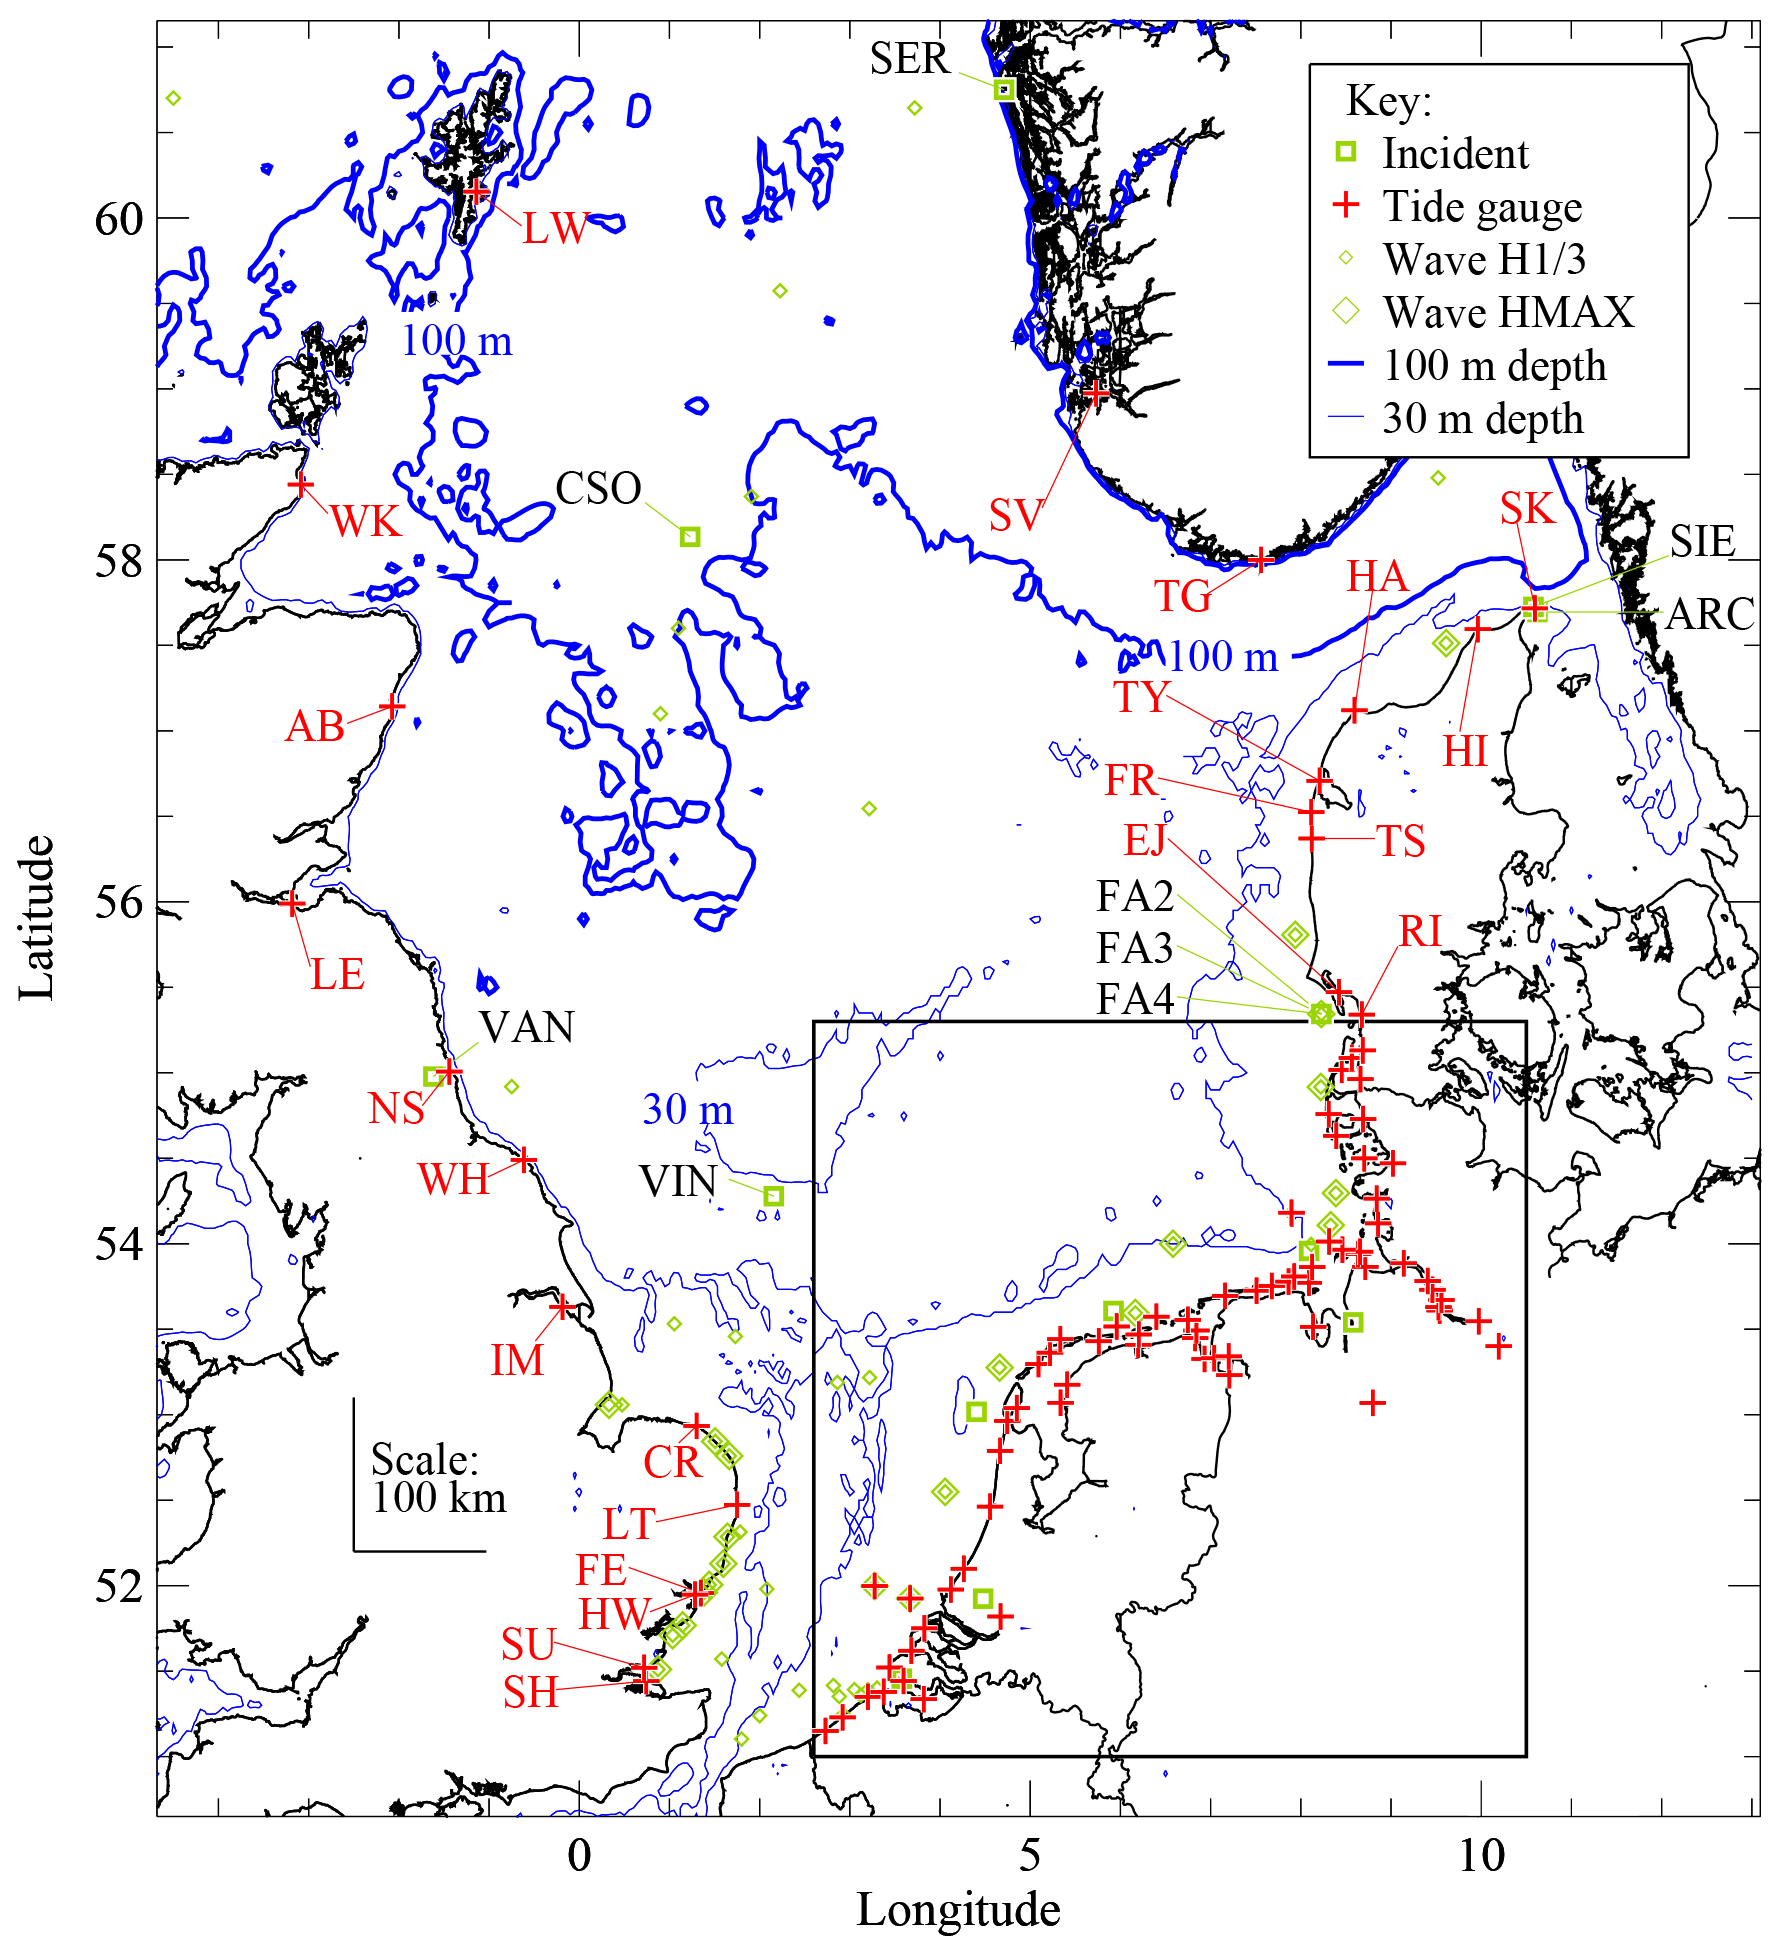
Figure 3Location of tide gauges analyzed in this study and of North Sea maritime incidents that were reported over the 2 d period 11–12 January 2007. For presentation clarity, the information in the inset box covering the south-eastern North Sea is shown in Fig. 4. The abbreviation codes for the tide gauges and maritime incidents are explained in Tables S8.1 and S11.1.
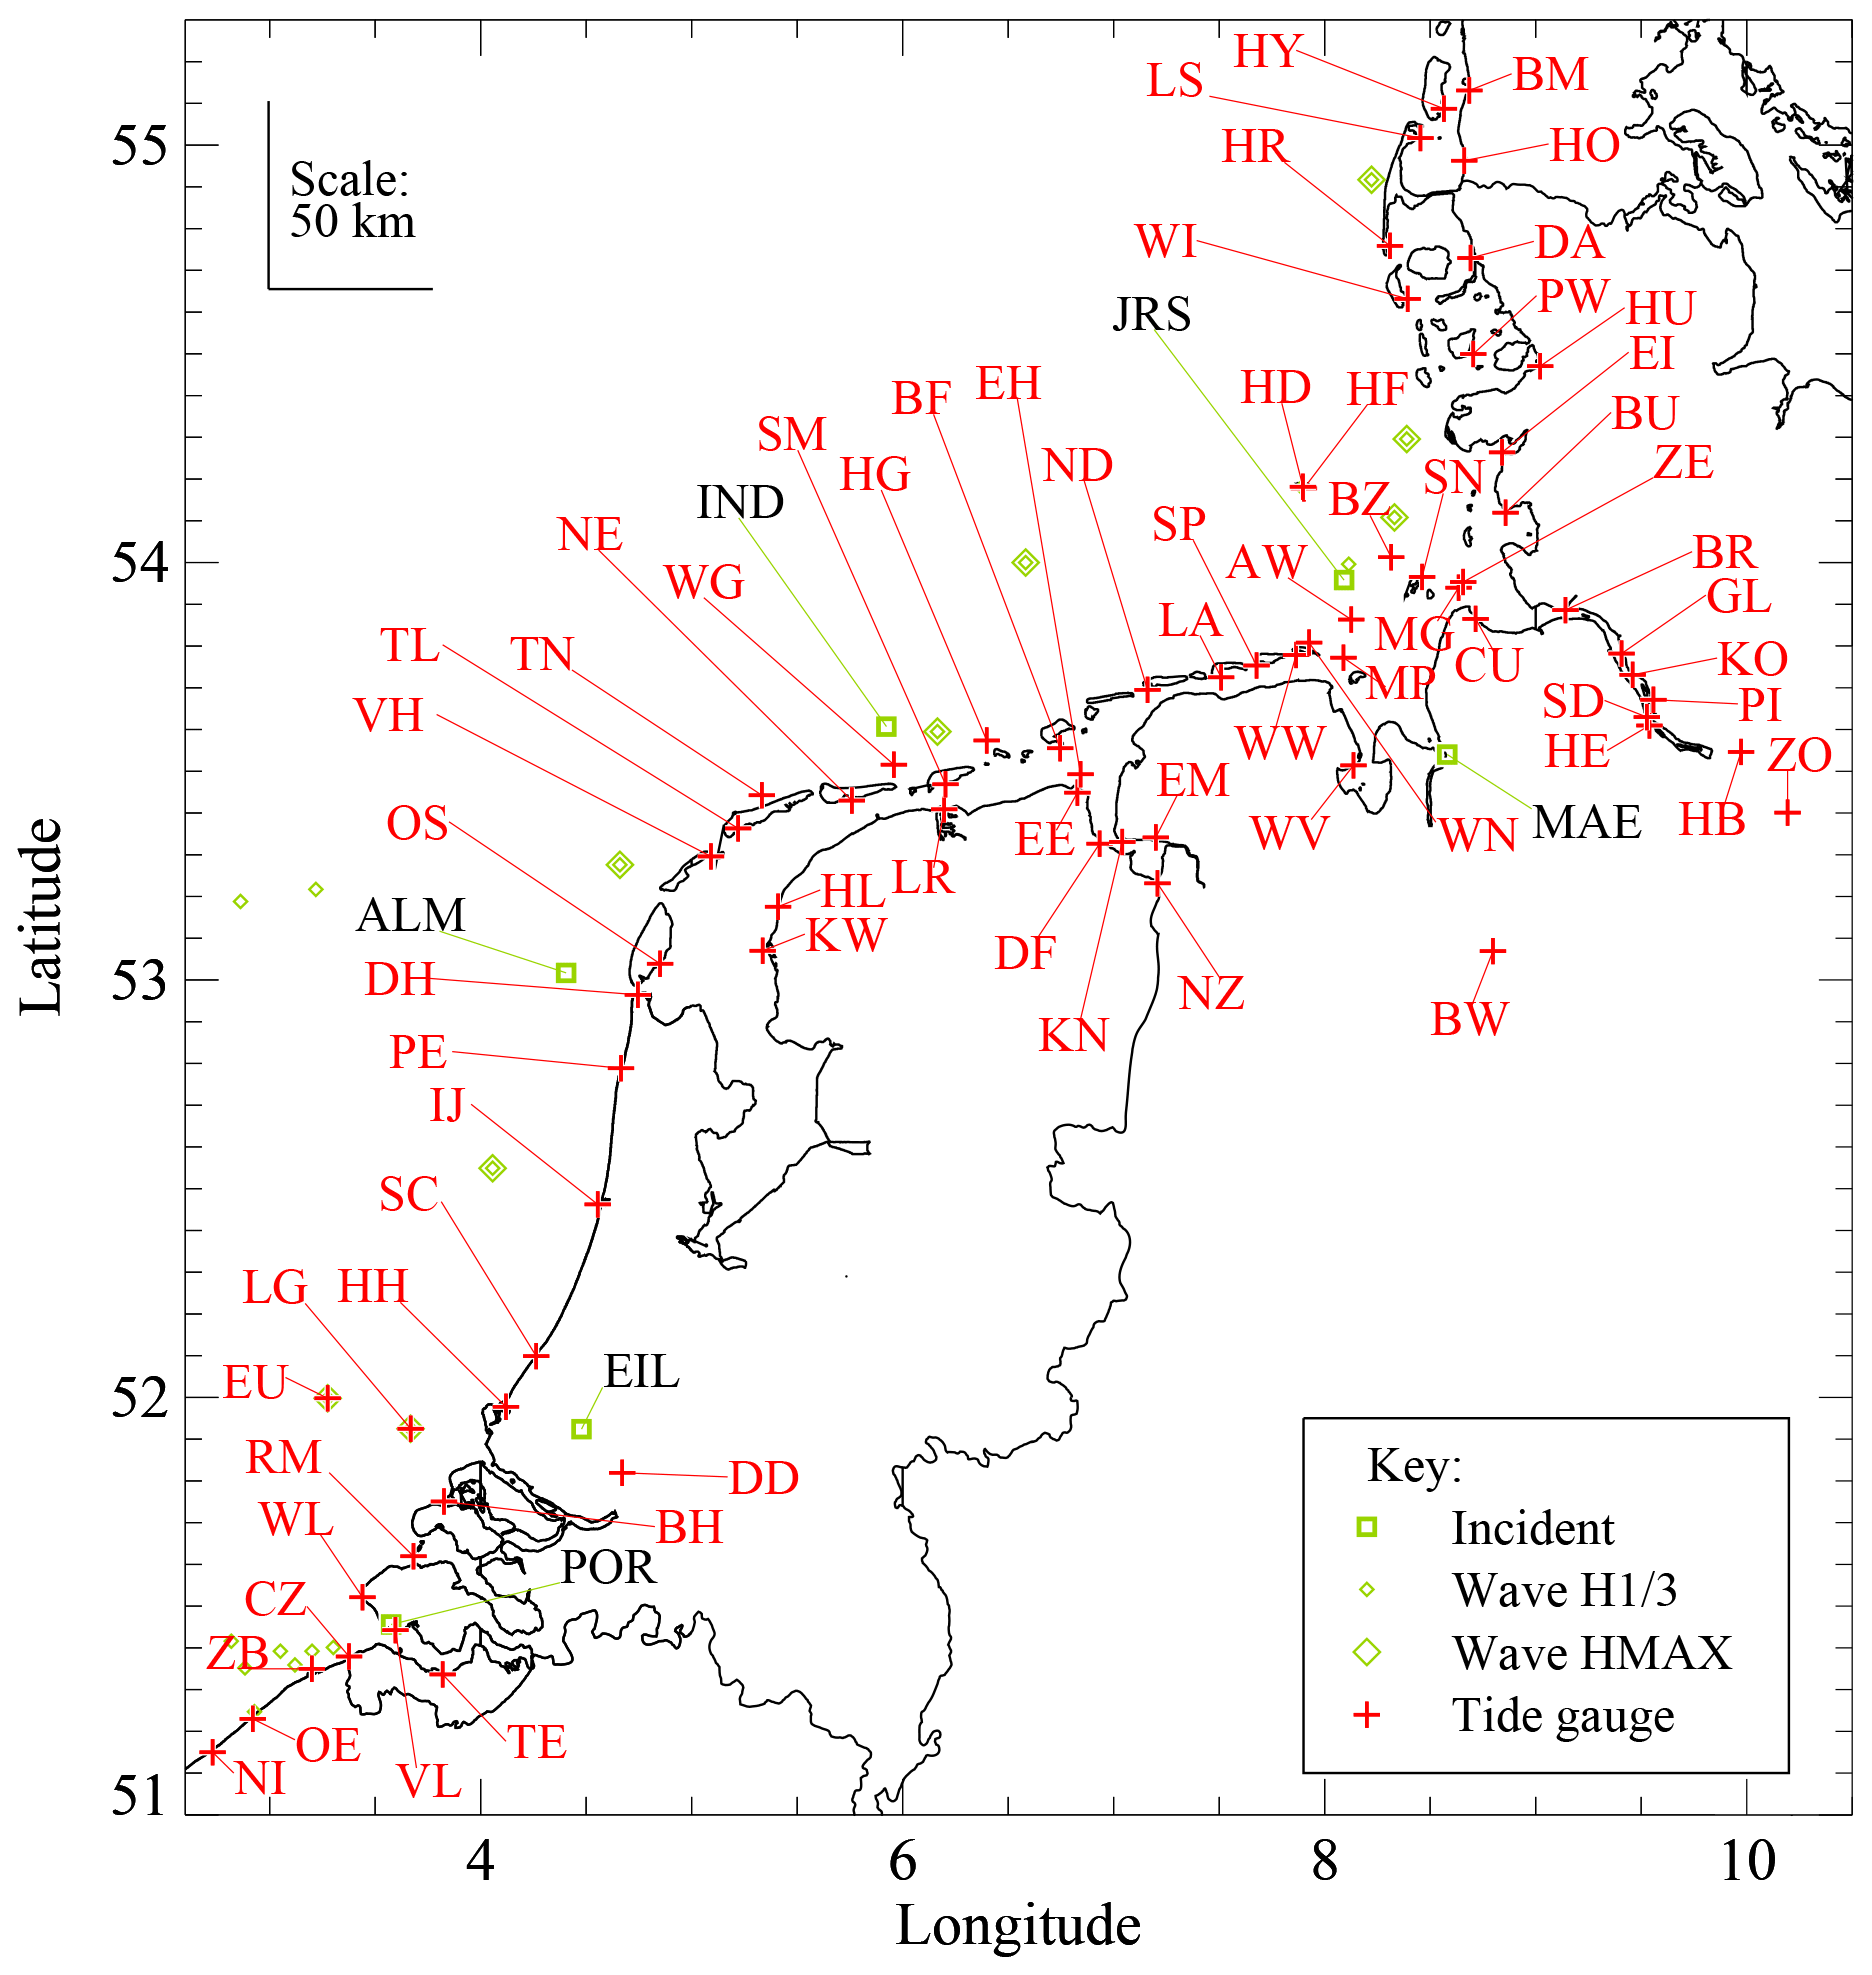
Figure 4Location of tide gauges and maritime incidents along the North Sea coasts of the Netherlands, Germany, and southern Denmark. The abbreviation codes for the tide gauges and maritime incidents are explained in Tables S8.1 and S11.1.
A short database of maritime incidents in the North Sea area was compiled to compare with the largest events in the short period reconstruction of the water level time series (i.e., with characteristic periods <0.2 d). These were gathered mostly from Lloyd's Casualty Week (2007a, b), and supplemented by one accident investigation report (BSU, 2008). For many of these reports, weather and wave conditions are mentioned (Almar, CSO Orelia, Grande Portogallo, Sierra Lara, Vindo), usually to clarify the circumstances of the incident or complications in recovering a marine casualty. Although most of the incidents relate to vessels that are underway, some accidents are due to vessels being torn from moorings in harbour (Eiltank 4, Maersk Wave, Vans Queen). Sometimes, the maritime accident is attributed directly to a point incident of an extreme weather event or a rogue wave (JRS Canis). More often, a mechanical/electrical failure or grounding is reported without mention of the environmental conditions (Arctic Sea, Independent, Server), although from the time and location, it is known that it is in the middle of a significant storm. Most the maritime incidents could be located precisely in latitude and longitude, and fairly precisely in time. Rarely, there is an inconsistency in the incident report (Grande Portogallo), but this did not cause problems in identifying the time and location of the event for this storm. Altogether, 12 maritime incidents were identified in the North Sea. The location of these is shown in Figs. 3 and 4 with additional information in Table S11.1. The JRS Canis incident – a ship losing containers overboard during an extreme wave event – is an interesting test of the combined water level and wave analysis presented here. The accident report (BSU, 2008) emphasized an unexpected ship instability in special wave conditions, but as shown below, there may have been unusually high waves linked to the passage of the storm surge.
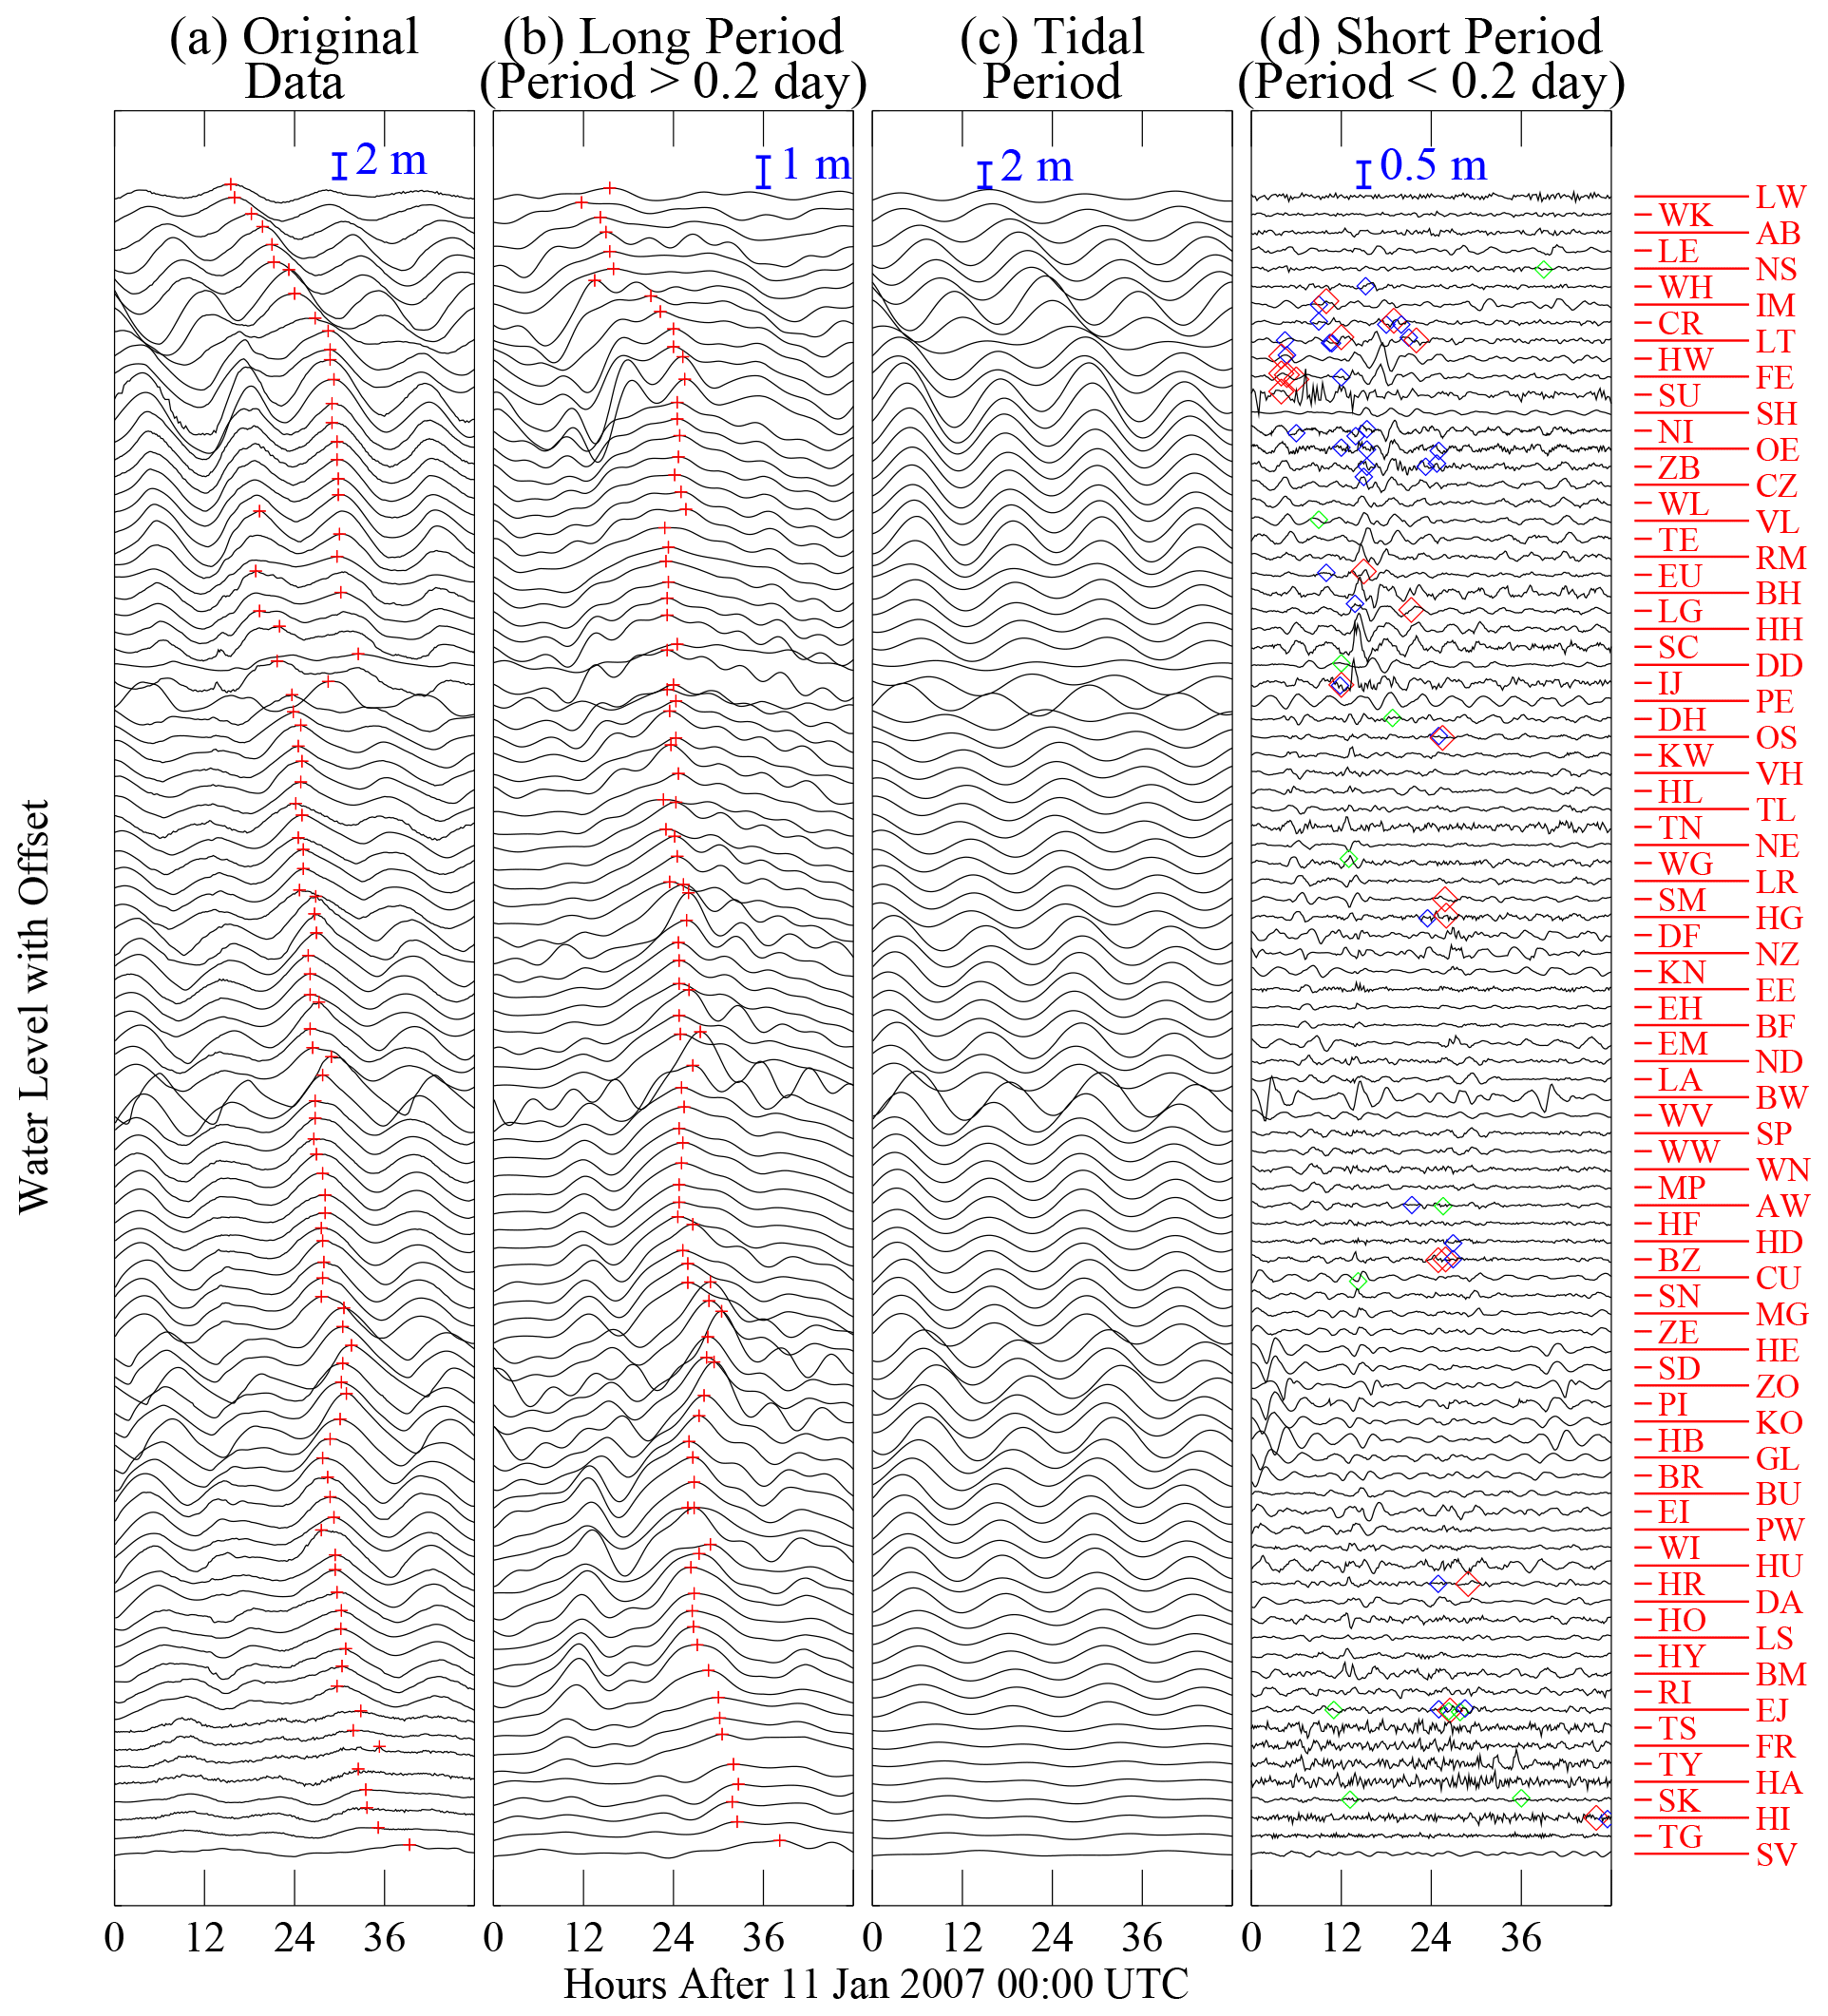
Figure 5Time series of the (a) original water level data, and reconstructions of the (b) long period, (c) diurnal plus semi-diurnal tide, and (d) short period components of the original time series. The station identifications are given by two letter codes along the right hand side of the last panel. The stations have been vertically offset according to their relative arrangement counter-clockwise around the North Sea, starting from Lerwick in Scotland at the top and ending with Stavanger in Norway at the bottom. In the first two panels, red vertical crosses indicate the maximum of the data segment shown. In the last panel, diamonds mark the time of events at the closest tide gauge station: green for maritime incidents, blue for maximum significant wave height and red for maximum wave height.
In addition to the maritime accident reports, information was drawn from the time series of wave statistics available in the North Sea area. Many wave recorders were in operation along the coasts of England, Belgium, the Netherlands, Germany, Denmark, and Sweden, in addition to a series of measurements from petroleum platforms in the central North Sea and Norwegian Sea. Different wave measurement methods are used, including acceleration-integration techniques, range-finding approaches using down-looking radar or laser instruments, and side-looking radar systems whose backscatter signal is calibrated. A typical site will have only one instrument installed, with radar instruments preferred at offshore platforms for operational convenience. However, the Ekofisk petroleum complex in the central North Sea has multiple independent wave measurement systems in operation, based on laser and radar range-finding in addition to an acceleration-integration system: the Datawell Waverider buoy (Magnusson, 2009a, b, 2013). The Datawell Waverider has some recognized measurement biases, but is regarded as a reference standard in the offshore industry (Magnusson, 2009a), and responds to the forces of the wave field in a similar manner as an engineered structure or a ship. The raw data output from the Datawell Waverider is a high frequency record of water level from which the statistics of individual waves can be generated usually over a time interval of typically 20 min, encompassing the passage of several hundred waves. Mostly, high resolution water level time series are not made available by measuring agencies, even though the file sizes are not large (Magnusson, 2009b). Instead, lower resolution time series of wave statistics – diagnostics based on wave height and period – are provided for Internet download, and this has mostly been used here. Certain statistics may be more useful in describing extreme wave events. Significant wave height is almost universally reported and has been used in the present study. The maximum wave height information is often registered by wave recorders, but is not always reported, and has also been used here where available.
Details of the data quality control processes are typically not presented with wave statistics, and there have been reports that some of the data cleaning procedures may be too vigorous and removed valid data (Magnusson, 2009b). Sometimes there are cases where wave information from an Internet archive has small changes compared to its presentation in initial reports (Matelski et al., 2014), possibly due to data cleaning procedures before final archival. In a review of rogue waves from one of the largest noncirculating wave datasets, Christou and Ewans (2011) describe quality cleaning procedures that might have filtered out the largest documented waves in the southern North Sea (Pleskachevsky et al., 2012). Using such a filtered data set, the assessment of the occurrence of the largest rogue waves may be biased. For the highest sea states, consideration also has to be given to the mounting height of downward-looking range finders. At Ekofisk, for example, the mounting height of the LASAR rangefinder array (Krogstad et al., 2009) would have not have captured the full profile of the large waves that caused damage to North Sea offshore platforms in 1990 (Magnusson, 2009a) and 2006 (PTIL, 2007). In spite of potential limitations, 63 time series of significant wave height and 22 time series of maximum wave height have been assembled for this study (see Sect. S5). For each time series, the highest value in the 2 d record for Storm Franz 11–12 January 2007 has been identified and appended to the list of ship accidents. Finally, several additional records of unusually high waves from the Fanø Bugt wave recorder on the Danish west coast have been added to the analysis. These large measured waves may be due to an instrument measurement error. However, for certain storms the high wave records sometimes appear in more than one Danish wave recorder (especially off northwest Jutland), lending some support to a valid extreme wave event.
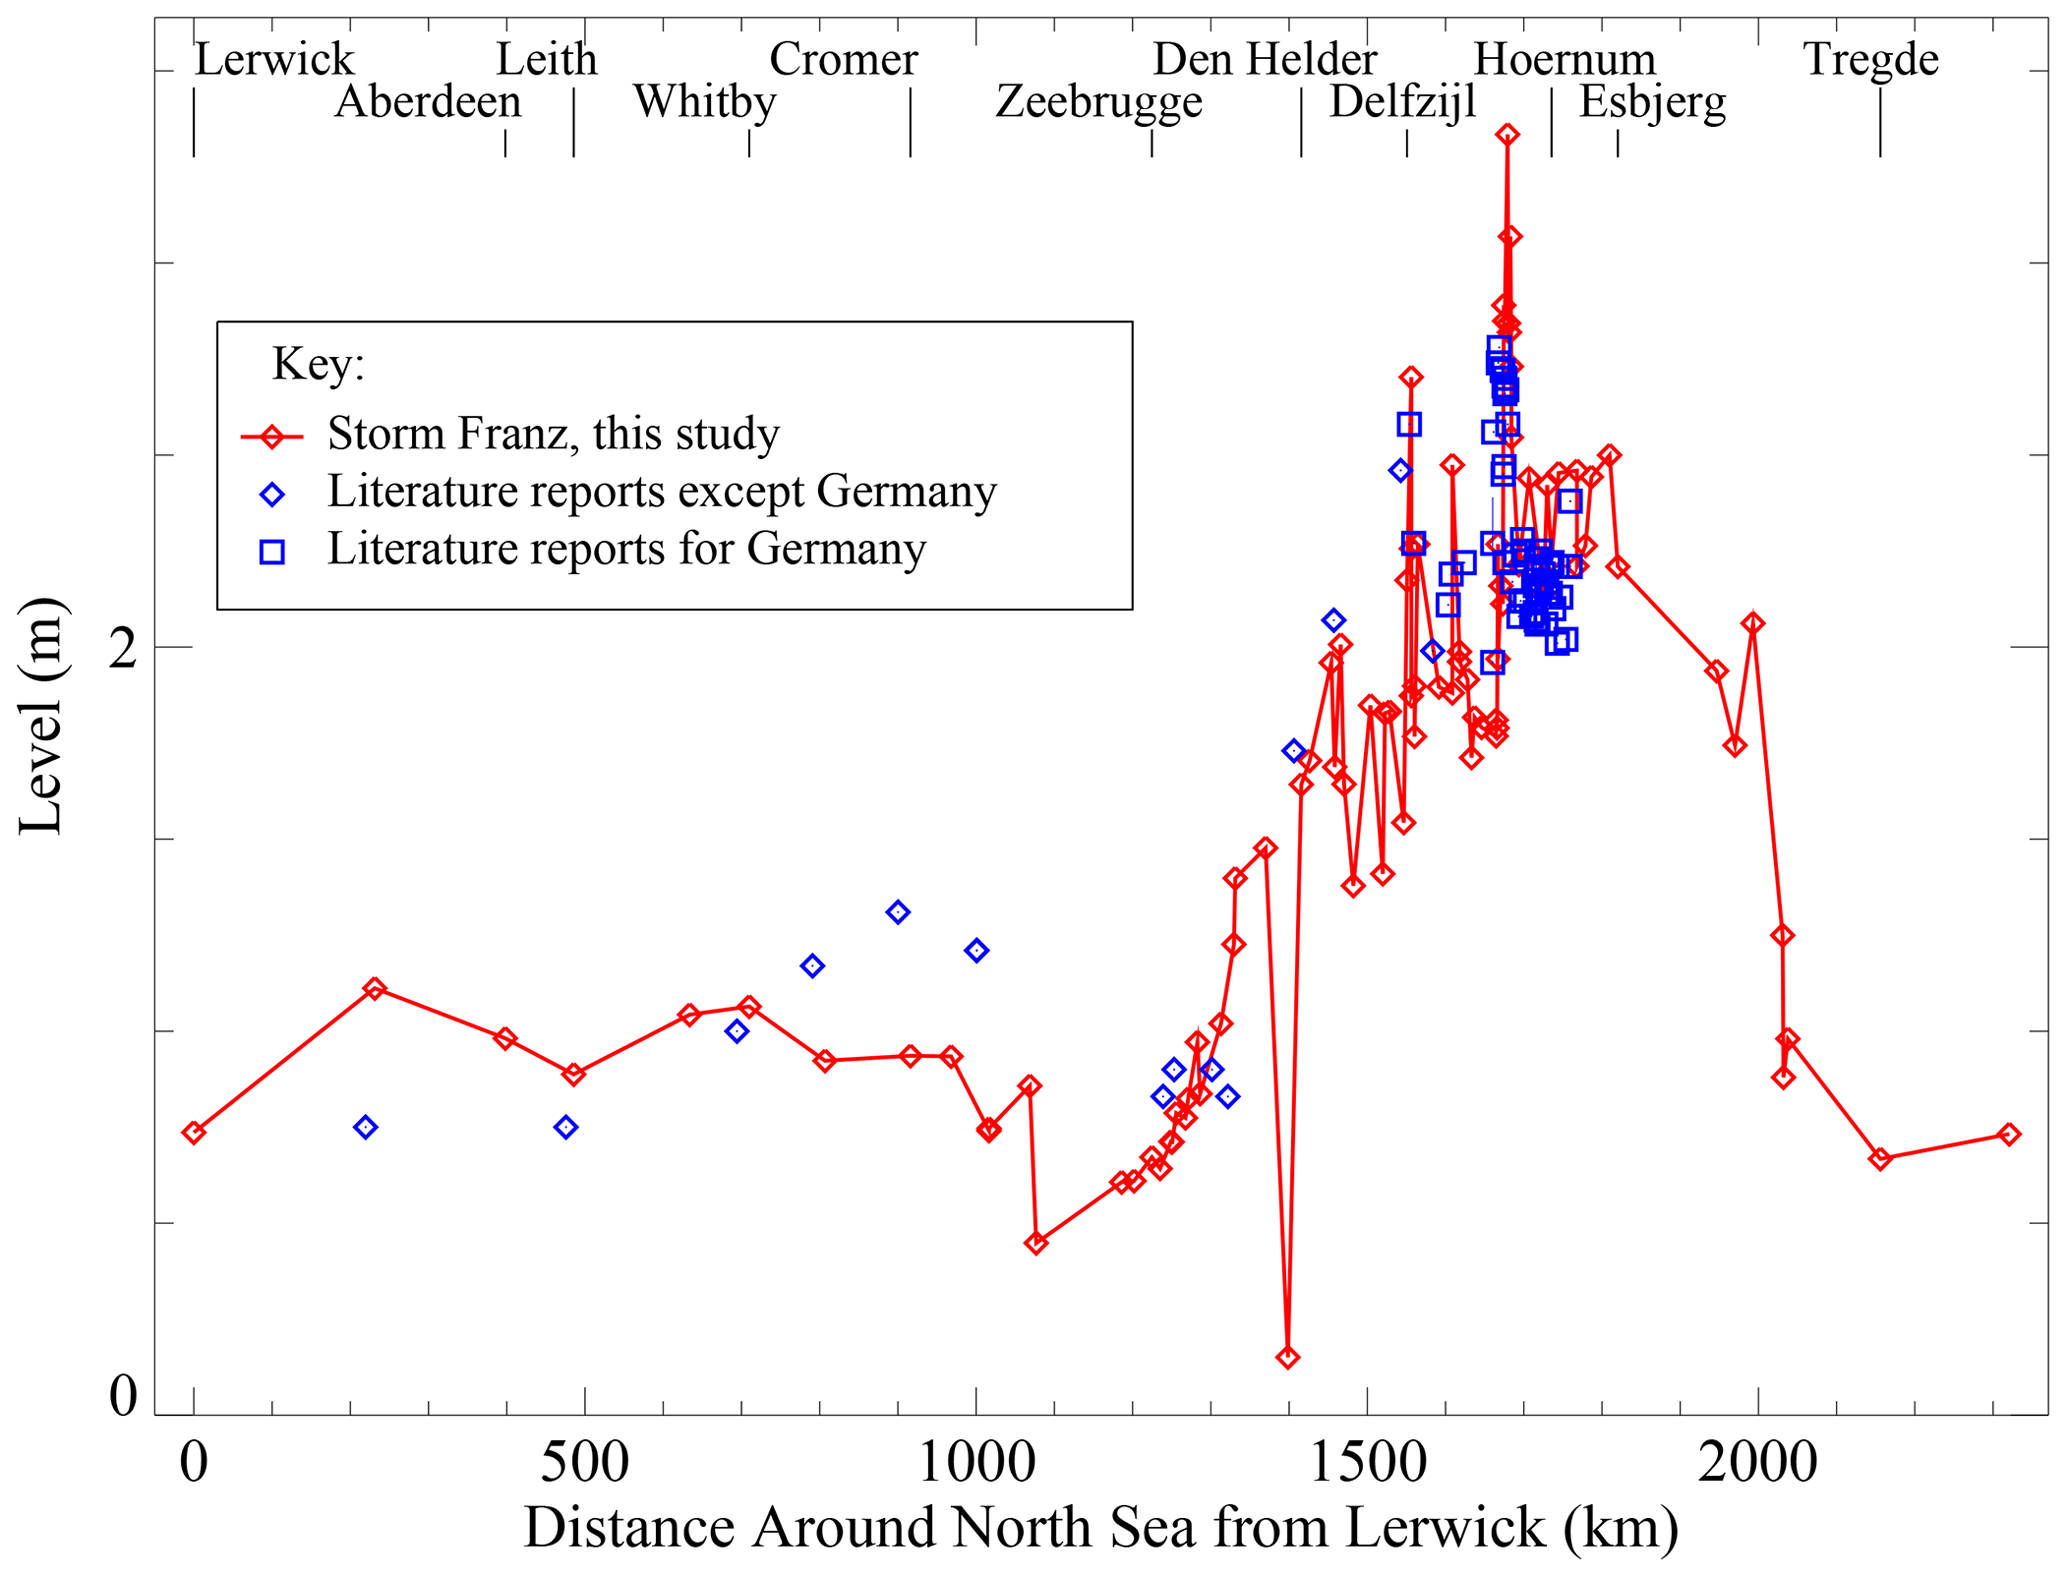
Figure 6Skew surge during storm Storm Franz on 11–12 January 2007. The values are calculated from tide gauge records and arranged by counter-clockwise distance around the North Sea starting from Lerwick in Scotland. Literature reports are included for comparison.
The results of the water level analysis are shown in Fig. 5 for the full set of the tide gauge stations. The time series are arranged in order of counter-clockwise placement around the North Sea starting from Lerwick in Scotland with vertical offsets for presentation clarity. This arrangement was chosen because the tides and external storm surges travel as coastally trapped Kelvin waves, entering the North Sea across the top of Scotland and then passing along the coasts of England, Netherlands, Germany, and Denmark in succession. However, this arrangement produces an order of water level events (storm surge and wind waves) that is different if the high westerly winds of this storm were the causal mechanism. This is less of a consideration for Storm Franz compared with Storm Kyrill (Kettle, 2023), and there was a strong external surge during Storm Franz that travelled with the tide. Figure 5a shows the original time series with the maximum water levels indicated. The long period component of the time series is shown in the second panel (Fig. 5b), also with the maximum levels indicated. There is a prominent peak in the record with small forward time offsets from station to station, taking about 20 h to travel around the full North Sea domain. The tidal component is shown in Fig. 5c, and it reveals that the semi-diurnal tide is prominent in most stations with its peak about every 12 h.
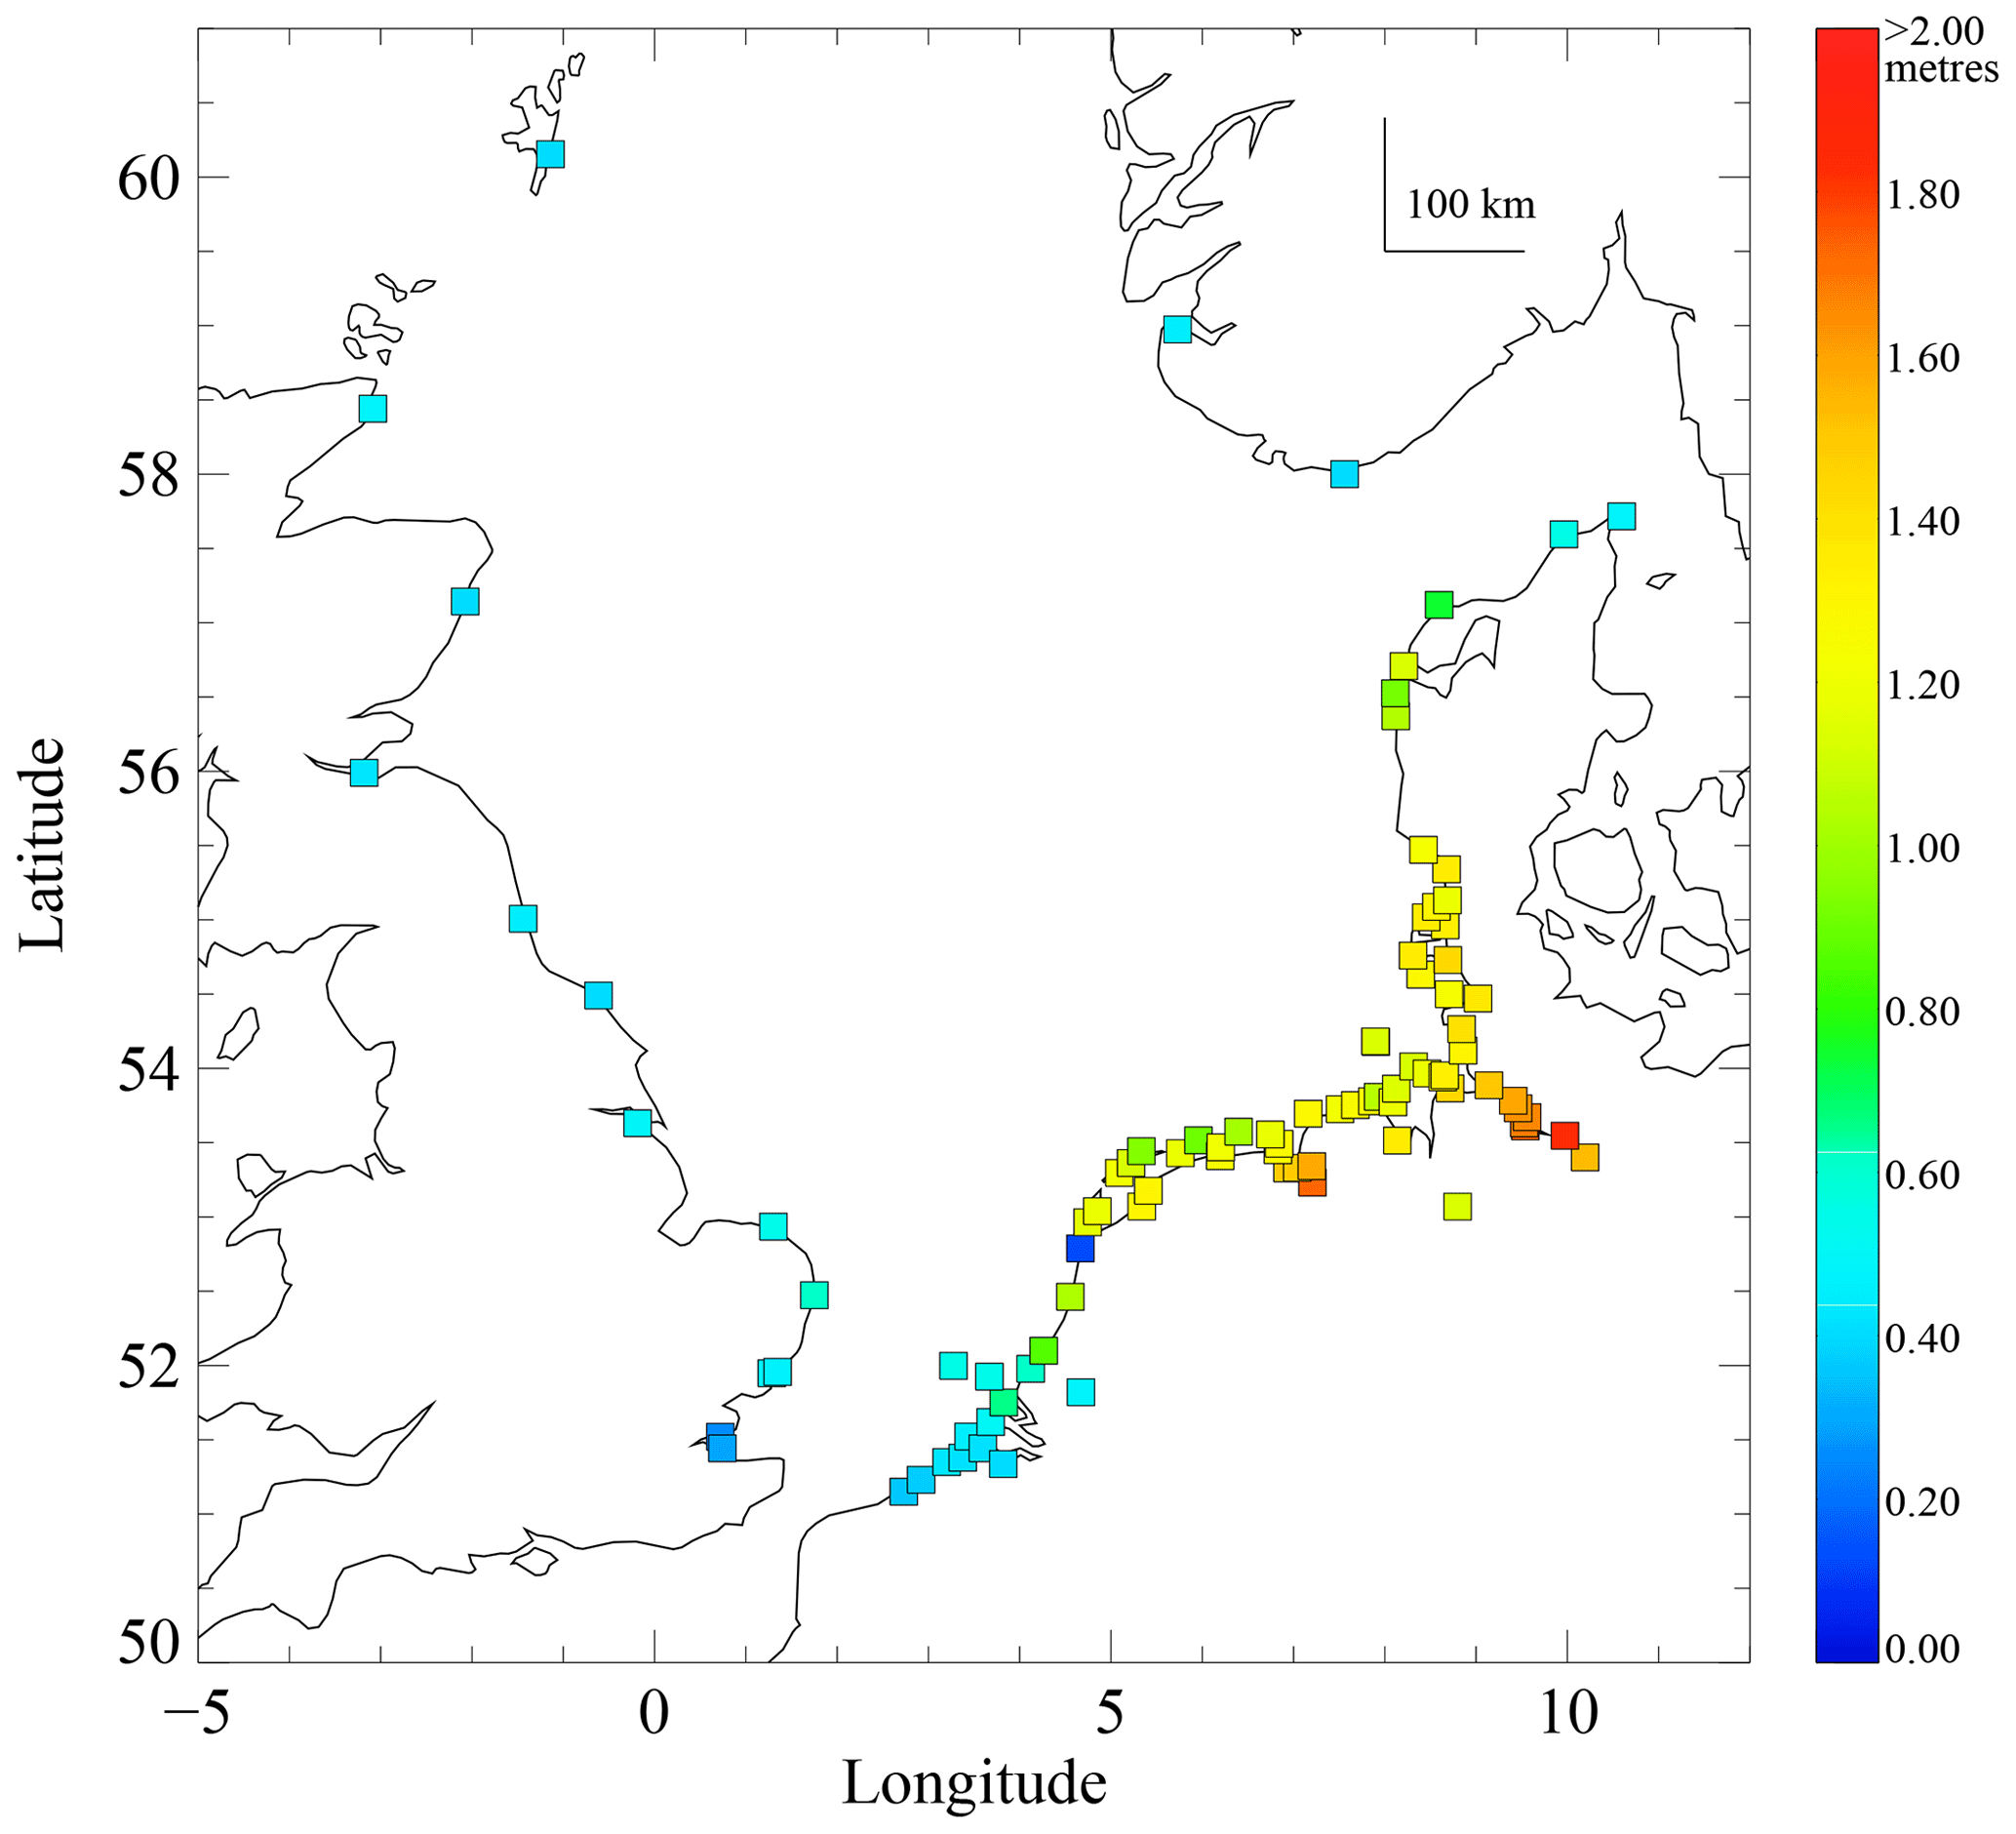
Figure 7Map of skew surge for tide gauge stations around the North Sea during Storm Franz 11–12 January 2007.
The water level and modelled tide information are used to assess the surge or water height anomaly associated with the storm. The surge residual time series is calculated as the measured water level minus the modelled tide. Originally, this was the normal way to analyze a storm surge, but it has some disadvantages. First, the maximum residual may occur at low tide, so that its value does not immediately completely convey information about a coastal flooding threat. Second, because the external surge and tide travel as shallow water waves, their propagation speed is related to water depth and crest height. The tides speed up slightly during storm surge conditions, and the high tide arrives sooner than expected. This means that calculating surge as the difference between measured water level and modelled tide could result in the residual carrying some of the tide information, which may appear as small ∼12 h oscillations. To avoid these problems, skew surge is used, especially by the UK scientific community, and this is the difference between the highest measured water level and nearest modelled high tide (Environment Agency, 2019). It is a single parameter to characterize the surge threat, so that tide phase problems associated with tide arrival times are removed. For Storm Franz, the variation of the skew surge around the North Sea is shown in Fig. 6. Note that the values calculated in the present study have been adjusted upward by the apparent difference of mean sea level calculated from the 16 d measurement record and the official sea level. This is to compare the results with the published literature values, and there is good agreement between the two sets of information. The figure shows data spikes at intervals, especially in the region of the German Bight, and the (unadjusted) skew surge values are shown on a map in Fig. 7. This reveals that the skew surge spikes mostly occur at the heads of estuaries and tidal rivers in the German Bight. In comparison with the expected high tide, water levels were ∼0.5 m higher than normal for the UK and Belgium coasts, 0.8–1.2 m higher than for the north coast of the Netherlands, ∼1.4 m higher than normal for Schleswig-Holstein, and 1.5–2 m higher than normal for the Elbe estuary and Hamburg where flooding was reported. For the maximum surge residual during Storm Franz, Sect. S12 has information about its distribution around the North Sea (Fig. S12.1) and a map of its spatial distribution (Fig. S12.2).
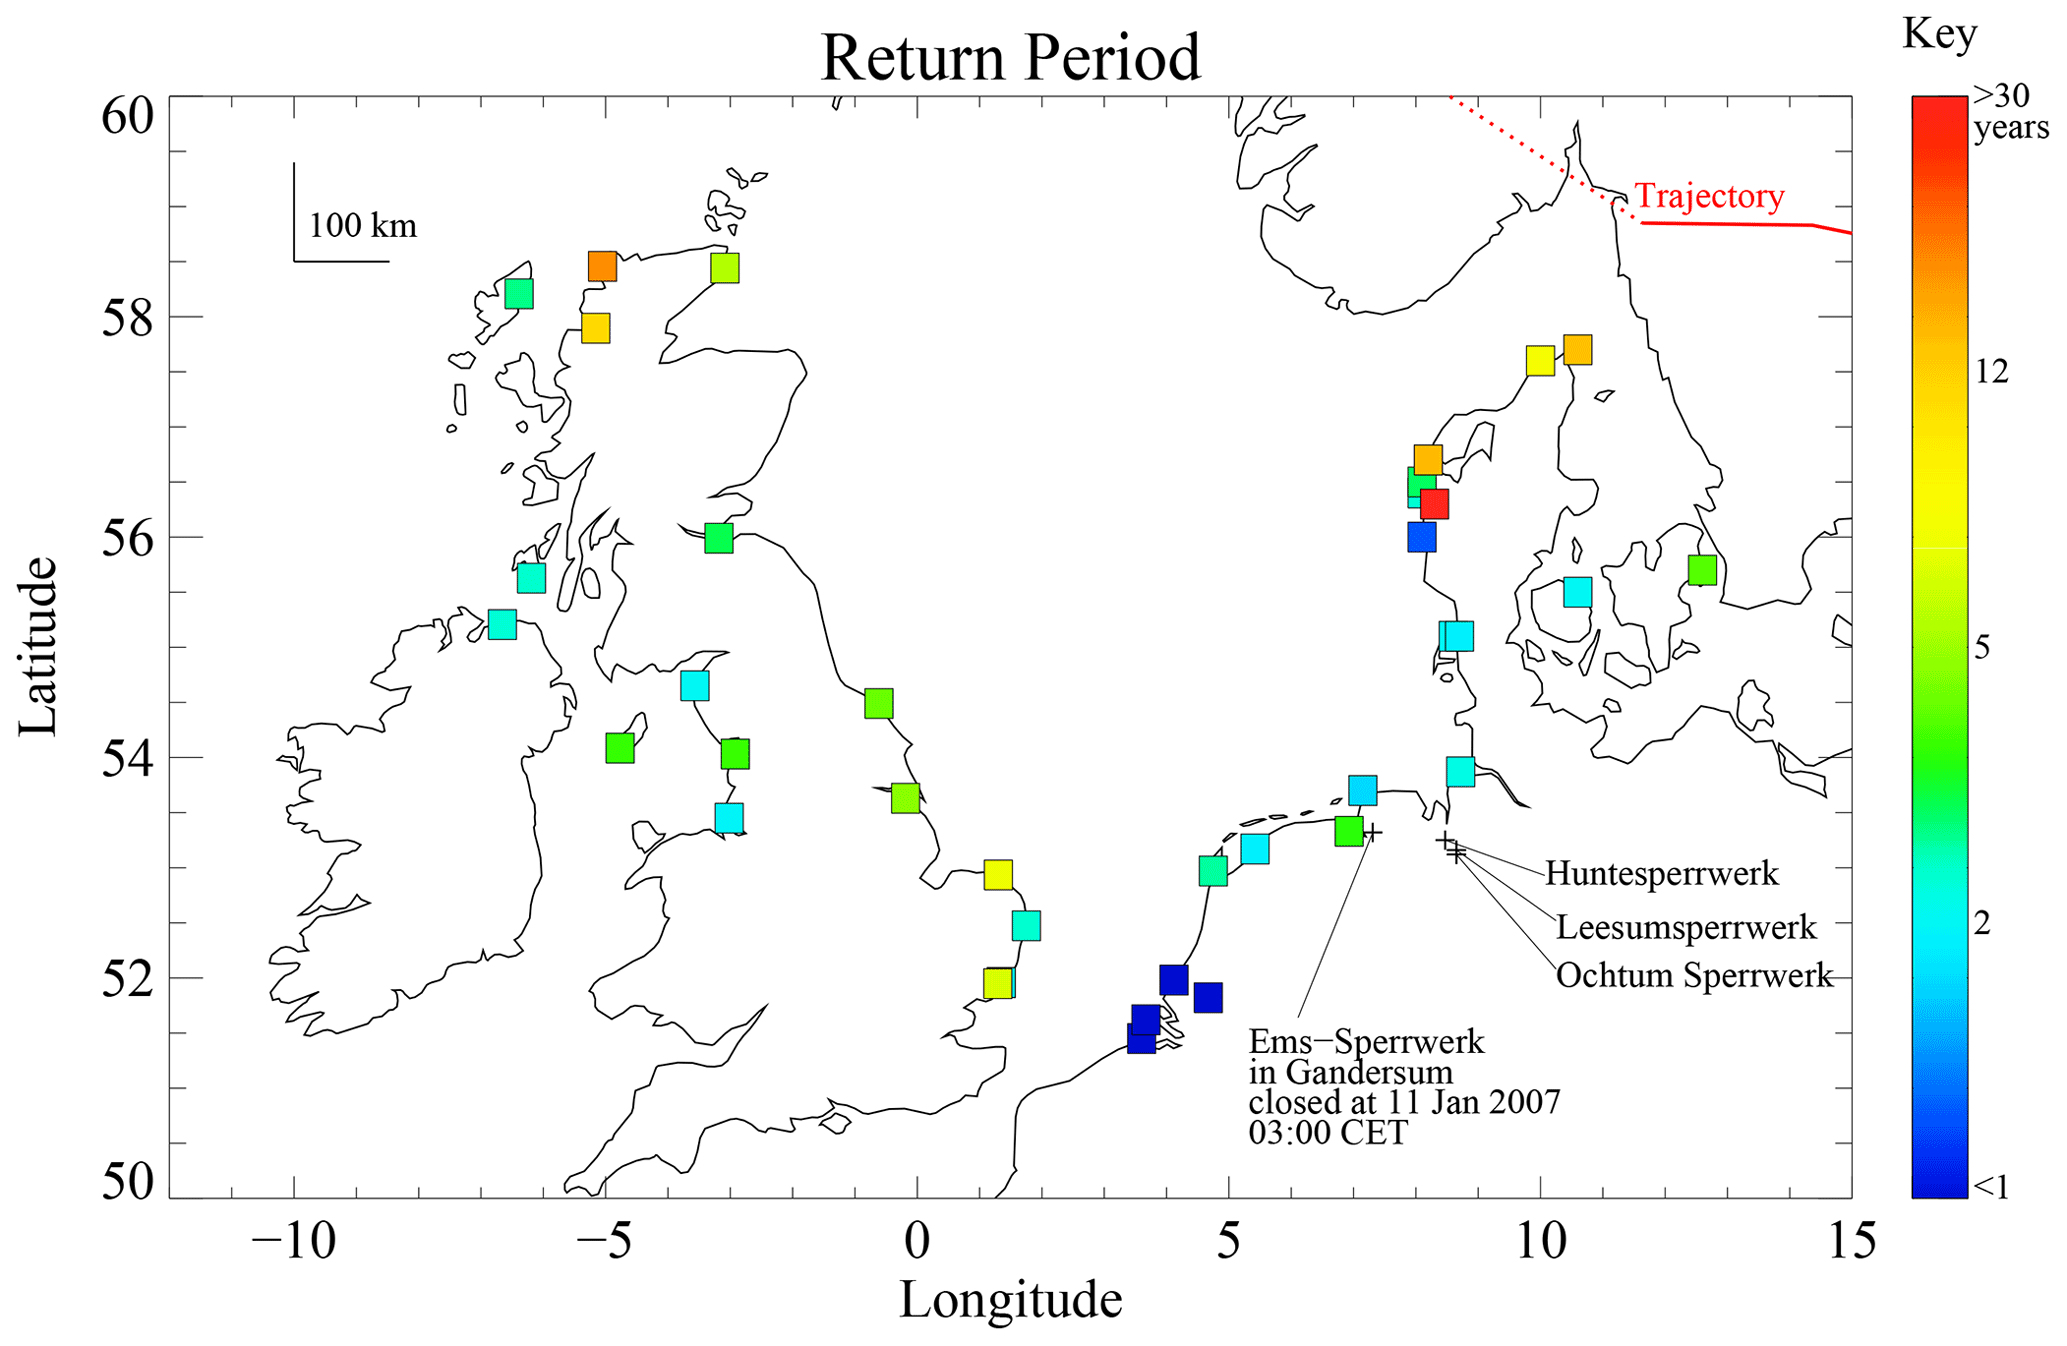
Figure 8Return period of maximum water level during Storm Franz on 11–12 January 2007, as calculated from literature summary results. Surge barrier closures are indicated by text.
The significance of the skew surge is placed in a historical context by expressing absolute water levels in terms of the return period of recurrence. This requires a data base of past storm surges or at least a report of the last time that a given water level was exceeded. For cases where there is no precedent of an extreme measured water level within the measurement record, statistical extrapolation techniques are used to derive a return period. Extreme value analysis of high coastal water levels in England and Denmark is described by Dixon and Tawn (1994) and Ditlevsen et al. (2018), respectively. For the Netherlands, return periods are presented without a description of the underlying theory (RWS, 2007). The return periods of water level for Storm Franz are shown in Fig. 8. This map has been constructed from different literature sources and techniques that are outlined in Table S13.1. The measured water level maxima at several stations in north-western Scotland and northern Denmark had return periods >10 years. The highest return periods were for Kloster (32 years) and Thyborøn (30 years) in northern Denmark.
The short period component of the water level measurements is shown in Fig. 5d. Many stations show oscillations, although the zero crossing periods vary. While most oscillations appear to have periods >1 h, for some stations in northern Denmark the oscillation period is so short that the time series resembles noise. This may be due to shorter period wave phenomena that are close to the tide gauge sampling interval and not linked to the tidal harmonics. For the present storm, there appears to be a spatial clustering of certain groups of stations based on the short period behaviour. In particular, there appears to be a series of linked oscillations in the early afternoon of 11 January 2007 starting first in IJmuiden in the Netherlands and propagating around the coast to Cromer in East Anglia. Visual inspection of the data suggests that the same oscillation may also be present in most stations between the northern Netherlands and southern Denmark but without a significant phase shift. For each station, a statistical analysis of the oscillations was conducted following the conventions used for high resolution recordings of wind waves. The sequence of oscillations was separated according to the zero-crossing times, and an assessment was made of the zero-crossing wave period, minimum/maximum amplitude, and oscillation range. The maximum oscillation range was identified, and the stations were ranked according to this value. The maximum range was about 87 cm for Bremen Grosse Weserbrücke in Germany in early morning of 11 January 2007. Nine stations had maximum ranges greater than 50 cm during the 2 d storm period. These are located along the coast of Germany, the Netherlands, and England, and the highest oscillation events occur mostly during the first 13 h of 11 January 2007. Several stations show a significant range with a short duration period of <2 h (Southend, Hanstholm, Terschelling Noordzee, Ferring, and Hirtshals), and these may be significant because they are not near the higher tidal harmonics. Figure 9 shows the maximum amplitude (i.e., displacement above zero level) of short period oscillations arranged by coastal distance around the North Sea. The maximum amplitudes for most stations are <20 cm, although several stations show values >40 cm, and these appear as spikes in the figure. Figure 10 shows the maximum amplitude information on a map. The distribution of values is different from the skew surge map in Fig. 7 with the highest values (or spikes) along the coast of the Netherlands and southern England. Tables S14.1 and S14.2 give a complete list of the maximum ranges and amplitudes of oscillations for all stations around the North Sea, together with ancillary information.
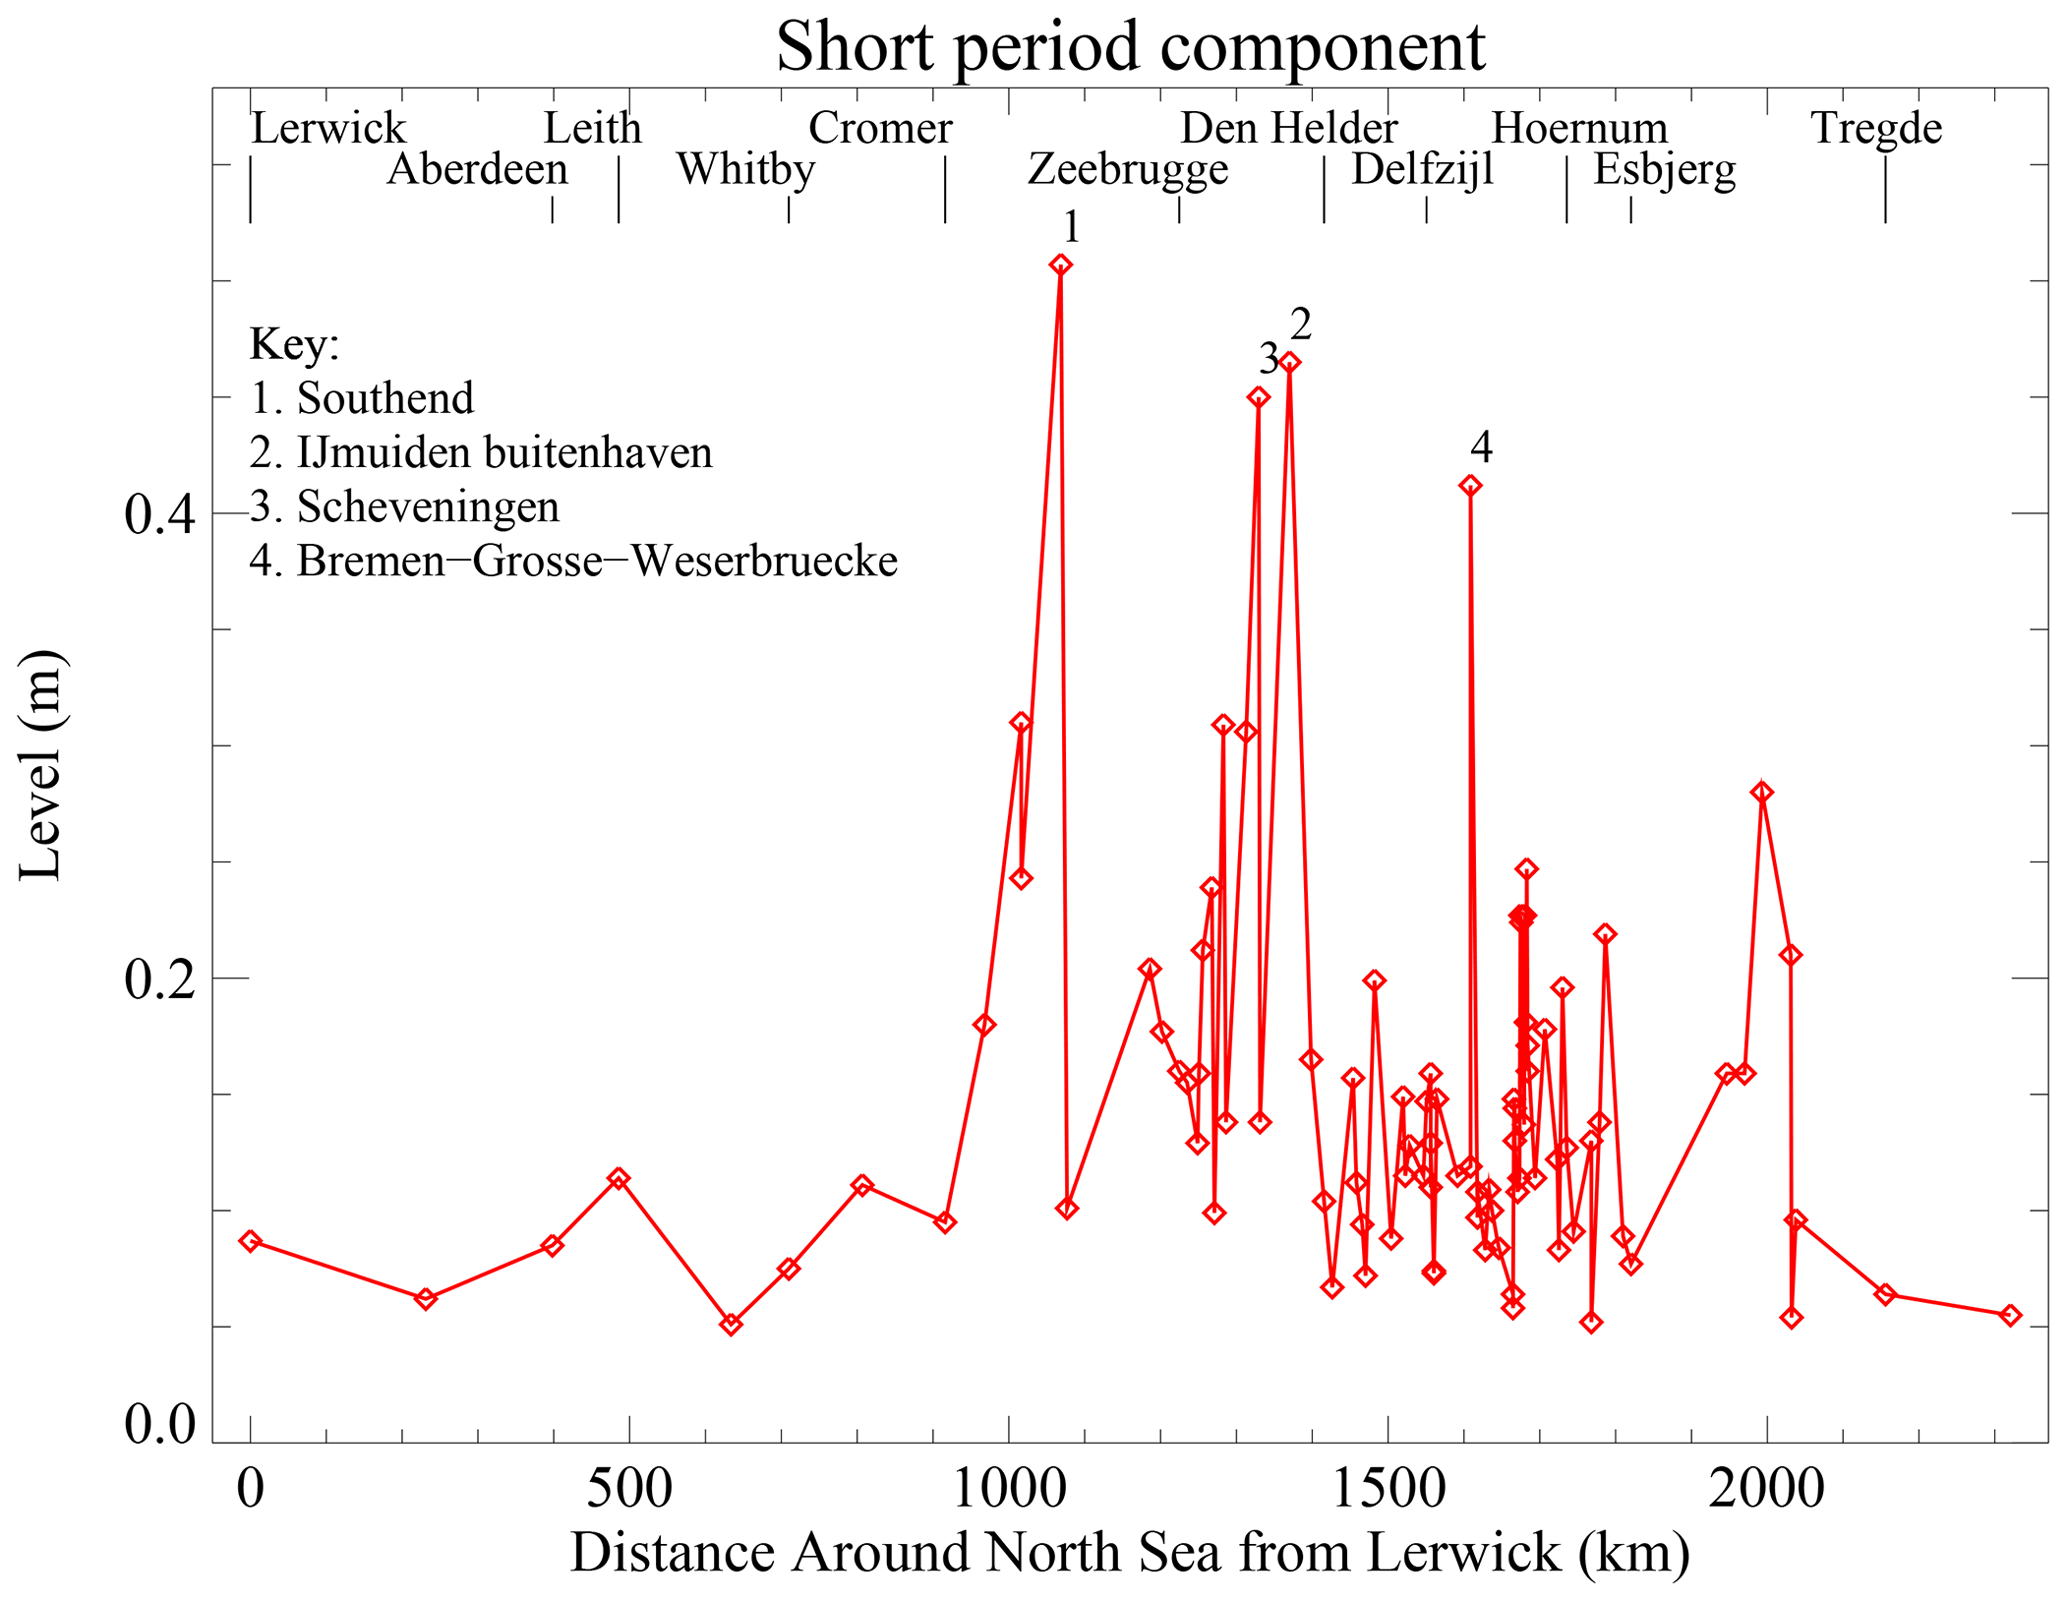
Figure 9Maximum amplitude of highest short period oscillation during Storm Franz on 11–12 January 2007 versus coastal distance around the North Sea starting from Lerwick in Scotland. Selected outlier stations have been labelled.
The original 1 min time series data for Germany provides additional information on possible shorter period wave phenomena that may be masked in normal tide gauges with a time discretization of 10 min. Potentially, the data may yield evidence of meteotsunamis as for the MISELA project (Zemunik et al., 2021). The original water level data set for Germany was queried for the range of water level across 10 min intervals for stations around the North Sea coast. These ranges are shown in Fig. S15.1 as a time series and in Fig. S15.2 as a map of maximum values for the storm period 11–12 January 2007. Two stations show a range of water level >35 cm over a 10 min period: Bremen Grosse Weserbrücke and Pinnau Sperrwerk on the Elbe River. Several other stations show water level ranges >20 cm, and these include Helgoland, Wittdün in the North Friesland Islands, as well as several stations along the Elbe River and estuary. The values are broadly similar to Storm Kyrill on 18–19 January 2007.
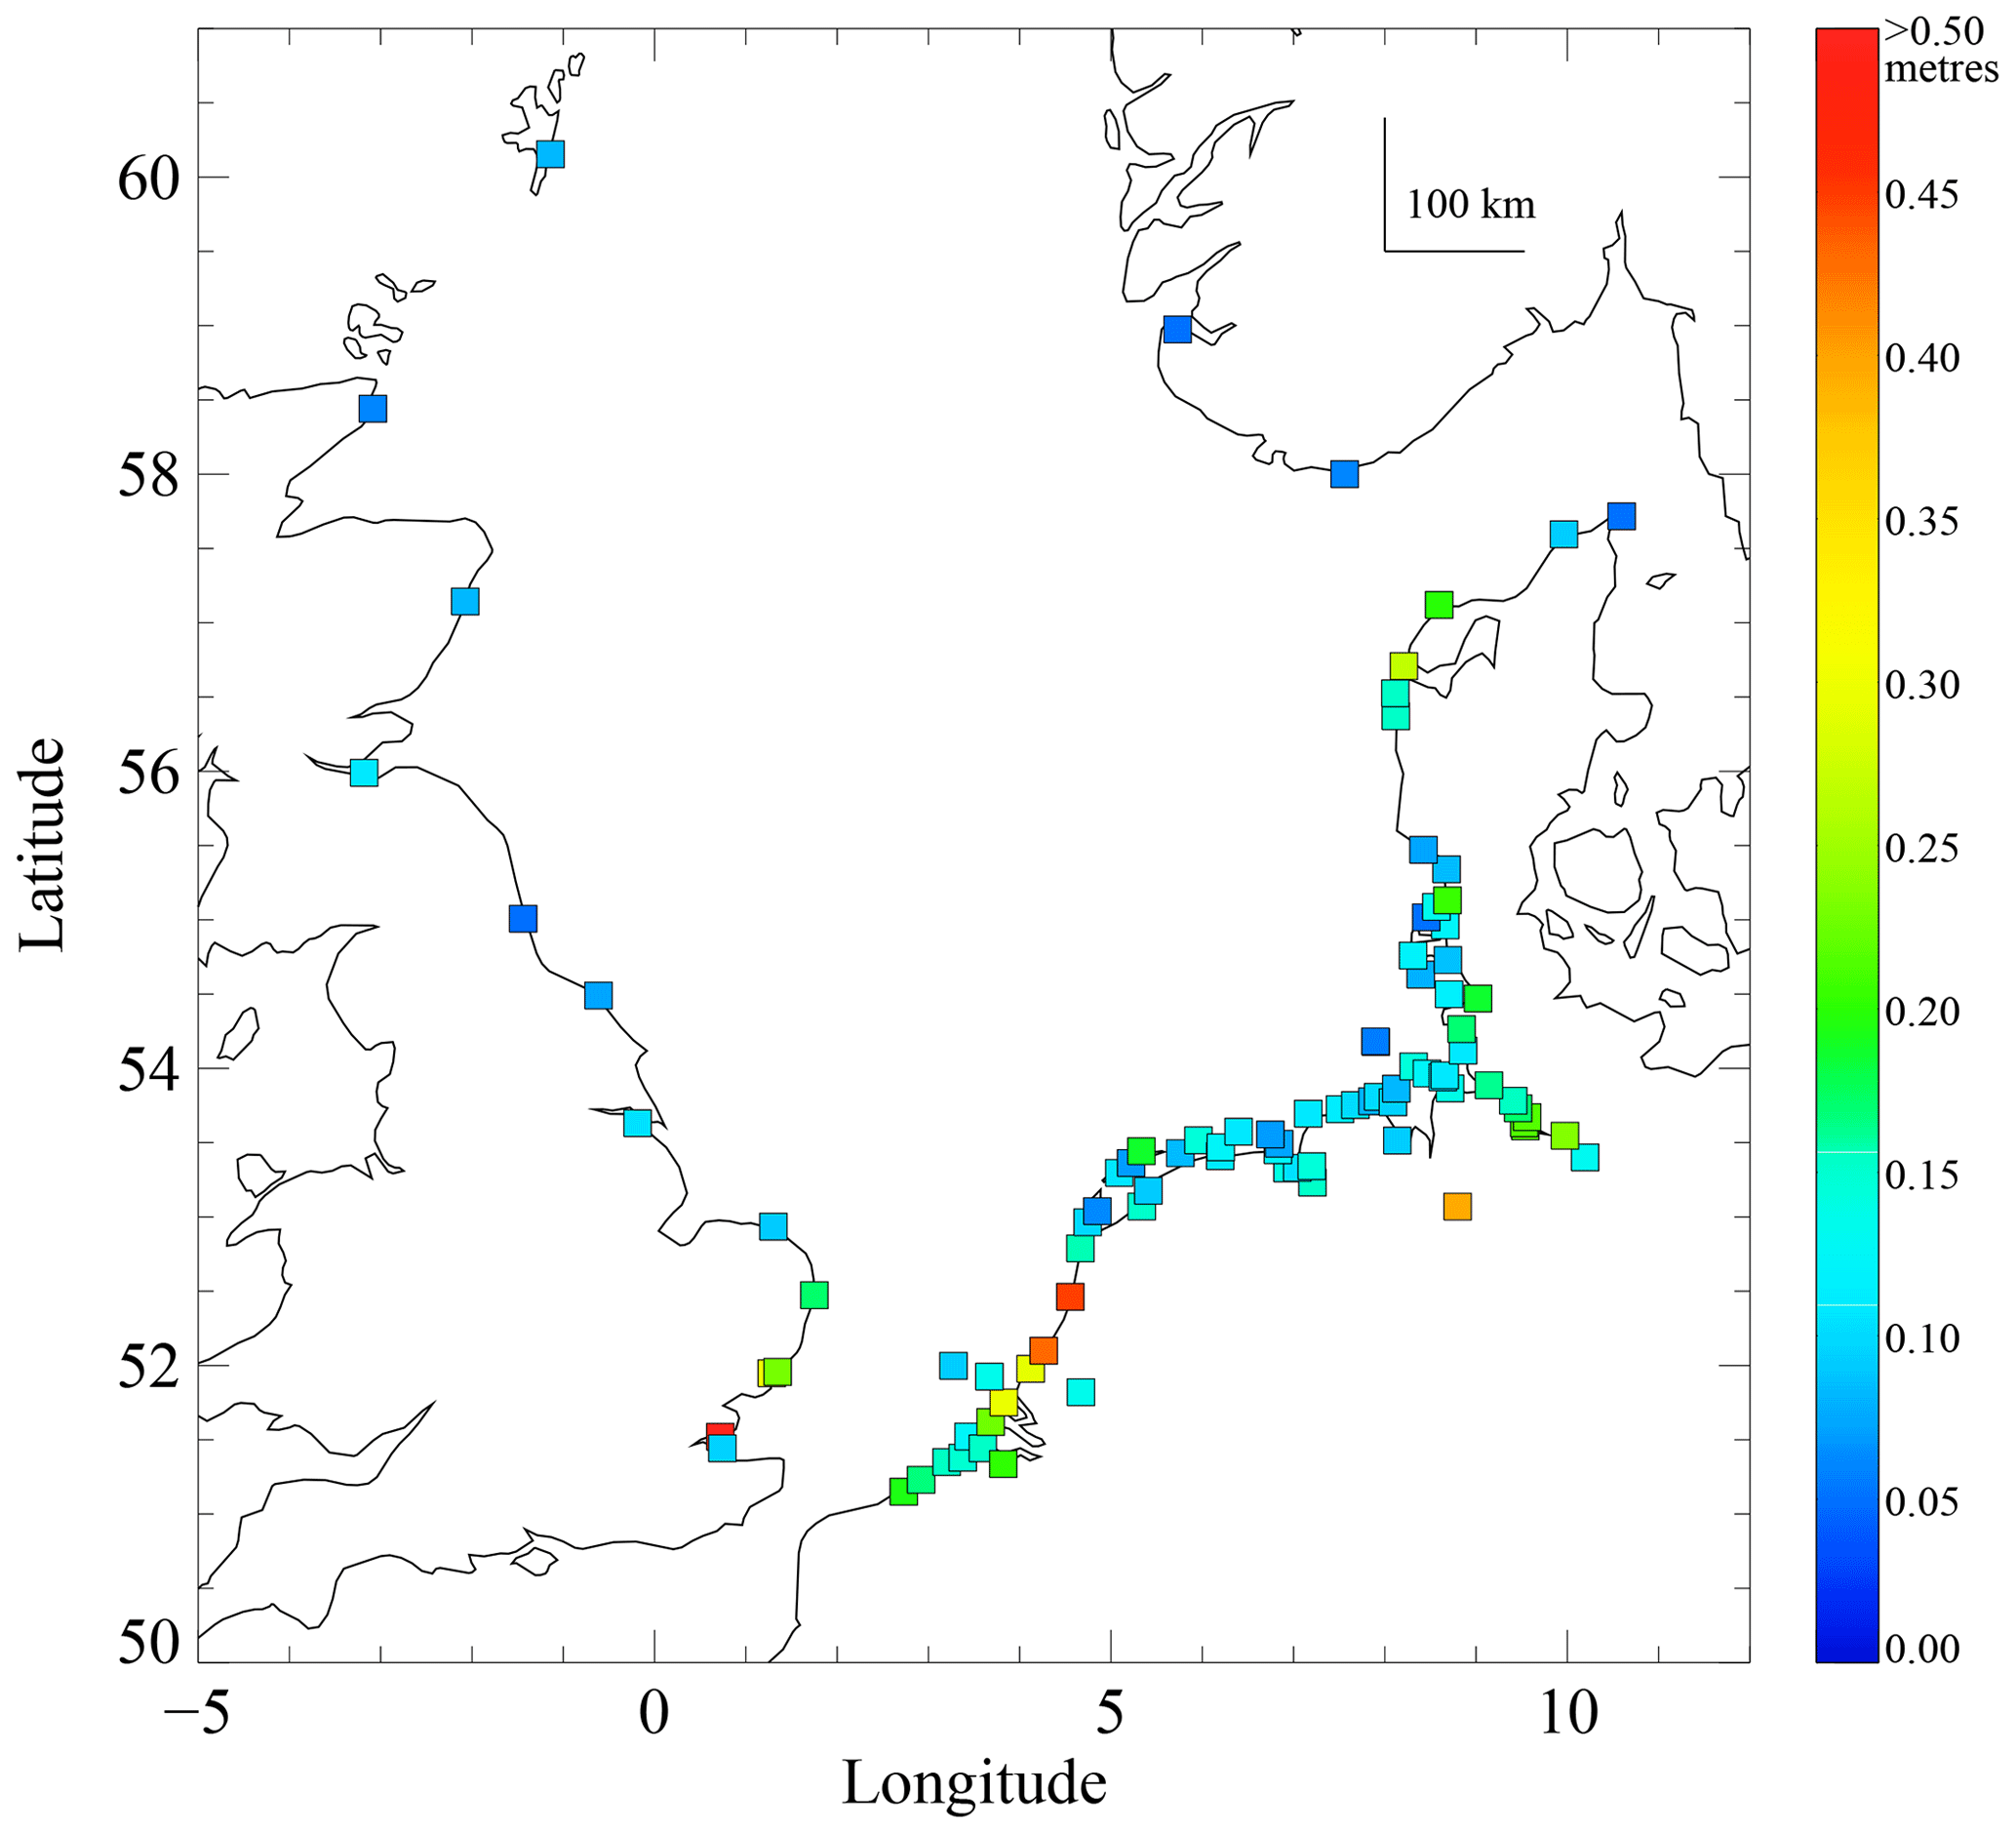
Figure 10Map of maximum amplitude of highest short period oscillation during Storm Franz on 11–12 January 2007 versus coastal distance around the North Sea starting from Lerwick in Scotland.
The maritime incidents and highest significant and maximum wave heights during the storm are also shown in Fig. 5d in association with the short period wave events of the closest tide gauge. Most of the offshore incidents occur on the first day of the storm on 11 January 2007. Several are associated with the previously-identified high oscillation feature in the early afternoon that appears in many of the tide gauge stations between Denmark and the UK. For the UK, Belgium, and the Netherlands, maximum values of significant and maximum wave heights tend to occur across 11 January 2007, with a possible tendency to cluster just before the high oscillation feature in the short period time series in the early afternoon. For the Netherlands, Germany, and Denmark, there is a small cluster of wave events at the start of 12 January 2007, also with a couple of offshore incidents at about the same time.
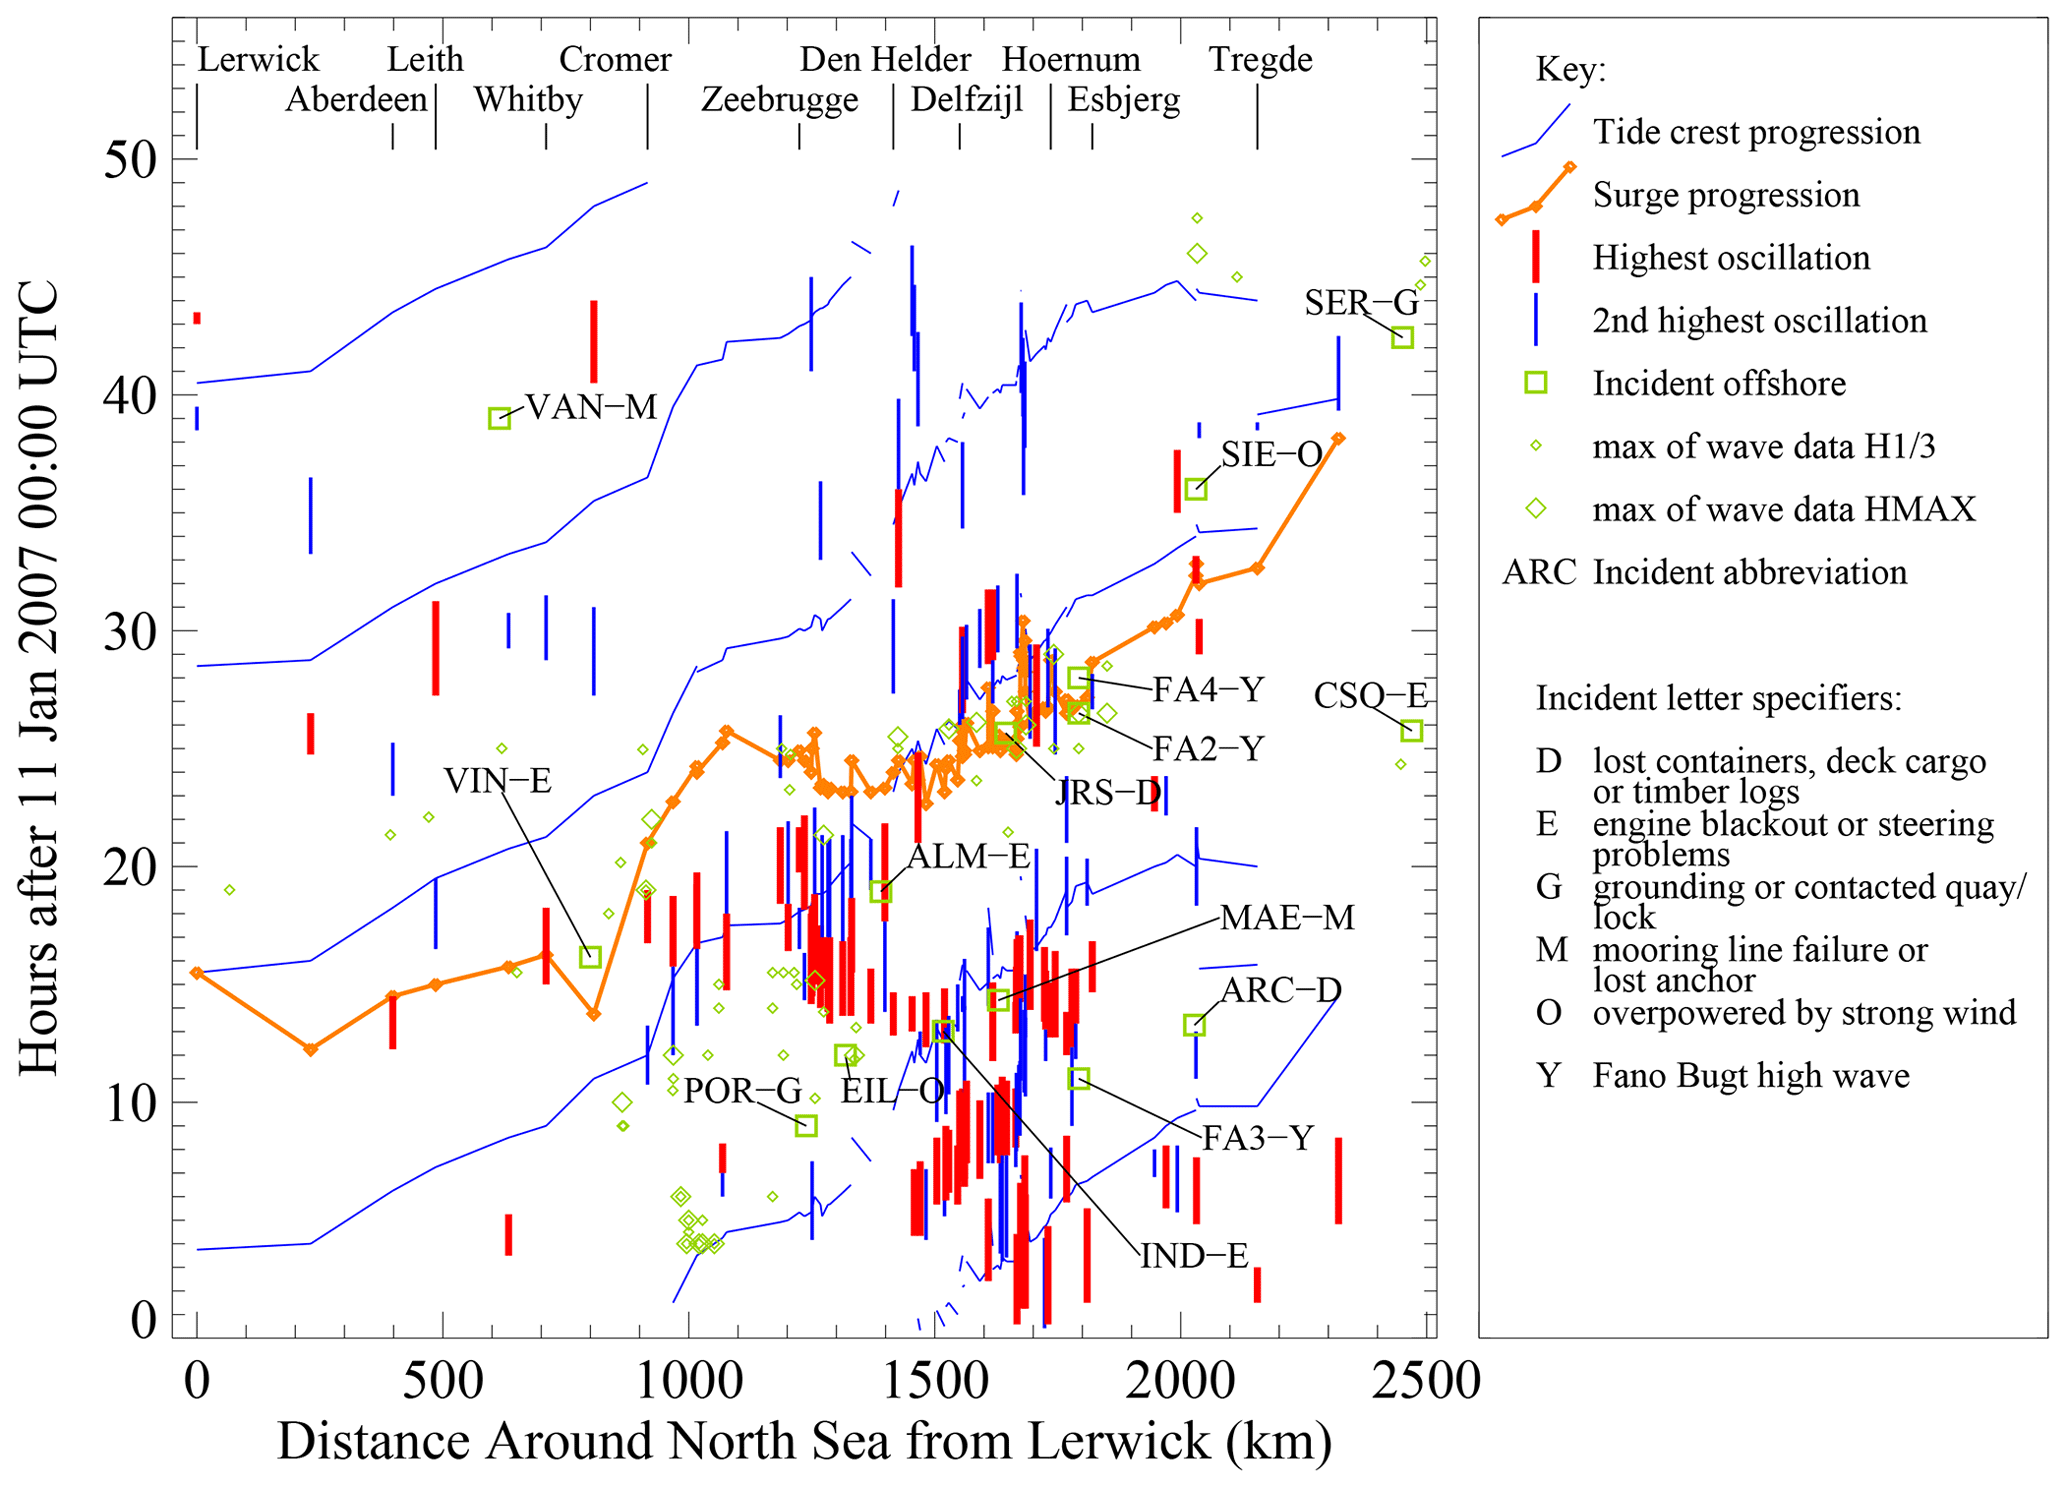
Figure 11Summary of the progression of the tidal crests and storm surge peak around the North Sea on 11–12 January 2007, and spatial-temporal relationship of peak-to-trough range of the highest up-crossing short period oscillations in the tide gauge record and maritime incidents/accidents. The highest significant and maximum wave heights from recorders around the North Sea are also indicated. The data are plotted on axes of time versus counter-clockwise distance around the North Sea starting from Lerwick in Scotland.
Figure 11 presents the key information for the surge, tides, short-period oscillations, offshore incidents, and maximum waves on axes of time versus distance around the North Sea (see also Sect. S16 for simplified graphs of this information). The storm surge peak occurred in association with two semidiurnal tidal peaks, slipping from one tide peak to the preceding one during its passage around the North Sea. The surge maximum coincides with the low tide period along the coasts of the UK and Belgium, but arrives just before the high tide for the Netherlands, Germany, and Denmark. The highest oscillations in the short period time series mostly occur on the first day of the storm on 11 January 2007 before the passage of the storm surge. The maximum wave events are found also on the first day of the storm, but there is some clustering in association with the storm surge peak. For the maritime accidents and incidents, there is a cluster occurring between the late morning and early afternoon on 11 January 2007 before the passage of the surge. This cluster contains one of the extreme maximum wave episodes from the Fanø Bugt wave recorder of southern Denmark. There is also a second cluster in association with the storm surge peak starting at the English coast and continuing around to the Norwegian coast.
The unusual wave-related accident of the JRS Canis at the start of 12 January 2007 was part of this surge-linked cluster and occurred at about the same time when nearby wave recorders were also registering maximum values. Among these wave events were two cases of extreme maximum waves registered by the Fanø Bugt recorder (see Fig. S5.4), which occurred about 1–3 h after the JRS Canis incident. Although the maximum wave spikes registered at Fanø Bugt initially appeared to indicate an instrument malfunction, there is some support from independent measuring systems and maritime accidents nearby. The case is broadly consistent with the available literature on the link between rogue waves and tidal water depth near the coast. Gemmrich et al. (2009) indicated a link between rogue waves and the semidiurnal tide in coastal areas of British Columbia, although the relation to the phase of the tide was different for different sites. In the North Sea off the coast of England, two investigations of coastal surge flooding during Storm Xaver on 5–6 December 2013 identified a relation between the tide gauge water levels and significant wave height from nearby wave recorders (Parsons, 2014; Spencer et al, 2015). However, the highest waves did not always correspond with the times of high water for different areas along the English coast. Wave height might have a closer link with coastal tidal currents, which are offset in time from tidal water levels. Investigation reports for the Honeydew II and MSC Napoli accidents in the middle of January 2007 (MAIB, 2008; MCIB, 2009) included information of the relative strength and direction of the winds and tidal currents. There was an implication that mismatched winds and tidal currents may have contributed to dangerous wave conditions, although the flow regimes for the two incidents were different. The accident report of JRS Canis did not present tidal current information (BSU, 2008), and the present study benefits from a larger archive of wave data.
In the aftermath of the event, Storm Franz would not be considered one of the defining European winter storms of the last half century, which are usually tallied in terms of societal damage and insurance loss (Roberts et al., 2014). The storm was overshadowed a little over a week later by the passage of Storm Kyrill on 18–19 January 2007. Winter storm websites in Germany make systematic assessments of storm impacts, so it is possible to inter-compare them, at least for central Europe. Maximum wind gusts for Storm Kyrill were significantly higher than Storm Franz, and covered a larger area (Deutsche Rück, 2007; Unwetterzentrale, 2007a, b). The winter storm insurance losses for Storm Kyrill reached a high rank in Europe, whereas for Storm Franz it was quickly assessed that there would not be significant insurance losses for onshore properties (Air Worldwide, 2007a). In terms of power cuts, Storm Franz impacted tens of thousands of households, but Storm Kyrill affected millions of properties across Europe. There were also significant differences in the interruptions of transport networks. For example, Storm Kyrill led Germany to shut down its rail network for the first time since 1945, and the rail network of the Netherlands was also closed. By contrast, Storm Franz had just a few rail interruptions in northern Germany. Regionally, it might be argued Storm Franz had a greater impact in western England and Wales where there were a number of cases of road and rail route closures from rainfall flooding, high winds, and landslips. Because the trajectory of Storm Franz was further to the north than Storm Kyrill, there might have been more transport interruptions and bridge closures in Scotland and Denmark due to strong winds.
However, Storm Franz had a larger number of maritime incidents and large wave events than Storm Kyrill, and it is therefore potentially more important for offshore wind energy. Three independent maritime accidents in extreme wave conditions led to fatalities off southeast Ireland and the English Channel within a 12 h period at the start of Storm Franz. In the North Sea, JRS Canis lost containers in an unexpected wave event that has some support from measurements at a wave buoy off southern Denmark. The MISELA project has focussed attention on special met-ocean interactions leading to unusual longer period wave events and meteotsunamis (Zemunik et al., 2021). The phenomena is not usually associated with the North Sea, but the available data provides no relevant information. On the other hand, there are fairly regular reports of wave-related damage to ships and platforms, but these are not always associated with the highest profile storms. For example, the large Scandinavian car ferry Prinsesse Ragnhild sailing from Hirtshals in Denmark to Stavanger in Norway experienced a heavy roll in strong winds and high sea states on 14 January 2007 (i.e., Storm Hanno), leading to 10 cars being damaged and a 10 h delay in arrival at Stavanger (Kvamme, 2007). Several days later on 20 January 2007 (probably during Storm Lancelot), the same ship was hit by a huge wave that broke some of its conference room windows (Lloyd's Casualty Week, 2007b; TV2, 2007) at a height of ∼12–14 m above sea level (hhvferry, 2012). The ship left service the following year. The vessel was constructed in 1981, but issues had been raised in the naval architecture community in the 1990s and 2000s if the standards of ship design were appropriate for the met-ocean conditions actually being experienced offshore (Faulkner, 2002).
The water level data for this study were measured by the national tide gauge networks of the UK, Belgium, the Netherlands, Germany, Denmark, and Norway. The data were downloaded from publicly accessible websites maintained by the national authorities, except for Germany (datasets were sent by Wilfried Wiechmann of the Bundesanstalt für Gewässerkunde BAFG), one station in the UK (dataset for Southend was sent by Victoria Grobler of the Environment Agency), and three stations in Denmark (datasets for Hanstholm, Hirtshals, and Skagen were sent by Bjørn Frederiksen of Kystdirektoratet). Further information on the URL addresses is given in Table S8.1 of the Supplement.
The supplement related to this article is available online at: https://doi.org/10.5194/adgeo-62-41-2023-supplement.
The author has declared that there are no competing interests.
Publisher's note: Copernicus Publications remains neutral with regard to jurisdictional claims made in the text, published maps, institutional affiliations, or any other geographical representation in this paper. While Copernicus Publications makes every effort to include appropriate place names, the final responsibility lies with the authors.
This article is part of the special issue “European Geosciences Union General Assembly 2023, EGU Division Energy, Resources & Environment (ERE)”. It is a result of the EGU General Assembly 2023, Vienna, Austria, 23–28 April 2023.
The author gratefully acknowledges data from national tide gauge networks of the UK, Belgium, Netherlands, Germany, Denmark, and Norway. The tide gauge data for the UK, Belgium, the Netherlands, Denmark, and Norway was downloaded from Internet servers. For the UK, Victoria Grobler (Environment Agency) emailed data for one additional tide gauge at Southend. For Germany, Wilfried Wiechmann of the Bundesanstalt für Gewässerkunde kindly provided tide gauge data by email. Bjørn Frederiksen of Kystdirektoratet also emailed data for three tide gauge stations in northern Denmark that were not provided on the public Internet server. The following people provided background reports, data, or other information to support this review: Maria Blümel (Landesbetrieb für Küstenschutz, Nationalpark, und Meereschutz Schleswig-Holstein, Germany), Julia Lockwood (Met Office Hadley Centre, UK), Delila Montes (International Energy Agency), Irene Perez-Gonzalez (Bundesamt für Seeschifffahrt und Hydrographie, Germany), and Reidun Gangstø Skaland (Met.no, Norway). I appreciate the comments of Tarmo Soomere, one anonymous referee, and Sonja Martens (editor) in improving the manuscript.
This paper was edited by Sonja Martens and reviewed by Tarmo Soomere and one anonymous referee.
4coffshore: Samsø turbine collapsed due to welding crack, http://www.4coffshore.com/windfarms/sams%C3%B8-turbine-collapsed-due-to-welding-crack-nid3005.html (last access: 27 September 2023), 15 December 2015.
Air Worldwide: European Winter Storm Franz, https://alert.air-worldwide.com/extratropical-cyclone/2007/european-winter-storm-franz/first-posting/ (last access: 27 September 2023), first posting 12 January 2007a.
Air Worldwide: European winter storm Per, https://alert.air-worldwide.com/extratropical-cyclone/2007/european-winter-storm-per/first-posting/ (last access: 27 September 2023), 16 January 2007b.
Aktion Wetterpate, https://www.wetterpate.de/namenslisten/tiefdruckgebiete/tief2007/index.html (last access: 27 September 2023), 11 September 2023.
BBC: Thousands hit by storm power cuts, http://news.bbc.co.uk/2/hi/uk_news/wales/6250925.stm (last access: 27 September 2023), 11 January 2007a.
BBC: England battered by wind and rain, http://news.bbc.co.uk/2/hi/uk_news/england/6251415.stm (last access: 27 September 2023), 11 January 2007b.
BBC: Search for Russian ship steward, http://news.bbc.co.uk/1/hi/uk_news/england/cornwall/6252609.stm (last access: 27 September 2023), 11 January 2007c.
BBC: Power restored as winds subside, http://news.bbc.co.uk/2/hi/uk_news/wales/6254617.stm (last access: 27 September 2023), 12 January 2007d.
Becerra, M., Long, M., Schulz, W., and Thottappillil, R.: On the estimation of lightning incidence to offshore wind farms, Electr. Power Syst. Res., 157, 211–226, https://doi.org/10.1016/j.epsr.2017.12.008, 2018.
Belfast Telegraph: Severe gales continue, contributors: Lenaghan, C. and O'Hara, V., 11 January 2007.
BSU: Loss overboard of 10 containers from JRS Canis at estuary of Elbe River on 12 January 2007 at 02:40, Investigation Report 45/07, Less Serious Marine Casualty, Bundestelle für Seeunfalluntersuchung, 1 October 2008.
Caithness Wind Farm: https://scotlandagainstspin.org/wp-content/uploads/2023/04/Detailed-incidents-to-31-Mar2023.pdf, last access: 27 September 2023.
Chen, X. and Xu, J.-Z.: Structural failure analysis of wind turbines impacted by super typhoon Usagi, Eng. Fail. Anal., 60, 391–404, https://doi.org/10.1016/j.engfailanal.2015.11.028, 2016.
Christou, M. and Ewans, K.: Examining a comprehensive dataset containing thousands of freak wave events. Part 1 – Description of the data and quality control procedure, in: Proceedings of the ASME 2011 30th International Conference on Ocean, Offshore and Arctic Engineering, OMAE2011, 19–24 June 2011, Rotterdam, The Netherlands, OMAE2011-50168, 2011.
DEA: Offshore Wind Power. Danish Experiences and Solutions. Danish Energy Authority, [pdf properties: datestamp: 24 Oct 2005], October 2005.
Deutsche Rück: Sturmdokumentation 2007 Deutschland, Deutsche Rückversicherung Aktiengesellschaft, Düsseldorf und Berlin, Hansaallee 177, 40549 Düsseldorf, Postfach 290110, 40528 Düsseldorf, https://www.deutscherueck.de/fileadmin/Downloads/Sturmdoku_2007_web.pdf (last access: 1 November 2023), 38 pp., edited by: Axer, T., Bistry, T., Müller, M., Reiner, A., Süsser, M., Document properties: created 08 Sep 2015, 2007.
Diamond, K. E.: Extreme weather impacts on offshore wind turbines, Nat. Resour. Environ., 27, 1–5, 2012.
Ditlevsen, C., Ramos, M. M., Sørensen, C., Ciocan, U. R., and Pionkowitz, T.: Højvandsstatistikker 2017, Miljo-og Fødevareministeriet, Kystdirektoratet Lemvig, February 2018.
Dixon, M. J. and Tawn, J. A.: Extreme sea-levels at UK A-class site: site-by-site analysis, Proudman Oceanographic Laboratory, Internal document No.65, 234 pp., March 1994.
Dotzek, N., Emeis, S., Lefevre, C., and Gerpott, J.: Waterspouts over the North and Baltic Seas: Observations and climatology, prediction and reporting, Meteorol. Z., 19, 115–129, https://doi.org/10.1127/0941-2948/2010/0422, 2010.
DR: Storebælts broen lukket på grund af blæsten, https://www.dr.dk/nyheder/indland/storebaeltsbroen-lukket-paa-grund-af-blaesten (last access: 27 September 2023), 12 January 2007.
Electrek: In a first, a cargo ship strikes an offshore wind turbine, contributor: Lewis, M., https://electrek.co/2023/04/27/cargo-ship-offshore-wind-turbine/ (last access: 27 September 2023), 27 April 2023.
Environment Agency: Coastal flood boundary conditions for the UK: update 2018. Technical summary report, SC060064/TR6, published by: Environment Agency, Horizon House, Deanery Road, Bristol BS1 5AH, May 2019.
ErtekProjects: Web page where wind turbine accident list can be downloaded, https://ertekprojects.com/wind-turbine-accidents/data/, last access: 27 September 2023.
ESWD: European Severe Weather Database, https://eswd.eu (last access: 27 September 2023), 2022.
Faulkner, D.: Shipping safety. A matter of concern, Ingenia, Royal Academy of Engineering, London (August/September), 13, 13–20, 2002.
FAZ: Orkantief Franz wütet über Europa, Frankfurter Allgemeine Zeitung, 12 January 2007.
Fehrmann, A. and Fackler, A.: Offshore wind farms: risk and initial loss experience, Temple Insurance, a member of the Munich Re Group, PDF document timestamp 9 March 2010, 2010.
Feng, Y., Tavner, P. J., and Long, H.: Early experiences with UK round I offshore wind farms, Proceedings of the Institution of Civil Engineers, Energy, 163, 167–181, https://doi.org/10.1680/ener.2010.163.4.167, 2010.
FINO1: 15-m wave damaged FINO1, report date stamp 8 January 2014, https://www.fino1.de/de/aktuelles/meldung/15-meter-welle-beschaedigt-fino1.html (last access: 27 September 2023), 2014.
Fischer, J., Herklotz, K., Senet, C., Outzen, O., and Hahn, R.: Oceanographic observations at FINO1 and the “Alpha Ventus” offshore wind farm, 10th German wind energy conference, DEWEK 2010, Bremen, 2010.
Fore, A. G., Stiles, B. W., Chau, A. H., Williams, B. A., Dunbar, R. A., and Rodriguez, E.: Point-wise wind retrieval and ambiguity removal improvements for the QuikSCAT climatological data set, IEEE T. Geosci. Remote, 52, 51–59, https://doi.org/10.1109/TGRS.2012.2235843, 2013.
FU-Berlin: Lebensgeschichte. Tiefdruckgebiet Franz (getauft am 09.01.2007), written by: Loewenherz, R., https://www.met.fu-berlin.de/wetterpate/lebensgeschichten/Tief_FRANZ_09_01_07.htm (last access: 27 September 2023), 12 March 2007.
Ge, J., Much, D., Kappenberg, J., Nino, O., Ding, P., and Chen, Z.: Simulating storm flooding maps over Hafencity under present and sea level rise scenarios, J. Flood Risk Manage., 7, 319–331, https://doi.org/10.1111/jfr3.12054, 2014.
Gemmrich, J., Garrett, C., and Thompson, K.: Extreme waves in Canadian coastal waters, 11 th International Workshop on Wave Hindcasting and Forecasting and Coastal Hazard Symposium, JCOMM Technical Report 62, WMO/TD-No. 1533, IOC Workshop Report 232, Halifax, Canada, 18–23 October 2009, http://www.waveworkshop.org/11thWaves/ (last access: 27 September 2023), 2009.
Gönnert, G., Isert, K., Giese, H., and Plüss, A.: Charakterisierung der Tidekurve, Die Küste, 68, 99–141, 2004.
Guardian: Nine killed as gales lash UK, https://www.theguardian.com/world/2007/jan/12/weather.uk (last access: 27 September 2023), 12 January 2007.
Herald: Disaster averted as drifting ship misses North Sea platforms, The Herald, https://www.heraldscotland.com/default_content/12754075.disaster-averted-drifting-ship-misses-north-sea-platforms/ (last access: 27 September 2023), 12 January 2007.
hhvferry: Dekksplan/Decksplan/Deckplan M/S Prinsesse Ragnhild, https://hhvferry.com/prinragh_dpx.jpg (last access: 27 September 2023), November 2012.
Hüppop, O., Hill, R., Hüppop, K., and Jachmann, F.: Auswirkung auf den Vogelzug. Begleitforschung im Offshore-Bereich auf Forschungsplattformen in der Nordsee, FINOBIRD, Abschlussbericht, Institut für Vogelforschung “Vogelwarte Helgoland”, Inselstation, An der Sapskuhle 511, 27498 Helgoland, September 2009.
Kettle, A. J.: The North Sea surge of 31 October–1 November 2006 during Storm Britta, Adv. Geosci., 45, 273–279, https://doi.org/10.5194/adgeo-45-273-2018, 2018.
Kettle, A. J.: Storm Tilo over Europe in November 2007: storm surge and impacts on societal and energy infrastructure, Adv. Geosci., 49, 187–196, https://doi.org/10.5194/adgeo-49-187-2019, 2019.
Kettle, A. J.: Storm Xaver over Europe in December 2013: Overview of energy impacts and North Sea events, Adv. Geosci., 54, 137–147, https://doi.org/10.5194/adgeo-54-137-2020, 2020.
Kettle, A. J.: Storm Anatol over Europe in December 1999: impacts on societal and energy infrastructure, Adv. Geosci., 56, 141–153, https://doi.org/10.5194/adgeo-56-141-2021, 2021.
Kettle, A. J.: Storm Kyrill and the storms of mid-January 2007: Societal and Energy Impacts in Europe, Adv. Geosci., 58, 135–147, https://doi.org/10.5194/adgeo-58-135-2023, 2023.
Krogstad, H. E., Barstow, S. F., Mathisen, J. P., Lønseth, L., Magnusson, A. K., and Donelan, M. A.: Extreme waves in the long-term wave measurements at Ekofisk, in: Rogue Waves 2008: Proceedings of a Workshop organized by Ifremer and held in Brest, France, 13–15 October 2008 within the Brest Sea Tech Week 2008, edited by: Olagnon, M. and Prevosto, M., Ifremer, 23–33, https://archimer.ifremer.fr/doc/00133/24444 (last access: 27 September 2023), 2009.
Kurth, R., Taiarol, P., Crowther, J., and Stobart, M.: 4 challenges to overcome when transmitting offshore wind power, Stantec, https://www.stantec.com/en/ideas/4-challenges-to-overcome-when-transmitting-offshore-wind-power (last access: 23 October 2023), 7 June 2022.
Kvamme, D.: Ekstremvaer nr.1/2007 – “Per”, Intern Rapport, met.no, 15 pp., Meteorogisk Institutt met.no, Bergen, 14 February 2007.
Lloyd's Casualty Week: Lloyd's MIU, Telephone House, 69–77 Paul Street, London, EC2A 4LQ, 19 January 2007a.
Lloyd's Casualty Week: Lloyd's MIU, Telephone House, 69–77 Paul Street, London, EC2A 4LQ, 26 January 2007b.
Lockwood, J. F., Guentchev, G. S., Alabaster, A., Brown, S. J., Palin, E. J., Roberts, M. J., and Thornton, H. E.: Using high-resolution global climate models from the PRIMAVERA project to create a European winter windstorm event set, Nat. Hazards Earth Syst. Sci., 22, 3585–3606, https://doi.org/10.5194/nhess-22-3585-2022, 2022.
Magnusson, A. K.: Forecasting extreme waves in practice, in: Rogue Waves 2008: Proceedings of a Workshop organized by Ifremer and held in Brest, France 13–15 October 2008 within the Brest Sea Tech Week 2008, edited by: Olagnon, M. and Prevosto, M., Ifremer, 261–282, https://archimer.ifremer.fr/doc/00133/24444 (last access: 27 September 2023), 2009a.
Magnusson, A. K.: What is true sea state? Proceedings of the 11th International Workshop on Wave Hindcasting and Forecasting and Coastal Hazard Symposium, JCOMM Halifax, Canada, 18–23 October 2009, Technical Report No 52, WMO/TD-No. 1533, IOC Workshop Report No. 232, 2009b.
Magnusson, A. K.: Variability of sea state measurements and sensor dependence, Workshop: Statistical models of the Metocean environment for engineering uses, IFREMER 30.09–01.10.2013 [pdf timestamp: 10/10/2013], 2013.
MAIB: Report on the investigation of the structural failure of MSC Napoli English Channel on 18 January 2007, Marine Accident Investigation Branch, Carlton House, Carlton Place, Southampton, UK, SO15 2DZ, Report No 9/2008, April 2008.
Matelski, B., Jensen, F., Voss, P., Peters, J., and Blümel, M.: Auswertung zur Hydrologie des Sturmtiefs Xaver 05.12.2013 bis 06.12.2013, Statusbericht vom 01.10.2014, Landesbetrieb für Küstenschutz, Nationalpark und Meeresschutz, Schleswig-Holstein, Husum, 25 pp., 1 October 2014.
MCIB: Report of the Investigation into the sinking of the Irish fishing vessel “Pere Charles” off the south Wexford coast on 10 January 2007, Marine Casualty Investigation Board, Report No. MCIB/134, 15 October 2008.
MCIB: Report of investigation into the loss of the FV “Honeydew II” off Ram Head Co. Waterford on 11 January 2007, Marine Casualty Investigation Board, Report No. MCIB/135, 31 August 2009.
ModernPowerSystems: Horns Rev reveals the real hazards of offshore wind, https://www.modernpowersystems.com/features/featurehorns-rev-reveals-the-real-hazards-of-offshore-wind-720/ (last access: 30 September 2023), 1 October 2004.
Monserrat, S., Vilibić, I., and Rabinovich, A. B.: Meteotsunamis: atmospherically induced destructive ocean waves in the tsunami frequency band, Nat. Hazards Earth Syst. Sci., 6, 1035–1051, https://doi.org/10.5194/nhess-6-1035-2006, 2006.
Neumann, T. and Nolopp, K.: Three years operation of far offshore measurements at FINO1, DEWI Magasin, 30, 42–46, 2007.
NLWKN: Sturmflut am 12. Januar 2007: Nordseeküste kam glimpflich davon 12. Januar 2007 (aktualisiert am 15. Januar 2007): Dünenabbrüche auf den ostfriesischen inseln, https://www.nlwkn.niedersachsen.de/startseite/aktuelles/presse_und_offentlichkeitsarbeit/pressemitteilungen/-41838.html (last access: 30 September 2023), 15 January 2007.
Ørsted: Incident at Anholt offshore wind farm, https://orsted.com/en/media/newsroom/news/2022/04/incident-at-anholt-offshore-wind-farm (last access: 30 September 2023), 6 April 2022.
Outzen, O., Herklotz, K., Heinrich, H., and Lefebvre, C.: Extreme waves at FINO1 research platform caused by storm “Tilo” on 9 November 2007, DEWI Magazin No. 33, August 2008.
Parsons, A.: Cell 1 Regional Coastal Monitoring Programme Wave Data Analysis Report 2: 2013–2014, CH2MHILL Halcrow, Final Report, March, 2014.
Pattiaratchi, C. B. and Wijeratne, E. M. S.: Are meteotsunamis an underrated hazard?. Philos. T. R. Soc. A, 373, 2140377, https://doi.org/10.1098/rsta.2014.0377, 2015.
Pinto, J. G., Gomara, I., Masato, G., Dacre, H. F., Woolings, T., and Caballero, R.: Large-scale dynamics associated with clustering of extratropical cyclones affecting Western Europe, J. Geophys. Res.-Atmos., 119, 13704–13719, https://doi.org/10.1002/2014JD022305, 2014.
Pleskachevsky, A. L., Lehner, S., and Rosenthal, W.: Storm observations by remote sensing and influences of gustiness on ocean waves and on generation of rogue waves, Ocean Dynam., 62, 1335–1351, https://doi.org/10.1007/s10236-012-0567-z, 2012.
PTIL: Petrolum Safety Authority Norway Annual Report. Supervision and facts, Petroleum Safety Authority Norway, Stavanger, 26 April 2007.
Pugh, D. T.: Tides, Surges and Mean Sea Level, John Wiley and Sons, 1987.
Recharge: Video. Rescue dash as rudderless cargo ship hits foundation at giant North Sea wind farm (contributor Andrew Lee), https://www.rechargenews.com/wind/video-rescue-dash-as-rudderless-cargo-ship-hits-foundation-at-giant-north-sea-wind-farm/2-1-1160591 (last access: 30 September 2023), 1 February 2022.
Rheinische Post: Orkan Franz fegt über Deutschland hinweg, https://rp-online.de/panorama/deutschland/orkan-franz-fegt-ueber-deutschland-hinweg_aid-11404937 (last access: 30 September 2023), 11 January 2007.
Roberts, J. F., Champion, A. J., Dawkins, L. C., Hodges, K. I., Shaffrey, L. C., Stephenson, D. B., Stringer, M. A., Thornton, H. E., and Youngman, B. D.: The XWS open access catalogue of extreme European windstorms from 1979 to 2012, Nat. Hazards Earth Syst. Sci., 14, 2487–2501, https://doi.org/10.5194/nhess-14-2487-2014, 2014.
Rose, S., Jaramillo, P., Small, M.J., Grossmann, I., and Apt, J.: Quantifying the hurricane risk to offshore wind turbines, P. Natl. Acad. Sci. USA, 109, 3247–3252, https://doi.org/10.1073/pnas.1111769109, 2012.
RWS: Verslag van de stormvloed van 11 en 12 januari 2007 (SR85), Ministerie van Veerkeer en Waterstaat, Rijkswaterstaat, Stormvloedwaarschuwingsdienst/SVSD, Postbus 20907, 2500 EX 's-Gravenhage, https://open.rijkswaterstaat.nl/open-overheid/onderzoeksrapporten/%40257220/stormvloedrapporten-kust-benedenrivieren/ (last access: 23 October 2023), 's-Gravenhage, January 2007.
Sanders, F. and Gyakum, J. R.: Synoptic-dynamic climatology of the “Bomb”, Mon. Weather Rev., 108, 1589–1606, https://doi.org/10.1175/1520-0493(1980)108<1589:SDCOT>2.0.CO;2, 1980.
SMHI: Per – Januaristormen 2007, https://www.smhi.se/kunskapsbanken/meteorologi/per-januaristormen-2007-1.5287 (last access: 30 September 2023), 6 August 2009.
Sorensen, T., Jensen, F. V., Raben, N., Lykkegaard, J., and Saxov, J.: Lightning protection for offshore wind turbines CIRED2001, 18–21 June 2001, Conference Publication No. 482, IEE, 2001.
Spencer, T., Brooks, S. M., Evans, B. R., Tempest, J. A., and Möller, I.: Southern North Sea storm surge event of Dec.5, 2013: Water levels, waves, and coastal impacts, Earth-Sci. Rev., 146, 120–145, https://doi.org/10.1016/j.earscirev.2015.04.002, 2015.
Stull, R. B.: An Introduction to Boundary Layer Meteorology, Kluwer Academic Publishers, Dordrecht, 1988.
The Journal: “No impact on the grid” after wind turbine catches fire during lightning storm off Wicklow coast, http://www.thejournal.ie/no-impact-on-the-grid-after-wind-turbine-catches-fire-during-lightning-storm-off-wicklow-coast-5898419-Oct2022/ (last access: 30 September 2023), 20 October 2022.
TV2: Norge-færge tog vand ind i nat, https://nyheder.tv2.dk/krimi/2007-01-21-norgefaerge-tog-vand-ind-i-nat (last access: 30 September 2023), 21 January 2007.
Unwetterzentrale: Orkantief FRANZ – 11.,12.01.2007 (Tief Nr. 29), prepared by Manfred Spatzierer and Stefan Laps, http://www.unwetterzentrale.de/uwz/347.html (last access: 30 September 2023), January 2007a.
Unwetterzentrale: Orkantief KYRILL – 18., 19.01.2007 (Tief Nr. 33) – Der schwerste Orkan seit Jahrzehnten analysis by Manfred Spatzierer, Thomas Sävert, Stefan Laps, http://www.unwetterzentrale.de/uwz/348.html (last access: 30 September 2023), January 2007b.
US Army Corps of Engineers: Shore Protection Manual, Volume 1, Coastal Engineering Research Center, Department of the Army, Waterways Experiment Station, Corps of Engineers, P.O. Box 631, Vicksburg, Mississippi 39180, USA, 1984.
Wind Action: Massive damage in the wind farm – cause unclear, contributor: Gerlach, C., NDR, http://www.windaction.org/posts/48258-massive-damage-in-the-wind-farm-cause-unclear#.XsD_dDl7nIU (last access: 30 September 2023), 25 April 2018.
Wind-Watch: Crews in Harper County cleaning up after Saturday's tornado, contributed by: Johnson, R., Enright, G., and Grawe, J., https://www.wind-watch.org/news/2012/05/21/crews-in-harper-county-cleaning-up-after-saturdays-tornado/ (last access: 30 September 2023), 19 May 2012.
Winther-Jensen, M. and Jørgensen, E. R.: When real life wind speed exceeds design wind assumptions, 1999 European Wind Energy Conference, 1–5 March 1999, Nice, France, 220–223, 1999.
Zemunik, P., Šepić, J., Pellikka, H., Ćatipović, L., and Vilibić, I.: Minute Sea-Level Analysis (MISELA): a high-frequency sea-level analysis global dataset, Earth Syst. Sci. Data, 13, 4121–4132, https://doi.org/10.5194/essd-13-4121-2021, 2021.