the Creative Commons Attribution 4.0 License.
the Creative Commons Attribution 4.0 License.
 | 18 Jan 2024
A new look into the impacts of dust radiative effects on the energetics of tropical easterly waves
Farnaz Hosseinpour
Eric M. Wilcox
Saharan dust aerosols are often embedded in tropical easterly waves, also known as African easterly waves, and are transported thousands of kilometers across the tropical Atlantic Ocean, reaching the Caribbean Sea, Amazon Basin, and eastern USA. However, due to the complex climate dynamics of west Africa and the eastern tropical Atlantic Ocean, there is still a lack of understanding of how dust particles may influence the development of African easterly waves, which are coupled to deep convective systems over the tropical Atlantic Ocean and in some cases may seed the growth of tropical cyclones. Here we used 22 years of daily satellite observations and reanalysis data to explore the relationships between dust in the Saharan air layer and the development of African easterly waves. Our findings show that dust aerosols not merely are transported by the African easterly jet and the African easterly waves system across the tropical Atlantic Ocean, but also contribute to the changes in the eddy energetics of the African easterly waves.
The efficiency of the dust radiative effect in the atmosphere is estimated to be a warming of approximately 20 W m−2 over the ocean and 35 W m−2 over land. This diabatic heating of dust aerosols in the Saharan air layer acts as an additional energy source to increase the growth of the waves. The enhanced diabatic heating of dust leads to an increase in meridional temperature gradients in the baroclinic zone, where eddies extract available potential energy from the mean flow and convert it to eddy kinetic energy. This suggests that diabatic heating of dust aerosols can increase the eddy kinetic energy of the African easterly waves and enhance the baroclinicity of the region. Our findings also show that dust outbreaks over the tropical Atlantic Ocean precede the development of baroclinic waves downstream of the African easterly jet, which suggests that the dust radiative effect has the capability to trigger the generation of the zonal and meridional transient eddies in the system comprising the African easterly jet and African easterly waves.
- Article
(7850 KB) - Full-text XML
-
Supplement
(2160 KB) - BibTeX
- EndNote


African easterly waves (AEWs), also known as tropical Atlantic easterly waves, are synoptic-scale atmospheric disturbances with a preferred wavelength in the 2000–4000 km range that often develop into tropical Atlantic cyclones (Dunn, 1940). The basic characteristics and behavior of the AEWs have been described in previous studies (Charney and Stern, 1962; Chang, 1993; Kiladis et al., 2006; Diaz and Aiyyer, 2013). Local heating is a dominant factor in determining the growth of AEWs over west Africa (Norquist et al., 1977), such that the presence of diabatic heating near the entrance of the African easterly jet (AEJ) is a favorable factor in generating AEWs (Thorncroft et al., 2008; Russell et al., 2020). The localized middle- to lower-tropospheric heating generates vortices in the vicinity of the AEJ core, which comprise the genesis of the AEWs (Thorncroft et al., 2008; Berry and Thorncroft, 2012). AEWs can be initiated by convective triggers over the highlands of eastern Africa and forcing from the subtropical Atlantic storm track (Cornforth et al., 2009).
Several studies have shown that AEWs are intensified in the presence of convective systems where the mesoscale convection and synoptic-scale AEWs are dynamically coupled (Kiladis et al., 2006; Hsieh and Cook, 2005, 2007; Berry and Thorncroft, 2012). A large portion of tropical Atlantic cyclones and hurricanes evolve from the AEWs (Avila and Clark, 1989; Avila and Pasch, 1992; Pasch and Avila, 1994) during the boreal summer season, which is the season when the amplitude of AEWs peaks (e.g., Roundy and Frank, 2004).
Numerous studies have addressed the dynamics of the AEWs; however, the impacts of aerosol radiative effects on the energy of the AEWs are poorly understood. The Sahara in north Africa is the largest source of dust in the world, where over 60×106 t of dust particles (e.g., Prospero and Lamb, 2003; Lau and Kim, 2007) is lifted annually and transported within the Saharan air layer (SAL) across the Atlantic Ocean (Carlson and Prospero, 1972), reaching the Caribbean Sea, the Gulf of Mexico, the Amazon Basin, and the United States (e.g., Perry et al., 1997; Liu et al., 2008; Francis et al., 2020). Dust particles in the SAL have a robust influence on regional and global climate through their impacts on radiation, clouds, the hydrological cycle, and atmospheric circulation (Colarco et al., 2003; Lau et al., 2009; Wilcox et al., 2010; Kim et al., 2010). In particular, among aerosol species, dust is known for having a strong shortwave radiative effect by both efficiently scattering and absorbing incoming radiation, leading to a heating of the dust layer and strong cooling of the surface (Myhre et al., 2004; Mamun et al., 2021; Francis et al., 2022). The shortwave radiative effect is slightly counteracted by the longwave radiative effect of dust, which causes warming at the surface and cooling within the atmosphere (Meloni et al., 2018).
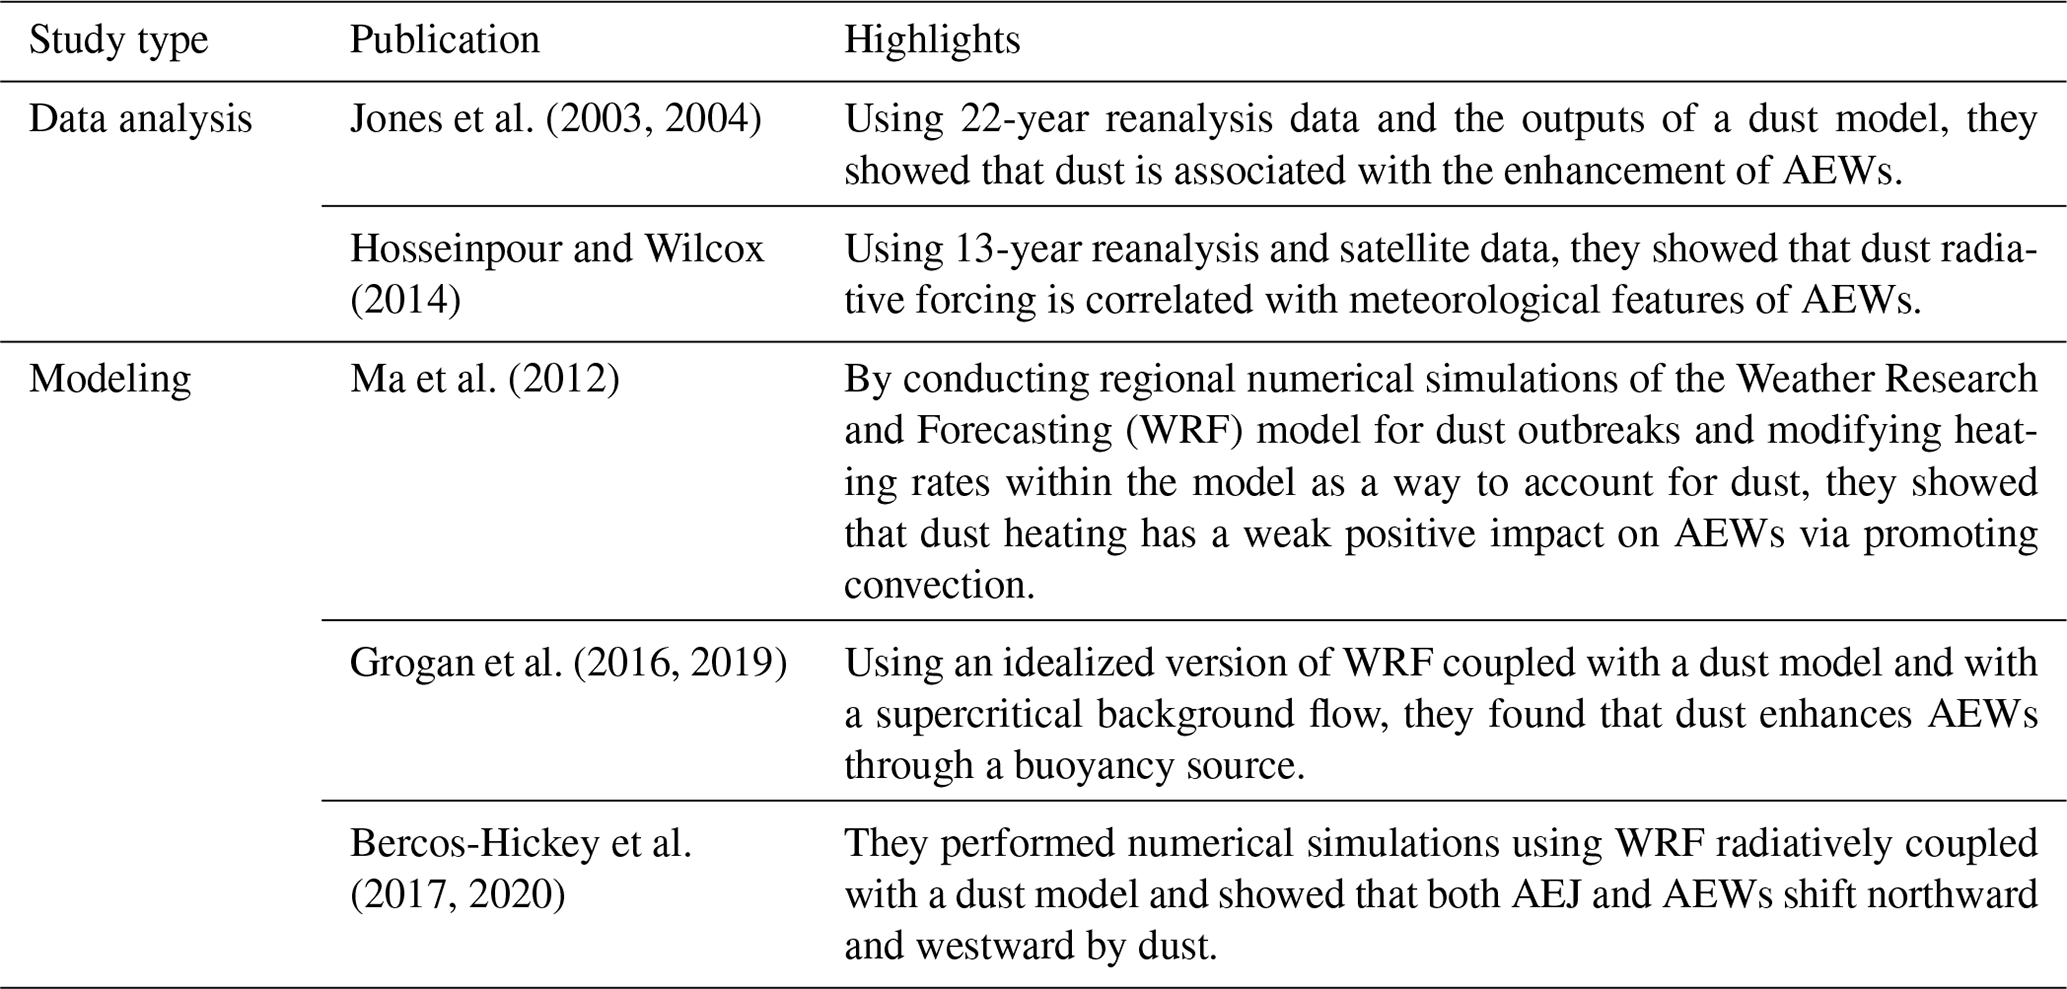
A limited number of studies have focused on the impacts of Saharan dust plumes on the dynamics of the AEWs (Jones et al., 2003; Ma et al., 2012; Hosseinpour and Wilcox, 2014). Jones et al. (2004) suggested that dust optical and radiative properties have significant impacts on the AEWs. They showed that the low-level temperature anomalies associated with the AEWs are modulated by the dust radiative effect and suggested that dust loading in the SAL precedes the maximum geopotential height at 700 hPa by about 1–2 d. Model sensitivity studies have also shown that the intensification of AEWs can be induced by dust (Ma et al., 2012; Grogan et al., 2019; Bercos-Hickey and Patricola, 2021; Grogan et al., 2022). Using an idealized numerical model, Grogan et al. (2016) found that the presence of dust enhances the development of AEWs by providing a buoyancy source. They also showed that dust can affect the propagation of AEWs by changing the wind shear and stability of the atmosphere. Using a regional climate model coupled with a dust model, Bercos-Hickey et al. (2017) found that Saharan dust causes AEJ to shift northward, upward, and westward, and this results in westward expansion and the northward shift of both the northern and the southern tracks of the AEWs. Satellite observations support this notion by showing that a similarity exists between the patterns of temperature and wind anomalies of the AEWs and those associated with the dust outbreaks (Hosseinpour and Wilcox, 2014).
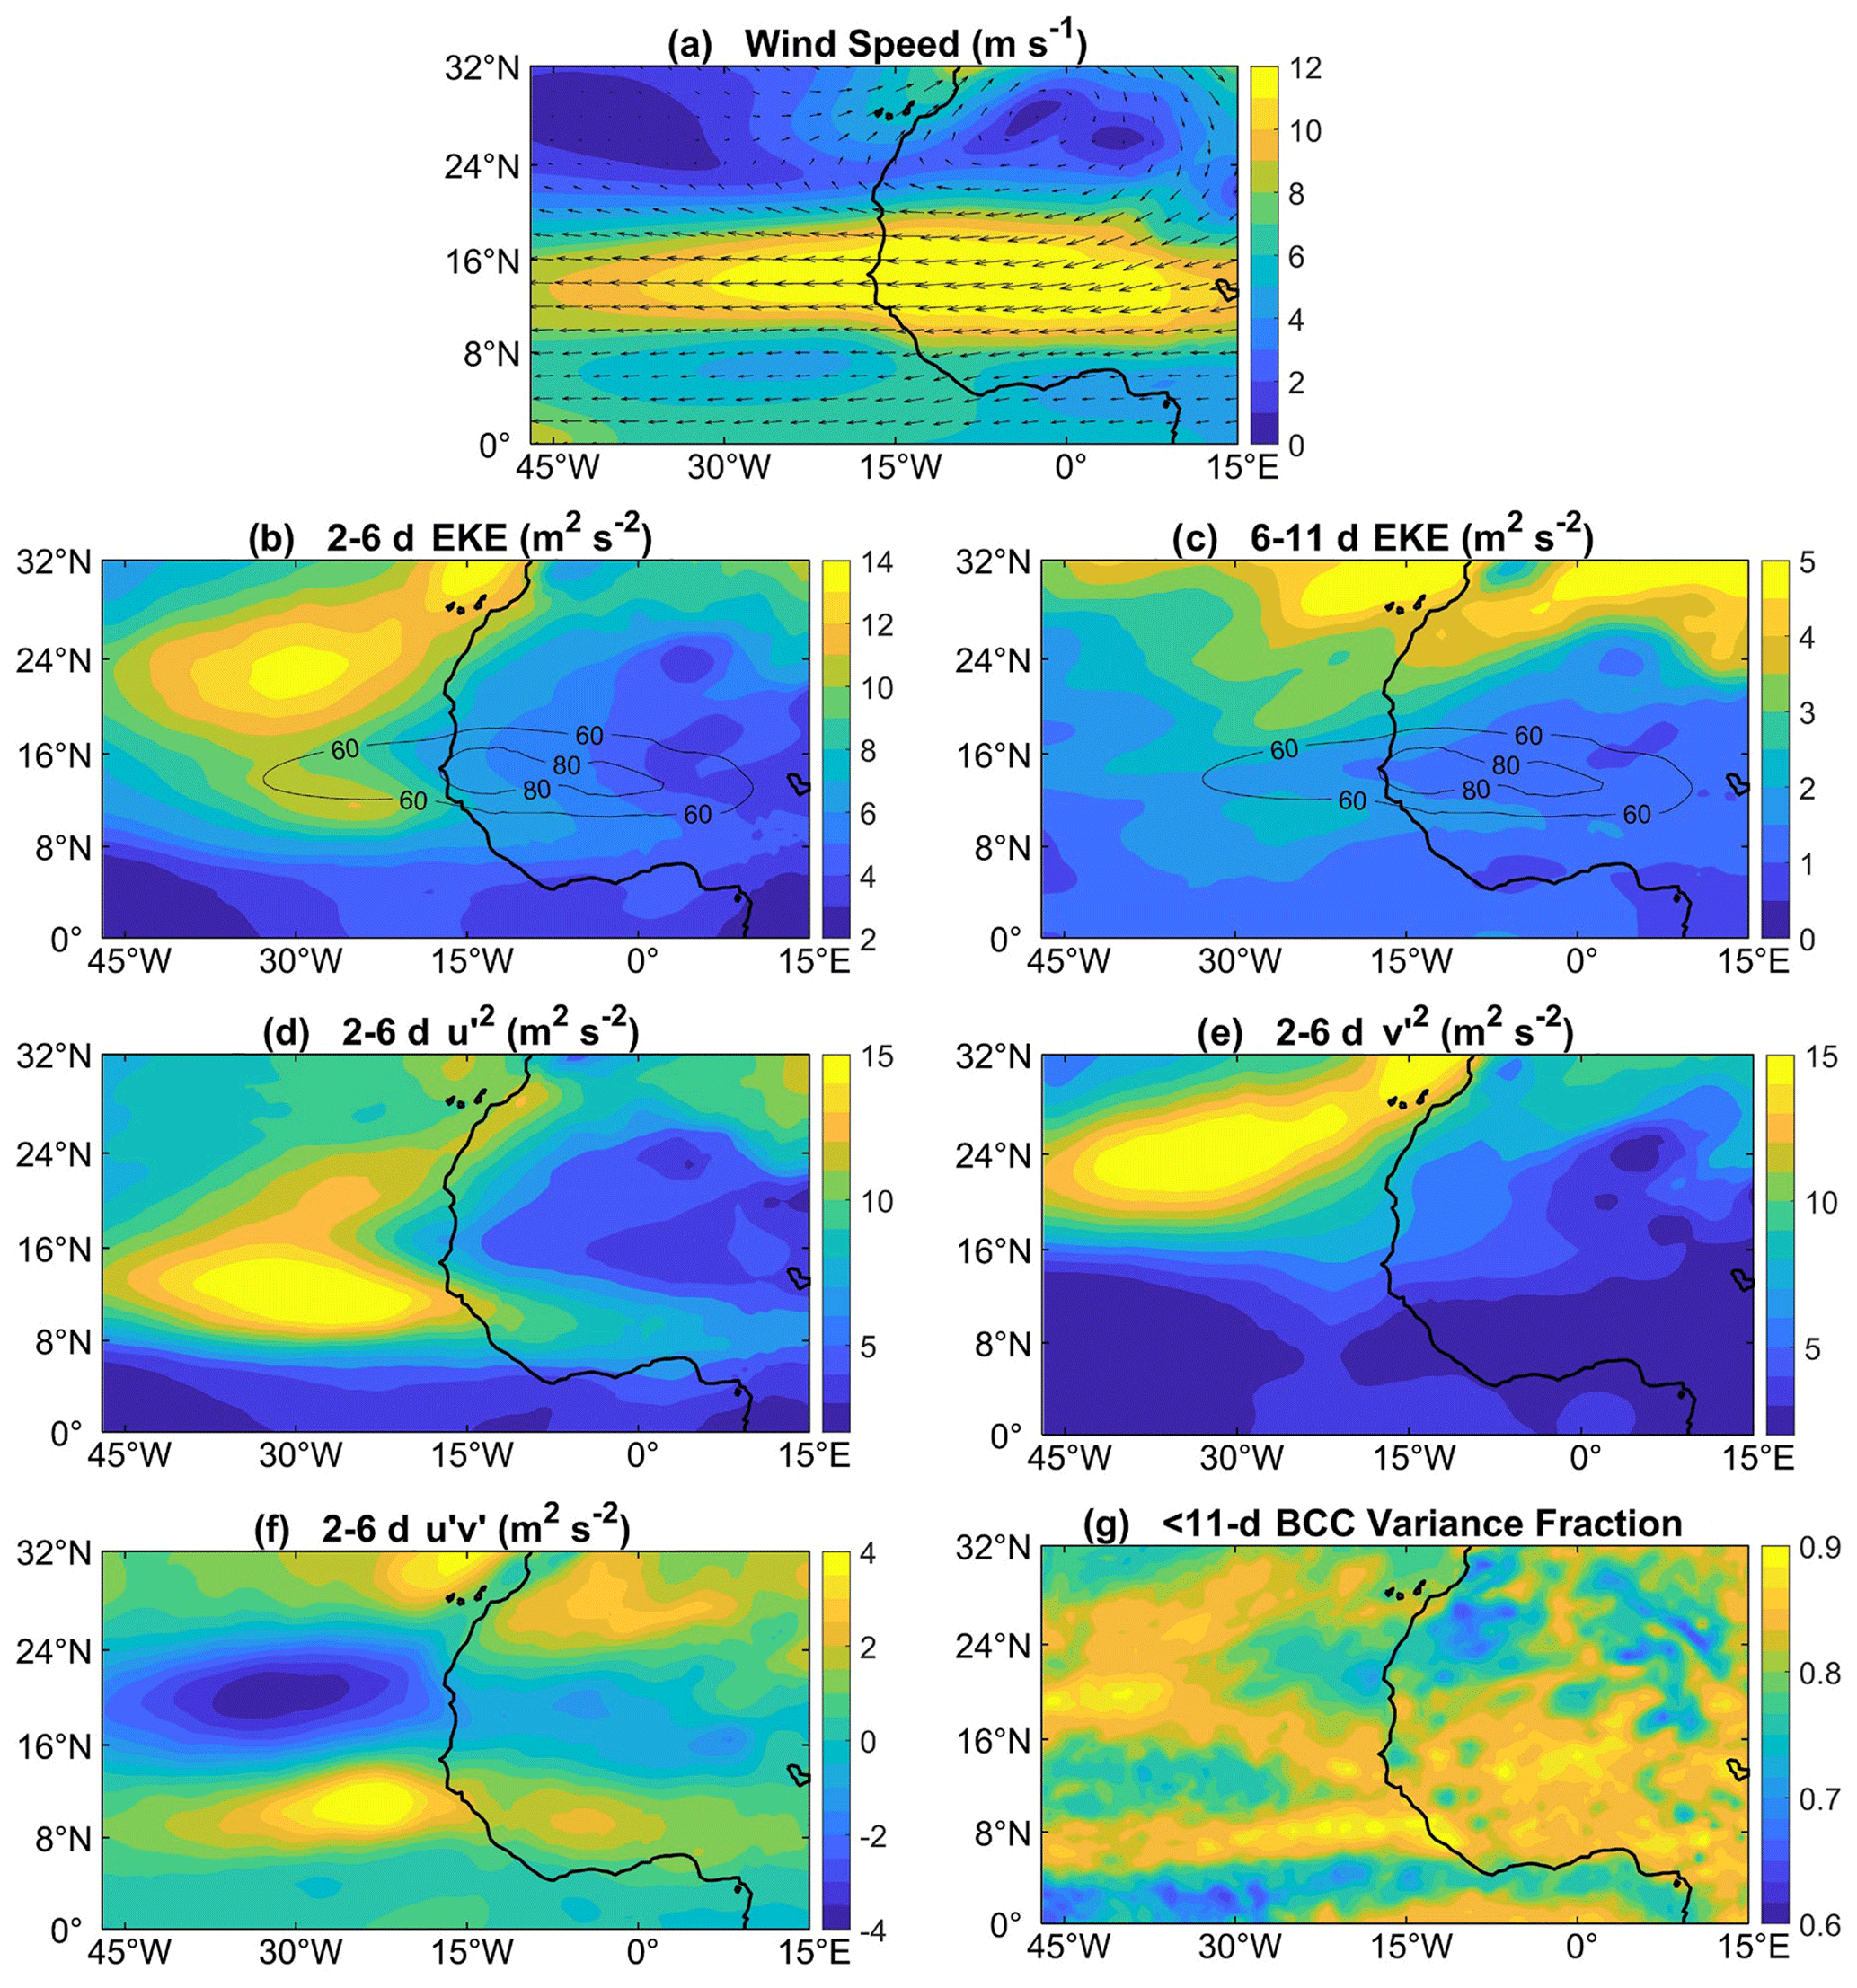
Figure 1(a) Long-term mean of 600 hPa wind speed (m s−1) from MERRA-2 reanalysis over JJA, 2000–2021. (b) Same as (a) but for 2–6 d bandpass-filtered EKE (m2 s−2) at 600 hPa. (c) Same as (b) but for 6–11 d bandpass-filtered EKE. (d) Same as (b) but shows the 2–6 d variance of zonal wind, (m2 s−2). (e) Same as (b) but shows the 2–6 d variance of meridional wind, (m2 s−2). (f) Same as (b) but for the 2–6 d filtered transient momentum fluxes, (m2 s−2). (g) Fraction of less than the 11 d variance of 600 hPa baroclinic conversion (BCC) with respect to the total variance of BCC in JJA, 2000–2021.
Saharan dust is not the only contributor to the aerosol radiative effect over Africa and the Atlantic Ocean. Previous studies have shown that smoke transport from biomass burning can reach up to ∼ 3–5 km altitude, which is above the stratocumulus clouds over the Sahel region and may affect the radiation through aerosol direct and indirect effects (Redemann et al., 2021). Biomass burning in Africa is closely related to seasonal rainfall variability and the location of the Intertropical Convergence Zone (ITCZ); thus, the emissions from biomass burning in north Africa occur in boreal spring and winter, when ITCZ is south of the Equator (e.g., Cahoon et al., 1992; Barbosa et al., 1999; Ramo et al., 2021). During the boreal winter, smoke aerosols are maximized over the Sahel region (Fig. 1; Haywood et al., 2008), where the northward transport of smoke merges with dry southward and westward transport of dust aerosols. This leads to the co-existence of dust and smoke, as smoke is dominant on the top of the dust layer (Haywood et al., 2008). However, during the boreal summer, biomass burning mainly occurs in southern Africa, where the air circulations transport smoke plumes toward the southeast Atlantic off the coasts of Namibia and Angola (Zuidema et al., 2016; Cochrane et al., 2022). To study the effects of Saharan dust aerosols on AEWs while avoiding the major impact of smoke transport from biomass burning in southern Africa, we focus our study on the region above 5∘ N latitude in west Africa and the eastern Atlantic Ocean in boreal summer, where the contribution of aerosols from biomass burning is less than 15 % by mass over this region (Matsuki et al., 2010). This study focuses on the boreal summer season because, during this season, the amplitude of AEWs peaks (e.g., Roundy and Frank, 2004) and Saharan dust storms are active with less simultaneous transport of smoke from southern Africa biomass burning.
While previous studies have shown the impacts of dust aerosols on climate (Ming and Ramaswamy, 2011; Hosseinpour and Wilcox, 2014; Chen et al., 2021; Liang et al., 2021; Grogan et al., 2022), the hydrological cycle (Konare et al., 2008; Kim et al., 2010; Bercos-Hickey et al., 2020), and cloud properties (Weinzierl et al., 2017; Haarig et al., 2019), these elements of the climate system in this region exhibit strong variability due to AEWs. To understand the details of interactions between dust aerosols and climate over the Atlantic Ocean, it is essential to understand how the evolution of AEWs is determined by both diabatic heating and exchanges of eddy kinetic energy (EKE) within the jet–wave system and how dust may contribute to the energy driving AEWs. Toward this goal, we apply eddy energetic concepts to further analyze the relationships between dust and the AEJ–AEW system to gain insight into the impacts of the dust aerosol radiative effects on the development of AEWs and the distribution of kinetic energy from the source of instability (i.e., AEJ). Section 2 summarizes the data and methodology. Section 3 discusses the summary of results: the climatology of and variability in the AEJ–AEW system from an energy point of view (Sect. 3.1), the climatology of and variability in Saharan dust aerosols across west Africa and the eastern tropical Atlantic Ocean (Sect. 3.2), and the impacts of dust on the AEJ–AEW system (Sect. 3.3). Conclusions are presented in Sect. 4.
This study focuses on the relationships of Saharan dust aerosols and AEWs in boreal summer because during this season, the amplitude of the AEWs peaks (e.g., Roundy and Frank, 2004). We used a 22-year time series of NASA's satellite observations and reanalysis for the boreal summer seasons from June to August (JJA) 2000–2021 to calculate the variability in energy components of the system comprising the AEJ, the AEWs, and the aerosol radiative effect.
2.1 MODIS and MERRA-2 data
To study the climatology of west Africa and the eastern tropical Atlantic Ocean, the successor to the Modern-Era Retrospective Analysis for Research and Applications reanalysis (MERRA; Rienecker et al., 2008, 2011), the 3-hourly MERRA-2 reanalysis (Randles et al., 2017; Buchard et al., 2017; Gelaro et al., 2017), was used to provide more reliable assessments of climatic and meteorological variables from 1980 to the present. The MERRA-2 reanalysis has a 3-hourly temporal resolution and a spatial resolution of 0.5∘ latitude by 0.625∘ longitude with 72 vertical levels, extending from the surface up to 0.01 hPa.
We used the MERRA-2 broadband shortwave flux across the visible spectrum to study the aerosol radiative effect as described in Sect. 2.2, as well as the meteorological variables, including wind components, temperature, pressure, and humidity from the 3-hourly MERRA-2 reanalysis for the boreal summer (JJA) from 2000 to 2021, to calculate the eddy energetic terms of the AEW–AEJ system as described in Sect. 2.3.
The reason for choosing the MERRA-2 analysis for this study is as follows: an essential aspect of MERRA-2 is the assimilation of bias-corrected aerosol optical depth (AOD) from the various ground- and space-based remote sensing platforms (e.g., Randles et al., 2017). In particular, AOD is simulated in MERRA-2 with a radiatively coupled version of the Goddard Chemistry, Aerosol Radiation and Transport (GOCART; Colarco et al., 2010) aerosol model. In this manner, the MERRA-2 system provides an estimate of the atmosphere state historically from the present day back to 1980.
It is important to note that the dust and the circulation are fully coupled in MERRA-2. A limitation of using such an empirical tool is that it is not possible to directly compare a complete representation of the circulation without dust to the circulation with dust. However, the benefit of using MERRA-2 is that it offers a more realistic representation of the circulation, including AEWs, than an unconstrained model because the data assimilation ties the simulated circulation more closely to the properties of the observed atmosphere. It is our intention with this study to evaluate the empirical relationships between the dust radiative effect and the energetics of AEWs in a reanalysis constrained by observations to determine whether the relationships observed are consistent with the inferences about the role of dust aerosols in tropical dynamics from prior modeling work, including the studies cited in Sect. 1 above. Furthermore, we aim to show how an analysis of the eddy energetics of tropical easterly waves can be applied to studies of dust aerosols and their interaction with tropical dynamics, which can be applied to model simulation experiments to further test the hypothesis that dust radiative effects contribute to eddy energetics. We also perform a time-lag analysis between variations in the dust radiative effect and the eddy kinetic energy of AEWs, as well as other supplementary analyses, to build confidence that the observed relationships presented here are consistent with our hypothesis.
Table 1MODIS and MERRA-2 data information applied in this study.
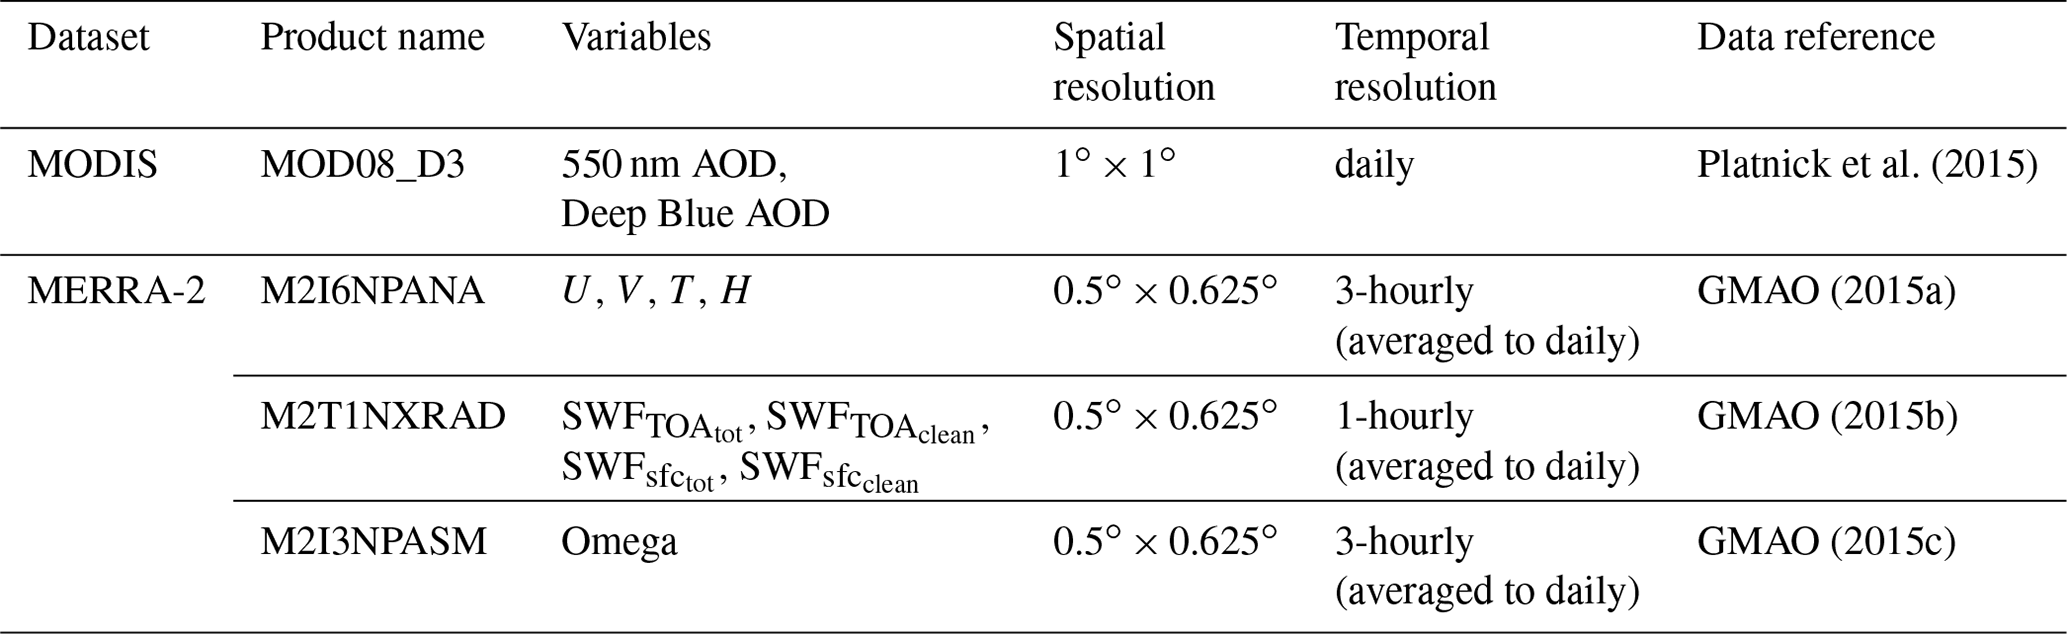
To evaluate the MERRA-2 reanalysis with satellite observations, we used the entire record of the daily AOD (level 3) from two independent algorithms and well-calibrated sensors: (i) the 550 nm Moderate Resolution Imaging Spectroradiometer dark-target retrieval (MODIS, MOD08_D3; Remer et al., 2020), with a 1∘ spatial resolution on Terra since 2000 for the dust domains over the Atlantic Ocean, and (ii) the 470 nm Deep Blue (Sayer et al., 2019; Hsu et al., 2019) retrievals of MODIS AOD available with a 1∘ spatial resolution for the dust source regions over the land in boreal summer (JJA, 2000–2021). A summary of the information about the MODIS and MERRA-2 data product name, variables, and spatial and temporal resolutions is provided in Table 1.
2.2 Aerosol radiative effect in the atmosphere
We used the components of the aerosol radiative effect at the surface and top of the atmosphere (TOA) from the 3-hourly MERRA-2 reanalysis datasets to calculate the radiative effect of dust in the atmosphere (i.e., TOA minus surface) as follows:
where refers to the net downward shortwave radiation flux at the TOA, is the net downward shortwave flux at the TOA under clean-sky conditions, is the net downward shortwave flux at the surface, and is net downward shortwave flux at the surface under clean-sky conditions.
To show the variability in dust, time–longitude Hovmöller diagrams of daily anomalies of the aerosol radiative effect are provided to represent the dust transport within the SAL across the tropical Atlantic Ocean. The daily values of the radiative effect are calculated by time-averaging the 3-hourly data. The daily anomalies of the radiative effect were calculated with respect to the seasonal time average of the radiative effect for each year. These anomalies were latitudinally averaged over the latitudes of dust domains, 12–22∘ N.
To investigate the relationship between dust and the AEJ–AEW system over the Atlantic Ocean, we focused on the dust variability over the ocean; therefore, we consider the location of the SAL over the tropical Atlantic Ocean, the so-called OSAL domain, where dust is significant from −28 to −16∘ E longitude and from 12 to 22∘ N latitude in the climatology of boreal summer seasons.
2.3 Energetics of the AEJ–AEW system
We used MERRA-2 meteorological variables as described in Sect. 2.1 to calculate the eddy energetic terms associated with the distribution of kinetic energy across the AEJ–AEW system for the boreal summer from 2000 to 2021. While the MERRA-2 data are 3-hourly, we averaged them for each day to be consistent with the daily temporal resolution of MODIS AOD data. We provided daily MERRA-2 data to apply them in the calculation of the eddy energetic terms.
From an energy point of view, the kinematics of the atmosphere is a combination of the mean kinetic energy (MKE) of the background mean flow and the eddy kinetic energy (EKE) representing transient eddies (Lorenz, 1955). The MKE associated with the AEJ is calculated as below, where u and v are horizontal components of wind and the bar represents the time averaged over the long-term daily time series of the wind components:
To detect the 2–6 and 6–11 d variations associated with the AEWs, we used the methodology following Wu et al. (2013). While many studies have focused exclusively on 2–6 d period AEWs, several studies have found evidence that AEWs exist on two distinct timescales of 2–6 and 6–11 d periods, as the structure of the AEWs differs substantially between these two different time windows (Mekonnen et al., 2006; Wu et al., 2013). The time-filtering method described below was applied to decompose the EKE of the AEWs at different timescales: 2–6 and 6–11 d filtered variations.
We provide the daily times series of wind components by time-averaging over the 3-hourly MERRA-2 datasets. We further used the Lanczos bandpass filtering techniques described in Duchon's (1979) study to filter the 2–6 and 6–11 d disturbances from the daily time series of the zonal and meridional components of wind (u,v). The daily anomalies of wind components (u,v) were calculated for each boreal summer season with respect to the average of that season ( and ; primes indicate daily anomalies, and bars show seasonal averages). Finally, EKE was calculated as the average of the variances of u and v shown as follows:
The bars indicate the average over the entire JJA, 2000–2021, and the primed quantities denote the deviation of wind components from the time mean (daily anomalies) described above.
Baroclinic conversion (BCC) is one of the most important components in the eddy energy budget to distribute transient energy from the upstream baroclinic source across the storm tracks downstream of the jet stream (e.g., Orlanski and Katzfey, 1991; Chang et al., 2002). The initiation of and the growth of the waves are significantly related to BCC, where the transient eddies extract energy from the mean flow through BCC (e.g., Plumb, 1983). Following the approach described in Chang et al. (2002) study, we calculated the BCC term as below:
where ω is the rate of pressure and α is a scale to estimate the changes in the vertical profile of the gradient of geopotential height . We investigate BCC to identify the locations favorable for developing EKE in the AEJ–AEWs.
2.4 Composite analysis
Composite analyses for 2–6 and 6–11 d variations in the eddy energetics of the AEWs were conducted for the boreal summer seasons of 22 years, 2000–2021. Composite EKE was calculated by subtracting the EKE values associated with the lower-quartile radiative effect of dust from those EKE values associated with the upper-quartile aerosol radiative effect. We find the upper- and lower-quartile aerosol radiative effect offshore, where the dust load is significant over the OSAL domain (rectangle in Fig. 2a). To determine the upper and lower quartile of the aerosol effect, the aerosol effect over the OSAL box is averaged at each time to create a time series of OSAL aerosol effects. The daily time series of aerosol radiative effect of the grid points were spatially averaged over the OSAL domain, which provided one single value of the aerosol radiative effect for each individual day in the long-term time series over the dust domain. For averaging over the OSAL domain, an area-weighted average is applied since the area of grid cells is not the same. These time series of the aerosol radiative effect were used to select the days of the upper-quartile and the lower-quartile aerosol radiative effect for the summer season of each year. Hence, we selected 23 d of the highest aerosol concentration (upper quartile) and 23 d of the lowest aerosol concentration (lower quartile) over each domain during the boreal summer of each year. From a climatology point of view, we used the upper quartile and lower quartile of dust over 22 years of data such that there are 506 data points to represent the days with high values of dust concentration and 506 d with low values of dust over each domain of study.
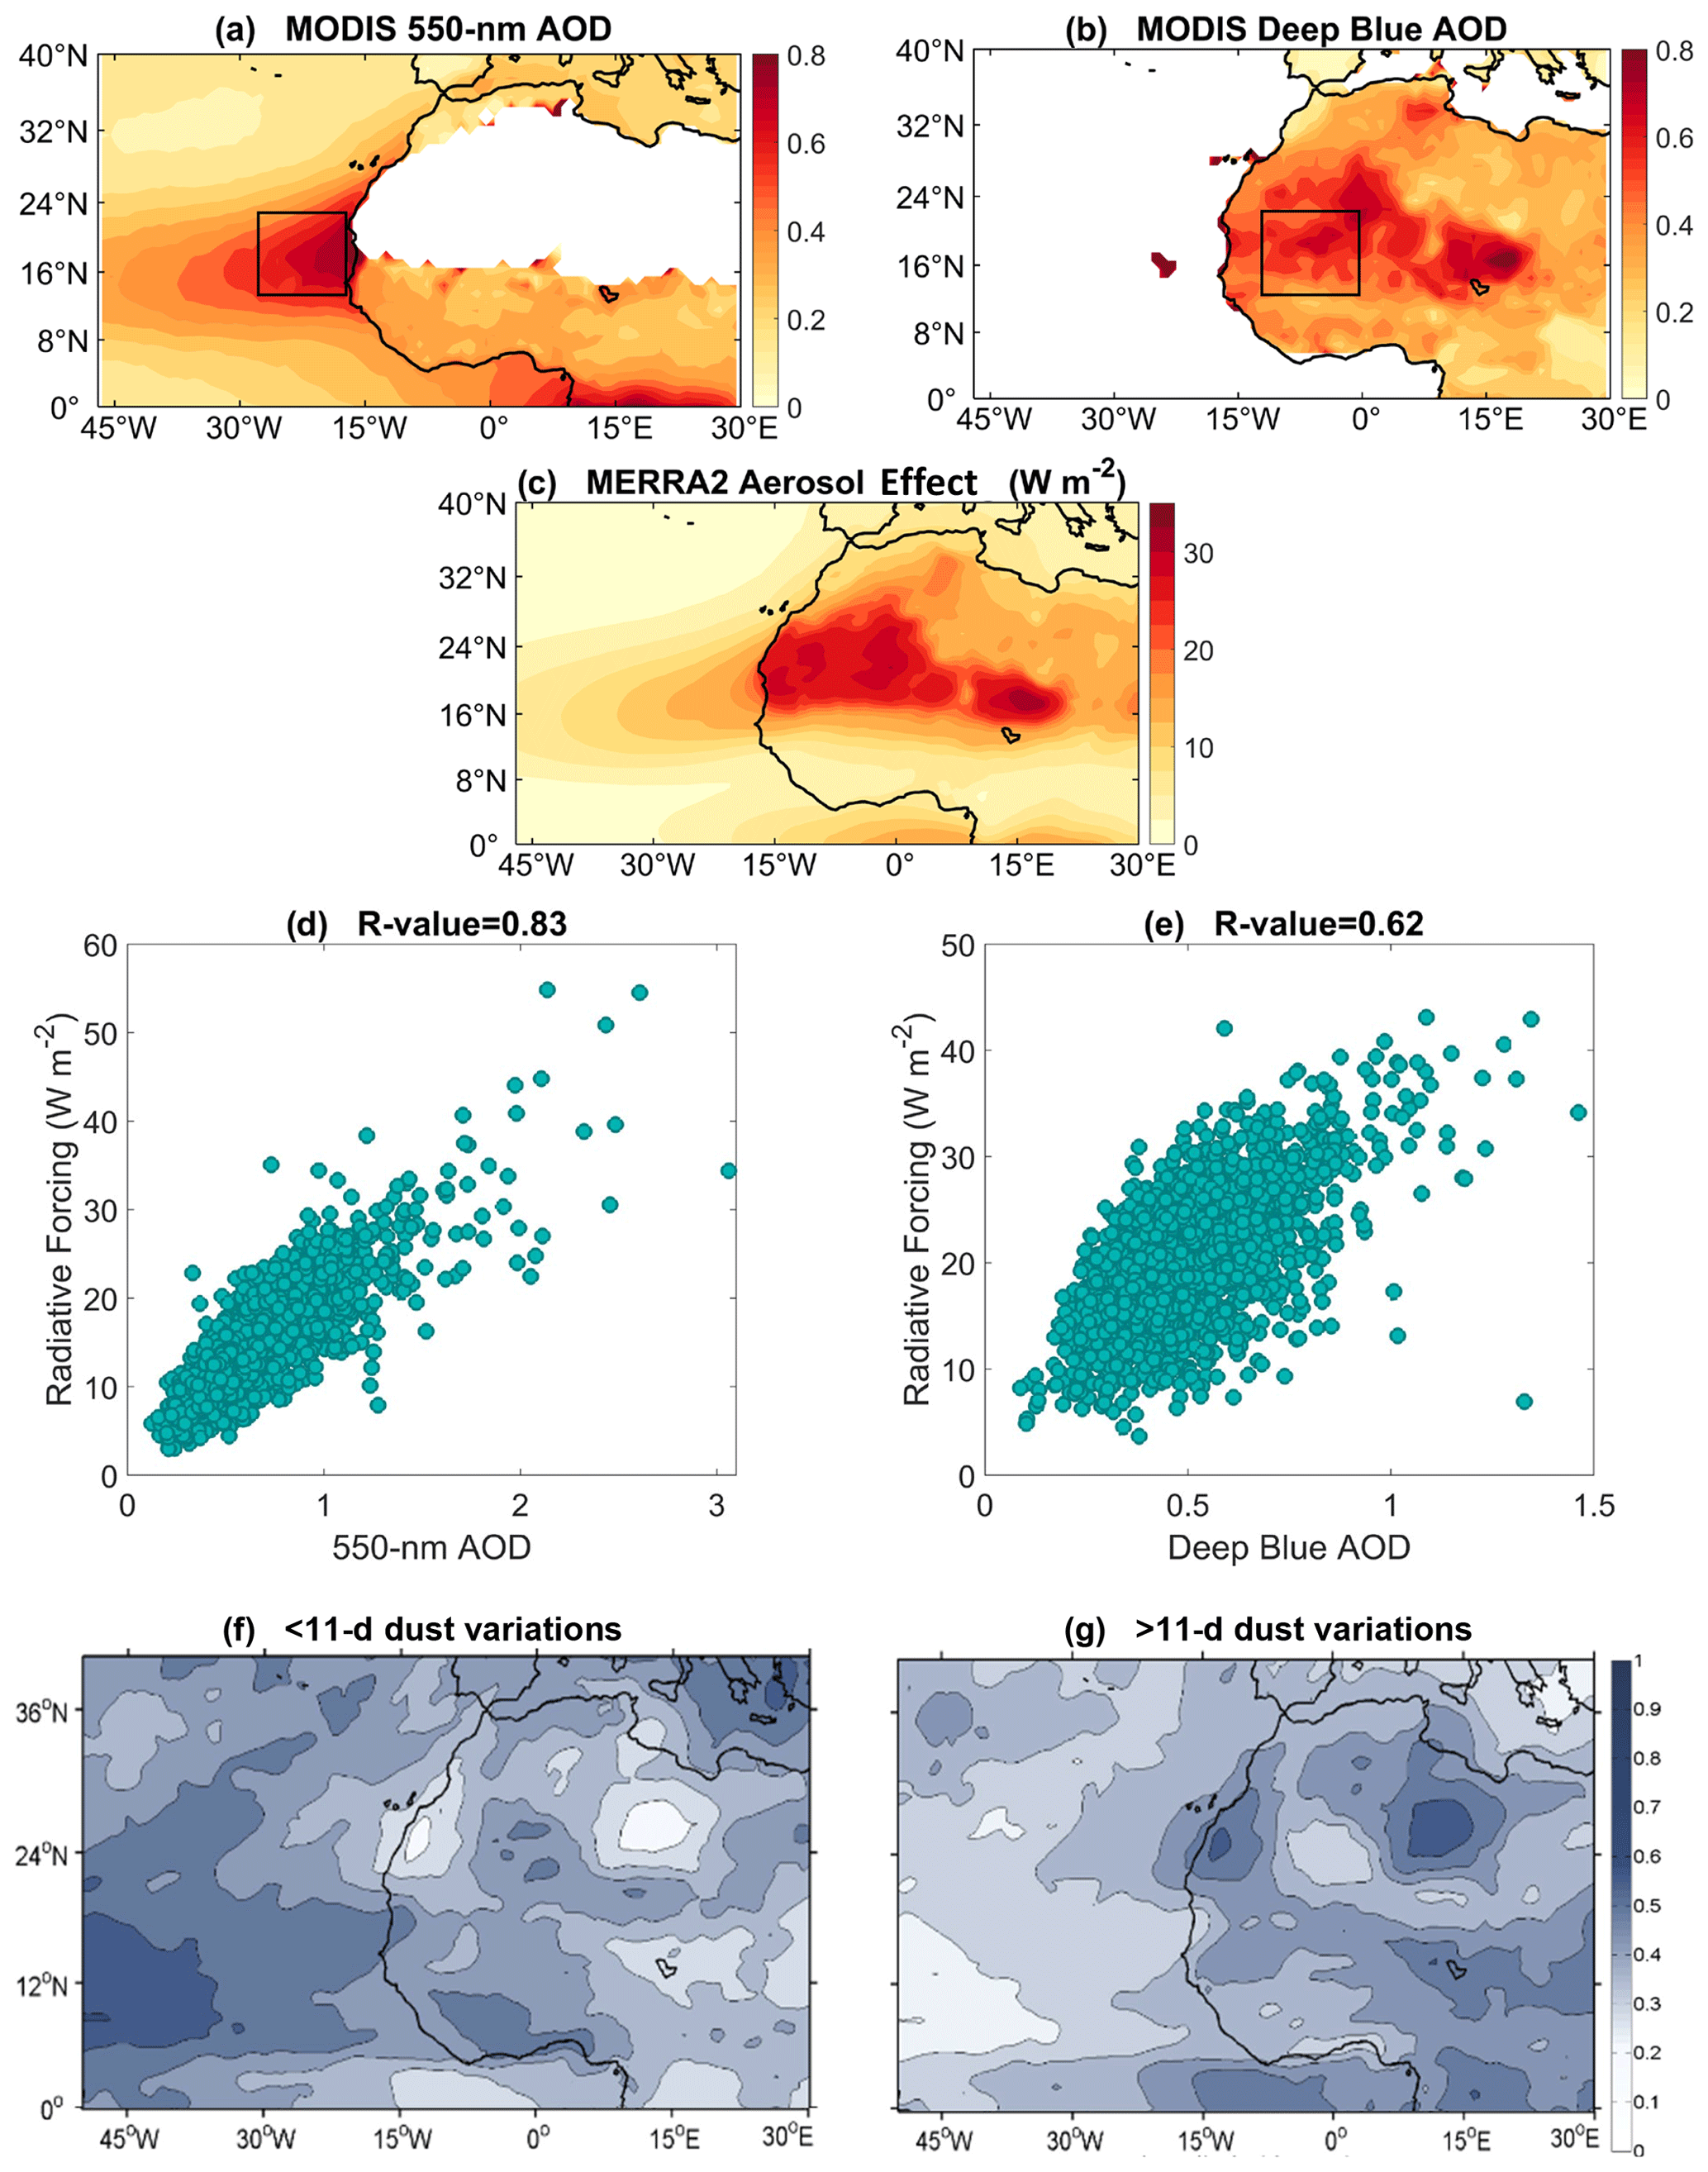
Figure 2(a) Long-term mean of 550 nm aerosol optical depth (AOD) from MODIS over JJA, 2000–2021. (b) Same as (a) but for 470 nm MODIS Deep Blue AOD. (c) Same as (a) but for the aerosol shortwave radiative effect (W m−2) in the atmosphere (TOA minus surface) from the MERRA-2 reanalysis. (d) Relationship between MODIS AOD and the MERRA-2 radiative effect for JJA, 2000–2021. Each data point shows daily data averaged over the OSAL region (rectangle in panel (a)). The results are statistically significant with P value < 0.05. (e) Same as (d) but for MODIS Deep Blue AOD over the land (rectangle in panel (b)). (f) Fraction of variations of less than 11 d for the variance of the aerosol radiative effect with respect to the total variance using the long-term mean of the aerosol radiative effect in the atmosphere (TOA minus surface) from the MERRA-2 reanalysis over JJA, 2000–2021. (g) Same as (f) but for variations of more than 11 d.
Composite EKE is provided for each grid point by subtracting the EKE values corresponding to the upper-quartile dust days from those of the lower-quartile dust days. Using the method explained above, a composite of the variance of zonal wind , the variance of meridional wind , and the transient momentum fluxes was also calculated for boreal summer seasons, JJA, 2000–2001 (Fig. 1).
2.5 Time-lag analysis
The time-lag analyses were conducted over each domain of the study to evaluate the temporal relationships between the radiative effect of dust outbreak events and the activity of AEWs. Using the same methodology explained above (Sect. 2.4.), we used the time series of aerosol radiative effect spatially averaged over the dust domain to select the days in the upper-quartile and the lower-quartile aerosol radiative effect such that there are 506 data points to represent the days with high values of dust concentration and 506 d with low values of dust concentration over each domain. For each of the 506 d of high dust concentration, we studied the time series for 5 d before and 5 d after the event to investigate the evolution of each individual dust storm. For each time series, we assigned each day of the 506 d as follows: T = 0 for the dust peak, T = 1 for 1 d after the dust peak, and T = −1 for 1 d before the peak of dust, and we continue this for 5 d before and after each of the 506 d. We used each of these time series for 22 years and averaged the dust radiative effect individually for T = 0, T = ±1, T = ±2, T = ±3, T = ±4, and T = ±5 to gain insight into the climatology of dust evolution 5 d before and 5 d after dust peaks over each domain. We repeated the steps explained above for the 506 data points of dust in the lower quartile to provide a long-term time series of low aerosol radiative effect over the dust domain. Finally, by subtracting the time series of the lower-quartile from the upper-quartile radiative effect, we provide the composite of dust over each domain to investigate the highest variability in dust (as T = 0, Fig. 5) and its evolution 5 d before and after the dust peak over the dust domain. Using the same methodology, we analyzed the wave activity that coincides with the upper-quartile (and lower-quartile) aerosol radiative effect to investigate a possible time lag between the dust and the development of kinetic energy over the northern and southern track of the AEWs. The domains selected to investigate wave activity are shown in Table 2.
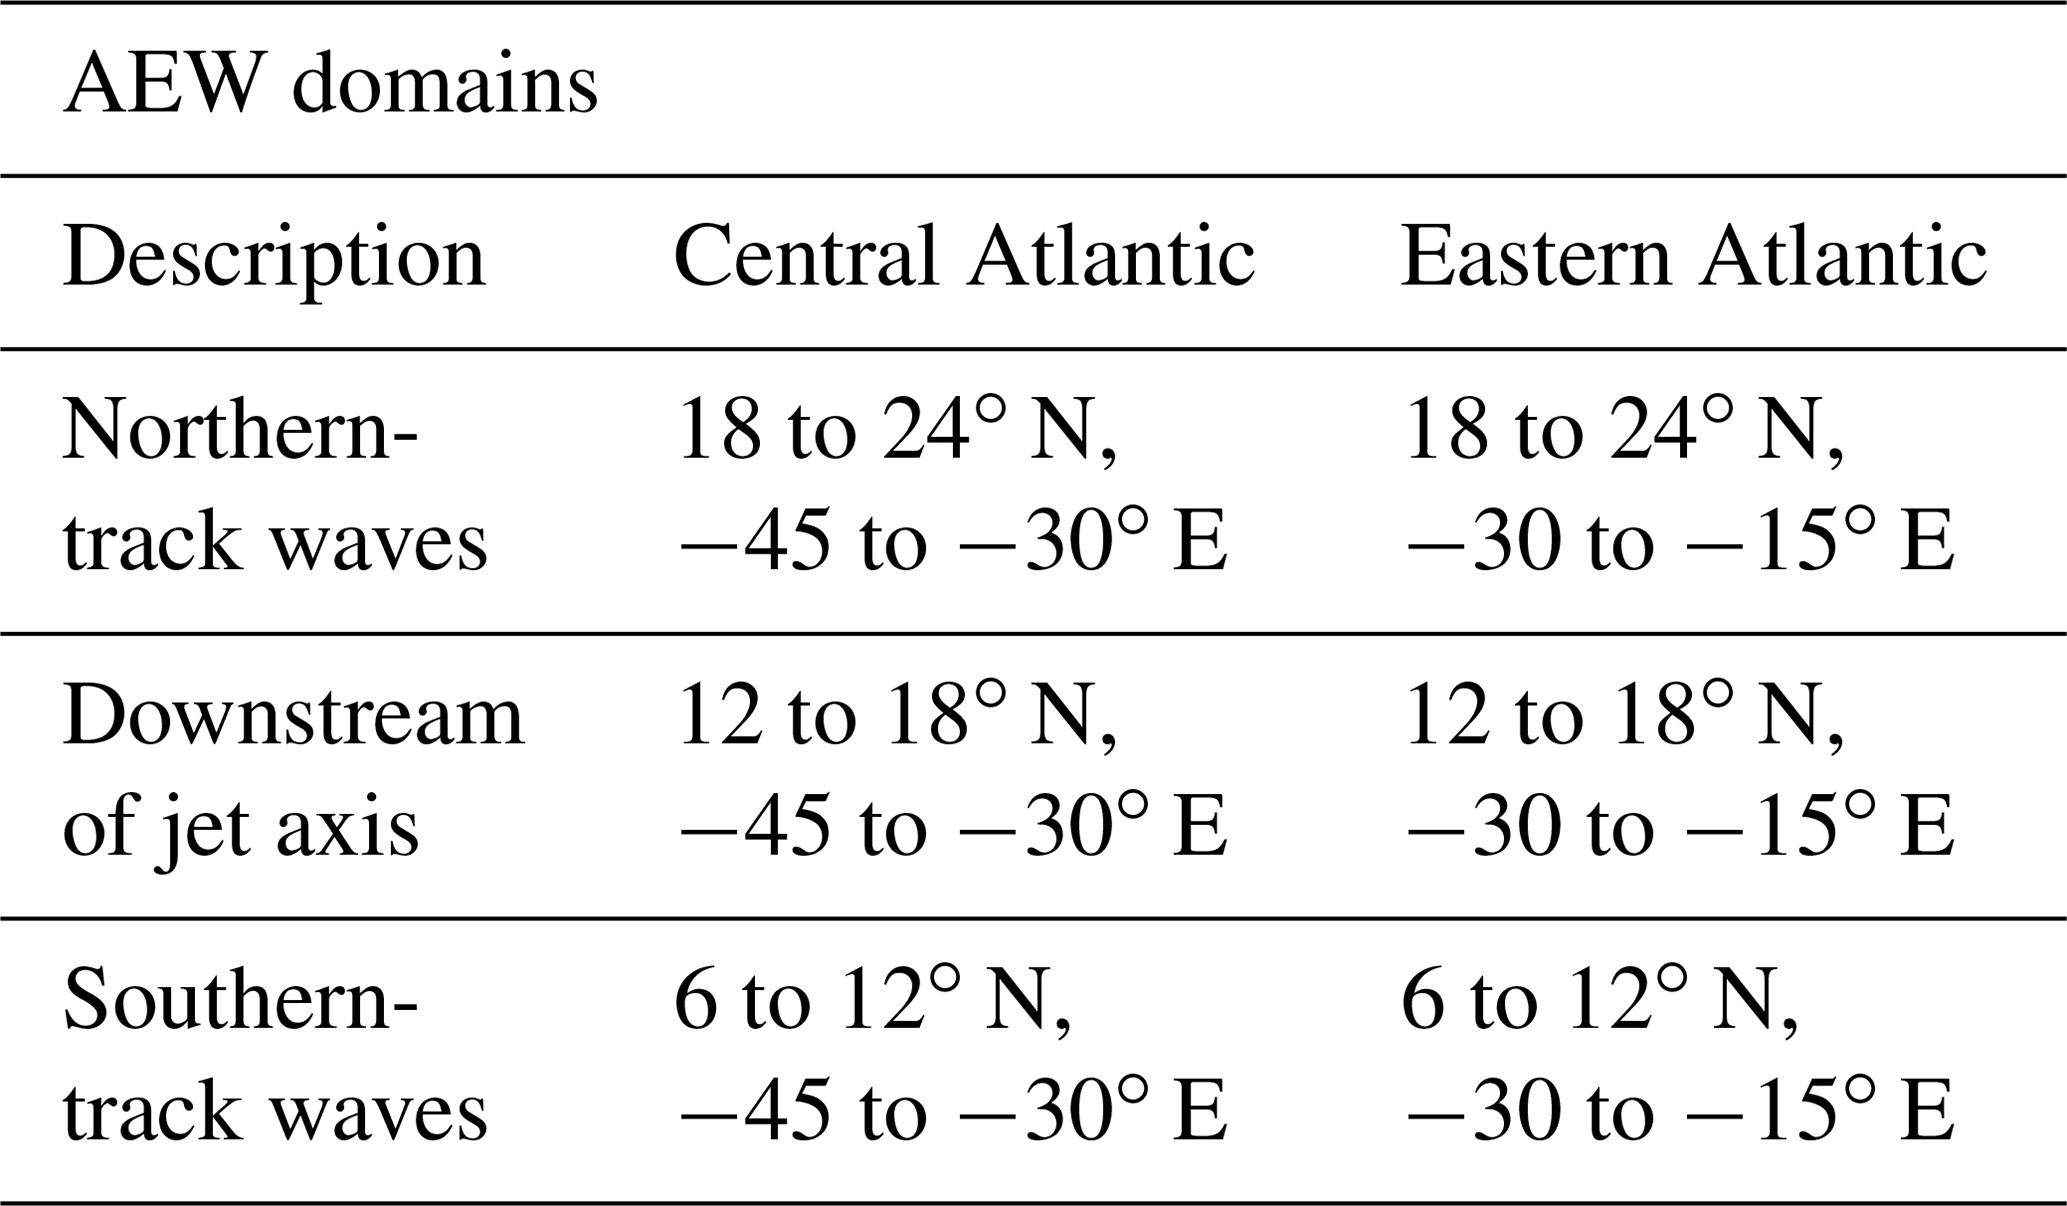
Table 2The coordinates of domains of transient changes across the tropical Atlantic Ocean.
3.1 AEJ–AEW system from an energy perspective
Traditional studies have used the mid-tropospheric trough and ridge from unfiltered wind fields to diagnose the AEWs. In this manner, the AEWs trough was identified where the meridional wind at the vertical level of the AEJ is equal to zero, indicating that the wind shifts from northerlies to southerlies (Diedhiou et al., 1999). The existence of two distinct tracks of the AEWs – the northern and southern tracks (e.g., Diedhiou et al., 1999; Nitta and Takayabu, 1985; Reed et al., 1988; Wu et al., 2013) – has been identified by examining the vorticity structure of the AEWs (e.g., Carlson, 1969; Thorncroft and Hodges, 2001; Hopsch et al., 2007) and applying the reversal of the meridional gradient of potential vorticity (e.g., Norquist et al., 1977; Pytharoulis and Thorncroft, 1999; Kiladis et al., 2006). However, these methods are limited because of the overlapping scale of AEWs with other phenomena and the significant amount of manual intervention required to differentiate between synoptic-scale AEW trough axes and localized circulation centers. As a solution to this problem, here we applied the eddy energy budget to diagnose the growth and evolution of the AEWs.
Hosseinpour and Wilcox (2014) showed that the axis of the AEJ core resides at about 600 hPa during the boreal summer; thus, here we present the results for 600 hPa, where the activity of the AEJ–AEW system is maximized. Figure 1a shows the mid-level AEJ in the climatology of boreal summer. The core of the jet is zonally located from 20∘ E to 30∘ W between the Sahel and the Sahara and spans the area from Africa toward the Atlantic Ocean, where the jet axis is located at ∼ 15∘ N latitude. The closed contours in Fig. 1b–c represent the MKE of the AEJ. The MKE peaks at ∼ 12–18∘ N, collocated with the core of the AEJ (Fig. 1a). The long-term mean of the mid-level EKE for the 2–6 d (warm shades in Fig. 1b) and 6–11 d (warm shades in Fig. 1c) bandpass-filtered EKE represents the kinetic energy of two distinct categories of the AEWs: the 2–6 d bandpass EKE peaks offshore, downstream of, and along the northern side of the jet core, while the 6–11 d bandpass EKE has a weaker signal over the northern side of the jet compared to 2–6 d EKE. The significant signal of the 2–6 d AEWs over the tropical Atlantic implies the significant contribution of 2–6 d transient eddies in transient disturbances over the ocean.
In addition, both 2–6 and 6–11 d bandpass EKE can develop at the higher latitudes above ∼ 32∘ N toward the subtropics, which can be related to the impacts of the westerly Rossby waves of the subtropical storm track over north Africa. These are consistent with previous studies, showing that after leaving the west coast of Africa, the majority of AEWs either (1) penetrate the subtropical Atlantic Ocean via an interaction with an extratropical trough or (2) develop further downstream and are involved in tropical cyclogenesis (Berry et al., 2007; Chen et al., 2008).
3.1.1 Behaviors of transient eddies of the AEWs
In this section, we further investigate the characteristics of the AEWs. Figure 1d and 1e show the climatology of transient eddies. The variance of zonal wind represents the zonal transient eddies (Fig. 1d), which peak at ∼ 6–12∘ N and are elongated downstream along the southern edge of the AEJ from approximately 15 to 45∘ W. Comparing this with Fig. 1b shows that the increase in 2–6 d bandpass EKE downstream of the jet core corresponds to the 2–6 d zonal transient eddies, whereas the core of the 2–6 d EKE over the northern-track AEWs at ∼ 18–24∘ N is related to the meridional wind variance , which represents the 2–6 d meridional transient eddies (Fig. 1e). These patterns suggest that transient eddies of the 2–6 d timescale AEWs are elongated both zonally and meridionally.
Figure 1f gives further information about the structure and propagation of the 2–6 d eddies. The enhanced transient momentum flux of 2–6 d bandpass eddies over the northern and southern tracks of the AEWs indicates the orientation and the group velocity of the transient eddies relative to easterly mean flow. The positive values of the transient momentum flux are dominant over the southern sides of the jet core, suggesting that the southern-track transient eddies propagate with a NE–SW orientation, whereas the negative values of the transient momentum flux over the northern track suggest the NW–SE orientation of transient eddies relative to the mean flow. The relatively tilted orientations of the eddies over the northern and southern track, fanning out or diverging downstream of the jet core, are signatures of the so-called downstream development, where transient eddy activity associated with 2–6 d AEWs is enhanced. The magnitude of the transient momentum flux shows that the 2–6 d eddies over the northern and southern tracks of the AEWs propagate faster relative to the easterly mean flow, whereas the values of transient momentum flux are negligible along the AEJ axis where the mean flow is strong. To further investigate the behavior of the 2–6 d eddies, we discuss the baroclinic and barotropic instability of the waves in the following section.
3.1.2 Baroclinic instability of the AEJ–AEW system
Baroclinic instability is the dynamic cause for synoptic-scale storms as a result of vertical shear of the zonal wind, corresponding to meridional temperature gradients based on the thermal wind balance (e.g., Charney, 1947; Eady, 1949). The meridional temperature gradient is also proportional to the available potential energy in the baroclinic instability mechanism (Hoskins et al., 1983; Grotjahn, 2003). Baroclinic zones are defined as the favored areas for strengthening and weakening of systems, where eddies extract available potential energy from the mean flow and convert the eddy available potential energy to EKE through baroclinic conversion (BCC) of energy (Chang et al., 2002; Orlanski and Katzfey, 1991). The changes in meridional temperature gradient also contribute to the changes in EKE of the waves (e.g., Coumou et al., 2015; Gertler and O'Gorman, 2019).
Previous studies have shown that is an indicator of baroclinic instability at the exit region of the jet (e.g., Hoskins et al., 1983). Figure 1f represents the presence of baroclinic instability at the northern and southern tracks of the waves downstream of the jet core, showing that the development of the 2–6 d transient eddy activity downstream of the AEJ corresponds to the presence of baroclinic instability in the region where eddies can extract energy from the easterly mean flow through baroclinic conversion (as described in the following section). These patterns suggest that the northern and southern tracks of the AEWs are favorable areas for the potential growth of baroclinic transient eddies as the variations in baroclinic instability tend to extract energy from the jet and convert it to eddy energy downstream of the AEJ, where the jet weakens.
We further investigated the conversion of energy through BCC by studying the fraction of the total variance of BCC (Fig. 1g) attributable to variations on timescales of less than 11 d, which includes both the 2–6 d AEWs and the 6–11 d AEWs. Figure 1g shows that these variations account for a significant fraction of BCC variations over land, where the AEJ core resides (Fig. 1a), and this high fraction of BCC variance extends offshore over the northern and southern sides of the AEJ. This is consistent with the discussion above, suggesting the eddy activity occurs at the north and south sides of the AEJ (Fig. 1f), where the transient zonal and meridional eddies (Fig. 1d–e) extract energy from the MKE (contours in Fig. 1b–c) and convert it to EKE (Fig. 1b–c) through BCC.
In the next section, we investigate the relationships between the African aerosols and the AEWs. Studying the time series of EKE and dust anomalies shows a similarity between the variability in the dust radiative effect and the changes in the 2–6 d EKE over the northern and southern tracks of the AEWs (Figs. S1 and S2 in the Supplement), suggesting a possible impact of dust diabatic heating on the enhancement of the kinetic energy of the AEWs. Such a relationship between dust and AEWs is also seen over each individual JJA period (Figs. S1, S2, and S3). We explore Saharan dust variability (Sect. 3.2) and then investigate the possible impacts of the aerosol radiative effect of dust concentration on the energy of AEWs (Sect. 3.3).
3.2 Saharan dust plumes – climatology and variability
The significant dust transport from the Sahara across the Atlantic Ocean is seen in the long-term mean of Saharan dust optical thickness and the radiative effect vertically integrated over the troposphere during boreal summer (Fig. 2a–c). The inherent limitation of MODIS satellite observations is the lack of AOD data over the highly reflective desert regions (Fig. 2a) and the Deep Blue AOD over the ocean (Fig. 2b). Because of that, based on Eq. (1), we calculated the aerosol shortwave radiative effect from the MERRA-2 reanalysis as a complementary component (Fig. 2c) to the satellite observations. This was further examined by the scatterplots of MODIS AOD over the ocean (Fig. 2d) and Deep Blue over the land (Fig. 2e) with respect to the MERRA-2 radiative effect, where daily data points were averaged over the oceanic and land dust domains (rectangle in Fig. 2a and 2b, respectively). This shows that MERRA-2 reanalysis is highly correlated with MODIS observations with R values of 0.83 and 0.62, respectively, and statistically significant with P values of less than 0.05. From a climatology point of view, the maximum value of dust heating the atmosphere is approximately 35 W m−2, localized over the western and central Sahara in JJA, 2000–2021 (Fig. 2c). In addition, the radiative effect efficiency for atmospheric heating by Saharan dust inferred from these scatterplots (Fig. 2d–e) is roughly 20 W m−2 per unit AOD over the ocean and 35 W m−2 per unit AOD over land.
We investigated dust variability by studying the changes in the daily radiative effect during dust transport across the tropical Atlantic Ocean. The longitude–time Hovmöller diagrams of daily aerosol radiative effect anomalies are provided for each summer from 2000 to 2021 (Fig. 3). The aerosol radiative effect is meridionally averaged over the SAL, 12–22∘ N, where the dust concentration is high. The positive and negative anomalies show the increase and decrease in the aerosol radiative effect within the SAL as dust propagates in transient dust plumes across the tropical Atlantic Ocean. Figure 3 shows that, on average, dust transport may reach the Caribbean Sea in less than 11 d. To investigate the climatology of this, the fraction of the total variance of the dust radiative effect was calculated for less than 11 d and more than 11 d of dust variations during boreal summer seasons, 2000–2021 (Fig. 2f–g). The variations in the aerosol radiative effect for less-than-11 d timescale variations are significant over west Africa and the eastern tropical Atlantic Ocean and account for up to 70 %–80 % of the total variance of the aerosol radiative effect over these regions. In contrast, the variations in the dust radiative effect longer than 11 d are a more significant fraction of the variance upstream, mainly over the dust sources in the Sahara.
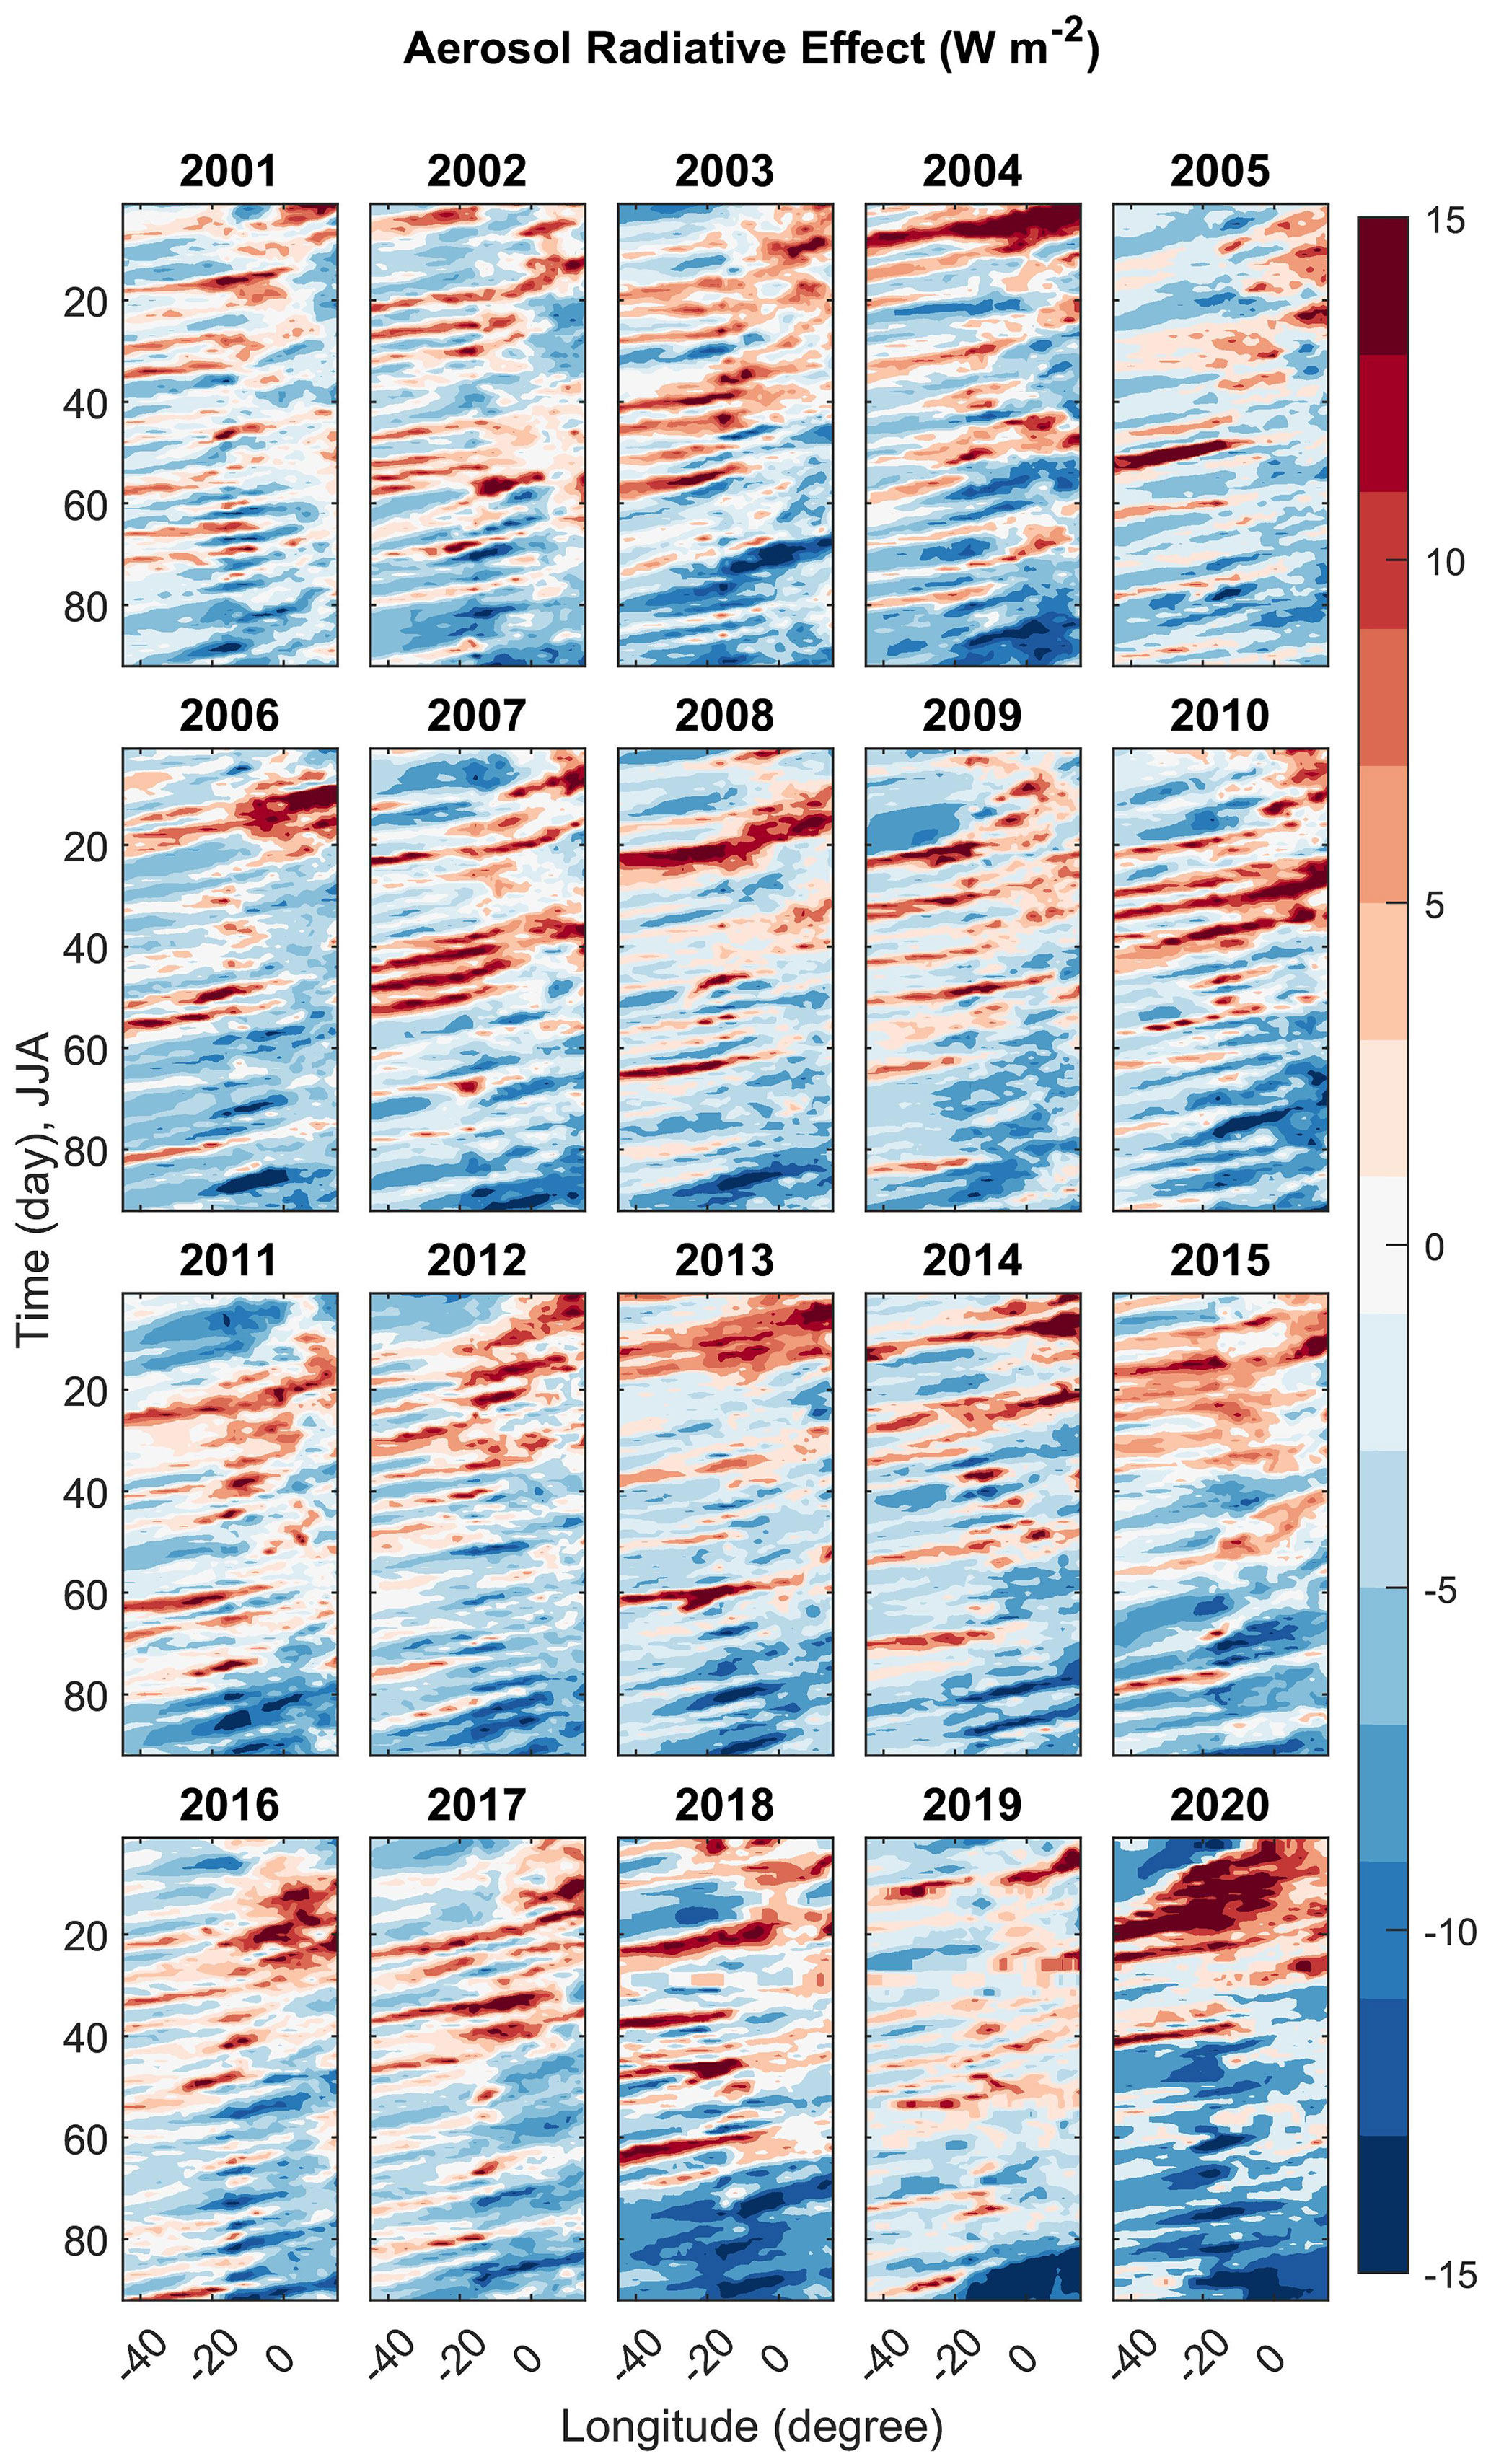
Figure 3Time–longitude Hovmöller diagrams of aerosol-radiative-effect daily anomalies (W m−2) using the MERRA-2 reanalysis for all individual boreal summer seasons, JJA from 2000 to 2021, meridionally averaged (12–22∘ N) over the OSAL domain (rectangle in Fig. 2a). Daily anomalies of the aerosol radiative effect are calculated with respect to the seasonal time average of the radiative effect for each year.
We conducted similar Hovmöller analyses to the above but for MODIS observations as a check on the variability in the dust radiative effect in the MERRA-2 reanalysis, and we found that the results from the MERRA-2 reanalysis were consistent with the MODIS AOD (Fig. S3). Analyzing the dust storm events from 2000 to 2021 suggests a possible relationship between the dust transport and the variations in the AEJ–AEW system. We hypothesize that the variations in dust across the ocean during Saharan dust storms contribute to the growth of the waves over the ocean through diabatic heating from the dust radiative effect. To investigate this, we focus on the dust over the oceanic domain (i.e., OSAL; rectangle in Fig. 2a). The steps to study this are described in the following sections.
3.3 Impacts of the dust radiative effect on the energy of the AEWs
Previous studies have discussed the dynamics of the AEWs as summarized in the Introduction; however, the relationships between dust radiative effect and the kinetic energy of the AEWs are still unexplored. In this section, we investigate the relationships between the dust radiative effect of the atmosphere (TOA minus surface) and the kinetic energy of the AEWs during the boreal summer from 2000 to 2021.
3.3.1 Composite analysis of eddy energetics with respect to dust variability
The composite analyses were conducted for the boreal summer seasons of 22 years. The composites of the 2–6 and 6–11 d filtered EKE (Fig. 4a and b, respectively) are based on the EKE values for the times that correspond to the upper-quartile dust radiative effect in the OSAL region (rectangle in Fig. 2a) minus the EKE values of the times that correspond to the lower-quartile dust radiative effect. The steps to calculate composite diagrams are explained in Sect. 2.
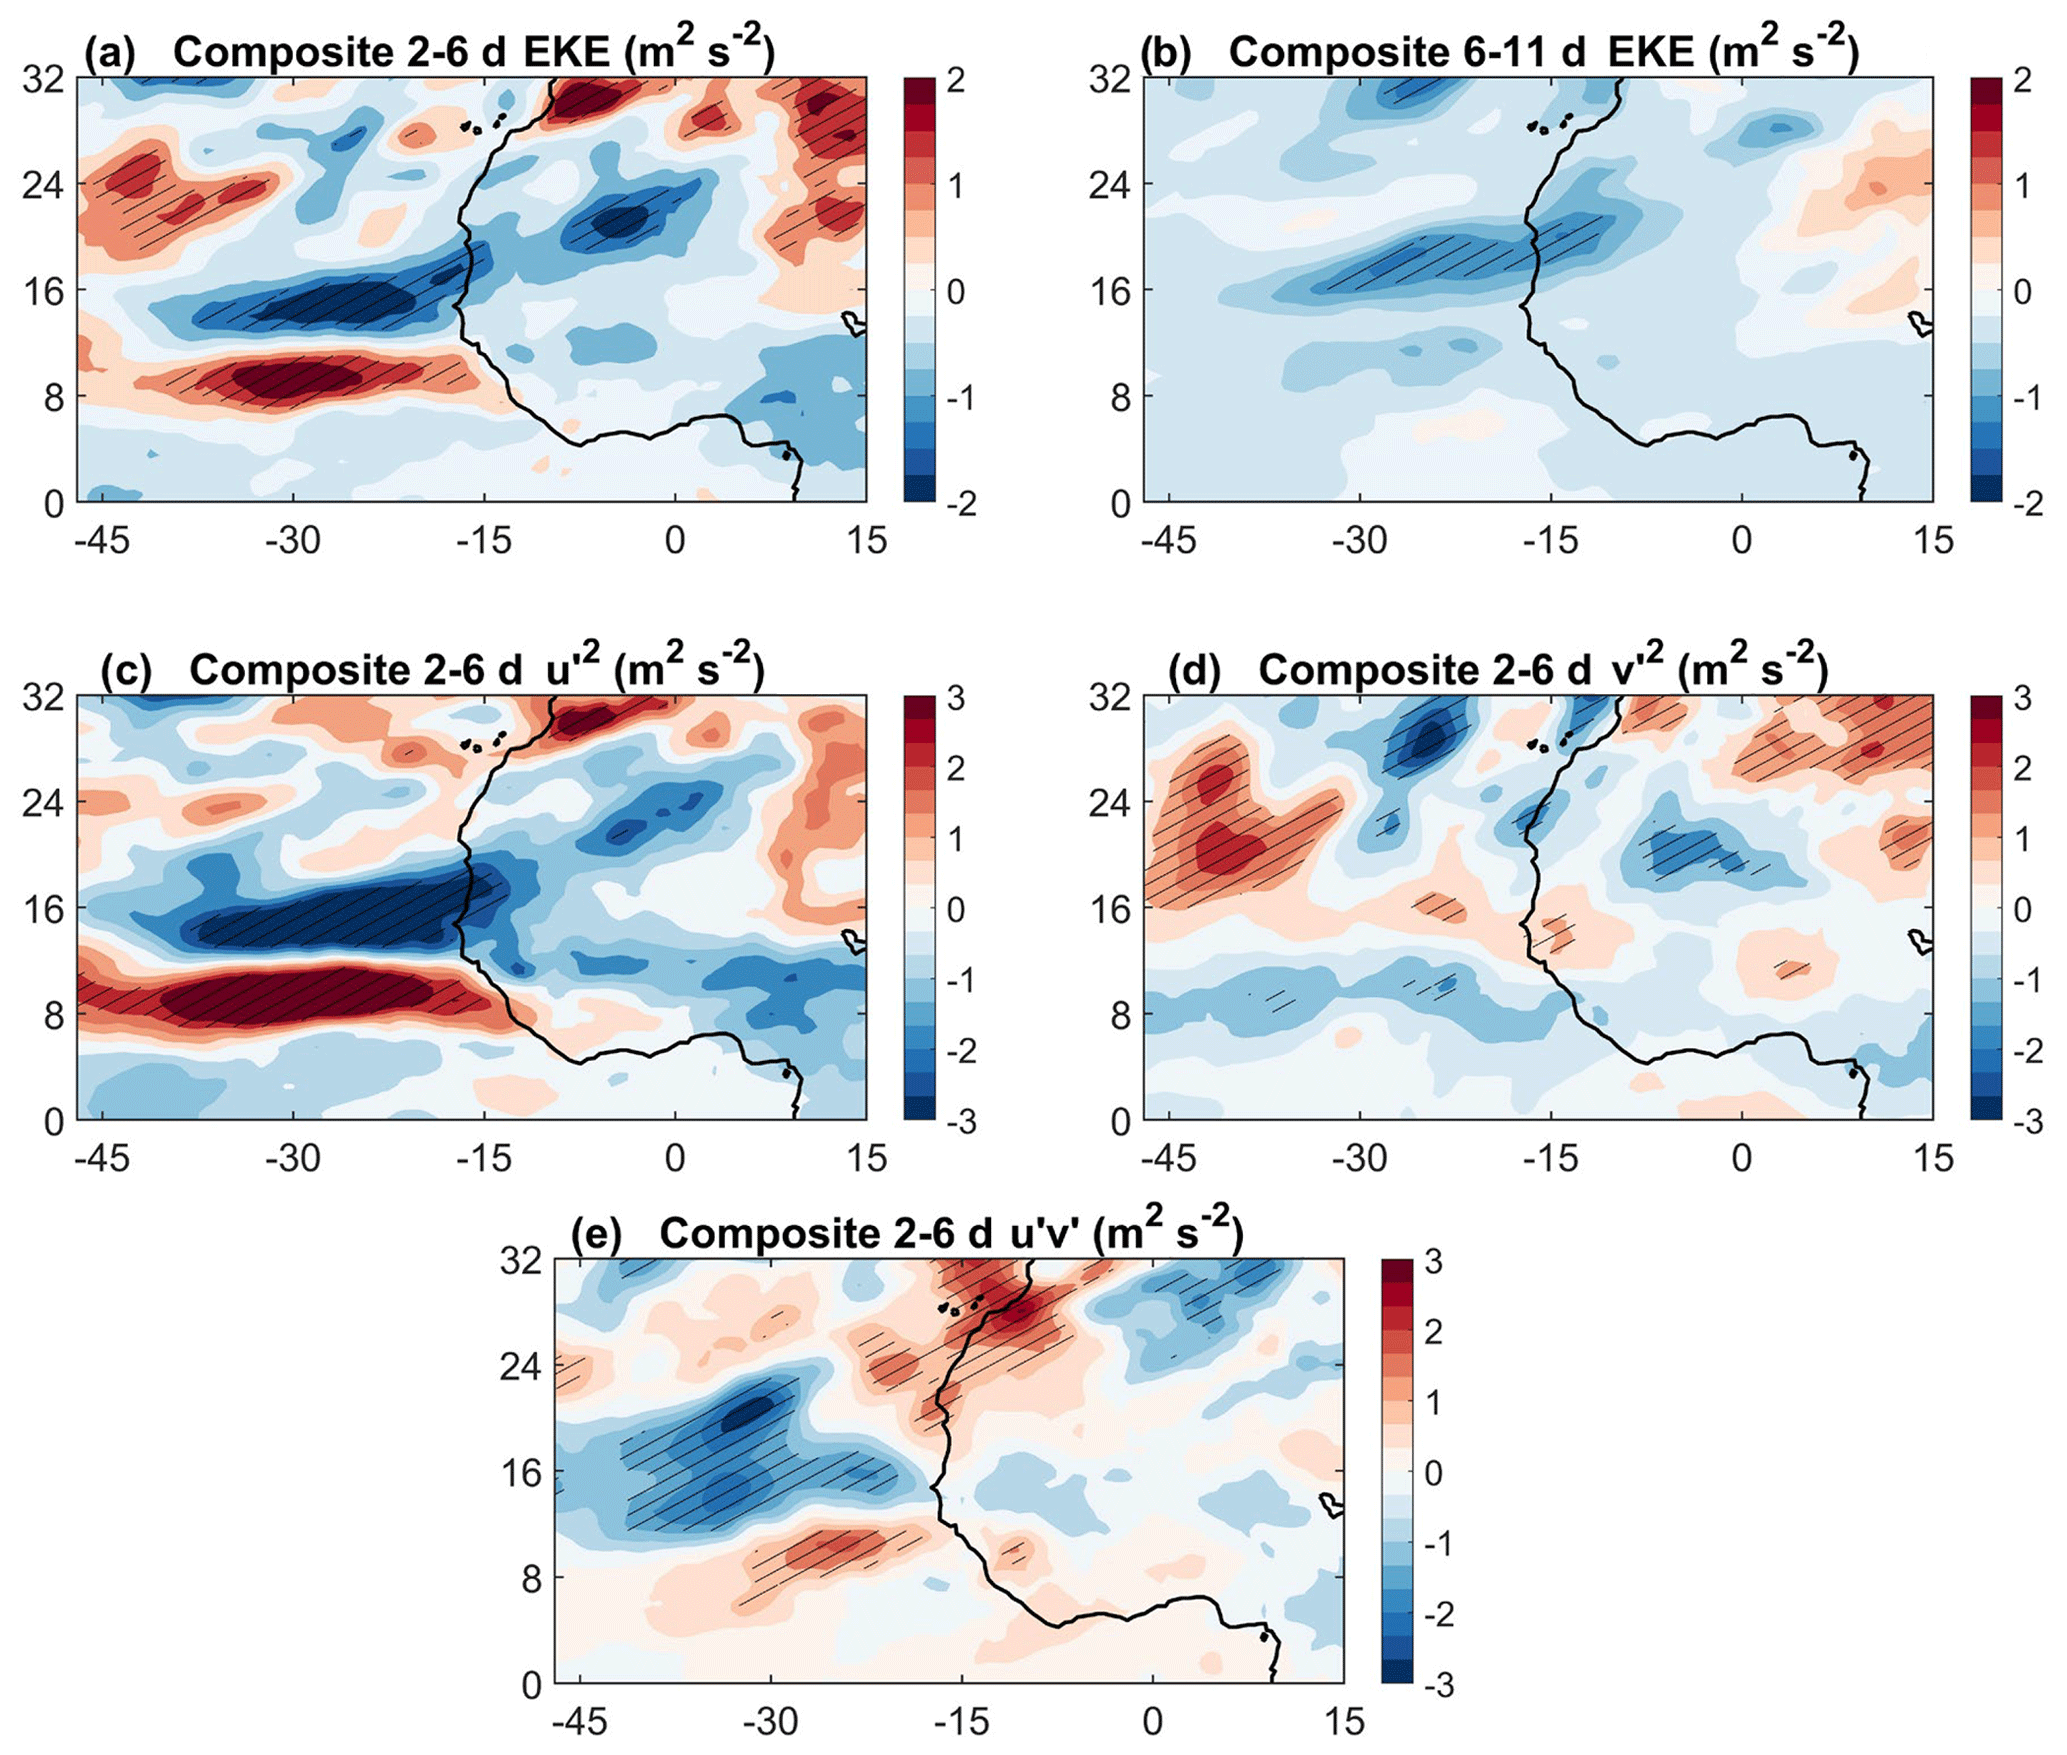
Figure 4(a) Composite 600 hPa 2–6 d filtered EKE (m2 s−2) values for the times corresponding to the upper-quartile aerosol radiative effect minus the EKE values of the times corresponding to the lower-quartile aerosol radiative effect over the OSAL domain (rectangle in Fig. 2a). The calculations are conducted using the MERRA-2 reanalysis for JJA, 2000–2021. (b) Same as (a) but for 6–11 d filtered EKE (m2 s−2). (c) Same as (a) but for the 2–6 d variance of zonal wind, (m2 s−2). (d) As in (a) but for the 2–6 d variance of meridional wind, (m2 s−2). (e) Same as (a) but for the 2–6 d filtered momentum fluxes, (m2 s−2).
The positive anomalies in Fig. 4a show that the increase in the 2–6 d EKE at the southern track (∼ 6–12∘ N) of the AEWs and further downstream over the northern track (∼ 18–24∘ N) coincides with the enhanced radiative effect of dust over the offshore region. The dipole pattern of the positive and negative anomalies may also imply a possible southward shift of the 2–6 d EKE at the southern edge of the AEJ during high dust concentrations. A similar dipole pattern can also be seen in Fig. 4c.
Figure 4c shows the increase in the zonally elongated 2–6 d eddies at the southern edge of the jet, which suggests that the strengthening of the 2–6 d zonal transient eddies may lead to the amplification of EKE (Fig. 4a) over the southern track of the waves during dust events when the aerosol radiative effect is significant offshore. Meanwhile, the increase in the meridionally elongated transient eddies (Fig. 4d) coincides with the high concentrations of dust. Comparing this with Fig. 4a suggests that during high dust concentration in the OSAL, the amplification of the 2–6 d EKE further downstream in the northern track of the AEWs corresponds to the enhanced meridionally elongated transient eddies. While the positive anomalies of 2–6 d (Fig. 4e) comprise a weaker signal at the northern and southern tracks of the waves, they are still statistically significant, which shows that the enhancement of the baroclinic instability over the northern and southern tracks of the AEWs occurs during a high aerosol radiative effect in the OSAL.
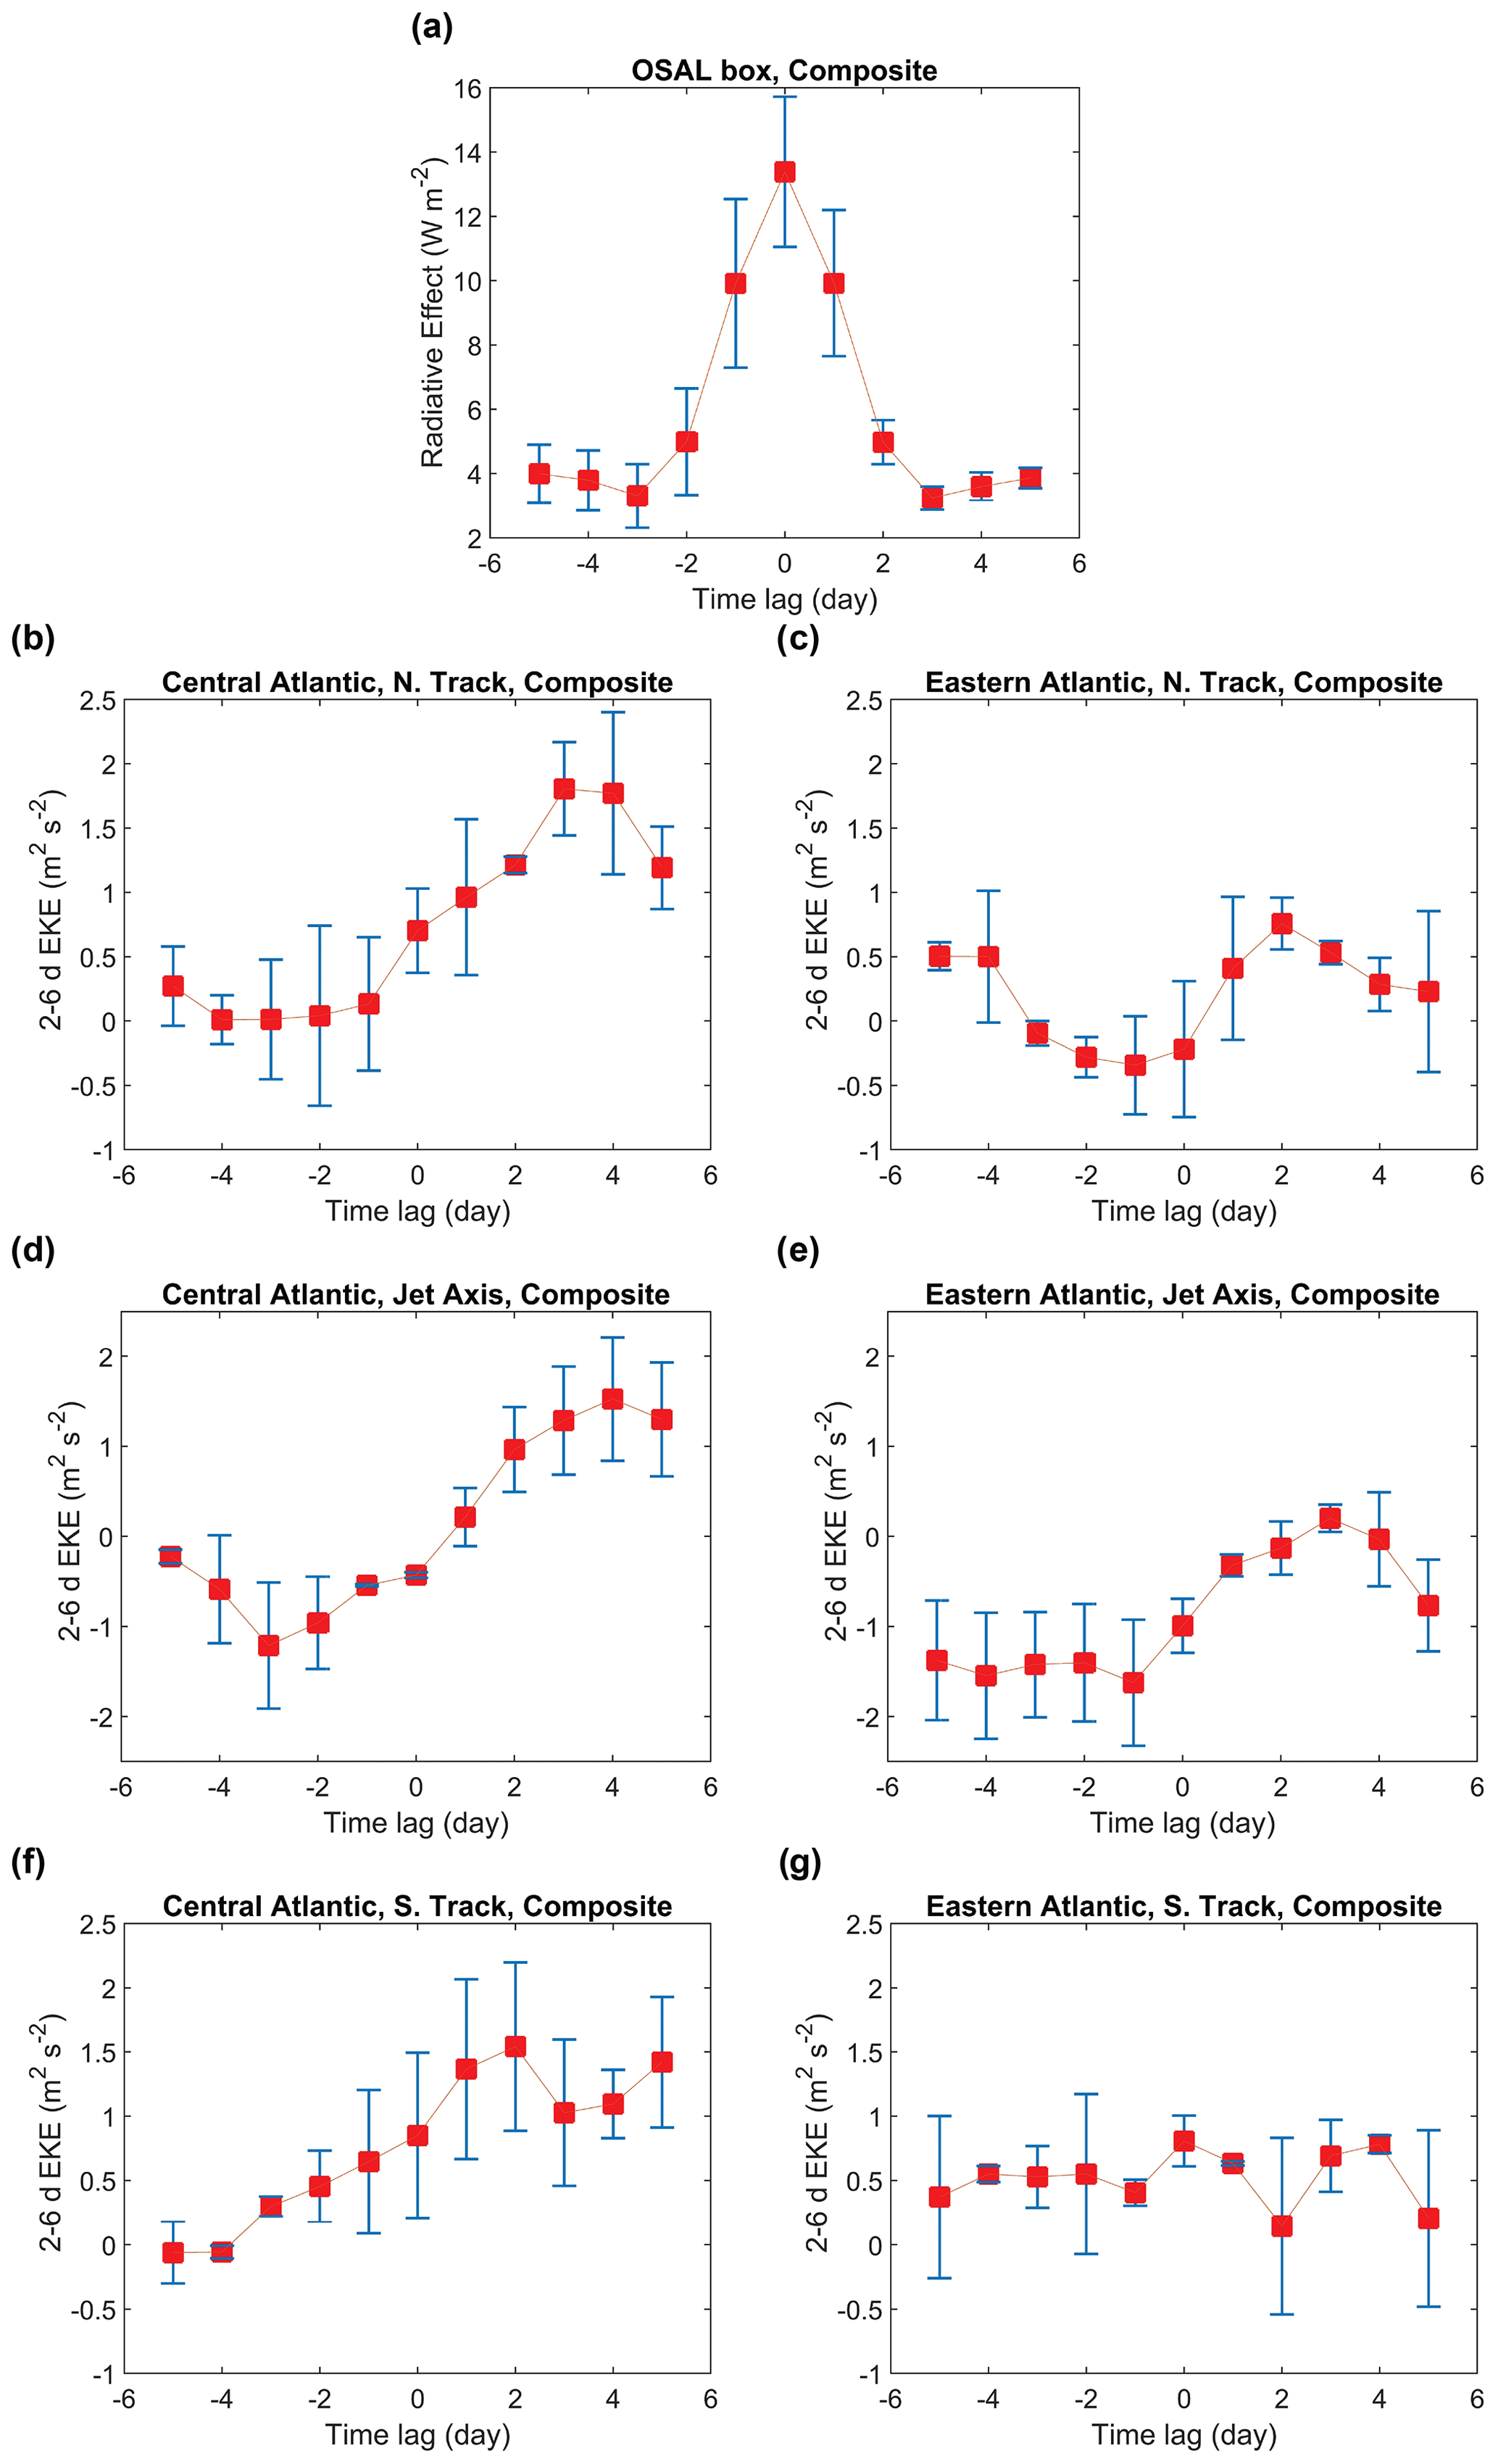
Figure 5(a) Daily time series of the composite aerosol radiative effect for the days in the upper quartile minus those days in the lower quartile of the radiative effect, spatially averaged over the OSAL domain (rectangle in Fig. 2a). T = 0 is assigned for the days with the highest variability in the aerosol radiative effect in the OSAL. T = ±1, T = ±2, T = ±3, T = ±4, and T = ±5 are assigned for 5 d before and 5 d after each individual dust event, averaged over 22 years, JJA, 2000–2021. (b) Same as (a) but for the composite 2–6 d filtered EKE at 600 hPa, spatially averaged over the northern-track AEWs in the central Atlantic (18 to 24∘ N, −45 to −30∘ E). (c) Same as (b) but for the eastern Atlantic (18 to 24∘ N, −30 to −15∘ E). (d) Same as (b) but spatially averaged over the domain, downstream of the AEJ in the central Atlantic (12 to 18∘ N, −45 to −30∘ E). (e) Same as (d) but for the eastern Atlantic (12 to 18∘ N, −30 to −15∘ E). (f) Same as (b) but spatially averaged over the southern track of the AEWs in the central Atlantic (6 to 12∘ N, −45 to −30∘ E). (g) Same as (f) but for the eastern Atlantic (6 to 12∘ N, −30 to −15∘ E). The domains of the wave activity are listed in Table 3.
The negative composite along the AEJ axis at about 12-18∘ N (Fig. 4) can be related to the fact that the 2–6 d EKE and 6–11 d EKE are not significant along the AEJ axis, where the MKE and the horizontal shear of mean flow are strong (Fig. 1a–c). As described in Sect. 3.1., the growth of transient eddies is more likely over the south and north side of the jet, where the jet weakens and thus offers a greater chance for the development of baroclinic AEWs (Fig. 1f–g). While the negative anomaly may seem like a reduction in eddy activity along the AEJ axis simultaneous with the time of dust enhancement, in the next section (Sect. 3.3.2), we have evidence that the amplification of 2–6 d EKE along the AEJ axis starts on average 2 d after the peak of dust offshore (Fig. 5d–e).
We conducted the same composite analysis using MODIS AOD, which shows that the results are consistent whether the MERRA-2 radiative effect metric or the MODIS AOD data are applied (Fig. S4). Overall, these composite analyses suggest a mechanistic relationship between the kinetic energy of the AEJ–AEW system over the ocean and the aerosol radiative effect during dust outbreaks in summer. The enhanced dust offshore coincides with the strengthening of the baroclinic instability and amplification of the 2–6 d AEWs downstream, where the jet weakens and gives a chance to strengthen the propagation of the zonally and meridionally elongated transient eddies over the southern and northern tracks of the waves, respectively. In the following section, we study a possible time lag between the occurrence of dust storms and the changes in the activity of the waves over various domains.
To evaluate the possibility that these relationships may simply reflect correlations of dust and the EKE of the waves with the flow of the AEJ, we repeated the composite analysis of the 2–6 d period AEWs shown in Fig. 4a for the three terciles of the mean speed of the AEJ (Fig. S5). The differences in the composite EKE for high and low dust radiative effects are shown for low, middle, and high mean wind speeds of the AEJ. The structure of the EKE differences varies somewhat with the AEJ wind speed; however, the main features of enhanced EKE during high-dust-loading conditions along the southern track of AEWs south of the AEJ core and in the outflow region to the west of the northern track of the AEWs discussed above (Fig. 4a) are present for all three terciles of the AEJ wind speed, which suggests that these differences in EKE with dust amount are independent of the mean speed of the AEJ and less likely to be a result of a spurious correlation with the AEJ wind speed.
3.3.2 Time lag between dust outbreaks and the development of the AEWs
In this section, we investigate a possible lag between the changes in the EKE with respect to the variability in the dust radiative effect over the OSAL. We divide the northern-track waves (18 to 24∘ N) and southern track (6 to 12∘ N) of the AEWs into two separate regions: eastern Atlantic (−15 to −30∘ E) and central Atlantic (−30 to −45∘ E). We also study the possible lag between dust in the OSAL and the eddy activity downstream of the jet core (12 to 18∘ N) over the eastern and central Atlantic domains (Table 2). The time lag is investigated between composite EKE over each wave domain with respect to the composite dust radiative effect in the OSAL. The methodology for calculating the time lag is described in Sect. 2.
The variability in the dust radiative effect (i.e., composite for the daily upper-quartile aerosol radiative effect minus daily lower-quartile aerosol radiative effect) in Fig. 5a represents the daily variations in the radiative effect 5 d before and after the peak of dust in the OSAL region for the 22 years of boreal summer seasons. This shows that the variability in the dust radiative effect associated with the dust outbreaks over the OSAL region is significant for about 6 d, as it starts 3 d before (T = −3) and ends 3 d after (T = +3) the peak of dust (T = 0), which is consistent with the timescale of the 2–6 d AEWs. Similar analyses are conducted using the upper-quartile radiative effect only to investigate such relationships for the days with high dust concentration (Fig. S6). The results are consistent with the patterns shown in Fig. 5.
Figure 5b represents the time evolution and changes in 2–6 d EKE of the northern-track AEWs further downstream over the eastern Atlantic Ocean. The changes in EKE seem negligible at T < 0 before starting the high variations in dust in the OSAL; however, the growth of EKE occurs on average at T = 0, coinciding with the peak of dust, and then continues growing and reaches its maximum about 3 d (T = +3) after the peak of dust variations. In contrast, although a slight decrease and increase in EKE are seen before and after dust peaks, respectively, the variations in the northern-track EKE over the eastern Atlantic (Fig. 5c) seem weaker compared to those further downstream. Comparing Fig. 5b with the composite analysis in Fig. 4a suggests that the enhancement of the northern-track 2–6 d EKE, further downstream over the central Atlantic, coincides with the peak of dust and is even more significant on average 3 d after dust peaks in the OSAL.
The negative variations in the EKE in Fig. 5d and e at T = 0 are consistent with the negative composite of the EKE along the AEJ axis in Fig. 4. This means that the decay of EKE along the jet axis over the central Atlantic (Fig. 5d) is initiated before dust activity; however, the rapid growth of EKE starts on average 2 d (T = +2) after the peak of dust and is maximized about 3 to 4 d (T ∼ +3 to +4) after the peak of dust in the OSAL. A similar, but weaker, pattern is seen across the jet axis over the eastern Atlantic (Fig. 5e).
Figure 5f and g show that the changes in EKE are maintained as positive before and after dust activity. Comparing Fig. 5f with Fig. 5a suggests that the activity of both dust plumes in the OSAL and the southern EKE anomalies over the central Atlantic is initiated about 3 d (T = −3) before dust peaks, and then amplification of EKE continues and reaches its maximum on average 2 d (T = +2) after dust peaks.
Over the eastern tropical Atlantic (Fig. 5g), the EKE variations seem negligible during dust storms. The weaker signal of the southern-track EKE variations over the eastern Atlantic can be explained by the dynamic and energy of the AEJ–AEW system (Fig. 1), as this is the region where the southern edge of the jet is dominant, and the MKE and conversion of energy to EKE through BCC are significant. This suggests that while the positive anomalies of EKE over this region coincide with the enhancement of dust in the OSAL, the influence of the dust radiative effect on changes in EKE could be quantitatively weak over the eastern tropical Atlantic compared to the amount of energy exchange between the components of the AEJ–AEW system at the southern edge of the jet core.
Table 3Summary of lag analyses showing AEW evolution before and after dust peaks in the OSAL.
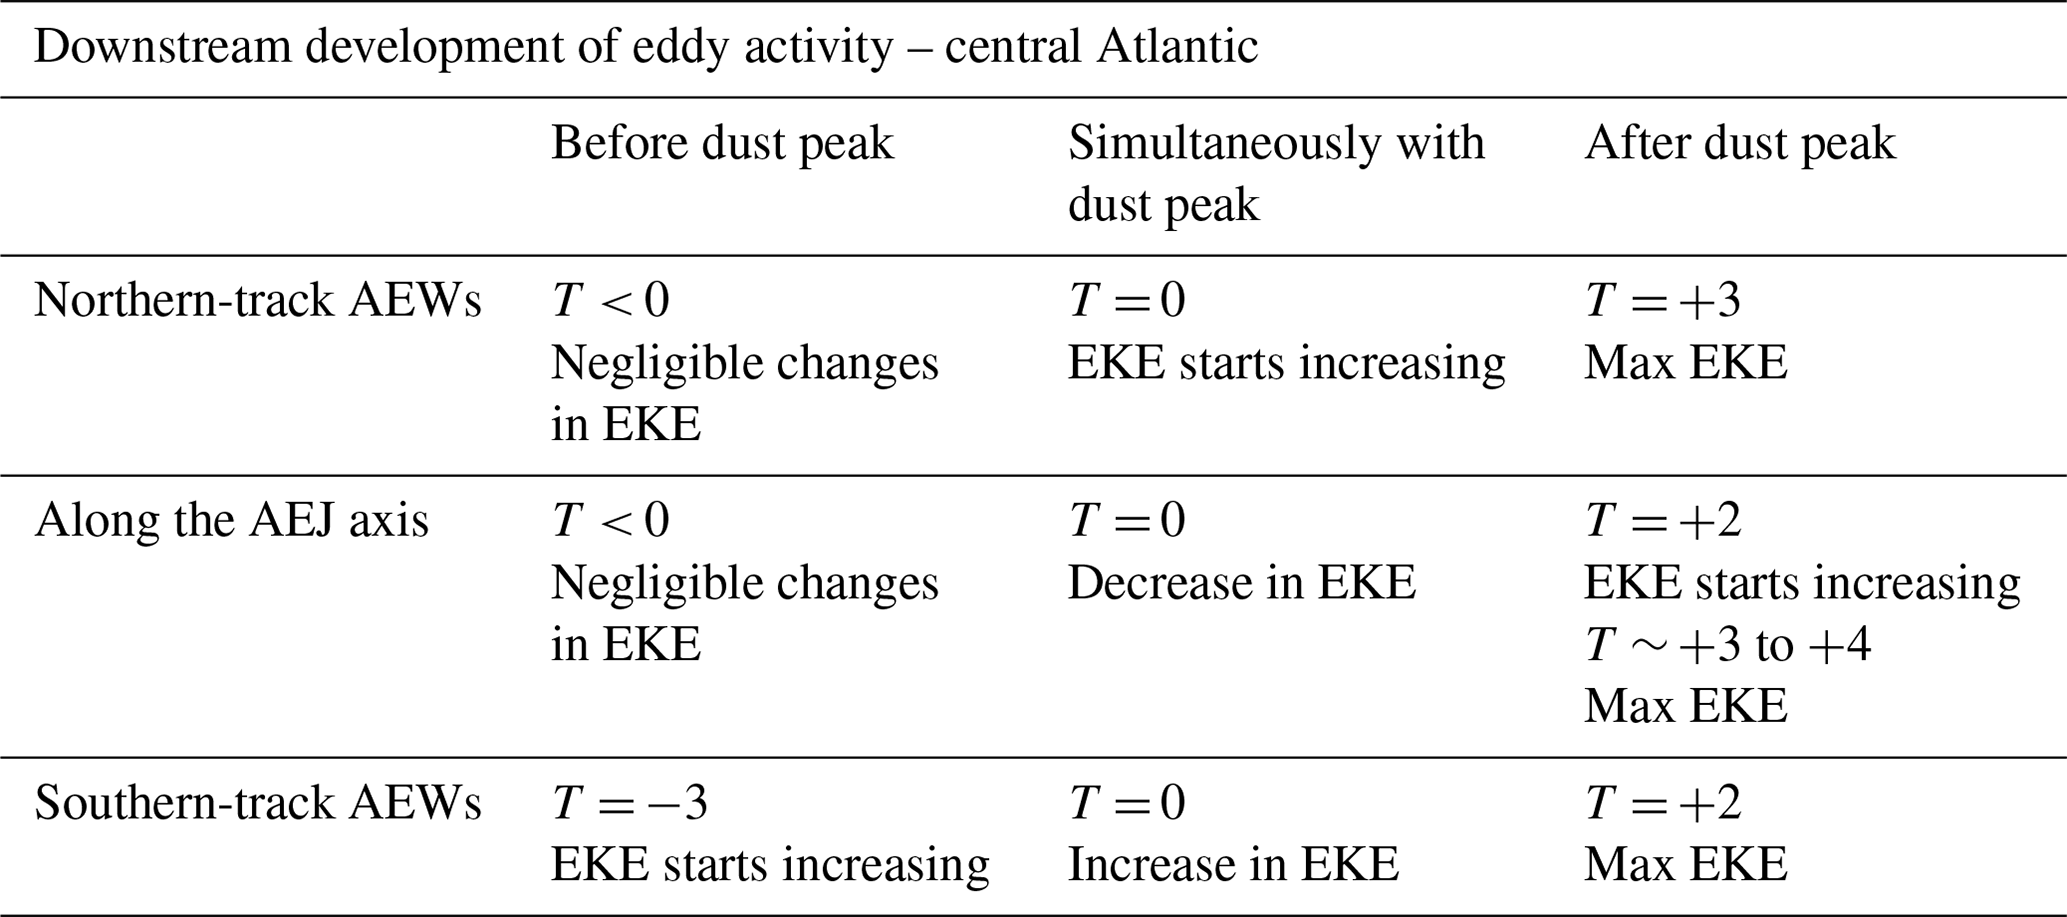
Comparing Fig. 5b, d, and f reveals evidence of the mechanistic relationship between variability in the dust radiative effect offshore and the changes in the 2–6 d EKE further downstream over the central tropical Atlantic, where the easterly flow weakens at the exit region of the jet over the central Atlantic. On average, the peak of dust load in the OSAL occurs a few days before the amplification of the EKE downstream of the AEJ; a similar pattern is also seen with a weaker signal over the eastern tropical Atlantic. The lag analyses, summarized in Table 3, suggest that the peak of dust aerosols loading offshore over the OSAL region precedes the amplification of EKE further downstream of the AEJ over the central Atlantic Ocean. This evidence is consistent with our hypothesis on the influence of the dust radiative effect, fueling the EKE of the 2–6 d AEWs downstream of the AEJ over the tropical Atlantic Ocean, where tropical cyclogenesis and hurricane activity occur. We further investigated our analyses by selecting various dust domains (e.g., 12 to 22∘ N and −38 to −28∘ E, shown in Fig. S7) and showed that our findings are consistent regardless of the location of the dust domain in the SAL across the tropical Atlantic Ocean.
While previous studies have shown the impact of AEJ Saharan dust transport across the Atlantic Ocean (Perry et al., 1997; Liu et al., 2008; Francis et al., 2020, 2022), the feedback of dust to AEJ–AEWs is not well understood. A few recent studies have shown that dust affects the atmospheric dynamics of the Atlantic Ocean by enhancing AEW strength (e.g., Jones et al., 2003, 2004; Ma et al., 2012; Hosseinpour and Wilcox, 2014; Grogan et al., 2016, 2019; Bercos-Hickey et al., 2017, 2020) (Table 4 is provided for more details). However, the mechanisms of such effects are still unclear. Moreover, to the best of our knowledge, the mechanistic effects of dust on the eddy energetics of the waves have not been addressed in previous studies. This has motivated us to explore relationships between dust outbreaks and metrics that quantify the production of eddy kinetic energy in AEWs and take us toward a deeper understanding of the role that the dust radiative effect may play in the production of eddy kinetic energy of AEWs.
Table 4Summary of relevant previous studies focused on the impact of dust on AEJ/AEWs.
This study shows mechanistic relationships between the radiative effect of dust aerosols in the SAL and the kinetic energy of the AEWs across the tropical Atlantic Ocean using 22 years of daily satellite observations, as well as reanalysis data based on satellite assimilation. Dust plumes across the Atlantic not only are transported by the AEJ–AEW system but also contribute to increasing the kinetic energy of the baroclinic AEWs through diabatic heating. The enhanced dust contributes to an increase in meridional temperature gradients (Hosseinpour and Wilcox, 2014), which leads to an increase in baroclinicity and amplification of the EKE of the AEWs.
The efficiency of the dust radiative effect in the atmosphere is a heating of roughly 20 W m−2 per unit AOD over the ocean and 35 W m−2 per unit AOD over land (Fig. 2c). This agrees with in situ measurements (Soupiona et al., 2020) and regional climate modeling (Saidou Chaibou et al., 2020) of the Saharan dust radiative effect. This radiative effect of dust aerosols in the SAL contributes to the diabatic heating of the atmosphere in the regions (Hosseinpour and Wilcox, 2014) where the increase in temperature gradients leads to the growth of baroclinic waves through the conversion of energy to EKE in the AEJ–AEW system. Outbreaks of high dust concentrations in the SAL coincide with the growth of the meridionally elongated 2–6 d transient eddies over the northern track of AEWs (∼ 18–24∘ N) and zonally elongated eddies over the southern track of AEWs (∼ 6–12∘ N) (Fig. 4). This leads to amplifying the EKE of the AEWs, particularly at the exit region of the AEJ, where the MKE and the horizontal shear of mean flow are weakened. This offers the chance for the downstream development of the AEWs, associated with enhanced dust. The dust-induced enhancement of AEW through a buoyancy source was shown by Grogan et al. (2016), albeit with a different methodology (i.e., analytical and regional modeling analyses). In addition, our results agree with a case study of the Saharan dust event by a regional climate model (Bercos-Hickey et al., 2017) that showed that Saharan dust causes AEWs to shift northward and expand westward.
The growth of the baroclinic transient eddies, as well as the corresponding EKE of the 2–6 d AEWs, is amplified at the exit region of the AEJ, on average, 2 to 4 d after the enhancement of dust upstream in the OSAL region (Fig. 5). Our findings show that dust activity precedes the amplification of EKE, suggesting that the diabatic heating from the dust radiative effect can fuel the development of the AEWs. This mechanistic impact of the dust radiative effect on AEW development is consistent across the tropical Atlantic Ocean.
This study further supports a hypothesis that the dust radiative effect contributes to the EKE of transient wave dynamics. An advantage of using the MERRA-2 reanalysis for this study is that the data assimilation in MERRA-2 provides a more realistic representation of circulation, including the AEWs, than an unconstrained atmospheric model. However, one limitation of using MERRA-2 is that it is not possible to compare a dusty circulation to an equivalent dust-free circulation. The goal of this study was to determine if the observed relationships are consistent with a role for dust radiative effects, which has been argued in some prior modeling studies, and to advance a methodology to explore in more detail the mechanisms by which EKE is generated in AEWs and their relationships to dust radiative effects which can be applied to either reanalysis or output from model sensitivity studies. To account for the possibility that our observed relationships might result from a coincident response of dust and the EKE of AEWs to variations in the speed of the AEJ, we have determined that our results showing that enhanced EKE following the passage of dust-radiative-effect events occurs during periods of relatively weak AEJ speeds as well as during periods of moderate and strong AEJ speeds (Fig. S5). Furthermore, we have performed temporal lag analyses to demonstrate that the enhancement of EKE is observed in the days following the peak in the dust radiative effect, as would be expected if the EKE is responding to the diabatic heating by dust (Figs. 5, S6, and S7). Although a few studies (e.g., Bercos-Hickey et al., 2017, 2020) have used regional models, to the best of our knowledge, there is no global climate model study that explicitly quantifies the impact of dust on AEWs in a coupled system. The empirical relationships apparent from this study will be examined in a follow-on study of atmospheric general circulation model simulations using the Community Earth System Model (CESM) with and without the dust radiative effect to further explore the hypothesis linking dust radiative effects to AEW dynamics.
MERRA-2 aerosol, radiation, and meteorological datasets can be obtained from https://disc.gsfc.nasa.gov/datasets (GMAO, 2015a, b, c). MODIS AOD retrievals are accessible through https://doi.org/10.5067/MODIS/MOD08_D3.061 (Platnick et al., 2015). Numerical codes developed to conduct data extraction, analysis, and visualization will be provided upon request.
The supplement related to this article is available online at: https://doi.org/10.5194/acp-24-707-2024-supplement.
FH and EMW originated this study. FH formulated, developed, and implemented the codes and analyzed the results. FH drafted and finalized the paper, and EMW provided edits and revisions.
The contact author has declared that neither of the authors has any competing interests.
Publisher’s note: Copernicus Publications remains neutral with regard to jurisdictional claims made in the text, published maps, institutional affiliations, or any other geographical representation in this paper. While Copernicus Publications makes every effort to include appropriate place names, the final responsibility lies with the authors.
This article is part of the special issue “Dust aerosol measurements, modeling and multidisciplinary effects (AMT/ACP inter-journal SI)”. It is not associated with a conference.
Special thanks go to Peter Colarco, Naresh Kumar, and Hans Moosmuller for their constructive comments that contributed to the improvement of this paper. We also appreciate the anonymous reviewers for their constructive comments.
This work is supported by the NASA Interdisciplinary Science Program (grant nos. NNX11AF21G, NNX14AH95G).
This paper was edited by Yves Balkanski and reviewed by two anonymous referees.
Avila, L. A. and Clark, G. B.: Atlantic Tropical Systems of 1988, Mon. Weather Rev., 117, 2260–2265, https://doi.org/10.1175/1520-0493(1989)117<2260:ATSO>2.0.CO;2, 1989.
Avila, L. A. and Pasch, R. J.: Atlantic Tropical Systems of 1991, Mon. Weather Rev., 120, 2688–2696, https://doi.org/10.1175/1520-0493(1992)120<2688:ATSO>2.0.CO;2, 1992.
Barbosa, P. M., Stroppiana, D., Grégoire, J. M., and Cardoso Pereira, J. M.: An assessment of vegetation fire in Africa (1981–1991): Burned areas, burned biomass, and atmospheric emissions, Global Biogeochem. Cy., 13, 933–950, https://doi.org/10.1029/1999GB900042, 1999.
Bercos-Hickey, E. and Patricola, C. M.: Anthropogenic influences on the African easterly jet – African easterly wave system, Clim. Dynam., 57, 2779–2792, https://doi.org/10.1007/s00382-021-05838-1, 2021.
Bercos-Hickey, E., Nathan, T. R., and Chen, S. H.: Saharan dust and the African easterly jet-African easterly wave system: Structure, location and energetics, Q. J. Roy. Meteor. Soc., 143, 2797–2808, https://doi.org/10.1002/qj.3128, 2017.
Bercos-Hickey, E., Nathan, T. R., and Chen, S.-H.: On the Relationship between the African Easterly Jet, Saharan Mineral Dust Aerosols, and West African Precipitation, J. Climate, 33, 3533–3546, https://doi.org/10.1175/jcli-d-18-0661.1, 2020.
Berry, G. J. and Thorncroft, C. D.: African easterly wave dynamics in a mesoscale numerical model: The upscale role of convection, J. Atmos. Sci., 69, 1267–1283, https://doi.org/10.1175/JAS-D-11-099.1, 2012.
Berry, G. J., Thorncroft, C. D., and Hewson, T.: African easterly waves during 2004 – Analysis using objective techniques, Mon. Weather Rev., 135, 1251–1267, https://doi.org/10.1175/MWR3343.1, 2007.
Buchard, V., Randles, C. A., da Silva, A. M., Darmenov, A., Colarco, P. R., and Govindaraju, R.: The MERRA-2 Aerosol Reanalysis, 1980 Onward. Part II: Evaluation and Case Studies, J. Climate, 30, 6851–6872, https://doi.org/10.1175/JCLI-D-16-0613.1, 2017.
Cahoon, D. R., Stocks, B. J., Levine, J. S., Cofer, W. R., and O'Neill, K. P.: Seasonal distribution of African savanna fires, Nature, 359, 812–815, https://doi.org/10.1038/359812a0, 1992.
Carlson, T. N.: Synoptic histories of three African disturbances that developed into Atlantic hurricanes, Mon. Weather Rev., 97, 256–276, https://doi.org/10.1175/1520-0493(1969)097<0256:SHOTAD>2.3.CO;2, 1969.
Carlson, T. N. and Prospero, J. M.: The Large-Scale Movement of Saharan Air Outbreaks over the Northern Equatorial Atlantic, J. Appl. Meteorol., 11, 283–297, https://doi.org/10.1175/1520-0450(1972)011<0283:TLSMOS>2.0.CO;2, 1972.
Chang, C. B.: Impact of desert environment on the genesis of African wave disturbances, J. Atmos. Sci., 50, 2137–2145, https://doi.org/10.1175/1520-0469(1993)050<2137:IODEOT>2.0.CO;2, 1993.
Chang, E. K. M., Lee, S., and Swanson, K. L.: Storm track dynamics, J. Climate, 15, 2163–2183, https://doi.org/10.1175/1520-0442(2002)015<02163:STD>2.0.CO;2, 2002.
Charney, J. G.: The Dynamics of Long Waves in a Baroclinic Westerly Current, J. Atmos. Sci., 4, 136–162, https://doi.org/10.1175/1520-0469(1947)004<0136:TDOLWI>2.0.CO;2, 1947.
Charney, J. G. and Stern, M. E.: On the stability of internal baroclinic jets in a rotating atmosphere, J. Atmos. Sci., 19, 159–172, https://doi.org/10.1175/1520-0469(1962)019<0159:OTSOIB>2.0.CO;2, 1962.
Chen, S. H., McDowell, B., Huang, C. C., and Nathan, T. R.: Formation of a low-level barrier jet and its modulation by dust radiative forcing over the Hexi Corridor in Central China on March 17, 2010, Q. J. Roy. Meteor. Soc., 147, 1873–1891, https://doi.org/10.1002/qj.4000, 2021.
Chen, T., Wang, S., and Clark, A. J.: North Atlantic Hurricanes Contributed by African Easterly Waves North and South of the African Easterly Jet, J. Climate, 21, 6767–6776, https://doi.org/10.1175/2008JCLI2523.1, 2008.
Cochrane, S. P., Schmidt, K. S., Chen, H., Pilewskie, P., Kittelman, S., Redemann, J., LeBlanc, S., Pistone, K., Segal Rozenhaimer, M., Kacenelenbogen, M., Shinozuka, Y., Flynn, C., Ferrare, R., Burton, S., Hostetler, C., Mallet, M., and Zuidema, P.: Biomass burning aerosol heating rates from the ORACLES (ObseRvations of Aerosols above CLouds and their intEractionS) 2016 and 2017 experiments, Atmos. Meas. Tech., 15, 61–77, https://doi.org/10.5194/amt-15-61-2022, 2022.
Colarco, P. R., Toon, O. B., and Holben, B. N.: Saharan dust transport to the Caribbean during PRIDE: 1. Influence of dust sources and removal mechanisms on the timing and magnitude of downwind aerosol optical depth events from simulations of in situ and remote sensing observations, J. Geophys. Res.-Atmos., 108, 8589, https://doi.org/10.1029/2002JD002658, 2003.
Colarco, P. R., Silva, A., Chin, M., and Diehl, T.: Online simulations of global aerosol distributions in the NASA GEOS-4 model and comparisons to satellite and ground-based aerosol optical depth, J. Geophys. Res.-Atmos., 115, D14207, https://doi.org/10.1029/2009JD012820, 2010.
Cornforth, R. J., Hoskins, B. J., and Thorncroft, C. D.: The impact of moist processes on the African easterly jet–African easterly wave system, Q. J. Roy. Meteor. Soc, 135, 894–913, https://doi.org/10.1002/qj.414, 2009.
Coumou, D., Lehmann, J., and Beckmann, J.: The weakening summer circulation in the Northern Hemisphere mid-latitudes, Science, 348, 324–327, https://doi.org/10.1126/science.1261768, 2015.
Diaz, M. and Aiyyer, A.: The Genesis of African Easterly Waves by Upstream Development, J. Atmos. Sci., 70, 3492–3512, https://doi.org/10.1175/JAS-D-12-0342.1, 2013.
Diedhiou, A., Janicot, S., Viltard, A., De Felice, P., and Laurent, H.: Easterly wave regimes and associated convection over West Africa and tropical Atlantic: results from the NCEP/NCAR and ECMWF reanalyses, Clim. Dynam., 15, 795–822, https://doi.org/10.1007/s003820050316, 1999.
Duchon, C. E.: Lanczos filtering in one and two dimensions, J. Appl. Meteorol., 18, 1016–1022, https://doi.org/10.1175/1520-0450(1979)018<1016:LFIOAT>2.0.CO;2, 1979.
Dunn, G. E.: Cyclogenesis in the tropical Atlantic, B. Am. Meteorol. Soc., 21, 215–229, https://doi.org/10.1175/1520-0477-21.6.215, 1940.
Eady, E. T.: Long Waves and Cyclone Waves, Tellus, 1, 33–52, https://doi.org/10.1111/j.2153-3490.1949.tb01265.x, 1949.
Francis, D., Fonseca, R., Nelli, N., Cuesta, J., Weston, M., Evan, A., and Temimi, M.: The atmospheric drivers of the major Saharan dust storm in June 2020, Geophys. Res. Lett., 47, e2020GL090102, https://doi.org/10.1029/2020GL090102, 2020.
Francis, D., Nelli, N., Fonseca, R., Weston, M., Flamant, C., and Cherif, C.: The dust load and radiative impact associated with the June 2020 historical Saharan dust storm, Atmos. Environ., 268, 118808, https://doi.org/10.1016/j.atmosenv.2021.118808, 2022.
Gelaro, R., McCarty, W., Suárez, M. J., Todling, R., Molod, A., and Takacs, L.: The modern-era retrospective analysis for research and applications, version 2 (MERRA-2), J. Climate, 30, 5419–5454, https://doi.org/10.1175/JCLI-D-16-0758.1, 2017.
Gertler, C. G. and O'Gorman, P. A.: Changing available energy for extratropical cyclones and associated convection in Northern Hemisphere summer, P. Natl. Acad. Sci. USA, 116, 4105–4110, https://doi.org/10.1073/pnas.1812312116, 2019.
Global Modeling and Assimilation Office (GMAO): MERRA-2 inst6_3d_ana_Np: 3d,6-Hourly,Instantaneous,Pressure-Level,Analysis,Analyzed Meteorological Fields V5.12.4, Greenbelt, MD, USA, Goddard Earth Sciences Data and Information Services Center (GES DISC) [data set], https://doi.org/10.5067/A7S6XP56VZWS, 2015a.
Global Modeling and Assimilation Office (GMAO): MERRA-2 tavg1_2d_rad_Nx: 2d,1-Hourly,Time-Averaged,Single-Level,Assimilation,Radiation Diagnostics V5.12.4, Greenbelt, MD, USA, Goddard Earth Sciences Data and Information Services Center (GES DISC) [data set], https://doi.org/10.5067/Q9QMY5PBNV1T, 2015b.
Global Modeling and Assimilation Office (GMAO): MERRA-2 inst3_3d_asm_Np: 3d,3-Hourly,Instantaneous,Pressure-Level,Assimilation,Assimilated Meteorological Fields V5.12.4, Greenbelt, MD, USA, Goddard Earth Sciences Data and Information Services Center (GES DISC) [data set], https://doi.org/10.5067/QBZ6MG944HW0, 2015c.
Grogan, D. F., Nathan, T. R., and Chen, S. H.: Effects of Saharan dust on the linear dynamics of African easterly waves, J. Atmos. Sci., 73, 891–911, https://doi.org/10.1175/JAS-D-15-0143.1, 2016.
Grogan, D. F., Nathan, T. R., and Chen, S. H.: Structural changes in the African easterly jet and its role in mediating the effects of Saharan dust on the linear dynamics of African easterly waves, J. Atmos. Sci., 76, 3351–3365, https://doi.org/10.1175/JAS-D-19-0104.1, 2019.
Grogan, D. F. P., Lu, C.-H., Wei, S.-W., and Chen, S.-P.: Investigating the impact of Saharan dust aerosols on analyses and forecasts of African easterly waves by constraining aerosol effects in radiance data assimilation, Atmos. Chem. Phys., 22, 2385–2398, https://doi.org/10.5194/acp-22-2385-2022, 2022.
Grotjahn, R.: Baroclinic instability, Enc. Atmos. Sci., 179, 00076-2, https://doi.org/10.1016/B0-12-227090-8/00076-2, 2003.
Haarig, M., Walser, A., Ansmann, A., Dollner, M., Althausen, D., Sauer, D., Farrell, D., and Weinzierl, B.: Profiles of cloud condensation nuclei, dust mass concentration, and ice-nucleating-particle-relevant aerosol properties in the Saharan Air Layer over Barbados from polarization lidar and airborne in situ measurements, Atmos. Chem. Phys., 19, 13773–13788, https://doi.org/10.5194/acp-19-13773-2019, 2019.
Haywood, J. M., Pelon, J., Formenti, P., Bharmal, N., Brooks, M., Capes, G., and Tulet, P.: Overview of the dust and biomass-burning experiment and African monsoon multidisciplinary analysis special observing period-0, J. Geophys. Res.-Atmos., 113, D00C17, https://doi.org/10.1029/2008JD010077, 2008.
Hopsch, S. B., Thorncroft, C. D., Hodge, K., and Aiyyer, A.: West African storm tracks and their relationship to Atlantic tropical cyclones, J. Climate, 20, 2468–2483, https://doi.org/10.1175/JCLI4139.1, 2007.
Hoskins, B. J., James, I. N., and White, G. H.: The Shape, Propagation and Mean-Flow Interaction of Large-Scale Weather Systems, J. Atmos. Sci., 40, 1595–1612, https://doi.org/10.1175/1520-0469(1983)040<1595:TSPAMF>2.0.CO;2, 1983.
Hosseinpour, F. and Wilcox, E. M.: Aerosol interactions with African/Atlantic climate dynamics, Environ. Res. Lett., 9, 075004, https://doi.org/10.1088/1748-9326/9/7/075004, 2014.
Hsieh, J. S. and Cook, K. H.: Generation of African Easterly Wave Disturbances: Relationship to the African Easterly Jet, Mon. Weather Rev., 133, 1311–1327, https://doi.org/10.1175/MWR2916.1, 2005.
Hsieh, J. S. and Cook, K. H.: A Study of the Energetics of African Easterly Waves Using a Regional Climate Model, J. Atmos. Sci., 64, 421–440, https://doi.org/10.1175/JAS3851.1, 2007.
Hsu, N. C., Lee, J., Sayer, A. M., Kim, W., Bettenhausen, C., and Tsay, S. C.: VIIRS Deep Blue aerosol products over land: Extending the EOS long-term aerosol data records, J. Geophys. Res.-Atmos., 124, 4026–4053, https://doi.org/10.1029/2018JD029688, 2019.
Jones, C., Mahowald, N., and Luo, C.: The role of easterly waves on African Desert dust transport, J. Climate, 16, 3617–3628, https://doi.org/10.1175/1520-0442(2003)016<3617:TROEWO>2.0.CO;2, 2003.
Jones, C., Mahowald, N., and Luo, C.: Observational evidence of African Desert dust intensification of easterly waves, Geophys. Res. Lett, 31, L17208, https://doi.org/10.1029/2004gl020107, 2004.
Kiladis, G. N., Thorncroft, C. D., and Hall, N. M. J.: Three-dimensional structure and dynamics of African easterly waves part I: Observations, J. Atmos. Sci., 63, 2212–2230, https://doi.org/10.1175/JAS3741.1, 2006.
Kim, K. M., Lau, W. K. M., Sud, Y. C., and Walker, G. K.: Influence of Aerosol-Radiative forcing on the diurnal and seasonal cycles of rainfall over West Africa and eastern Atlantic Ocean using GCM simulations, Clim. Dynam., 35, 115–126, https://doi.org/10.1007/s00382-010-0750-1, 2010.
Konare, A., Zakey, A. S., Solmon, F., Giorgi, F., Rauscher, S., Ibrah, S., and Bi, X.: A regional climate modeling study of the effect of desert dust on the West African monsoon, J. Geophys. Res.-Atmos., 113, D12206, https://doi.org/10.1029/2007JD009322, 2008.
Lau, K. M. and Kim, K. M.: Cooling of the Atlantic by Saharan dust, Geophys. Res. Lett., 34, L23811, https://doi.org/10.1029/2007GL031538, 2007.
Lau, K. M., Kim, K. M., Sud, Y. C., and Walker, G. K.: A GCM study of the response of the atmospheric water cycle of West Africa and the Atlantic to Saharan dust radiative forcing, Ann. Geophys., 27, 4023–4037, https://doi.org/10.5194/angeo-27-4023-2009, 2009.
Liang, J., Chen, Y., Arellano, A. F., and Mamun, A. A.: Model sensitivity study of the direct radiative impact of saharan dust on the early stage of hurricane earl, Atmosphere, 12, 1181, https://doi.org/10.3390/atmos12091181, 2021.
Liu, D., Wang, Z., Liu, Z., Winker, D., and Trepte, C.: A height resolved global view of dust aerosols from the first year CALIPSO lidar measurements, J. Geophys. Res.-Atmos., 113, D16214, https://doi.org/10.1029/2007JD009776, 2008.
Lorenz, E. N.: Available potential energy and the maintenance of the general circulation, Tellus, 7, 157–167, https://doi.org/10.1111/j.2153-3490.1955.tb01148.x, 1955.
Ma, P. L., Zhang, K., Shi, J. J., Matsui, T., and Arking, A.: Direct radiative effect of mineral dust on the development of African easterly waves in late summer 2003–07, J. Appl. Meteorol. Clim., 51, 51, 2090–2104, https://doi.org/10.1175/JAMC-D-11-0215.1, 2012.
Mamun, A., Chen, Y., and Liang, J.: Radiative and cloud microphysical effects of the Saharan dust simulated by the WRF-Chem model, J. Atmos. Sol.-Terr. Phy., 219, 105646, https://doi.org/10.1016/j.jastp.2021.105646, 2021.
Matsuki, A., Quennehen, B., Schwarzenboeck, A., Crumeyrolle, S., Venzac, H., Laj, P., and Gomes, L.: Temporal and vertical variations of aerosol physical and chemical properties over West Africa: AMMA aircraft campaign in summer 2006, Atmos. Chem. Phys., 10, 8437–8451, https://doi.org/10.5194/acp-10-8437-2010, 2010.
Mekonnen, A., Thorncroft, C. D., and Aiyyer, A. R.: Analysis of Convection and Its Association with African Easterly Waves, J. Climate, 19, 5405–5421, https://doi.org/10.1175/JCLI3920.1, 2006.
Meloni, D., di Sarra, A., Brogniez, G., Denjean, C., De Silvestri, L., Di Iorio, T., Formenti, P., Gómez-Amo, J. L., Gröbner, J., Kouremeti, N., Liuzzi, G., Mallet, M., Pace, G., and Sferlazzo, D. M.: Determining the infrared radiative effects of Saharan dust: a radiative transfer modelling study based on vertically resolved measurements at Lampedusa, Atmos. Chem. Phys., 18, 4377–4401, https://doi.org/10.5194/acp-18-4377-2018, 2018.
Ming, Y. and Ramaswamy, V.: A model investigation of aerosol-induced changes in tropical circulation, J. Climate, 24, 5125–5133, https://doi.org/10.1175/2011JCLI4108.1, 2011.
Myhre, G., Stordal, F., Johnsrud, M., Ignatov, A., Mishchenko, M. I., Geogdzhayev, I. V., Tanré, D., Deuzé, J. L., Goloub, P., Nakajima, T., and Higurashi, A., Intercomparison of satellite retrieved aerosol optical depth over the ocean, J. Atmos. Sci., 61, 499–513, https://doi.org/10.1175/1520-0469(2004)061<0499:IOSRAO>2.0.CO;2, 2004.
Nitta, T. and Takayabu, Y.: Global analysis of the lower tropospheric disturbances in the tropics during the northern summer of FGGE year. Part II: Regional characteristics of the disturbances, Pure Appl. Geophys., 123, 272–292, https://doi.org/10.1007/BF00877023, 1985.
Norquist, D. C., Recker, E., and Reed, R. J.: The energetics of African wave disturbances as observed during the phase III of GATE, Mon. Weather Rev., 105, 334–342, https://doi.org/10.1175/1520-0493(1977)105<0334:TEOAWD>2.0.CO;2, 1977.
Orlanski, I. and Katzfey, J.: The life cycle of a cyclone wave in the Southern Hemisphere, Part I: Eddy energy budget, J. Atmos. Sci., 48, 1972–1998, https://doi.org/10.1175/1520-0469(1991)048<1972:TLCOAC>2.0.CO;2, 1991.
Pasch, R. J. and Avila, L. A.: Atlantic Tropical Systems of 1992, Mon. Weather Rev., 122, 539–548, https://doi.org/10.1175/1520-0493(1994)122<0539:ATSO>2.0.CO;2, 1994.
Perry, K. D., Cahill, T. A., Eldred, R. A., Dutcher, D. D., and Gill, T. E.: Long-range transport of North African dust to the eastern United States, J. Geophys. Res.-Atmos., 102, 11225–11238, https://doi.org/10.1029/97JD00260, 1997.
Platnick, S., Hubanks, P., Meyer, K., and King, M. D.: MODIS Atmosphere L3 Daily Product, NASA MODIS Adaptive Processing System, Goddard Space Flight Center, USA [data set], https://doi.org/10.5067/MODIS/MOD08_D3.061, 2015
Plumb, R. A.: A new look at the energy cycle, J. Atmos. Sci., 40, 1669–1688, https://doi.org/10.1175/1520-0469(1983)040<1669:ANLATE>2.0.CO;2, 1983.
Prospero, J. M. and Lamb, P. J.: African Droughts and Dust Transport to the Caribbean: Climate Change Implications, Science, 302, 1024–1027, https://doi.org/10.1126/science.1089915, 2003.
Pytharoulis, I. and Thorncroft, C.: The low-level structure of African easterly waves in 1995, Mon. Weather Rev., 127, 2266–2280, https://doi.org/10.1175/1520-0493(1999)127<2266:TLLSOA>2.0.CO;2, 1999.
Ramo, R., Roteta, E., Bistinas, I., Wees, D., Bastarrika, A., Chuvieco, E., and Werf, G. R.: African burned area and fire carbon emissions are strongly impacted by small fires undetected by coarse resolution satellite data, P. Natl. Acad. Sci. USA, 118, 2011160118, https://doi.org/10.1073/pnas.2011160118, 2021.
Randles, C. A., Da Silva, A. M., Buchard, V., Colarco, P. R., Darmenov, A., Govindaraju, R., Smirnov, A., Holben, B., Ferrare, R., Hair, J. and Shinozuka, Y.: The MERRA-2 Aerosol Reanalysis, 1980 Onward. Part I: System Description and Data Assimilation Evaluation, J. Climate, 30, 6823–6850, https://doi.org/10.1175/JCLI-D-16-0609.1, 2017.
Redemann, J., Wood, R., Zuidema, P., Doherty, S. J., Luna, B., LeBlanc, S. E., Diamond, M. S., Shinozuka, Y., Chang, I. Y., Ueyama, R., Pfister, L., Ryoo, J.-M., Dobracki, A. N., da Silva, A. M., Longo, K. M., Kacenelenbogen, M. S., Flynn, C. J., Pistone, K., Knox, N. M., Piketh, S. J., Haywood, J. M., Formenti, P., Mallet, M., Stier, P., Ackerman, A. S., Bauer, S. E., Fridlind, A. M., Carmichael, G. R., Saide, P. E., Ferrada, G. A., Howell, S. G., Freitag, S., Cairns, B., Holben, B. N., Knobelspiesse, K. D., Tanelli, S., L'Ecuyer, T. S., Dzambo, A. M., Sy, O. O., McFarquhar, G. M., Poellot, M. R., Gupta, S., O'Brien, J. R., Nenes, A., Kacarab, M., Wong, J. P. S., Small-Griswold, J. D., Thornhill, K. L., Noone, D., Podolske, J. R., Schmidt, K. S., Pilewskie, P., Chen, H., Cochrane, S. P., Sedlacek, A. J., Lang, T. J., Stith, E., Segal-Rozenhaimer, M., Ferrare, R. A., Burton, S. P., Hostetler, C. A., Diner, D. J., Seidel, F. C., Platnick, S. E., Myers, J. S., Meyer, K. G., Spangenberg, D. A., Maring, H., and Gao, L.: An overview of the ORACLES (ObseRvations of Aerosols above CLouds and their intEractionS) project: aerosol–cloud–radiation interactions in the southeast Atlantic basin, Atmos. Chem. Phys., 21, 1507–1563, https://doi.org/10.5194/acp-21-1507-2021, 2021.
Reed, R. J., Hollingsworth, A., Heckley, W. A., and Delsol, F.: An evaluation of the performance of the ECMWF operational system in analyzing and forecasting easterly wave disturbances 15 SEPTEMBER 2013, Mon. Weather Rev., 116, 824–865, https://doi.org/10.1175/1520-0493(1988)116<0824:AEOTPO>2.0.CO;2, 1988.
Remer, L. A., Levy, R. C., Mattoo, S., Tanré, D., Gupta, P., Shi, Y., and Holben, B. N.: The dark target algorithm for observing the global aerosol system: Past, present, and future, Remote Sens., 12, 2900, https://doi.org/10.3390/rs12182900, 2020.
Rienecker, M. M., Suarez, M. J., Todling, R., Bacmeister, J., Takacs, L., and Liu, H. C.: The GEOS-5 Data Assimilation System – Documentation of versions 5.0.1 and 5.1.0, and 5.2.0., NASA Tech. Rep. Series on Global Modeling and Data Assimilation, NASA/TM-2008-104606, Vol. 27, 92 pp., 2008.
Rienecker, M. M., Suarez, M., Gelaro, R., Todling, R., Bacmeister, J., Liu, E., and Bosilovich, M.: MERRA: NASA's Modern-Era retrospective analysis for research and applications, J. Climate, 24, 3624–3648, https://doi.org/10.1175/JCLI-D-11-00015.1, 2011.
Roundy, P. E. and Frank, W. M.: A climatology of waves in the equatorial region, J. Atmos. Sci., 61, 2105–2032, https://doi.org/10.1175/1520-0469(2004)061<2105:ACOWIT>2.0.CO;2, 2004.
Russell, J. O., Aiyyer, A., and Dylan White, J.: African Easterly Wave Dynamics in Convection-Permitting Simulations: Rotational Stratiform Instability as a Conceptual Model, J. Adv. Model. Earth Syst., 12, e2019MS001706, https://doi.org/10.1029/2019MS001706, 2020.
Saidou Chaibou, A. A., Ma, X., and Sha, T.: Dust radiative forcing and its impact on surface energy budget over West Africa, Sci. Rep., 10, 12236, https://doi.org/10.1038/s41598-020-69223-4, 2020.
Sayer, A. M., Hsu, N. C., Lee, J., Kim, W. V., and Dutcher, S. T.: Validation, stability, and consistency of MODIS Collection 6.1 and VIIRS Version 1 Deep Blue aerosol data over land, J. Geophys. Res.-Atmos., 124, 4658–4688, https://doi.org/10.1029/2018JD029598, 2019.
Soupiona, O., Papayannis, A., Kokkalis, P., Foskinis, R., Sánchez Hernández, G., Ortiz-Amezcua, P., Mylonaki, M., Papanikolaou, C.-A., Papagiannopoulos, N., Samaras, S., Groß, S., Mamouri, R.-E., Alados-Arboledas, L., Amodeo, A., and Psiloglou, B.: EARLINET observations of Saharan dust intrusions over the northern Mediterranean region (2014–2017): properties and impact on radiative forcing, Atmos. Chem. Phys., 20, 15147–15166, https://doi.org/10.5194/acp-20-15147-2020, 2020.
Thorncroft, C. D. and Hodges, K.: African Easterly Wave Variability and Its Relationship to Atlantic Tropical Cyclone Activity, J. Climate, 14, 116–1179, https://doi.org/10.1175/1520-0442(2001)014<1166:AEWVAI>2.0.CO;2, 2001.
Thorncroft, C. D., Hall, N. M., and Kiladis, G. N.: Three-dimensional structure and dynamics of African easterly waves, Part III: genesis, J. Atmos. Sci., 65, 3596–3607, https://doi.org/10.1175/2008JAS2575.1, 2008.
Weinzierl, B., Ansmann, A., Prospero, J., Althausen, D., Benker, N., and Chouza, F.: The saharan aerosol long-range transport and aerosol–cloud-interaction experiment: Overview and selected highlights, B. Am. Meteorol. Soc., 98, 1427–1451, https://doi.org/10.1175/BAMS-D-15-00142.1, 2017.
Wilcox, E. M., Lau, W. K. M., and Kim, K. M.: A Northward shift of the North Atlantic Ocean intertropical convergence zone in response to summertime Saharan dust outbreaks, Geophys. Res. Lett., 37, L04804, https://doi.org/10.1029/2009GL041774, 2010.
Wu, M. L. C., Reale, O., and Schubert, S. D.: A characterization of African easterly waves on 2.5–6-day and 6–9-day time scales, J. Climate, 26, 6750–6774, https://doi.org/10.1175/JCLI-D-12-00336.1, 2013.
Zuidema, P., Redemann, J., Haywood, J., Wood, R., Piketh, S., Hipondoka, M., and Formenti, P.: Smoke and clouds above the southeast Atlantic: Upcoming field campaigns probe absorbing aerosol's impact on climate, B. Am. Meteorol. Soc., 97, 1131–1135, https://doi.org/10.1175/BAMS-D-15-00082.1, 2016.