the Creative Commons Attribution 4.0 License.
the Creative Commons Attribution 4.0 License.
 | 31 Jul 2023
Investigation of the effects of the Greek extreme wildfires of August 2021 on air quality and spectral solar irradiance
Akriti Masoom
Ilias Fountoulakis
Stelios Kazadzis
Ioannis-Panagiotis Raptis
Anna Kampouri
Basil E. Psiloglou
Dimitra Kouklaki
Kyriakoula Papachristopoulou
Eleni Marinou
Stavros Solomos
Anna Gialitaki
Dimitra Founda
Vasileios Salamalikis
Dimitris Kaskaoutis
Natalia Kouremeti
Nikolaos Mihalopoulos
Vassilis Amiridis
Andreas Kazantzidis
Alexandros Papayannis
Christos S. Zerefos
In August 2021, a historic heatwave was recorded in Greece which resulted in extreme wildfire events that strongly affected the air quality over the city of Athens. Saharan dust was also transferred over Greece on certain days of the same period due to the prevailing southern winds. The impact of these events on air quality and surface solar radiation is investigated in this study. Event characterization based on active and passive remote sensing instrumentation has been performed. The study shows that significantly increased levels of air pollution were recorded from the end of July to the first week of August. The smoke led to unusually high aerosol optical depth (AOD) values (up to 3.6 at 500 nm), high Ångström exponent (AE) (up to 2.4 at 440–870 nm), and a strong and negative dependence of single-scattering albedo (SSA) on wavelength that was observed to decrease from 0.93 at 440 nm to 0.86 at 1020 nm, while the dust event led to high AOD (up to 0.7 at 500 nm), low AE (up to 0.9 at 440–870 nm), and a positive dependence of SSA on wavelength that was observed to increase from 0.89 at 440 nm to 0.95 at 1020. Furthermore, the smoke plume was also detected over the PANhellenic GEophysical observatory of Antikythera on 7 August, which is about 240 km away from Athens. Increased AOD values (up to ∼ 0.90 at 500 nm) associated with a high fine-mode AOD (up to ∼ 0.85 at 500 nm) and decrease in SSA with wavelength suggested the dominance of fine biomass burning aerosols. The impact of dust and smoke on solar irradiance revealed significant differences in the spectral dependence of the attenuation caused by the two different aerosol types. The attenuation of solar irradiance in the ultraviolet (UV-B) spectrum was found to be much lower in the case of dust compared to smoke for similar AOD500 values. Differences were less pronounced in the near-infrared and visible spectral regions. The large AODs during the wildfires resulted in a decrease in the noon UV index by up to 53 %, as well as in the daily effective doses for the production of vitamin D (up to 50 %), in the daily photosynthetically active radiation (up to 21 %) and in the daily global horizontal irradiance (up to 17 %), with serious implications for health, agriculture, and energy. This study highlights the wider impacts of wildfires that are part of the wider problem for Mediterranean countries, whose frequency is predicted to increase in view of the projected increasing occurrence of summer heatwaves.
- Article
(15691 KB) - Full-text XML
- BibTeX
- EndNote


Climate change is becoming a harsh reality and leading to climate problems, one of which is the increased frequency of occurrence of large-scale wildfires around the globe which affect both the environment and human life (Weilnhammer et al., 2021). Wildfires lead to the loss of land vegetation; worsen air quality; and affect ecosystems, societies, economies, and climate (Jaffe et al., 2013; Jolly et al., 2015). There have been concerns about the frequency of occurrence of such events in the recent past (Ganor et al., 2010; Forzieri et al., 2017). Extreme weather events like severe heatwaves (Perkins-Kirkpatrick and Lewis, 2020; Fischer et al., 2021), which are more prominent in southern and southeastern Europe (Giorgi and Lionello, 2008; Fernandez et al., 2015; Forzieri et al., 2017; Weilnhammer et al., 2021), act as fuel for other extreme events like wildfires. The probable causes of ignition of wildfires can be categorized as lightning-induced and human-caused.
A wildfire event leads to a sudden rise in particulate matter (PM) and gaseous pollutants, such as nitrogen oxides, carbon monoxide, greenhouse gases, and volatile organic compounds (Andreae and Merlet, 2001; Knorr et al., 2017; Fernandes et al., 2022). Among these, greenhouse gases having longer lifetimes impact the global climate, while aerosols having short lifespans mainly have regional and local effects. The long-range transport of wildfire smoke can lead to a change in the chemical composition of the plume and also affect the local and regional air quality upon the planetary boundary layer entrainment (Colarco et al., 2004; Pani et al., 2018; Wu et al., 2021). Following a wildfire, the poor air quality due to the high gaseous and particulate pollutant levels imposes serious threats of asthma, respiratory diseases, cardiovascular effects, and lung cancer via human inhalation exposure (Manisalidis et al., 2020; Rice et al., 2021; Andreadis et al., 2022). Biomass burning also reduces the amount of solar radiation, as presented in the study by Rosário et al. (2022) that showed that the mean drop in solar radiation was up to 200 W m−2. In another study by Park et al. (2018), it was found that smoke significantly reduces the ultraviolet (UV) actinic flux, while the spectral light absorption by smoke aerosols depends upon the combustion conditions, smoke chemical properties, and atmospheric processing (Saleh et al., 2013; Srinivas et al., 2016). Moreover, Arola et al. (2007) found that biomass burning aerosols led to a decline of about 35 % in surface UV irradiance, while the reduction was comparatively smaller for total solar radiation.
The Mediterranean is considered a “climate change hotspot” (Founda et al., 2022; Zittis et al., 2022) due to its faster warming rates, as compared to the global average, as well as an increase in the frequency of heatwaves followed by forest fires and prolonged droughts. The Mediterranean region is also susceptible to increased aridity as a result of climate change (IPCC, 2022; Turco et al., 2018; Guiot and Cramer, 2016). The occurrence of fires leads to water stress that in turn reduces the post-fire vegetation recovery (Puig-Gironès et al., 2017; Cruz and Moreno, 2001; Pratt et al., 2014; Vilagrosa et al., 2014; Pausas et al., 2016), leading to an expansion of shrublands as a combined effect of fire and drought (Batllori et al., 2017, 2019; Baudena et al., 2020). Previous publications in the Mediterranean have analysed aerosol optical properties and mixtures due to seasonal forest fires. Castagna et al. (2021) analysed the 2017 summer wildfires in the region of Calabria (southern Italy), which resulted in the largest burnt area of the last decade (2008–2019), estimated to be more than 1679 ha of forests and shrubland. The impact of the wildfires on air quality, ecosystems, and human health was analysed using carbon monoxide and black carbon (BC) measurements at the high-altitude station of Monte Curcio (39.32∘ N, 16.42∘ E). In Gómez-Amo et al. (2017), the authors studied two wildfires in Spain that occurred near Valencia during 29–30 June 2012 affecting 48 500 ha of land.
On the other hand, the summer season in the Mediterranean region witnesses frequent dust activities, and the dust accumulation is favoured by stable weather conditions due to the absence of precipitation and depressions (Nastos, 2012). The eastern Mediterranean region has a marked seasonal cycle of the occurrence of the Saharan dust events, which maximize in spring (mainly) and summer (Moulin et al., 1998; Rodríguez et al., 2001; Fotiadi et al., 2006; Meloni et al., 2007). In Papayannis et al. (2009), the authors presented a statistical analysis of Saharan dust for a 3-year period between 2004 and 2006 over Athens, Greece, and they found that the Saharan-dust-related aerosol layers were prevalent for 79 d. In Marinou et al. (2017), the authors showed that Saharan dust layers arrive above Greece in altitudes between 2–6 km in spring (mean dust extinction coefficient values of ∼ 70 Mm−1), between 3–6 km in summer (∼ 50 Mm−1), and between 2–5 km in autumn (∼ 40 Mm−1). Recently, Soupiona et al. (2018) presented a statistical analysis of Saharan dust events over Athens for a 16-year period between 2000 and 2016. They found that the dust layers arrive over Athens, between 1–6 km a.s.l., with the number of these events being the highest in spring, summer, and early-autumn periods, and that during spring the dust layers were moved at higher altitudes than in other seasons. Saharan dust effects in various sectors including health, aviation, and solar energy have been presented in Monteiro et al. (2022) and references therein. In particular, extreme dust events can attenuate the global horizontal irradiance (GHI) by as much as 40 %–50 %, while a much stronger attenuation was recorded in the direct normal irradiance (DNI) (by 80 %–90 %); spectrally, this attenuation is distributed as 37 % in the UV, 33 % in the VIS, and around 30 % in the infrared regions (Kosmopoulos et al., 2017). Also, Papachristopoulou et al. (2022) showed that for the eastern Mediterranean the average attenuation of dust in GHI and DNI using a 15-year climatology is ∼ 3 % and ∼ 10 %, respectively.
The wildfires of summer 2021 in Greece were the most severe in the decade, signifying a conflagration period of about 20 d in August, and were triggered by severe and prolonged heatwaves, as discussed in a few recent studies. The study by Founda et al. (2022) showed that the heatwave of 2021 was intense and persistent with the highest observed nighttime temperatures and cumulative heat, which were also intensified due to the urban heat island effect in Athens. A study of the Varympompi wildfire of 2021, in the northern suburbs of Athens, by Giannaros et al. (2022), showed that it was characterized by an unusual spread of fire followed by massive spotting as well as pyroconvection influence. The development of pyroconvection and ignition was supported by dry and hot conditions that began emerging in late June that deteriorated further, reaching its peak in July and resulting in the wildfires. The meteorological conditions also supported the event including a lack of significant precipitation and higher-than-average temperatures. Another study by Papavasileiou and Giannaros (2022) analysed the pyroconvection using satellite data and found that there was a presence of pyrocumulus and pyrocumulonimbus for many hours during the severe fire events.
The increase in the frequency of occurrence of these extreme wildfire events enhances the necessity of a more in-depth understanding of these phenomena and their impact on various domains. The analysis presented in this study focuses on such wildfire events that were prevalent in August 2021 around the city of Athens. The study aspires to better analyse the wildfire smoke and simultaneous dust activity from in situ, remote sensing, and modelling data and to analyse their respective and combined impact on spectral solar irradiance. The datasets used were collected from Athens, during the ASPIRE (Atmospheric parameters affecting SPectral solar IRradiance and solar Energy) (ASPIRE, 2022) campaign, and from the PANhellenic GEophysical observatory of Antikythera (PANGEA) of the National Observatory of Athens (NOA). The ASPIRE campaign was designed with the objective to investigate the effect of clouds, aerosols, water vapour, and absorbing trace gases on spectral solar irradiance and contributes to interdisciplinary aspects. Wildfire events during this campaign allowed for the in-depth investigation of atmospheric composition and its impact on the transfer of solar radiation using active and passive remote sensing instruments.
The aim of this work is to analyse the spatial and temporal spectral aerosol optical properties during the August 2021 wildfires in Athens and their effects on surface solar radiation. More specifically, the main objectives are (1) to discuss the effect of the smoke and dust events on air quality, (2) to show how observations from different sensors can be combined to identify and study such events, (3) to study aerosol optical and microphysical properties during the events, (4) to investigate the transport of the smoke plume and its characteristics to the PANGEA observatory in Antikythera, and (5) to analyse the contribution of dust and biomass burning aerosols to the attenuation of spectral surface solar radiation over Athens. This paper is organized into four sections. Section 2 deals with the observational data and the methodology and is followed by Sect. 3, which presents the results and discussions; finally, Sect. 4 summarizes the findings of this study.
For a better understanding of the August 2021 wildfires in Greece, ground-based measurements, satellite images, and radiative transfer modelling are used synergistically. This section deals with the description of the datasets used in this work, as well as the methodology followed to study the wildfire event.
2.1 Ground-based measurements
Data that were collected during the intensive ASPIRE campaign have been used for the study. In addition to the instruments that are permanently installed and operating at the actinometric station (for observations and measurements of solar radiation) of NOA (ASNOA) (located at Thissio, in the centre of Athens; 37.97∘ N, 23.72∘ E; 107 m a.s.l.), new instruments were installed in the context of the ASPIRE campaign. To study the impact of wildfires in Athens, measurements that were performed at the Biomedical Research Foundation of the Academy of Athens (BRFAA), Greece (37.99∘ N, 23.78∘ E; at approximately 180 m a.s.l.; located in a green area 4 km from ASNOA), and at the National Technical University of Athens (NTUA) (37.96∘ N, 23.78∘ E; at approximately 212 m a.s.l.; about 3 km from ASNOA) were also used. In situ air quality measurements were also used, obtained from the stations of the Greek National Air Pollution Monitoring Network (GNAPMN) in Athens. From the PANGEA observatory (35.86∘ N, 23.29∘ E; 110 m a.s.l.), which is located on the remote island of Antikythera, measurements collected at the NOA aerosol remote sensing facility have been used. Details on the equipment and measuring sites are provided in Table 1.
Table 1Description of ground-based measurements.
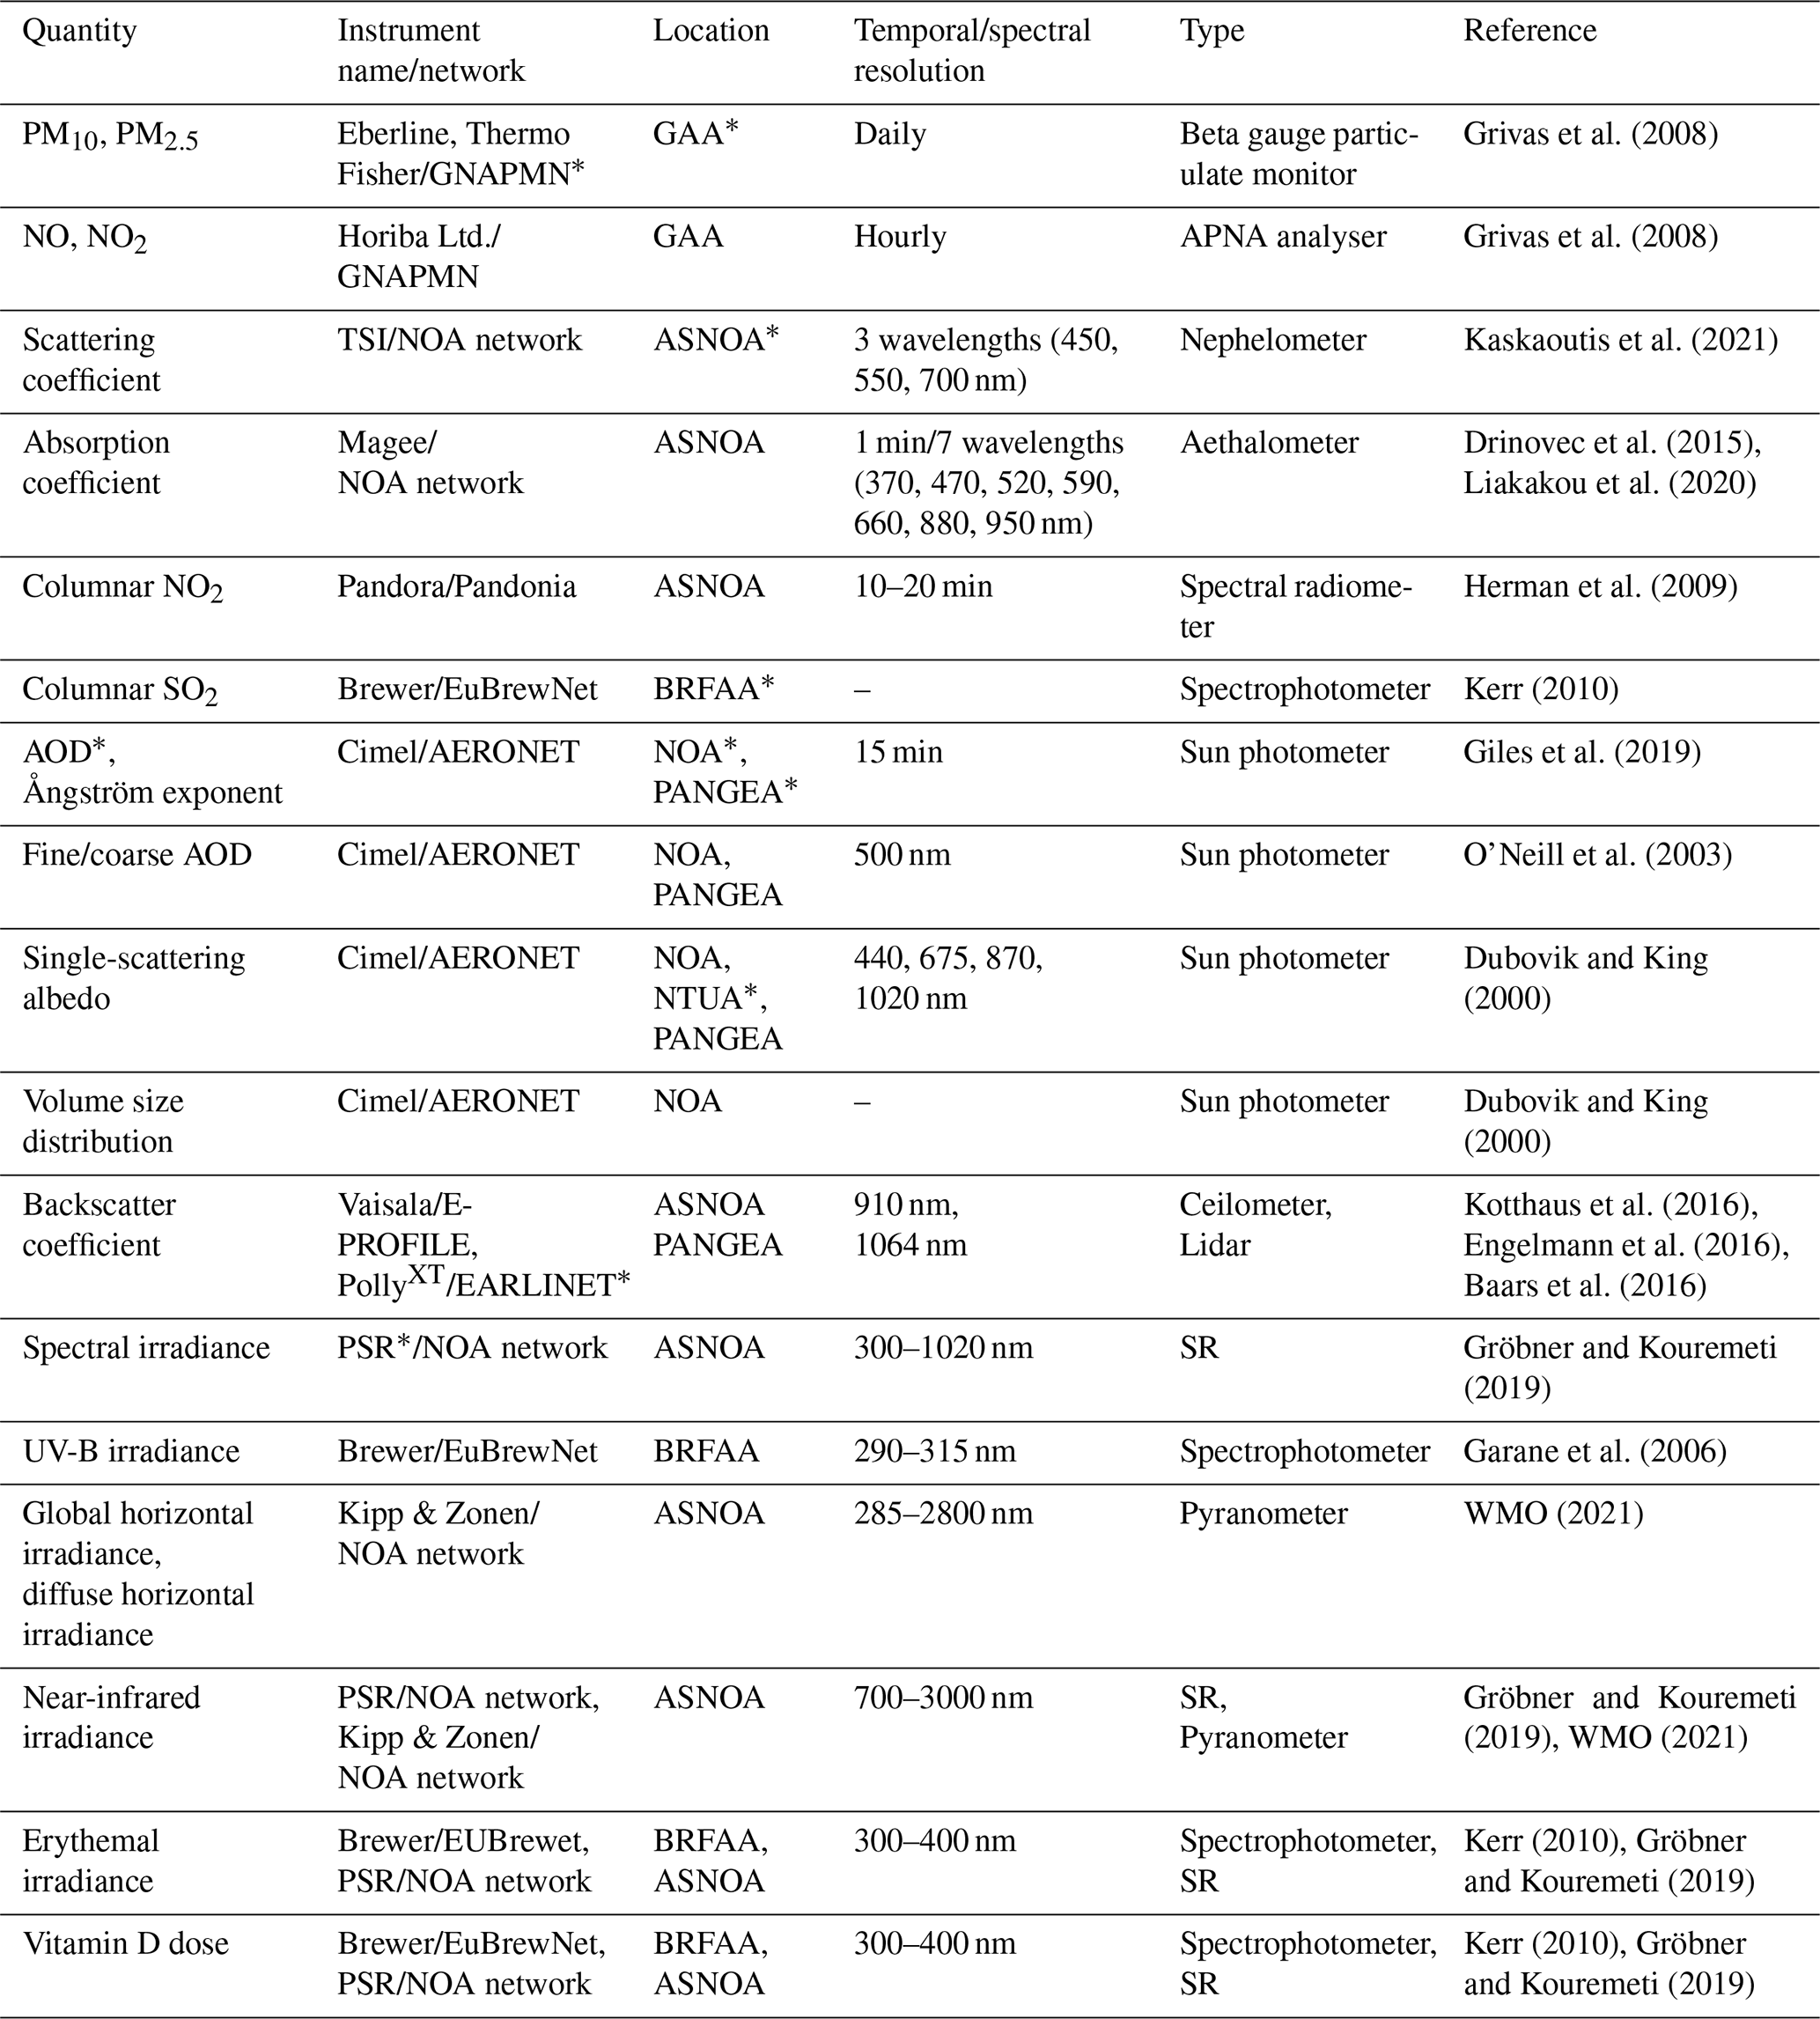
∗ AOD (aerosol optical depth), ASNOA (actinometric station of NOA), BRFAA (Biomedical Research Foundation of the Academy of Athens), EARLINET (European Aerosol Research Lidar Network), GAA (greater Athens area), GNAPMN (Greek National Air Pollution Monitoring Network), NOA (National Observatory of Athens), NTUA (National Technical University of Athens), PANGEA (PANhellenic GEophysical observatory of Antikythera), PSR (Precision Solar Spectroradiometer), SR (spectral radiometer).
2.1.1 Air quality
We have analysed air quality data for the greater Athens area (GAA) from the GNAPMN. More specifically, we analysed daily averages of particulate matter concentrations (PM10, PM2.5), as well as hourly concentrations of nitrogen oxides (NO, NO2), for the period July–August 2021 at 11 sites. Since data of NO and NO2 are provided on an hourly basis and not on a daily basis as the PM data, we calculated daily mean concentrations of NO and NO2 when at least 12 hourly measurements were available. Analytical information about the stations contributing data to the GNAPMN is provided by Grivas et al. (2008). Columnar NO2 from Pandora (operating at ASNOA) (Herman et al., 2009) and an MKIV, a single monochromator Brewer spectrophotometer (Brewer no. 001) (Kerr, 2010; Kerr et al., 1985) (operating at BRFAA), were used in this study. Spectral measurements from the Brewer instrument were also used to retrieve the total column SO2 and the total column ozone. Details about the instruments, calibration, and uncertainties are provided in Appendix A.
2.1.2 Aerosol properties
The Athens NOA AERONET (Aerosol Robotic Network) station was operating from 2008 to 2021, with a CE318 sun/sky photometer from Cimel Electronique (Cimel no. 440) in operation during the study period. The columnar aerosol optical depth (AOD), Ångström exponent (AE), fine/coarse AOD, single-scattering albedo (SSA), and volume size distribution (VSD) (Giles et al., 2019; O'Neill et al., 2003; Dubovik and King, 2000), retrieved from the AERONET Version 3 algorithm (Giles et al., 2019), are used here. For Athens, Level 2.0 AERONET direct sun products (AOD, AE, fine/coarse AOD) were used in this study except for the days with very high smoke and/or dust aerosol load (4, 5, 7, 11, 18, and 19 August), when Level 1.0 data were used. For these particular days, the AERONET automatic cloud-screening algorithm filtered out data related to the wildfire plumes, when going from Level 1.0 (unscreened) to Level 1.5 (cloud-screened) and Level 2.0 (cloud-screened and quality-assured) products, due to the very high temporal variations in AOD. The sun photometer measurements during high-aerosol events with extremely frequent changes in the radiation field are difficult to be captured due to a cloud-flagging algorithm failure and are more likely to be rejected as cloudy, even in cloud-free situations (Evan et al., 2022). Manual control of sky-camera (SKYCAM) images from the cloud camera was used as additional evidence for non-cloud presence regarding the choice of the Level 1.0 products to be used (Appendix Fig. A1). Accordingly, Level 2.0 inversion products (SSA, VSD) were used except for the days mentioned above (where Level 1.5 data with a sky error limit up to 5 % and solar zenith angle (SZA) of > 45∘ were used with additional filtering of coincident AOD at 440 nm of > 0.4 for SSA similar to the AERONET quality assurance criterion for Level 1.5 to rise to Level 2.0, except for SZA for which we have used 45∘ instead of 50∘; Holben et al., 2023) since the strict criteria for Level 2.0 filters out a lot of useful retrievals in summer months, as explained in Kazadzis et al. (2016). The approach of using lower-level data increases the uncertainty in the retrievals, but the evidence of the collocated data from other sources provides a relatively high degree of data quality assurance. Also, the climatological values of the aforementioned properties reported in previous studies (Raptis et al., 2020) are used as a reference. We note here that measurements from the NTUA AERONET station operating in Athens since January 2021 (CE318 sun/sky photometer) were used for 7 August when the data in morning hours were not available from the Athens NOA AERONET station. The same parameters (AOD, AE, fine/coarse AOD, and SSA) were also collected at the PANGEA observatory. For PANGEA, Level 2.0 products were used for both direct sun and inversion products, as there was not much difference in Level 1.0 and higher-level products, as was the case of Athens.
In addition to the columnar optical properties, in situ measurements of spectral scattering and absorption coefficients measured at the Thissio Air Monitoring Station by means of integrated nephelometer (TSI 3564) and aethalometer (AE-33) instruments were analysed. Nephelometer measures the spectral scattering coefficient (bsca,λ) at three wavelengths (450, 550, and 700 nm). Aerosol absorption was computed via AE-33 measurements at seven wavelengths (370, 470, 520, 590, 660, 880, and 950 nm), while the instrument also provides the BC concentrations and through the “aethalometer model” the fractions of BC related to biomass (or wood) burning (BCwb) and fossil-fuel combustion (BCff) (Liakakou et al., 2020). Quality-controlled aerosol scattering, absorption, BC, and SSA values at Thissio are available on an hourly basis (Kaskaoutis et al., 2021), while daily averaged values are used in this study (1–20 August 2021). A Vaisala CL31 ceilometer installed at ASNOA provides information on the vertical distribution of the aerosol extinction coefficient (Kotthaus et al., 2016) and is part of the European Meteorological Network's programme “E-PROFILE” (ALCProfile, 2022).
2.1.3 Clouds
The Q24M Mobotix all-sky imager (ASI) was installed at ASNOA for observing the atmospheric conditions in Athens in the context of the ASPIRE campaign, which operated from December 2020 to September 2022, and provided images with a temporal resolution of 10 s. Such ASIs can be employed for performing cloud detection and characterization (Kazantzidis et al., 2012) and/or retrieving aerosol properties (Cazorla et al., 2009; Román et al., 2022; Kazantzidis et al., 2017). Kazantzidis et al. (2017) proposed a methodology for retrieving AOD at 440, 500, and 675 nm using RGB channels of the ASI, the sun saturation area (a feature extracted from ASI images representative of AOD magnitude), and solar zenith position as inputs in a machine learning algorithm. In this study, the AOD from the ASI at 500 nm was analysed and compared with the AOD from the Cimel instrument at NOA. The ASI images have also been used to separate clouds from wildfire smoke, augmenting the AERONET datasets with cases erroneously characterized as clouds by the automated cloud-screening algorithm. At the PANGEA observatory, the PollyXT lidar at NOA (part of the European Lidar Network, EARLINET, 2022; part of the Raman and polarization lidar network, POLLYNET, 2022) is installed. The PollyXT lidar at NOA (Engelmann et al., 2016; Baars et al., 2016) is a multi-wavelength Raman-polarization system with 24/7 operational capabilities, which provides vertical distributions of the particle backscatter coefficient at 355, 532, and 1064 nm; the extinction coefficient at 355 and 532 nm; and the particle depolarization ratio at 355 and 532 nm, in altitudes from 0.2 up to 15 km above the surface. With these observations and using well-known methodologies, we can separate between aerosols and clouds, spherical and non-spherical particles in mixed aerosol layers (Tesche et al., 2009; Marinou et al., 2019), and absorbing and non-absorbing aerosols towards aerosol characterization and aerosol–cloud separation (Baars et al., 2017). Using the aforementioned parameters, we identified the times and altitudes where cloud-free smoke layers were observed above the PANGEA observatory, and we use these measurements as a complementary dataset in this study.
2.1.4 Solar irradiance
The Precision Solar Spectroradiometer (PSR) no. 007, operating at ASNOA since 2016, is a high-precision and high-accuracy state-of-the-art spectroradiometer (details are provided in Appendix A). It measures irradiance in the spectral range of 300–1020 nm with an average step of 0.7 nm and spectral resolution in the range of 1.5–6 nm (depending on the measured wavelength) (Raptis et al., 2018; Gröbner and Kouremeti, 2019). The total UV radiation has been calculated by integrating the PSR measurements in the range of 290–400 nm, while UV-A constitutes the integral in the range of 315–400 nm. The photosynthetically active radiation (PAR), which is equivalent to the visible (VIS) radiation, constitutes the integrated radiation in the spectral range of 400–700 nm (Poorter et al., 2019). The uncertainty budget of the instrument is less than 1 % in VIS, less than 1.7 % in UV-A, and higher than 2 % in UV-B (Gröbner and Kouremeti, 2019).
Measurements of the global solar-spectral UV-B irradiance (integrated at 290–315 nm) from the Brewer (see Appendix A), which are available with a temporal resolution of about 30 min, were also analysed. In addition, measurements of the broadband GHI and diffuse horizontal irradiances have been also used. These measurements were performed by the two Eppley precision spectral pyranometers (: 26 069, 26 070) that have been operating at ASNOA since 1986 (details are provided in Appendix A).
Near-infrared irradiance (700–3000 nm) was calculated from the difference between the GHI measurements from the pyranometer and the calculated integral of the PSR measurements in the 290–700 nm spectral range. The erythemal irradiance was calculated as the product of the UV spectra measured by the Brewer and the PSR with the action spectrum proposed by the International Commission of Illumination (ISO/CIE, 2023; McKinlay and Diffey, 1987; Webb et al., 2011). The effective dose for the production of pre-vitamin D3 in the human skin (hereafter referred as the vitamin D dose) was calculated similarly to the erythemal irradiance but using the respective effective spectrum (Bouillon et al., 2006). The spectral extension correction technique proposed by Fioletov et al. (2003) was used to calculate erythemal irradiance from the Brewer (which measures up to 325 nm, while the erythema effective spectrum extends up to 400 nm). A similar method was used for the calculation of the vitamin D doses from the Brewer. For vitamin D and PAR, we are interested in the cumulative daily dose (since their effects depend on the overall dose that a human or a plant, respectively, gets), while for erythema, we are interested in dose rates around local noon, when solar radiation is higher.
2.2 Satellite and reanalysis data
2.2.1 Copernicus Atmosphere Monitoring Service (CAMS)
The Copernicus Atmosphere Monitoring Service (CAMS) reanalysis product (Inness et al., 2019) was used to identify the dominant aerosol types over Athens during August 2021. Total AOD, dust AOD, and organic matter AOD at 550 nm were collected and analysed for a 2 × 2 pixel area centred over Athens for a month period in August 2021. The CAMS data are available at an interval of 3 h on a regular longitude–latitude grid (0.75∘ × 0.75∘) and is retrieved using the Copernicus Atmosphere Data Store (ADS, 2022).
2.2.2 Meteosat Second Generation (MSG)
The Spinning Enhanced Visible and InfraRed Imager (SEVIRI) instrument on board geostationary Meteosat Second Generation (MSG) satellites of EUMETSAT provides full earth disc data at different channels every 15 min. In this analysis, the European high-resolution visible cloud RGB product was utilized, which is a product based on the high-resolution visible and IR10.8 SEVIRI channels. These data are advantageous for cloud monitoring in high resolution. The images were analysed for August 2021 in order to identify the events, the initiation of the wildfires, and the smoke plume transport.
2.3 Modelling
2.3.1 Spectral surface solar radiation
The disort (DIScrete Ordinate Radiative Transfer) pseudo-spherical approximation (Buras et al., 2011) of the UVSPEC radiative transfer model that is included in the libRadtran v2.4 package (Emde et al., 2016) was used to simulate the spectral solar irradiance in the range of 290–3000 nm. Radiative transfer simulations were performed for August for the coordinates of the actinometric station of Thissio with a temporal resolution of 15 min. The libRadtran simulations were performed for three different groups of inputs.
-
Case a. In the first case, the simulations were performed for the UV region with SSA = 0.85 and for the VIS and near-infrared (NIR) regions with SSA = 0.95. The inputs included AOD (at 340 nm for UV and at 500 nm for wavelengths above 400 nm), AE (440–675 nm), and the total column of water vapour (WV) that were obtained from the Cimel instrument at NOA. The Cimel measurements were interpolated to the time of the simulations (i.e. for all of August with a step of 15 min).
-
Case b. In the second case, climatological values of AOD (at 340 nm for UV and at 500 nm for wavelengths above 400 nm), AE (440–675 nm), SSA (average of SSA at 440 and 675 nm), and the total column of WV were used, which were derived by analysing Cimel measurements during 2008–2018 (Raptis et al., 2020).
-
Case c. The third case uses AOD = 0 and the total column of WV from the Cimel instrument as inputs.
The total column of ozone from the Brewer was also interpolated to the time of the simulations and was used as input in all the three cases. A default concentration of 420 ppb was assumed for CO2. Surface albedos used were for 0.05 and 0.2 in UV and VIS, respectively. In all these cases, simulations were performed for cloudless conditions assuming climatological profiles of atmospheric molecules corresponding to mid-latitude summer (Anderson et al., 1986) and climatological profiles of the aerosol optical properties (Shettle, 1989). The extraterrestrial spectrum proposed by Kurucz (1994) was used for the simulations.
2.3.2 Aerosol source and transport
For analysing the source and transport of the wildfire plumes, the Hybrid Single-Particle Lagrangian Integrated Trajectory (HYSPLIT) model (Stein et al., 2015) was employed that uses a hybrid of Lagrangian and Eulerian approaches. HYSPLIT is used over the regional to global scale to account for the transport of pollutants, their dispersion, and deposition. In this analysis, 72 and 24 h backward trajectories ending at 12:00 UTC for Athens and PANGEA, respectively, were generated using Global Data Assimilation System meteorological data at seven levels varying from 0.5 to 3.5 km, with an interval of 0.5 km above ground level.
3.1 Description of the event
A series of wildfires that severely affected Athens occurred at three locations, namely Varympompi, North Evia, and Vilia, as shown in Fig. 1. The first source was ∼ 25 km north of Athens, near Varympompi, and affected the air quality from 4 to 9 August with about 8370 ha of area burnt. The second fire source was at a distance of ∼ 190 km, in the northern part of the Evia Island that led to the worsening of air quality from 3 to 11 August and with a burnt area of about 51 000 ha. Another fire source that affected the air quality in Athens from 17 to 19 August was in the northwest at a distance of ∼ 50 km from Vilia, with a resulting burnt area of 9400 ha. Giannaros et al. (2022) reported that a total area of 94 000 ha was burnt collectively by five large wildfires in 2021 in Greece.
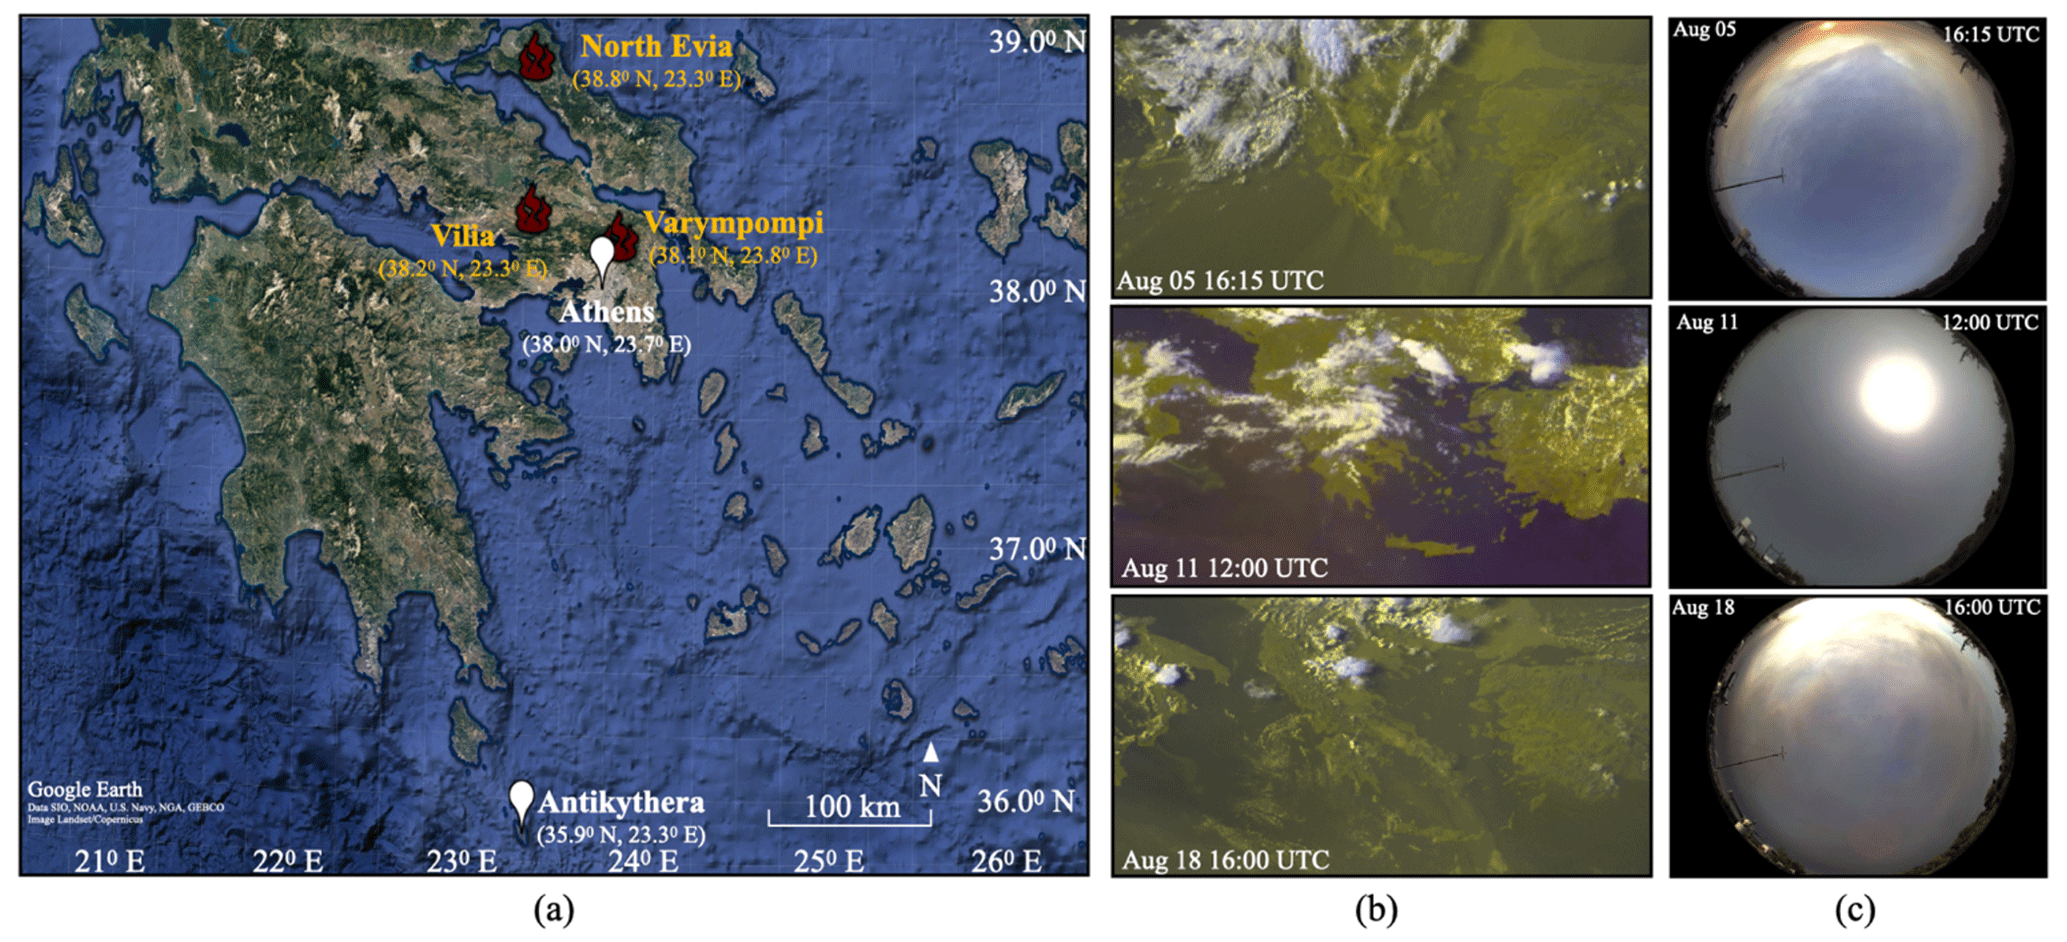
Figure 1(a) Map for the wildfire source sites (in red) and the study region (in white). Base map credits: © Google Earth 2022. Identification of the event on 5, 11, and 18 August using (b) Meteosat Second Generation (MSG) and (c) sky-camera images.
According to NOA records, the summer (June–August) average temperature in Athens over the climatic period 1991–2020 was found to be around 28.5 ∘C, and the average daily maximum temperature was about 34 ∘C over the same period (Fig. A2a in Appendix A). However, the period from the end of July to the beginning of August 2021 was marked by a very high temperature surge, with positive air temperature anomalies of the order of 10 ∘C, compared to the long-term average (34 ∘C) (Founda et al., 2022). Moreover, the relative humidity in the same period was observed to be well below its climatic value (summer average humidity from 1991 to 2020, Fig. A2b). Apart from the temperature and relative humidity, the maximum wind speed from the end of July to early August was found to be around 5.4 m s−1, well below 5 on the Beaufort scale (8.0–10.7 m s−1) (Fig. A2c and d in Appendix). Yet, total precipitation in Athens from March to July 2021 was found to be about 75 % lower than its climatic value (Founda et al., 2022). Such meteorological conditions characterized by warmer-than-average temperatures, extremely dry air, low wind speed, and a precipitation deficit served as the preconditions for the burning of the available fuel and then conversion into massive wildfires. In Giannaros et al. (2022), the authors found that warmer-than-average temperatures and a lack of precipitation catering to the two prolonged (greater than 10 d) heatwaves led to the efficient drying of the fuel until the ignition time, creating a highly flammable fuel. Also, the hot and dry atmospheric layer near the surface helps in maintaining intense burning, as well as the upthrust of the plume.
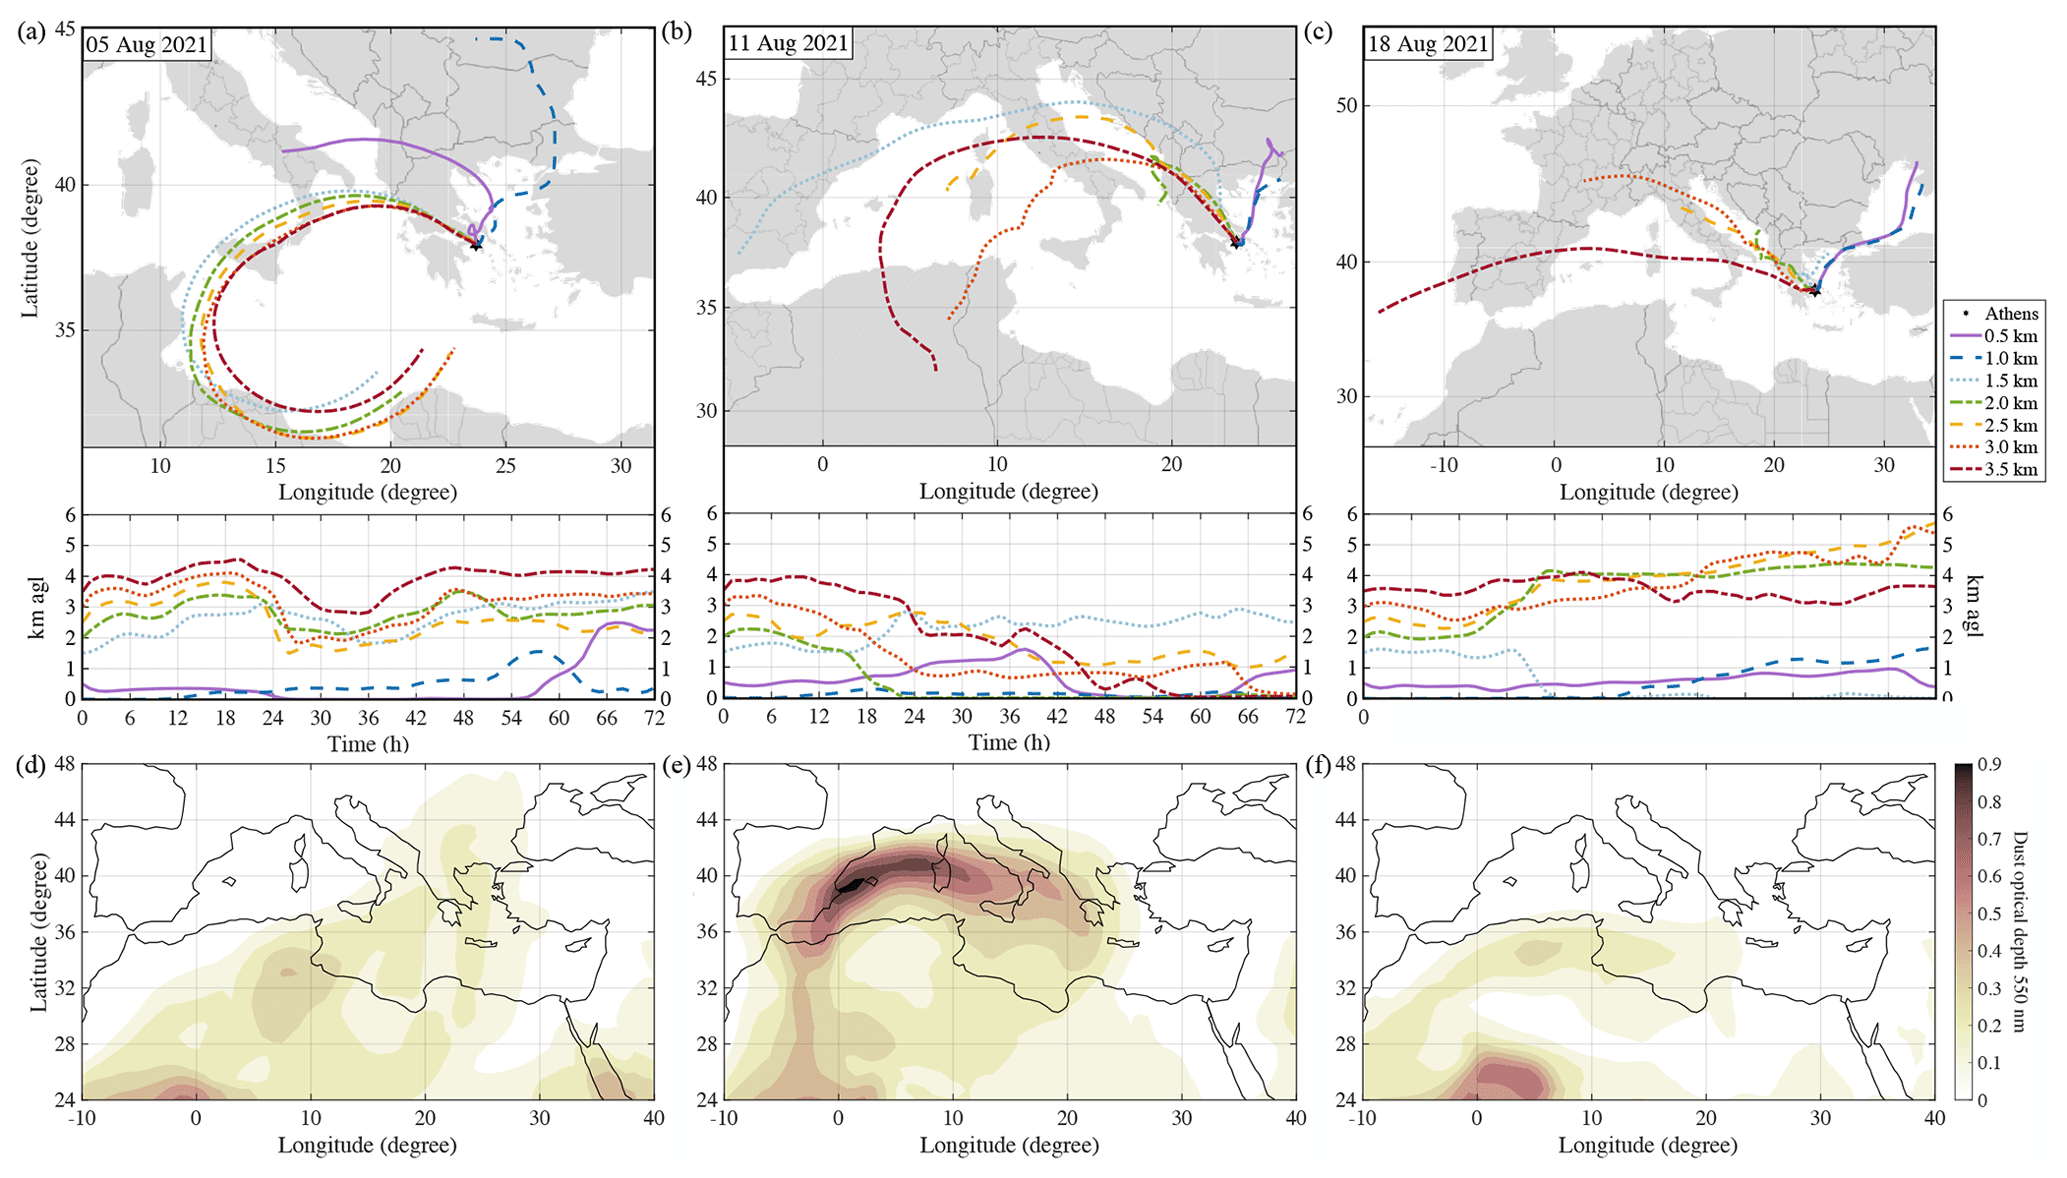
Figure 2Identification of dust transfer to Athens using (a, b, c) HYSPLIT back trajectories ending at 12:00 UTC and (d, e f) Copernicus Atmosphere Monitoring Service (CAMS) reanalysis time-averaged dust optical thickness over 00:00–21:00 UTC.
The spread of wildfire smoke was investigated using the MSG images (15 min frequency), while the presence of smoke over Athens was confirmed by visually inspecting SKYCAM images (available with a frequency of 10 s). Figure 1b presents satellite images from MSG on specific days/hours, which along with the respective sky-camera images (Fig. 1c) for Athens, confirm the presence of smoke in the region. In addition to the prevalent smoke due to wildfires, August 2021 also experienced episodes of dust, as can be seen in the maps of the dust extinction optical thickness from CAMS reanalysis (Fig. 2d and e). HYSPLIT back trajectories confirmed that the origin of air masses on particular days (5 and 11 August) was from the Sahara (Fig. 2a and b). According to CAMS reanalysis and HYSPLIT back trajectories, dusty air mass from northern Africa (Morocco, Tunisia, and northern Algeria) merged over the Mediterranean Sea. As a result, the air over Athens on 5 and 11 August included a mixture of smoke, marine, and dust particles at altitudes below 3 km. On the other hand, 18 August (Fig. 2f) was a dust-free day.
3.2 Impact on air quality
Both primary and secondary aerosols are produced during biomass burning whose chemical composition highly depends on the type of combustion (flaming or smoldering) and environmental conditions (Rickly et al., 2022). The time series of the air quality data are presented in Fig. 3, which shows the daily mean of PM2.5, PM10, NO, and NO2 concentrations (µg m−3) at various sites within GAA. Note that not all stations measure the same air pollutants, which is why the number of stations is different in Fig. 3. It was observed that PM2.5 values were generally below 20 µg m−3 during this period except for the beginning and middle of August (during wildfire events), when, for particular stations that were strongly affected by smoke, they exceeded 60 and 70 µg m−3, respectively (Fig. 3a). Elevated PM10 levels were also found during the same period with values reaching up to 130 µg m−3 (Fig. 3b). PM10 levels were at their maximum in the first week of August due to the presence of wildfire smoke and desert dust over all the stations.
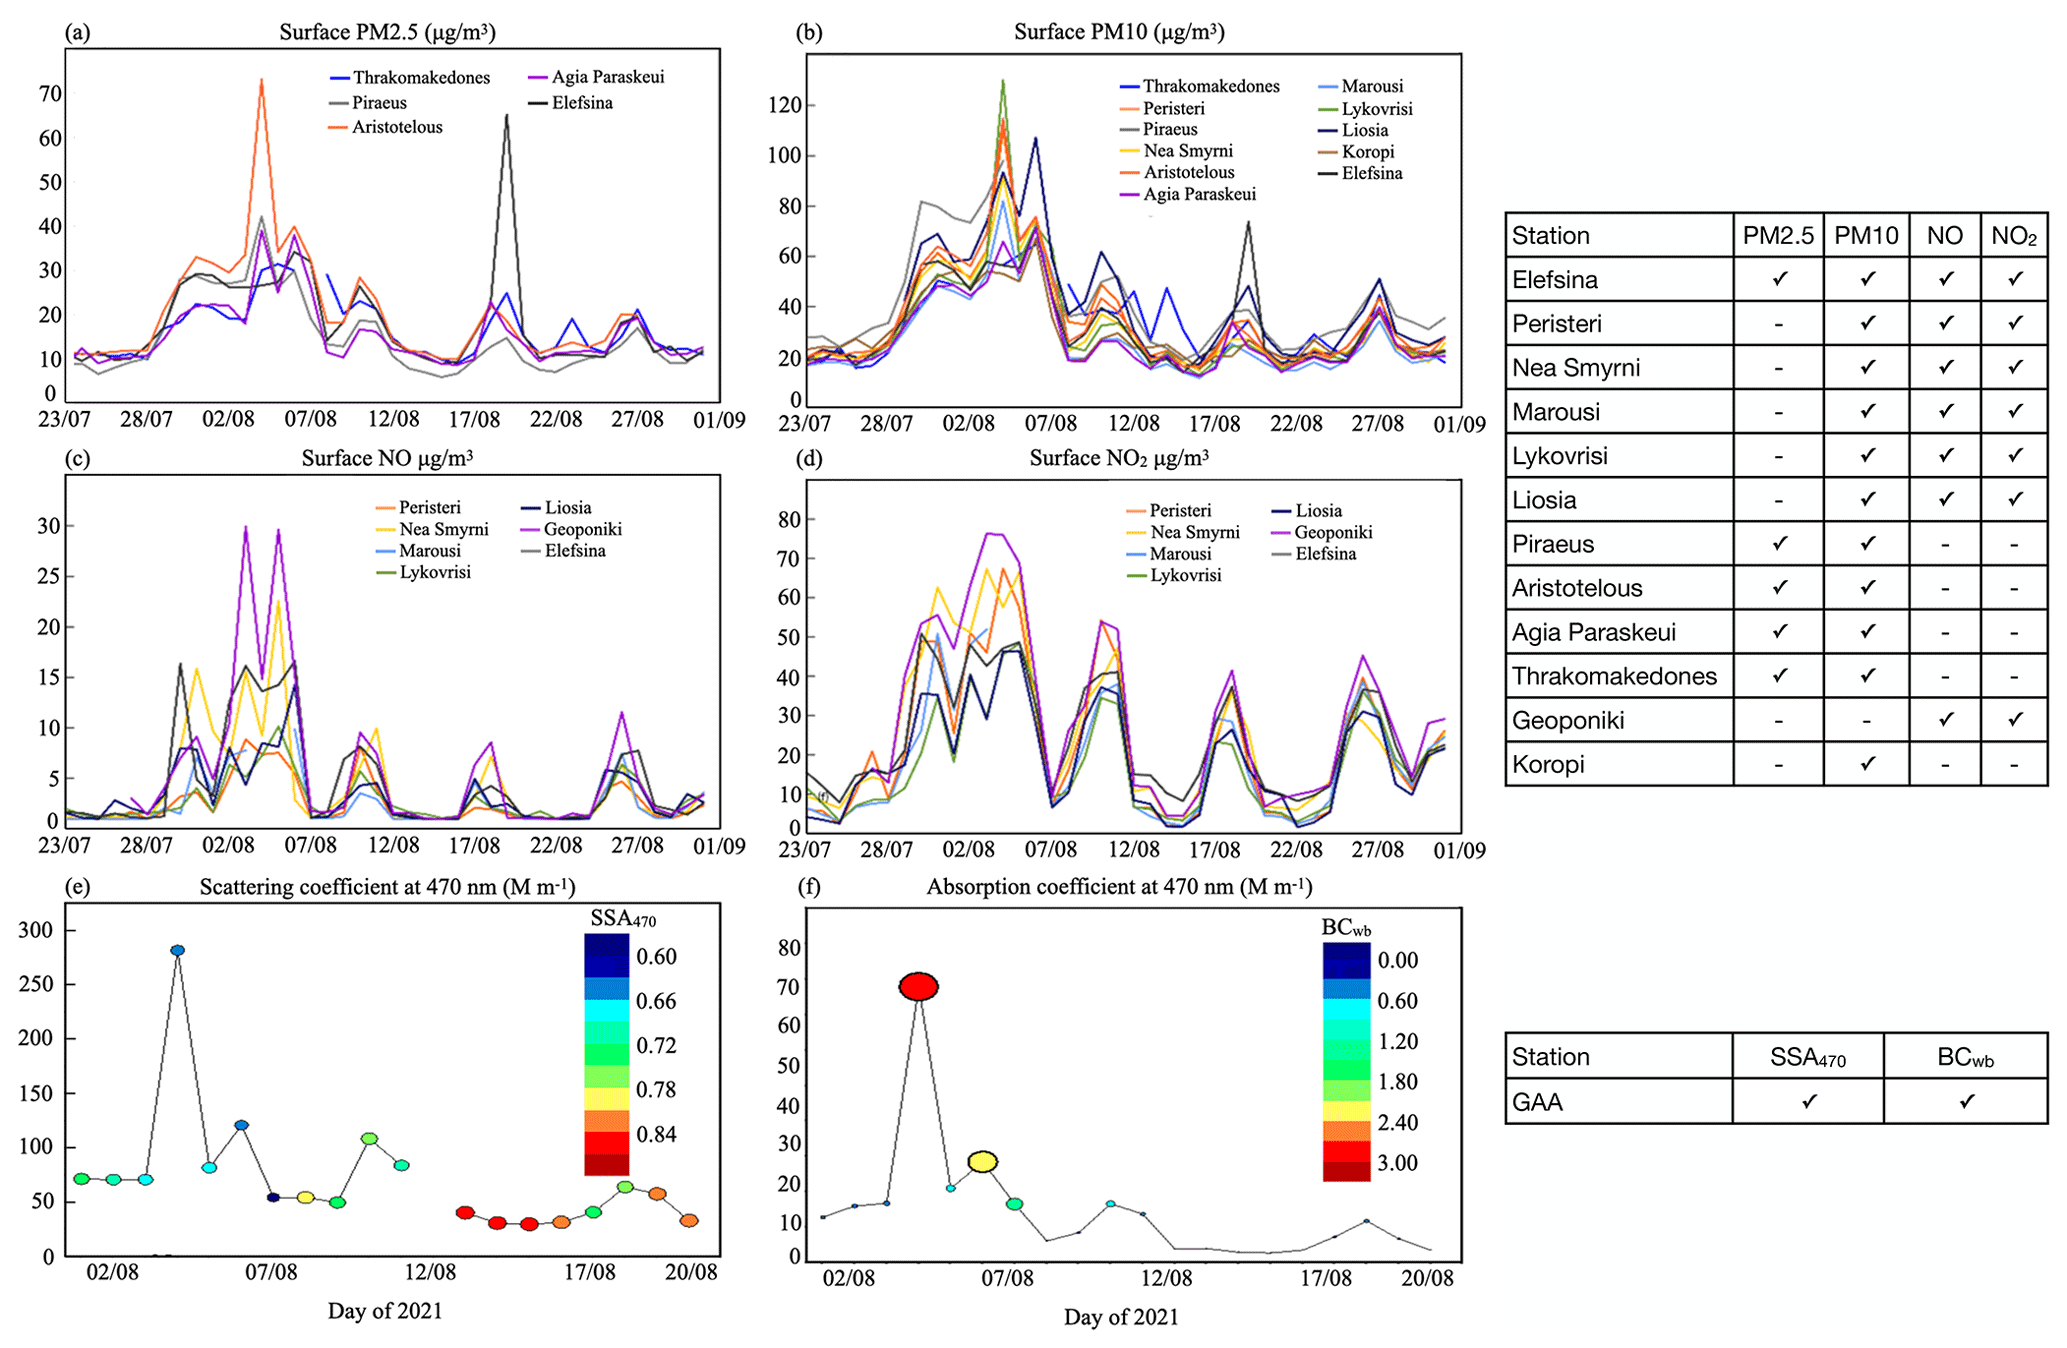
Figure 3Variation in (a) PM2.5 (µg m−3), (b) PM10 (µg m−3), (c) NO (µg m−3), and (d) NO2 (µg m−3) in the greater Athens area (GAA) during August 2021. Temporal variation in the daily mean values for the (e) scattering and (f) absorption coefficients in Athens during 1–20 August 2021. The data points in (e) and (f) are colour-coded as a function of SSA470 and BCwb concentration, respectively. Please note that the date format in this figure is day/month.
NOx is mainly generated during the flaming stage that occurs at high temperatures (Stefenelli et al., 2019). Very high NO and NO2 concentrations were also recorded in the first week of August, as well as on 18 and 19 August, due to the wildfire events that obviously tend to increase NOx emissions (Jin et al., 2021). Daily average NO reached 30 µg m−3 (it is usually below 10 µg m−3), while daily average NO2 reached 75 µg m−3 (it is usually below 30 µg m−3). But it is interesting to note that high NO and NO2 values have also been recorded on days when the aerosol mixture is mainly constituted of dust (e.g. 11, 26, and 27 August). Elevated NO NO2 levels during dust events have been also reported in other studies (Milford et al., 2020). An increase in the total column of NO2 (Fig. 3d) is generally in agreement with the increase in surface NO2 concentration. According to our analyses, increased NOx levels coincide with the presence of smoke and dust aerosols and/or low wind speeds (see Appendix Fig. A2). Low wind speed also favours increased NO2 concentrations in urban environments, as NOx concentrations are found to be in negative correlation with wind, precipitation, and relative humidity (Liu et al., 2020). Also, total NO2 columns increased up to 6 times from the climatological mean during the forest-fire period (Fig. A3). High values of total column SO2 were also observed during the first week of August (highest on 7 August) and, then, later on 19 August, with values reaching as high as 8 and 6 DU (Dobson unit), respectively (Appendix Fig. A3), while the climatological average is ∼ 1 DU. During wildfire events, unusually large amounts of SO2 also have been observed in previous studies (Rickly et al., 2022; Weber et al., 2021; Ren et al., 2021).
The daily evolution of the near-surface aerosol scattering coefficient (bsca,470) clearly detects the effect of Attica forest fires on the light scattering (Fig. 3e), with a daily mean bsca value of 282 Mm−1 on 4 August and enhanced (> 100 Mm−1) bsca values on other days (like 6 and 10 August) significantly affected by transported smoke plumes over Athens. The mean SSA660 during the measuring period was found to be 0.77 (0.02 higher than SSA470), while under intense smoke conditions (4 August), this difference increased to 0.05 (SSA660 = 0.70), suggesting the enhanced presence of brown carbon (BrC) aerosols. The peak values of the aerosol absorption coefficient (babs) on 4 and 6 August, associated with higher BCwb concentrations, are characteristic of the strong smoke effect on light absorption, while this effect was much more intense at 370 nm (babs,370 = 156.7 Mm−1 on 4 August). The BCwb concentrations in August 2021 (0.43 ± 1.21 µg m−3) were much higher – and variable as well – than the 4-year August mean value of 0.22 ± 0.20 µg m−3 (Liakakou et al., 2020).
3.3 Aerosol columnar optical and microphysical properties
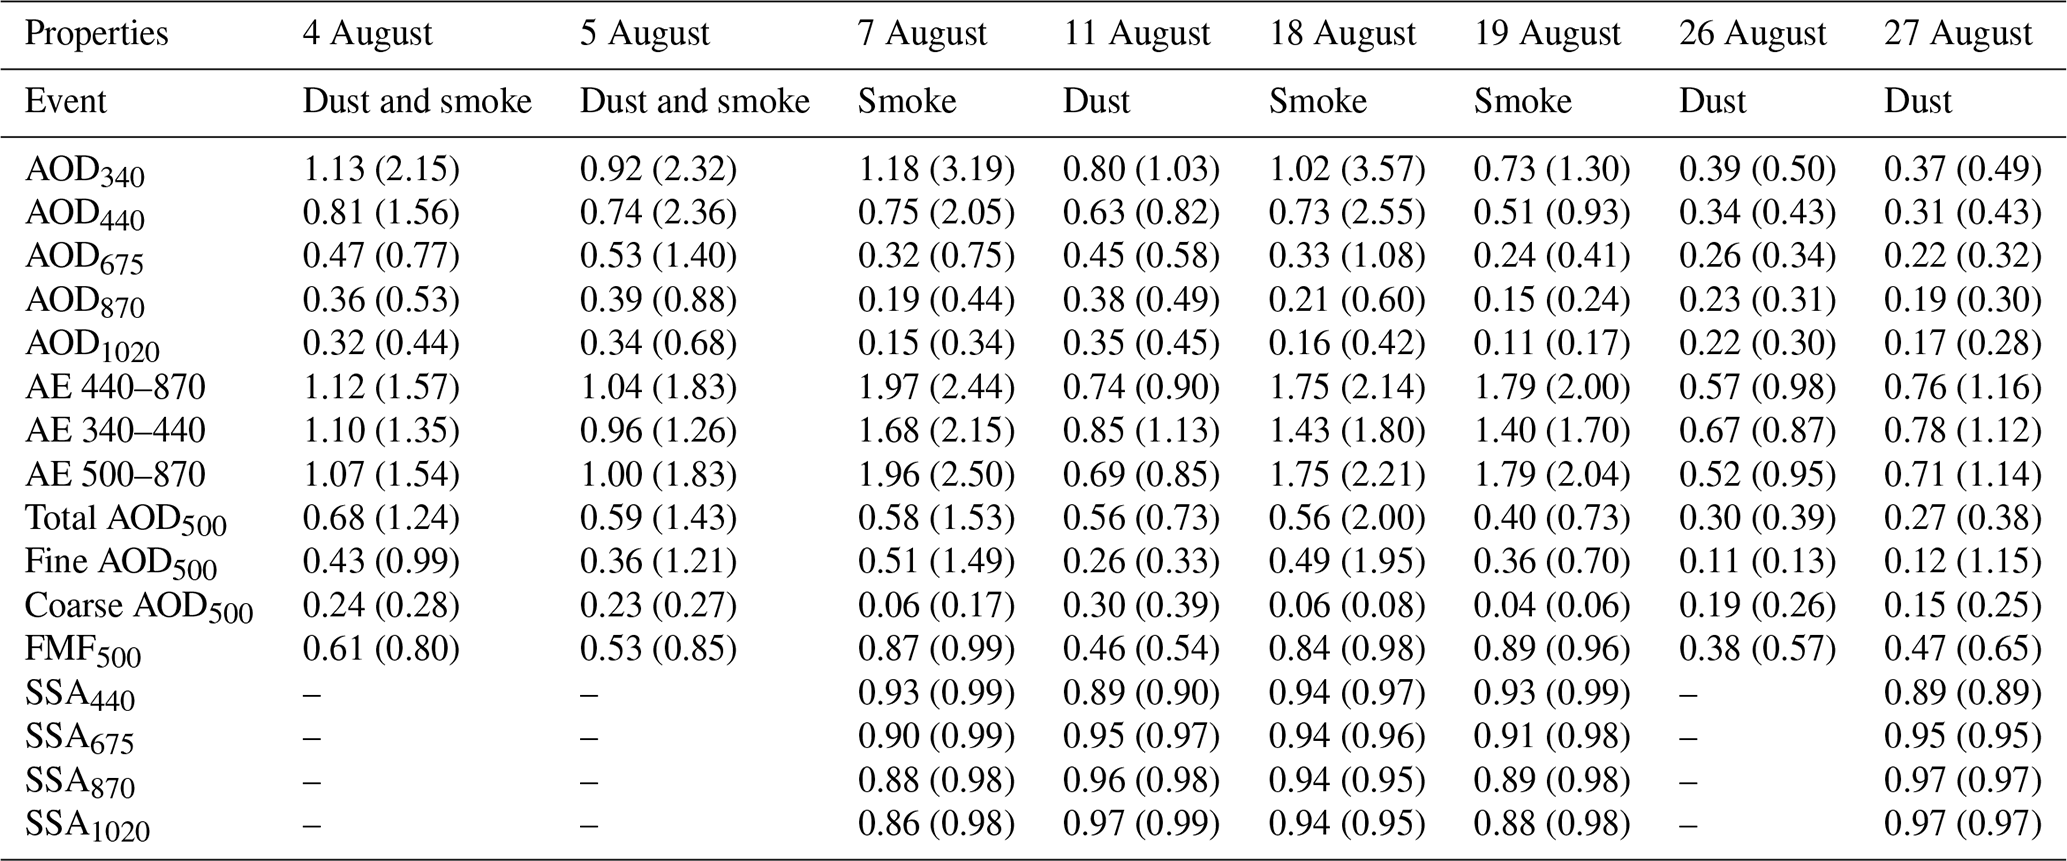
Figure 4a shows the variation in AOD at five wavelengths, namely 340, 440, 675, 870, and 1020 nm (from now on referred as C5), and AE at 440–870 nm, while Fig. 4b presents the variation in the fine-mode, coarse-mode, and total AOD at 500 nm and the fine-mode fraction during August 2021. For Fig. 4, AERONET Level 2.0 data were used except for the days with high dust and/or smoke events when Level 1.0 direct sun and Level 1.5 inversion products were used, as mentioned in Sect. 2.1.2. Extremely high levels of fine-mode AOD were recorded, up to 1.95 at 500 nm on 18 August, due to the presence of smoke, with the high fine-mode fraction reaching 0.99 (99 %) during these days. When dust aerosols were dominant, the fine-mode fraction was much lower, e.g. 0.36 on 11 August. On other days with a strong effect from smoke and dust (i.e. 4 and 5 August), the coarse-mode AOD was relatively higher. The detailed values of aerosol properties on these days are presented in Appendix Table A1.
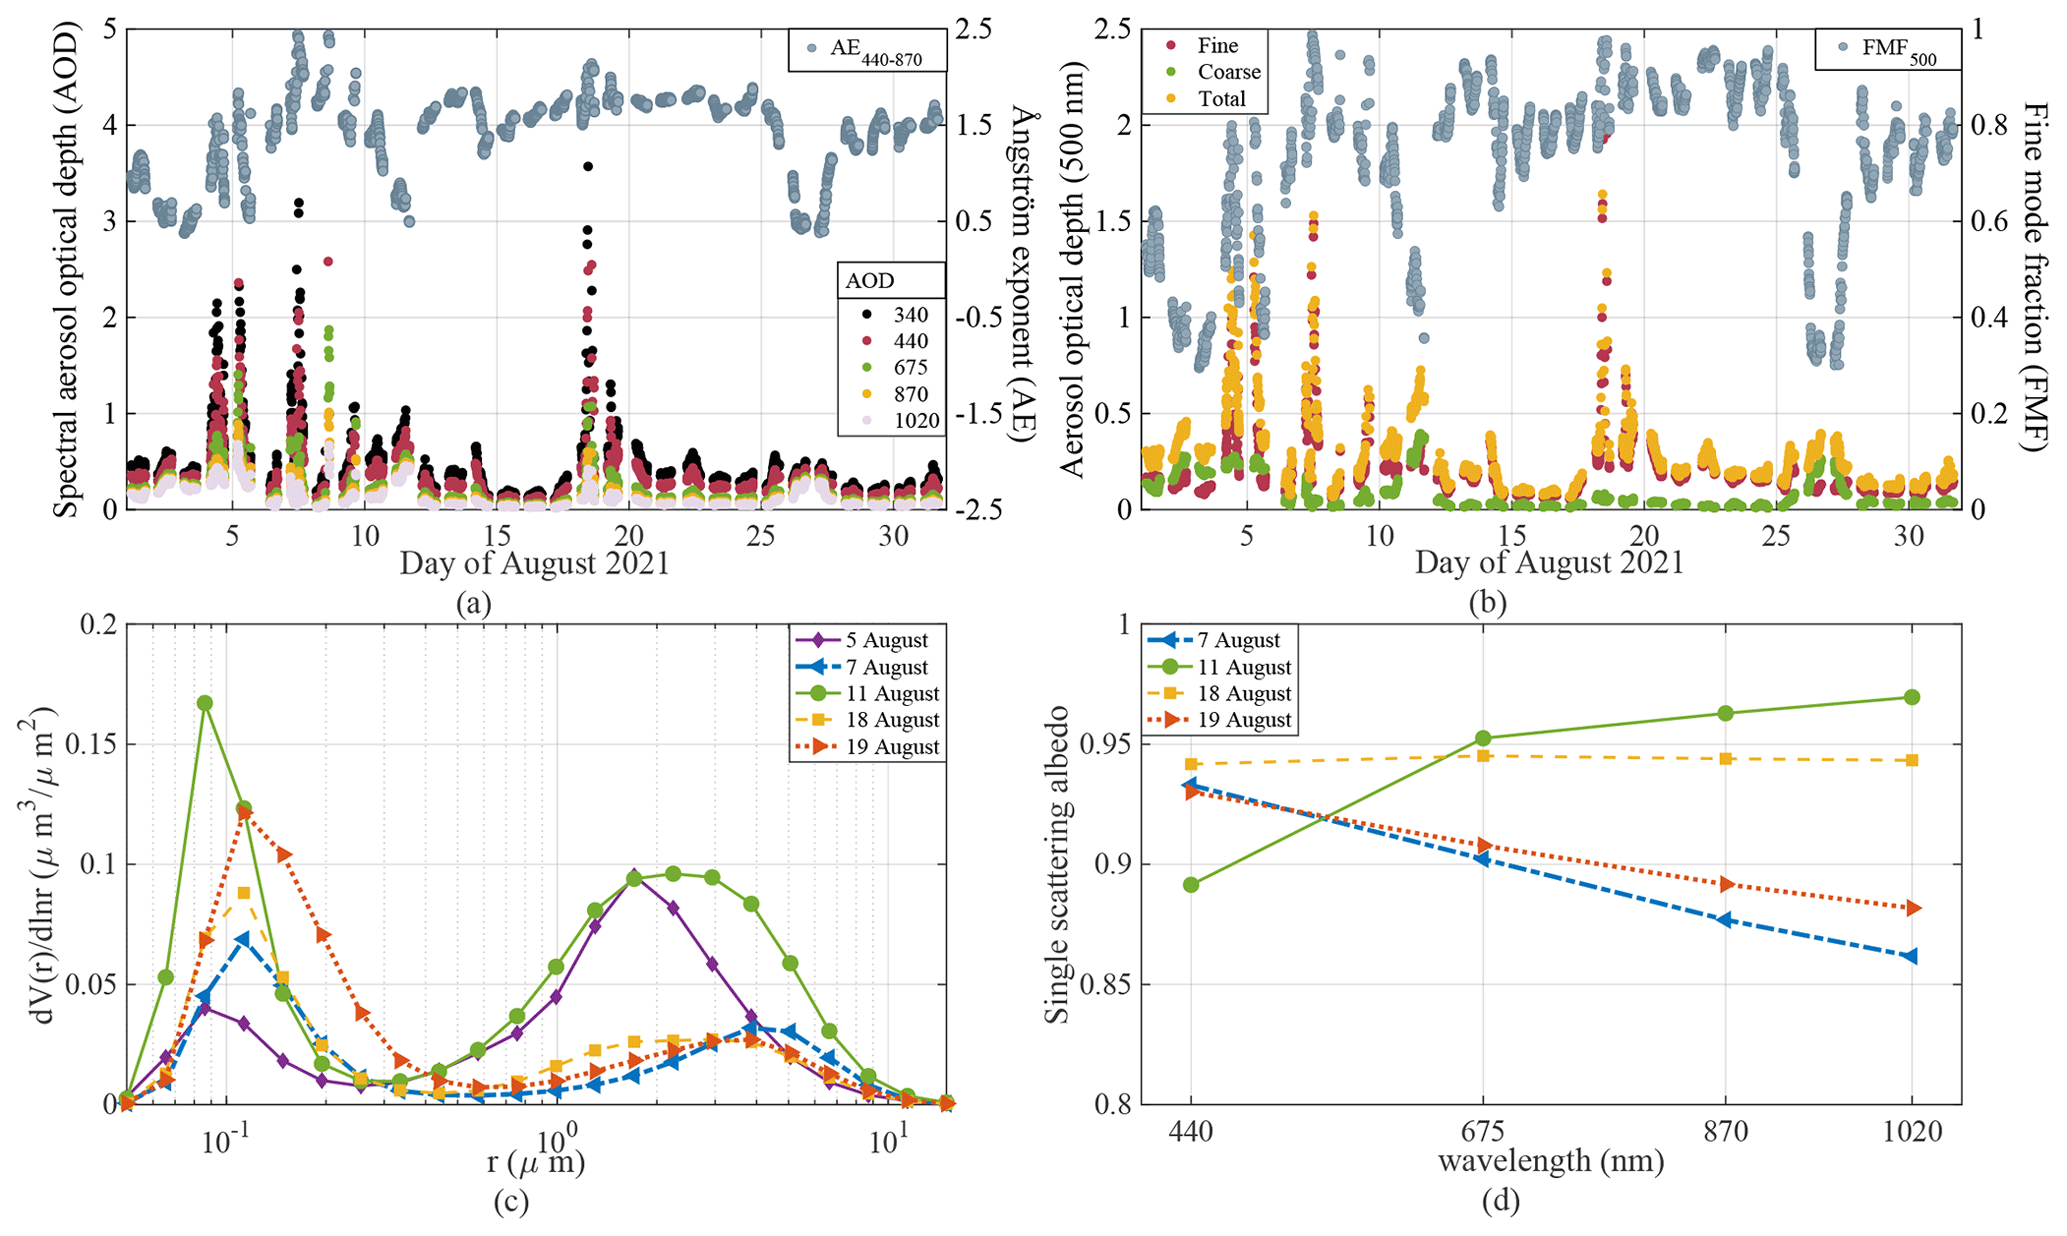
Figure 4Variation in (a) spectral aerosol optical depth, (b) fine- and coarse-mode AOD at 500 nm, (c) daily mean volume particle size distribution, and (d) single-scattering albedo during the wildfire event in Athens. The missing lines for 4 and 5 August (c, d) are due to the available data at Level 1.5 not meeting our filter criteria for the inversion products on these days.
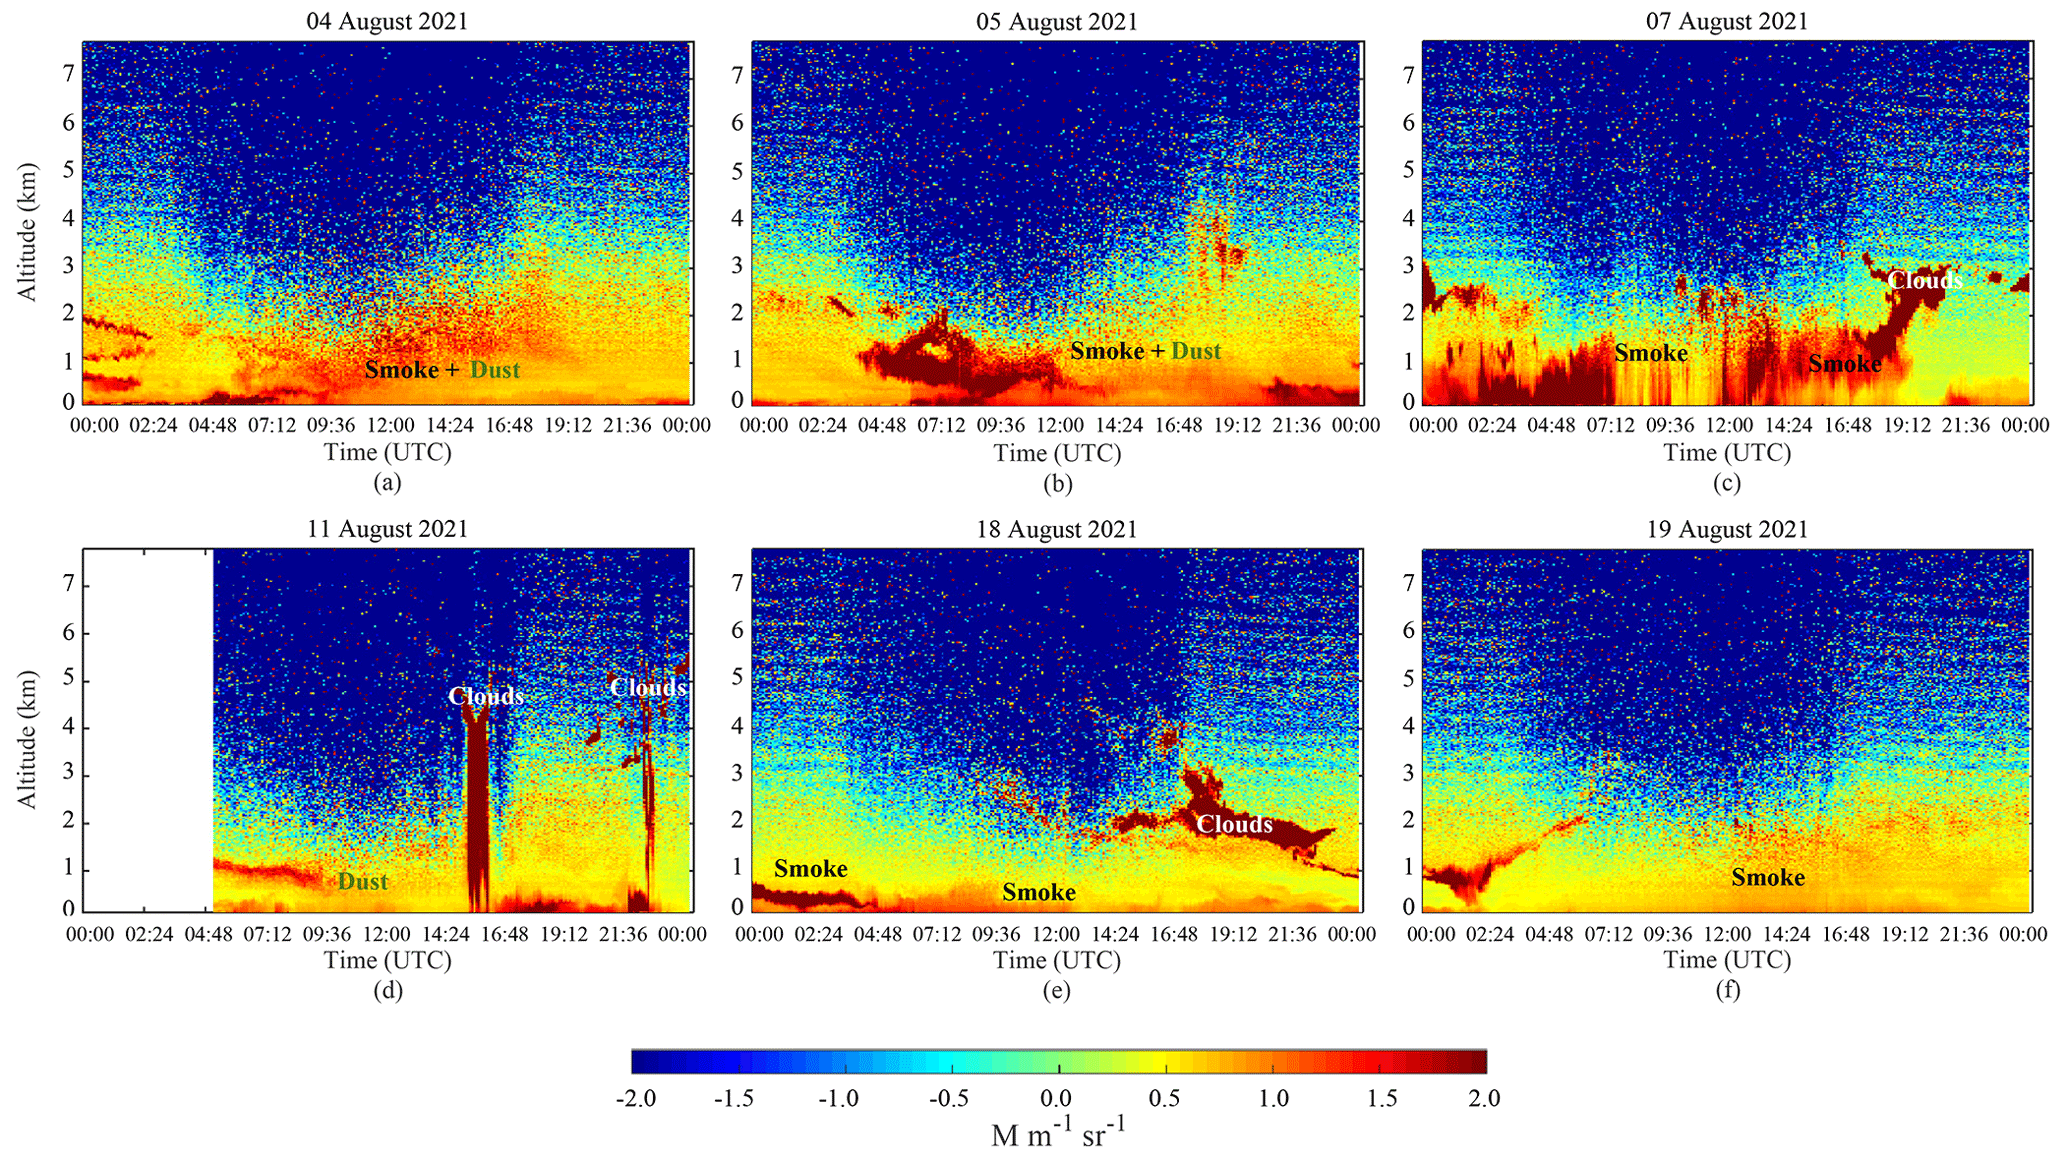
Figure 5Variation in (a) spectral aerosol optical depth, (b) fine- and coarse-mode AOD at 500 nm, (c) daily mean volume particle size distribution, and (d) single-scattering albedo during the wildfire event in Athens. The missing lines for 4 and 5 August (c, d) are due to the available data at Level 1.5 not meeting our filter criteria for the inversion products on these days.
Table 2Average aerosol properties (maximum values in brackets) for smoke and/or dust events in August 2021.
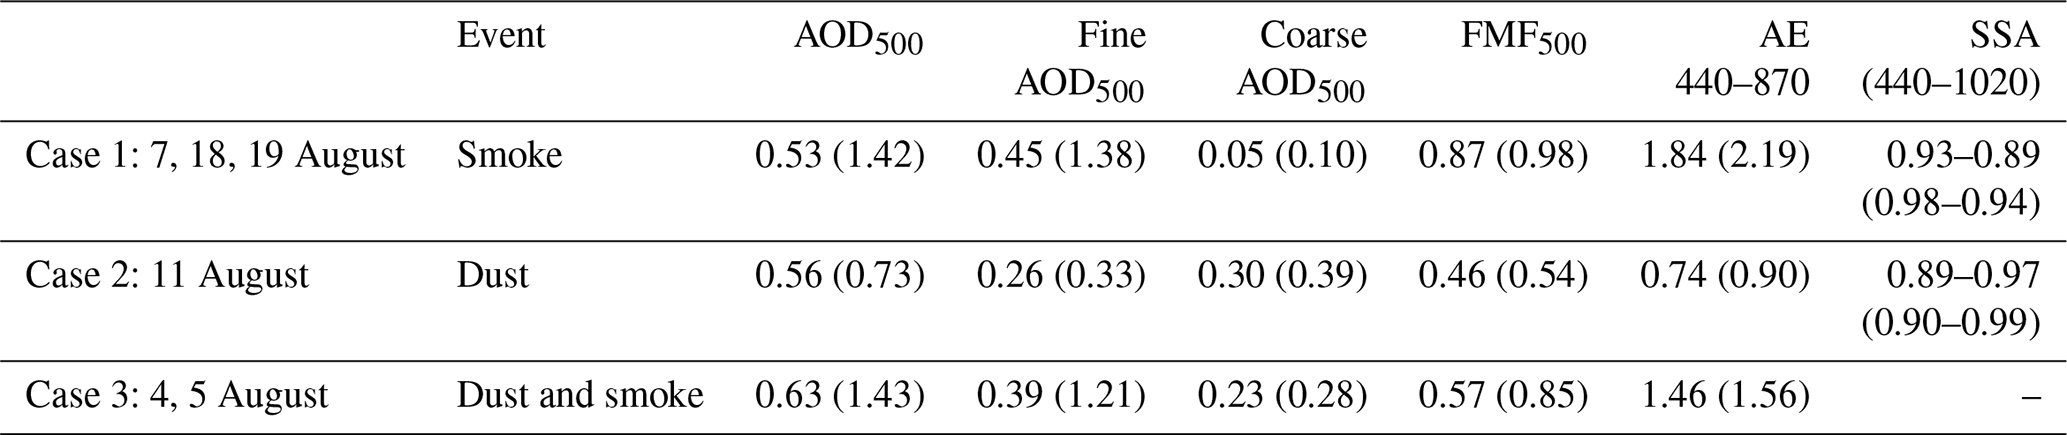
FMF: fine mode fraction. AE: Ångström exponent. SSA: single scattering albedo.
Figure 4c and d present the volume particle size distribution and variation in columnar SSA on specific days in August 2021 in Athens, which are produced using the daily averages of 22 logarithmically equidistant discrete points in the size range varying from 0.05 to 15 µm and daily average SSA values (at 440, 675, 870, and 1020 nm), respectively. There were six interesting cases observed in Athens (with AOD values equal to 1 or above) on 4, 5, 7, 11, 18, and 19 August. For these days, Fig. 5 shows the time–height distribution of aerosol layers in the atmosphere using the attenuated backscatter collected by the ceilometer at Thissio, Athens. The most notable aerosol layers were observed from 4 to 7 August, on 11 August, and from 18 to 19 August. Henceforth, we consider three cases: case 1 with only smoke, case 2 with dust, and case 3 with both dust and smoke. The variations in the aerosol properties in these three cases are presented in Table 2.
3.3.1 Case 1: smoke
On 7, 18, and 19 August, only smoke was present; 7 August was characterized by very high AOD values varying from 3.19 to 0.34 at C5 with the mean and maximum AE being 1.97 and 2.44, respectively. The high values of AE denote the dominance of small smoke particles in the aerosol mixture; 18 August was characterized by maximum values of AODs between 3.57 and 0.42 at C5, and AE showed a mean and maximum value of 1.75 and 2.14, respectively. The particle size distribution on these days had the dominance of accumulation mode (Fig. 4c). A strong absorption characteristic and strong spectral dependence is observed on 7 August when the SSA is seen to monotonically decrease with wavelength from 0.93 at 440 nm to 0.86 at 1020 nm, indicating the presence of smoke (Reid and Hobbs, 1998; Dubovik et al., 2000), while the lower SSA values in this day indicate the presence of strong absorbing aerosols (Kaskaoutis et al., 2021; Wu et al., 2021). A highly intensified aerosol layer is observed below 2 km altitude on 7 August as it appears from Fig. 5c, which persists for the entire day. On 18 August, a dense floating aerosol layer can be seen before about 03:00 UTC that descends down and gets mixed in the boundary layer (Fig. 5f). This aerosol layer remained there throughout the day.
3.3.2 Case 2: dust
On 11 August, dust was dominant in the aerosol mixture. The AOD at C5 reached maximum values varying from 1.03 to 0.45, respectively, and the AE displayed an average and maximum value of 0.74 and 0.90, respectively. The average fine-mode, coarse-mode, and total AODs at 500 nm and fine-mode fraction were observed as 0.26, 0.30, 0.56, and 0.46, respectively. Low AE on 11 August indicates the presence of larger particles (Pace et al., 2006) which, as can be seen in Fig. 2, are dust particles that have been transported to Athens, and the size distributions is bimodal with dominance by the coarse mode (Fig. 4c). From Fig. 4d (and in Appendix Table A1), the SSA on 11 August is seen to increase with wavelength from 0.89 at 440 nm to values above 0.97 at wavelengths between 675 nm and 1020 nm, which signifies large forward scattering due to the presence of dust particles (Gómez-Amo et al., 2017). This is a typical spectral behaviour of dust aerosols having more absorption in UV than in the near-infrared region (Dubovik et al., 2002; Derimian et al., 2008). From Fig. 5d, it is seen that on 11 August there was a floating dust aerosol layer around 1 km altitude until 10:00 UTC and after 16:00 UTC.
3.3.3 Case 3: smoke and dust
4 and 5 August were characterized by the presence of both dust and smoke. On 4 August, the maximum AOD values at C5 varied from 2.15 to 0.44, respectively, while the corresponding variation on 5 August was from 2.32 to 0.68, respectively. The maximum AE at 440–870 nm was found to be 1.57 and 1.83 for 4 and 5 August, respectively. An enhanced aerosol layer was present throughout the day on 4 August below 2 km (Fig. 5a). Figure 2a indicated the transport of Saharan dust to Athens, thus signifying the presence of both smoke and dust on 5 August. On 5 August, there was a large difference in the average and maximum AE at 440–870 nm (Appendix Table A1). For that particular day, a constant dust layer and a smoke layer decreasing from morning to afternoon led to a decrease in AOD and in AE during the day. A dense floating layer of aerosol is observed on 5 August (Fig. 5b) at about 1 km altitude and mostly below 2 km around 07:00 UTC. During the nocturnal hours, the highlighted aerosol layers are observed below 1 km altitude. Also, in Gómez-Amo et al. (2017), the authors found that the wildfire-related smoke event and a dust episode were simultaneously detected, and the dust–smoke mixing was found to enhance the aerosol load and modify the aerosol properties. The bimodal size distribution of the mixture was found to be dominated by smoke and dust in fine and coarse modes, respectively.
3.4 Aerosol properties from CAMS and SKYCAM
Figure 6a shows the total, organic matter, and dust AODs from CAMS. It is observed that the organic matter AOD is high on 7 August and between 17 to 19 August, while the dust AOD on these days is low. The dust AOD is high on 11 and 27 August, while it also presented enhanced values from 1 to 5 August, when the organic matter AOD is also high (4 and 5 August) due to the smoke effect. Figure 6b and c compare the daily average AODs from the Cimel instrument with those from CAMS and SKYCAM retrievals. For this comparison, the AOD from CAMS at 550 nm has been extrapolated to 500 nm, using the daily average AE from the Cimel instrument. It must be noted that the SKYCAM retrievals used for the calculation of daily averages were simultaneous with the Cimel AOD retrievals. For most days, SKYCAM gives higher values than the Cimel instrument, with the difference between the AODs being less than 0.1 (Fig. 6c). However, during intense smoke events, the differences are much larger, up to 0.2. Similarly, the differences between the AODs from CAMS and the Cimel instrument are also below 0.1, with the exception of days with dust or smoke events. Dust AOD is generally overestimated by CAMS (e.g. by 0.2 on 11 August). During smoke events, differences between CAMS and the Cimel instrument are again larger.
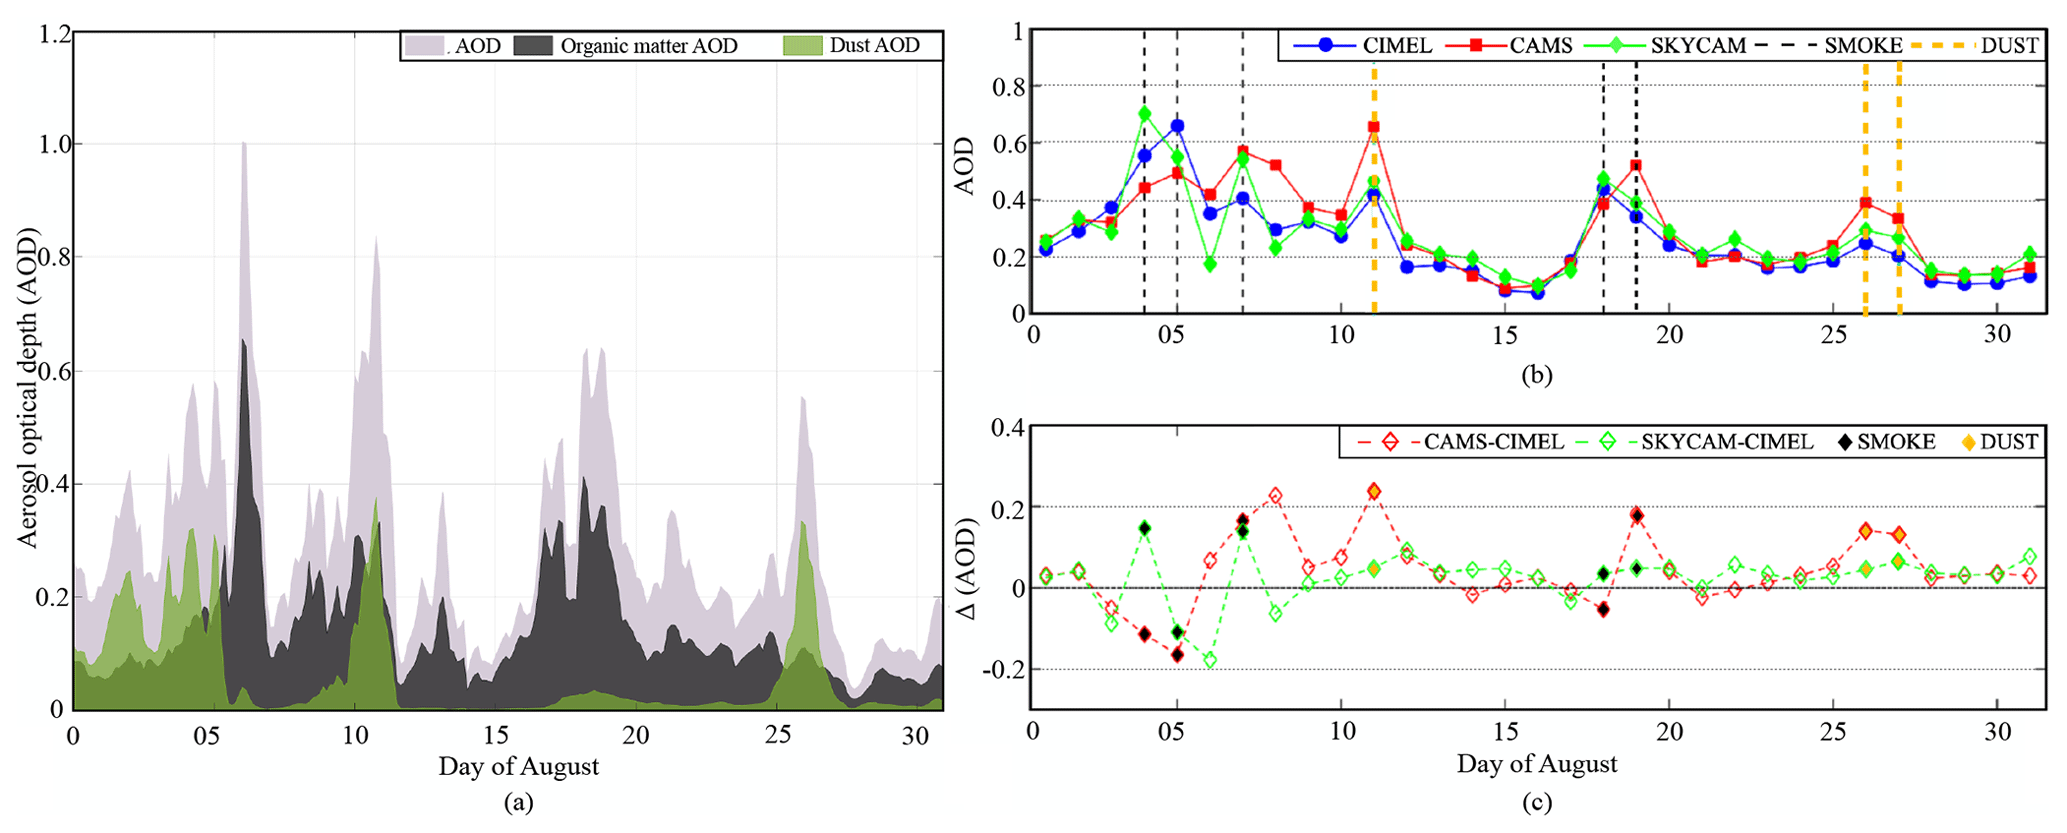
Figure 6(a) Total, organic matter, and dust AOD from CAMS at 550 nm. (b) Comparison of AOD from the Cimel instrument with AODs from CAMS and SKYCAM at 500 nm (see text). (c) AOD differences between CAMS and the Cimel instrument and between SKYCAM and the Cimel instrument at 500 nm.
3.5 Transport to PANGEA
On 7 August smoke was detected from the PollyXT lidar at NOA above the PANGEA observatory at altitudes of 0.5–3.0 km above the surface. Figure 7 shows the attenuated backscatter coefficient at 1064 nm for the PollyXT lidar at NOA and the 24 h air masses back trajectories above the station (ending at 12:00 UTC on 7 August 2021) from HYSPLIT model simulations (Fig. 7b). Wildfire aerosol sources and transports, lidar measurements, and analyses with the HYSPLIT model confirm that the smoke plume was transferred to PANGEA from various fire events, as can be seen from the layers below 3 km in Fig. 7a.
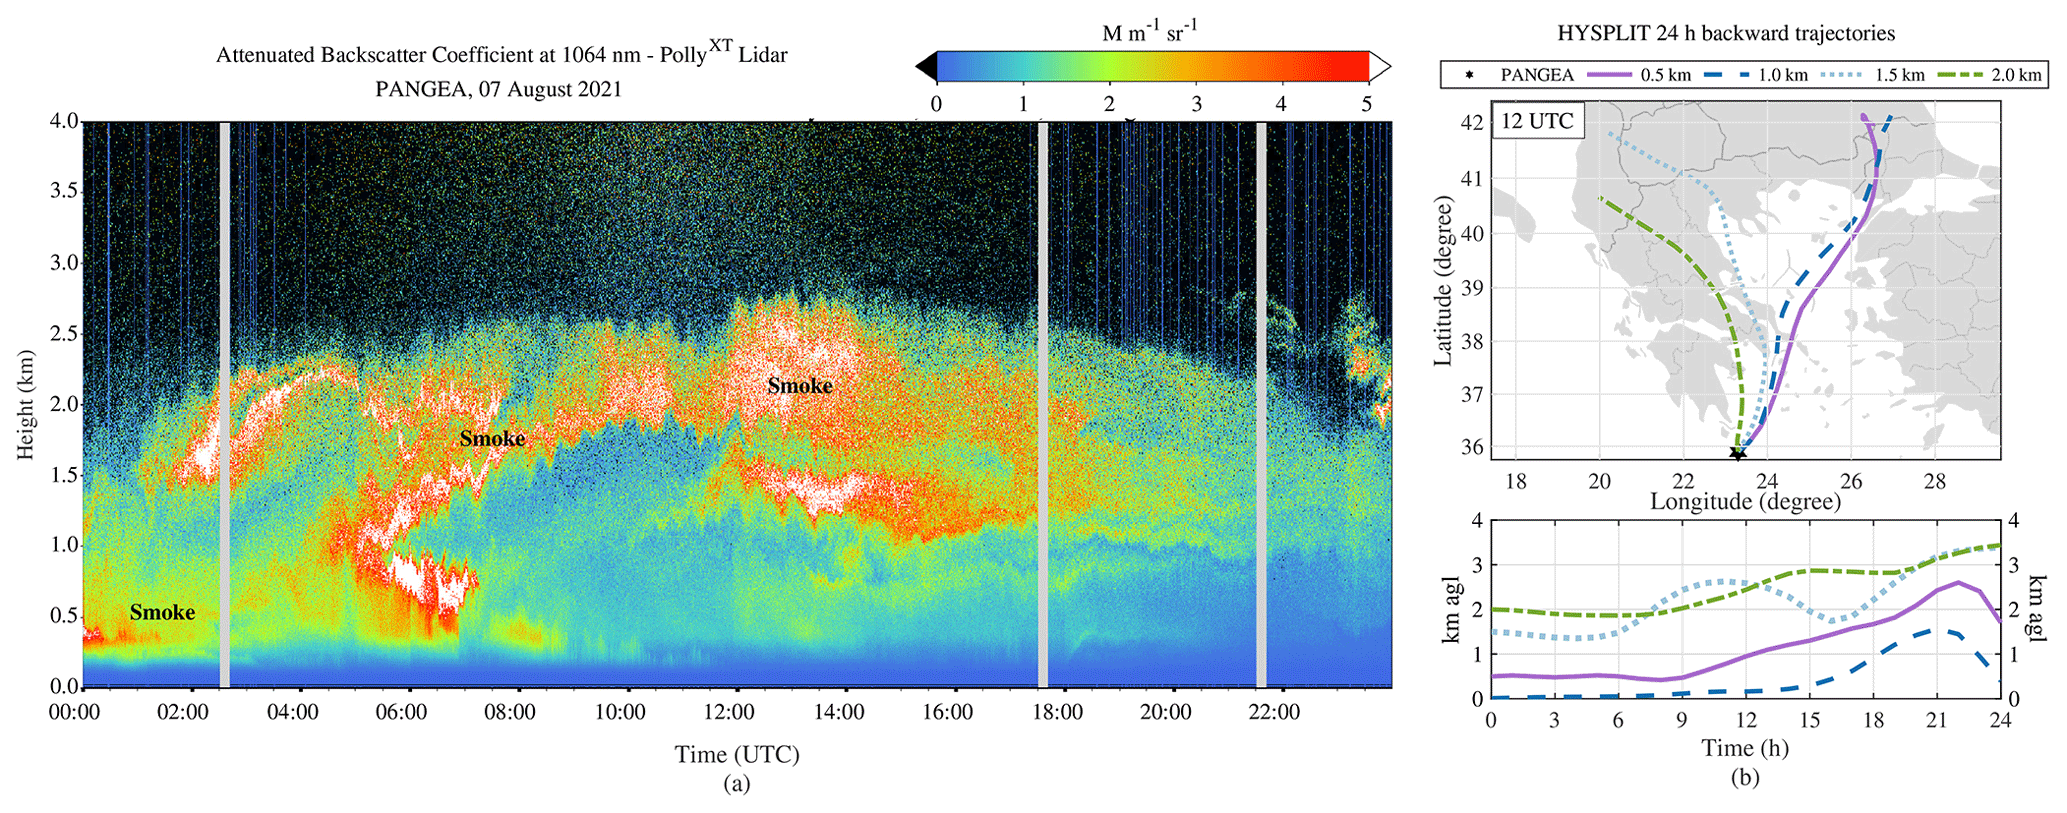
Figure 7(a) Lidar attenuated backscatter coefficient at 1064 nm and (b) HYSPLIT 24 h backward trajectories ending at 12:00 UTC on 7 August 2021 over PANGEA.
On the morning of 7 August aerosol concentrations above PANGEA were increased at different heights, probably as a result of remaining smoke plumes of a fire that started and also ended on 6 August in the southern Peloponnese (Mani Peninsula), an area close to the island of Antikythera (PANGEA). Air mass trajectories also showed that smoke from the main Attica and Evia fires arrived at PANGEA (at altitude below ∼ 1500 m) in the midday of 7 August (Fig. 7a), possibly mixed with smoke from wildfires that were burning in the Peloponnese (at altitude above ∼ 2000 m) during the previous day and/or night. The fire on the Mani Peninsula on 6 August can be seen in Aqua MODIS satellite images (see for instance Aqua MODIS-corrected reflectance, NASA Worldview; https://go.nasa.gov/3SEK9XK, last access: 10 May 2023; MODIS, 2023).
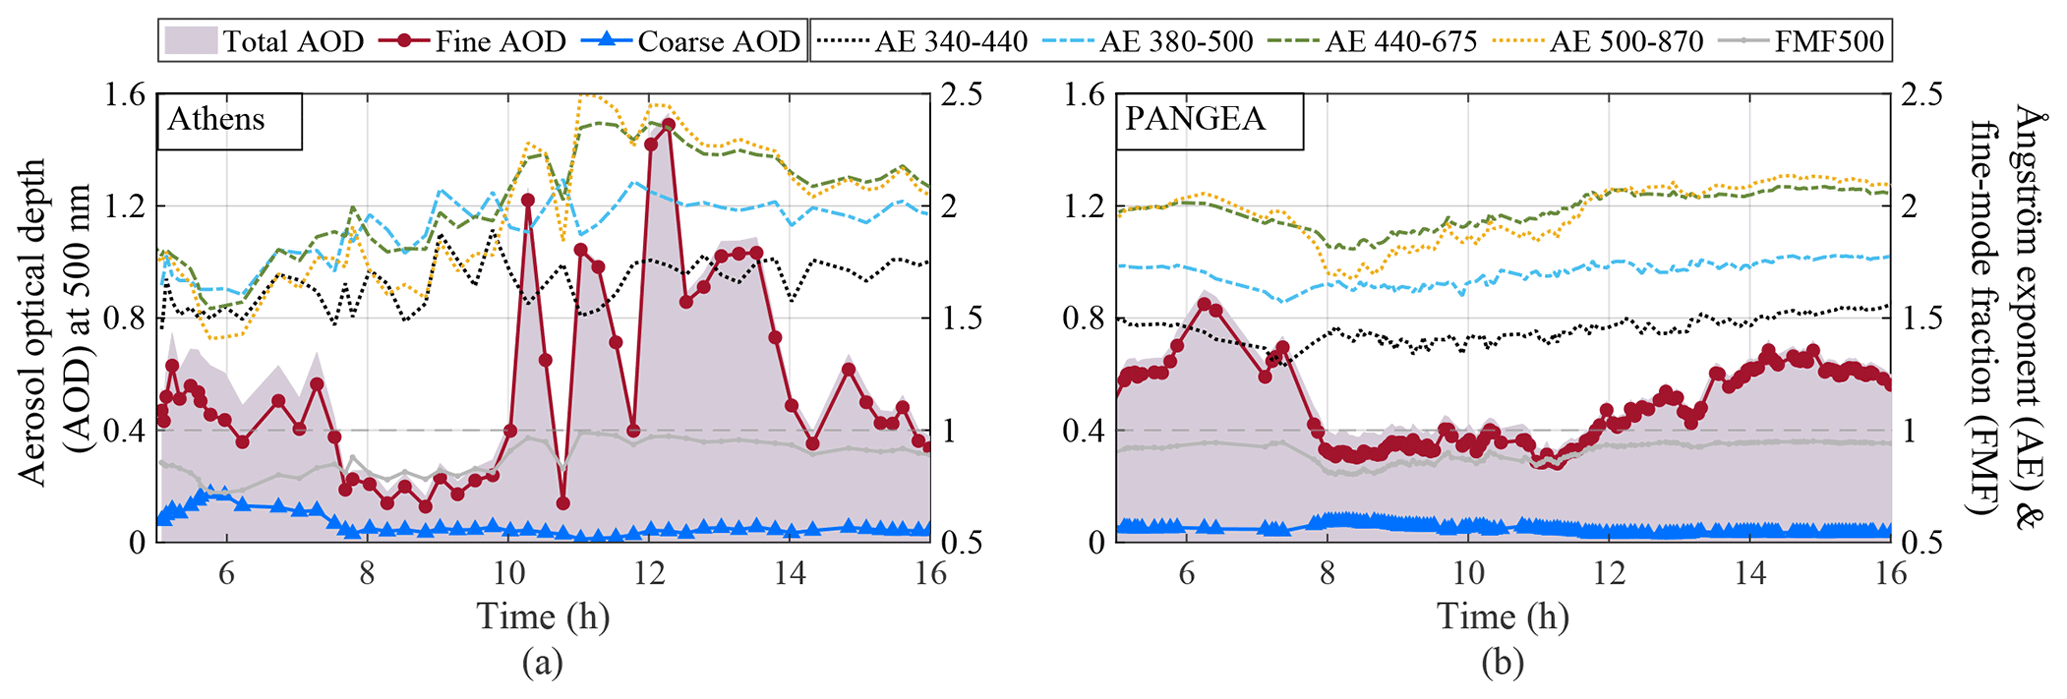
Figure 8Variation in total, fine-mode, and coarse-mode AOD at 500 nm and Ångström exponents (a) in Athens (AERONET Level 1.0) and (b) at PANGEA (AERONET Level 2.0) during the wildfire event of 7 August 2021.
Figure 8 presents the diurnal variation in total, fine-mode, and coarse-mode AODs at 500 nm and AEs on 7 August 2021. In Athens, high AOD values (up to ∼ 0.75) were observed in the early morning hours that were further increased after 10:00 UTC (up to ∼ 1.53), which were accompanied by a high fine-mode fraction. The AE for both stations was found to be above 1 for the entire day. The lower AE values at 340–440 nm compared to those at 500–870 nm indicate a negative curvature effect, signifying the dominance of fine particles (Schuster et al., 2006). At PANGEA, AOD was high in the morning (∼ 0.90) and afternoon (∼ 0.72) hours of 7 August (due to the Athens fire transport), with a significantly high fine-mode AOD (∼ 0.85 and ∼ 0.68, respectively) and high fine-mode fraction. The fires of the southern Peloponnese may have also affected the air composition on 7 August at PANGEA.
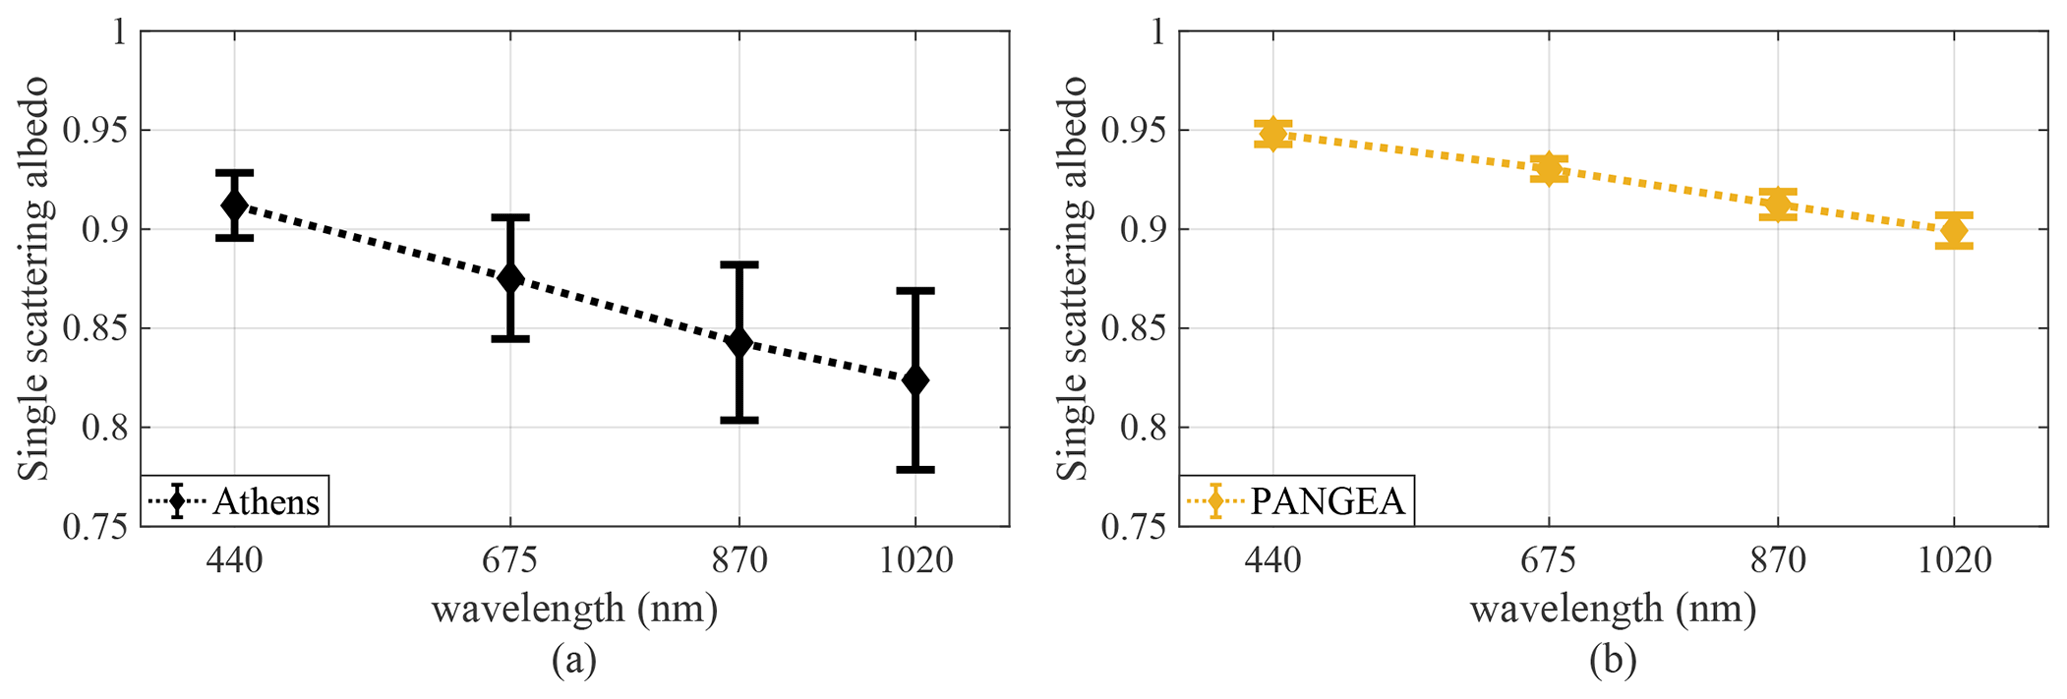
Figure 9Single-scattering albedo for (a) Athens (AERONET Level 1.5 with filters as mentioned in Sect. 2.1.2) and (b) PANGEA (only afternoon measurements from AERONET Level 2.0 inversion) for 7 August 2021.
Figure 9 shows the daily averaged spectral SSA variations from 440 to 1020 nm on 7 August, when smoke was present over Athens and over PANGEA (only afternoon values). The median SSA value at PANGEA decreases monotonically from 0.95 at 440 nm to 0.90 at 1020 nm. In Athens, the median SSA value was found to have a more drastic decrease from 0.91 at 440 nm to 0.82 at 1020 nm. It should be noted that Level 1.5 inversions were used for SSA retrievals in Athens from the Athens NOA station and one morning measurement was taken from the Athens NTUA station to get the average SSA of the day. The SSA decreasing with wavelength indicates the presence of fine smoke, which is evident for both stations. Higher SSA values in the afternoon of 7 August at PANGEA, compared to Athens, could be an indication of changing optical properties of smoke through transport and ageing processes that reduced the absorbing capability (Dasari et al., 2019; Eck et al., 2023). However, the presence of smoke from the Peloponnese local fire makes this assumption quite uncertain.
3.6 Effect on solar radiation
3.6.1 Spectral and total solar radiation
Finally, we calculated the attenuation of solar radiation by dust and smoke in different spectral regions during specific high-AOD days of August 2021. For this purpose, we compared measured irradiances at different spectral bands with the corresponding modelled irradiances for aerosol-free skies (case c in Sect. 2.3.1). In order to ensure that the modelled and the measured irradiances are comparable, we also modelled the irradiances using Cimel measurements (case a in Sect. 2.3.1) and then compared measured and modelled irradiances for days with very low aerosol load. When AOD is low, uncertainties in the aerosol optical properties used for the simulations have a negligible impact on the simulated irradiances. The lowest-AOD days were 15 and 16 August as inferred from Sect. 3.3. The results for both days were nearly identical and yielded an agreement better than 2 % between the measured and modelled irradiances for SZAs below 80∘. For 16 August, the ratio between the measured and modelled values (considering realistic aerosol conditions) is presented with dotted lines in Fig. 10o. The results of the comparison between measured and modelled (considering AOD = 0) irradiances for 4 different days are also presented in Fig. 10 for UV-B (Fig. 10a–d), VIS (Fig. 10e–h), and NIR (Fig. 10i–l). These days are chosen as representative of different events, as presented in Sect. 3.3, including 4 August with very high AOD due to the presence of both dust and smoke, 11 August with very high AOD due to the presence of dust, 16 August representing very low AOD (daily average below 0.05 at 500 nm), and 18 August with very high AOD due to the presence of smoke.
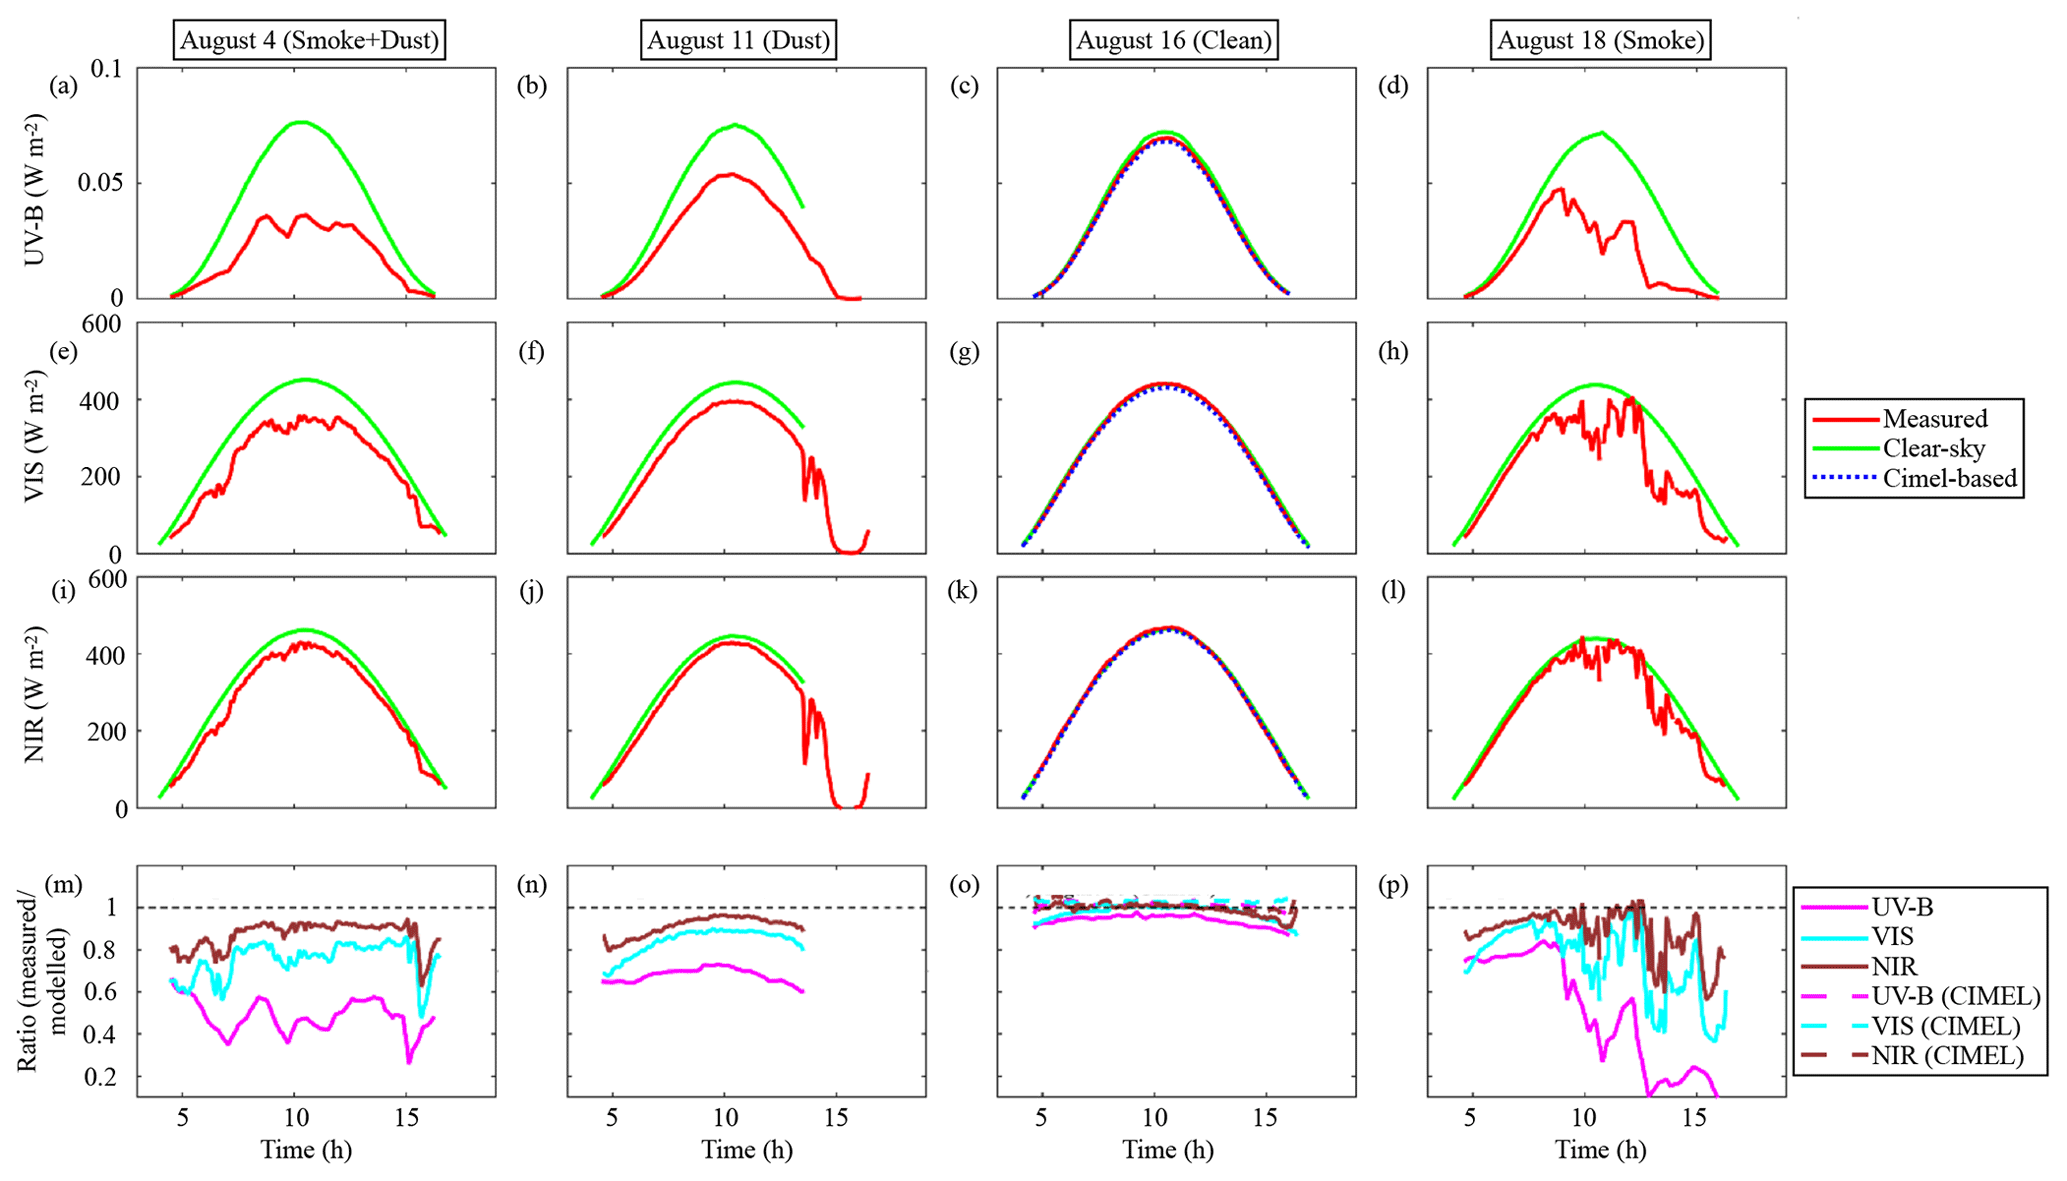
Figure 10Effect of aerosols on (a–d) UV-B, (e–h) VIS, and (i–l) NIR irradiance on 4, 11, 16, and 18 August, respectively, and the ratio between measured and modelled irradiances (m–p).
From Fig. 10a–d, it is observed that the attenuation of UV-B irradiance was the least on 11 August and was the highest on 18 August, followed by 4 August. It is to be noted that 4 and 18 August are the days corresponding to smoke aerosols with very high fine-mode AOD values (> 1), as presented in Sect. 3.3, while 11 August has low fine-mode AOD but high coarse-mode AOD. Also, the very high AE of smoke, combined with the low SSA, induced a steep gradient in the spectral dependence of the attenuation. Thus, on 4 and 18 August, the UV-B irradiance was attenuated by 60 %. Moreover, in the evening of 18 August, the smoke aerosols attenuated about 90 % or even more of the UV-B irradiance. The attenuation in NIR was comparatively less, as can be seen from Fig. 10i–l, which was mostly of the order of 20 % or less. However, the attenuation of NIR irradiance was higher in the evening of 18 August, as was the case of UV-B irradiance, reaching about 40 %.
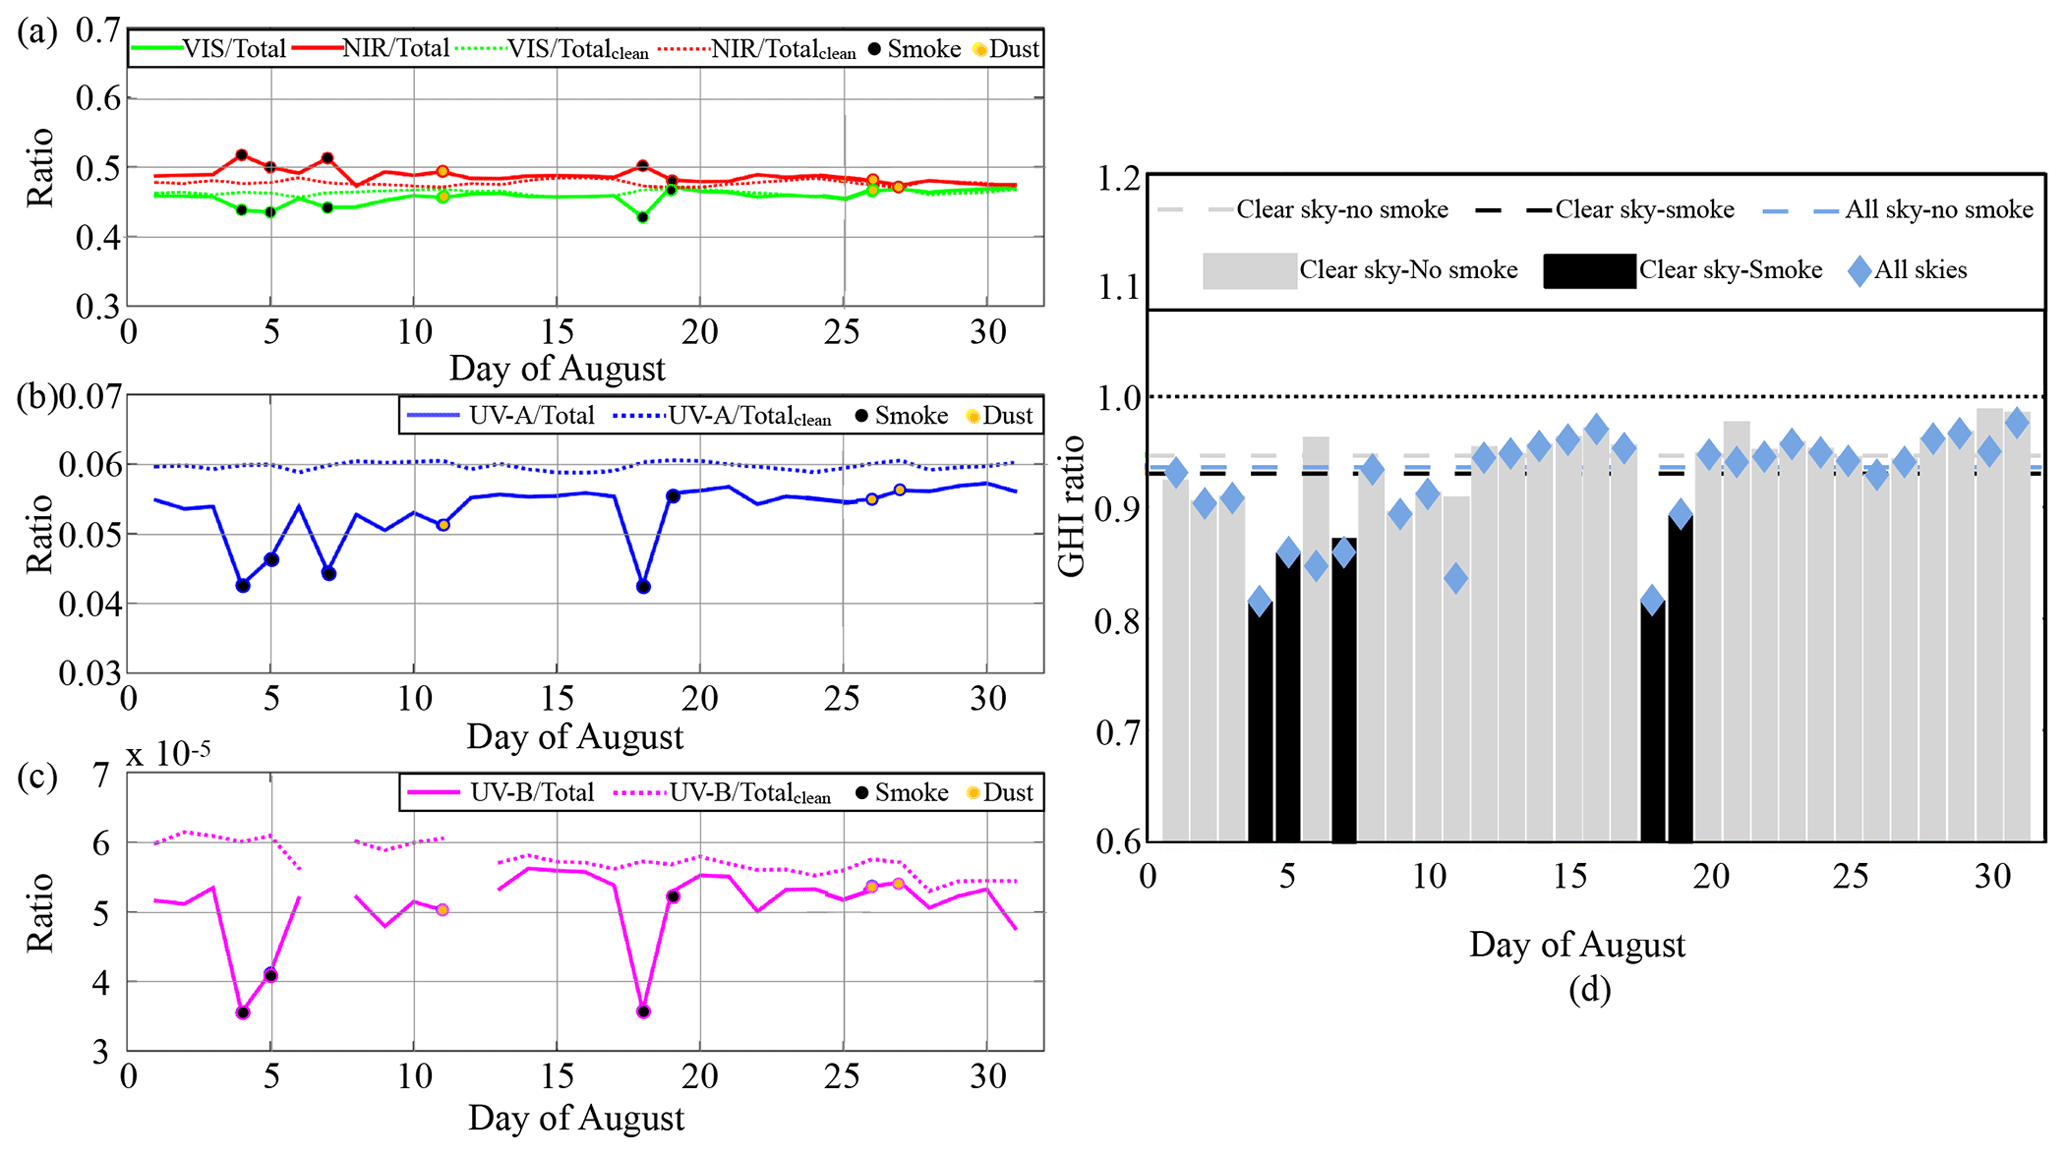
Figure 11Contribution of different spectral regions to total solar irradiance in August 2021. (a) Ratios of NIR and VIS with GHI, (b) ratio of UV-A with GHI, (c) ratio of UV-B with GHI, and (d) effect of smoke on the levels of GHI. Continuous lines represent ratios calculated using measured values, while dotted lines represent ratios calculated using modelled values for aerosol-free conditions. Black dots represent smoke events, while yellow dots represent dust events. The dashed lines (grey, light blue, and black) represent the ratio based on average GHI for August, while the ratio based on daily GHI is represented by grey shading, black bars, and a light-blue rhombus.
Figure 11 shows the relative contribution of the different spectral regions (UV-B, UV-A, VIS, NIR) to the daily integrals of the GHI irradiance. The contribution is calculated as the ratio between irradiance in a spectral region (NIR, VIS, and UV) and the GHI. Due to relatively large gaps in the Brewer measurements on 7 and 12 August, the UV-B integrals have not been calculated for these days. The theoretical integrals that have been calculated based on modelled irradiances are presented with dashed lines. It can be observed that the contribution of NIR to total irradiance is higher on smoke days than on dust days, while the opposite can be observed for the VIS range. Figure 11b and c show the contribution of UV-A and UV-B to total irradiance. As in the VIS range, the contribution from UV-A and UV-B is lower for smoke cases as expected, due to the higher spectral dependence (high AE) of AOD on smoke aerosols, being higher in the lower spectral ranges. The daily average AOD at 500 nm and at 340 nm is shown in Appendix Table A1. It is interesting that although the daily average AOD at 500 nm is almost same, ∼ 0.58, the average AE at 440–870 nm is 1.97 and 0.74 on 7 August (smoke) and 11 August (dust), respectively, signifying the large variation in AOD with wavelength on 7 August (1.18 to 0.15 for the 340–1020 nm) compared to that on 11 August (0.80 to 0.35 for the 340–1020 nm) (Appendix Table A1). Hence, the change in the composition of GHI is significantly more pronounced on 7 August, and the attenuation is more enhanced mainly because of stronger absorption of light by smoke aerosols relative to dust aerosols (Kaskaoutis et al., 2021).
The effect of smoke on the levels of daily and monthly GHI in August 2021 is presented in Fig. 11d. These ratios have been calculated as the ratio of the daily integrals from the pyranometer measurements divided by the daily integrals calculated from modelled irradiances for AOD = 0 and are represented by the light-blue rhombus. In order to exclude the effect of clouds there was a visual inspection of the measurements with respect to cloud camera images and the hours during which the sun disc was partially or fully covered by clouds were marked. Then, for these hours the modelled irradiances were assumed to be equal to the measured irradiances (assuming that the aerosol effects are negligible under cloudy conditions). Measurement-based integrals were then divided with the latter modified modelled integrals (grey and black bars). Intense smoke events were marked in black. The dashed light-blue line represents the ratio between the average of measurement-based daily integrals and the model-based daily integrals, excluding the days corresponding to intense smoke events. The dotted grey line represents the ratio between the average of measurement-based daily integrals and the modified model-based daily integrals for clear-sky days, excluding again the days corresponding to intense smoke events. The ratio represented by the dashed black line has been calculated in the same way (as the ratio represented by the dashed grey line) but including the days with intense smoke events.
During intense smoke events, the daily GHI was attenuated by 10 %–20 % leading to a decrease of ∼ 1.5 % in the monthly GHI. If days with smoke are not taken into account, the overall GHI decrease due to aerosols is ∼ 5.5 % (dashed grey line). By taking the effect of clouds into account for the same days (dashed light-blue line), the decrease becomes 6.5 %. If only cloudless conditions are considered, including intense smoke events, the overall monthly GHI attenuation is 7 % (dashed black line). Also, during an intense wildfire event in Spain (Gómez-Amo et al., 2019), the radiative impacts of smoke and dust on photovoltaic plant performances were studied, revealing a loss of energy due to smoke with an average of 34 % on a daily basis, while due to dust it was around 6 %, signifying the much higher efficiency of smoke in diminishing the solar-energy generation, as compared to dust.
3.6.2 Biologically effective doses
The effect of the intense smoke events on the levels of different biologically effective doses was also investigated. For this part of the study, the measured doses were compared with modelled ones that were calculated for climatological aerosol optical properties (case b of Sect. 2.3.1). In Fig. 12, the vitamin D and PAR daily doses, as well as the maximum UV index are presented, as they were calculated from the Brewer (maximum UV index and daily vitamin D), PSR measurements, and libRadtran simulations. The corresponding ratios between measured and modelled doses are also presented. The maximum UV index was calculated as the average UV index within ±30 min around local noon.
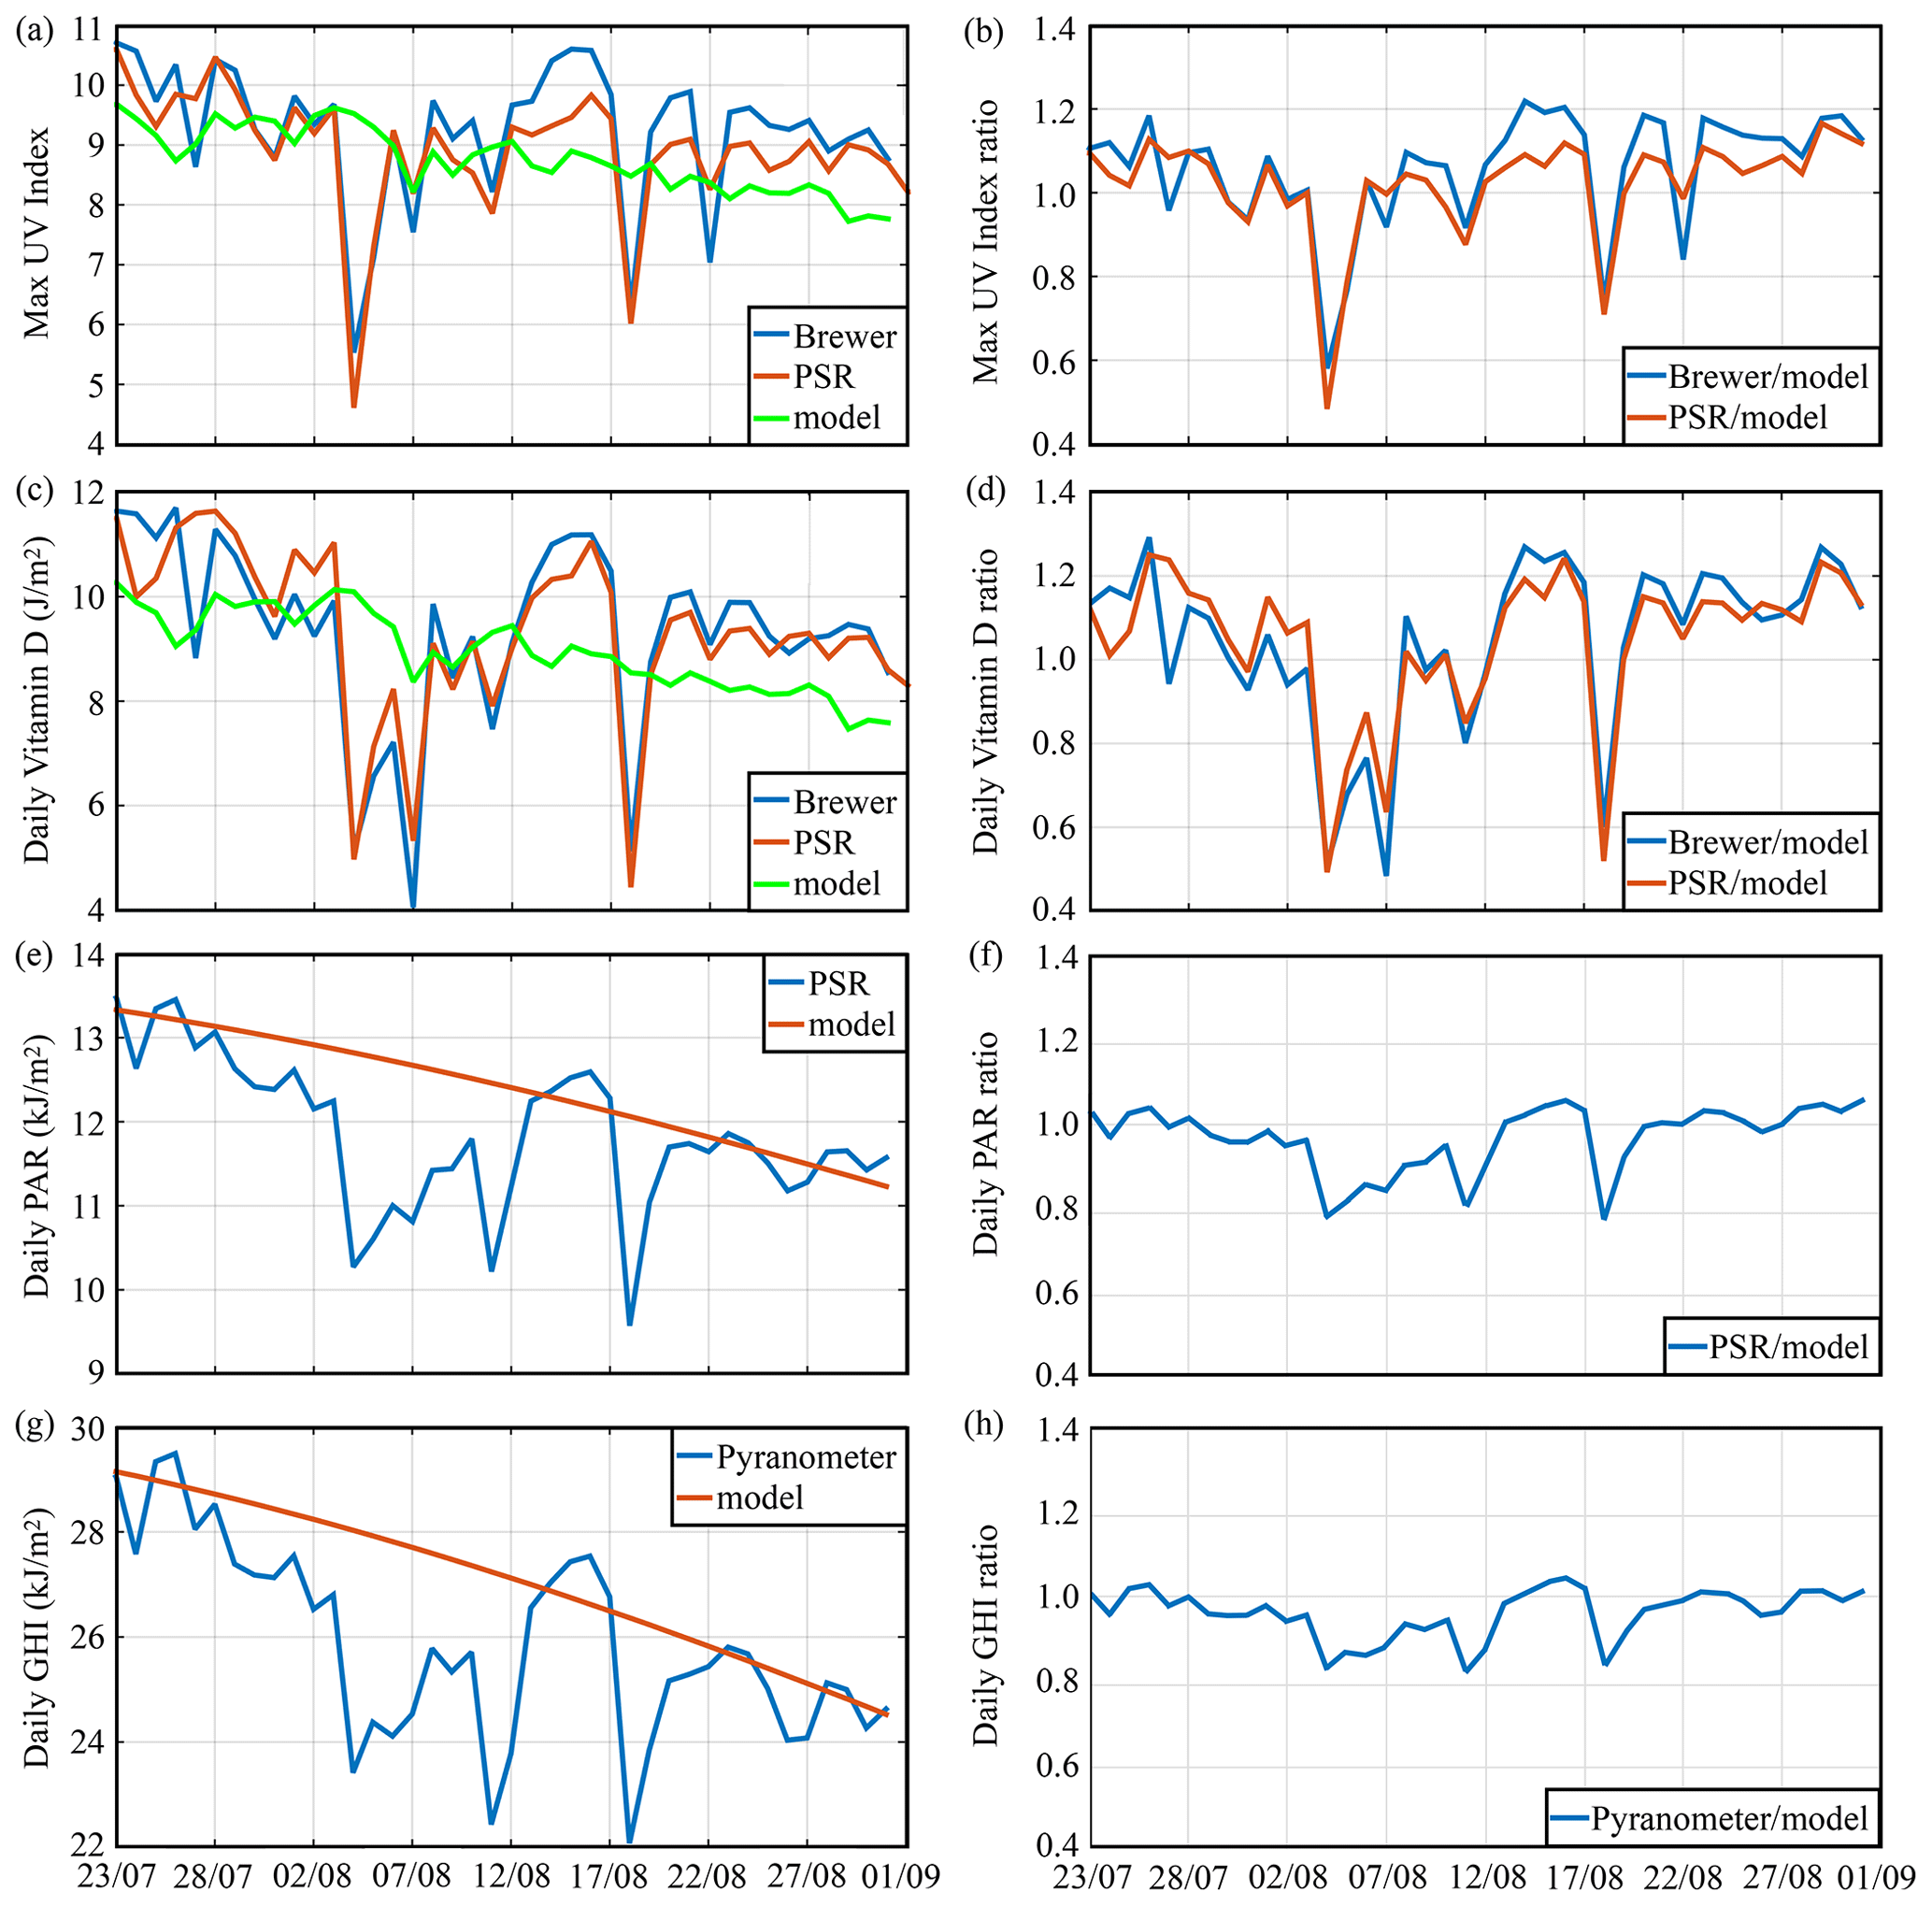
Figure 12(a, c, e, g) Variability in biologically effective doses from the Brewer, PSR, pyranometer, and libRadtran simulations for climatological aerosol optical properties and (b, d, f, h) the corresponding ratios between the Brewer, PSR, pyranometer, and modelled doses. Please note that the date format in this figure is day/month.
Despite the distance of 6 km between the PSR and Brewer, the calculated doses from the two instruments agree quite well (within less than 5 % during the dust and smoke events), confirming that the effects of dust and smoke aerosols were quite homogeneous over the city centre during the events. The presence of smoke at noon on 4 and 18 August resulted in UV indices that are 4.5 and 2 units, respectively, below the climatological levels. A decrease of 30 %–50 % in the daily vitamin D doses was also estimated for the extreme-smoke events. Attenuation of the daily vitamin D dose on 7 August is 40 %–50 % and, thus, nearly double than the attenuation by dust on 11 August (∼ 20 %), although the daily average AOD500 was larger on 11 August (see Sect. 3.6.1).
A significant impact of severe forest fires on air quality and solar irradiance was observed in Greece in August of 2021. The AOD values increased up to 12 times, and total columnar NO2 was up to 6 times above their climatological means. Total columnar SO2 reached as high as 8 DU, while the climatological average is ∼ 1 DU. Significantly elevated levels were also recorded in the surface PM2.5, PM10, and NO NO2 concentrations. In situ measurements showed that the transported smoke plumes over the Athens urban environment also exhibited a large effect on near-surface aerosol properties by significantly increasing the scattering and absorption coefficients, along with the BC concentrations, and especially the component related to biomass burning (BCwb), which in August 2021 was double the long-term climatological August value.
Wildfire smoke was also observed to be accompanied by the Saharan dust on a few days in August. Based on AOD, AE, volume size distribution, spectral variation in SSA, and the synergistic use of the ceilometer vertical distribution, it was inferred that 4 and 5 August were characterized by the presence of both dust and smoke, while 7, 18, and 19 August were characterized by the presence of smoke and 11 August was characterized by the presence of dust. Only dust days were found to have high AOD, low AE, and positive spectral dependence of SSA. While the days with the presence of smoke exhibited high AOD, high AE, and a negative spectral dependence of SSA with increasing wavelength. Separate analyses of total, organic matter, and dust AODs from CAMS showed similarly the presence of large amounts of organic matter on only smoke days (7, 18, and 19 August) and peak dust AOD on 11 August.
On 7 August a smoke plume was also detected over PANGEA, which is about 240 km away from Athens. The transport of the plumes was detected below 3 km using lidar and HYSPLIT backward trajectories ending at PANGEA. AOD was found to be high in the morning and afternoon hours (smoke transported from Athens) with significant fine-mode AOD and AE values above 1 for the entire day. The negative curvature effect of AE further indicated the dominance of fine particles. Also, the SSA value was observed to decrease with wavelength from 440 to 1020 nm and to be considerably higher than the SSA measured in Athens.
Furthermore, the attenuation of solar irradiance in different spectral regions due to the presence of dust and smoke was analysed. It was found that the attenuation of UV-B irradiance was least in the presence of dust and highest due to smoke (up to 60 % or more) and intermediate when there was a mixture of smoke and dust. The attenuation in NIR was less compared to UV and VIS and mostly of the order of 20 % or less, although it reached up to 40 % in the presence of smoke. In the VIS region, the attenuation was greater than in the NIR region but less than in the UV-B region. The relative contribution of the different spectral regions, as compared to the daily integrals of the GHI irradiance, was also analysed, and it was found that the higher spectral dependence of AOD on smoke particles leads to lower relative contributions of the irradiance at lower wavelengths (UV, VIS) and higher relative contributions of the irradiance in NIR, compared to the ones for the dust cases.
The effect of smoke on the levels of daily and monthly GHI was also considered, and it was observed that during intense smoke events, the daily GHI got attenuated by 10 %–20 %. In August, the energy demand is high due to high temperatures, especially under extreme heat events (such as the one in August 2021). In the future, where a significant fraction of consumed energy will emerge from photovoltaics, decreases in GHI of 10 %–20 % could have a significant impact on many human activities that are strongly related to solar-energy production. Also, the smoke effect during the wildfires period, as compared to climatology, led to decrease in the UV index of up to 53 %, in vitamin D of up to 50 %, in PAR of up to 21 %, and in GHI of up to 17 %, with implications for health, agriculture, and energy.
Our results showed that extreme wildland fires such as those in August 2021 in Greece have considerable effects on air quality (e.g. aerosol concentrations, aerosol properties, air pollutants) and solar radiation effective doses related to human health, ecosystems, and energy (e.g. UV index, vitamin D, PAR, GHI). Wildfires are part of the wider problem for Mediterranean countries, and the frequency of summer wildfires is predicted to increase in view of the projected increasing occurrence of summer heatwaves (Zittis et al., 2022). According to recent projections by Ruffault et al. (2020) the frequency of heat-induced fire weather is expected to increase in the Mediterranean basin until 2071–2100 under the RCP4.5 and RCP8.5 (Representative Concentration Pathway) scenarios, by 14 % and 30 %, respectively. In combination with extreme drought, extreme wind, and prolonged heatwave conditions in the future, it may well be speculated that the adverse effects of the projected increased frequency and extent of summer wildfires on vitamin D and PAR, as well as solar-energy production, will worsen across Mediterranean countries.
A1 Brewer spectrophotometer
Brewer no. 001 has been automatically measuring the direct, diffuse, and global spectral irradiances in the UV and visible regions since 2003, and every 2–3 years it is calibrated on site by International Ozone Services (https://www.io3.ca/, last access: 7 May 2023). Since 2020, the Brewer has been calibrated using a set of three 200 W lamps that are traceable to the scale of spectral irradiance established by the Physikalisch-Technische Bundesanstalt (PTB). More detailed information about the Brewer including measurements, quality control/assurance procedures, and calibration can be found in Eleftheratos et al. (2021) and Diémoz et al. (2016). The uncertainty in the Brewer measurements is estimated to 5 % for wavelengths above 305 nm and SZAs lower than 70∘ (Garane et al., 2006). There is about 1 DU uncertainty in Brewer direct sun SO2 measurements (Fioletov et al., 1998). During the wildfires, the SO2 levels rose high enough in Athens, well above the mean ±2σ (with the mean being 0.9 DU and σ being 0.6 DU), and, hence, the uncertainty was not of as much importance as it is in the case of low SO2 values.
A2 Pandora spectral radiometer
Pandora uses the BlickP algorithm to calculate the total optical depth by estimating a synthetic reference spectrum and cross sections of NO2 at an effective temperature of 254.5 K (Vandaele et al., 1998) that are fitted to a fourth-order polynomial, which results in the derivation of the slant column density (SCD). Then, it calculates the vertical column density (VCD) by applying a direct sun air mass factor. In clear-sky conditions, the precision of the slant column is 0.01 DU (Herman et al., 2009). Measurement uncertainties related to noise, systematic errors, drift, and wavelength shift are quantified during the monitoring process, and quality flags are provided (Cede and Tiefengraber, 2013). In this study, only the high-quality post-processed data are used in order to eliminate any artefacts.
A3 Precision Solar Spectroradiometer
PSR no. 007 has a global sensor mounted on the auxiliary port, and by using the built-in shutter of the instrument, spectral GHI can be measured. Each cycle of measurements consists of 10 spectra of GHI and 5 dark measurements, which are eliminated, and the average spectra are stored before applying the calibration. Calibrations of the instrument were performed in the field on 7 July and 3 November in 2021 using a 200 W quartz halogen lamp that is traceable to the Physikalisch-Technische Bundesanstalt (PTB). The mean ratio between the calibrations was 1.0004 with a range between 0.9902 and 1.0276. Visual inspection of the data showed no possible jump/drift in the time series. Hence, a linear interpolation between the two calibrations provided the calibration for each day in the study period (August 2021). The uncertainty budget of the instrument is presented in Gröbner and Kouremeti (2019) and is less than 1 % in VIS, less than 1.7 % in UV-A, and higher than 2 % in UV-B.
A4 Pyranometer
The two pyranometers used in this study, manufactured by the Eppley Laboratory, have a black-coated thermopile acting as a sensor (or detector) which is protected against meteorological conditions by two concentric hemispherical domes. They both comply with the International Organization for Standardization (ISO) (ISO 9060, 2022) criteria for an ISO secondary standard pyranometer, being classified as “high quality” according to the World Meteorological Organization (WMO) nomenclature (WMO, 2021). Additionally, the corresponding pyranometer measuring the diffuse component was mounted on a shading device (Eppley shadow band) to block the direct irradiance and prevent it from reaching the sensor. Measurements from both pyranometers (for global and diffuse) have also been corrected for the “dark-signal” offset, also known as the “nighttime” offset, which is mainly due to thermal gradients between the dome and the sensor. As in any optical system that does not use cryogenic cooling or balanced operation, the transfer of infrared radiation between components affects the performance of pyranometers by generating an internal infrared signal that is superimposed on the output signal. The temperatures of the detector and of the outer dome are the main drivers of the temperature gradients that generate the internal, spurious signal. The inner dome acts as a “heat shield”; it reduces the amount of infrared radiation being transferred between the detector and the outer dome (Taylor, 1985). Both pyranometers were calibrated by the Laboratory of Meteorological Device Calibration of NOA (LMDC, 2022; Basil E. Psiloglou, personal communication, 2021) on 28 and 30 June 2021. In order to ensure high-quality measurements, LMDC follows the standard calibration procedure for thermopile pyranometers (ISO 9847, 2022), with exposure to real sunlight conditions and comparison with a working standard thermopile pyranometer (secondary standard), under constant clear-sky conditions and for solar altitude greater than 20∘. This method is simple and provides sufficient accuracy because errors related to the dependence on solar incident angle and the instrument's spectral response are avoided. Traceability is ensured as LMDC's reference pyranometer, a Kipp & Zonen CMP21 (: 150 561), is regularly calibrated at the Physikalisch-Meteorologisches Observatorium Davos/World Radiation Center (PMOD/WRC), Davos, Switzerland. Also, utilizing the measurements during the nighttime period, from 21:00 to 03:00 UTC of the following day, it was possible to calculate the dark-signal error and correct the measurements of both pyranometers. The maximum daily error (daily integral) expected from these thermopile pyranometers is about 1 %–2 % (Hulstrom, 2003). These instruments also have imperfect angular response (Gueymard and Vignola, 1998), and, hence, a model-based correction for this effect was applied using a methodology similar to Bais et al. (1998).
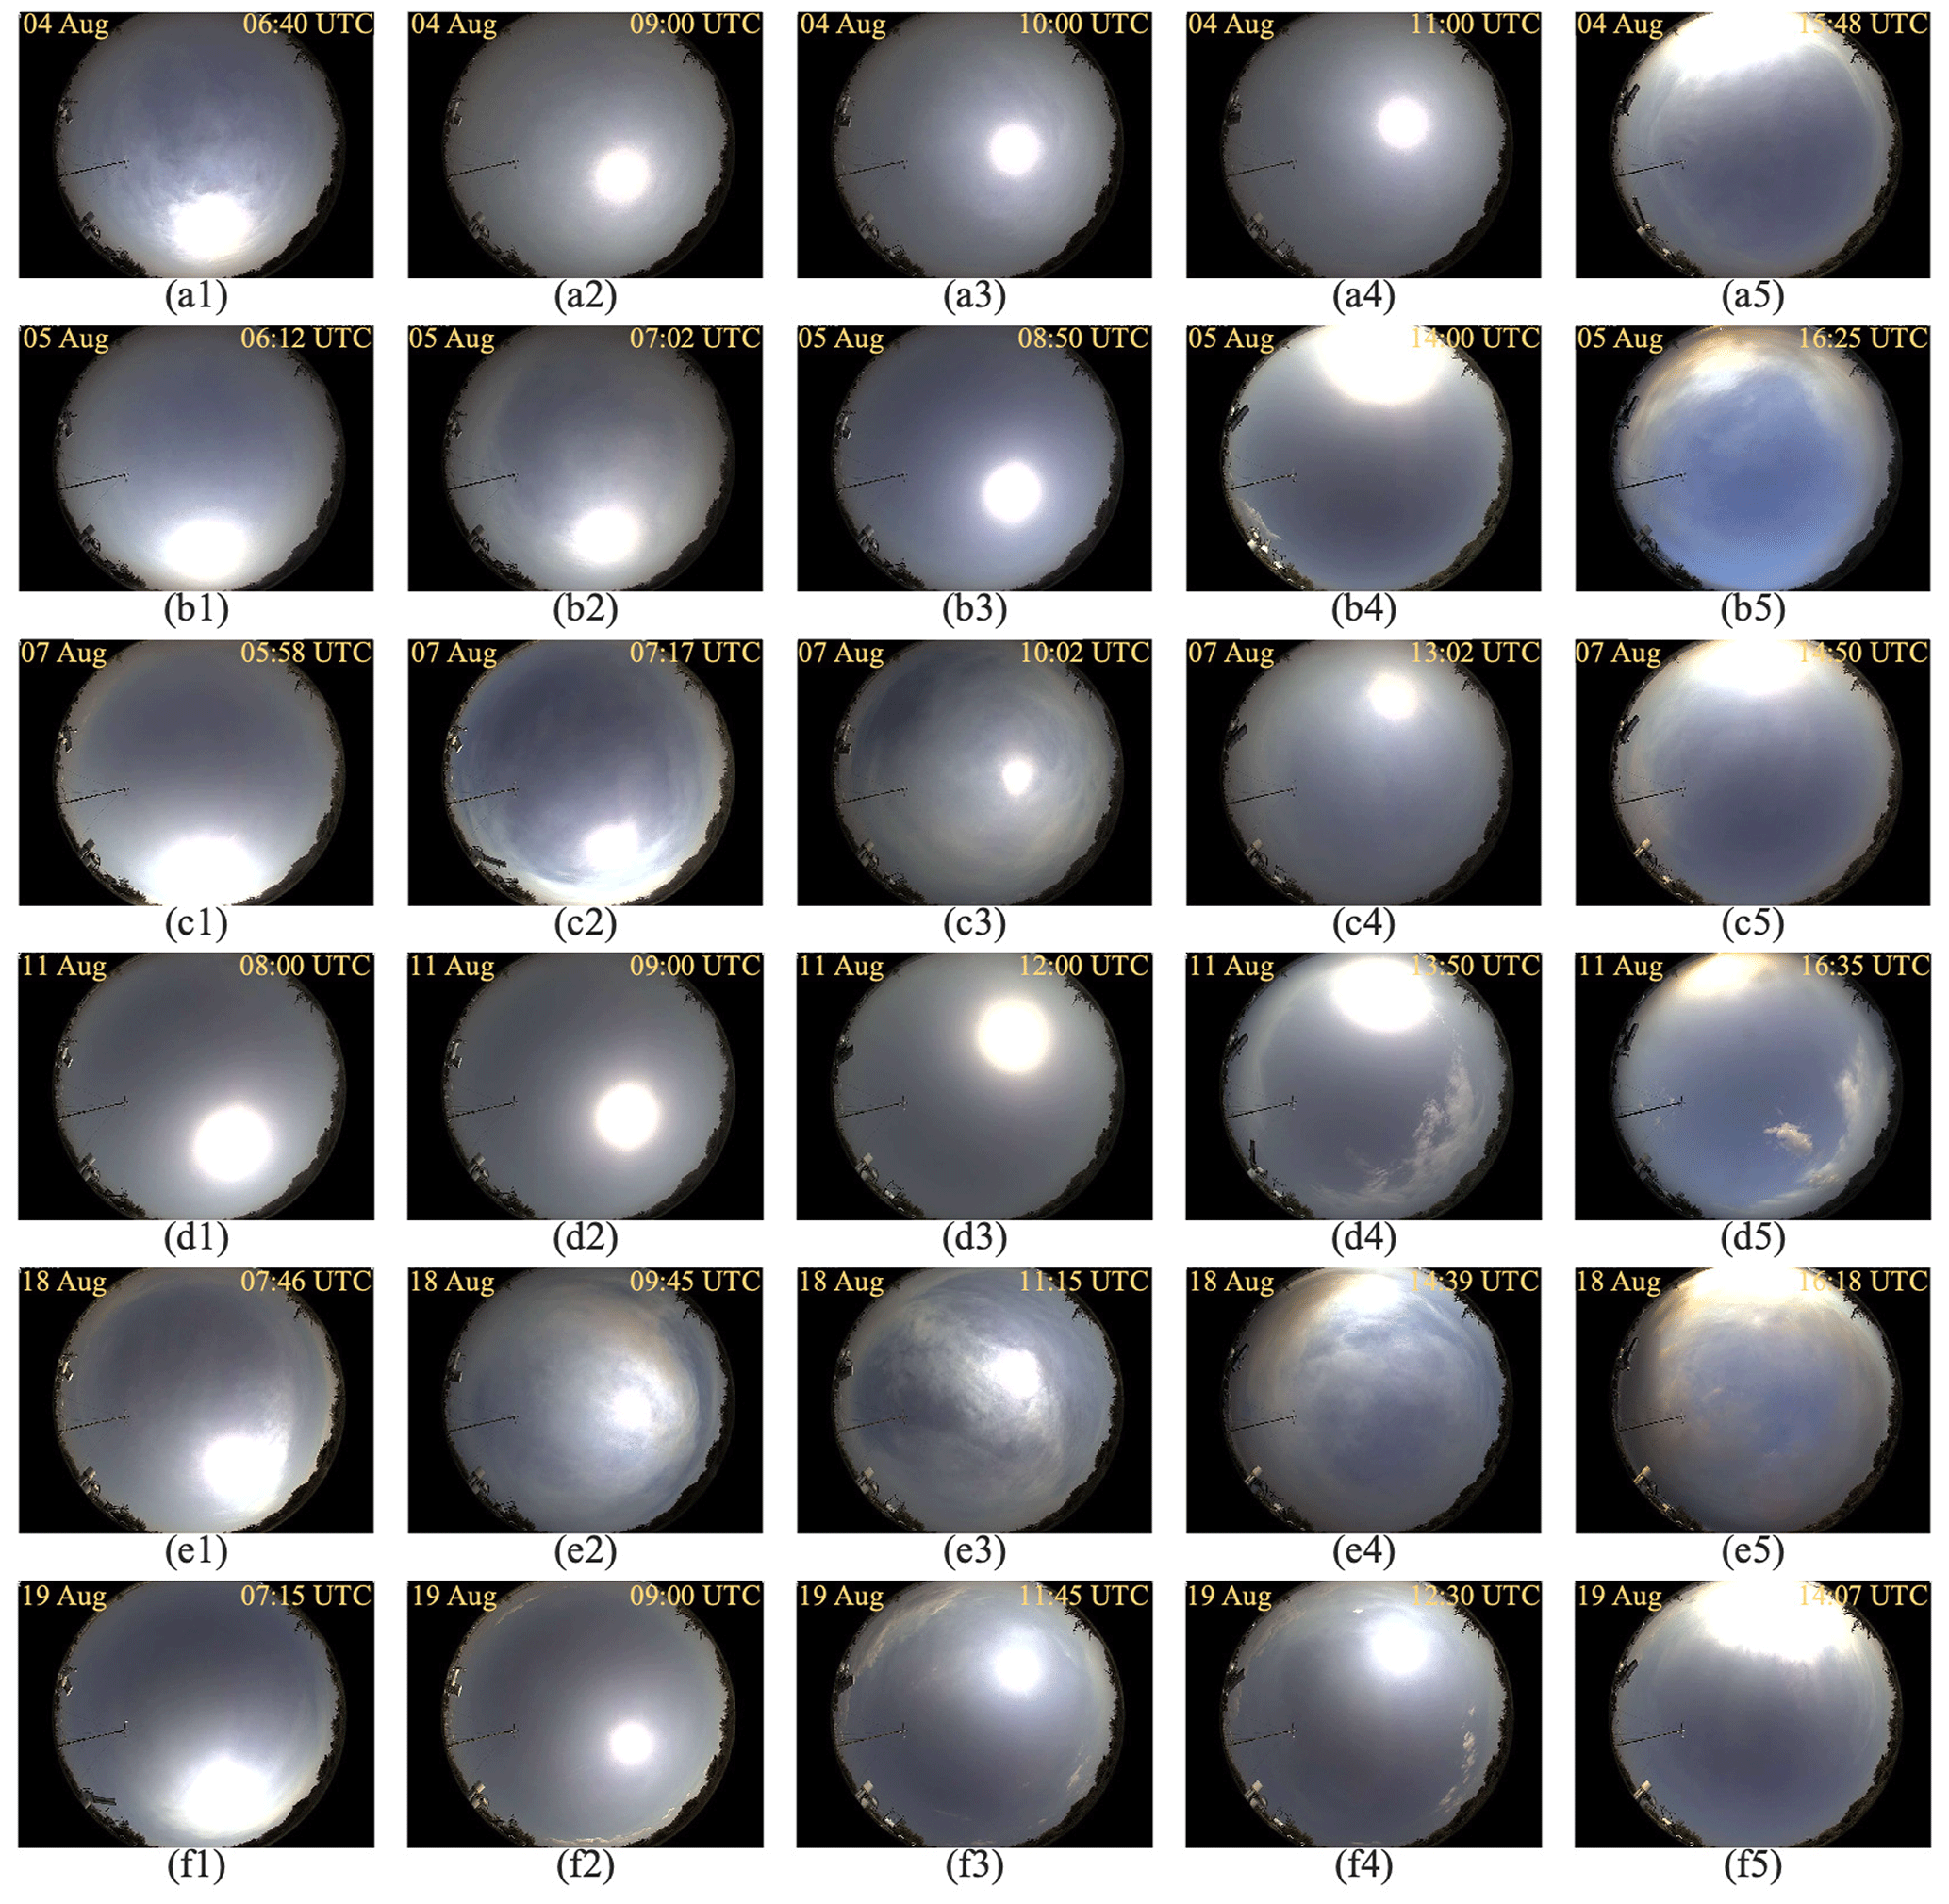
Figure A1Sky-camera images for Athens for (a1–a5) 4 August, (b1–b5) 5 August, (c1–c5) 7 August, (d1–d5) 11 August, (e1–e5) 18 August, and (f1–f5) 19 August, respectively.
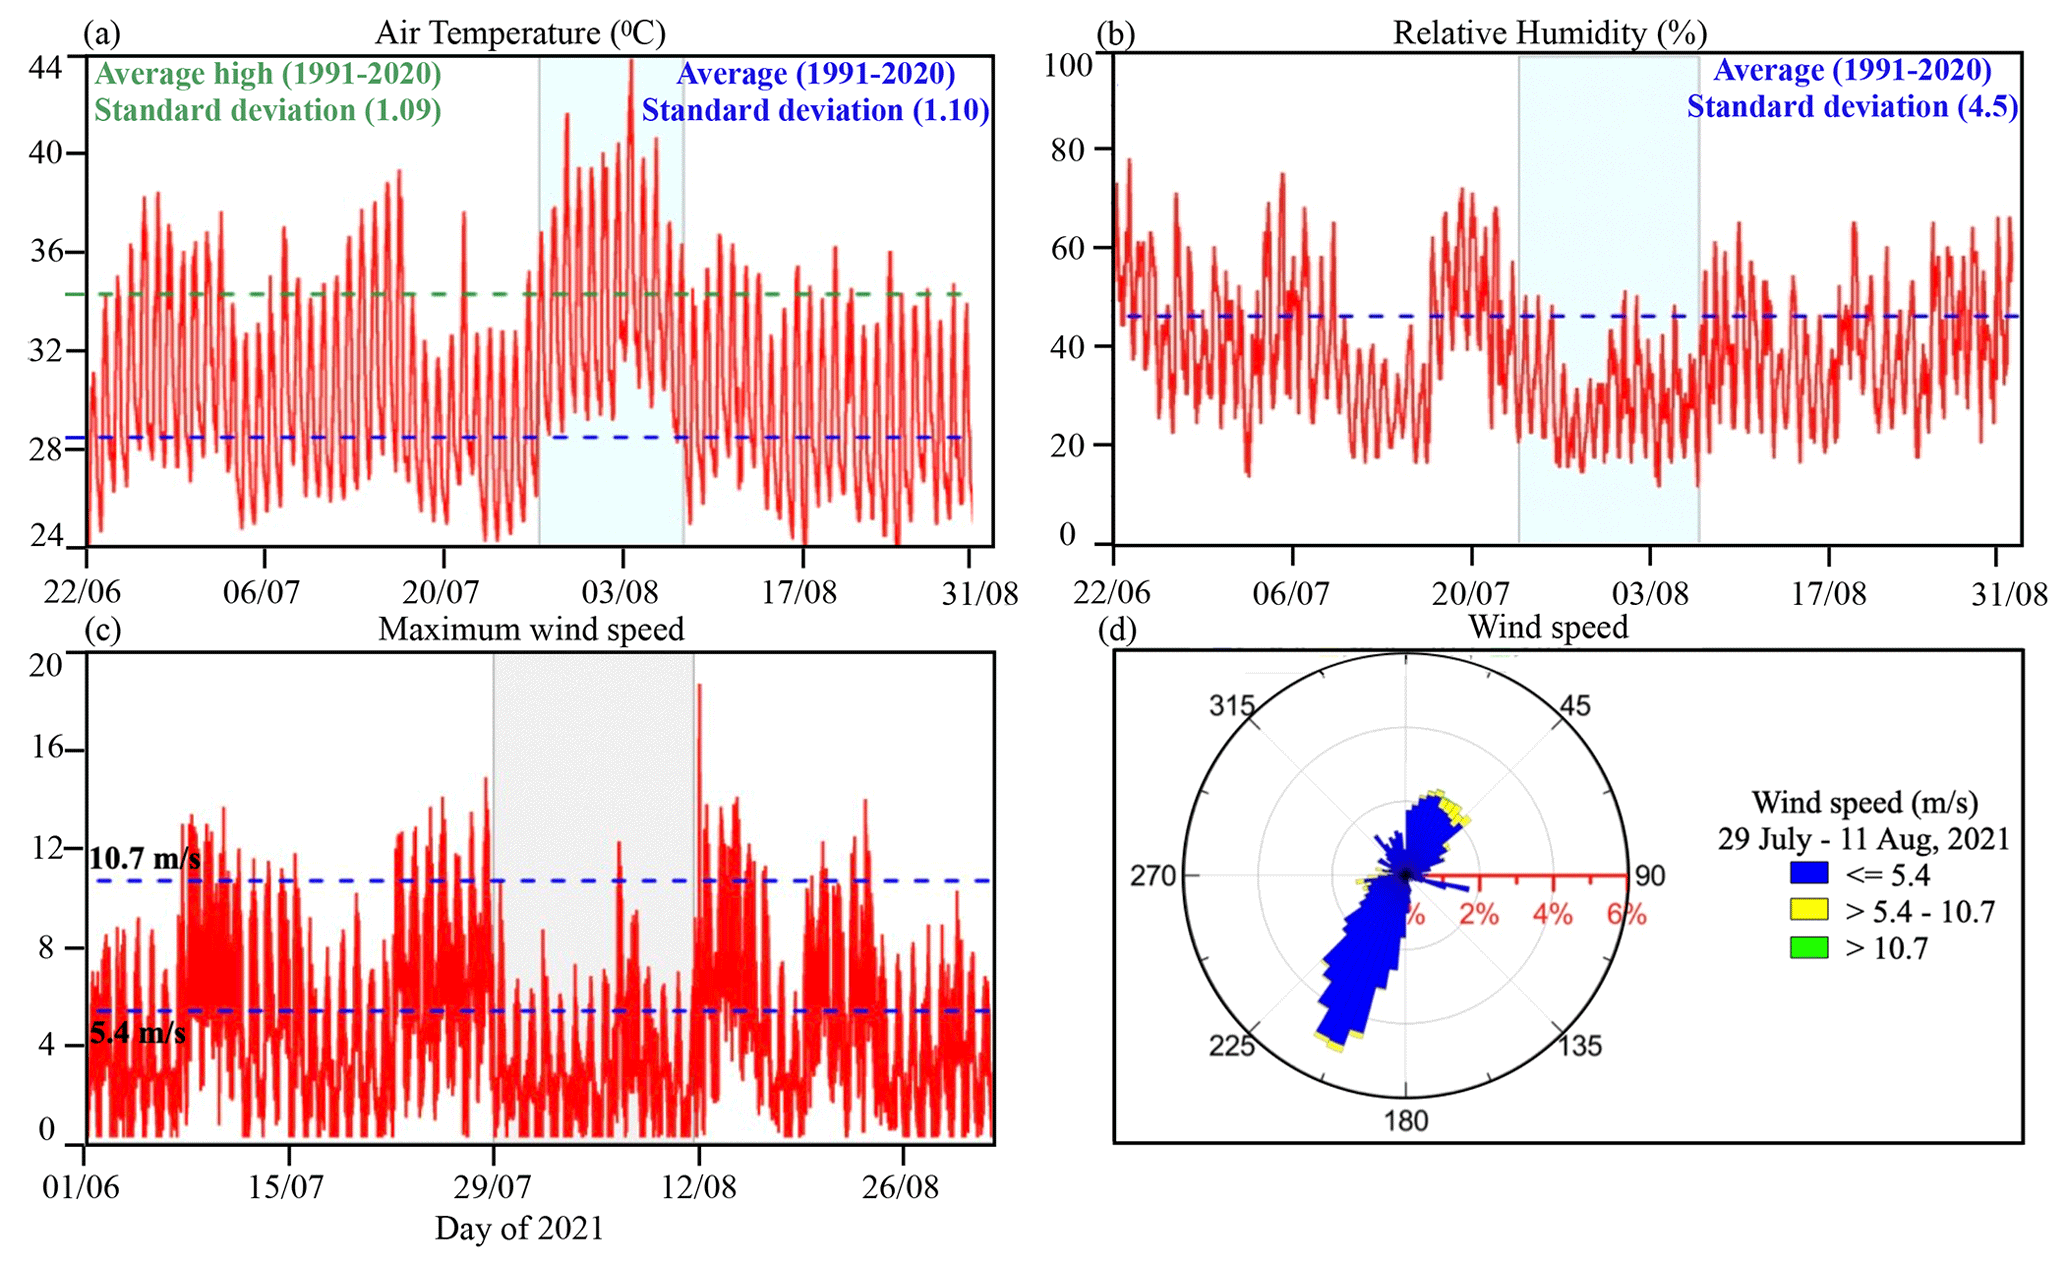
Figure A2Variation in (a) air temperature, (b) relative humidity, and (c, d) maximum wind speed during August 2021. Air temperature and humidity data are from the historical climatic data record of NOA. Wind speed data are from the ASNOA station. Please note that the date format in this figure is day/month.
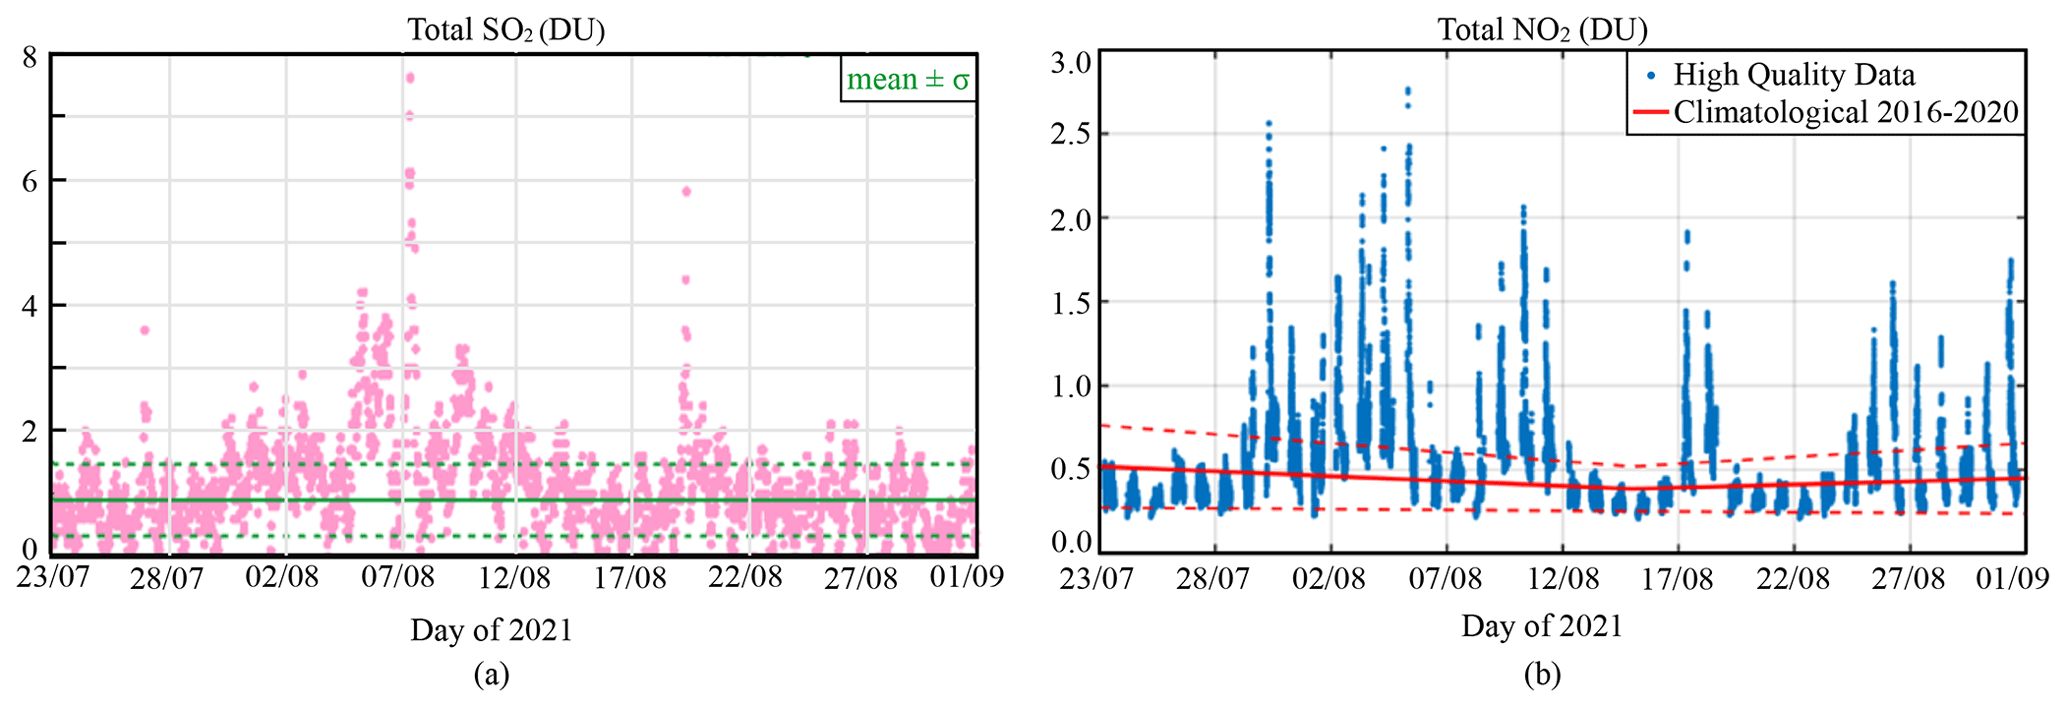
Figure A3Variation in (a) total SO2 (DU) from Brewer measurements and (b) total NO2 (DU) from Pandora measurements at Athens during August 2021. Please note that the date format in this figure is day/month.
Table A1Daily average values (maximum values in brackets) of aerosol properties for smoke and dust events of August 2021.
The code and data used in this paper are available upon request from the authors. The AERONET aerosol optical depth data are freely available from the NASA Goddard Space Flight Center at https://aeronet.gsfc.nasa.gov/new_web/aerosols.html (Giles et al., 2019).
AM prepared the first draft. AM, IF, SK, and KE were the main concept organizers and main contributors to the writing of this paper. KE and SK organized the ASPIRE campaign, from which most of the data were collected. IPR, DK, IF, and NK contributed to the spectral solar and Pandora measurement analysis. AKam, SS, and AM contributed to air mass trajectory modelling. KP and IF contributed to radiative transfer modelling and the solar radiation analysis. EM, AG, and VA provided the Antikythera aerosol data. BEP provided solar radiation measurements and contributed to the data quality control and analysis. DF provided meteorological data and contributed to the analysis. VS and AKaz contributed to the sky-camera data analysis. DK and NM contributed to the in situ aerosol data provision and analysis. AP provided Athens NTUA data. CSZ, KE, and SK contributed to the paper overview and section organization. All authors contributed by critically reviewing the writing and gave final approval for publication.
At least one of the (co-)authors is a member of the editorial board of Atmospheric Chemistry and Physics. The peer-review process was guided by an independent editor, and the authors also have no other competing interests to declare.
Publisher’s note: Copernicus Publications remains neutral with regard to jurisdictional claims in published maps and institutional affiliations.
Authors would like to acknowledge the Hellenic Foundation for Research and Innovation (H.F.R.I.). Akriti Masoom acknowledges ACTRIS-CH (Aerosol, Clouds and Trace Gases Research Infrastructure – Swiss contribution) funded by the State Secretariat for Education, Research and Innovation, Switzerland. Stelios Kazadzis would like to acknowledge the COST Action “Harmonia” (grant no. CA21119), supported by COST (European Cooperation in Science and Technology) and ACTRIS-CH (Aerosol, Clouds and Trace Gases Research Infrastructure – Swiss contribution) funded by the State Secretariat for Education, Research and Innovation, Switzerland. PANGEA measurements are supported by (a) the European Research Council (ERC) D-TECT project under the European Community's Horizon 2020 research and innovation framework programme (grant agreement no. 725698); (b) the PANGEA4CalVal project under the European Union's Horizon Widera 2021 Access programme (grant agreement no. 101079201); and (c) the project “PANhellenic infrastructure for Atmospheric Composition and climatE chAnge” (grant no. MIS 5021516), which is implemented under the action “Reinforcement of the Research and Innovation Infrastructure”, funded by the Operational Programme “Competitiveness, Entrepreneurship and Innovation” (NSRF 2014–2020) and co-financed by Greece and the European Union (European Regional Development Fund). We acknowledge Kyriakos Psychas from the Hellenic Ministry of Environment and Energy for providing the air quality measurements for Athens. Finally, the two anonymous reviewers are also acknowledged for their constructive comments that helped us to improve the paper.
This research has been supported by the Hellenic Foundation for Research and Innovation (H.F.R.I.) under the “1st Call for H.F.R.I. Research Projects to Support Faculty Members & Researchers and Procure High-Value Research Equipment” grant (Atmospheric parameters affecting SPectral solar IRradiance and solar Energy, ASPIRE; project no. 300).
This paper was edited by Matthias Tesche and reviewed by two anonymous referees.
ADS (Atmosphere Data Store): https://ads.atmosphere.copernicus.eu/#/home, last access: 20 September 2022.
ALCProfile (EUMETNET): https://e-profile.eu/#/cm_profile, last access: 31 October 2022.
Anderson, G. P., Clough, S. A., Kneizys, F. X., Chetwynd, J. H., and Shettle, E. P.: AFGL atmospheric constituent profiles (0.120 km), Air Force Geophysics Laboratory, https://apps.dtic.mil/sti/pdfs/ADA175173.pdf (last access: 28 December 2022), 1986.
Andreadis, E. A., Vourkas, G. I., Varelas, G., Angelopoulos, E. T., Gerasopoulos, E., Mihalopoulos, N., and Thomopoulos, C.: Air Pollution and Home Blood Pressure: The 2021 Athens Wildfires, High Blood Pressure & Cardiovascular Prevention, 29, 619–624, https://doi.org/10.1007/s40292-022-00547-0, 2022.
Andreae, M. O. and Merlet, P.: Emission of trace gases and aerosols from biomass burning, Global Biogeochem. Cy., 15, 955–966, https://doi.org/10.1029/2000GB001382, 2001.
Arola, A., Lindfors, A., Natunen, A., and Lehtinen, K. E. J.: A case study on biomass burning aerosols: effects on aerosol optical properties and surface radiation levels, Atmos. Chem. Phys., 7, 4257–4266, https://doi.org/10.5194/acp-7-4257-2007, 2007.
ASPIRE: Measuring atmospheric parameters affecting spectral solar irradiance and solar energy, Atmospheric parameters affecting spectral solar irradiance and solar Energy, https://aspire.geol.uoa.gr, last access: 24 December 2022.
Baars, H., Kanitz, T., Engelmann, R., Althausen, D., Heese, B., Komppula, M., Preißler, J., Tesche, M., Ansmann, A., Wandinger, U., Lim, J.-H., Ahn, J. Y., Stachlewska, I. S., Amiridis, V., Marinou, E., Seifert, P., Hofer, J., Skupin, A., Schneider, F., Bohlmann, S., Foth, A., Bley, S., Pfüller, A., Giannakaki, E., Lihavainen, H., Viisanen, Y., Hooda, R. K., Pereira, S. N., Bortoli, D., Wagner, F., Mattis, I., Janicka, L., Markowicz, K. M., Achtert, P., Artaxo, P., Pauliquevis, T., Souza, R. A. F., Sharma, V. P., van Zyl, P. G., Beukes, J. P., Sun, J., Rohwer, E. G., Deng, R., Mamouri, R.-E., and Zamorano, F.: An overview of the first decade of PollyNET: an emerging network of automated Raman-polarization lidars for continuous aerosol profiling, Atmos. Chem. Phys., 16, 5111–5137, https://doi.org/10.5194/acp-16-5111-2016, 2016.
Baars, H., Seifert, P., Engelmann, R., and Wandinger, U.: Target categorization of aerosol and clouds by continuous multiwavelength-polarization lidar measurements, Atmos. Meas. Tech., 10, 3175–3201, https://doi.org/10.5194/amt-10-3175-2017, 2017.
Bais, A. F., Kazadzis, S., Balis, D., Zerefos, C. S., and Blumthaler, M.: Correcting global solar ultraviolet spectra recorded by a Brewer spectroradiometer for its angular response error, Appl. Optics, 37, 6339–6344, https://doi.org/10.1364/AO.37.006339, 1998.
Batllori, E., De Cáceres, M., Brotons, L., Ackerly, D. D., Moritz, M. A., and Lloret, F.: Cumulative effects of fire and drought in Mediterranean ecosystems, Ecosphere, 8, e01906, https://doi.org/10.1002/ecs2.1906, 2017.
Batllori, E., De Cáceres, M., Brotons, L., Ackerly, D. D., Moritz, M. A., and Lloret, F.: Compound fire-drought regimes promote ecosystem transitions in Mediterranean ecosystems, J. Ecol., 107, 1187–1198, https://doi.org/10.1111/1365-2745.13115, 2019.
Baudena, M., Santana, V. M., Baeza, M. J., Bautista, S., Eppinga, M. B., Hemerik, L., Garcia Mayor, A., Rodriguez, F., Valdecantos, A., Vallejo, V. R., Vasques, A., and Rietkerk, M.: Increased aridity drives post-fire recovery of Mediterranean forests towards open shrublands, New Phytol., 225, 1500–1515, https://doi.org/10.1111/nph.16252, 2020.
Bouillon, R., Eisman, J., Garabedian, M., Holick, M., Kleinschmidt, J., Suda, T., Terenetskaya, I., and Webb, A.: Action spectrum for the production of previtamin D3 in human skin, CIE, 481–506, https://cie.co.at/publications/action-spectrum-production-previtamin-d3-human-skin (last access: 6 May 2023), 2006.
Buras, R., Dowling, T., and Emde, C.: New secondary-scattering correction in DISORT with increased efficiency for forward scattering, J. Quant. Spectrosc. Ra., 112, 2028–2034, https://doi.org/10.1016/j.jqsrt.2011.03.019, 2011.
Castagna, J., Senatore, A., Bencardino, M., D'Amore, F., Sprovieri, F., Pirrone, N., and Mendicino, G.: Multiscale assessment of the impact on air quality of an intense wildfire season in southern Italy, Sci. Total Environ., 761, 143271, https://doi.org/10.1016/j.scitotenv.2020.143271, 2021.
Cazorla, A., Shields, J. E., Karr, M. E., Olmo, F. J., Burden, A., and Alados-Arboledas, L.: Technical Note: Determination of aerosol optical properties by a calibrated sky imager, Atmos. Chem. Phys., 9, 6417–6427, https://doi.org/10.5194/acp-9-6417-2009, 2009.
Cede, A. and Tiefengraber, M.: CEOS Intercalibration of Ground-Based Spectrometers and Lidars, Minispectrometer Intercalibration and Satellite Validation, LuftBlick, https://www.pandonia-global-network.org/wp-content/uploads/2019/06/LuftBlick_CEOS_ICal-Minispectrometers_IntercalRecommendations_RP_2013002_v5.pdf (last access: 5 June 2023), 2013.
Colarco, P. R., Schoeberl, M. R., Doddridge, B. G., Marufu, L. T., Torres, O., and Welton, E. J.: Transport of smoke from Canadian forest fires to the surface near Washington, D.C.: Injection height, entrainment, and optical properties, J. Geophys. Res.-Atmos., 109, D06203, https://doi.org/10.1029/2003JD004248, 2004.
Cruz, A. and Moreno, J.: Seasonal course of total non-structural carbohydrates in the lignotuberous Mediterranean-type shrub Erica australis, Oecologia, 128, 343–350, https://doi.org/10.1007/s004420100664, 2001.
Dasari, S., Andersson, A., Bikkina, S., Holmstrand, H., Budhavant, K., Satheesh, S., Asmi, E., Kesti, J., Backman, J., Salam, Adasa, Bisht, D.S., Tiwari, S., Hameed, Z., and Gustafsson, Ö.: Photochemical degradation affects the light absorption of water-soluble brown carbon in the South Asian outflow, Science Advances, 5, eaau8066, https://doi.org/10.1126/sciadv.aau8066, 2019.
Derimian, Y., Léon, J.-F., Dubovik, O., Chiapello, I., Tanré, D., Sinyuk, A., Auriol, F., Podvin, T., Brogniez, G., and Holben, B. N.: Radiative properties of aerosol mixture observed during the dry season 2006 over M'Bour, Senegal (African Monsoon Multidisciplinary Analysis campaign), J. Geophys. Res.-Atmos., 113, D00C09, https://doi.org/10.1029/2008JD009904, 2008.
Diémoz, H., Eleftheratos, K., Kazadzis, S., Amiridis, V., and Zerefos, C. S.: Retrieval of aerosol optical depth in the visible range with a Brewer spectrophotometer in Athens, Atmos. Meas. Tech., 9, 1871–1888, https://doi.org/10.5194/amt-9-1871-2016, 2016.
Drinovec, L., Močnik, G., Zotter, P., Prévôt, A. S. H., Ruckstuhl, C., Coz, E., Rupakheti, M., Sciare, J., Müller, T., Wiedensohler, A., and Hansen, A. D. A.: The “dual-spot” Aethalometer: an improved measurement of aerosol black carbon with real-time loading compensation, Atmos. Meas. Tech., 8, 1965–1979, https://doi.org/10.5194/amt-8-1965-2015, 2015.
Dubovik, O. and King, M. D.: A flexible inversion algorithm for retrieval of aerosol optical properties from Sun and sky radiance measurements, J. Geophys. Res.-Atmos., 105, 20673–20696, https://doi.org/10.1029/2000JD900282, 2000.
Dubovik, O., Smirnov, A., Holben, B. N., King, M. D., Kaufman, Y. J., Eck, T. F., and Slutsker, I.: Accuracy assessments of aerosol optical properties retrieved from Aerosol Robotic Network (AERONET) Sun and sky radiance measurements, J. Geophys. Res.-Atmos., 105, 9791–9806, https://doi.org/10.1029/2000JD900040, 2000.
Dubovik, O., Holben, B., Eck, T. F., Smirnov, A., Kaufman, Y. J., King, M. D., Tanré, D., and Slutsker, I.: Variability of Absorption and Optical Properties of Key Aerosol Types Observed in Worldwide Locations, J. Atmos. Sci., 59, 590–608, https://doi.org/10.1175/1520-0469(2002)059<0590:VOAAOP>2.0.CO;2, 2002.
EARLINET: A European Aerosol Research Lidar Network to Establish an Aerosol Climatology, EARLINET, https://earlinet.org/index.php?id=earlinet_homepage, last access: 31 October 2022.
Eck, T. F., Holben, B. N., Reid, J. S., Sinyuk, A., Giles, D. M., Arola, A., Slutsker, I., Schafer, J. S., Sorokin, M. G., Smirnov, A., LaRosa, A. D., Kraft, J., Reid, E. A., O'Neill, N. T., Welton, E. J., and Menendez, A. R.: The extreme forest fires in California/Oregon in 2020: Aerosol optical and physical properties and comparisons of aged versus fresh smoke, Atmos. Environ., 305, 119798, https://doi.org/10.1016/j.atmosenv.2023.119798, 2023.
Eleftheratos, K., Kouklaki, D., and Zerefos, C.: Sixteen Years of Measurements of Ozone over Athens, Greece with a Brewer Spectrophotometer, Oxygen, 1, 32–45, https://doi.org/10.3390/oxygen1010005, 2021.
Emde, C., Buras-Schnell, R., Kylling, A., Mayer, B., Gasteiger, J., Hamann, U., Kylling, J., Richter, B., Pause, C., Dowling, T., and Bugliaro, L.: The libRadtran software package for radiative transfer calculations (version 2.0.1), Geosci. Model Dev., 9, 1647–1672, https://doi.org/10.5194/gmd-9-1647-2016, 2016.
Engelmann, R., Kanitz, T., Baars, H., Heese, B., Althausen, D., Skupin, A., Wandinger, U., Komppula, M., Stachlewska, I. S., Amiridis, V., Marinou, E., Mattis, I., Linné, H., and Ansmann, A.: The automated multiwavelength Raman polarization and water-vapor lidar PollyXT: the neXT generation, Atmos. Meas. Tech., 9, 1767–1784, https://doi.org/10.5194/amt-9-1767-2016, 2016.
Evan, A., Walkowiak, B., and Frouin, R.: On the Misclassification of Dust as Cloud at an AERONET Site in the Sonoran Desert, J. Atmos. Ocean. Tech., 39, 181–191, https://doi.org/10.1175/JTECH-D-21-0114.1, 2022.
Fernandes, A. P., Lopes, D., Sorte, S., Monteiro, A., Gama, C., Reis, J., Menezes, I., Osswald, T., Borrego, C., Almeida, M., Ribeiro, L. M., Viegas, D. X., and Miranda, A. I.: Smoke emissions from the extreme wildfire events in central Portugal in October 2017, Int. J. Wildland Fire, 31, 989–1001, https://doi.org/10.1071/WF21097, 2022.
Fernandez, A., Black, J., Jones, M., Wilson, L., Salvador-Carulla, L., Astell-Burt, T., and Black, D.: Flooding and Mental Health: A Systematic Mapping Review, PLOS ONE, 10, e0119929, https://doi.org/10.1371/journal.pone.0119929, 2015.
Fioletov, V. E., Griffioen, E., Kerr, J. B., Wardle, D. I., and Uchino, O.: Influence of volcanic sulfur dioxide on spectral UV irradiance as measured by Brewer Spectrophotometers, Geophys. Res. Lett., 25, 1665–1668, https://doi.org/10.1029/98GL51305, 1998.
Fioletov, V. E., Kerr, J. B., McArthur, L. J. B., Wardle, D. I., and Mathews, T. W.: Estimating UV Index Climatology over Canada, J. Appl. Meteorol., 42, 417–433, https://doi.org/10.1175/1520-0450(2003)042<0417:EUICOC>2.0.CO;2, 2003.
Fischer, E., Sippel, S., and Knutti, R.: Increasing probability of record-shattering climate extremes, Nat. Clim. Change, 11, 689–695, https://doi.org/10.1038/s41558-021-01092-9, 2021.
Forzieri, G., Cescatti, A., Silva, F. B., and Feyen, L.: Increasing risk over time of weather-related hazards to the European population: a data-driven prognostic study, Lancet Planet Health 2017, 1, E200–E208, https://doi.org/10.1016/S2542-5196(17)30082-7, 2017.
Fotiadi, A., Hatzianastassiou, N., Drakakis, E., Matsoukas, C., Pavlakis, K. G., Hatzidimitriou, D., Gerasopoulos, E., Mihalopoulos, N., and Vardavas, I.: Aerosol physical and optical properties in the Eastern Mediterranean Basin, Crete, from Aerosol Robotic Network data, Atmos. Chem. Phys., 6, 5399–5413, https://doi.org/10.5194/acp-6-5399-2006, 2006.
Founda, D., Katavoutas, G., Pierros, F., and Mihalopoulos, N.: The Extreme Heat Wave of Summer 2021 in Athens (Greece): Cumulative Heat and Exposure to Heat Stress, Sustainability, 14, 7766, https://doi.org/10.3390/su14137766, 2022.
Ganor, E., Osetinsky, I., Stupp, A., and Alpert, P.: Increasing trend of African dust, over 49 years, in the eastern Mediterranean, J. Geophys. Res.-Atmos., 115, D07201, https://doi.org/10.1029/2009JD012500, 2010.
Garane, K., Bais, A. F., Kazadzis, S., Kazantzidis, A., and Meleti, C.: Monitoring of UV spectral irradiance at Thessaloniki (1990–2005): data re-evaluation and quality control, Ann. Geophys., 24, 3215–3228, https://doi.org/10.5194/angeo-24-3215-2006, 2006.
Giannaros, T. M., Papavasileiou, G., Lagouvardos, K., Kotroni, V., Dafis, S., Karagiannidis, A., and Dragozi, E.: Meteorological Analysis of the 2021 Extreme Wildfires in Greece: Lessons Learned and Implications for Early Warning of the Potential for Pyroconvection, Atmosphere, 13, 475, https://doi.org/10.3390/atmos13030475, 2022.
Giles, D. M., Sinyuk, A., Sorokin, M. G., Schafer, J. S., Smirnov, A., Slutsker, I., Eck, T. F., Holben, B. N., Lewis, J. R., Campbell, J. R., Welton, E. J., Korkin, S. V., and Lyapustin, A. I.: Advancements in the Aerosol Robotic Network (AERONET) Version 3 database – automated near-real-time quality control algorithm with improved cloud screening for Sun photometer aerosol optical depth (AOD) measurements, Atmos. Meas. Tech., 12, 169–209, https://doi.org/10.5194/amt-12-169-2019, 2019 (data available at: https://aeronet.gsfc.nasa.gov/new_web/aerosols.html, last access: 5 May 2023).
Giorgi, F. and Lionello, P.: Climate change projections for the Mediterranean region, Global Planet. Change, 63, 90–104, https://doi.org/10.1016/j.gloplacha.2007.09.005, 2008.
Gómez-Amo, J., Estellés, V., Marcos, C., Segura, S., Esteve, A., Pedrós, R., Utrillas, M., and Martínez-Lozano, J.: Impact of dust and smoke mixing on column-integrated aerosol properties from observations during a severe wildfire episode over Valencia (Spain), Sci. Total Environ., 599–600, 2121–2134, https://doi.org/10.1016/j.scitotenv.2017.05.041, 2017.
Gómez-Amo, J., Freile-Aranda, M., J. Camarasa, V. E., Utrillas, M., and Martínez-Lozano, J.: Empirical estimates of the radiative impact of an unusually extreme dust and T wildfire episode on the performance of a photovoltaic plant in Western Mediterranean, Appl. Energ., 235, 1226–1234, https://doi.org/10.1016/j.apenergy.2018.11.052, 2019.
Grivas, G., Chaloulakou, A., and Kassomenos, P.: An overview of the PM10 pollution problem, in the Metropolitan Area of Athens, Greece. Assessment of controlling factors and potential impact of long range transport, Sci. Total Environ., 389, 165–177, https://doi.org/10.1016/j.scitotenv.2007.08.048, 2008.
Gröbner, J. and Kouremeti, N.: The Precision Solar Spectroradiometer (PSR) for direct solar irradiance measurements, Sol. Energy, 185, 199–210, https://doi.org/10.1016/j.solener.2019.04.060, 2019.
Gueymard, C. and Vignola, F.: Determination of atmospheric turbidity from the diffuse-beam broadband irradiance ratio, Sol. Energy, 63, 135–146, https://doi.org/10.1016/S0038-092X(98)00065-6, 1998.
Guiot, J. and Cramer, W.: Climate change: The 2015 Paris Agreement thresholds and Mediterranean basin ecosystems, Science, 354, 465–468, https://doi.org/10.1126/science.aah5015, 2016.
Herman, J., Cede, A., Spinei, E., Mount, G., Tzortziou, M., and Abuhassan, N.: NO2 column amounts from ground-based Pandora and MFDOAS spectrometers using the direct-sun DOAS technique: Intercomparisons and application to OMI validation, J. Geophys. Res.-Atmos., 114, D13307, https://doi.org/10.1029/2009JD011848, 2009.
Holben, B. N., Eck, T. F., Slutsker, I., Smirnov, A., Sinyuk, A., Schafer, J., Giles, D., and Dubovik, O.: AERONET's Version 2.0 quality assurance criteria, National Aeronautics and Space Administration, https://aeronet.gsfc.nasa.gov/new_web/PDF/AERONETcriteria_final1.pdf, last access: 5 June 2023.
Hulstrom, R. L.: Solar Resources, MIT Press, Cambridge, ISBN 9780262515368, 2003.
Inness, A., Ades, M., Agustí-Panareda, A., Barré, J., Benedictow, A., Blechschmidt, A.-M., Dominguez, J. J., Engelen, R., Eskes, H., Flemming, J., Huijnen, V., Jones, L., Kipling, Z., Massart, S., Parrington, M., Peuch, V.-H., Razinger, M., Remy, S., Schulz, M., and Suttie, M.: The CAMS reanalysis of atmospheric composition, Atmos. Chem. Phys., 19, 3515–3556, https://doi.org/10.5194/acp-19-3515-2019, 2019.
IPCC: Climate Change 2022: Impacts, Adaptation and Vulnerability, edited by: Pörtner, H.-O., Roberts, D. C., Tignor, M. M. B., Poloczanska, E., Mintenbeck, K., Alegría, A., Craig, M., Langsdorf, S., Löschke, S., Möller, V., Okem, A., and Rama, B., Intergovernmental Panel on Climate Change, https://www.ipcc.ch/report/ar5/wg1/, last access: 24 December 2022.
ISO 9060: Solar energy-Specification and classification of instruments for measuring hemispherical solar and direct solar radiation, International Organization for Standardization, https://www.iso.org/standard/67464.html, last access: 31 October 2022.
ISO 9847: Solar Energy – Calibration of Field Pyranometers by Comparison to a Reference Pyranometer, International Organization for Standardization, https://www.iso.org/standard/17725.html, last access: 31 October 2022.
ISO/CIE: 17166-2019: Erythema reference action spectrum and standard erythema dose, International Organization for Standardization, https://www.iso.org/standard/74167.html, last access: 23 March 2023.
Jaffe, D. A., Wigder, N., Downey, N., Pfister, G., Boynard, A., and Reid, S. B.: Impact of Wildfires on Ozone Exceptional Events in the Western U.S., Environ. Sci. Technol., 47, 11065–11072, https://doi.org/10.1021/es402164f, 2013.
Jin, X., Zhu, Q., and Cohen, R. C.: Direct estimates of biomass burning NOx emissions and lifetimes using daily observations from TROPOMI, Atmos. Chem. Phys., 21, 15569–15587, https://doi.org/10.5194/acp-21-15569-2021, 2021.
Jolly, W., Cochrane, M., Freeborn, P., Holden, Z. A., Brown, T. J., Williamson, G. J., and Bowman, D. M. J. S.: Climate-induced variations in global wildfire danger from 1979 to 2013, Nat. Commun., 6, 7537, https://doi.org/10.1038/ncomms8537, 2015.
Kaskaoutis, D., Grivas, G., Stavroulas, I., Liakakou, E., Dumka, U., Dimitriou, K., Gerasopoulos, E., and Mihalopoulos, N.: In situ identification of aerosol types in Athens, Greece, based on long-term optical and on online chemical characterization, Atmos. Environ., 246, 118070, https://doi.org/10.1016/j.atmosenv.2020.118070, 2021.
Kazadzis, S., Raptis, P., Kouremeti, N., Amiridis, V., Arola, A., Gerasopoulos, E., and Schuster, G. L.: Aerosol absorption retrieval at ultraviolet wavelengths in a complex environment, Atmos. Meas. Tech., 9, 5997–6011, https://doi.org/10.5194/amt-9-5997-2016, 2016.
Kazantzidis, A., Tzoumanikas, P., Bais, A., Fotopoulos, S., and Economou, G.: Cloud detection and classification with the use of whole-sky ground-based images, Atmos. Res., 113, 80–88, https://doi.org/10.1016/j.atmosres.2012.05.005, 2012.
Kazantzidis, A., Tzoumanikas, P., Nikitidou, E., Salamalikis, V., Wilbert, S., Kuhn, P., and Blanc, P.: Estimation of cloud coverage/type and aerosol optical depth with all-sky imagers at Plataforma Solar de Almeria, Spain: EMS Annual Meeting, Dublin, Ireland, 4–8 September 2017, EMS2017-390, European Meteorological Society, https://meetingorganizer.copernicus.org/EMS2017/EMS2017-390.pdf (last access: 5 June 2023), 2017.
Kerr, J. B.: The Brewer Spectrophotometer, in: UV Radiation in Global Climate Change, edited by: Gao, W., Slusser, J. R., and Schmoldt, D. L., Springer, Berlin, Heidelberg, 160-191, https://doi.org/10.1007/978-3-642-03313-1_6, 2010.
Kerr, J. B., McElroy, C. T., Wardle, D. I., Olafson, R. A., and Evans, W. F. J.: The Automated Brewer Spectrophotometer, in: Atmospheric Ozone, edited by: Zerefos, C. S. and Ghazi, A., Springer, Dordrecht, 396–401, https://doi.org/10.1007/978-94-009-5313-0_80, 1985.
Knorr, W., Dentener, F., Lamarque, J.-F., Jiang, L., and Arneth, A.: Wildfire air pollution hazard during the 21st century, Atmos. Chem. Phys., 17, 9223–9236, https://doi.org/10.5194/acp-17-9223-2017, 2017.
Kosmopoulos, P. G., Kazadzis, S., Taylor, M., Athanasopoulou, E., Speyer, O., Raptis, P. I., Marinou, E., Proestakis, E., Solomos, S., Gerasopoulos, E., Amiridis, V., Bais, A., and Kontoes, C.: Dust impact on surface solar irradiance assessed with model simulations, satellite observations and ground-based measurements, Atmos. Meas. Tech., 10, 2435–2453, https://doi.org/10.5194/amt-10-2435-2017, 2017.
Kotthaus, S., O'Connor, E., Münkel, C., Charlton-Perez, C., Haeffelin, M., Gabey, A. M., and Grimmond, C. S. B.: Recommendations for processing atmospheric attenuated backscatter profiles from Vaisala CL31 ceilometers, Atmos. Meas. Tech., 9, 3769–3791, https://doi.org/10.5194/amt-9-3769-2016, 2016.
Kurucz, R. L.: Synthetic Infrared Spectra, in: Proceedings of the International Astronomical Union, Symposium – International Astronomical Union, Infrared Solar Physics, Tucson, Arizona, 2–5 March 1992, 523–531, https://doi.org/10.1017/S0074180900124805, 1994.
Liakakou, E., Stavroulas, I., Kaskaoutis, D., Grivas, G., Paraskevopoulou, D., Dumka, U., Tsagkaraki, M., Bougiatioti, A., Oikonomou, K., Sciare, J., Gerasopoulos, E., and Mihalopoulos, N.: Long-term variability, source apportionment and spectral properties of black carbon at an urban background site in Athens, Greece, Atmos. Environ., 222, 117137, https://doi.org/10.1016/j.atmosenv.2019.117137, 2020.
Liu, Y., Zhou, Y., and Lu, J.: Exploring the relationship between air pollution and meteorological conditions in China under environmental governance, Sci. Rep.-UK, 10, 14518, https://doi.org/10.1038/s41598-020-71338-7, 2020.
LMDC (Laboratory of Meteorological Device Calibration): https://www.iersd.noa.gr/en/services/laboratory-of-meteorological-device-calibration/, last access: 31 October 2022.
Manisalidis, I., Stavropoulou, E., Stavropoulos, A., and Bezirtzoglou, E.: Environmental and Health Impacts of Air Pollution: A Review, Front. Public Health, 8, 14, https://doi.org/10.3389/fpubh.2020.00014, 2020.
Marinou, E., Amiridis, V., Binietoglou, I., Tsikerdekis, A., Solomos, S., Proestakis, E., Konsta, D., Papagiannopoulos, N., Tsekeri, A., Vlastou, G., Zanis, P., Balis, D., Wandinger, U., and Ansmann, A.: Three-dimensional evolution of Saharan dust transport towards Europe based on a 9-year EARLINET-optimized CALIPSO dataset, Atmos. Chem. Phys., 17, 5893–5919, https://doi.org/10.5194/acp-17-5893-2017, 2017.
Marinou, E., Tesche, M., Nenes, A., Ansmann, A., Schrod, J., Mamali, D., Tsekeri, A., Pikridas, M., Baars, H., Engelmann, R., Voudouri, K.-A., Solomos, S., Sciare, J., Groß, S., Ewald, F., and Amiridis, V.: Retrieval of ice-nucleating particle concentrations from lidar observations and comparison with UAV in situ measurements, Atmos. Chem. Phys., 19, 11315–11342, https://doi.org/10.5194/acp-19-11315-2019, 2019.
McKinlay, A. F. and Diffey, B. L.: A Reference Action Spectrum for Ultraviolet Induced Erythema in Human Skin, in: Human exposure to ultraviolet radiation: risks and regulations, edited by: Passchier, W. F. and Bosnjakovic, B. F. M., Elsevier Science Publishers, Amsterdam, the Netherlands, 17–22, ISBN 0444809147, 1987.
Meloni, D., di Sarra, A., Biavati, G., DeLuisi, J., Monteleone, F., Pace, G., Piacentino, S., and Sferlazzo, D.: Seasonal behavior of Saharan dust events at the Mediterranean island of Lampedusa in the period 1999–2005, Atmos. Environ., 41, 3041–3056, https://doi.org/10.1016/j.atmosenv.2006.12.001, 2007.
Milford, C., Cuevas, E., Marrero, C. L., Bustos, J., Gallo, V., Rodríguez, S., Romero-Campos, P. M., and Torres, C.: Impacts of Desert Dust Outbreaks on Air Quality in Urban Areas, Atmosphere, 11, 23, https://doi.org/10.3390/atmos11010023, 2020.
MODIS: Moderate Resolution Imaging Spectroradiometer: Aqua, National Aeronautics and Space Administration, https://go.nasa.gov/3SEK9XK, last access: 4 May 2023.
Monteiro, A., Basart, S., Kazadzis, S., Votsis, A., Gkikas, A., Vandenbussche, S., Tobias, A., Gama, C., García-Pando, C. P., Terradellas, E., Notas, G., Middleton, N., Kushta, J., Amiridis, V., Lagouvardos, K., Kosmopoulos, P., Kotroni, V., Kanakidou, M., Mihalopoulos, N., Kalivitis, N., Dagsson-Waldhauserová, P., El-Askary, H., Sievers, K., Giannaros, T., Mona, L., Hirtl, M., Skomorowski, P., Virtanen, T. H., Christoudias, T., Di Mauro, B., Trippetta, S., Kutuzov, S., Meinander, O., and Nickovic, S.: Multi-sectoral impact assessment of an extreme African dust episode in the Eastern Mediterranean in March 2018, Sci. Total Environ., 843, 156861, https://doi.org/10.1016/j.scitotenv.2022.156861, 2022.
Moulin, C., Lambert, C. E., Dayan, U., Masson, V., Ramonet, M., Bousquet, P., Legrand, M., Balkanski, Y. J., Guelle, W., Marticorena, B., Bergametti, G., and Dulac, F.: Satellite climatology of African dust transport in the Mediterranean atmosphere, J. Geophys. Res.-Atmos., 103, 13137–13144, https://doi.org/10.1029/98JD00171, 1998.
Nastos, P. T.: Meteorological Patterns Associated with Intense Saharan Dust Outbreaks over Greece in Winter, Adv. Meteorol., 2012, 828301, https://doi.org/10.1155/2012/828301, 2012.
O'Neill, N. T., Eck, T. F., Smirnov, A., Holben, B. N., and Thulasiraman, S.: Spectral discrimination of coarse and fine mode optical depth, J. Geophys. Res., 108, 4559-4573, https://doi.org/10.1029/2002JD002975, 2003.
Pace, G., di Sarra, A., Meloni, D., Piacentino, S., and Chamard, P.: Aerosol optical properties at Lampedusa (Central Mediterranean). 1. Influence of transport and identification of different aerosol types, Atmos. Chem. Phys., 6, 697–713, https://doi.org/10.5194/acp-6-697-2006, 2006.
Pani, S. K., Lin, N.-H., Chantara, S., Wang, S.-H., Khamkaew, C., Prapamontol, T., and Janjay, S.: Radiative response of biomass-burning aerosols over an urban atmosphere in northern peninsular Southeast Asia, Sci. Total Environ., 633, 892–911, https://doi.org/10.1016/j.scitotenv.2018.03.204, 2018.
Papachristopoulou, K., Fountoulakis, I., Gkikas, A., Kosmopoulos, P. G., Nastos, P. T., Hatzaki, M., and Kazadzis, S.: 15-Year Analysis of Direct Effects of Total and Dust Aerosols in Solar Radiation/Energy over the Mediterranean Basin, Remote Sens.-Basel, 14, 1535, https://doi.org/10.3390/rs14071535, 2022.
Papavasileiou, G. and Giannaros, T. M.: The Catastrophic 2021 Wildfires in Greece: An Outbreak of Pyroconvective Events, Third International Conference on Fire Behavior and Risk, Sardinia, Italy, 3–6 May 2022, Environ. Sci. Proc., 17, 7, https://doi.org/10.3390/environsciproc2022017007, 2022.
Papayannis, A., Mamouri, R. E., Amiridis, V., Kazadzis, S., Pérez, C., Tsaknakis, G., Kokkalis, P., and Baldasano, J. M.: Systematic lidar observations of Saharan dust layers over Athens, Greece in the frame of EARLINET project (2004–2006), Ann. Geophys., 27, 3611–3620, https://doi.org/10.5194/angeo-27-3611-2009, 2009.
Park, Y. H., Sokolik, I. N., and Hall, S. R.: The Impact of Smoke on the Ultraviolet and Visible Radiative Forcing Under Different Fire Regimes, Air, Soil and Water Research, 11, 1–10, https://doi.org/10.1177/1178622118774803, 2018.
Pausas, J. G., Pratt, R. B., Keeley, J. E., Jacobsen, A. L., Ramirez, A. R., Vilagrosa, A., Paula, S., Kaneakua-Pia, I. N., and Davis, S. D.: Towards understanding resprouting at the global scale, New Phytol., 209, 945–954, https://doi.org/10.1111/nph.13644, 2016.
Perkins-Kirkpatrick, S. and Lewis, S.: Increasing trends in regional heatwaves, Nat. Commun., 11, 3357, https://doi.org/10.1038/s41467-020-16970-7, 2020.
POLLYNET: Raman and polarization lidar network, Leibniz Institute for Tropospheric Research e.V., Leipzig, https://polly.tropos.de, last access: 31 October 2022.
Poorter, H., Niinemets, U., Ntagkas, N., Siebenküas, A., Mäenpää, M., Matsubara, S., and Pons, T.: A meta-analysis of plant responses to light intensity for 70 traits ranging from molecules to whole plant performance, New Phytol., 223, 1073–1105, https://doi.org/10.1111/nph.15754, 2019.
Pratt, R. B., Jacobsen, A. L., Ramirez, A. R., Helms, A. M., Traugh, C. A., Tobin, M. F., Heffner, M. S., and Davis, S. D.: Mortality of resprouting chaparral shrubs after a fire and during a record drought: physiological mechanisms and demographic consequences, Glob. Change Biol., 20, 893–907, https://doi.org/10.1111/gcb.12477, 2014.
Puig-Gironès, R., Brotons, L., and Pons, P.: Aridity influences the recovery of vegetation and shrubland birds after wildfire, PLOS ONE, 12, e0173599, https://doi.org/10.1371/journal.pone.0173599, 2017.
Raptis, I.-P., Kazadzis, S., Amiridis, V., Gkikas, A., Gerasopoulos, E., and Mihalopoulos, N.: A Decade of Aerosol Optical Properties Measurements over Athens, Greece, Atmosphere, 11, 154, https://doi.org/10.3390/atmos11020154, 2020.
Raptis, P.-I., Kazadzis, S., Gröbner, J., Kouremeti, N., Doppler, L., Becker, R., and Helmis, C.: Water vapour retrieval using the Precision Solar Spectroradiometer, Atmos. Meas. Tech., 11, 1143–1157, https://doi.org/10.5194/amt-11-1143-2018, 2018.
Reid, J. S. and Hobbs, P. V.: Physical and optical properties of young smoke from individual biomass fires in Brazil, J. Geophys. Res.-Atmos., 103, 32013–32030, https://doi.org/10.1029/98JD00159, 1998.
Ren, Y., Shen, G., Shen, H., Zhong, Q., Xu, H., Meng, W., Zhang, W., Yu, X., Yun, X., Luo, Z., Chen, Y., Li, B., Cheng, H., Zhu, D., and Tao, S.: Contributions of biomass burning to global and regional SO2 emissions, Atmos. Res., 260, 105709, https://doi.org/10.1016/j.atmosres.2021.105709, 2021.
Rice, M., Henderson, S., Lambert, A., Cromar, K., Hall, J., Cascio, W., Smith, P., Marsh, B., Coefield, S., Balmes, J., Kamal, A., Gilmour, M., Carlsten, C., Navarro, K., Collman, G., Rappold, A., Miller, M., Stone, S., and Costa, D.: Respiratory Impacts of Wildland Fire Smoke: Future Challenges and Policy Opportunities. An Official American Thoracic Society Workshop Report, Annals of the American Thoracic Society, 18, 921–930, https://doi.org/10.1513/AnnalsATS.202102-148ST, 2021.
Rickly, P. S., Guo, H., Campuzano-Jost, P., Jimenez, J. L., Wolfe, G. M., Bennett, R., Bourgeois, I., Crounse, J. D., Dibb, J. E., DiGangi, J. P., Diskin, G. S., Dollner, M., Gargulinski, E. M., Hall, S. R., Halliday, H. S., Hanisco, T. F., Hannun, R. A., Liao, J., Moore, R., Nault, B. A., Nowak, J. B., Peischl, J., Robinson, C. E., Ryerson, T., Sanchez, K. J., Schöberl, M., Soja, A. J., St. Clair, J. M., Thornhill, K. L., Ullmann, K., Wennberg, P. O., Weinzierl, B., Wiggins, E. B., Winstead, E. L., and Rollins, A. W.: Emission factors and evolution of SO2 measured from biomass burning in wildfires and agricultural fires, Atmos. Chem. Phys., 22, 15603–15620, https://doi.org/10.5194/acp-22-15603-2022, 2022.
Rodríguez, S., Querol, X., Alastuey, A., Kallos, G., and Kakaliagou, O.: Saharan dust contributions to PM10 and TSP levels in Southern and Eastern Spain, Atmos. Environ., 35, 2433–2447, https://doi.org/10.1016/S1352-2310(00)00496-9, 2001.
Román, R., Antuña-Sánchez, J. C., Cachorro, V. E., Toledano, C., Torres, B., Mateos, D., Fuertes, D., López, C., González, R., Lapionok, T., Herreras-Giralda, M., Dubovik, O., and de Frutos, Á. M.: Retrieval of aerosol properties using relative radiance measurements from an all-sky camera, Atmos. Meas. Tech., 15, 407–433, https://doi.org/10.5194/amt-15-407-2022, 2022.
Rosário, N. É. D., Sena, E. T., and Yamasoe, M. A.: South American 2020 regional smoke plume: intercomparison with previous years, impact on solar radiation, and the role of Pantanal biomass burning season, Atmos. Chem. Phys., 22, 15021–15033, https://doi.org/10.5194/acp-22-15021-2022, 2022.
Ruffault, J., Curt, T., Moron, V., Trigo, R. M., Mouillot, F., Koutsias, N., Pimont, F., Martin-StPaul, N., Barbero, R., Dupuy, J.-C., Russo, A., and Belhadj-Khedher, C.: Increased likelihood of heat-induced large wildfires in the Mediterranean Basin, Sci. Rep.-UK, 10, 13790, https://doi.org/10.1038/s41598-020-70069-z, 2020.
Saleh, R., Hennigan, C. J., McMeeking, G. R., Chuang, W. K., Robinson, E. S., Coe, H., Donahue, N. M., and Robinson, A. L.: Absorptivity of brown carbon in fresh and photo-chemically aged biomass-burning emissions, Atmos. Chem. Phys., 13, 7683–7693, https://doi.org/10.5194/acp-13-7683-2013, 2013.
Schuster, G. L., Dubovik, O., and Holben, B. N.: Angstrom exponent and bimodal aerosol size distributions, J. Geophys. Res.-Atmos., 111, D07207, https://doi.org/10.1029/2005JD006328, 2006.
Shettle, E.: Models of aerosols, clouds, and precipitation for atmospheric propagation studies, in: Atmospheric propagation in the UV, visible IR and MM-wave region and related systems aspects, Conference Proceedings no. 454, Advisory Group for Aerospace Research and Development, Copenhagen, Denmark, 9–13 October 1989, https://www.researchgate.net/publication/234312286_Models_of_aerosols_clouds_and_precipitation_for_atmospheric_propagation_studies (last access: 7 May 2023), 1989.
Soupiona, O., Papayannis, A., Kokkalis, P., Mylonaki, M., Tsaknakis, G., Argyrouli, A., and Vratolis, S.: Long-term systematic profiling of dust aerosol optical properties using the EOLE NTUA lidar system over Athens, Greece (2000–2016), Atmos. Environ., 183, 165–174, https://doi.org/10.1016/j.atmosenv.2018.04.011, 2018.
Srinivas, B., Rastogi, N., Sarin, M. M., Singh, A., and Singh, D.: Mass absorption efficiency of light absorbing organic aerosols from source region of paddy-residue burning emissions in the Indo-Gangetic Plain, Atmos. Environ. 125, 360–370, https://doi.org/10.1016/j.atmosenv.2015.07.017, 2016.
Stefenelli, G., Jiang, J., Bertrand, A., Bruns, E. A., Pieber, S. M., Baltensperger, U., Marchand, N., Aksoyoglu, S., Prévôt, A. S. H., Slowik, J. G., and El Haddad, I.: Secondary organic aerosol formation from smoldering and flaming combustion of biomass: a box model parametrization based on volatility basis set, Atmos. Chem. Phys., 19, 11461–11484, https://doi.org/10.5194/acp-19-11461-2019, 2019.
Stein, A. F., Draxler, R. R., Rolph, G. D., Stunder, B. J. B., Cohen, M. D., and Ngan, F.: NOAA's HYSPLIT Atmospheric Transport and Dispersion Modeling System, B. Am. Meteorol. Soc., 96, 2059–2077, https://doi.org/10.1175/BAMS-D-14-00110.1, 2015.
Taylor, R. G.: Heat Transfer: a Basic Approach, Aeronaut. J., 89, 198–198, https://doi.org/10.1017/S0001924000014780, 1985.
Tesche, M., Ansmann, A., Müller, D., Althausen, D., Engelmann, R., Freudenthaler, V., and Groß, S.: Vertically resolved separation of dust and smoke over Cape Verde using multiwavelength Raman and polarization lidars during Saharan Mineral Dust Experiment 2008, J. Geophys. Res.-Atmos., 114, D13202, https://doi.org/10.1029/2009JD011862, 2009.
Turco, M., Rosa-Cánovas, J., Bedia, J., Jerez, S., Montávez, J., Llasat, M., and Provenzale, A.: Exacerbated fires in Mediterranean Europe due to anthropogenic warming projected with non-stationary climate-fire models, Nat. Commun., 9, 3821, https://doi.org/10.1038/s41467-018-06358-z, 2018.
Vandaele, A., Hermans, C., Simon, P., Carleer, M., Colin, R., Fally, S., Mérienne, M., Jenouvrier, A., and Coquart, B.: Measurements of the NO2 absorption cross-section from 42 000 cm−1 to 10 000 cm−1 (238–1000 nm) at 220 K and 294 K, J. Quant. Spectrosc. Ra., 59, 171–184, https://doi.org/10.1016/S0022-4073(97)00168-4, 1998.
Vilagrosa, A., Hernández, E. I., Luis, V. C., Cochard, H., and Pausas, J. G.: Physiological differences explain the co-existence of different regeneration strategies in Mediterranean ecosystems, New Phytol., 201, 1277–1288, https://doi.org/10.1111/nph.12584, 2014.
Webb, A. R., Slaper, H., Koepke, P., and Schmalwieser, A. W.: Know your standard: clarifying the CIE erythema action spectrum., Photochem. Photobiol., 87, 483–486, https://doi.org/10.1111/j.1751-1097.2010.00871.x, 2011.
Weber, J. K., Kaufholdt, D., Minner-Meinen, R., Bloem, E., Shahid, A., Rennenberg, H., and Hänsch, R.: Impact of wildfires on SO2 detoxification mechanisms in leaves of oak and beech trees, Environ. Pollut., 272, 116389, https://doi.org/10.1016/j.envpol.2020.116389, 2021.
Weilnhammer, V., Schmid, J., Mittermeier, I., Schreiber, F., Jiang, L., Pastuhovic, V., Herr, C., and Heinze, S.: Extreme weather events in Europe and their health consequences – A systematic review, I. J. Hyg. Envir. Heal., 233, 113688, https://doi.org/10.1016/j.ijheh.2021.113688, 2021.
WMO: Guide to Instruments and Methods of Observation, WMO-No. 8, World Meteorological Organization, https://library.wmo.int/doc_num.php?explnum_id=11612 (last access: 6 June 2023), 2021.
Wu, Y., Nehrir, A. R., Ren, X., Dickerson, R. R., Huang, J., Stratton, P. R., Gronoff, G., Kooi, S. A., Collins, J. E., Berkoff, T. A., Lei, L., Gross, B., and Moshary, F.: Synergistic aircraft and ground observations of transported wildfire smoke and its impact on air quality in New York City during the summer 2018 LISTOS campaign, Sci. Total Environ., 773, 145030, https://doi.org/10.1016/j.scitotenv.2021.145030, 2021.
Zittis, G., Almazroui, M., Alpert, P., Ciais, P., Cramer, W., Dahdal, Y., Fnais, M., Francis, D., Hadjinicolaou, P., Howari, F., Jrrar, A., Kaskaoutis, D. G., Kulmala, M., Lazoglou, G., Mihalopoulos, N., Lin, X., Rudich, Y., Sciare, J., Stenchikov, G., Xoplaki, E., and Lelieveld, J.: Climate Change and Weather Extremes in the Eastern Mediterranean and Middle East, Rev. Geophys., 60, e2021RG000762, https://doi.org/10.1029/2021RG000762, 2022.