the Creative Commons Attribution 4.0 License.
the Creative Commons Attribution 4.0 License.
 | 22 Jun 2023
A simple model to assess the impact of gravity waves on ice-crystal populations in the tropical tropopause layer
Milena Corcos
Albert Hertzog
Riwal Plougonven
Aurélien Podglajen
The role of gravity waves on microphysics of tropical cirrus clouds and air-parcel dehydration was studied using the combination of Lagrangian observations of temperature fluctuations and a 1.5D model. High-frequency measurements during isopycnal balloon flights were used to resolve the gravity-wave signals with periods ranging from a few days to 10 min. The detailed microphysical simulations with homogeneous freezing, sedimentation, and a crude horizontal mixing represent the slow ascent of air parcels in the tropical tropopause layer (TTL). A reference simulation describes the slow ascent of air parcels in the tropical tropopause layer, with nucleation occurring only below the cold-point tropopause with a small ice-crystal density. The inclusion of the gravity waves drastically modifies the vertical profile of low ice concentration and weak dehydration found during the ascent alone, with the increased ice-crystal number and size distribution agreeing better with observations. Numerous events of nucleation occur below and above the cold-point tropopause, efficiently restoring the relative humidity over ice to equilibrium with respect to the background temperature, as well as increasing the cloud fraction in the vicinity of the cold-point tropopause. The corresponding decrease in water vapor is estimated at 2 ppmv around the cold-point tropopause.


Cirrus clouds are frequent and stand out as an important component in the Earth climate system (Winker and Trepte, 1998; McFarquhar et al., 2000). In the tropical tropopause layer (TTL), they notably regulate the amount of water vapor that enters the stratosphere via the freeze-drying mechanism, i.e., ice particles forming near the cold point and sedimenting out of the ascending air masses (Jensen et al., 1996; Holton and Gettelman, 2001; Gettelman et al., 2002; Fueglistaler et al., 2009; Randel and Jensen, 2013). Stratospheric water vapor affects not only the Earth's radiative budget (Solomon et al., 2010) but also ozone destruction, surface climate, and polar stratospheric clouds (Solomon et al., 1986; Toon et al., 1989). Microphysical characteristics of TTL cirrus, like ice-crystal number density, size, and shape, have a strong influence on their radiative properties (Smith et al., 1998). The size of ice crystals furthermore determines their sedimentation velocity, and therefore impacts TTL cirrus lifetimes as well as the humidity in the upper troposphere and stratosphere (Jensen et al., 2001).
The relative importance of homogeneous and heterogeneous freezing in the TTL is still debated (Jensen et al., 2018). In situ measurements found ice nuclei from anthropogenic emissions such as soot and sulfate (Chen et al., 1998) as well as a significant fraction of organic compounds (Cziczo et al., 2004). Jensen et al. (2001) argued that in mixtures of particles with different freezing thresholds, effective ice nuclei, even in a very small amount, can control the freezing and growth dynamics, but the competition for water vapor is relevant mainly during slow updrafts when homogeneous nucleation only freezes small ice densities, comparable to the number of efficient ice nuclei (Kärcher and Lohmann, 2002). Furthermore, measurements of RHi ranging from 1.1 to 1.7 in this region (Krämer et al., 2009) seem to suggest that the majority of aerosols are hard to freeze, and the small amount of effective ice nuclei would not fully suppress homogeneous freezing. Thus, homogeneous freezing is expected to be prevalent in the TTL (Kärcher, 2004; Krämer et al., 2009; Spichtinger and Krämer, 2013).
Homogeneous freezing of aqueous aerosols is strongly sensitive to cooling rates (Jensen and Toon, 1994; Kärcher and Lohmann, 2002), so that the life cycle and microphysical properties of TTL cirrus are sensitive to temperature perturbations induced by gravity waves (Jensen and Pfister, 2004). Several idealized model studies explored the effects of wave-induced temperature variability on cirrus properties (Kärcher, 2003; Jensen and Pfister, 2004; Haag, 2004; Hoyle et al., 2005). The associated impact on dehydration in the TTL is still only partially understood though, as it notably depends on the amplitude and intrinsic frequency of the wave-driven perturbations (Pfister et al., 2001; Jensen and Pfister, 2004; Kim and Alexander, 2015; Schoeberl et al., 2015), as well as on whether TTL cirrus form in situ or are anvils of convective clouds (Kärcher et al., 2006; Corti et al., 2008; Schiller et al., 2009; Spichtinger and Krämer, 2013; Schoeberl et al., 2014). A number of processes, with a wide range of scales, affect the formation and evolution of cirrus clouds. Thus, any modeling effort will induce important simplifications or even omissions on parts of the processes involved.
Detailed microphysical simulations of TTL cirrus have naturally used Lagrangian box models (Hoyle et al., 2005), which are able to resolve the size distribution of ice crystals. Such models can notably estimate ice concentration maxima, yet a critical limitation is their difficulty to infer the dehydration of air parcels and the evolution of cirrus clouds on timescales significantly longer than that associated with nucleation. Other models track the size and heights of ice crystals in a curtain approach (Jensen and Pfister, 2004). At larger scales, the Community Aerosol and Radiation Model for Atmospheres (CARMA) (Toon et al., 1988; Bardeen et al., 2008), which represents crystal formation, growth, aggregation, and sedimentation, can be combined with global circulation models. Ultimately though, detailed information about the temperature variability experienced by air parcels is crucial to address the issue of small-scale dynamic impacts on cirrus clouds (Jensen et al., 2016). In that regard, superpressure balloon observations providing in situ measurements of wave-driven temperature variability in a quasi-Lagrangian framework were also used in idealized box-model simulations (Dinh et al., 2016; Jensen et al., 2016). These studies were nevertheless limited by the absence of sedimentation, which has a prominent role in determining ice concentration in cirrus clouds (Jensen et al., 2012, 2013b; Murphy, 2014).
This paper further addresses the question of gravity-wave impacts on in situ tropical cirrus clouds. Our approach is to combine Lagrangian observations of temperature fluctuations to a simplified representation of microphysics to assess both TTL cirrus ice-crystal densities and dehydration efficiency. Our observation dataset is that collected during eight superpressure balloon flights in the deep tropics, realized in the frame of the first Stratéole-2 campaign. This campaign took place in the boreal winter of 2019, and the balloon flights recorded time series of temperature fluctuations at ∼19 km of altitude for 3 months typically. Our microphysical model is able to resolve ice-crystal homogeneous nucleation, growth, sublimation, and sedimentation. It also includes a simplified representation of horizontal mixing, which has been found to be important in the life cycle and evolution of long-lived TTL cirrus clouds (Dinh et al., 2010).
The plan of the paper is as follows: Sect. 2 provides details on our method and simulations. In the Sect. 3, TTL cirrus found in simulations with and without gravity waves are described. Section 4 discusses in more detail the impacts of gravity waves on cirrus microphysical properties and dehydration efficiency, as well as sensitivity of ice production to gravity-wave amplitudes in our simulations. We also compare our results to in situ observations of TTL cirrus clouds in this Section. The main conclusions of our study are provided in the Sect. 5.
2.1 Balloon-derived Lagrangian temperature time series
The wave-resolving temperature time series used in this study are derived from superpressure balloons measurements collected during the 2019 Stratéole-2 campaign. During this campaign, eight balloons were launched by the Centre National d'Etudes Spatiales (CNES) in November and December, from Mahé Island (55.52∘ E, 4.67∘ S) in the Indian Ocean. The balloons drifted for 2–3 months at altitudes between ∼18.5 and ∼20.5 km within the whole tropical belt. More information about the balloon trajectories and their environment during the flights can be found in Corcos et al. (2021).
Superpressure balloons directly record the intrinsic periods of wave motions, i.e., the period of disturbances felt by air parcels advected by the atmospheric flow (Nastrom, 1980; Hertzog and Vial, 2001). During the Stratéole-2 campaign, each balloon was carrying a Thermodynamical SENsor (TSEN) instrument that records pressure and temperature every 30 s, hence resolving the whole gravity-wave spectrum. In this study, we have chosen not to use the direct temperature measurements recorded onboard the balloons since they tend to be influenced by the flight chain wake during the day. Instead, we have reconstructed temperature disturbances from pressure measurements. This reconstruction is based on three assumptions: (i) wave perturbations are hydrostatic, which enables us to relate the pressure disturbance to the balloon vertical displacement (), (ii) superpressure balloons drift on constant-density surfaces (Vincent and Hertzog, 2014), and (iii) wave perturbations are fast enough so that they can be considered as adiabatic transformations. These assumptions are valid for waves with intrinsic periods significantly longer than the Brunt–Väisälä period (∼5 min in the lower stratosphere) but shorter than the radiative damping time in the TTL (20–30 d, Gettelman et al., 2004).
The isentropic air-parcel displacements (ζ′) then relate to those of the balloons according to, e.g., Boccara et al. (2008) and Podglajen et al. (2016):
where
where g is the gravitational acceleration, cp and Ra the specific heat at constant pressure and perfect gas constant per unit mass for dry air, respectively, and the vertical gradient of the background temperature, estimated from ERA5. Then, following adiabaticity, the Lagrangian temperature fluctuations may be deduced (e.g., Podglajen et al., 2016):
and are checked to be very close to the raw temperature measurements. To be consistent with the above assumptions and to specifically study the role of gravity waves in cirrus cloud microphysics, we have applied a Bessel band-pass filter to the balloon time series, with cutoff periods at 15 min and 1 d. In particular, this enables us to damp disturbances with periods close to 5 min in the observations that are mostly associated with the balloon own dynamics (Vincent and Hertzog, 2014; Podglajen et al., 2016). The longer cutoff period is meant to focus on pure gravity waves in the tropics. We have checked that our results are qualitatively not sensitive to the filtering method.
It should be noted that the balloon data from Corcos et al. (2021) were obtained at altitudes slightly above that of interest (the upper TTL, 17 km). Contrary to Schoeberl et al. (2018), we did not reduce the amplitude of the stratospheric balloon fluctuations, since Lagrangian temperature fluctuations are expected to be roughly constant over that altitude range, contrary to Eulerian ones (Podglajen et al., 2016; Kärcher and Podglajen, 2019).
2.2 Microphysics model and experiment setup
2.2.1 1.5D representation of microphysics
Our microphysical model aims to study the in situ formation and evolution of cirrus clouds at high altitudes. It is based on the model developed in Dinh and Durran (2012) and Dinh et al. (2016), which simulates the homogeneous nucleation and growth of ice crystals in a single box under varying temperature and pressure conditions. The evolution of ice-crystal numbers and mass is detailed in 36 size bins, with radii ranging from 0.25 µm to 0.1 mm. Nucleation occurs by freezing on aerosol described by one bin of size, since previous studies have shown that ice formation generated by homogeneous freezing is not very sensitive to the aerosol size distribution (Jensen and Toon, 1994). This assumption is discussed in Sect. 4.1 below. The aerosol concentration is chosen as 230 cm−3, guided by observations of aerosols in the upper troposphere (Hermann et al., 2003). The nucleation rate is computed according to the formulae of Koop et al. (2000), which assume that the nucleation rate coefficients solely depend on the difference of activity between the liquid aerosol solution and ice. Nucleation therefore occurs for relative humidity with respect to ice (RHi) of 157 %–158 %.
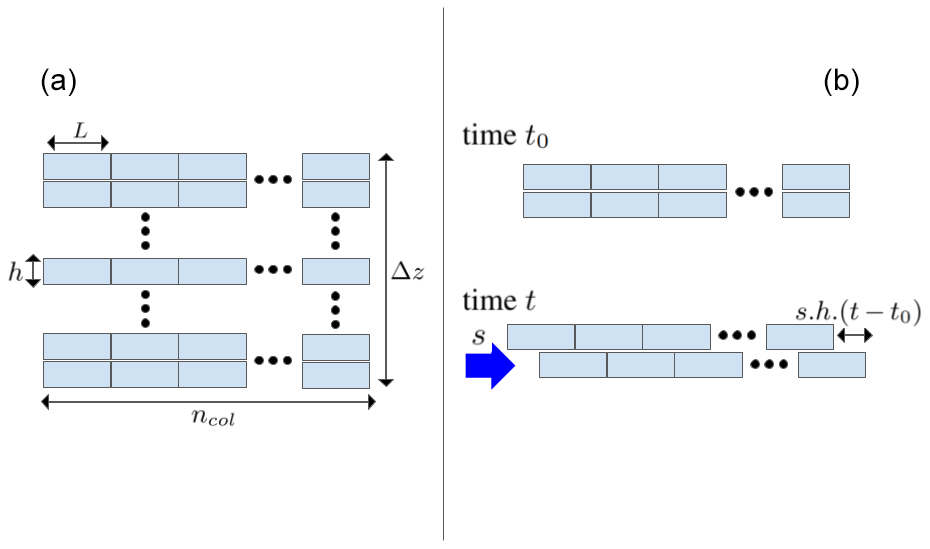
The microphysical box model used in Dinh et al. (2016) does not include a description of sedimentation. Yet, the size-resolved distribution of ice crystals allows us to estimate a terminal velocity for each size bin, and hence, with an assumption of the box thickness, an outgoing mass flux rate. We have therefore extended this microphysical model into the vertical dimension to represent sedimentation. Furthermore, we have included a crude representation of vertical wind shear so that ice crystals can mix horizontally and are not constrained to stay in vertical columns (Kärcher, 2002; Jensen et al., 2013a, 2016). The geometrical setup of air parcels in our 1.5D model is displayed in Fig. 1a.
The sedimentation fall speed is calculated assuming spherical-shaped crystals and is based on the Reynolds number (Re) of the flow around the crystals (Böhm, 1989, Eq. 11). It uses an Oseen–Best regime for , and a Stokes-Cunningham regime at smaller Re (Kärcher, 2003). The fraction of ice-crystal number that sediments from one air parcel to that directly below (fs(r)) is inferred assuming a uniform distribution of crystals in air parcels. It is as follows:
where r is the radius of the ice crystal, h is the thickness of the air mass, and dt is the time step of the model. The vertical shear of horizontal wind (s) further contributes to advecting ice crystals horizontally during their sedimentation. Our implementation of sedimenting ice crystals includes a module aimed at a rough representation of wind shear (right panel of Fig. 1); namely, during a time δt, a given row of air parcels (at a given altitude) has been horizontally advected by sh δt with respect to that immediately above or below. When this displacement becomes larger than half of the air-parcel length (L), we randomly shuffle air parcels in every row and get back to the situation where columns are vertically aligned, as depicted at time t0 in Fig. 1. This thus happens every . Unless otherwise noted, we assume a vertical shear typical of the tropical upper troposphere and lower stratosphere (UTLS) (s=10 m s−1 km−1), and the air parcels are therefore shuffled every 500 s (see Table 1 below).
The nucleation and growth of ice crystals simulated by our model are validated by comparison to Spichtinger and Krämer (2013). We find the same relationship between constant vertical updraft speeds and ice-crystal number concentration: a power-law variation for the slower vertical speeds and a saturation in ice-crystal number associated with the pre-existing background aerosol reservoir for the highest speeds (Spichtinger and Gierens, 2009). The simulated amount of ice crystals is furthermore found to be of the same order of magnitude.
2.2.2 Model dynamics
The temperature evolution of individual air parcels in the model includes two different processes. First, diabatic heating forces air parcels to slowly ascend through the TTL (Fueglistaler et al., 2009). This mean vertical motion is represented in the model by a constant vertical speed mm s−1, typical of the TTL (e.g., Jensen et al., 2001; Boehm and Lee, 2003; Salby and Callaghan, 2004). As air parcels ascend diabatically, their temperature adjusts on a background temperature profile (, see Fig. 2) representative of the TTL (Kärcher and Podglajen, 2019). Second, air parcels optionally undergo adiabatic temperature disturbances generated by gravity waves. To represent these fluctuations, a time sample with the same duration than that of the simulation is randomly chosen in the balloon-borne temperature-disturbance time series for each model air parcel independently. While these wave-driven Lagrangian temperature disturbances are associated with air-parcel vertical displacements in the real atmosphere, we do not track those vertical motions in the model. By doing this, we assume that the wave-driven disturbances are associated with linear waves, inducing on average zero net vertical displacement. The altitudes of air parcels in the model therefore only evolve due to the slow diabatic ascent.
Two obvious limitations of the model need to be highlighted: first, we did not attempt to represent the correlation of wave-driven temperature fluctuations between nearby air parcels. In a sense, our simulations thus maximize the random effect of gravity waves in microphysical processes. Furthermore, each simulation is therefore an ensemble of independent wave time series, and we have checked that the resulting microphysical properties consequently do not depend on the details of each air-parcel temperature fluctuation. An opposite experiment was run, with a total correlation between all air parcels; the results are not shown here as they are too sensitive to the time series of temperature fluctuations picked and required more simulations to converge statistically. Second, our microphysical model does not represent the dynamics induced by the cloud itself, such as turbulence or radiatively driven effects. Our simulations therefore apply to situations where those effects can be neglected at first order, i.e., optically thin cirrus associated with weak heating rates (Jensen et al., 2016).
2.2.3 Model configurations
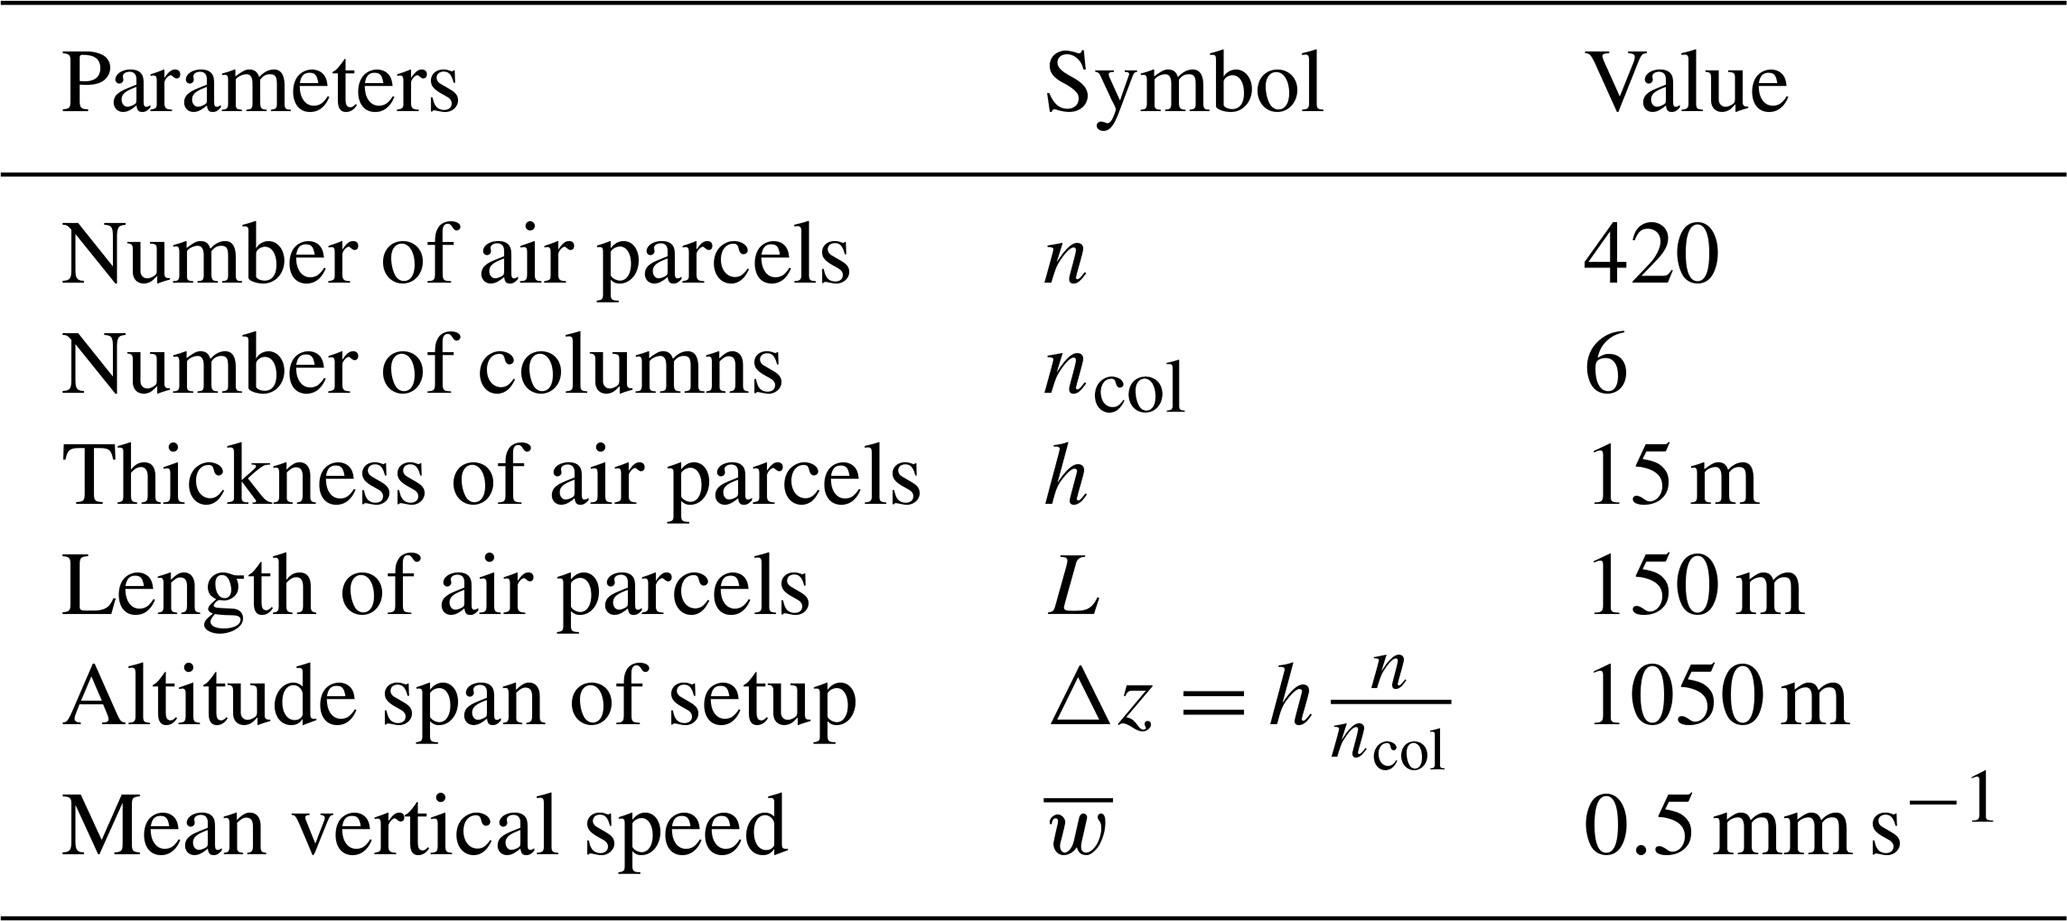
The simulation geometry (number of rows and columns) and that of individual air parcels (vertical thickness and horizontal length) are free parameters of the model. In the simulations displayed in this study, we have always used the same geometry: 6 columns of 70 rows with 15 m thick and 150 m long air parcels. In particular, the air-parcel thickness was set as in Jensen et al. (2010), i.e., allowing the growth of ice crystals within the air parcel while maintaining a fine vertical resolution. Sensitivity tests have shown that our results do not depend on this specific choice. The common parameters of all our simulations are recalled in Table 1.
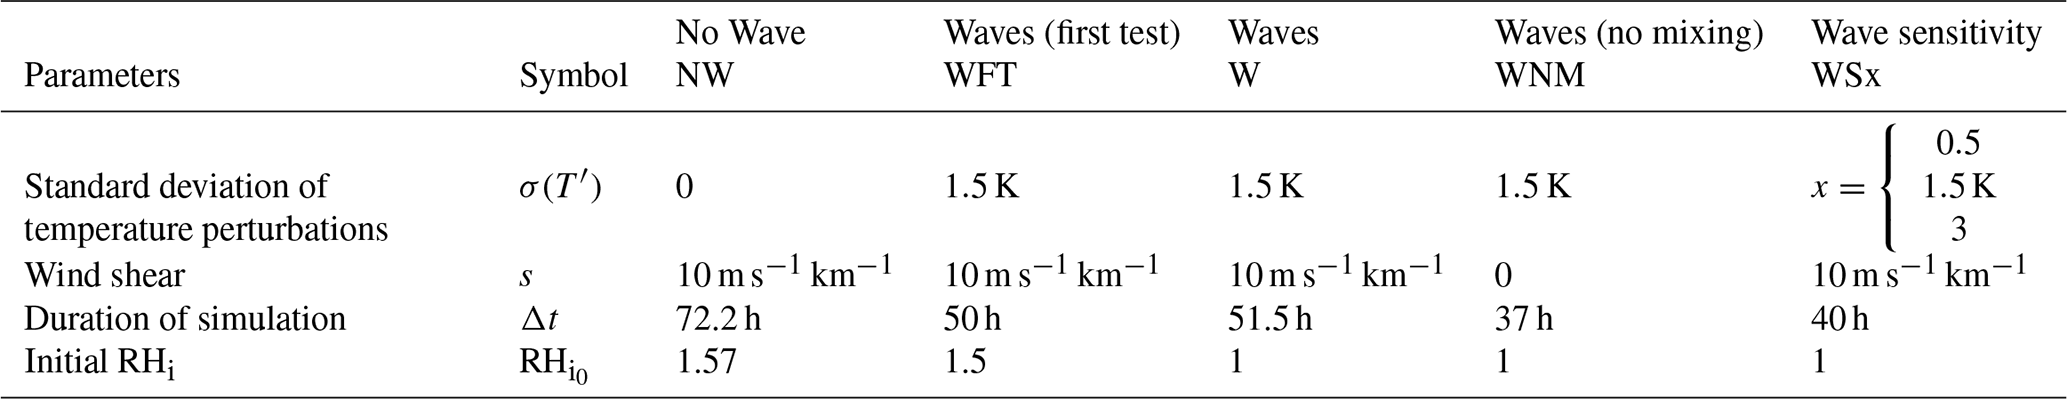
Seven simulations are performed in this study to assess the impact of gravity waves on ice-crystal populations. The details of these simulations are displayed in Table 2. First, a no-wave control simulation (NW) aims at representing TTL cirrus clouds generated by the slow radiative ascent only. The six other simulations all include wave-induced temperature perturbations. A preliminary simulation (wave first test, WFT) starts with the same (large) initial relative humidity (RH) than the no-wave simulation. We argue in the following that this is not the optimal choice for a wave simulation. Hence, we will discuss the third simulation (W) in more detail, in which RH.
The four other simulations illustrate the sensitivity of our results to simulation details and are thus used in the discussion part of the paper. In the no-mixing experiment (WNM), we toggle off the mixing associated with wind shear. The three remaining experiments are designed to test the sensitivity of ice production to wave amplitudes. These experiments are referred to as WSx, where , or 3 K is the standard deviation of the wave-induced temperature fluctuations. In these experiments, we have simply rescaled the balloon-borne temperature fluctuations to enforce a given standard deviation in each model air parcel. In particular, the WS1.5 experiment differs from the W simulation in the sense that the standard deviation of wave-induced temperature fluctuations is 1.5 K only in average over all model air parcels in the W simulations (and thus may slightly vary from one air parcel to the other), while it is strictly 1.5 K for each air parcel in the WS1.5 experiment.
Finally, the relative humidity at the start of the simulation (RH) is constant along all the columns and the aerosol content. RH varies between our simulations and the choice of this parameter is further discussed below, but we will see that longer simulations remove the sensitivity to the initial relative humidity.
3.1 The slow-ascent simulation
The NW simulation corresponds to a 72 h ascent of air parcels encompassing the cold-point tropopause. During that time frame, air parcels have ascended for ∼130 m. Due to the slow vertical speed, the associated cooling rates are very low, typically ±4 mK h−1 (Fig. 2). The initial relative humidity (RH) is chosen close enough to the nucleation threshold so that nucleation occurs during the simulation. We will first qualitatively describe the ice formation, its evolution in time and altitude, and then we will focus on the population of ice crystals.
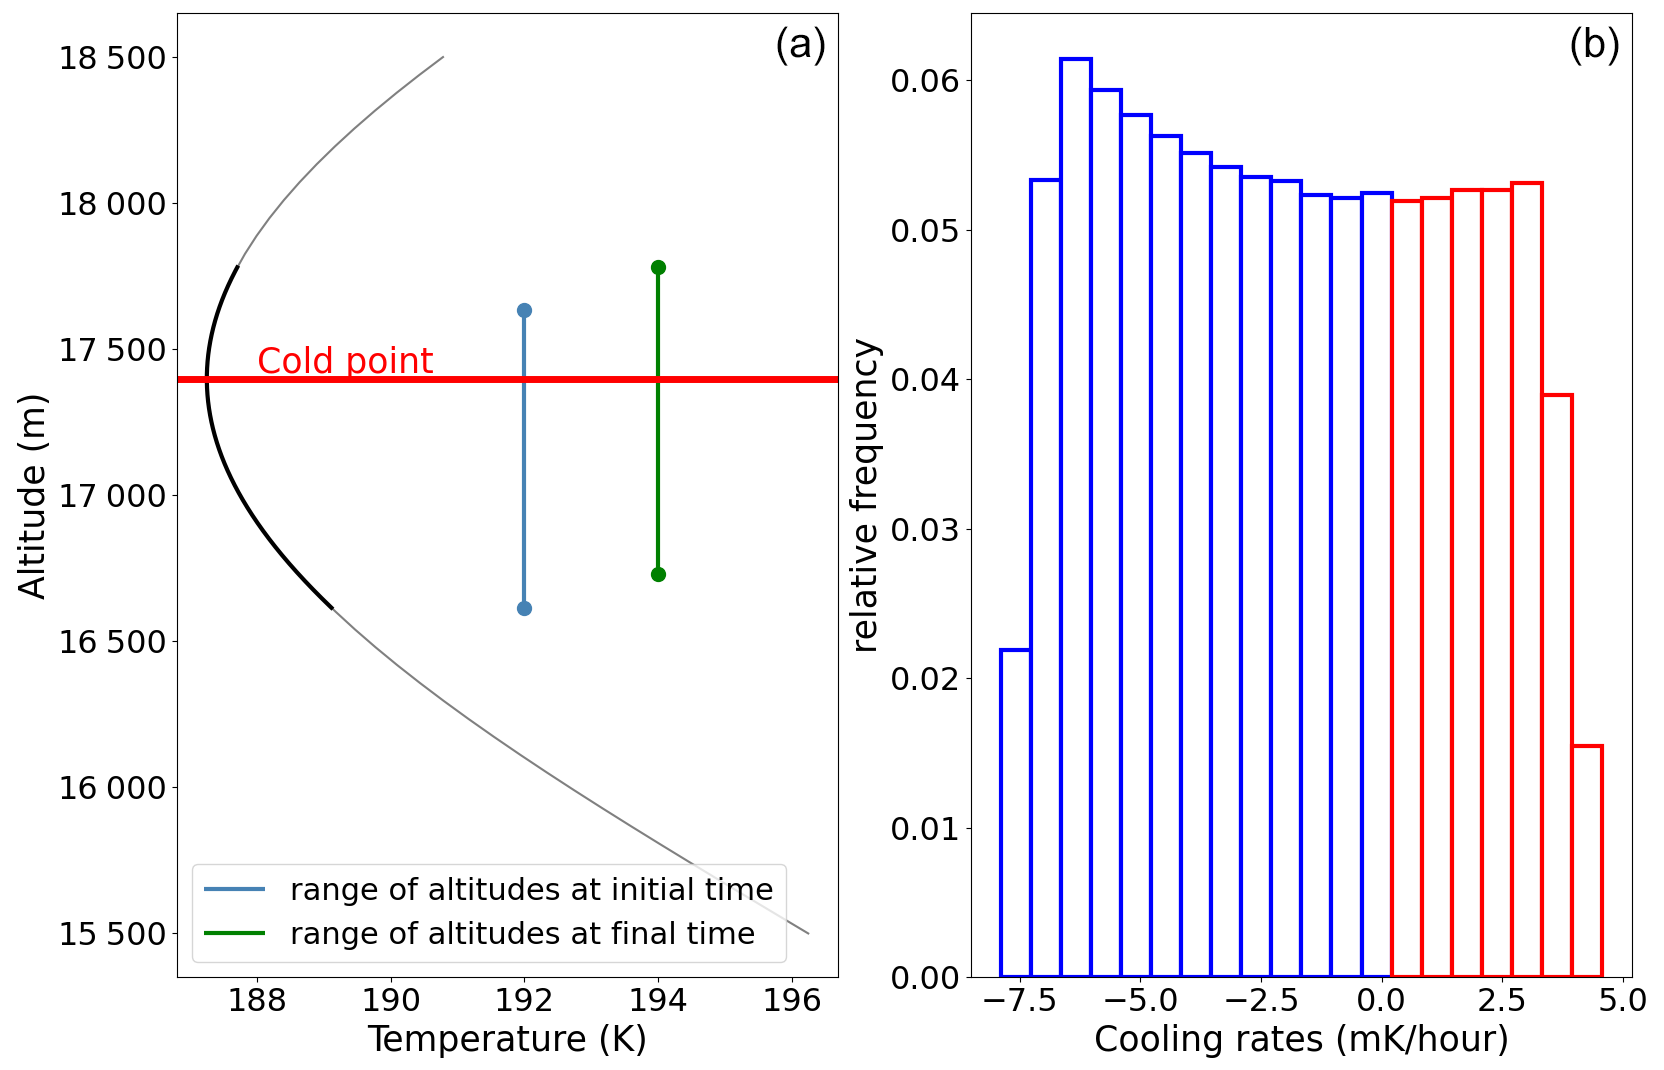
Figure 2(a) Temperature profile based on Kärcher and Podglajen (2019) radiosonde measurements in the tropics (171∘ E, 7∘ N), averaged over a year. The range of temperatures seen by air parcels in the NW simulation is highlighted in black. The initial and final altitude ranges of air parcels are indicated by the blue and green vertical bars, respectively. (b) Corresponding cooling rates with an ascent speed of 0.5 mm s−1.
Figure 3 displays the evolution of the ice mass and ice-crystal number as a function of time and altitude. Below an initial altitude of ∼17.1 km, all air parcels undergo at least one nucleation event, which occurs later and later as the altitude increases (and the absolute temperature gradient decreases). In contrast, the RHi of air parcels located closer (or even above) the cold point never crosses the nucleation threshold. This dependence of the cooling rates with altitude also explains that the largest numbers of nucleated ice crystals are found in the lowest layers of the simulated domain (e.g., Spichtinger and Krämer, 2013) and at the beginning of the air-parcel ascent.
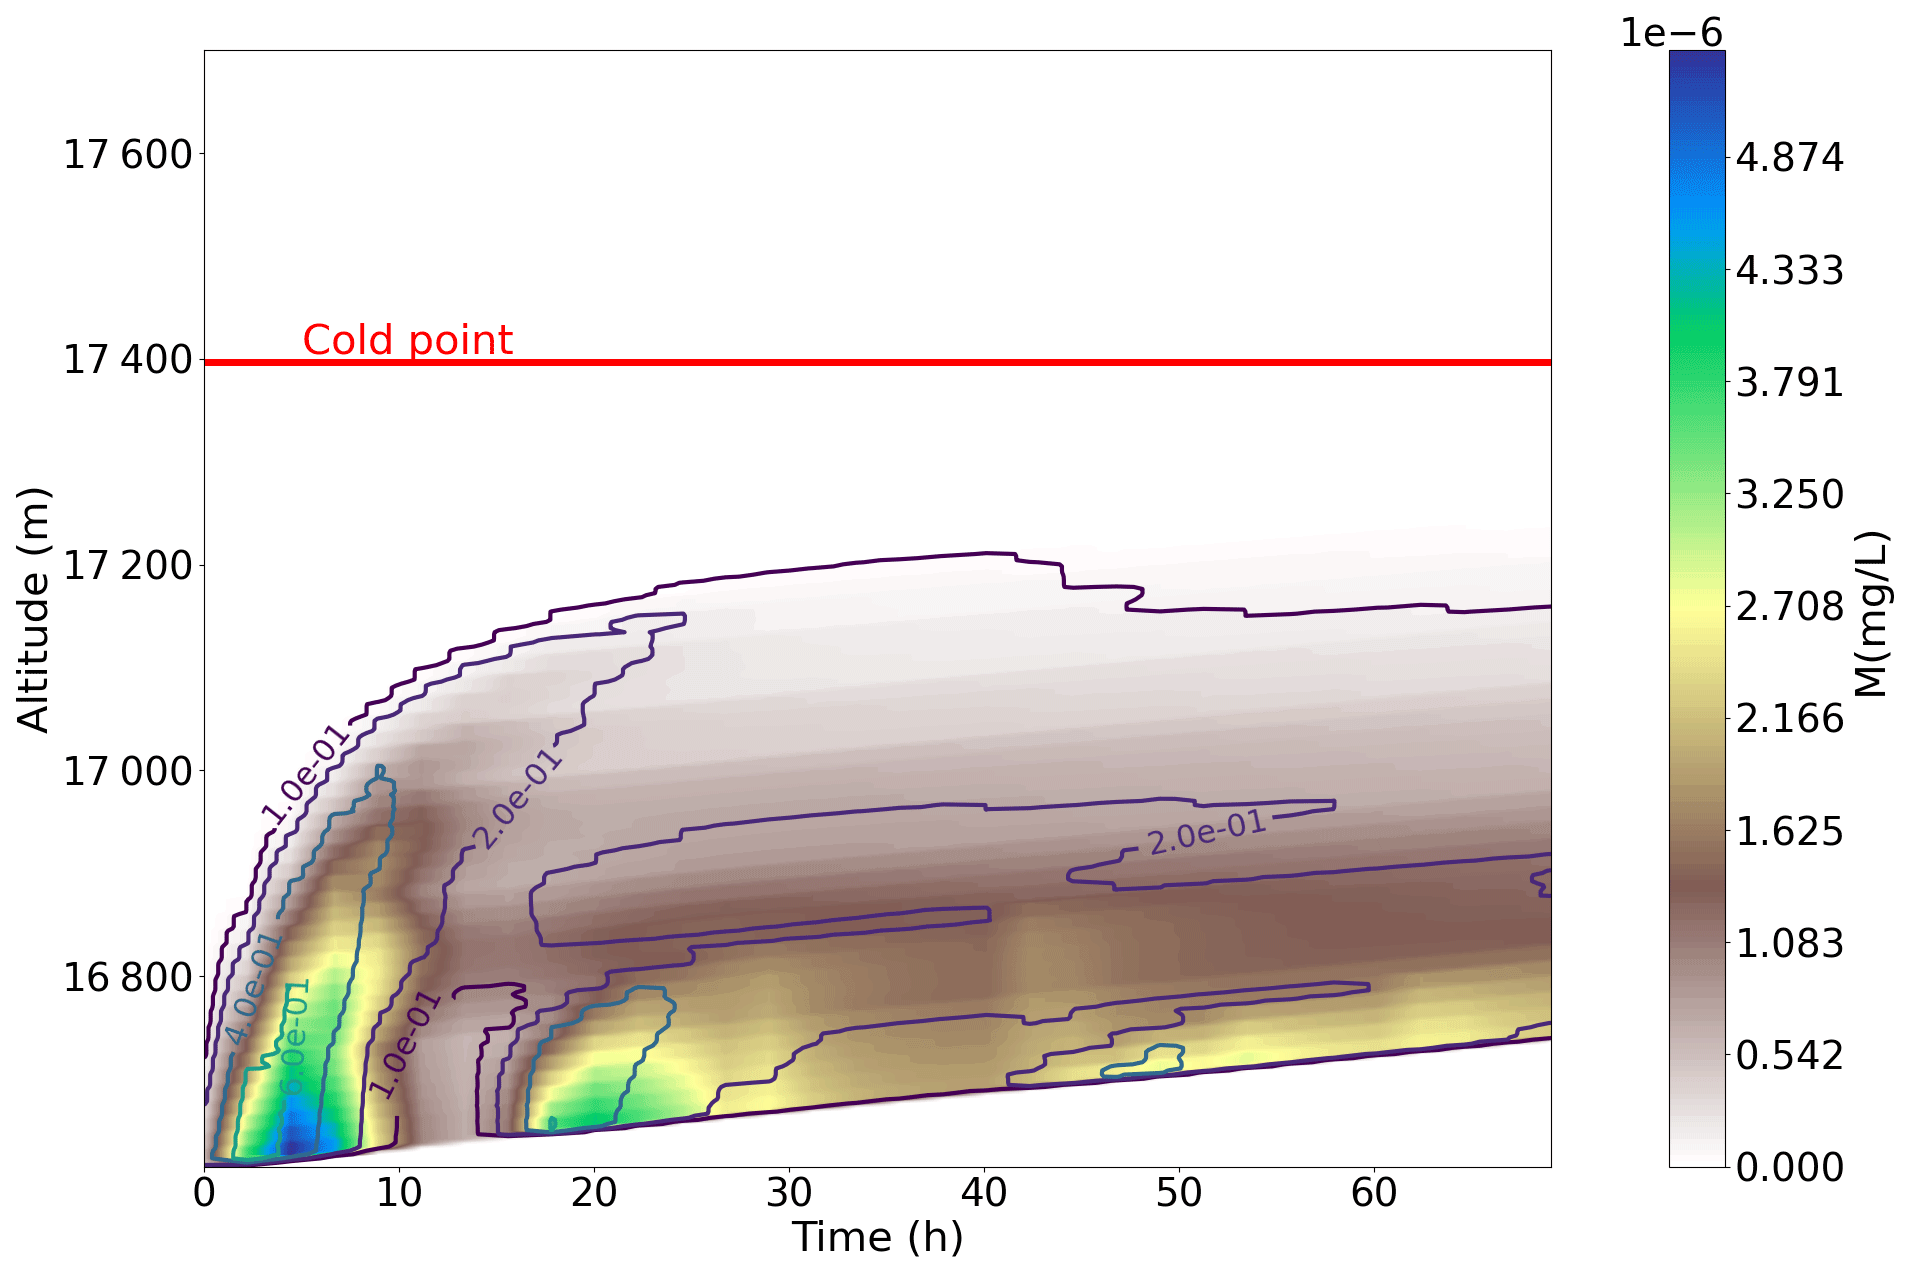
Figure 3Evolution of ice mass (in mg L−1, color) and ice-crystal number (in L−1, contours) in time and altitude for a simple slow ascent of 420 air parcels.
The evolution in time and altitude of the crystal size distribution during the NW simulation is displayed in Fig. 4. The time evolution (left panel) and altitude evolution (right panel) are respectively a vertical average and a time average over the whole domain. The time evolution clearly exhibits the three nucleation events: at t<10 t∼20–30, and t∼40 h. During these events, ice crystals reach 5 µm within less than 1 h, while it takes ∼5 h for them to grow beyond 15 µm. This timescale, which is associated with the very low temperatures of the tropical tropopause, is prone to include modulation of the crystal growth by gravity waves, as suggested in Dinh et al. (2016) and Podglajen et al. (2018). Beyond 15 µm, the ice crystals tend to sediment quickly out of the model domain so that the size distribution in this NW simulation is fairly narrow and peaks at ∼14 µm, in agreement with previous results (e.g., Jensen et al., 2010).
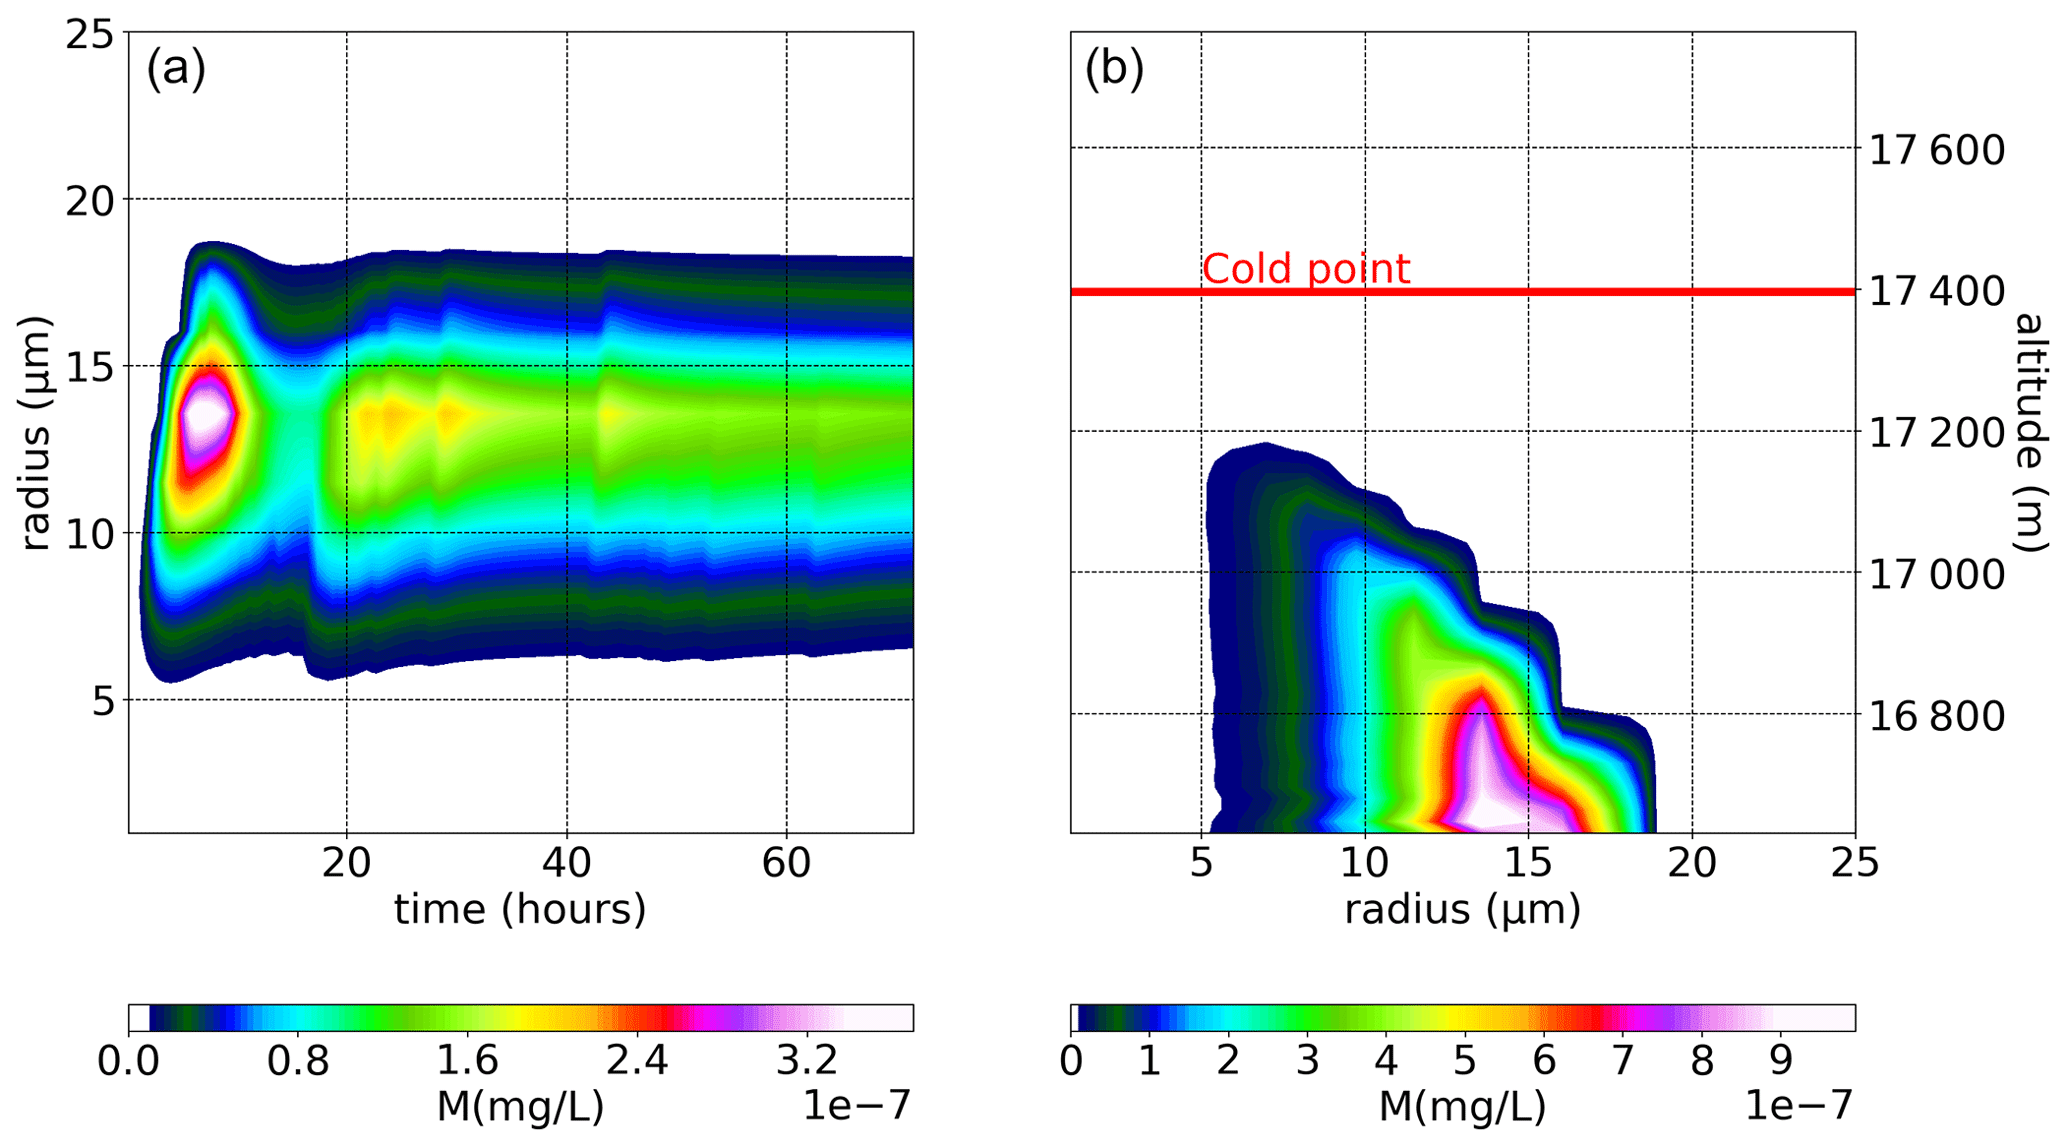
Figure 4Evolution of ice mass in time (a) and altitude (b) for the NW simulation. Bins filled with more than 1 ice crystal per cubic meter are colored.
This is further illustrated in Fig. 5, which shows typical timescales for sedimentation and growth of ice crystals depending on their size. Regarding sedimentation, the timescale shown corresponds to the time needed for half of the ice crystals to leave an air parcel of height h=15 m. The timescale associated with crystal growth depends on supersaturation (RHi−1), and it is displayed for a supersaturation typical of the NW simulation (0.6) and a lower value (0.25), which will be used later on. In the NW simulation, the two timescales are of similar value for ice particles with r=7 µm. Indeed, it can be observed on the right panel of Fig. 4 that particles with larger radii are not observed in the upper layers where nucleation occurs. Hence, particles with r>7 µm typically grow while they sediment and are thus not encountered in the layers where they have nucleated. On the other hand, the sedimentation timescale for ice crystals with r<3–4 µm is 1 order of magnitude larger than their growth timescales, and those particles are then mostly observed in the layer where they have nucleated. The sedimentation timescale for the bulk of the largest particles (r∼15 µm) in the NW simulation is h. Since those particles are observed 5 h after the start of the simulation, they have typically fallen over a few hundreds of meters, which corresponds approximately to the height difference between the model base and the uppermost layer where nucleation occurs (Fig. 4).
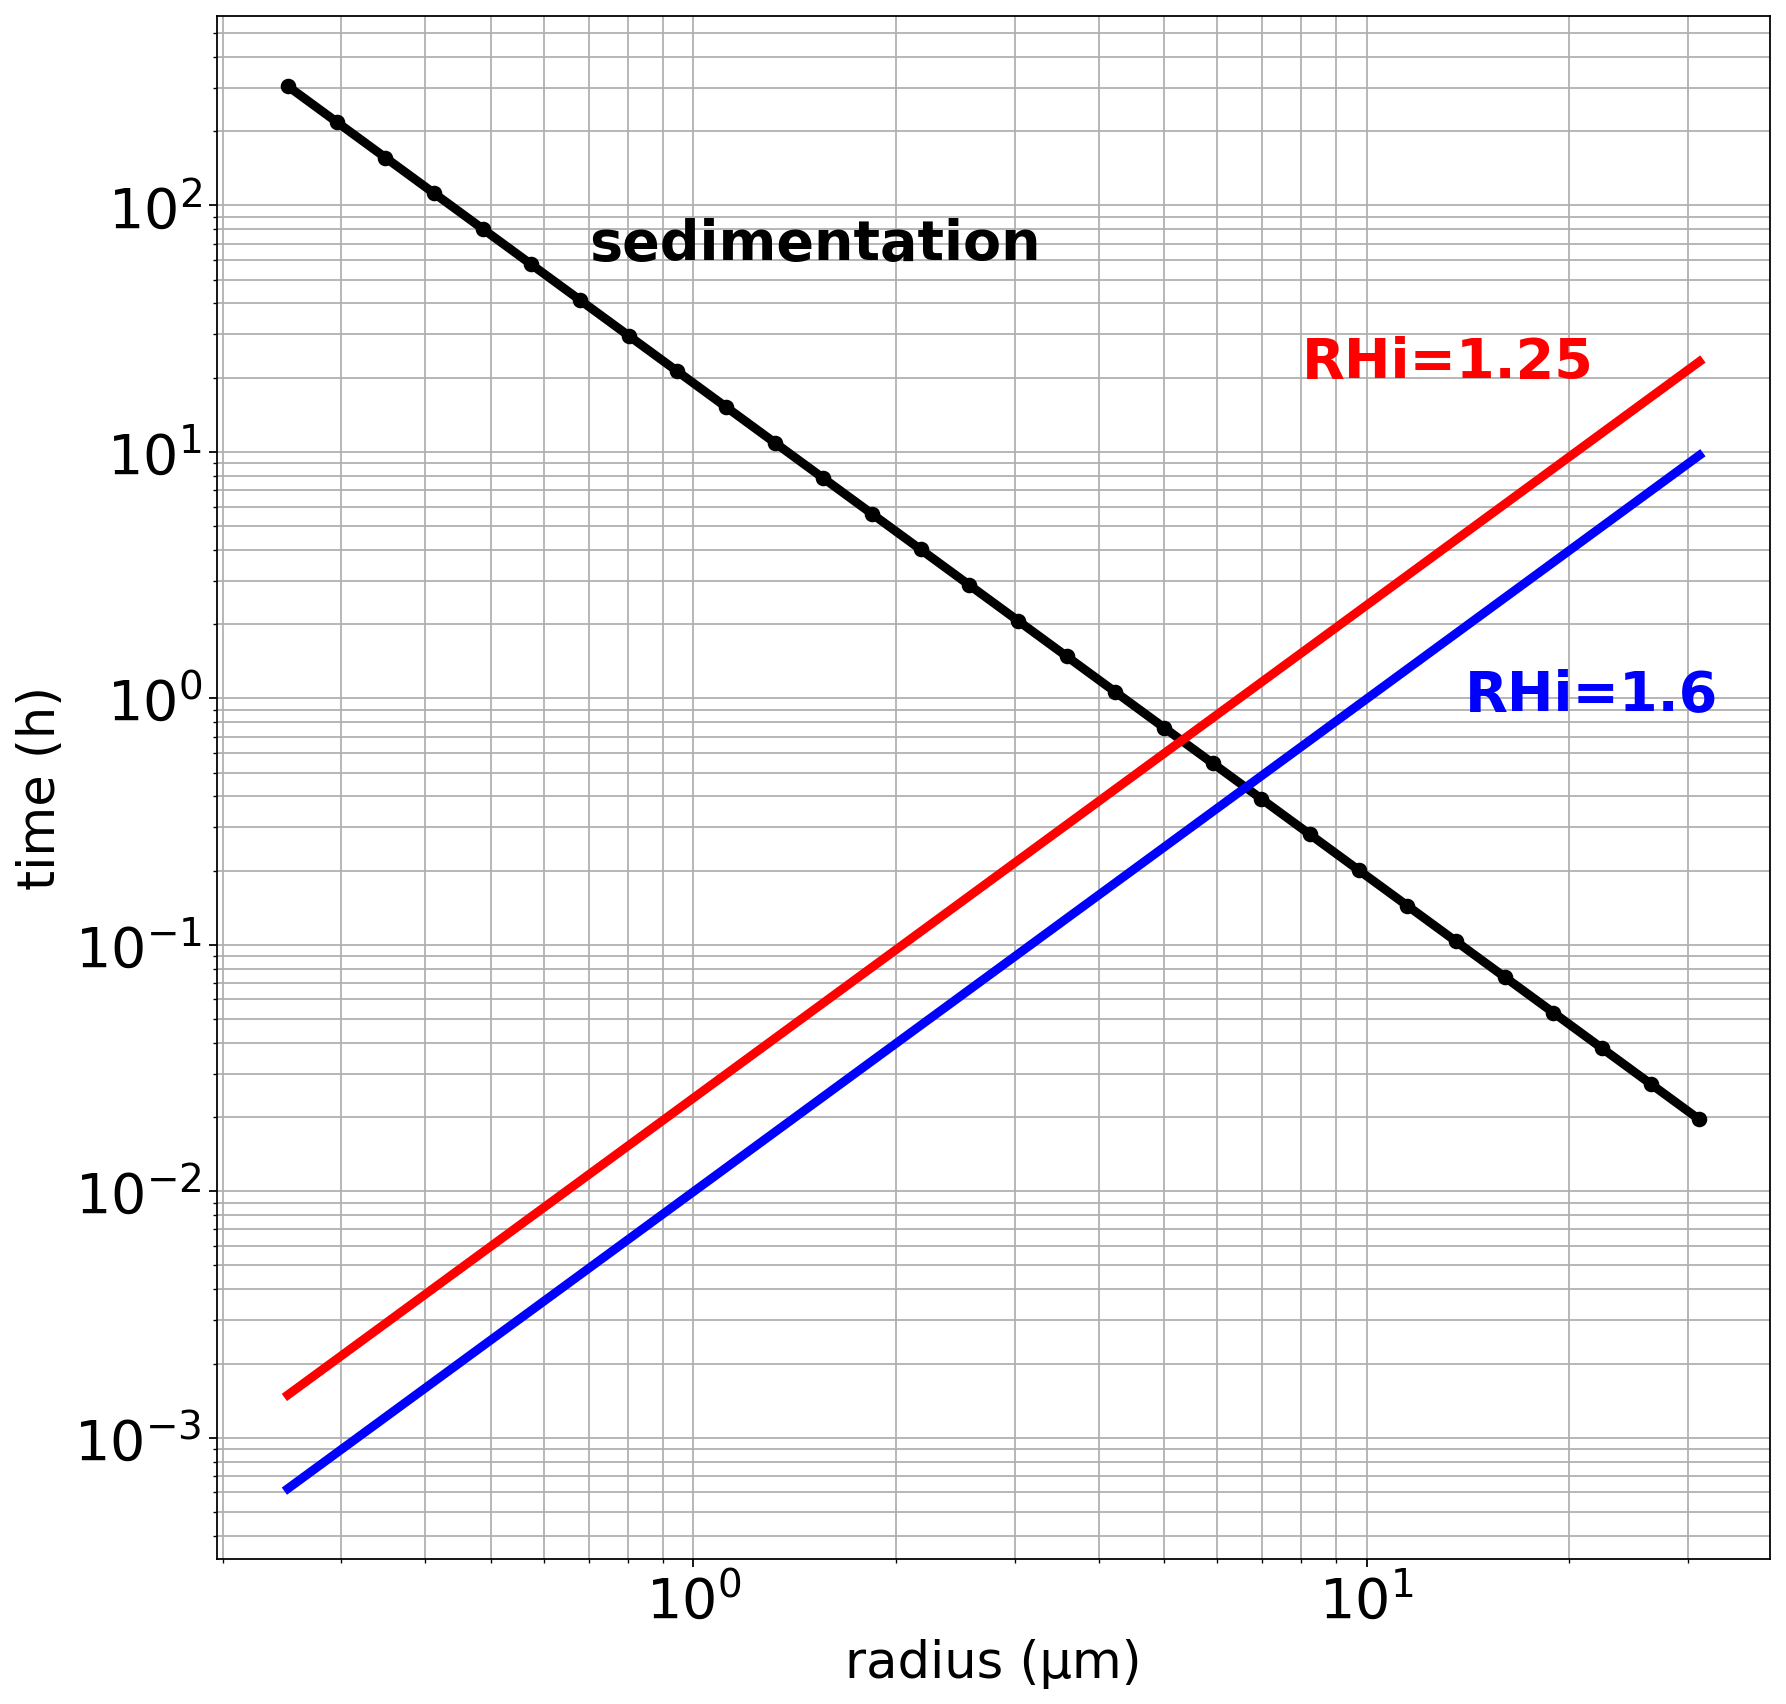
Figure 5Typical timescales of ice-crystal (black) sedimentation, (red) RHi=1.25, and (blue) RHi=1.6 growth rates, depending on their size.
3.2 The gravity-wave simulations
3.2.1 A preliminary experiment
A first test simulation that includes wave-induced temperature perturbations (WFT) is performed with an initial relative humidity close to the nucleation threshold (), as in the NW simulation. The evolution of the mean relative humidity in the simulated domain is displayed in Fig. 6. The wave-driven temperature perturbations trigger multiple events of nucleation, and the stronger cooling rates encountered by air parcels hugely increase the ice-crystal production in comparison with the NW simulation, as already highlighted in previous studies (Dinh et al., 2016; Jensen et al., 2016; Kärcher et al., 2019). The ice-crystal growth in the supersaturated environment efficiently depletes the water vapor, and the mean relative humidity consequently decreases within a few hours toward a value close to equilibrium (0.95). This behavior is in stark contrast with the NW simulation, where the low number of ice crystals produced did not succeed to significantly reduce the relative humidity. It is a strong indication that waves likely allow a faster dehydration of air parcels more efficient than the slow large-scale ascent.
Yet, the initial decrease in relative humidity seen in the WFT simulation is unlikely to occur in the real atmosphere and rather indicates a flaw in the initial relative humidity, which is inconsistent with the ubiquitous presence of gravity waves. We therefore designed a more realistic wave experiment (W) that starts with an initial relative humidity of 1 and is described in more detail in the following section. During this simulation, the domain-averaged RHi varies in a very limited range.
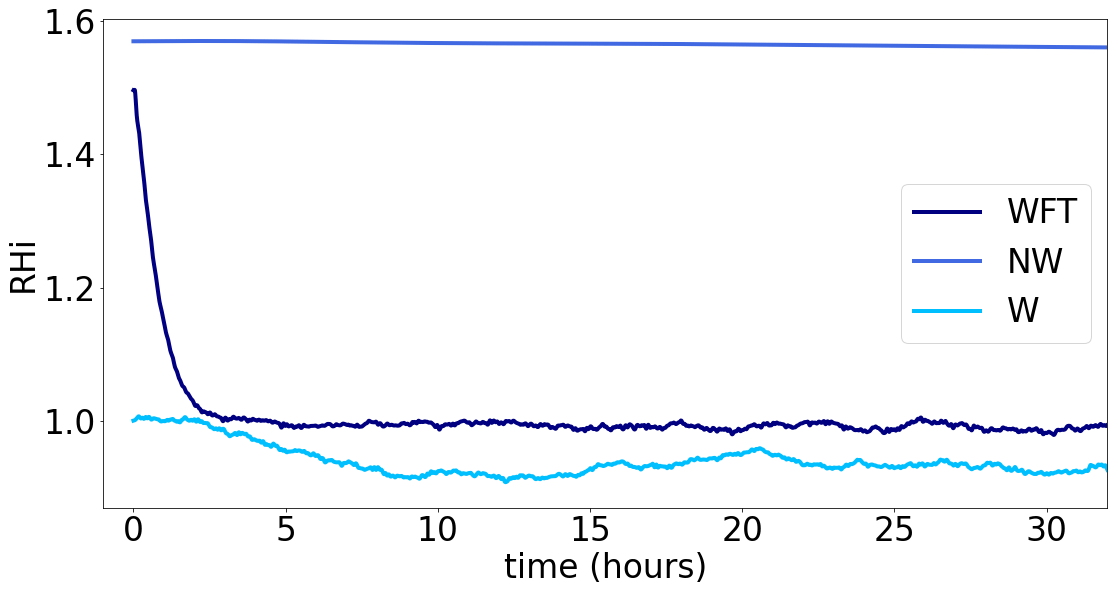
Figure 6Evolution of relative humidity with respect to ice for the simulations WFT, NW, and W.
3.2.2 A more realistic wave simulation
As already mentioned, one major effect of gravity waves is to widen the distribution of heating and cooling rates experienced by air parcels. This is illustrated in Fig. 7, which shows the temperature time series for two air parcels respectively located below and above the cold-point tropopause, as well as the probability distribution function of 30 s heating/cooling rates in the whole domain. Recall that the temperature fluctuations are random samples of balloon observations in the tropical lower stratosphere. The short-period wave-driven perturbations obviously dominate the either negative or positive temperature trend associated with the large-scale ascent. The standard deviation of heating/cooling rates in the wave simulations is 5 K h−1, i.e., a thousand times larger than in the NW simulation, which drastically modifies ice production.

Figure 7(a) Time series of temperature for two air parcels at different altitudes. Background temperature interpolated from Kärcher and Podglajen (2019) radiosonde is superposed. (b) Corresponding cooling rates with an ascent speed of 0.5 mm s−1.
Figure 8 displays the evolution of the mean ice mass in the simulated domain in the W simulation. In contrast with the NW simulation, nucleation occurs almost constantly during the whole duration of the simulation. Furthermore, as the wave-induced temperature fluctuations are dominating air-parcel temperature evolution, ice crystals are produced at all altitudes, even above the mean cold-point tropopause (∼17.4 km). Two distinct behaviors can be observed in the figure: first, some of the ice crystals are slowly advected upward at the same speed than air masses. They stay in the nucleating layer. This corresponds to small-size crystals, which typically need several tens of hours to sediment out of the air mass in which they have nucleated (see Fig. 5). These crystals may eventually re-sublimate when air parcels experience a warm temperature disturbance and will therefore have little (if any) effect on the dehydration of air parcels. On the other hand, the largest ice crystals sediment out efficiently, widen the cloud layer, and dilute the initial amount of ice. They contribute to dehydrate air parcels. Several fall streaks associated with sedimenting crystals are observed in Fig. 8. Some fall speeds are superimposed on the figure to illustrate that those larger crystals have typical sizes between 3 and 8.5 µm. Note that the fall streaks are well fitted assuming ice crystals with constant radii in an environment close to equilibrium (RHi≈1). Larger crystals may be created by a comparatively small temperature perturbation, a quenched nucleation (Dinh et al., 2016), or even ice crystals that have nucleated in response to a previous temperature fluctuation and which damp the wave-driven evolution of RHi (Jensen et al., 2010; Spichtinger and Krämer, 2013). This stresses that bigger crystals can be found at all altitudes and not only at the lower levels after sedimentation.
Overall, the ice mass field in this W simulation is much more heterogeneous than in the NW simulation. This heterogeneity certainly results from the uncorrelated time series of wave-induced temperature disturbances between air parcels, even though Fig. 8 shows the mean ice mass field and therefore somewhat damps out a part of the inter-parcel differences. Yet, we note that this heterogeneity is also reminiscent of high-resolution profiles of cloud properties, like those obtained during the NASA Airborne Tropical Tropopause EXperiment (ATTREX) experiment (Jensen et al., 2013a).
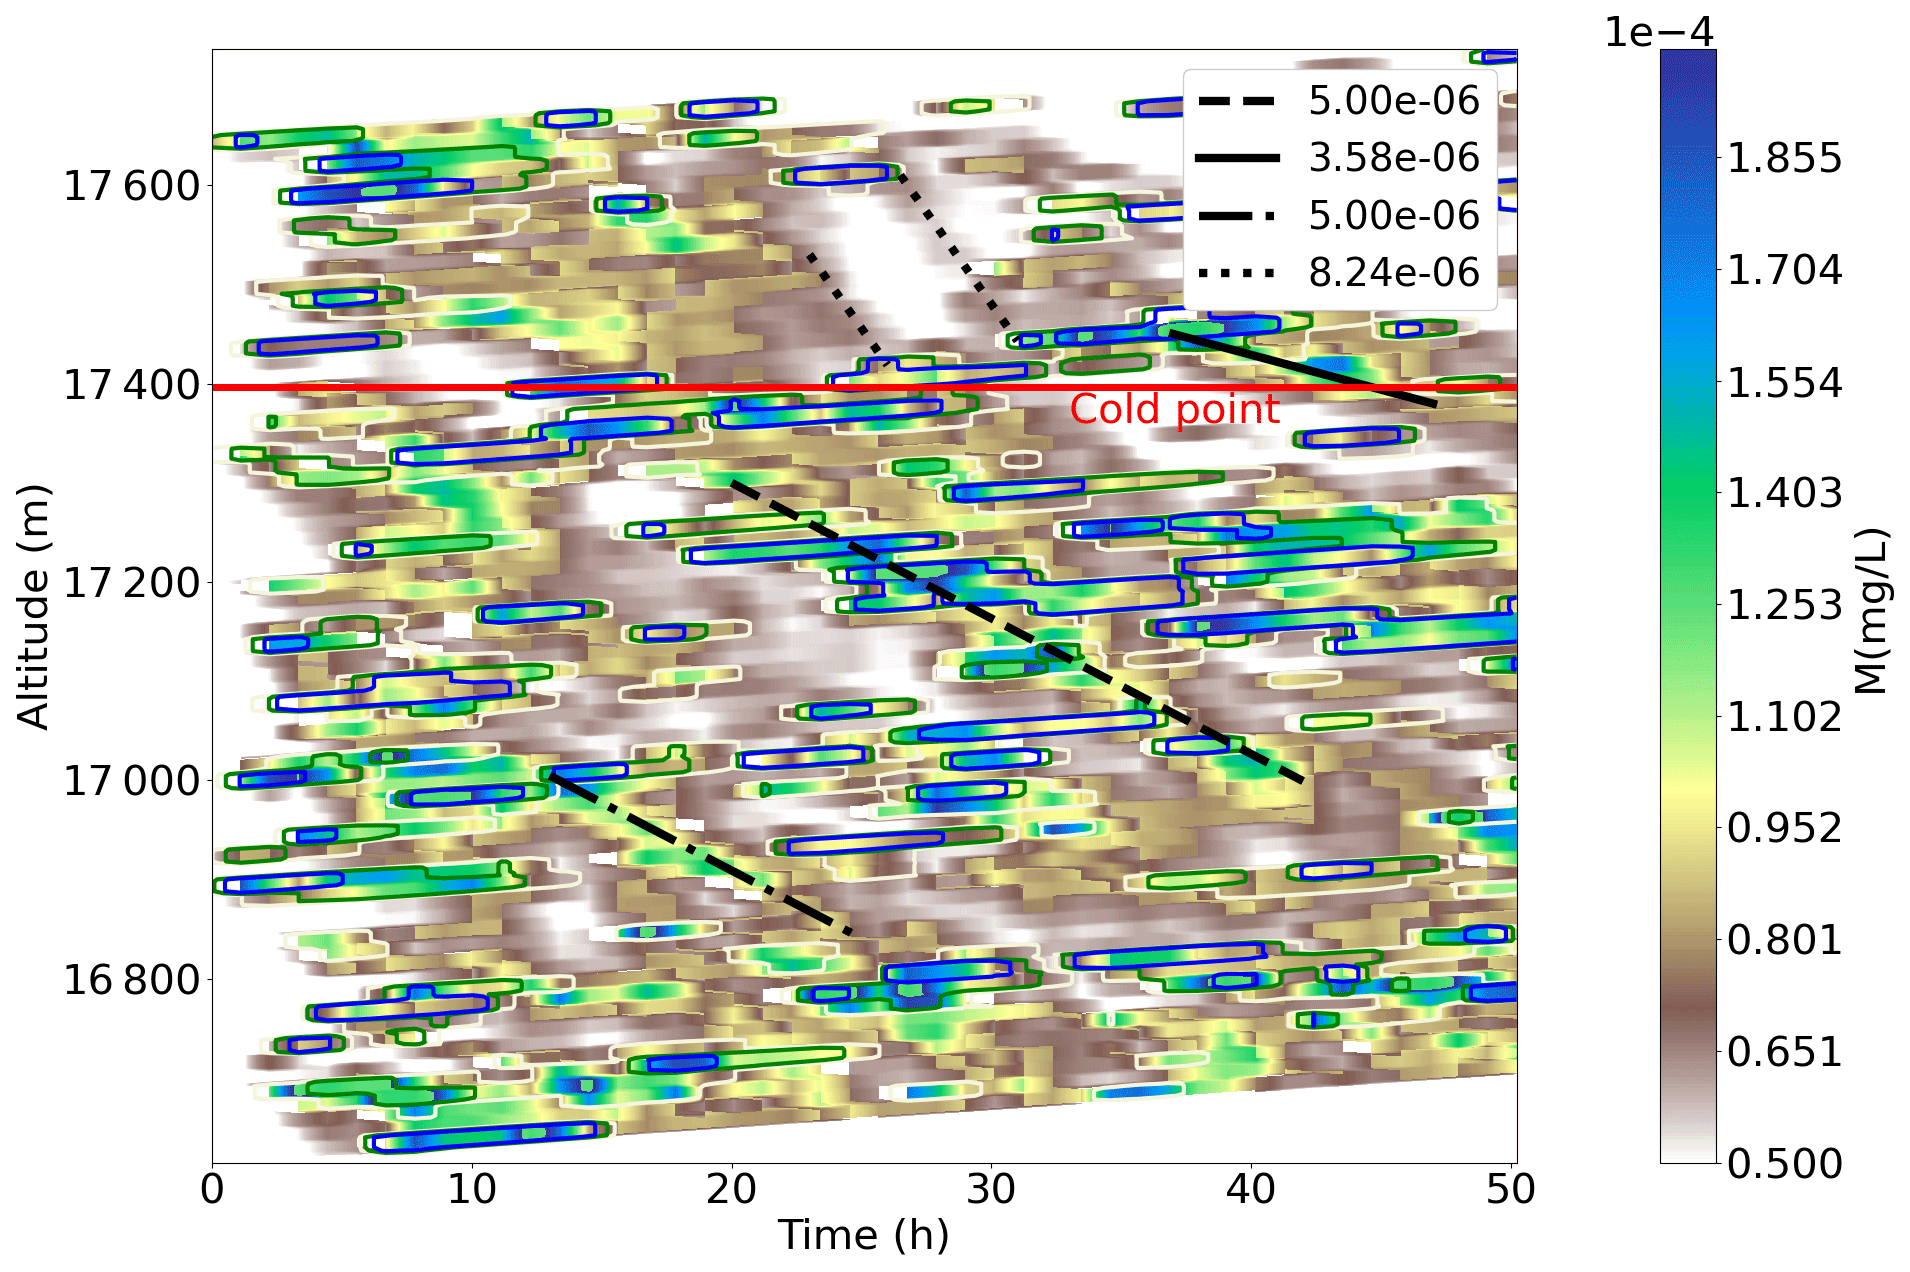
Figure 8Evolution of ice mass in time and altitude for W simulation. Contours are representing the number of ice crystals (in L−1): light brown N=1000, green N=2500, and blue N=5000
Figure 9 displays the evolution in time and altitude of the crystal-size distribution during the W simulation. The time evolution exhibits some striking differences with the corresponding figure for the NW simulation. First, ice crystals hardly grow larger than 8 µm when wave effects are included, i.e., half the maximum size reached in the NW simulation. The ice mass is mostly associated with ice-crystal radii of 3–6 µm, i.e., a factor 3 to 4 smaller than in the NW simulation. The typical growth timescale of the largest crystals (∼10 h) is also much slower. This can first be understood since the larger cooling rates induced by wave perturbations contribute to nucleate a larger number of ice crystals than when only the slow ascent is responsible for nucleation. These numerous ice crystals then deplete water vapor more efficiently from the gas phase, and therefore grow more slowly than in the NW simulation. This first effect is illustrated in Fig. 5, which shows in red the characteristic growth time of ice crystals at a lower supersaturation (0.25) than that of the NW simulation (0.6). The 0.25 supersaturation value corresponds to 1 standard deviation of supersaturation in the W simulation. The ice-crystal growth times are twice as large at this overall lower supersaturation than in the NW simulation but still remain somewhat shorter than those inferred from Fig. 9. A second wave effect that furthermore contributes to slowing the ice-crystal growth timescale is the encounter of warm temperature disturbances by air parcels. Indeed, ice crystals larger than ∼5 µm have a typical growth timescale larger than 1 h, allowing wave-induced temperature fluctuations to potentially reduce the supersaturation over that timescale.
The altitude evolution once again illustrates the distinct behavior of small ice crystals with a radius of r<2–3 µm, which tend to essentially remain and grow in the air mass in which they have nucleated, and that of larger ice crystals that tend to essentially sediment out of it. In the W simulation, the sedimentation is observed as soon as the crystals reach radii larger than 5 µm, in agreement with the lower overall supersaturation of this simulation (see Fig. 5). The altitude evolution also highlights the correlation between crystal sizes and their sensitivity to high-frequency temperature fluctuations: the larger the radius, the less the sensitivity. Smaller crystals respond quickly to their environment and are therefore easier to sublimate if a warm wave-induced temperature fluctuation creates subsaturation.
Interestingly, ice crystals with radii larger than 5 µm are observed throughout the simulated domain in the W simulation, and even above the cold-point tropopause. A possible nucleation mechanism for those high-altitude large crystals may be quenched nucleation events, as suggested in Dinh et al. (2016): as the background temperature increases in the stratosphere, waves will progressively create shorter and shorter nucleation events, which will limit the number of produced ice crystals and allow them to grow more efficiently. Hence, sedimentation occurs at all altitudes in the W simulation, which furthermore highlights the fact that waves likely contribute to the dehydration of air parcels in the TTL.
Finally, note that we use the same initial large number of aerosols at all altitudes (230 000 L−1) in this simulation, hence nucleation is primarily controlled by the competition of existing ice crystals for water vapor and the gravity-wave induced temperature changes (as well as the slow ascent at a second order).
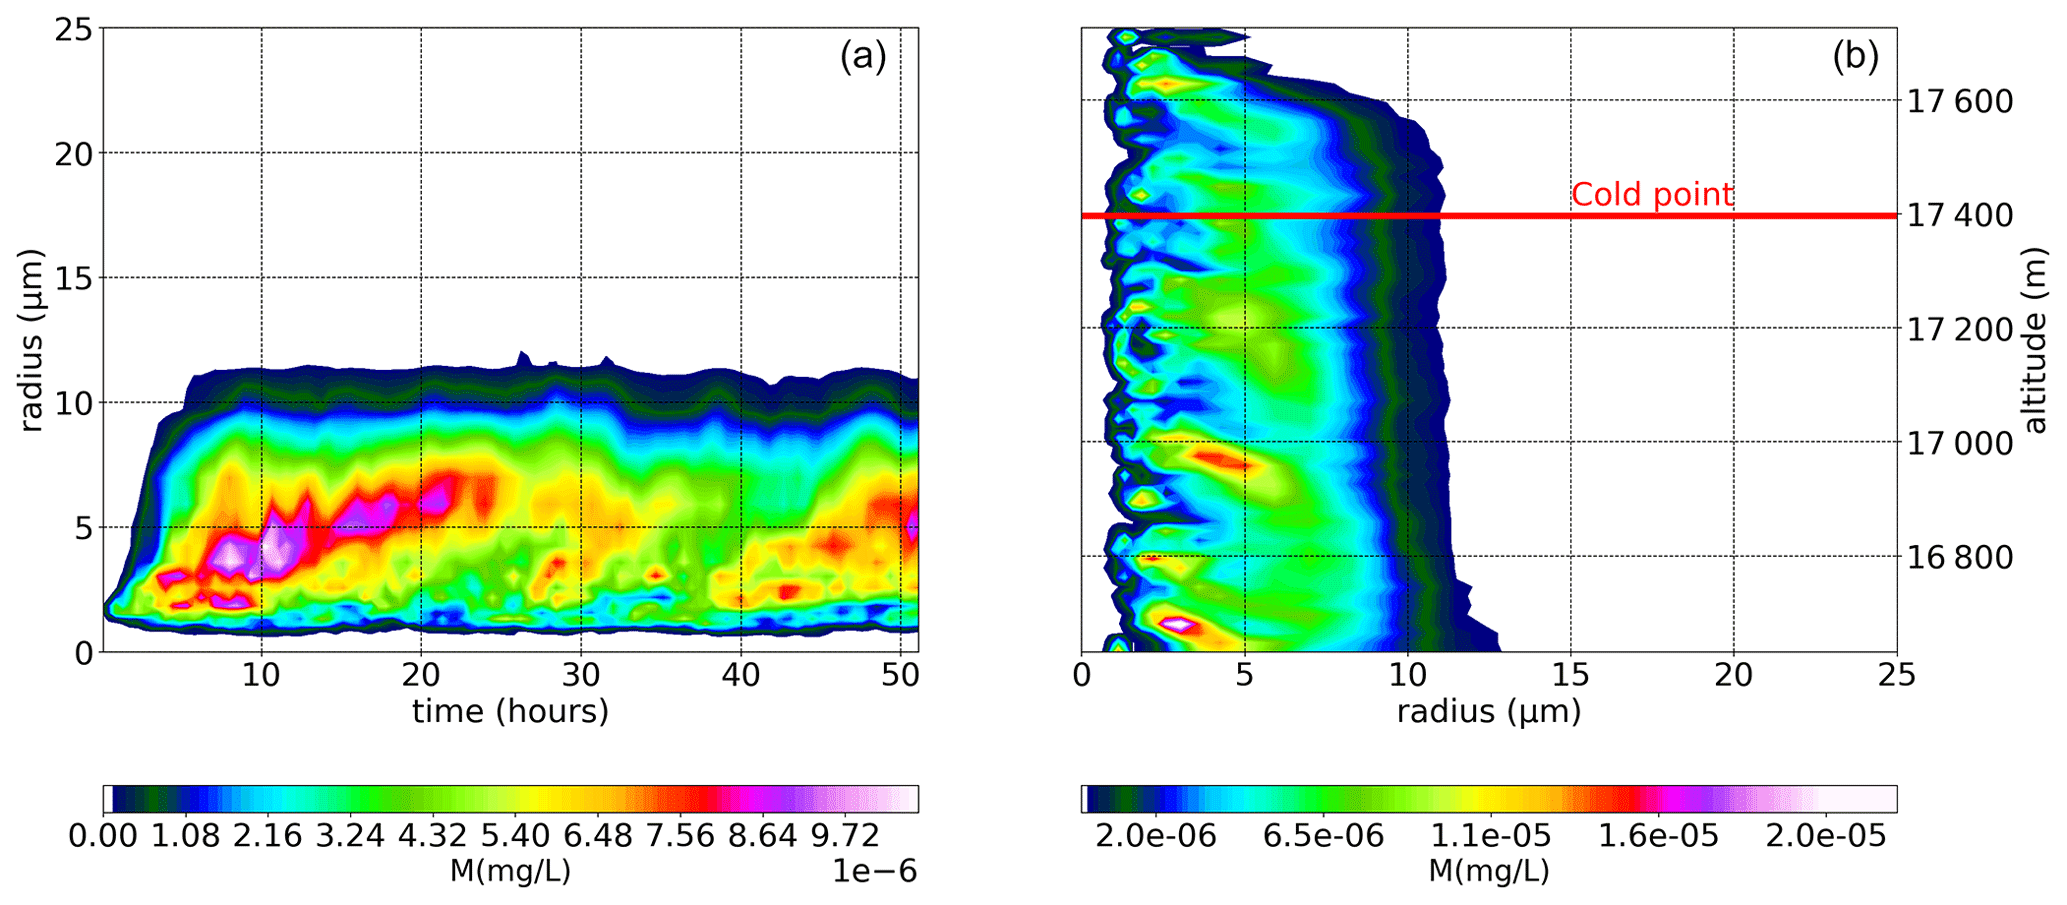
Figure 9Evolution of ice mass in time (a) and altitude (b) for a simple slow ascent of 420 air parcels. Bins filled with more than 1 ice crystal per cubic meter are filled.
4.1 Ice production with and without waves, sensitivity to wave amplitude and comparison with measurements
The main characteristics of ice production in the no-wave and wave simulations are summarized in Table 3. The most striking feature is the difference of 4 orders of magnitude between the overall mean ice-crystal concentrations (Nice) in the simulations with and without gravity waves, which results from waves triggering more nucleation events and generating larger cooling rates than the mere slow ascent in the TTL. The large difference between the mean and median ice concentrations in the W simulations also indicates that the largest concentrations are associated with a relatively small number of events. The condensed mass in the W simulation is increased by a factor ∼100 only with respect to that in the NW simulation, since ice crystals are of smaller sizes when wave perturbations are included. The overall cloud fraction, defined here as the fraction of time where in at least one parcel per column, is zero in the NW simulation and almost 100 % in the W simulation.
Varying the standard deviations of wave disturbances produces the expected effect on ice production. The ice concentration, mass, and cloud fraction increase with increased wave temperature fluctuations, while the mean crystal size decreases due to increased nucleation/growth quenching. Yet, the ice concentration and mass, as well as the cloud fraction, exhibit a very strong sensitivity to wave amplitudes, while on the other hand, the mean ice-crystal size varies by less than a factor 2 among all the wave simulations.
It may furthermore be noticed that a wave standard deviation of only 0.5 K is sufficient to nucleate significant ice crystals, even though the background environment is far from the homogeneous nucleation threshold (RH). This is associated with the fact that these small wave amplitudes still produce cooling rates of ≈2 K h−1, which are 2–3 orders of magnitude larger than those produced by the mean ascent. In the WS0.5 experiment though, the nucleation events are infrequent and the reported results for this simulation are therefore more dependent on the simulation details, i.e., the random wave temperature time series applied in each model air parcel.
The left panel of Fig. 10 presents the ice-crystal size distributions in the W and NW simulations. As mentioned previously, the size distributions of ice crystals differ significantly when wave perturbations are included or not. The small cooling rates associated with the slow ascent enable ice crystals to efficiently grow until they sediment out of the air mass, leading to a relatively narrow size distribution centered around r∼10 µm. On the other hand, both the competition between the numerous ice crystals produced by large wave-induced cooling rates and the potential quenching of crystal nucleation or growth by wave-induced warm anomalies result in a wider size distribution and a smaller mean size (r∼2 µm). The inclusion of horizontal mixing further reduces the size of ice crystals, but this is clearly a second-order effect in our simulations. This effect might nevertheless be more pronounced in a more realistic (less random) wave-perturbation field.
The right panel of Fig. 10 displays how the ice-crystal size distribution evolves with wave amplitudes. As the wave-induced temperature perturbations are increased from 0.5 to 1.5 K, the ice-crystal concentrations undergo a huge increase of 3 orders of magnitude. A further increase of wave amplitudes to 3 K result in more moderate changes in ice concentrations. In contrast with ice concentrations, the ice-crystal size distribution only exhibits a slight dependence to wave amplitudes with nevertheless a noticeable trend toward smaller crystals with increased wave perturbations. On the other hand, it may be noticed that small wave amplitudes suffice to significantly widen the NW ice population.
Table 3Characteristics of ice crystals produced in the simulations with or without gravity waves. The cloud fraction is defined as the fraction of time where .
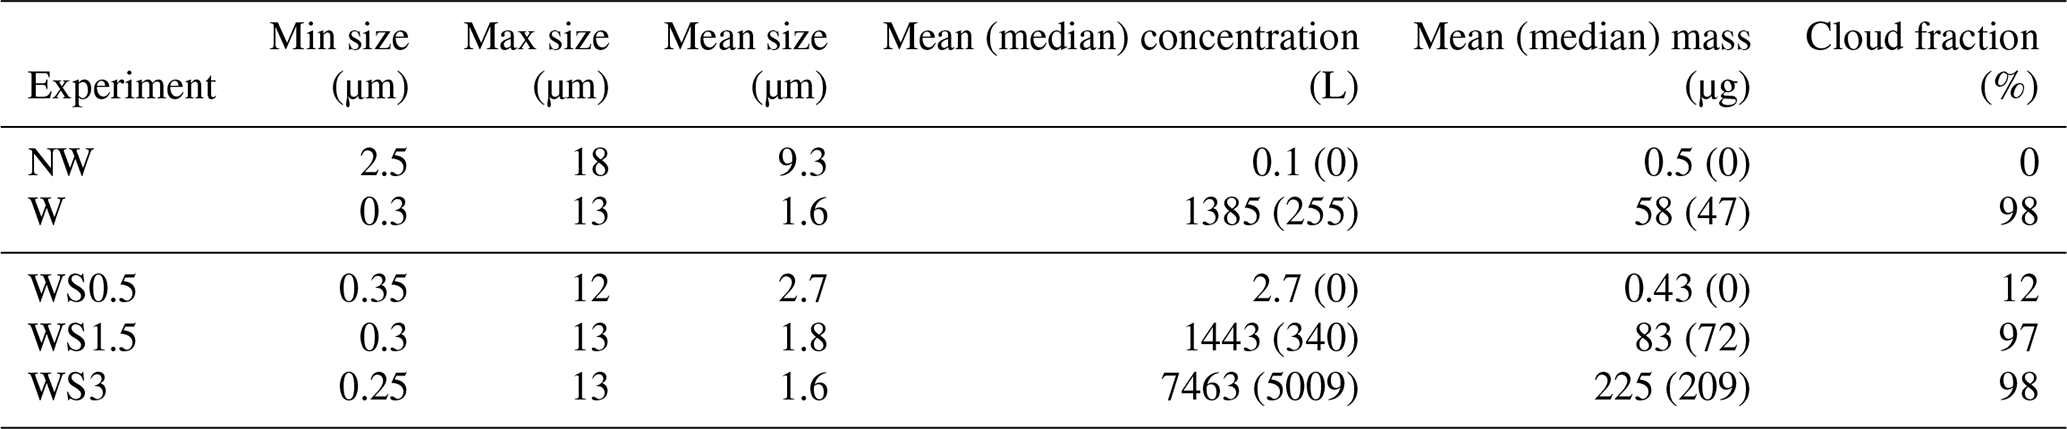
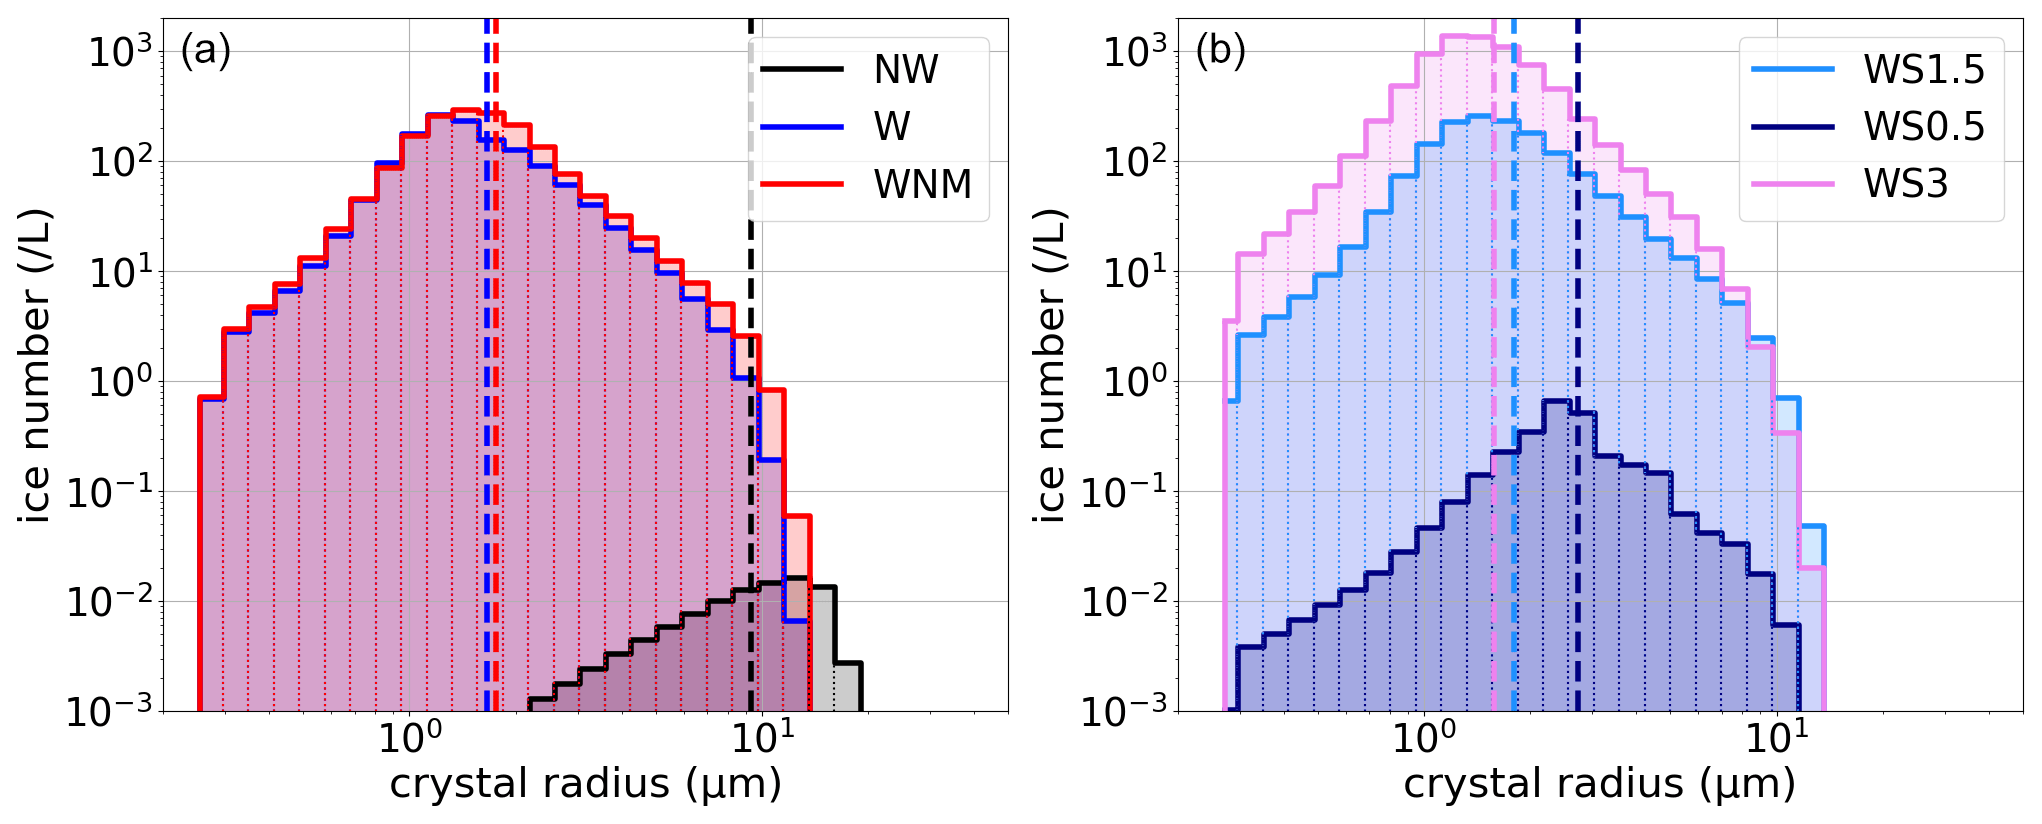
Figure 10(a) Ice-crystal size distributions in the (black) no-wave, (red) wave no mixing, and (blue) wave. (b) Ice-crystal size distributions in the (blue) WS0.5, (sky blue) WS1.5, and (violet) WS3 experiments. The mean size of each distribution is shown by vertical bars of the corresponding color.
Our simulations of ice-crystal population are now compared to observations of ice particles performed during the NASA Airborne Tropical Tropopause EXperiment (ATTREX) campaign in 2014 (Jensen et al., 2013c, 2017). ATTREX collected high-resolution in situ observations of cloud microphysics in the TTL during several flights of the Global Hawk unmanned aerial vehicle. The flights were performed out of Guam (13∘ N, 144∘ E), in the western Pacific, and lasted for 13–19 h at a maximum altitude of ∼18 km. In this study, we will compare our simulation results with the tropical part of the transit flight from California to Guam on 16 January, as well as flights on 12 February, 4, and 6 March, that sampled various types of TTL cirrus. On 4 March, the TTL was perturbed by the nearby presence of Tropical Cyclone Faxai, even though the Global Hawk did not sample the direct outflow of the cyclone (Jensen et al., 2017). In ATTREX flights, cloud properties were first measured with the Fast Cloud Droplet Probe (FCDP) spectrometer. The FCDP measures the forward scattered laser light from each cloud particle present in the sampling volume and deduces the size of the cloud particles from 1 to 50 µm diameter (Lance et al., 2010). We also compare our simulations with observations obtained by the 2D-S stereo probe (Lawson et al., 2006) during the first flight of the ATTREX deployment. The 2D-S measures particles with radii between 2.5 and 1500 µm, but we have limited the comparison to the first two 2D-S bins, respectively, associated with a mean radius of 5 and 10 µm. Only the last 10 h of simulation are used for the comparison to avoid any effect of the initial conditions.
Ice-crystal concentrations in our simulations and in ATTREX observations are displayed in Fig. 11. Note that the minimum detectable concentrations are ∼10 and for the FCDP and 2D-S instruments, respectively. In agreement with previous findings (e.g., Schoeberl et al., 2015), the NW simulation produces unrealistically low crystal concentrations, although such small concentrations are mainly below or close to the instrument's detection limits. On the other hand, ice-crystal concentrations obtained with the W simulation shows a fair agreement with observations. The main difference lies in the overestimation of ice-crystal concentrations larger than 1000 L−1 in the simulation. These large concentrations are associated with fresh nucleation events for the largest cooling rates, which might not be easy to capture with observations. We nevertheless note that ice-crystal numbers as large as 15 000 L−1 have been reported in ATTREX observations (Jensen et al., 2013a). On the other hand, the similarity of the distributions for the lower concentrations (), which are the most frequent, is relatively surprising. It has indeed been proposed that those low concentrations could result from heterogeneous nucleation on solid ice nuclei (e.g., Jensen et al., 2013a). Our simulations seem to indicate that homogeneous nucleation may also produce such low ice-crystal concentrations with reasonable probability of occurrence, in accordance with Spichtinger and Krämer (2013).
The WS1.5 simulation fits the ATTREX observations even better, with an increased occurrence of ice concentrations between 10 and 100 L−1 and a corresponding reduced occurrence of larger ice concentrations with respect to the W simulation. In the W experiment, the large ice concentrations were produced by a few events with large wave-induced temperature fluctuations, which are less probable in the more homogeneous WS1.5 experiment. The WS0.5 distribution of ice concentration lies in between those of the NW on the one hand, and of the W or WS1.5 on the other hand. Similar to the NW experiment, the WS0.5 distribution is associated with unrealistically high occurrences of the lowest ice concentrations. The agreement with the 2D-S observations for is likely fortuitous since the 2D-S instrument is unable to detect crystals with r≤5 µm, which are mostly responsible for these large concentrations. Finally, the WS3 experiment is in good agreement with the 2D-S low ice concentration but strongly overestimates the occurrences of .
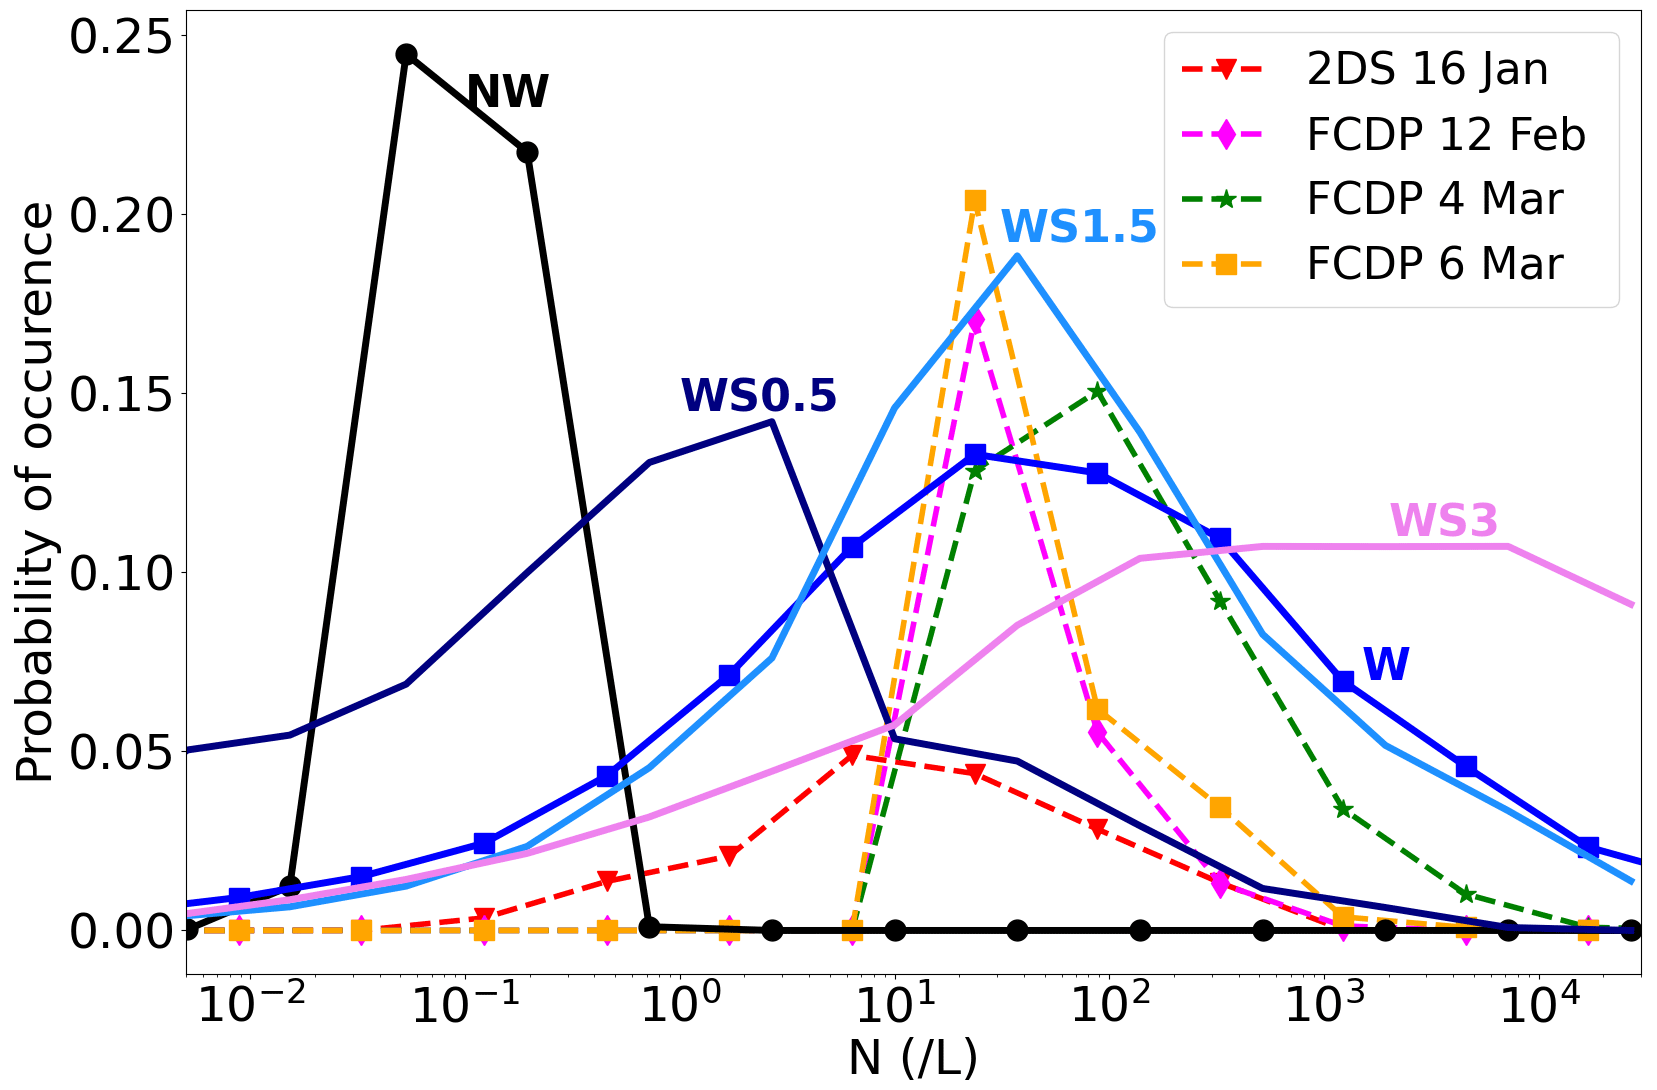
Figure 11Comparison of ice-crystal concentrations in (solid) our numerical experiments and (dashed) 2014 ATTREX measurements. In ATTREX measurements, the minimum detectable concentration by the FCDP and 2D-S instruments are ∼10 and 0.1 L−1, respectively.
Recent results (Baumgartner et al., 2022) have indicated that the density of homogeneously nucleated ice crystals is sensitive to the size distribution of aerosols. Our simulations used a monodisperse aerosol distribution with ra=250 nm, consistent with observations performed during the balloon flights. Yet, the observed distributions are relatively broad, and therefore contain aerosols with larger sizes. Those large aerosol nucleate first and reduce the available humidity for smaller aerosols. We nevertheless expect that this sensitivity of the nucleated ice-crystal number to the aerosol size should be rather small in our simulations, since the mean radius used is comparable to the observed one. If any, it would contribute to reduce the number of nucleated ice crystals.
Figure 12 finally displays the comparisons of ice-crystal size distribution between our simulations and FCDP observations. The results associated with the simulation without wave-induced fluctuations are not shown here because of its low crystal concentrations. In agreement with the measurable concentrations by the FCDP instrument, we have only retained air parcels with in the WSx simulations for this comparison. We note that the comparison of ice-crystal size distribution should be taken cautiously as FCDP was designed for measurements of water droplets. The size retrieval actually assumes Mie scattering in spherical particles (Lance, 2012; Lance et al., 2010), and therefore, it bears uncertainties associated with the sizing of non-spherical ice crystals. Woods et al. (2018) nevertheless showed a tendency toward quasi-spheroid particles when particle sizes (and temperature) decrease. The simulated crystal sizes in the WSx simulations fall in the range of ATTREX observations, i.e., radii between 1 and 15 µm, and the distribution shapes are fairly consistent. Even though the dependence of ice population to wave amplitudes is small, the WS1.5 (or the W) simulation looks in better agreement with the overall ATTREX observations. The increased occurrence of smaller particles in the simulation might be associated with limitations of the FCDP instrument at sizes near 1 µm. On the other hand, one possible reason for the lower occurrence of ∼10 µm particles in the WSx simulations is the limited altitude range of this simulation, which contribute to preclude the growth of sedimenting particles.
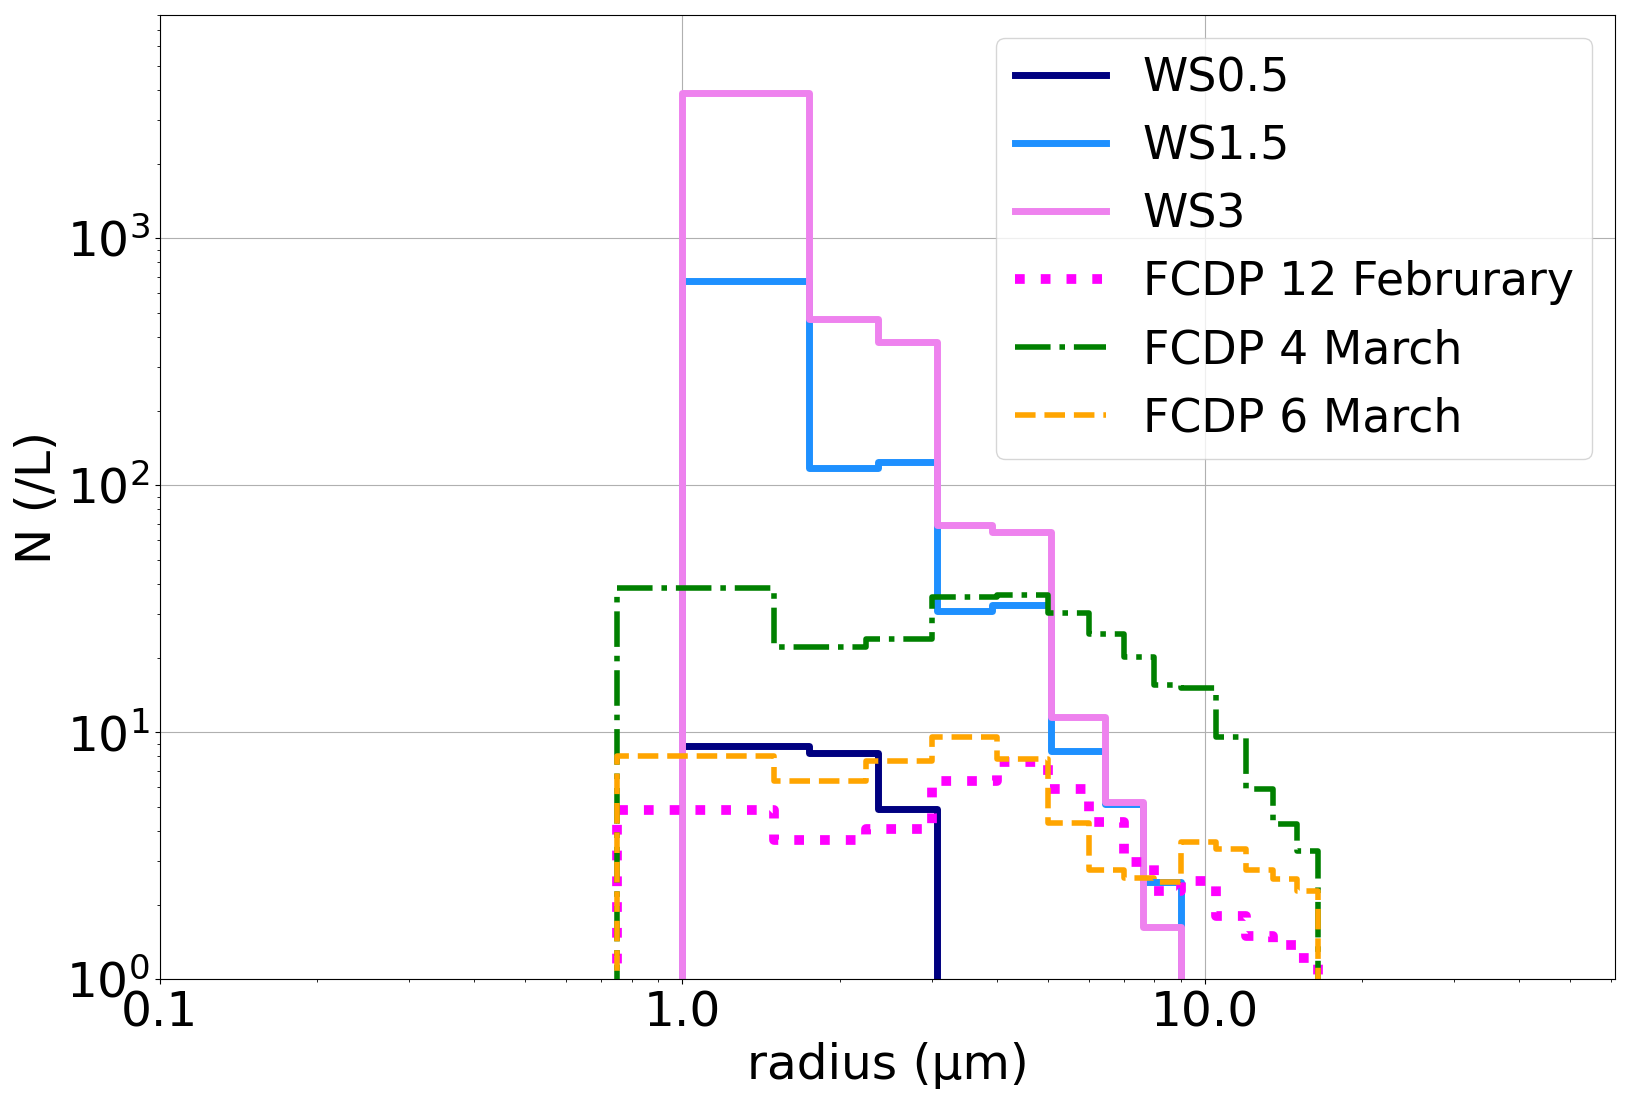
Figure 12Comparison of ice-crystal size distribution in the WSx simulations and in 2014 ATTREX FCDP measurements. Distributions are shown in cloud fraction only, i.e., .
4.2 Air-parcel dehydration
It is now commonly accepted that gravity waves likely play a role in dehydration processes in the TTL, and therefore in setting the stratospheric water vapor content (e.g., Kim and Alexander, 2015; Schoeberl et al., 2015). The primary effect of gravity waves is to lower the temperature experienced by air parcels as they ascend through the TTL. Yet, dehydration only occurs when produced ice crystals are able to sediment out of the air parcel in which they have nucleated. At low temperatures characteristic of the tropical cold-point tropopause, the typical timescales of crystal nucleation, growth, and sedimentation are of the same order of magnitude as gravity-wave periods. Hence, TTL dehydration results from the complex coupling of wave-induced temperature perturbations and microphysical processes, which for instance include nucleation or growth quenching (Spichtinger and Krämer, 2013; Dinh et al., 2016; Jensen et al., 2016; Schoeberl et al., 2015) and sedimentation-wave phasing (Podglajen et al., 2018). The dehydration efficiency is notably controlled by the crystal-size distribution, which critically depends on gravity-wave perturbations, as our simulations have shown.
Figure 13 displays the relative change of water vapor mixing ratio as a function of the final altitude of air parcels in the W simulation, i.e.,
where stands for the water vapor mixing ratio. The mean net effect of gravity waves is to dehydrate air parcels by ∼5 % throughout the simulated altitudes, in agreement with Fig. 6. Yet, Fig. 13 exhibits a large variability in dehydration at a given altitude, which results from different water vapor redistribution through nucleation and sedimentation in the different model columns. In particular, air parcels can be rehydrated as ice crystals sedimenting from above sublimate in them (Dinh et al., 2010; Murphy, 2014). In the uppermost layers of the domain though, i.e., above the mean cold-point tropopause located at 17.4 km, dehydration becomes more systematic, and the net wave-induced dehydration is increased to ∼20 %. This suggests that the final wave-induced dehydration events may actually occur above the climatological cold-point tropopause.
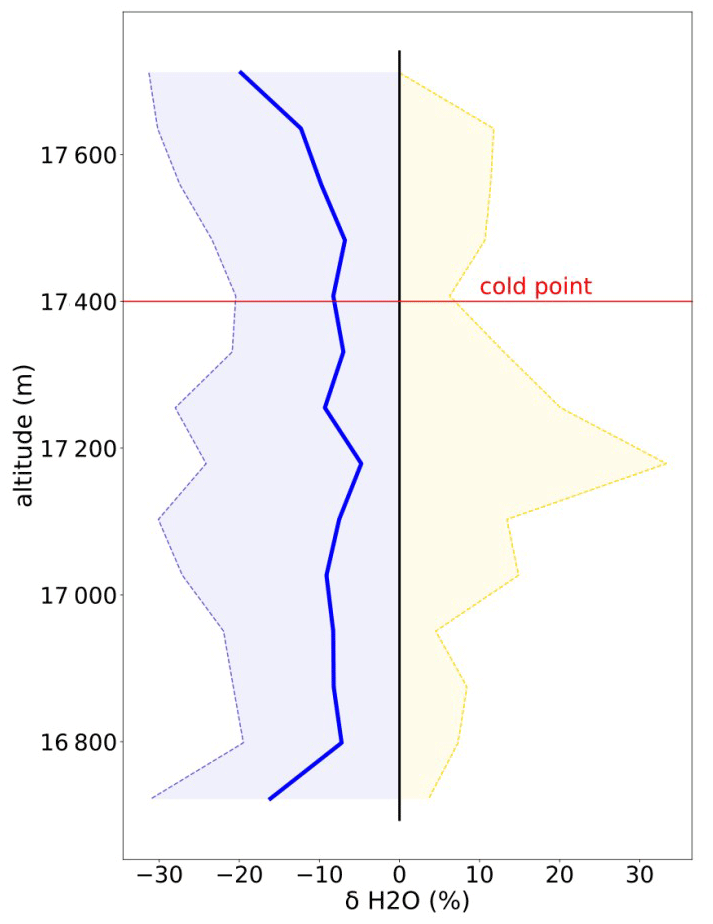
Figure 13Relative dehydration () of air parcels in the W simulation: (thick) mean dehydration, (thin) 25th and 75th quantiles. The altitudes shown correspond to the final altitudes of air parcels. The mean cold point is indicated by the thin horizontal line at 17.4 km. The relative dehydration in the NW simulation is hardly discernible from the 0 % vertical line.
Table 4Water vapor mixing ratios in the NW, W, and WSx simulations. The stratospheric corresponds to the mean water vapor mixing ratio of those air parcels that are above the mean cold-point tropopause at the end of the simulation.
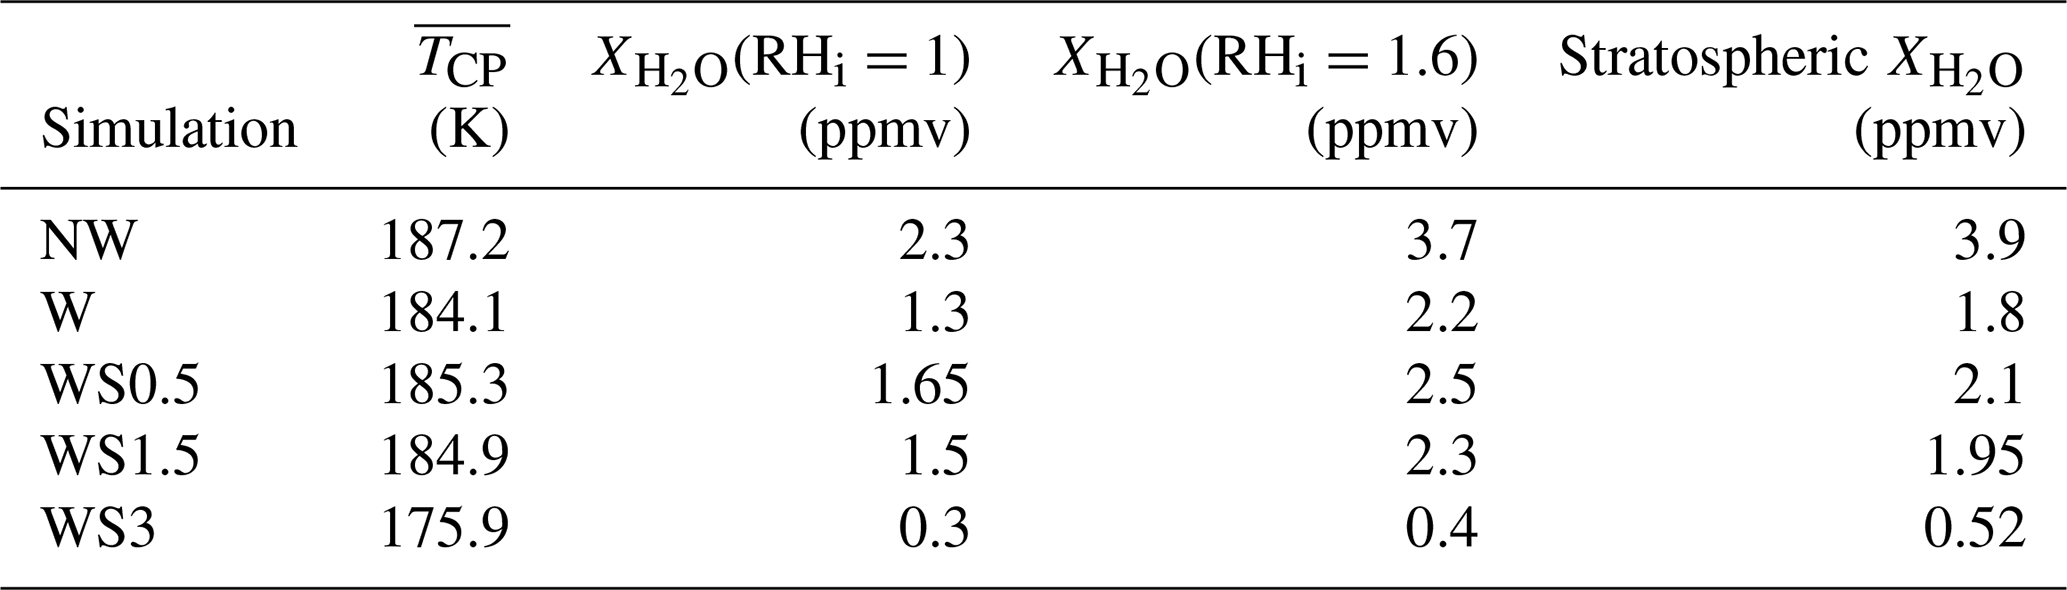
Table 4 shows the observed water vapor mixing ratios in our simulations for those air parcels that are above the mean cold-point tropopause at the end of the simulations, as well as mixing ratios associated with relative humidities over ice of 1 and 1.6 at the mean cold-point temperature. In the NW simulation, the mean cold-point temperature is that shown in Fig. 2, i.e., . In the W or WSx simulations, the mean cold-point temperature is computed as the mean of the minimum temperature experienced by each air parcel that has crossed 17.4 km (Kim and Alexander, 2015). First, no dehydration is observed in the NW simulation: the very small number of ice crystals created in this simulation were very inefficient in depleting water vapor (see Fig. 6). In this run, the stratospheric water-vapor mixing ratio (3.9 ppmv) thus corresponds to that of the air parcels initially, which was set at RHi=1.57 over the whole altitude range. Because of this initial constant relative humidity, the stratospheric mixing ratio is slightly higher than that at the cold point. One may note that none of the air parcels in which nucleation occurred have crossed the tropopause during the NW simulation, so that the real stratospheric mixing ratio would have been (very) slightly reduced in a longer run.
In the W simulation on the other hand, the stratospheric water-vapor mixing ratio is 1.8 ppmv. This value lies in between the extreme mixing ratios obtained with RHi=1 and RHi=1.6 at the cold point. Hence, as expected, gravity waves are not fully efficient in restoring RHi=1 at the minimum temperature experienced by the air parcels (Schoeberl et al., 2015). Yet, this water vapor mixing ratio is slightly lower than the mixing ratio corresponding to RHi=1 at the background temperature (2.3 ppmv), in agreement with the 20 % increased dehydration observed in the uppermost layers of the W simulation (see Fig. 6). When compared to the NW case, the stratospheric water vapor mixing ratio is thus decreased by ∼2 ppmv when gravity-wave perturbations are included. The magnitude of this systematic wave-induced dehydration is very significant, since it is for instance comparable to the seasonal variation of water vapor at the tropical tropopause (e.g., Mote et al., 1996; Davis et al., 2016). The increased amplitude lowers the temperature and enhances the air-parcel dehydration, but not as much as it increases ice production, which tends to demonstrate the low impact of the very small ice crystals on dehydration.
This study aimed to investigate the effects of gravity waves on the microphysics of cirrus clouds and air-parcel dehydration at the tropical tropopause layer in idealized simulations. Detailed microphysical simulations, which consider homogeneous nucleation as the sole mechanism for ice production, sedimentation, and a crude treatment of horizontal mixing, have been carried out with and without gravity-wave temperature perturbations. Excerpts from quasi-Lagrangian balloon-borne observations in the lower tropical stratosphere are used to add gravity-wave disturbances in otherwise slowly ascending air parcels in the TTL. Two main simulations are carried out and contrasted to highlight the profoundly different outcomes in terms of microphysics, depending on the inclusion of gravity-wave effects. A reference simulation represents the ascension of air parcels in the tropical tropopause layer, initially close to nucleating conditions (NW simulation). The second one also represents the impact of gravity-wave-driven temperature variability in a non-saturated environment (W simulation).
The NW simulation indicates that without wave perturbations, i.e., when only the slow ascent of air parcels in the TTL is responsible for nucleation events, ice-crystal concentrations are unrealistically low. Similarly, the ice-crystal size distribution is too narrow and peaks at a radius of 9 µm, which is too large when compared to observations. Lastly, the NW simulation is associated with almost zero dehydration in the vicinity of the cold-point tropopause despite initial conditions close to the homogeneous nucleation threshold.
The inclusion of gravity waves significantly modifies the production of ice crystals in the simulation. This is notably due to the much larger cooling/heating rates produced by gravity waves. The more numerous nucleation events in the wave simulation contribute to efficiently restoring the relative humidity over ice to equilibrium with respect to the background temperature profile throughout the simulated domain. A further 20 % decrease in water vapor mixing ratio is observed in air parcels that have penetrated the stratosphere. The wave-induced dehydration effect is thus estimated to ∼2 ppmv in the vicinity of the cold-point tropopause.
Moreover, ice crystal number concentration and size distribution compare better with observations in the gravity-wave simulation, even though no ice nuclei are included in the simulations. This supports the fact that heterogeneous nucleation might not be the only process responsible for lower ice-crystal concentrations. Furthermore, this accordance highlights the importance of a realistic representation of waves to reproduce observations.
Our results bring further evidence that gravity waves may significantly increase the cloud fraction in the vicinity of the cold-point tropopause, as also suggested in, e.g., Ueyama et al. (2015) and Schoeberl et al. (2018). A precise assessment of this increase would require less idealized simulations than those carried out here, namely, more realistic correlations between the air-parcel temperature perturbations would be carried out in a later study. Similarly, the radiative impact of the wave-induced enhanced cloudiness is left for future work. Our results nonetheless call for a coupled treatment of TTL waves and microphysics in parameterizations used in climate models.
The balloon-born TSEN data are part of Stratéole-2 and available at https://data.ipsl.fr/catalog/strateole2/ (LMD/IPSL, 2022). Stratéole-2 is sponsored by CNES, CNRS/INSU, ESA, and NSF. ATTREX data are available at https://espoarchive.nasa.gov/archive/browse/attrex/id4/GHawk (NASA, 2022).
The authors confirm contribution to the paper as follows: Formal analysis and methodology: MC, AH, AP, and RP. Manuscript preparation: MC. Writing of the original draft: MC and AH. All authors reviewed the results and approved the final version of the paper.
The contact author has declared that none of the authors has any competing interests.
Publisher’s note: Copernicus Publications remains neutral with regard to jurisdictional claims in published maps and institutional affiliations.
The authors would like to warmly thank Eric Jensen and Bernd Kärcher for thoughtful discussions and suggestions during the final stage of this study, as well as Martina Bramberger, Joan Alexander, and Sean Davis.
This paper was edited by Martina Krämer and reviewed by two anonymous referees.
Bardeen, C. G., Toon, O. B., Jensen, E. J., Marsh, D. R., and Harvey, V. L.: Numerical simulations of the three-dimensional distribution of meteoric dust in the mesosphere and upper stratosphere, J. Geophys. Res., 113, D17, https://doi.org/10.1029/2007jd009515, 2008. a
Baumgartner, M., Rolf, C., Grooß, J.-U., Schneider, J., Schorr, T., Möhler, O., Spichtinger, P., and Krämer, M.: New investigations on homogeneous ice nucleation: the effects of water activity and water saturation formulations, Atmos. Chem. Phys., 22, 65–91, https://doi.org/10.5194/acp-22-65-2022, 2022. a
Boccara, G., Hertzog, A., Vincent, R. A., and Vial, F.: Estimation of Gravity Wave Momentum Flux and Phase Speeds from Quasi-Lagrangian Stratospheric Balloon Flights, Part I: Theory and Simulations, J. Atmos. Sci., 65, 3042–3055, https://doi.org/10.1175/2008JAS2709.1, 2008. a
Boehm, M. T. and Lee, S.: The Implications of Tropical Rossby Waves for Tropical Tropopause Cirrus Formation and for the Equatorial Upwelling of the Brewer–Dobson Circulation, J. Atmos. Sci., 60, 247–261, https://doi.org/10.1175/1520-0469(2003)060<0247:tiotrw>2.0.co;2, 2003. a
Böhm, H. P.: A General Equation for the Terminal Fall Speed of Solid Hydrometeors, J. Atmos. Sci., 46, 2419–2427, https://doi.org/10.1175/1520-0469(1989)046<2419:ageftt>2.0.co;2, 1989. a
Chen, Y., Kreidenweis, S. M., McInnes, L. M., Rogers, D. C., and DeMott, P. J.: Single particle analyses of ice nucleating aerosols in the upper troposphere and lower stratosphere, Geophys. Res. Lett., 25, 1391–1394, https://doi.org/10.1029/97gl03261, 1998. a
Corcos, M., Hertzog, A., Plougonven, R., and Podglajen, A.: Observation of Gravity Waves at the Tropical Tropopause Using Superpressure Balloons, J. Geophys. Res., 126, 15, https://doi.org/10.1029/2021jd035165, 2021. a, b
Corti, T., Luo, B. P., de Reus, M., Brunner, D., Cairo, F., Mahoney, M. J., Martucci, G., Matthey, R., Mitev, V., dos Santos, F. H., Schiller, C., Shur, G., Sitnikov, N. M., Spelten, N., Vössing, H. J., Borrmann, S., and Peter, T.: Unprecedented evidence for deep convection hydrating the tropical stratosphere, Geophys. Res. Lett., 35, 10, https://doi.org/10.1029/2008gl033641, 2008. a
Cziczo, D. J., DeMott, P. J., Brooks, S. D., Prenni, A. J., Thomson, D. S., Baumgardner, D., Wilson, J. C., Kreidenweis, S. M., and Murphy, D. M.: Observations of organic species and atmospheric ice formation, Geophys. Res. Lett., 31, 12, https://doi.org/10.1029/2004gl019822, 2004. a
Davis, S. M., Rosenlof, K. H., Hassler, B., Hurst, D. F., Read, W. G., Vömel, H., Selkirk, H., Fujiwara, M., and Damadeo, R.: The Stratospheric Water and Ozone Satellite Homogenized (SWOOSH) database: a long-term database for climate studies, Earth Syst. Sci. Data, 8, 461–490, https://doi.org/10.5194/essd-8-461-2016, 2016. a
Dinh, T. and Durran, D. R.: A hybrid bin scheme to solve the condensation/evaporation equation using a cubic distribution function, Atmos. Chem. Phys., 12, 1003–1011, https://doi.org/10.5194/acp-12-1003-2012, 2012. a
Dinh, T., Podglajen, A., Hertzog, A., Legras, B., and Plougonven, R.: Effect of gravity wave temperature fluctuations on homogeneous ice nucleation in the tropical tropopause layer, Atmos. Chem. Phys., 16, 35–46, https://doi.org/10.5194/acp-16-35-2016, 2016. a, b, c, d, e, f, g, h
Dinh, T. P., Durran, D. R., and Ackerman, T. P.: Maintenance of tropical tropopause layer cirrus, J. Geophys. Res., 115, D2, https://doi.org/10.1029/2009jd012735, 2010. a, b
Fueglistaler, S., Dessler, A. E., Dunkerton, T. J., Folkins, I., Fu, Q., and Mote, P. W.: Tropical tropopause layer, Rev. Geophys., 47, 1, https://doi.org/10.1029/2008RG000267, 2009. a, b
Gettelman, A., Salby, M. L., and Sassi, F.: Distribution and influence of convection in the tropical tropopause region, J. Geophys. Res., 107, ACL 6-1–ACL 6-12, https://doi.org/10.1029/2001jd001048, 2002. a
Gettelman, A., de F. Forster, P. M., Fujiwara, M., Fu, Q., Vömel, H., Gohar, L. K., Johanson, C., and Ammerman, M.: Radiation balance of the tropical tropopause layer, J. Geophys. Res., 109, D7, https://doi.org/10.1029/2003JD004190, 2004. a
Haag, W.: The impact of aerosols and gravity waves on cirrus clouds at midlatitudes, J. Geophys. Res., 109, D12, https://doi.org/10.1029/2004jd004579, 2004. a
Hermann, M., Heintzenberg, J., Wiedensohler, A., Zahn, A., Heinrich, G., and Brenninkmeijer, C. A. M.: Meridional distributions of aerosol particle number concentrations in the upper troposphere and lower stratosphere obtained by Civil Aircraft for Regular Investigation of the Atmosphere Based on an Instrument Container (CARIBIC) flights, J. Geophys. Res., 108, D3, https://doi.org/10.1029/2001jd001077, 2003. a
Hertzog, A. and Vial, F.: A study of the dynamics of the equatorial lower stratosphere by use of ultra-long-duration balloons: 2. Gravity waves, J. Geophys. Res., 106, 22745–22761, https://doi.org/10.1029/2000JD000242, 2001. a
Holton, J. R. and Gettelman, A.: Horizontal transport and the dehydration of the stratosphere, Geophys. Res. Lett., 28, 2799–2802, https://doi.org/10.1029/2001gl013148, 2001. a
Hoyle, C. R., Luo, B. P., and Peter, T.: The Origin of High Ice Crystal Number Densities in Cirrus Clouds, J. Atmos. Sci., 62, 2568–2579, https://doi.org/10.1175/jas3487.1, 2005. a, b
Jensen, E. J. and Pfister, L.: Transport and freeze-drying in the tropical tropopause layer, J. Geophys. Res., 109, D2, https://doi.org/10.1029/2003jd004022, 2004. a, b, c, d
Jensen, E. J. and Toon, O. B.: Ice nucleation in the upper troposphere: Sensitivity to aerosol number density, temperature, and cooling rate, Geophys. Res. Lett., 21, 2019–2022, https://doi.org/10.1029/94gl01287, 1994. a, b
Jensen, E. J., Toon, O. B., Pfister, L., and Selkirk, H. B.: Dehydration of the upper troposphere and lower stratosphere by subvisible cirrus clouds near the tropical tropopause, Geophys. Res. Lett., 23, 825–828, https://doi.org/10.1029/96gl00722, 1996. a
Jensen, E. J., Pfister, L., Ackerman, A. S., Tabazadeh, A., and Toon, O. B.: A conceptual model of the dehydration of air due to freeze-drying by optically thin, laminar cirrus rising slowly across the tropical tropopause, J. Geophys. Res., 106, 17237–17252, https://doi.org/10.1029/2000jd900649, 2001. a, b, c
Jensen, E. J., Pfister, L., Bui, T.-P., Lawson, P., and Baumgardner, D.: Ice nucleation and cloud microphysical properties in tropical tropopause layer cirrus, Atmos. Chem. Phys., 10, 1369–1384, https://doi.org/10.5194/acp-10-1369-2010, 2010. a, b, c
Jensen, E. J., Pfister, L., and Bui, T. P.: Physical processes controlling ice concentrations in cold cirrus near the tropical tropopause, J. Geophys. Res., 117, D11, https://doi.org/10.1029/2011JD017319, 2012. a
Jensen, E. J., Diskin, G., Lawson, R. P., Lance, S., Bui, T. P., Hlavka, D., McGill, M., Pfister, L., Toon, O. B., and Gao, R.: Ice nucleation and dehydration in the Tropical Tropopause Layer, P. Natl. Acad. Sci. USA, 110, 2041–2046, 2013a. a, b, c, d
Jensen, E. J., Lawson, R. P., Bergman, J. W., Pfister, L., Bui, T. P., and Schmitt, C. G.: Physical processes controlling ice concentrations in synoptically forced, midlatitude cirrus, J. Geophys. Res., 118, 5348–5360, https://doi.org/10.1002/jgrd.50421, 2013b. a
Jensen, E. J., Pfister, L., Jordan, D. E., Fahey, D. W., Newman, P. A., Thornberry, T., Rollins, A., Diskin, G., Bui, T. P., McGill, M., Hlavka, D., Lawson, R. P., Gao, R.-S., Pilewskie, P., Elkins, J., Hintsa, E., Moore, F., Mahoney, M. J., Atlas, E., Stutz, J., Pfeilsticker, K., Wofsy, S. C., Evan, S., and Rosenlo, K. H.: The NASA Airborne Tropical TRopopause EXperiment (ATTREX), SPARC Newsletter, 41, 15–24, 2013c. a
Jensen, E. J., Ueyama, R., Pfister, L., Bui, T. V., Alexander, M. J., Podglajen, A., Hertzog, A., Woods, S., Lawson, R. P., Kim, J.-E., and Schoeberl, M. R.: High-frequency gravity waves and homogeneous ice nucleation in tropical tropopause layer cirrus, Geophys. Res. Lett., 43, 6629–6635, https://doi.org/10.1002/2016GL069426, 2016. a, b, c, d, e, f
Jensen, E. J., Pfister, L., Jordan, D. E., Bui, T. V., Ueyama, R., Singh, H. B., Thornberry, T. D., Rollins, A. W., Gao, R.-S., Fahey, D. W., Rosenlof, K. H., Elkins, J. W., Diskin, G. S., DiGangi, J. P., Lawson, R. P., Woods, S., Atlas, E. L., Rodriguez, M. A. N., Wofsy, S. C., Pittman, J., Bardeen, C. G., Toon, O. B., Kindel, B. C., Newman, P. A., McGill, M. J., Hlavka, D. L., Lait, L. R., Schoeberl, M. R., Bergman, J. W., Selkirk, H. B., Alexander, M. J., Kim, J.-E., Lim, B. H., Stutz, J., and Pfeilsticker, K.: The NASA Airborne Tropical Tropopause Experiment: High-Altitude Aircraft Measurements in the Tropical Western Pacific, Bull. Am. Meteorol. Soc., 98, 129–143, https://doi.org/10.1175/BAMS-D-14-00263.1, 2017. a, b
Jensen, E. J., Kärcher, B., Ueyama, R., Pfister, L., Bui, T. V., Diskin, G. S., DiGangi, J. P., Woods, S., Lawson, R. P., Froyd, K. D., and Murphy, D. M.: Heterogeneous Ice Nucleation in the Tropical Tropopause Layer, J. Geophys. Res., 123, 21, https://doi.org/10.1029/2018jd028949, 2018. a
Kim, J.-E. and Alexander, M. J.: Direct impacts of waves on tropical cold point tropopause temperature, Geophys. Res. Lett., 42, 1584–1592, https://doi.org/10.1002/2014GL062737, 2015. a, b, c
Koop, T., Luo, B., Tsias, A., and Peter, T.: Water activity as the determinant for homogeneous ice nucleation in aqueous solutions, Nature, 406, 611–614, https://doi.org/10.1038/35020537, 2000. a
Krämer, M., Schiller, C., Afchine, A., Bauer, R., Gensch, I., Mangold, A., Schlicht, S., Spelten, N., Sitnikov, N., Borrmann, S., de Reus, M., and Spichtinger, P.: Ice supersaturations and cirrus cloud crystal numbers, Atmos. Chem. Phys., 9, 3505–3522, https://doi.org/10.5194/acp-9-3505-2009, 2009. a, b
Kärcher, B.: Properties of subvisible cirrus clouds formed by homogeneous freezing, Atmos. Chem. Phys., 2, 161–170, https://doi.org/10.5194/acp-2-161-2002, 2002. a
Kärcher, B.: Simulating gas-aerosol-cirrus interactions: Process-oriented microphysical model and applications, Atmos. Chem. Phys., 3, 1645–1664, https://doi.org/10.5194/acp-3-1645-2003, 2003. a, b
Kärcher, B.: Cirrus clouds in the tropical tropopause layer: Role of heterogeneous ice nuclei, Geophys. Res. Lett., 31, 12, https://doi.org/10.1029/2004gl019774, 2004. a
Kärcher, B. and Lohmann, U.: A parameterization of cirrus cloud formation: Homogeneous freezing of supercooled aerosols, J. Geophys. Res., 107, AAC 4-1–AAC 4-10, https://doi.org/10.1029/2001JD000470, 2002. a, b
Kärcher, B. and Podglajen, A.: A Stochastic Representation of Temperature Fluctuations Induced by Mesoscale Gravity Waves, J. Geophys. Res., 124, 11506–11529, https://doi.org/10.1029/2019jd030680, 2019. a, b, c, d
Kärcher, B., Hendricks, J., and Lohmann, U.: Physically based parameterization of cirrus cloud formation for use in global atmospheric models, J. Geophys. Res., 111, D1, https://doi.org/10.1029/2005jd006219, 2006. a
Kärcher, B., Jensen, E. J., and Lohmann, U.: The Impact of Mesoscale Gravity Waves on Homogeneous Ice Nucleation in Cirrus Clouds, Geophys. Res. Lett., 46, 5556–5565, https://doi.org/10.1029/2019GL082437, 2019. a
Lance, S.: Coincidence Errors in a Cloud Droplet Probe (CDP) and a Cloud and Aerosol Spectrometer (CAS), and the Improved Performance of a Modified CDP, J. Atmos. Oceanic Technol., 29, 1532–1541, https://doi.org/10.1175/jtech-d-11-00208.1, 2012. a
Lance, S., Brock, C. A., Rogers, D., and Gordon, J. A.: Water droplet calibration of the Cloud Droplet Probe (CDP) and in-flight performance in liquid, ice and mixed-phase clouds during ARCPAC, Atmos. Meas. Tech., 3, 1683–1706, https://doi.org/10.5194/amt-3-1683-2010, 2010. a, b
Lawson, R. P., O’Connor, D., Zmarzly, P., Weaver, K., Baker, B., Mo, Q., and Jonsson, H.: The 2D-S (Stereo) Probe: Design and Preliminary Tests of a New Airborne, High-Speed, High-Resolution Particle Imaging Probe, J. Atmos. Ocean. Technol., 23, 1462–1477, https://doi.org/10.1175/JTECH1927.1, 2006. a
LMD/IPSL: STRATEOLE2-C0: TSEN-Thermodynamics SENsor, LMD/IPSL [data set], https://data.ipsl.fr/catalog/strateole2/ (last access: 5 January 2022), 2022 a
McFarquhar, G. M., Heymsfield, A. J., Spinhirne, J., and Hart, B.: Thin and Subvisual Tropopause Tropical Cirrus: Observations and Radiative Impacts, J. Atmos. Sci., 57, 1841–1853, https://doi.org/10.1175/1520-0469(2000)057<1841:tasttc>2.0.co;2, 2000. a
Mote, P. W., Rosenlof, K. H., McIntyre, M. E., Carr, S. E., Gille, J. C., Holton, J. R., Kinnersley, J. S., Pumphrey, H. C., Russell III, J. M., and Waters, J. W.: An atmospheric tape recorder: The imprint of tropical tropopause temperatures on stratospheric water vapor, J. Geophys. Res., 101, 3989–4006, 1996. a
Murphy, D. M.: Rare temperature histories and cirrus ice number density in a parcel and a one-dimensional model, Atmos. Chem. Phys., 14, 13013–13022, https://doi.org/10.5194/acp-14-13013-2014, 2014. a, b
NASA: ATTREX 2014 Global Hawk files, NASA [data set], https://espoarchive.nasa.gov/archive/browse/attrex/id4/GHawk (last access: 10 August 2022), 2022 a
Nastrom, G. D.: The Response of Superpressure Balloons to Gravity Waves, J. Applied Meteo., 19, 1013–1019, https://doi.org/10.1175/1520-0450(1980)019<1013:trosbt>2.0.co;2, 1980. a
Pfister, L., Selkirk, H. B., Jensen, E. J., Schoeberl, M. R., Toon, O. B., Browell, E. V., Grant, W. B., Gary, B., Mahoney, M. J., Bui, T. V., and Hintsa, E.: Aircraft observations of thin cirrus clouds near the tropical tropopause, J. Geophys. Res., 106, 9765–9786, https://doi.org/10.1029/2000jd900648, 2001. a
Podglajen, A., Hertzog, A., Plougonven, R., and Legras, B.: Lagrangian temperature and vertical velocity fluctuations due to gravity waves in the lower stratosphere, Geophys. Res. Lett., 43, 3543–3553, https://doi.org/10.1002/2016GL068148, 2016. a, b, c, d
Podglajen, A., Plougonven, R., Hertzog, A., and Jensen, E.: Impact of gravity waves on the motion and distribution of atmospheric ice particles, Atmos. Chem. Phys., 18, 10799–10823, https://doi.org/10.5194/acp-18-10799-2018, 2018. a, b
Randel, W. J. and Jensen, E. J.: Physical processes in the tropical tropopause layer and their roles in a changing climate, Nat. Geosci., 6, 169–176, https://doi.org/10.1038/ngeo1733, 2013. a
Salby, M. and Callaghan, P.: Control of the Tropical Tropopause and Vertical Transport across It, J. Clim., 17, 965–985, https://doi.org/10.1175/1520-0442(2004)017<0965:cottta>2.0.co;2, 2004. a
Schiller, C., Grooß, J.-U., Konopka, P., Plöger, F., dos Santos, F. H. S., and Spelten, N.: Hydration and dehydration at the tropical tropopause, Atmos. Chem. Phys., 9, 9647–9660, https://doi.org/10.5194/acp-9-9647-2009, 2009. a
Schoeberl, M. R., Dessler, A. E., Wang, T., Avery, M. A., and Jensen, E. J.: Cloud formation, convection, and stratospheric dehydration, Earth Space Sci., 1, 1–17, https://doi.org/10.1002/2014ea000014, 2014. a
Schoeberl, M. R., Jensen, E. J., and Woods, S.: Gravity waves amplify upper tropospheric dehydration by clouds, Earth Space Sci., 2, 485–500, https://doi.org/10.1002/2015ea000127, 2015. a, b, c, d, e
Schoeberl, M. R., Jensen, E. J., Pfister, L., Ueyama, R., Avery, M., and Dessler, A. E.: Convective Hydration of the Upper Troposphere and Lower Stratosphere, J. Geophys. Res.-Atmos., 123, 4583–4593, 2018. a, b
Smith, W. L., Ackerman, S., Revercomb, H., Huang, H., DeSlover, D. H., Feltz, W., Gumley, L., and Collard, A.: Infrared spectral absorption of nearly invisible cirrus clouds, Geophys. Res. Lett., 25, 1137–1140, https://doi.org/10.1029/97gl03491, 1998. a
Solomon, S., Garcia, R. R., Rowland, F. S., and Wuebbles, D. J.: On the depletion of Antarctic ozone, Nature, 321, 755–758, https://doi.org/10.1038/321755a0, 1986. a
Solomon, S., Rosenlof, K. H., Portmann, R. W., Daniel, J. S., Davis, S. M., Sanford, T. J., and Plattner, G.-K.: Contributions of Stratospheric Water Vapor to Decadal Changes in the Rate of Global Warming, Science, 327, 1219–1223, https://doi.org/10.1126/science.1182488, 2010. a
Spichtinger, P. and Gierens, K. M.: Modelling of cirrus clouds – Part 1b: Structuring cirrus clouds by dynamics, Atmos. Chem. Phys., 9, 707–719, https://doi.org/10.5194/acp-9-707-2009, 2009. a
Spichtinger, P. and Krämer, M.: Tropical tropopause ice clouds: a dynamic approach to the mystery of low crystal numbers, Atmos. Chem. Phys., 13, 9801–9818, https://doi.org/10.5194/acp-13-9801-2013, 2013. a, b, c, d, e, f, g
Toon, O. B., Turco, R. P., Westphal, D., Malone, R., and Liu, M.: A Multidimensional Model for Aerosols: Description of Computational Analogs, J. Atmos. Sci., 45, 2123–2144, https://doi.org/10.1175/1520-0469(1988)045<2123:ammfad>2.0.co;2, 1988. a
Toon, O. B., Turco, R. P., Jordan, J., Goodman, J., and Ferry, G.: Physical processes in polar stratospheric ice clouds, J. Geophys. Res., 94, 11359, https://doi.org/10.1029/jd094id09p11359, 1989. a
Ueyama, R., Jensen, E. J., Pfister, L., and Kim, J.-E.: Dynamical, convective, and microphysical control on wintertime distributions of water vapor and clouds in the tropical tropopause layer, J. Geophys. Res., 19, 10483–10500, https://doi.org/10.1002/2015jd023318, 2015. a
Vincent, R. A. and Hertzog, A.: The response of superpressure balloons to gravity wave motions, Atmos. Meas. Tech., 7, 1043–1055, https://doi.org/10.5194/amt-7-1043-2014, 2014. a, b
Winker, D. M. and Trepte, C. R.: Laminar cirrus observed near the tropical tropopause by LITE, Geophys. Res. Lett., 25, 3351–3354, https://doi.org/10.1029/98gl01292, 1998. a
Woods, S., Lawson, R. P., Jensen, E., Bui, T. P., Thornberry, T., Rollins, A., Pfister, L., and Avery, M.: Microphysical Properties of Tropical Tropopause Layer Cirrus, J. Geophys. Res., 123, 6053–6069, https://doi.org/10.1029/2017jd028068, 2018. a