the Creative Commons Attribution 4.0 License.
the Creative Commons Attribution 4.0 License.
 | 15 Dec 2023
In situ measurements of perturbations to stratospheric aerosol and modeled ozone and radiative impacts following the 2021 La Soufrière eruption
Corey Pedersen
John Dykema
Jean-Paul Vernier
Sandro Vattioni
Amit Kumar Pandit
Andrea Stenke
Elizabeth Asher
Troy Thornberry
Michael A. Todt
Thao Paul Bui
Jonathan Dean-Day
Frank N. Keutsch
Stratospheric aerosols play important roles in Earth's radiative budget and in heterogeneous chemistry. Volcanic eruptions modulate the stratospheric aerosol layer by injecting particles and particle precursors like sulfur dioxide (SO2) into the stratosphere. Beginning on 9 April 2021, La Soufrière erupted, injecting SO2 into the tropical upper troposphere and lower stratosphere, yielding a peak SO2 loading of 0.3–0.4 Tg. The resulting volcanic aerosol plumes dispersed predominately over the Northern Hemisphere (NH), as indicated by the CALIOP/CALIPSO satellite observations and model simulations. From June to August 2021 and May to July 2022, the NASA ER-2 high-altitude aircraft extensively sampled the stratospheric aerosol layer over the continental United States during the Dynamics and Chemistry of the Summer Stratosphere (DCOTSS) mission. These in situ aerosol measurements provide detailed insights into the number concentration, size distribution, and spatiotemporal variations of particles within volcanic plumes. Notably, aerosol surface area density and number density in 2021 were enhanced by a factor of 2–4 between 380–500 K potential temperature compared to the 2022 DCOTSS observations, which were minimally influenced by volcanic activity. Within the volcanic plume, the observed aerosol number density exhibited significant meridional and zonal variations, while the mode and shape of aerosol size distributions did not vary. The La Soufrière eruption led to an increase in the number concentration of small particles (<400 nm), resulting in a smaller aerosol effective diameter during the summer of 2021 compared to the baseline conditions in the summer of 2022, as observed in regular ER-2 profiles over Salina, Kansas. A similar reduction in aerosol effective diameter was not observed in ER-2 profiles over Palmdale, California, possibly due to the values that were already smaller in that region during the limited sampling period in 2022. Additionally, we modeled the eruption with the SOCOL-AERv2 aerosol–chemistry–climate model. The modeled aerosol enhancement aligned well with DCOTSS observations, although the direct comparison was complicated by issues related to the model's background aerosol burden. This study indicates that the La Soufrière eruption contributed approximately 0.6 % to Arctic and Antarctic ozone column depletion in both 2021 and 2022, which is well within the range of natural variability. The modeled top-of-atmosphere 1-year global average radiative forcing was −0.08 W m−2 clear-sky and −0.04 W m−2 all-sky. The radiative effects were concentrated in the tropics and NH midlatitudes and diminished to near-baseline levels after 1 year.
- Article
(4466 KB) - Full-text XML
-
Supplement
(4546 KB) - BibTeX
- EndNote


Stratospheric aerosols are important to the climate and chemistry of the Earth (Deshler, 2008; Kremser et al., 2016, and references therein). They modify the global radiative budget by scattering and absorbing solar shortwave and terrestrial longwave radiation. Aerosols in the lower stratosphere also affect the cloud life cycle by acting as ice nuclei (Sporre et al., 2022). Studies have shown that approximately 21 % of the overall direct aerosol radiative forcing since 1850 can be attributed to stratospheric aerosols (Yu et al., 2016). In general, stratospheric aerosols have a net surface cooling effect (Robock, 2000). Stratospheric aerosols can also provide a surface for heterogeneous reactions to occur that amplify catalytic ozone loss cycles (Fahey et al., 1993; Solomon, 1999; Mcneill and Thornton, 2023; Solomon et al., 2023). The climate and chemical impacts of stratospheric aerosols depend on their chemical composition, concentration, and size distribution (Li et al., 2021; Murphy et al., 2021).
Volcanic eruptions have a profound impact on the physicochemical properties of stratospheric aerosols by injecting a substantial amount of ash and particle precursors, such as sulfur dioxide (SO2), directly into the stratosphere (Kremser et al., 2016; Friberg et al., 2018; Schmidt et al., 2018). Once in the stratosphere, SO2 undergoes oxidation within a span of days to weeks (Rex et al., 2014), resulting in the formation of sulfate aerosols (sulfuric acid and water mixture). These aerosols can persist for months to years in the stratosphere, depending on particle size and the location of the volcanic plumes, due to limited wet and dry deposition processes. Therefore, it is crucial to understand the variations in aerosol concentration and size distribution, as well as the transport of the volcanic plumes after eruptions to accurately assess their impacts on climate and chemistry. Our current understanding of the size distribution of stratospheric volcanic aerosols is largely based on studies of the Mt. Pinatubo eruption in 1991, which was the largest eruption (regarding SO2) in the satellite era and resulted in a substantial increase in aerosol size (Deshler et al., 1993; Russell et al., 1996). However, the variability of stratospheric aerosol size distribution after volcanic eruptions, particularly those associated with moderate and small eruptions, remains unclear (Marshall et al., 2022). These eruptions, despite their smaller size, have been shown to contribute to persistent variability in stratospheric aerosols (Vernier et al., 2011) and can have significant climate impacts (Solomon et al., 2011; Andersson et al., 2015).
Satellite remote sensing provides long-term, global coverage of stratosphere aerosol retrievals (Thomason et al., 2018). It has been the primary method for assessing the volcanic influence on stratospheric aerosols and provides critical inputs, such as stratospheric aerosol optical depth and extinction profiles, for models to evaluate the subsequent climate and chemical impacts (Friberg et al., 2018). Satellite-derived stratospheric aerosol products, especially limb-scatter-based measurements, rely on assumptions about the aerosol size distribution (e.g., Loughman et al., 2018). To ensure accurate satellite retrievals, in situ aerosol measurements are essential as they provide size-resolved stratospheric aerosol number concentrations. Balloon-borne measurements offer valuable datasets on aerosol size distribution but are limited in spatial coverage (e.g., Kalnajs and Deshler, 2022; Todt et al., 2023). On the other hand, aircraft measurements provide wider spatial coverage and, in certain cases, finer temporal resolution, which are crucial for understanding the spatiotemporal variability of volcanic plumes and their impacts in the stratosphere (Wilson et al., 1993; Pueschel et al., 1994). While aircraft-based observations play a vital role in enhancing our precise understanding of volcanic plume evolution in the stratosphere, such observations are limited due to the challenge of organizing rapid and dedicated deployments following volcanic eruptions.
On 9 April 2021, La Soufrière (13.3∘ N, 61.2∘ W) began erupting explosively (maximum volcanic explosivity index of 4). Horváth et al. (2022) identified 49 distinct eruptive events between 9–22 April. The stratospherically relevant eruptive events occurred primarily between 9–12 April (Taylor et al., 2022). Peak SO2 column loading was measured to be between 0.3–0.4 Tg (Taylor et al., 2022; Bruckert et al., 2023). The bulk of the plumes and SO2 spread near the tropopause (∼ 17–18 km), with overshooting tops reaching up to 23 km (Horváth et al., 2022; Taylor et al., 2022). Multi-angle Imaging SpectroRadiometer (MISR) observations also indicate that the volcanic ash plume reached levels above 20 km (NASA Earth Applied Sciences Disasters Program). The volcanic plumes were first detected over North America on 30 April by a balloon-borne optical particle spectrometer launched from Boulder, Colorado (Todt et al., 2023).
Two months after the eruption of La Soufrière, the Dynamics and Chemistry of the Summer Stratosphere (DCOTSS) airborne mission obtained in situ measurements of aerosol number concentration and size in the lower stratosphere (13–21 km, 380–500 K potential temperature) over North America between June and August 2021. The extensive spatial and temporal coverage of the DCOTSS dataset enables a detailed examination of the aerosol variation as volcanic plumes age and disperse in the stratosphere during the months following the eruption (2–4 months post-eruption) and will be useful for validating satellite observations and model simulations. Furthermore, DCOTSS observations between May and July 2022, a period when the volcanic influence was minimal, serve as a baseline state for comparing the volcanic perturbations observed in 2021.
In this study we analyzed the stratospheric aerosol perturbations from the 2021 La Soufrière eruption and impacts on stratospheric ozone and radiative forcing, combining in situ aircraft and balloon-borne measurements, satellite observations, and SOCOL-AERv2 aerosol–chemistry–climate model simulations. We examined the distribution and transport of volcanic aerosol plumes in the stratosphere using satellite observations and model simulations. The modeled aerosol concentration enhancement was consistent with DCOTSS in situ aircraft measurements in Northern Hemisphere (NH) midlatitudes. Through DCOTSS measurements and model simulations, we explored the spatial variations in aerosol number density and size distribution within the volcanic plumes, as well as the impacts of these plumes on the stratospheric aerosol effective diameter. We also used balloon-borne optical particle counter measurements to gain insights about aerosol perturbations above 20 km in NH midlatitudes. Using our model simulations, we examined the radiative forcing and ozone column depletion caused by the eruption.
2.1 DCOTSS aircraft measurements
The DCOTSS campaign took place in June–August 2021 and May–July 2022 over North America, with a focus on understanding the interactions between dynamical and chemical processes that determine the composition of the extratropical summer stratosphere (https://dcotss.org/, last access: 6 December 2023). With the NASA ER-2 high-altitude aircraft platform, aerosols and various trace gases were sampled and analyzed in situ to characterize the background stratosphere and perturbations from overshooting convective events, volcanic eruptions, and wildfire injections. Figure 1 shows the ER-2 flight tracks of 31 total flights during the DCOTSS 2021 and 2022 missions. Most of the flights originated from Salina, Kansas (39∘ N, 98∘ W), while some flights were conducted from Palmdale, California (35∘ N, 118∘ W). The ER-2 aircraft can reach altitudes as high as 22 km (approximately 510 K potential temperature) and has a maximum flight duration of 8 h. Vertical profiling between 13 and 22 km was constantly conducted during the DCOTSS missions.
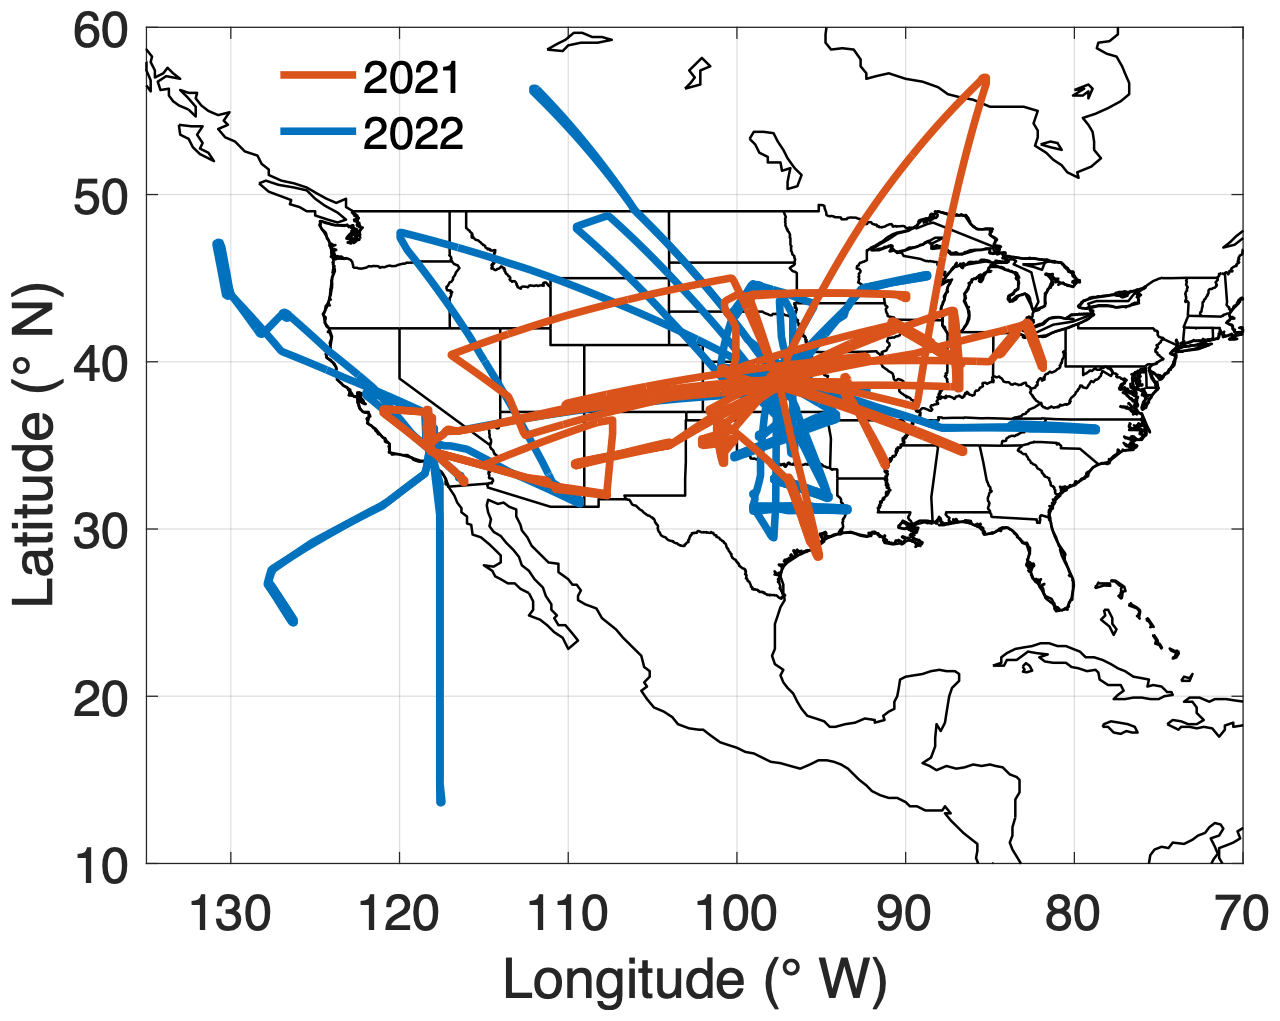
Figure 1Flight tracks (of 31 total flights) of the NASA ER-2 high-altitude research aircraft during the DCOTSS 2021 (June–August) and 2022 (May–July) missions.
The DCOTSS Portable Optical Particle Spectrometer (DPOPS) instrument aboard the ER-2 aircraft measured the particle number density and size distribution between 140 and 2500 nm diameter at 1 Hz resolution (Li et al., 2022). The core part of the instrument, i.e., the Portable Optical Particle Spectrometer (POPS; Handix Scientific, Boulder, CO), uses a 405 nm diode laser to count and size individual particles (Gao et al., 2016). DPOPS is an optimized POPS system designed specifically for high-altitude aircraft platforms, enabling isokinetic sampling of particles throughout the troposphere and lower stratosphere with autonomous operation during flight. The sample flow rate is 0.8 L min−1 (liter per minute). At this flow rate, the DPOPS instrument is capable of measuring total particle number concentrations ranging from 0 to 150 no. cm−3 with a coincidence error of less than 10 %. The DPOPS instrument was calibrated using size-classified dioctyl sebacate (DOS; refractive index of 1.45 + 0 i) particles and polystyrene latex (PSL; refractive index of 1.615 + 0.001i) beads before and after the campaign, and the performance was routinely checked with 300 nm PSL beads after each flight. For this study, the size distribution data calibrated with DOS were employed, as stratospheric volcanic aerosols predominantly consist of sulfuric acid and water, which have refractive indices (around 1.45) more similar to DOS. The size distribution is presented here in 36 non-uniformly spaced size bins.
The Meteorological Measurement System (MMS) provides high-resolution (20 Hz) measurements of ambient meteorological parameters, including pressure, temperature, 3-dimensional wind vector, turbulence index, and GPS position, along the ER-2 flight track (Scott et al., 1990). The potential temperature coordinates are used to analyze the transport and evolution of plumes in the stratosphere since stratospheric air masses tend to move along the lines of constant potential temperature (i.e., isentropes).
2.2 DCOTSS balloon-borne aerosol measurements
Between 23 and 28 August 2021, five balloon soundings were carried out from Salina, Kansas (39∘ N, 98∘ W). In addition to the Particle Plus 8306 Optical Particle Counter (POPC) and the Compact Optical Backscatter Aerosol Detector (COBALD), the payloads also include a cryogenic frost-point hygrometer (CFH) for water vapor mixing ratio measurements and an iMET-1 radiosonde for getting meteorological parameters and GPS locations. The POPC instrument (<2 kg) was specifically developed for weather balloon deployments to make aerosol concentration profile measurements from the ground to the stratosphere. This profiling is achieved through the utilization of a 785 nm laser diode, capable of detecting particle diameters spanning eight bins ranging from 300 to 10 000 nm. The sample flow rate for the POPC instrument is 2.83 L m−1. A separate paper describing the system, its calibration procedure, and comparisons with other instruments is in preparation. COBALD is a lightweight (540 g) instrument that consists of two high-power light-emitting diodes (LEDs) that emit about 500 mW of optical power, at wavelengths of 470 and 940 nm, respectively. The backscattered light from the molecules, aerosols, or ice particles is recorded by a silicon photodiode using phase-sensitive detection. The scattering ratio calculated from COBALD measurements has an absolute error interval of 5 %, with precision better than 1 % in the upper troposphere and lower stratosphere (Vernier et al., 2015). The balloon flights reached altitudes of up to 30 km.
2.3 Satellite observations
Two satellite instruments, the Infrared Atmospheric Sounding Interferometer (IASI) on board the MetOp-A, MetOp-B, and MetOp-C (MetOp) satellites and the TROPOspheric Monitoring Instrument (TROPOMI) on board the ESA/EU Copernicus Sentinel-5 Precursor (S5P) satellite, were used to obtain the La Soufrière SO2 vertical profile and burden for model input. IASI, a Fourier Transform spectrometer, exhibits good sensitivity to SO2 within its spectral range (Scott et al., 1990). Using IASI, it is possible to obtain SO2 column amounts and heights for each pixel twice per day (Carboni et al., 2012). The column amounts and heights across the plume are aggregated to create a vertical distribution of SO2 mass. Taylor et al. (2022) computed the vertical profile and burden of IASI/MetOp retrievals and found the bulk of the SO2 plume to be near the tropopause region with approximately 31 % in the stratosphere. Due to uncertainty in pixel height retrievals near the tropopause, the amount classified as stratospheric could be between 0.4 % and 78 %. The peak SO2 burden derived from IASI observations was 0.31 ± 0.09 Tg on 13 April, which was lower than the 0.4 Tg peak burden derived from TROPOMI/S5P observations (Bruckert et al., 2023). As discussed by Taylor et al. (2022), IASI/MetOp SO2 retrievals may be underestimated due to the effects of volcanic ash and the presence of SO2 below the detection threshold of the instrument. Also, Vernier et al. (2023) pointed out the limited vertical sensitivity of current satellite sensors in SO2 retrieval, which is around ±2 km in the lower stratosphere.
Following volcanic eruptions, the SO2 injected into the stratosphere undergoes oxidation and transforms into sulfuric acid/water aerosol particles over a period of days to weeks. The Cloud-Aerosol Lidar with Orthogonal Polarization (CALIOP) instrument on board the Cloud-Aerosol Lidar and Infrared Pathfinder Satellite Observations (CALIPSO) satellite provides high-resolution vertical profiles of aerosols and clouds with near-global coverage. The CALIPSO satellite completes about 15 orbits per day with a 16 d repeat cycle, covering latitudes between 82∘ S and 82∘ N. The measurements of CALIOP are based on the backscatter signals at 532 and 1064 nm wavelengths. Here we used the total attenuated backscatter at 532 nm from CALIOP Level 1 data version 4.11 following the data processing method developed by Vernier et al. (2009). Zonal averaging over 15 d was performed on the scattering ratios, calculated as the ratio of the measured total backscatter to the calculated molecular backscatter at 532 nm. The scattering ratio at 532 nm from CALIOP/CALIPSO provides an indicator of aerosol concentration.
2.4 SOCOL-AERv2 model
SOCOL-AERv2 is a coupled aerosol–chemistry–climate model (Sheng et al., 2015; Feinberg et al., 2019). The chemistry–climate model SOCOL integrates the global circulation model MA-ECHAM5 with a modified version of the chemistry model MEZON (Roeckner et al., 2003, 2006; Stenke et al., 2013). The model calculates a variety of chemical reactions including photolysis reactions, gas-phase reactions, and heterogeneous reactions on sulfate aerosol and three types of polar stratospheric clouds (see Stenke et al., 2013, and references therein for a complete description of the chemistry). The third component, AER, is a sectional aerosol model, which describes sulfate aerosol microphysics and chemistry with interactive deposition schemes. The aerosols in SOCOL-AERv2 are divided into 40 size bins of radii 0.39–3200 nm, with the aerosol volume varying by a factor of 2 between each bin. The model resolution used in this study was T42 (2.8∘ × 2.8∘), with 39 vertical levels from 1013.25 to 0.01 hPa. The stratosphere is represented by 15–20 model levels.
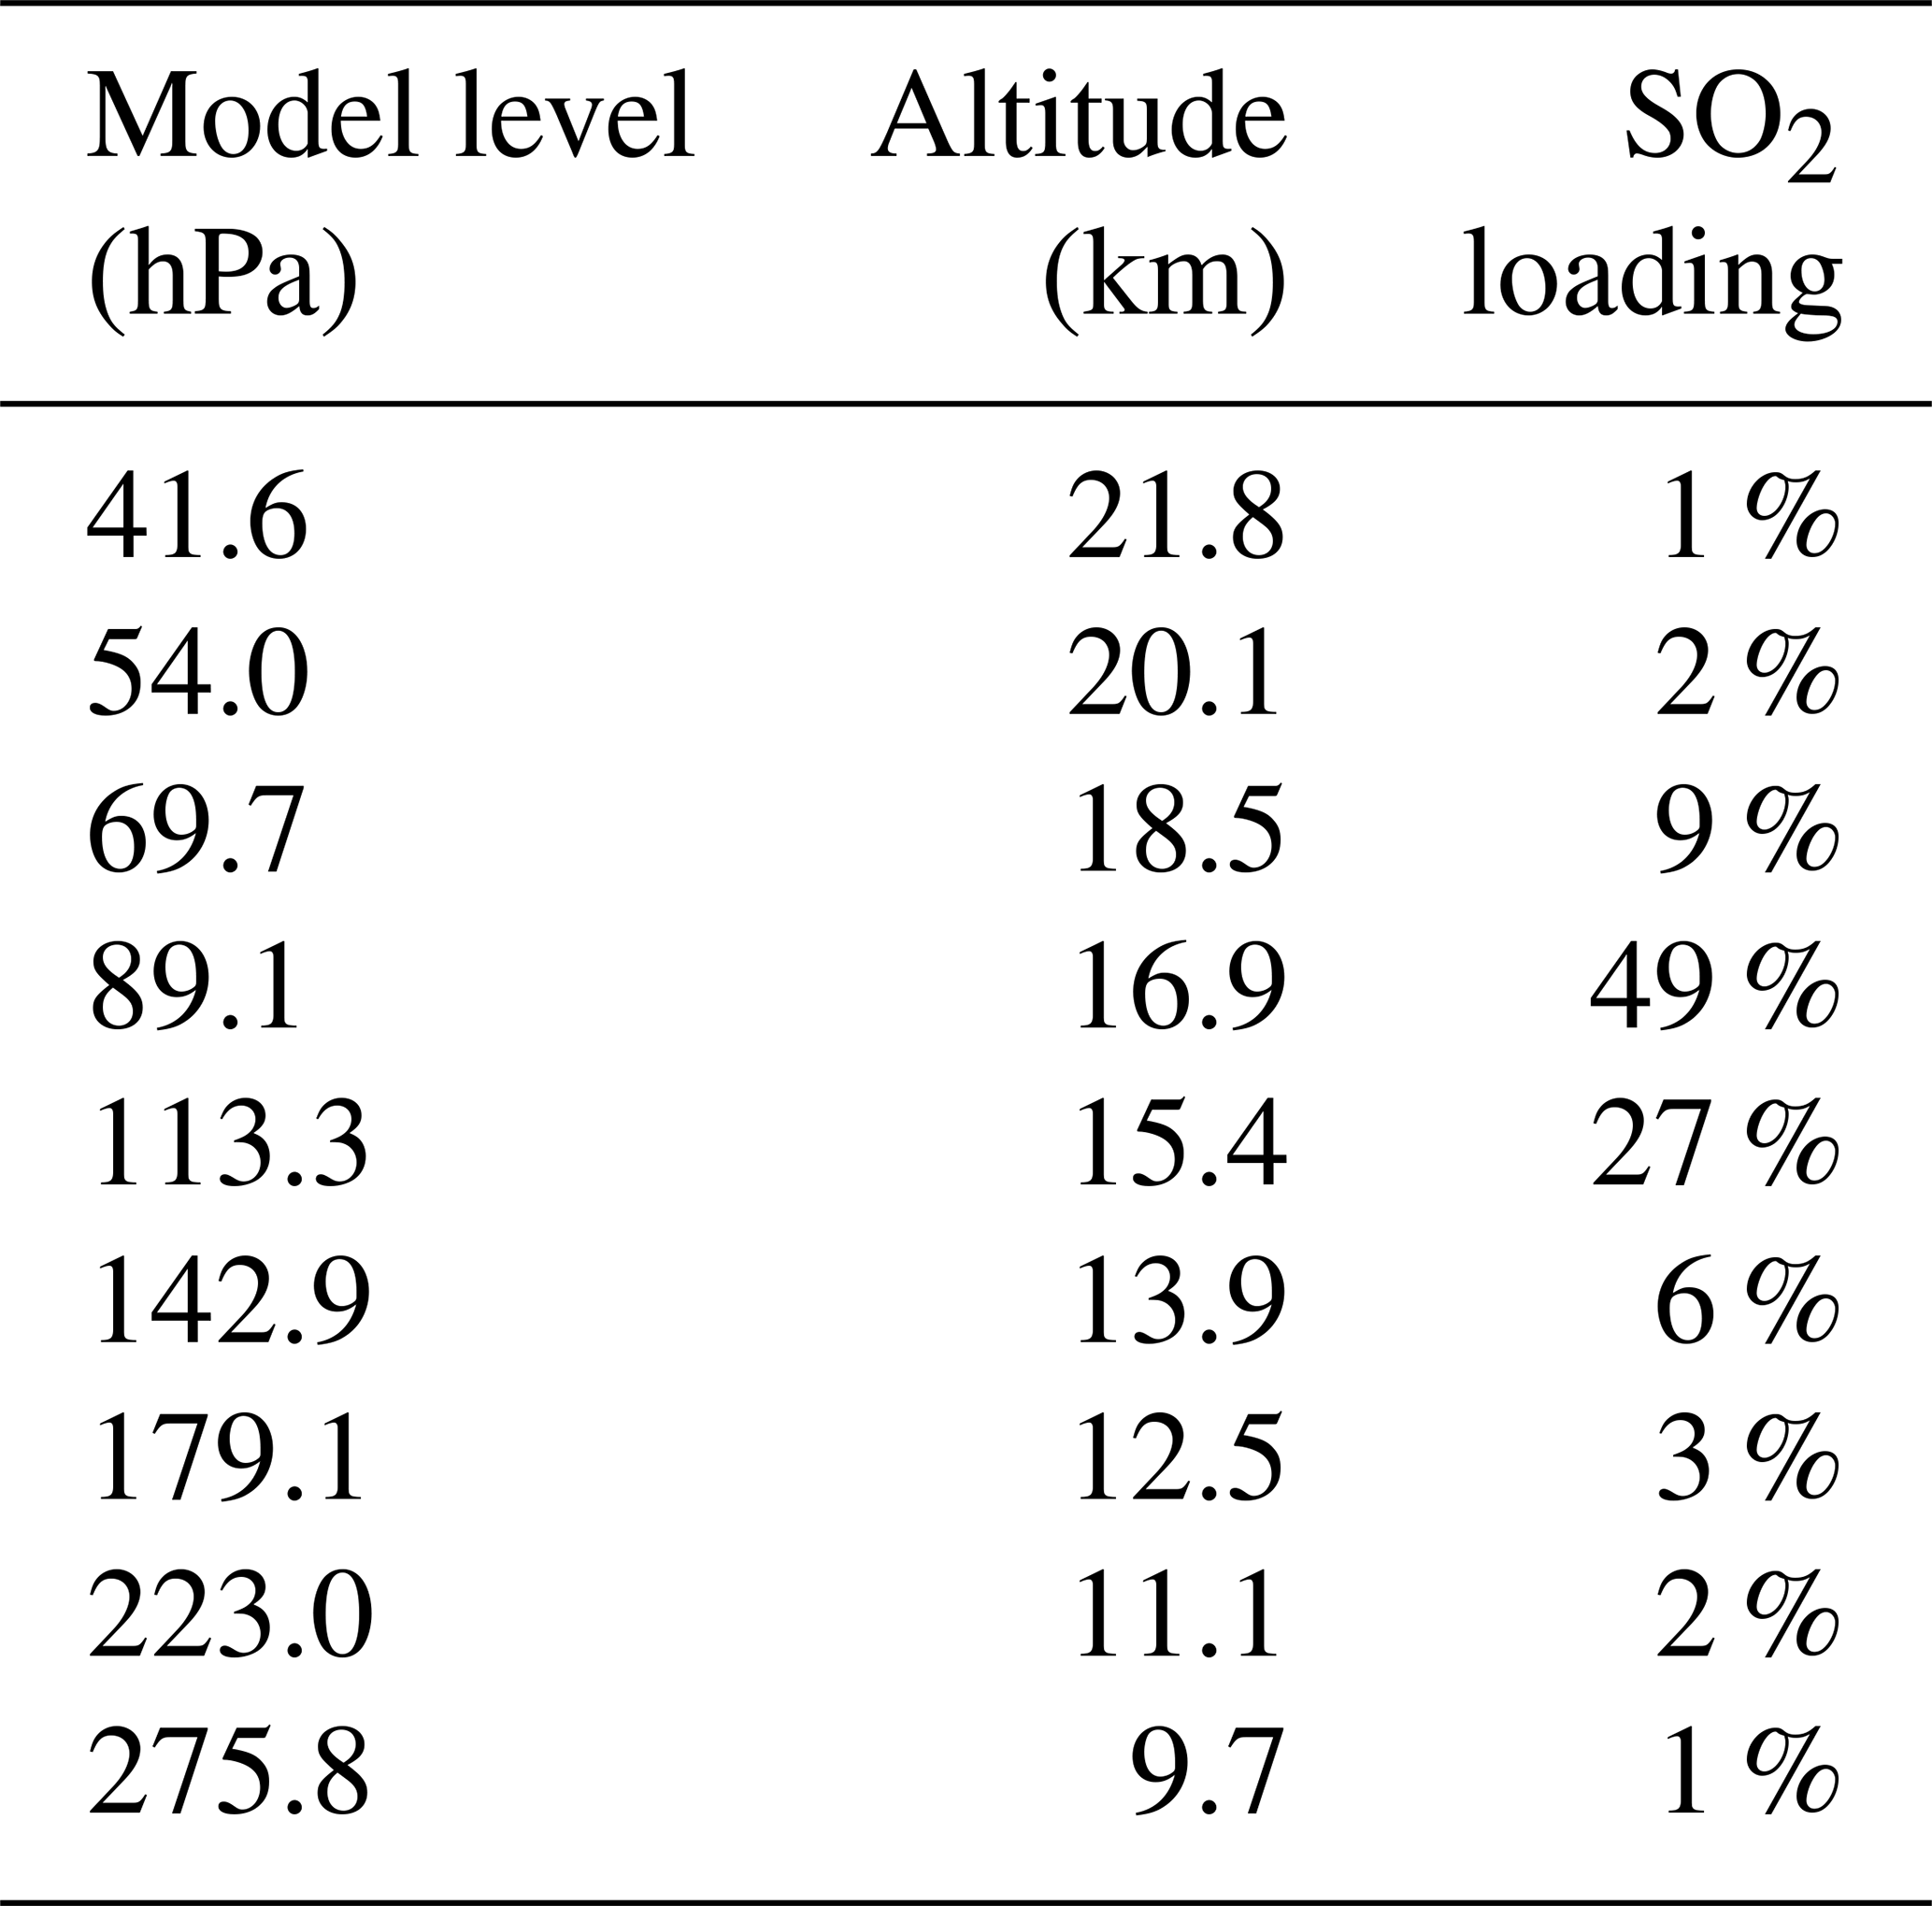
We prescribed the model simulation of the eruption using IASI/MetOp SO2 plume retrievals reported by Taylor et al. (2022). We inputted the eruption over the entire day of 12 April using the IASI SO2 vertical profile from 12 April (Table 1) to capture all stratospherically relevant eruptive events. For reasons discussed in Sect. 2.2, we scaled the IASI/MetOp SO2 vertical profile to attain a total mass loading of 0.4 Tg of SO2 as observed by TROPOMI/S5P on 11 April (Bruckert et al., 2023). The eruption was prescribed uniformly in the grid of 4–15∘ N, 20–62∘ W, which corresponds to latitudes and longitudes where the fraction of the total SO2 emission observed by IASI on 12 April was greater than 10 % and 4 %, respectively. Given the limited spatial resolution of our model (2.8∘ × 2.8∘ horizontal resolution, 39 vertical levels) and the adoption of a uniform injection scenario, accurately simulating the fine-scale structure of volcanic plumes is not possible. Our primary focus is on large-scale phenomena that are appropriate for the scale of the model. To explore the sensitivity of our model simulations on the SO2 vertical profile for reasons discussed in Sect. 3.1, we ran two additional simulations: one with the IASI vertical profile shifted upward by 2 km and one with 0.1 Tg injected at 42 hPa (∼22 km).
Table 1The IASI/MetOp SO2 vertical profile on 12 April (Taylor et al., 2022) binned to the SOCOL-AERv2 model levels. The total SO2 injected in the model is 0.4 Tg. The pressure altitudes of the model levels were calculated using the US Standard Atmosphere.
We performed the simulations with prescribed meteorology which nudges the model's temperature and wind fields toward ERA5 reanalysis (Hersbach et al., 2020). The model runs were initialized in 2015 with a constant carbonyl sulfide (OCS) surface mixing ratio of 500 ppt and SO2 surface emissions based on RCP2.6 emissions projections for 2020, which results in a background stratospheric aerosol burden of 196 Gg S. We also performed controlled simulations without SO2 injection to serve as the no-eruption reference. To compare the model simulations with DPOPS measurements, we calculated the model number and surface area density using the aerosol size bins closest to the DPOPS measurement range, bins 24–36, which correspond to wet diameters of 158–2536 nm.
3.1 Distribution and transport of La Soufrière aerosol plumes
The distribution and transport of aerosols produced by the La Soufrière eruption are depicted in Fig. 2, which shows CALIOP/CALIPSO 15 d zonal mean scattering ratios. The scattering ratio is an optical indicator of aerosol concentration but is also influenced by aerosol size. Figure 2a largely represents the background scattering ratio distribution before the La Soufrière eruption. In early May, approximately 3–5 weeks after the eruption, two distinct aerosol layers became apparent in the tropical stratosphere. The lower layer was centered around 18 km (∼400 K), while the upper layer was centered around 21 km (∼490 K). The lower plume dispersed poleward in the NH stratosphere along the isentropes and was within the DCOTSS measurement area (∼ 30–55∘ N, ∼ 8–21 km) during June, July, and August 2021. The lower plume was also gradually transported toward the Southern Hemisphere (SH) but at a relatively slower pace. The bulk of the upper plume did not display significant poleward transport but experienced dilution between April and September 2021. Routine balloon-borne measurements conducted over Boulder, Colorado (40∘ N, 105∘ W), in midlatitudes did not detect significant aerosol enhancement above 20 km throughout the year 2021 (Todt et al., 2023), indicating that the bulk of the upper plume did not reach the DCOTSS measurement area within NH midlatitudes.
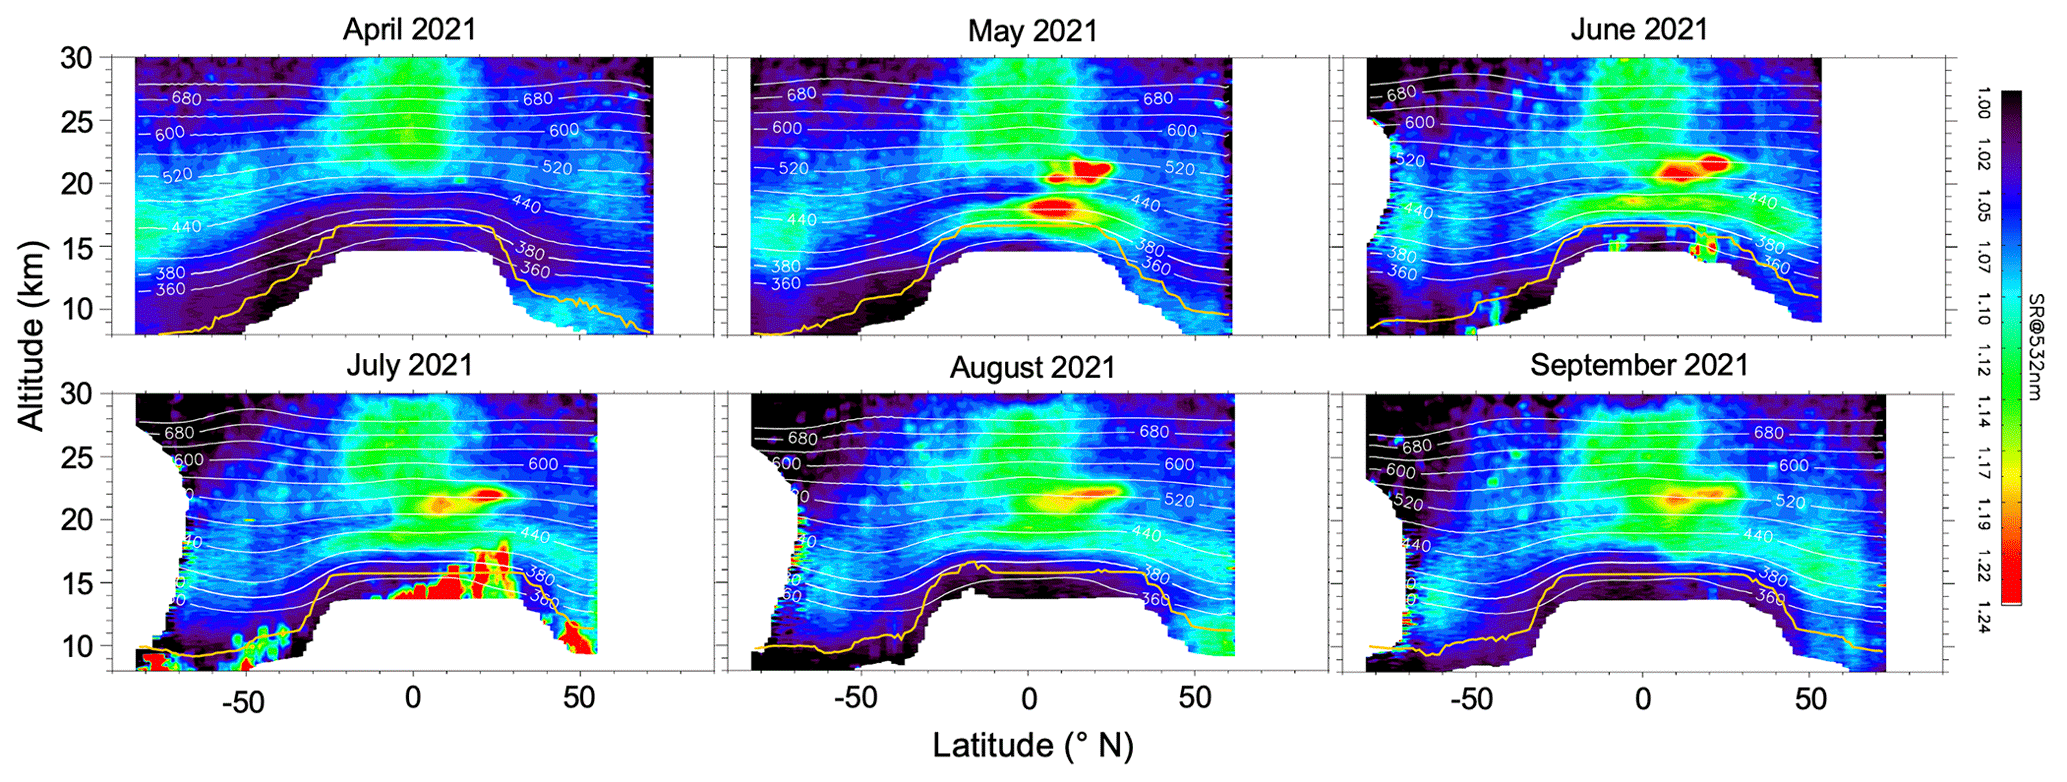
Figure 2Latitude and altitude distributions of scattering ratios (measured total backscatter divided by calculated molecular backscatter) at 532 nm from April to September 2021. Scatter ratio data are retrieved from CALIOP/CALIPSO observations and zonally averaged over the first 15 d of each month. Positive latitude values refer to the Northern Hemisphere, and negative values refer to the Southern Hemisphere. The white lines and numbers indicate the potential temperature levels. The yellow lines indicate the tropopause.
Intriguingly, however, DCOTSS balloon-borne POPC measurements launched over Salina, Kansas, detected a thin layer of aerosol enhancement for particles larger than 300 nm at 21.5 km on 23 August 2021 (Fig. 3a). Subsequent balloon flights in late August, equipped with both POPC and COBALD instruments, also revealed an enhancement at the same altitude, albeit with a reduced intensity (Fig. S1 in the Supplement). This suggests the possibility of a transient filament excursion originating from the tropical upper plume. Notably, Fig. 3a also displays a prominent enhancement below 20 km, attributed to the lower plume as observed by CALIOP observations.
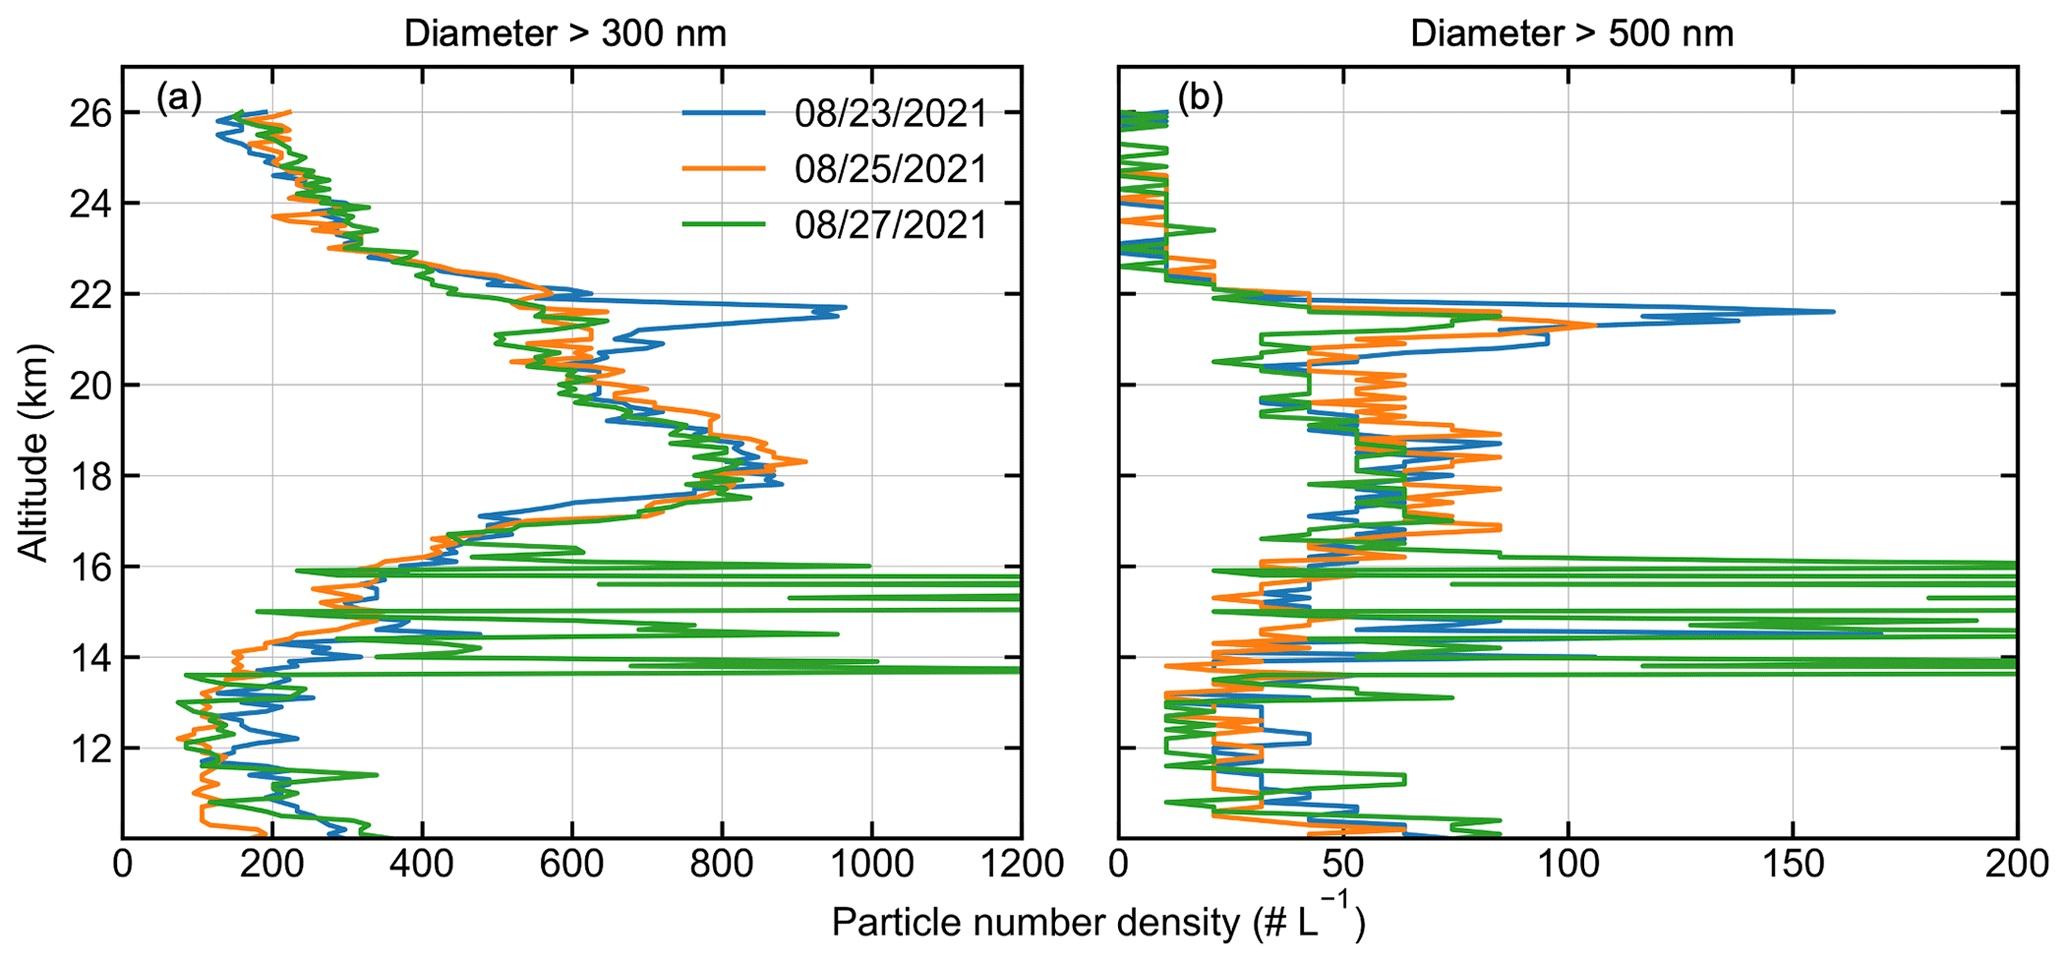
Figure 3Aerosol number density profiles from balloon-borne Particle Plus 8306 Optical Particle Counter (POPC) measurements for particles larger than 300 nm (a) and 500 nm (b) over Salina, Kansas.
Figure 3b shows that, for particles larger than 500 nm, the influence of the upper plume becomes notably more pronounced, indicating the particle size difference between the upper and lower plumes. The upper plume likely consists of larger particles due to an extended process time within the tropical reservoir, likely involving condensation growth. The variance in volcanic aerosol microphysical processes between the tropical reservoir and the midlatitude lower stratosphere, along with their consequent impact on changes in aerosol size, warrants further exploration.
Figure 4 shows the total aerosol surface area density (SAD) difference between injection and no-injection simulations performed by SOCOL-AERv2. Although Figs. 4 and 2 present different metrics (SAD vs. scattering ratio) for stratospheric aerosols, and Fig. 2 incorporates the background aerosols, while Fig. 4 does not, it is evident that there is a qualitative agreement between the modeled (Fig. 4) and observed (Fig. 2) altitude, meridional distribution, and temporal evolution of aerosol plumes. It is important to note, however, that our model simulations do not reproduce the upper aerosol plume observed by CALIOP between 20–22 km in the tropics (Fig. 2). This is because the IASI SO2 vertical profile we used to prescribe the eruption does not indicate two distinct SO2 plumes and suggests that 97 % of the plume is below 20 km. IASI retrievals are more sensitive to where a large amount of SO2 is and can potentially miss a smaller amount of SO2 at higher altitudes when significant amounts of SO2 are below it. By injecting 0.1 Tg of SO2 in one grid box at 42 hPa (∼22 km) in the model, we can reproduce an upper plume that, like in CALIOP observations, remains relatively stagnant between May and September (Fig. S4). The lack of a quantitative observational constraint led us to not consider the upper plume in our simulations presented here.
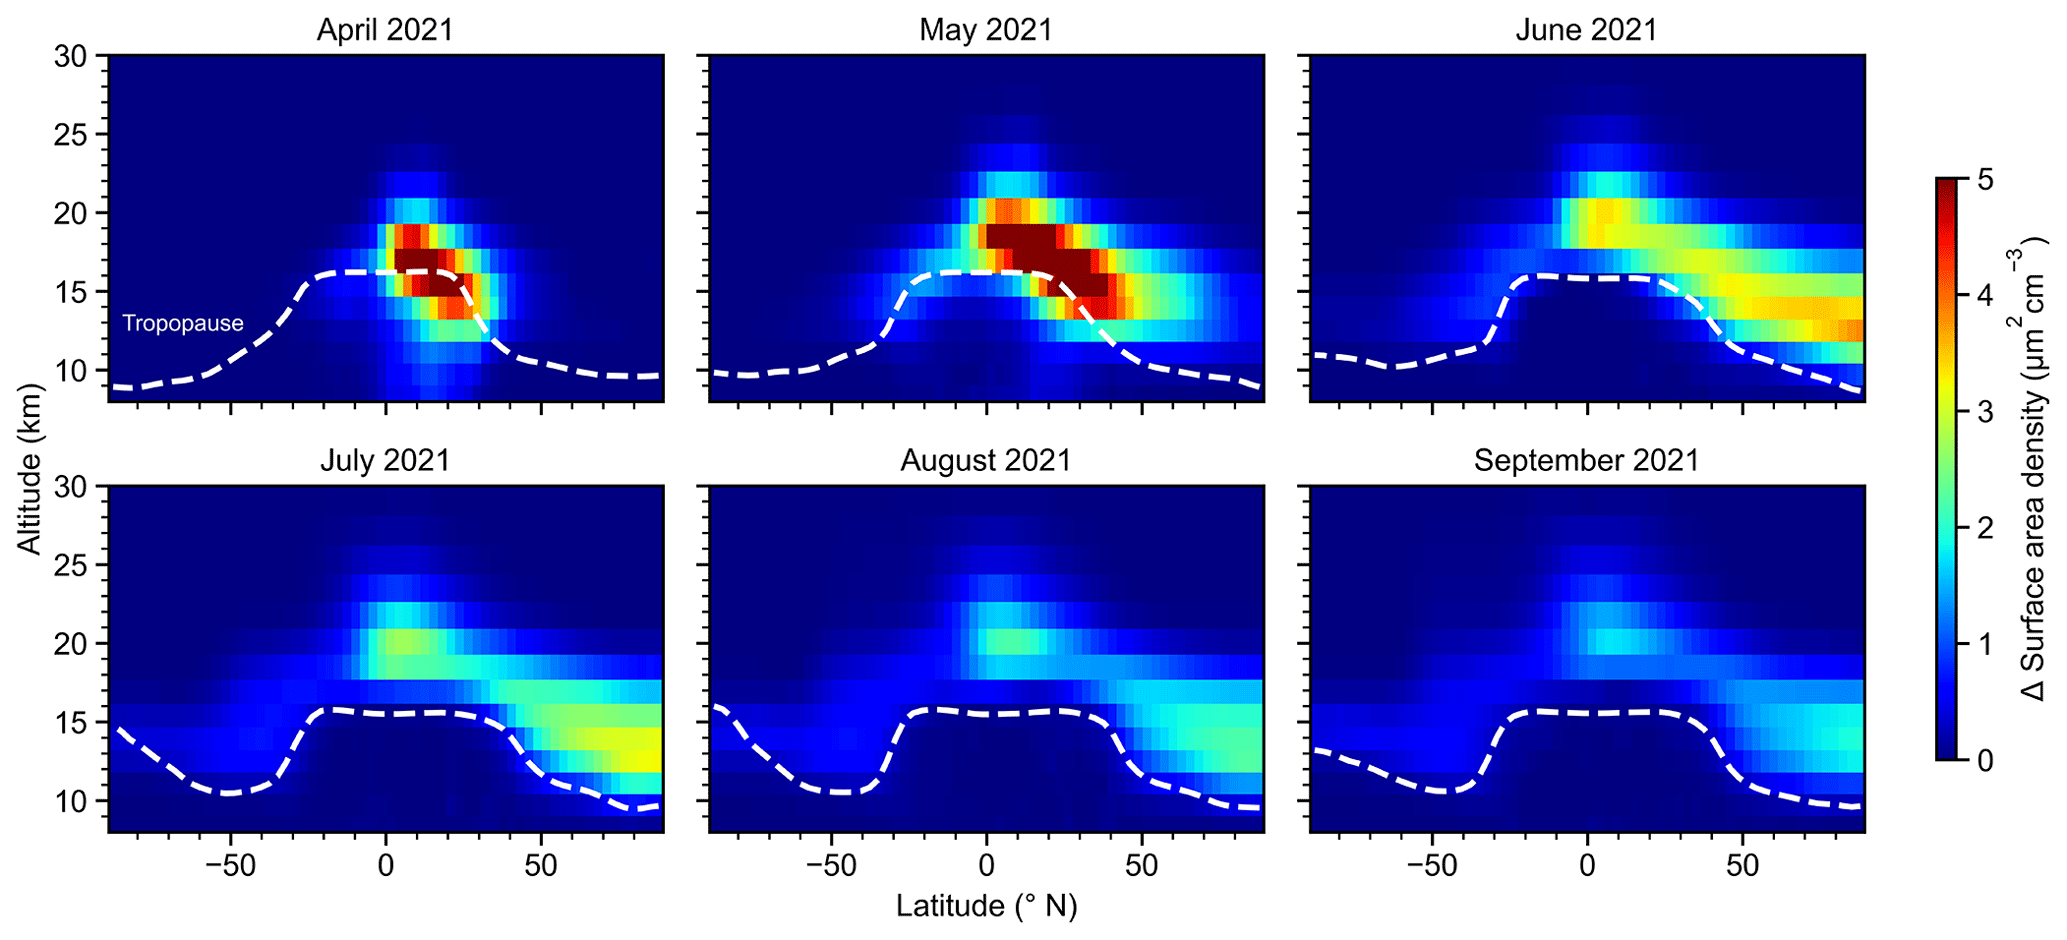
Figure 4Latitude and altitude distributions of aerosol surface area density (SAD) difference between injection and no-injection simulations performed by SOCOL-AERv2 from April to September 2021. Delta SAD was averaged zonally and monthly and used all aerosol size bins in the calculation. The dashed white lines indicate the WMO-defined tropopause.
3.2 Performance of model simulations
As discussed in Sect. 3.1, the modeled plume dispersion agrees qualitatively with CALIOP/CALIPSO observations, except for the localized upper plume in the tropical region. Considering that the vertical sensitivity of current satellite SO2 retrievals is around ±2 km in the lower stratosphere (Vernier et al., 2023), an additional model run with the IASI SO2 vertical profile shifted upward by 2 km was conducted, which resulted in marginal changes to the aerosol SAD profiles in the NH midlatitudes. This result, along with the lack of significant northern transport of the tropical upper plume to the DCOTSS sampling region within NH midlatitudes, indicates that the discrepancy between model and CALIOP observations does not hinder our comparison between model results and DCOTSS observations.
The SOCOL-AERv2 simulations of the La Soufrière eruption reproduced the volcanic perturbation with good agreement with DCOTSS observations of SAD enhancement vertical profiles in the lower stratosphere (Fig. 5c and d). However, the model failed to reproduce the background aerosol conditions in the volcanically quiescent stratosphere. The modeled no-injection SAD vertical profile is significantly elevated relative to DCOTSS 2022 observations (Fig. 5a and b). This discrepancy might arise from an overestimation of convective transport in the model, resulting in excessive transportation of aerosols and SO2 to the upper troposphere (Feinberg et al., 2019). The elevated background in the model complicates the direct comparison of model results to observations, particularly for the parameters where the volcanic perturbation cannot be isolated, such as size distribution and effective diameter. The DCOTSS summer 2022 data are taken as a suitable baseline reference in this study because (1) the data are comparable with the “unperturbed aerosol profile”, which represents the median of all profiles without discernible indications of recent volcanic or pyrogenic perturbation between March 2019 and March 2022, obtained from balloon-borne measurements conducted over Boulder, Colorado (Fig. 3 in Todt et al., 2023), and (2) SOCOL-AERv2 simulations indicate that aerosol concentration had declined close to no-injection values by June 2022 (see Figs. S2 and S3 in the Supplement).
3.3 Aerosol concentration and size distribution from aircraft measurements
DCOTSS aircraft measurements found that the aerosol SAD in NH midlatitudes during summer 2021 was significantly enhanced by a factor of 2–4 between 380–500 K relative to summer 2022 (Fig. 5), which was minimally influenced by volcanic activity. Figure S5 in the Supplement provides similar evidence of an enhancement in aerosol number concentration. Over Palmdale, California (35∘ N, 118∘ W), the SAD profile peaked at around 400 K, with the SAD values ranging from 2 to 3.5 µm2 cm−3 (Fig. 5a), while over Salina, Kansas (39∘ N, 98∘ W), the SAD profile double-peaked at around 420 and 450 K, with values ranging from 1.5 to 2.5 µm2 cm−3 (Fig. 5b). The observed differences in both the magnitude and shape of the DCOTSS SAD profiles above Palmdale and Salina in 2021 suggest the presence of spatial variations in volcanic aerosols in the stratosphere. Here we examine these variations in aerosol concentration and size distribution using detailed in situ aircraft measurements and aerosol–chemistry–climate model simulations.
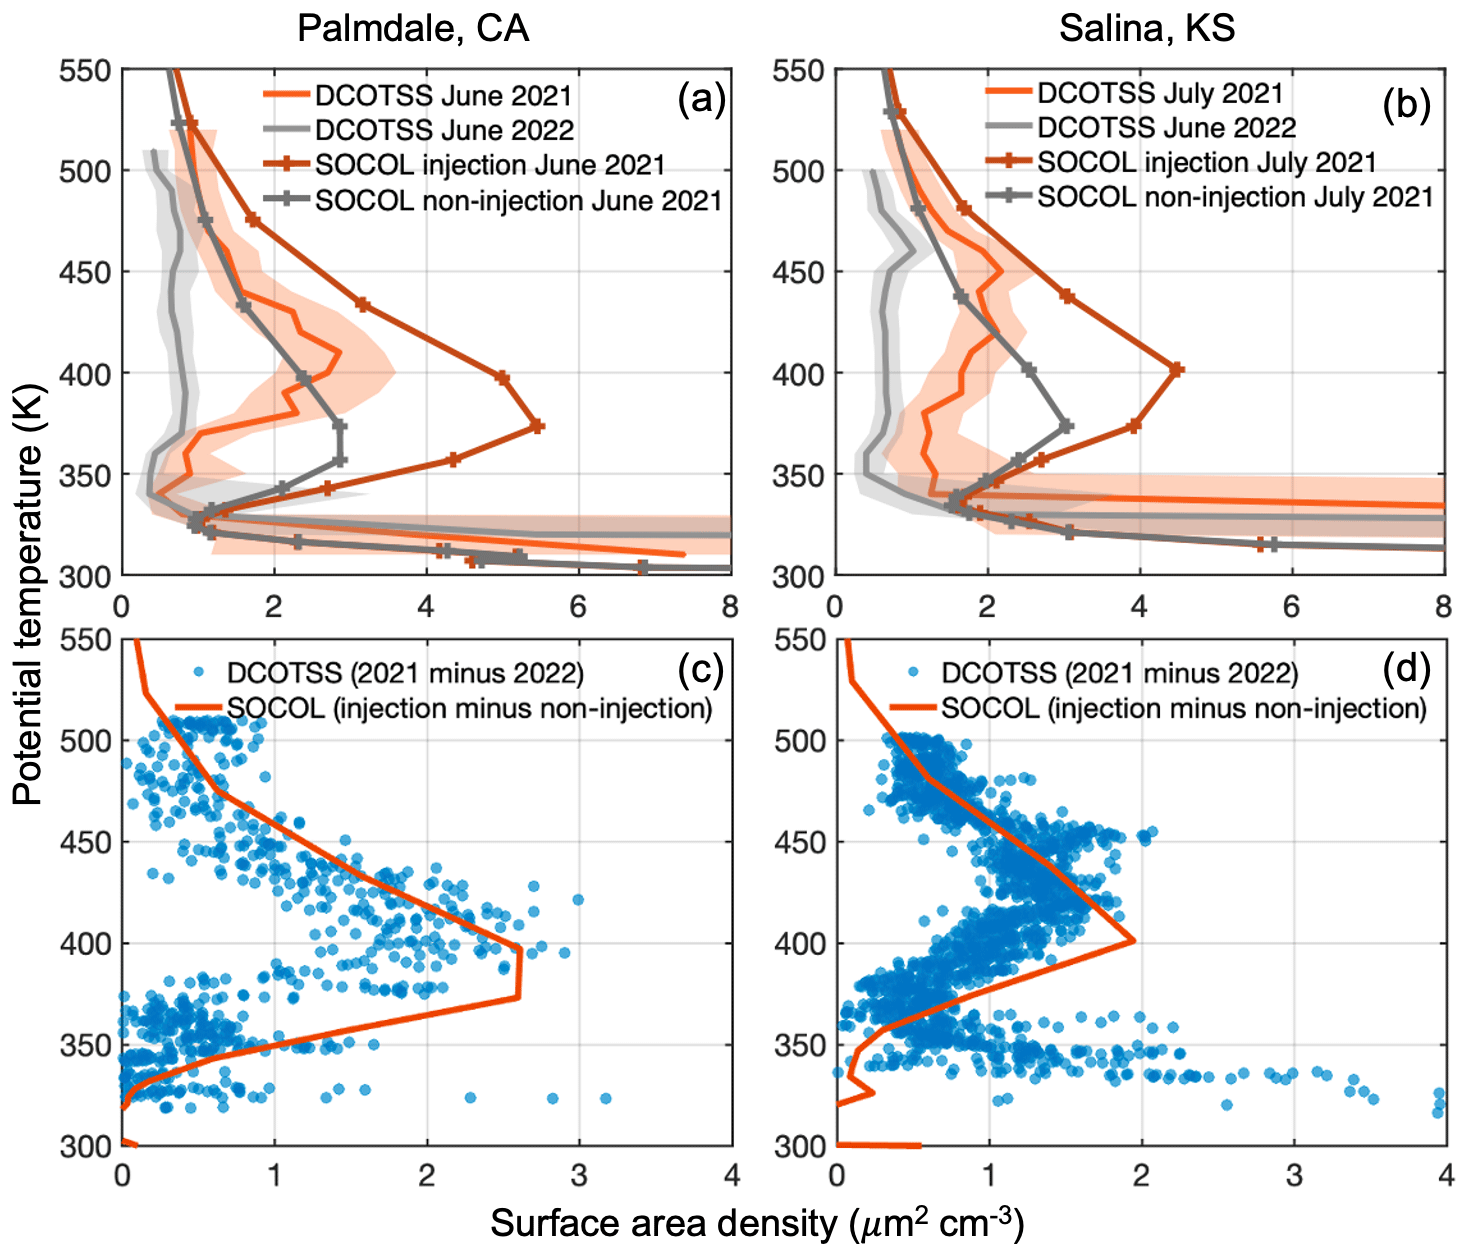
Figure 5Comparisons of aerosol surface area density (SAD) vertical profiles between SOCOL-AERv2 model simulations and DCOTSS aircraft measurements. Panels (a) and (c) present vertical profiles over Palmdale (averaged over 32–38∘ N, 115–121∘ W), while (b) and (d) present vertical profiles over Salina (averaged over 36–42∘ N, 95–101∘ W). The absolute SAD profiles are presented in panels (a) and (b), while the SAD enhancement profiles are presented in (c) and (d). Shaded areas in panels (a) and (b) correspond the 10th and 90th percentiles of DCOTSS aircraft measurements.
Figure 6 presents the meridional variations in the particle number density profiles and effective diameter profiles, along with the corresponding size distribution at the peak of each profile. The effective diameter describes the area-weighted mean diameter of the aerosol size distribution (Grainger, 2022). This parameter provides a simplified representation of the aerosol size distribution and is particularly relevant for characterizing aerosol–light interactions and heterogeneous chemistry.
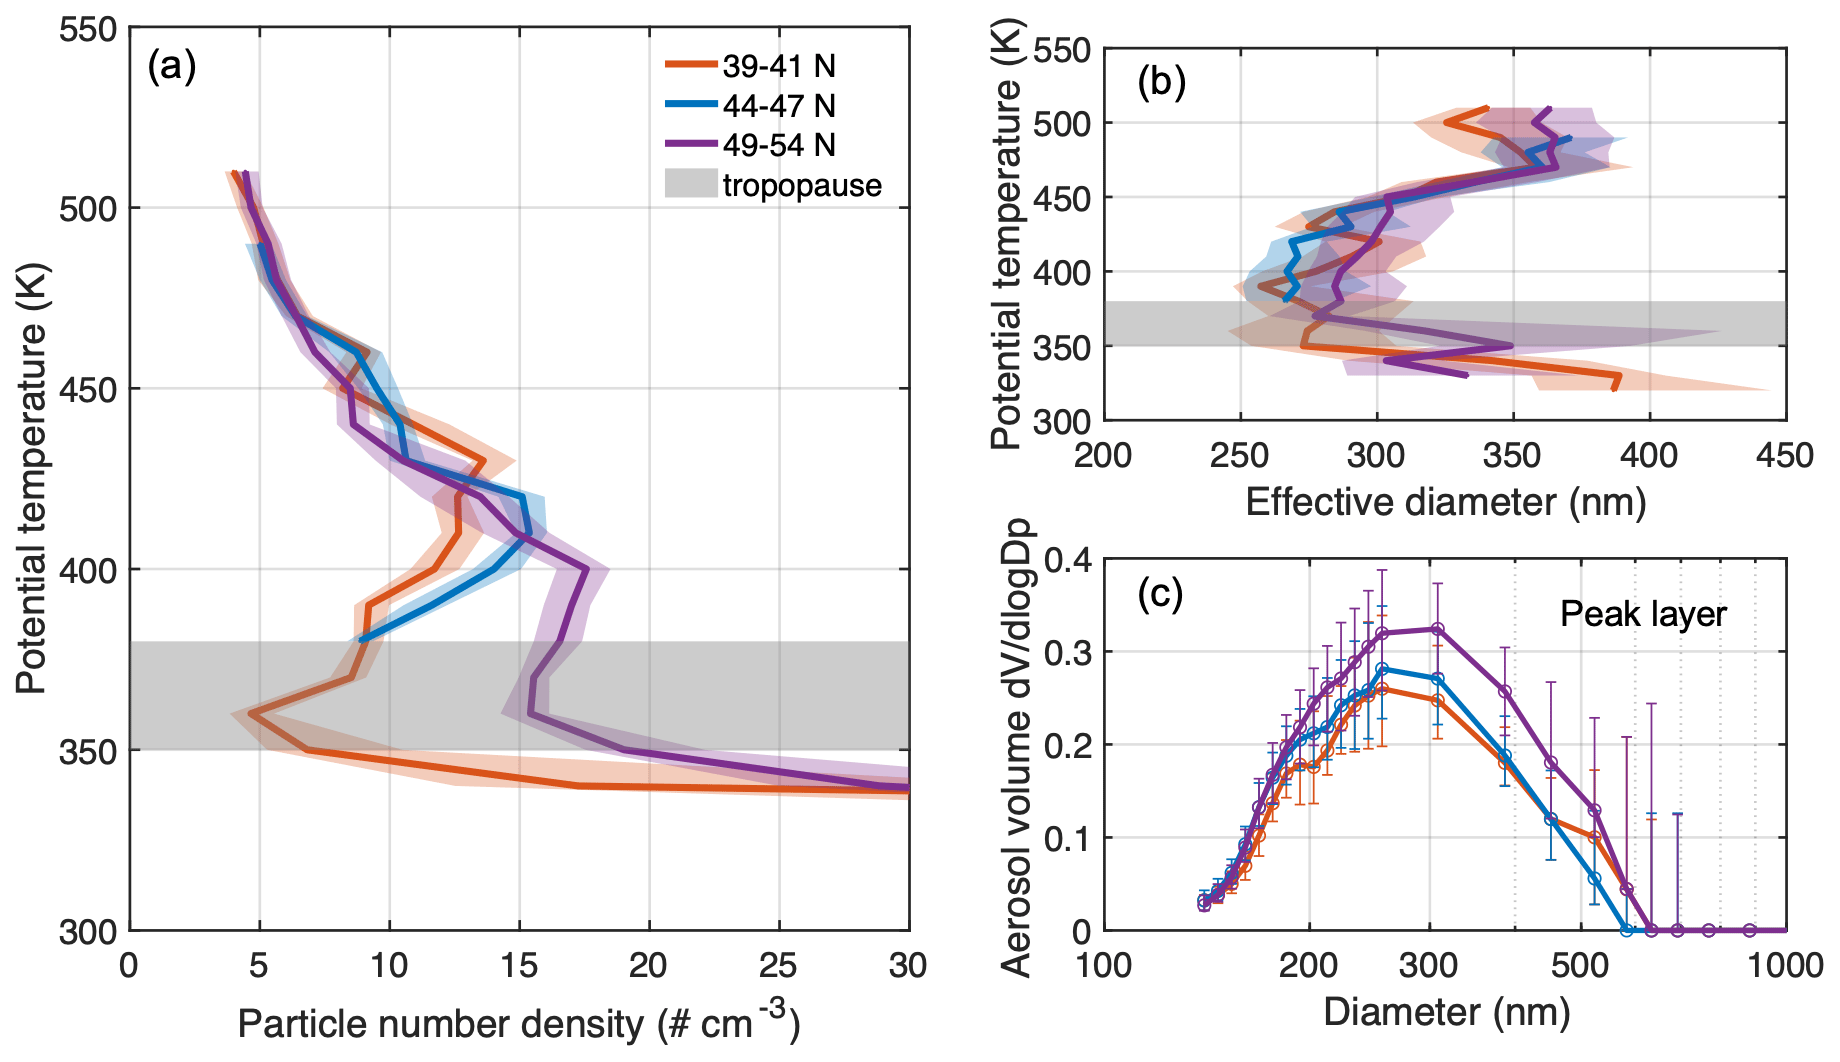
Figure 6Meridional variations of (a) aerosol number density profiles, (b) effective diameter profiles, and (c) aerosol volume density size distributions at the peak of each profile between 39 and 54∘ N. All the data were collected during a single ER-2 flight on 16 July 2021, covering the region between 90 and 100∘ W. Panel (c) presents aerosol size distribution at the peak of each profile shown in panel (a). All lines represent the median values. Shaded areas in panels (a) and (b) and error bars in (c) represent the 25th and 75th percentiles.
Greater peak number densities were observed at high latitudes (Fig. 6a). This aligns well with the transport of volcanic plumes shown in Figs. 2 and 4, which indicate the bulk of the plume was already transported to high latitudes in July. The plume peak appears to decrease in potential temperature with northern transport, which is likely the result of the combination of poleward isentropic transport, which maintains a consistent potential temperature, and the downwelling Brewer–Dobson circulation in midlatitudes to high latitudes, responsible for descending the plume (Bönisch et al., 2011). The SOCOL-AERv2 simulations reproduced the influence of these large-scale air movements on the meridional variations of the particle number density profile (Fig. S6a in the Supplement). Unlike the number density profiles, the effective diameter profiles and aerosol size distributions between 39 and 54∘ N did not exhibit significant meridional variations (Fig. 6b and c). Modeling results of the effective diameter profiles and volume size distributions also support these findings (Fig. S6b and c in the Supplement), though our model was unable to accurately reproduce the shape and magnitude of the observed effective diameter profile.
Similar to Fig. 6, Fig. 7 illustrates the zonal variations of particle number density profile, effective diameter profile, and the corresponding size distribution between 430 and 450 K potential temperature. In Fig. 7a, distinct shapes of the number density profile were observed between 85 and 110∘ W, which were not replicated by the model simulation (see Fig. S7a in the Supplement). This variation is likely due to dynamical variability associated with synoptic waves and wave breaking that is challenging to capture in the model (Charlton-Perez et al., 2013; Jing et al., 2020). Effective diameter profiles and aerosol size distributions between 85 and 110∘ W exhibit minimal zonal variations, as depicted in Fig. 7b and c. The modeled effective diameter and aerosol size distribution also exhibited minimal zonal variations (Fig. S7b and c in the Supplement).
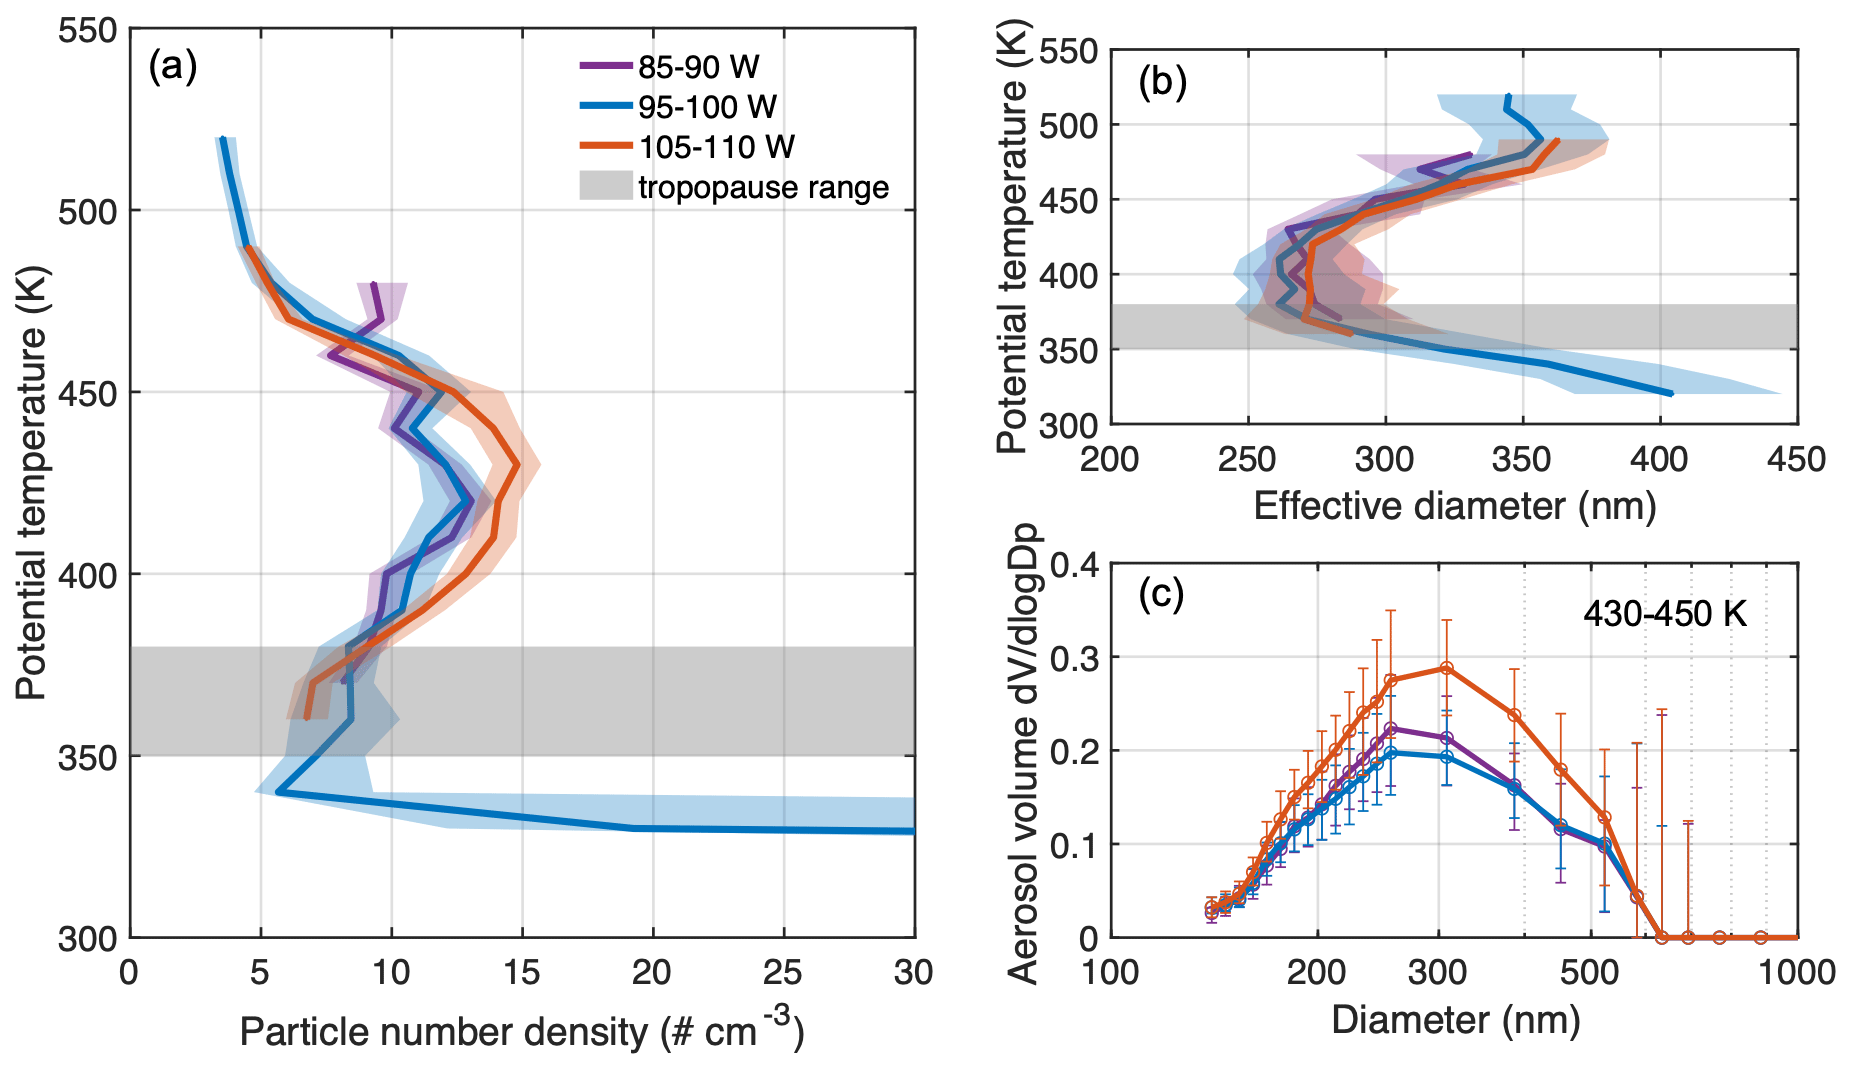
Figure 7Zonal variations of (a) aerosol number density profiles, (b) effective diameter profiles, and (c) aerosol volume density size distributions between 85 and 110∘ W. All data were taken from 4 ER-2 flights between 20–29 July 2021 between 35 and 40∘ N. Panel (c) presents aerosol size distributions between 430 and 450 K potential temperature range, where the most pronounced zonal variations in particle number density manifest. All lines represent median values. Shaded areas in panels (a) and (b) and error bars in (c) represent the 25th and 75th percentiles.
Figures 6 and 7 collectively suggest that, at a given time and potential temperature level, there are minimal meridional and zonal variations in aerosol size within the stratospheric volcanic plumes; however, the aerosol effective diameter shows significant variability with altitude. Conversely, aerosol number concentration profiles within the volcanic plumes exhibit substantial meridional variations and, to a somewhat lesser extent, zonal variations. These variations are primarily influenced by large-scale circulations and synoptic variability. For a broader perspective, the modeled global depiction of spatial variations in volcanic aerosol concentration and their temporal evolutions is available in Fig. S3 in the Supplement.
There is evidence that the La Soufrière eruption resulted in a smaller aerosol effective diameter in the midlatitude lower stratosphere. The effective diameter between the tropopause and 460 K over Salina (39∘ N, 98∘ W) exhibited smaller values in 2021 compared to 2022 (Fig. 8a). Figure 8b further implies that the La Soufrière volcanic plumes contained a notably higher proportion of small particles (<400 nm) than the baseline conditions observed in 2022, thereby contributing to the diminished aerosol effective diameter over Salina in 2021. This finding is supported by routine balloon-borne measurements conducted over Boulder, Colorado (40∘ N, 105∘ W), which show a consistent trend upon comparing data from the summers of 2021 and 2020, as well as the spring of 2019 before the Raikoke eruption (see Fig. S8 in the Supplement). The reduction in stratospheric aerosol size following the 2021 La Soufrière eruption is also indicated by SAGE III/ISS satellite retrievals (Wrana et al., 2023).
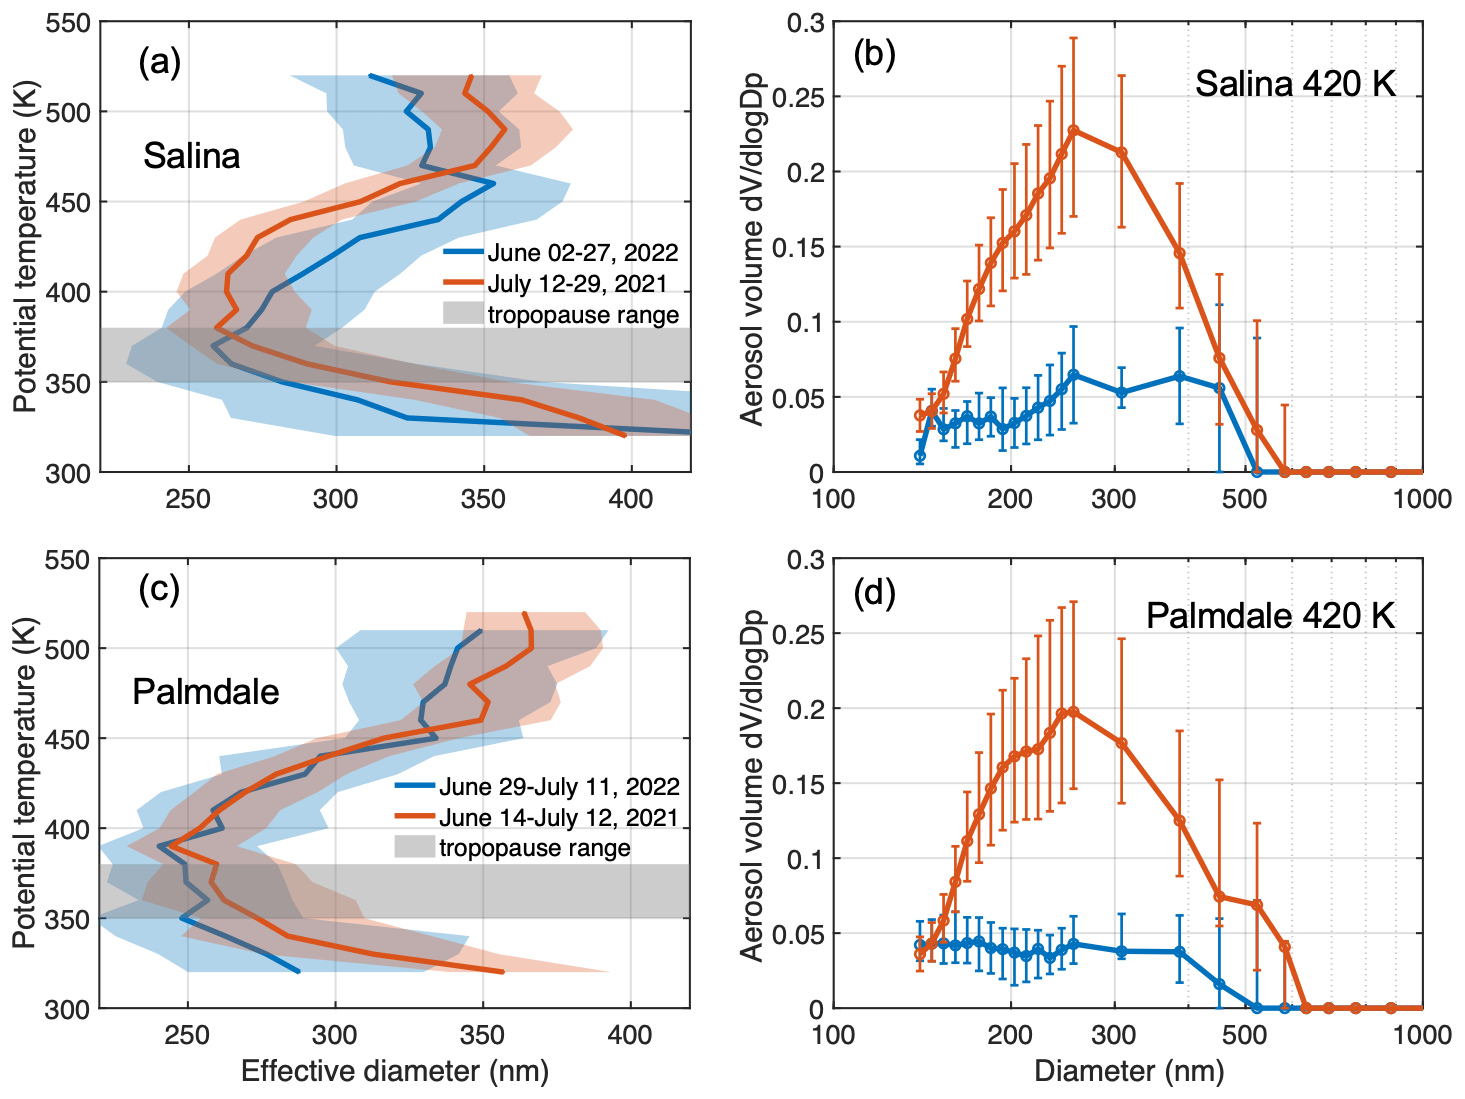
Figure 8Aerosol effective diameter and volume density size distributions over Salina (averaged over 36–42∘ N, 95–101∘ W) and Palmdale (averaged over 32–38∘ N, 115–121∘ W) in 2021 and 2022 from DCOTSS aircraft measurements. Shaded areas and error bars represent the 25th and 75th percentiles.
Volcanic eruptions have generally been considered to lead to an increase in aerosol size, as was clearly the case following massive events like the 1991 Pinatubo eruption (Quaglia et al., 2023). However, the present results show that this is not necessarily the case for all eruptions, especially for relatively smaller ones like the 2021 La Soufrière eruption, which are more frequent. The La Soufrière eruption led to an increase in the number concentration of small particles (<400 nm). The emergence of a notable quantity of small particles is likely related to the latitude and altitude of the SO2 injection, which in turn influences the aerosol microphysical processes that regulate the aerosol size. For particles ranging from 100 and 600 nm, smaller particles are much less efficient in scattering solar radiation (Murphy et al., 2021), resulting in a relatively minor radiative impact of the 2021 La Soufrière eruption, as shown in Sect. 3.4.
On the other hand, the effective diameter profile over Palmdale (35∘ N, 118∘ W) shows no noticeable difference between 2021 and 2022 (Fig. 8c). It is worth noting that both the effective diameter profiles (2021 data in Fig. 8a and c) and volume size distributions (2021 data in Fig. 8b and d) within the volcanic plumes exhibit similarities between Salina and Palmdale. Consequently, the minimal variance in effective diameter observed over Palmdale between 2021 and 2022 can be attributed to the relatively smaller effective diameters already present in that region during the sampling period in 2022. The relatively short DCOTSS measurement period (29 June–11 July) over Palmdale in 2022 might not sufficiently represent the averaged baseline condition.
3.4 Ozone and radiative impacts
As depicted in Figs. 2 and 4 and in Fig. S3 in the Supplement, aerosol enhancements resulting from the La Soufrière eruption were predominantly concentrated in the NH, although aerosol plumes were also transported to the SH. Figure 9 shows the simulated column ozone loss induced by the La Soufrière eruption. While the signal was more pronounced in the NH than in the SH, the overall magnitude of ozone loss was relatively minor. The La Soufrière eruption has been suggested to have potentially contributed to the exceptionally large Antarctic ozone hole in 2021 (Yook et al., 2022). However, our model simulations show minor Arctic and Antarctic ozone loss, with ozone column depletion peaking at about 0.6 % in 2021 (Fig. 9), which is well within the natural variability. An important caveat is that both the injection and no-injection simulations are nudged toward ERA5 reanalysis, which, to some degree, includes the dynamical response to the eruption. Thus, in our perturbation calculations (injection minus no-injection), the dynamical response captured by ERA5 reanalysis is partially subtracted out. As a result, the modeled ozone response is primarily due to heterogeneous chemistry. Additionally, the modeled ozone loss can be influenced by the specific SO2 vertical profile used to prescribe the SOCOL-AERv2 model. Given that our model simulations do not reproduce the upper aerosol plume observed by CALIOP/CALIPSO, the actual ozone response may differ from our projected outcomes. However, in the simulation with the IASI SO2 vertical profile shifted higher by 2 km, the Antarctic ozone depletion is lower in 2021 (peak is ∼0.3 %) and higher in 2022 (peak is ∼1.5 %) (Fig. S9a in the Supplement). Additionally, the simulation with 0.1 Tg of SO2 injected at 22 km, which reproduces the upper plume, only exhibits Antarctic ozone depletion in 2022 (peak is ∼1 %) (Fig. S9b in the Supplement). Although the two sensitivity simulations yield different ozone column depletion compared to Fig. 9, the values from all simulations remain minimal and within the range of natural variability. Thus, we do not expect the La Soufrière eruption to have contributed significantly to ozone loss in 2021. It is possible the 2019–2020 Australian wildfires, which caused a large ozone hole in 2020 (Rieger et al., 2021; Salawitch and Mcbride, 2022; Mcneill and Thornton, 2023; Solomon et al., 2023), also contributed to the similarly large Antarctic ozone hole of 2021 (https://ozonewatch.gsfc.nasa.gov/statistics/annual_data.html, last access: 28 February 2023). The potentially long-lasting ozone loss caused by the Australian wildfires warrants further investigation.
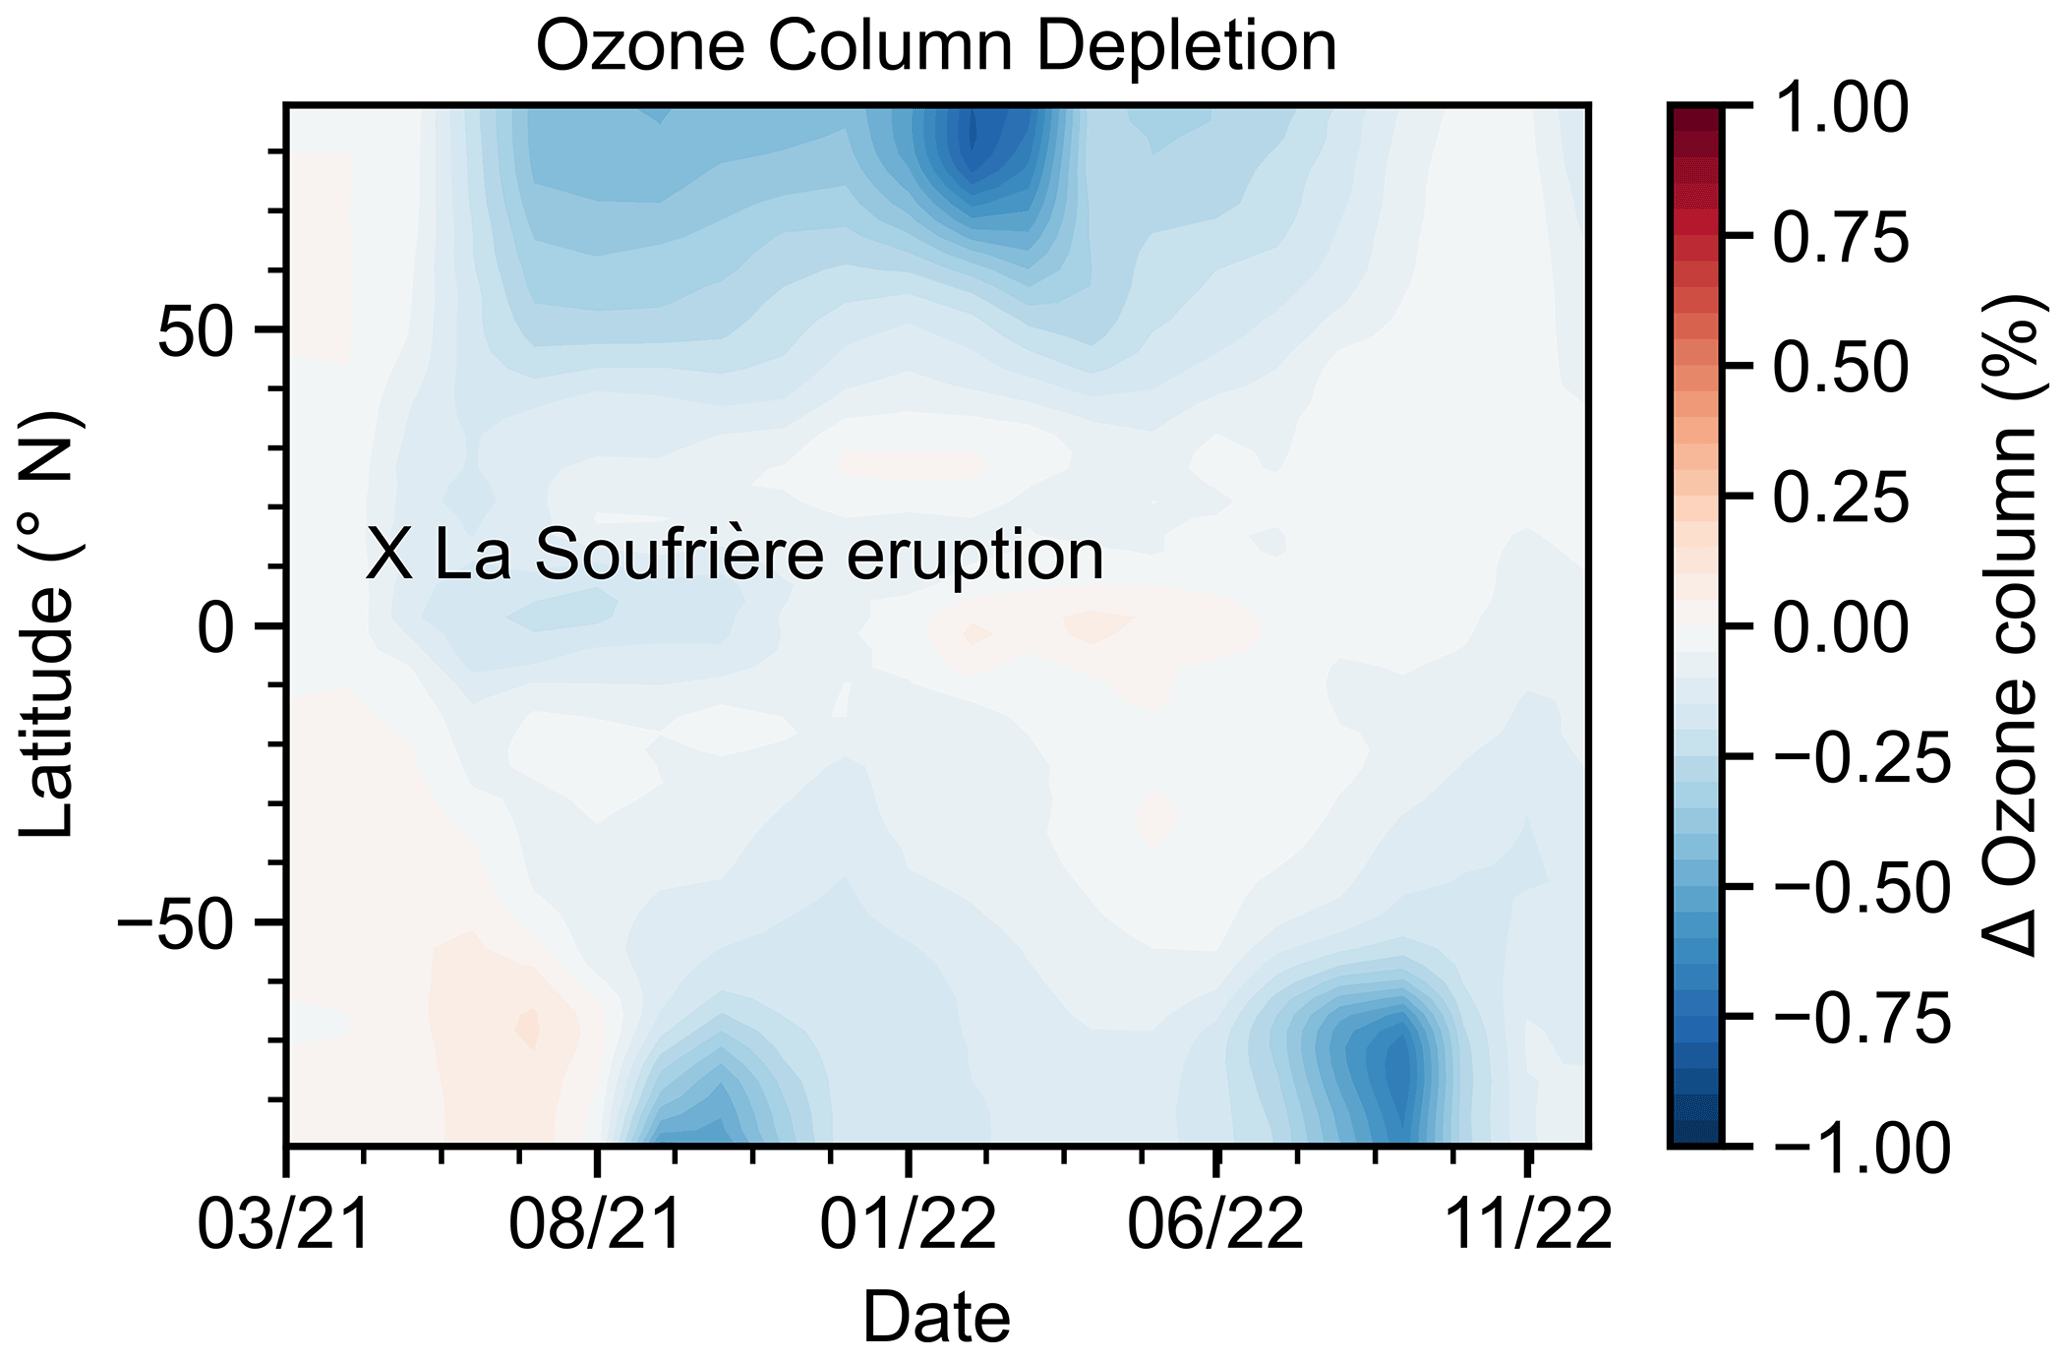
Figure 9Zonal-averaged ozone column change following the La Soufrière eruption based on SOCOL-AERv2 simulations. Ozone column change is shown as the percent difference between the SO2 injection simulation and the no-injection simulation.
Radiative forcing is calculated as the difference between the net top-of-atmosphere radiative fluxes from the injection and no-injection model simulations. It is important to note that, as discussed in the previous paragraph, the modeled dynamical response to the eruption is suppressed due to nudging to ERA5 reanalysis in both the injection and no-injection simulations. The modeled top-of-atmosphere 1-year average global total radiative forcing was −0.08 W m−2 clear-sky and −0.04 W m−2 all-sky (Table 2). Table 2 also shows values of shortwave and longwave forcing, separately. The shortwave forcing from La Soufrière eruption is in the same range (no more than −0.05 W m−2 all-sky) as the estimation for the 2019 Ulawun eruptions, which yielded a similar total SO2 loading (∼0.35 Tg). This shortwave forcing, however, is roughly one-third of that (−0.1 to −0.2 W m−2 all-sky) estimated for the 2019 Raikoke eruption, which had a significantly larger total SO2 loading (∼1.35 Tg) (Kloss et al., 2021). Additionally, the 1-year mean all-sky forcing from the La Soufrière eruption represents about one-third of the −0.12 W m−2 global multiannual mean volcanic forcing during the 2005–2015 period, marked by a series of small-to-moderate-magnitude explosive eruptions (Schmidt et al., 2018).
Table 2Modeled radiative forcing from the La Soufrière eruption. The values are top-of-atmosphere 1-year area-weighted global averages. Note that due to rounding errors, the sum of shortwave and longwave values may not precisely align with the total values.
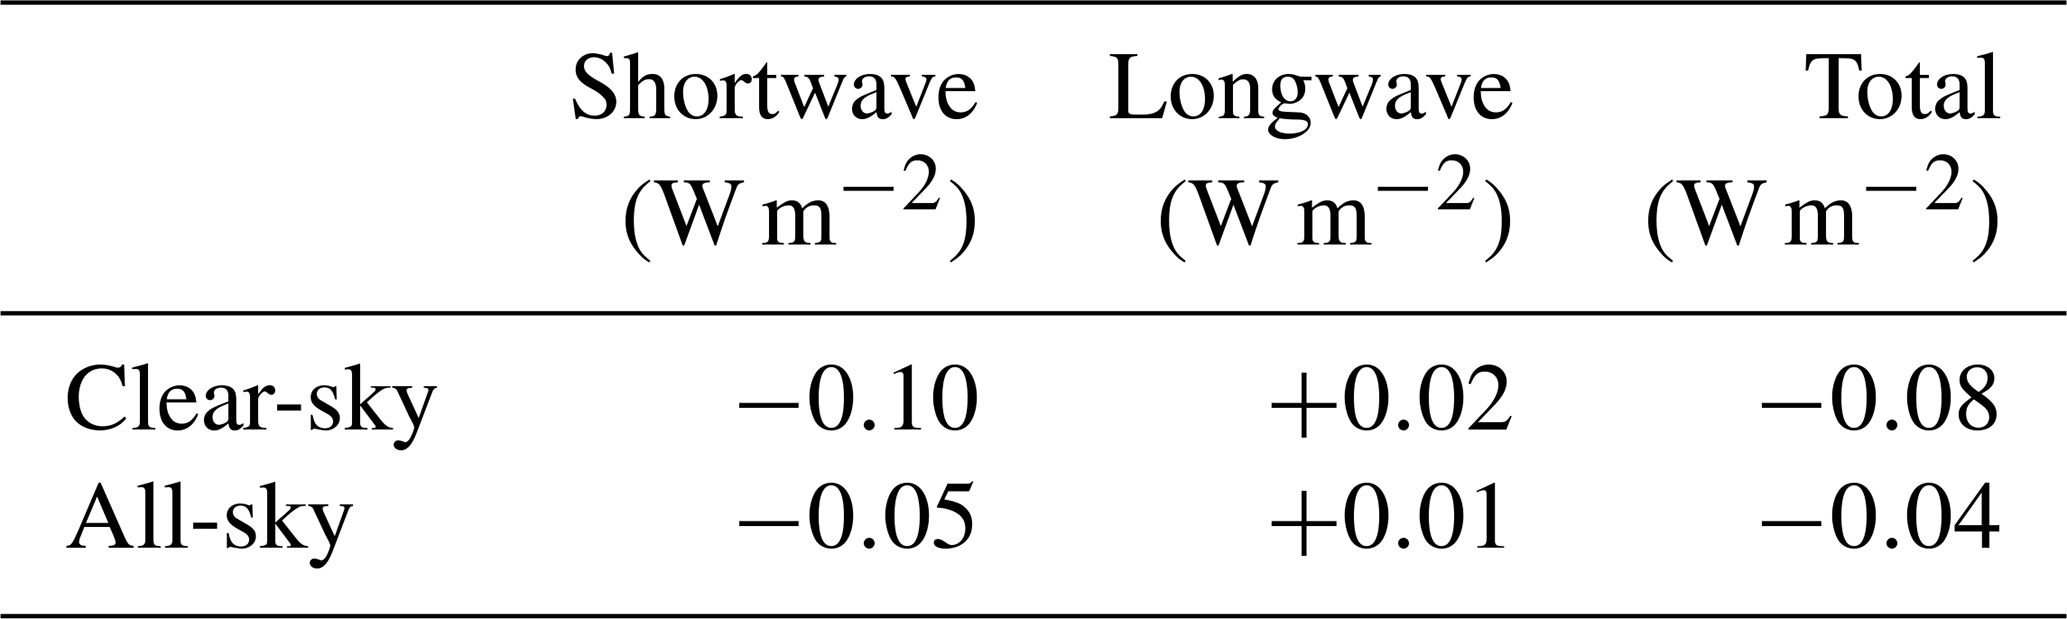
The clear-sky total radiative forcing was largest in June 2021 with a 1-month average of −0.15 W m−2 (see Fig. S10 in the Supplement). The radiative effects were concentrated in the tropics and NH midlatitudes (0–70∘ N 1-year average: −0.12 W m−2 clear-sky and −0.07 W m−2 all-sky) as the aerosol plume was transported minimally to the SH (see Fig. S3 in the Supplement for the global dispersion of the aerosol plume). The radiative effects diminished to near-baseline levels (less than −0.03 W m−2 clear-sky) after 1 year.
The eruption of La Soufrière in April 2021 resulted in two distinct enhanced aerosol layers in the tropical lower stratosphere. These layers emerged approximately 3–4 weeks after the eruption, specifically around 18 km (∼400 K) and 21 km (∼490 K), as observed through CALIOP/CALIPSO measurements. The SOCOL-AERv2 aerosol–chemistry–climate model reproduced the distribution and transport of the lower volcanic plume to higher latitudes in the NH, which was sampled extensively during the DCOTSS 2021 mission with the NASA ER-2 aircraft. DCOTSS measurements showed that aerosol SAD and number density in NH midlatitudes in the summer of 2021 were enhanced by a factor of 2–4 between 380–500 K potential temperature, relative to the minimally perturbed stratosphere at NH midlatitudes in the summer of 2022. Modeled aerosol enhancements in SAD and number density were consistent with the DCOTSS aircraft measurements. Although the tropical upper plume exhibited restricted poleward transport, it potentially influenced midlatitudes transiently, as indicated by DCOTSS balloon-borne measurements showcasing a transient aerosol layer around 21.5 km in late August 2021. These measurements implied that particles within the upper plume were larger than those present in the lower plume, likely due to an extended process time within the tropical reservoir.
This study examines the spatial variations in aerosol number concentration and size distribution of volcanic plumes using in situ aircraft measurements and model simulations. Both the aircraft measurements and model simulations revealed significant meridional variations in particle number density profiles in NH midlatitudes. These variations were attributed to the large-scale movement of the volcanic plumes, resulting from a combination of poleward isentropic transport and downwelling Brewer–Dobson circulation in the midlatitudes. Aircraft measurements also show zonal variations of particle number density profile which were not replicated by the model, which may be the result of synoptic variability that is challenging to capture in global climate models. Notably, no significant meridional or zonal variations in the mode or shape of the size distribution were observed within the studied latitudes (39–54∘ N) and longitudes (89–110∘ W). The La Soufrière eruption resulted in a shift toward small particles during the summer of 2021, relative to the summer of 2022. However, no significant change in effective diameter was observed over Palmdale, possibly due to the values in that region that were already smaller during the limited sampling period in 2022. In situ aerosol concentration and size distribution measurements during the DCOTSS mission conducted 2–4 months after the eruption will be valuable for validating satellite retrievals and model simulations of stratospheric aerosols following small–moderate volcanic eruptions.
Our results suggest that the modeled ozone loss due to the 2021 La Soufrière eruption was minor, with a peak ozone column depletion of about 0.6 % in both Arctic and Antarctic regions. This change falls within the natural variability and is unlikely to have contributed significantly to the exceptionally large Antarctic ozone hole in 2021. The eruption's radiative impact was modeled to be −0.08 W m−2 clear-sky and −0.04 W m−2 all-sky. This all-sky forcing represents about one-third of the global multiannual mean volcanic forcing during the 2005–2015 moderate volcanic period. The radiative effects were concentrated in the tropics and NH midlatitudes and diminished to near-baseline levels after 1 year.
All aircraft and balloon-borne measurement data from the DCOTSS mission are publicly available at the NASA Atmospheric Science Data Center at https://doi.org/10.5067/ASDC/DCOTSS-Aircraft-Data_1 (NASA/LARC/SD/ASDC, 2022). CALIOP/CALIPSO satellite data are publicly available at https://doi.org/10.5067/CALIOP/CALIPSO/CAL_LID_L1-Standard-V4-11 (NASA/LARC/SD/ASDC, 2016). Modeling data will be made available upon request.
The supplement related to this article is available online at: https://doi.org/10.5194/acp-23-15351-2023-supplement.
YL, JD, JPV, AKP, TPB, and JDD collected and analyzed the in situ measurement data. CP performed the SOCOL-AERv2 model simulations with guidance from SV and AS. JPV analyzed the CALIOP/CALIPSO satellite data. YL and CP wrote the manuscript with inputs from all the authors. FNK provided project guidance. All authors discussed, edited, and proofread the manuscript.
At least one of the (co-)authors is a member of the editorial board of Atmospheric Chemistry and Physics. The peer-review process was guided by an independent editor, and the authors also have no other competing interests to declare.
Publisher’s note: Copernicus Publications remains neutral with regard to jurisdictional claims made in the text, published maps, institutional affiliations, or any other geographical representation in this paper. While Copernicus Publications makes every effort to include appropriate place names, the final responsibility lies with the authors.
This work was supported by the National Aeronautics and Space Administration under grant 80NSSC19K0326. The authors thank Gabriel Chiodo, Timofei Sukhodolov, and Thomas Peter from ETH Zürich for useful discussions on SOCOL-AERv2 simulations; Isabelle A. Taylor from the University of Oxford for providing IASI/MetOp SO2 data; and Emrys Hall from NOAA CSL for helpful discussions. The authors also acknowledge the whole DCOTSS team.
This research has been supported by the National Aeronautics and Space Administration (grant no. 80NSSC19K0326).
This paper was edited by Jianzhong Ma and reviewed by Daniele Visioni, J. M. Haywood, and one anonymous referee.
Andersson, S. M., Martinsson, B. G., Vernier, J.-P., Friberg, J., Brenninkmeijer, C. A., Hermann, M., Van Velthoven, P. F., and Zahn, A.: Significant radiative impact of volcanic aerosol in the lowermost stratosphere, Nat. Commun., 6, 7692, 2015.
Bönisch, H., Engel, A., Birner, Th., Hoor, P., Tarasick, D. W., and Ray, E. A.: On the structural changes in the Brewer-Dobson circulation after 2000, Atmos. Chem. Phys., 11, 3937–3948, https://doi.org/10.5194/acp-11-3937-2011, 2011.
Bruckert, J., Hirsch, L., Horváth, Á., Kahn, R., Kölling, T., Muser, L., Timmreck, C., Vogel, H., Wallis, S., and Hoshyaripour, G.: Dispersion and aging of volcanic aerosols after the La Soufrière eruption in April 2021, J. Geophys. Res.-Atmos., e2022JD037694, https://doi.org/10.1029/2022JD037694, 2023.
Carboni, E., Grainger, R., Walker, J., Dudhia, A., and Siddans, R.: A new scheme for sulphur dioxide retrieval from IASI measurements: application to the Eyjafjallajökull eruption of April and May 2010, Atmos. Chem. Phys., 12, 11417–11434, https://doi.org/10.5194/acp-12-11417-2012, 2012.
Charlton-Perez, A. J., Baldwin, M. P., Birner, T., Black, R. X., Butler, A. H., Calvo, N., Davis, N. A., Gerber, E. P., Gillett, N., Hardiman, S., Kim, J., Krüger, K., Lee, Y.-Y., Manzini, E., McDaniel, B. A., Polvani, L., Reichler, T., Shaw, T. A., Sigmond, M., Son, S.-W., Toohey, M., Wilcox, L., Yoden, S., Christiansen, B., Lott, F., Shindell, D., Yukimoto, S., and Watanabe, S.: On the lack of stratospheric dynamical variability in low-top versions of the CMIP5 models, J. Geophys. Res.-Atmos., 118, 2494–2505, https://doi.org/10.1002/jgrd.50125, 2013.
Deshler, T.: A review of global stratospheric aerosol: Measurements, importance, life cycle, and local stratospheric aerosol, Atmos. Res., 90, 223–232, 2008.
Deshler, T., Johnson, B. J., and Rozier, W. R.: Balloonborne measurements of Pinatubo aerosol during 1991 and 1992 at 41∘ N: Vertical profiles, size distribution, and volatility, Geophys. Res. Lett., 20, 1435–1438, 1993.
Fahey, D., Kawa, S., Woodbridge, E., Tin, P., Wilson, J., Jonsson, H., Dye, J., Baumgardner, D., Borrmann, S., and Toohey, D.: In situ measurements constraining the role of sulphate aerosols in mid-latitude ozone depletion, Nature, 363, 509–514, 1993.
Feinberg, A., Sukhodolov, T., Luo, B.-P., Rozanov, E., Winkel, L. H. E., Peter, T., and Stenke, A.: Improved tropospheric and stratospheric sulfur cycle in the aerosol–chemistry–climate model SOCOL-AERv2, Geosci. Model Dev., 12, 3863–3887, https://doi.org/10.5194/gmd-12-3863-2019, 2019.
Friberg, J., Martinsson, B. G., Andersson, S. M., and Sandvik, O. S.: Volcanic impact on the climate – the stratospheric aerosol load in the period 2006–2015, Atmos. Chem. Phys., 18, 11149–11169, https://doi.org/10.5194/acp-18-11149-2018, 2018.
Gao, R., Telg, H., McLaughlin, R., Ciciora, S., Watts, L., Richardson, M., Schwarz, J., Perring, A., Thornberry, T., and Rollins, A.: A light-weight, high-sensitivity particle spectrometer for PM2.5 aerosol measurements, Aerosol Sci. Tech., 50, 88–99, 2016.
Grainger, R.: Some Useful Formulae for Particle Size Distributions and Optical Properties, https://eodg.atm.ox.ac.uk/user/grainger/research/aerosols.pdf (last access: 6 December 2023), 2022.
Hersbach, H., Bell, B., Berrisford, P., Hirahara, S., Horányi, A., Muñoz-Sabater, J., Nicolas, J., Peubey, C., Radu, R., and Schepers, D.: The ERA5 global reanalysis, Q. J. Roy. Meteor. Soc., 146, 1999–2049, 2020.
Horváth, Á., Carr, J. L., Wu, D. L., Bruckert, J., Hoshyaripour, G. A., and Buehler, S. A.: Measurement report: Plume heights of the April 2021 La Soufrière eruptions from GOES-17 side views and GOES-16–MODIS stereo views, Atmos. Chem. Phys., 22, 12311–12330, https://doi.org/10.5194/acp-22-12311-2022, 2022.
Jing, P., Banerjee, S., and Barrera, M.: Impact of Rossby wave breaking on ozone variation in the upper troposphere and lower stratosphere, 1985–2015, Atmos. Environ., 222, 117122, https://doi.org/10.1016/j.atmosenv.2019.117122, 2020.
Kalnajs, L. E. and Deshler, T.: A New Instrument for Balloon-Borne In Situ Aerosol Size Distribution Measurements, the Continuation of a 50 Year Record of Stratospheric Aerosols Measurements, J. Geophys. Res.-Atmos., e2022JD037485, https://doi.org/10.1029/2022JD037485, 2022.
Kloss, C., Berthet, G., Sellitto, P., Ploeger, F., Taha, G., Tidiga, M., Eremenko, M., Bossolasco, A., Jégou, F., Renard, J.-B., and Legras, B.: Stratospheric aerosol layer perturbation caused by the 2019 Raikoke and Ulawun eruptions and their radiative forcing, Atmos. Chem. Phys., 21, 535–560, https://doi.org/10.5194/acp-21-535-2021, 2021.
Kremser, S., Thomason, L. W., von Hobe, M., Hermann, M., Deshler, T., Timmreck, C., Toohey, M., Stenke, A., Schwarz, J. P., and Weigel, R.: Stratospheric aerosol – Observations, processes, and impact on climate, Rev. Geophys., 54, 278–335, 2016.
Li, Y., Dykema, J., Deshler, T., and Keutsch, F.: Composition dependence of stratospheric aerosol shortwave radiative forcing in northern midlatitudes, Geophys. Res. Lett., 48, e2021GL094427, https://doi.org/10.1029/2021GL094427, 2021.
Li, Y., Dykema, J., Shen, X., Sharpe, S., Rivera-Adorno, F. A., Fromm, M. D., Peterson, D. A., Laskin, A., Cziczo, D. J., and Keutsch, F. N.: Microphysical and Chemical Characterization of Aerosols in the Stratosphere and Upper Troposphere: Influence of Biomass Burning, AGU Fall Meeting Abstracts, Chicago, United States, 12–16 December 2022, A52Q-1216, 2022.
Loughman, R., Bhartia, P. K., Chen, Z., Xu, P., Nyaku, E., and Taha, G.: The Ozone Mapping and Profiler Suite (OMPS) Limb Profiler (LP) Version 1 aerosol extinction retrieval algorithm: theoretical basis, Atmos. Meas. Tech., 11, 2633–2651, https://doi.org/10.5194/amt-11-2633-2018, 2018.
Marshall, L. R., Maters, E. C., Schmidt, A., Timmreck, C., Robock, A., and Toohey, M.: Volcanic effects on climate: recent advances and future avenues, B. Volcanol., 84, 54, https://doi.org/10.1007/s00445-022-01559-3, 2022.
McNeill, V. F. and Thornton, J. A.: How wildfires deplete ozone in the stratosphere, Nature, 615, 219–221, https://doi.org/10.1038/d41586-023-00598-w, 2023.
Murphy, D. M., Froyd, K. D., Bourgeois, I., Brock, C. A., Kupc, A., Peischl, J., Schill, G. P., Thompson, C. R., Williamson, C. J., and Yu, P.: Radiative and chemical implications of the size and composition of aerosol particles in the existing or modified global stratosphere, Atmos. Chem. Phys., 21, 8915–8932, https://doi.org/10.5194/acp-21-8915-2021, 2021.
NASA/LARC/SD/ASDC: Dynamics and Chemistry of the Summer Stratosphere Airborne Data Products, NASA Langley Atmospheric Science Data Center DAAC [data set], https://doi.org/10.5067/ASDC/DCOTSS-Aircraft-Data_1, 2022.
NASA/LARC/SD/ASDC: CALIPSO Lidar Level 1B profile data, V4-11, NASA Langley Atmospheric Science Data Center DAAC [data set], https://doi.org/10.5067/CALIOP/CALIPSO/CAL_LID_L1-Standard-V4-11, 2016.
Pueschel, R., Russell, P., Allen, D., Ferry, G., Snetsinger, K., Livingston, J., and Verma, S.: Physical and optical properties of the Pinatubo volcanic aerosol: Aircraft observations with impactors and a Sun-tracking photometer, J. Geophys. Res.-Atmos., 99, 12915–12922, 1994.
Quaglia, I., Timmreck, C., Niemeier, U., Visioni, D., Pitari, G., Brodowsky, C., Brühl, C., Dhomse, S. S., Franke, H., Laakso, A., Mann, G. W., Rozanov, E., and Sukhodolov, T.: Interactive stratospheric aerosol models' response to different amounts and altitudes of SO2 injection during the 1991 Pinatubo eruption, Atmos. Chem. Phys., 23, 921–948, https://doi.org/10.5194/acp-23-921-2023, 2023.
Rex, M., Wohltmann, I., Ridder, T., Lehmann, R., Rosenlof, K., Wennberg, P., Weisenstein, D., Notholt, J., Krüger, K., Mohr, V., and Tegtmeier, S.: A tropical West Pacific OH minimum and implications for stratospheric composition, Atmos. Chem. Phys., 14, 4827–4841, https://doi.org/10.5194/acp-14-4827-2014, 2014.
Rieger, L., Randel, W., Bourassa, A., and Solomon, S.: Stratospheric temperature and ozone anomalies associated with the 2020 Australian New Year fires, Geophys. Res. Lett., 48, e2021GL095898, https://doi.org/10.1029/2021GL095898, 2021.
Robock, A.: Volcanic eruptions and climate, Rev. Geophys., 38, 191–219, 2000.
Roeckner, E., Bäuml, G., Bonaventura, L., Brokopf, R., Esch, M., Giorgetta, M., Hagemann, S., Kirchner, I., Kornblueh, L., and Manzini, E.: The atmospheric general circulation model ECHAM 5. PART I: Model description, Tech. rep., Max Planck Institute for Meteorology, MPI-Report 349, https://pure.mpg.de/rest/items/item_995269_4/component/file_995268/content (last access: 12 March 2023), 2003.
Roeckner, E., Brokopf, R., Esch, M., Giorgetta, M., Hagemann, S., Kornblueh, L., Manzini, E., Schlese, U., and Schulzweida, U.: Sensitivity of Simulated Climate to Horizontal and Vertical Resolution in the ECHAM5 Atmosphere Model, Journal of Climate, 19, 3771-3791, https://doi.org/10.1175/JCLI3824.1, 2006.
Russell, P., Livingston, J., Pueschel, R., Bauman, J., Pollack, J., Brooks, S., Hamill, P., Thomason, L., Stowe, L., and Deshler, T.: Global to microscale evolution of the Pinatubo volcanic aerosol derived from diverse measurements and analyses, J. Geophys. Res.-Atmos., 101, 18745–18763, 1996.
Salawitch, R. J. and McBride, L. A.: Australian wildfires depleted the ozone layer, Science, 378, 829–830, 2022.
Schmidt, A., Mills, M. J., Ghan, S., Gregory, J. M., Allan, R. P., Andrews, T., Bardeen, C. G., Conley, A., Forster, P. M., and Gettelman, A.: Volcanic radiative forcing from 1979 to 2015, J. Geophys. Res.-Atmos., 123, 12491–12508, 2018.
Scott, S. G., Bui, T. P., Chan, K. R., and Bowen, S. W.: The meteorological measurement system on the NASA ER-2 aircraft, J. Atmos. Ocean. Tech., 7, 525–540, 1990.
Sheng, J. X., Weisenstein, D. K., Luo, B. P., Rozanov, E., Stenke, A., Anet, J., Bingemer, H., and Peter, T.: Global atmospheric sulfur budget under volcanically quiescent conditions: Aerosol-chemistry-climate model predictions and validation, J. Geophys. Res.-Atmos., 120, 256–276, 2015.
Solomon, S.: Stratospheric ozone depletion: A review of concepts and history, Rev. Geophys., 37, 275–316, 1999.
Solomon, S., Daniel, J. S., Neely III, R. R., Vernier, J.-P., Dutton, E. G., and Thomason, L. W.: The persistently variable “background” stratospheric aerosol layer and global climate change, Science, 333, 866–870, 2011.
Solomon, S., Stone, K., Yu, P., Murphy, D., Kinnison, D., Ravishankara, A., and Wang, P.: Chlorine activation and enhanced ozone depletion induced by wildfire aerosol, Nature, 615, 259–264, 2023.
Sporre, M. K., Friberg, J., Svenhag, C., Sourdeval, O., and Storelvmo, T.: Springtime Stratospheric Volcanic Aerosol Impact on Midlatitude Cirrus Clouds, Geophys. Res. Lett., 49, e2021GL096171, https://doi.org/10.1029/2021GL096171, 2022.
Stenke, A., Schraner, M., Rozanov, E., Egorova, T., Luo, B., and Peter, T.: The SOCOL version 3.0 chemistry–climate model: description, evaluation, and implications from an advanced transport algorithm, Geosci. Model Dev., 6, 1407–1427, https://doi.org/10.5194/gmd-6-1407-2013, 2013.
Taylor, I. A., Grainger, R. G., Prata, A. T., Proud, S. R., Mather, T. A., and Pyle, D. M.: Satellite measurements of plumes from the 2021 eruption of La Soufrière, St Vincent, Atmos. Chem. Phys. Discuss. [preprint], https://doi.org/10.5194/acp-2022-772, in review, 2022.
Thomason, L. W., Ernest, N., Millán, L., Rieger, L., Bourassa, A., Vernier, J.-P., Manney, G., Luo, B., Arfeuille, F., and Peter, T.: A global space-based stratospheric aerosol climatology: 1979–2016, Earth Syst. Sci. Data, 10, 469–492, https://doi.org/10.5194/essd-10-469-2018, 2018.
Todt, M. A., Asher, E., Hall, E., Cullis, P., Jordan, A., Xiong, K., Hurst, D. F., and Thornberry, T.: Baseline Balloon Stratospheric Aerosol Profiles (B2SAP) – Systematic Measurements of Aerosol Number Density and Size, J. Geophys. Res.-Atmos., 128, e2022JD038041, https://doi.org/10.1029/2022JD038041, 2023.
Vernier, J.-P., Pommereau, J.-P., Garnier, A., Pelon, J., Larsen, N., Nielsen, J., Christensen, T., Cairo, F., Thomason, L. W., and Leblanc, T.: Tropical stratospheric aerosol layer from CALIPSO lidar observations, J. Geophys. Res.-Atmos., 114, D00H10, https://doi.org/10.1029/2009JD011946, 2009.
Vernier, J.-P., Thomason, L. W., Pommereau, J.-P., Bourassa, A., Pelon, J., Garnier, A., Hauchecorne, A., Blanot, L., Trepte, C., Degenstein, D., and Vargas, F.: Major influence of tropical volcanic eruptions on the stratospheric aerosol layer during the last decade, Geophys. Res. Lett., 38, L12807, https://doi.org/10.1029/2011GL047563, 2011.
Vernier, J. P., Fairlie, T., Natarajan, M., Wienhold, F., Bian, J., Martinsson, B., Crumeyrolle, S., Thomason, L., and Bedka, K.: Increase in upper tropospheric and lower stratospheric aerosol levels and its potential connection with Asian pollution, J. Geophys. Res.-Atmos., 120, 1608–1619, 2015.
Vernier, J.-P., Aubry, T., Timmreck, C., Schmidt, A., Clarisse, L., Prata, F., Theys, N., Prata, A., Mann, G., Choi, H., Carn, S., Rigby, R., Loughlin, S., and Stevenson, J.: The 2019 Raikoke eruption as a testbed for rapid assessment of volcanic atmospheric impacts by the Volcano Response group, EGUsphere [preprint], https://doi.org/10.5194/egusphere-2023-1116, 2023.
Wilson, J., Jonsson, H., Brock, C., Toohey, D., Avallone, L., Baumgardner, D., Dye, J., Poole, L., Woods, D., and DeCoursey, R.: In situ observations of aerosol and chlorine monoxide after the 1991 eruption of Mount Pinatubo: effect of reactions on sulfate aerosol, Science, 261, 1140–1143, 1993.
Wrana, F., Niemeier, U., Thomason, L. W., Wallis, S., and von Savigny, C.: Stratospheric aerosol size reduction after volcanic eruptions, EGUsphere [preprint], https://doi.org/10.5194/egusphere-2023-837, 2023.
Yook, S., Thompson, D. W., and Solomon, S.: Climate impacts and potential drivers of the unprecedented Antarctic ozone holes of 2020 and 2021, Geophys. Res. Lett., 49, e2022GL098064, https://doi.org/10.1029/2022GL098064, 2022.
Yu, P., Murphy, D. M., Portmann, R. W., Toon, O. B., Froyd, K. D., Rollins, A. W., Gao, R. S., and Rosenlof, K. H.: Radiative forcing from anthropogenic sulfur and organic emissions reaching the stratosphere, Geophys. Res. Lett., 43, 9361–9367, 2016.