the Creative Commons Attribution 4.0 License.
the Creative Commons Attribution 4.0 License.
 | 01 Dec 2023
Measurement report: Size-resolved mass concentration of equivalent black carbon-containing particles larger than 700 nm and their role in radiation
Weilun Zhao
Gang Zhao
Nan Ma
Shuya Hu
Chunsheng Zhao
Black carbon (BC) mass size distribution (BCMSD) is crucial in both the environment and the climate system due to BC's intense size-dependent absorption of solar radiation. BC-containing particles larger than 700 nm (BC>700) could contribute to more than half of bulk BC mass concentration. Unfortunately, previous methods concentrated on BC-containing particles of less than 700 nm because of technical limitations. The contribution of BC to absorption and the radiative effect might be underestimated without consideration of BC>700. In this study, equivalent BCMSD (eBCMSD) from 150 nm up to 1.5 µm was measured at high time resolution of 1 h for the first time by an aerodynamic aerosol classifier in tandem with an aethalometer in two field campaigns over eastern China, namely Changzhou located in the Yangtze River Delta and Beijing located in the North China Plain. The results revealed that the pattern of eBCMSD in Changzhou (Beijing) was mostly bimodal (unimodal) peaking at 240 and 1249 nm (427 nm). The peak diameter of eBCMSD in Changzhou did not shift significantly with increasing pollution (240 to 289 nm). In contrast, the peak diameter of eBCMSD in Beijing shifted towards larger sizes, from 347 to 527 nm, with increasing pollution, indicating that the aging process at the urban site was different from that at the regional background site. eBCMSD in both Changzhou and Beijing had a significant diurnal cycle with a smaller (larger) value of eBCMSD during daytime (nighttime). Equivalent BC>700 (eBC>700) was ubiquitous and varied significantly with different locations and pollution levels. The campaign-averaged contribution of eBC>700 to bulk eBC mass concentration (meBC,bulk), bulk absorption coefficient (σab,bulk) and estimated direct radiative forcing of eBC (DRFeBC) in Changzhou and Beijing were 27.8 % (20.9 %–36.5 %) and 24.1 % (17.5 %–34.2 %), 19.6 % (15.8 %–24.6 %) and 25.9 % (19.6 %–33.7 %) and 20.5 % (18.4 %–22.2 %) and 21.0 % (16.3 %–26.1 %), respectively. meBC,bulk, σab,bulk and DRFeBC of eBC>700 in Changzhou (Beijing) increased by a factor of 3.6 (5.1) from 0.11 (0.07) to 0.40 (0.36) µg m−3, by a factor of 3.2 (5.5) from 0.54 (0.63) to 1.75 (3.45) Mm−1 and by a factor of 2.4 (4.7) from 0.1 (0.1) to 0.24 (0.47) W m−2, respectively, with the aggravation of pollution. The contribution of eBC>700 to meBC,bulk and σab,bulk had a significant diurnal cycle with a higher (lower) fraction during daytime (nighttime) in both Changzhou and Beijing. A case study indicated that the contribution of eBC>700 to meBC,bulk, σab,bulk and DRFeBC could reach up to 50 %, 50 % and 40 %, respectively. It was highly recommended to consider the whole size range of BC-containing particles in model estimation of the BC radiative effect.
- Article
(2915 KB) - Full-text XML
-
Supplement
(1769 KB) - BibTeX
- EndNote


Black carbon (BC) is a strong light-absorbing carbonaceous particle (Bond and Bergstrom, 2006) from incomplete combustion of fossil fuel or biomass (Bond et al., 2004). Absorption of BC reduces atmospheric visibility (Moosmuller et al., 2009) and has warming effect on the climate system (Bond, 2001). The BC radiative effect had considerable uncertainties. Estimated BC radiative effects from different models did not even converge to the same order of magnitude (Bond et al., 2013; Szopa et al., 2021).
Previous estimation of the BC radiative effect was based on bulk BC mass concentration (mBC,bulk) from an emission inventory and prescribed mass absorption cross section (MAC) (Bond et al., 2013). Both mBC,bulk and MAC were influenced by BC mass size distribution (BCMSD), which was one of the BC microphysical properties. BC radiative effect was highly sensitive to BCMSD (Matsui et al., 2018), and BCMSD could result in obvious variations in aerosol radiative forcing (Zhao et al., 2019). BCMSD depended on the emission source essentially. For example, the peak diameter of freshly emitted BCMSD from fossil fuels was generally smaller than that from biomass burning (Berner et al., 1984; Artaxo et al., 1998; Schwarz et al., 2008). After BC was emitted to the ambient environment, BCMSD was influenced by the aging process, during which BC optical properties underwent remarkable changes (Zhang et al., 2008). For instance, BC could be coated by other non-BC materials during atmospheric transport. The existence of non-BC coating enhanced BC absorption, and this phenomenon was termed “lensing effect” (Fuller et al., 1999). The accurate quantification of the lensing effect was a critical challenge in estimating the BC radiative effect (Liu et al., 2017), and the information of BCMSD was required to resolve the influence of the lensing effect on BC radiative forcing.
Guo (2016) reported that particles containing elemental carbon (EC; Petzold et al., 2013) that were larger than 2.1 µm accounted for 27.6 %–35.2 % of bulk EC mass concentration (mEC,bulk). Wang et al. (2017) reported that EC-containing particles larger than 1.1 µm accounted for 40.6 %–65.5 % of mEC,bulk. Wang et al. (2022) indicated EC-containing particles larger than 1 µm contributed to 50 %–54 % of mEC,bulk. Therefore, BC-containing particles larger than 1 µm contributed a significant part of the total BC mass. Wang et al. (2022) found that these large carbon-containing particles were super-aggregated BC particles with fractal structures or BC-containing particles with massive coatings from secondary processes. Chakrabarty et al. (2014) found that the optical properties of these super BC aggregates could be significant. It should be noted that the current characterization of BC-containing particles larger than 1 µm can be only achieved through offline microscopy analysis (Chakrabarty et al., 2014) or EC mass size distribution (ECMSD) measurement by offline thermo/optical organic carbon/elemental carbon analysis of size-segregated filter-based samples (Chow et al., 2001). The resulting time resolution of ECMSD was 24–48 h. Considering that the typical timescale of BC aging was 4–18 h (Peng et al., 2016), current measured ECMSD could not resolve atmospheric aging of BC-containing particles larger than 1 µm. Actually, the current method capable of measuring BC-containing particles on timescales of BC aging, namely the laser-induced incandescence technique (Schwarz et al., 2006), is limited to sizes less than 700 nm. The characterization of BC-containing particles larger than 700 nm (BC>700) during atmospheric aging was still unclear. The contribution of BC>700 to absorption and BC radiative forcing has not been well studied.
In this study, equivalent BC (eBC, Petzold et al., 2013) mass size distribution (eBCMSD) up to 1.5 µm was measured with a time resolution of 1 h to study the evolution of equivalent BC>700 (eBC>700) as well as the contribution of eBC>700 to bulk eBC mass concentration (meBC,bulk), bulk absorption coefficient (σab,bulk) and eBC direct radiative forcing. The size refers to the particle size not the BC core size in this study. eBCMSD was determined by an aerosol aerodynamic classifier (AAC, Cambustion, UK; Tavakoli and Olfert, 2013) used in tandem with an aethalometer (model AE33, Magee, USA, Drinovec et al., 2015), hereafter referred to as AAC-AE33, based on the method proposed by Zhao et al. (2022). eBCMSD was measured in two different locations of eastern China to study the spatial difference in eBC>700. Direct radiative forcing of eBC (DRFeBC) was estimated by the Santa Barbara DISORT (discrete ordinates radiative transfer) Atmospheric Radiative Transfer (SBDART) model (Ricchiazzi et al., 1998).
The structure of this study was organized as follows. Section 2 introduce the field measurement, instrumental setup and details about estimation of DRFeBC. Section 3 discusses the evolution as well as mass, absorption and radiation contribution of eBC>700 based on the field measurement. Section 4 presents the conclusions.
2.1 Field measurement
The AAC-AE33 system was first applied to a field measurement in Changzhou, Jiangsu Province, China (119∘36′ E, 31∘43′ N), situated at the Yangtze River Delta, from 17 May to 3 June 2021 (summer). Changzhou is between two megacities, namely Nanjing (82 km to the northwest) and Shanghai (187 km to the southeast). There were no emission sources around the measurement site in Changzhou. Thus, pollution around the site was dominated by regional transportation and the measurement site in Changzhou was a typical regional background site (Zhao et al., 2022).
Then, the AAC-AE33 was deployed in Beijing, China (116∘18′ E, 39∘59′ N), located in the North China Plain, from 29 October 2021 to 25 January 2022 (winter). The measurement site was near two busy streets, namely Zhongguancun Street to the west and Chengfu Road to the south. Therefore, the measurement site in Beijing was representative of an urban environment (Zhao et al., 2019).
2.2 Instrumental setup
The instrumental setup for eBCMSD measurement was illustrated in detail by Zhao et al. (2022) and is introduced here briefly. As shown in Fig. 1, a PM10 inlet (16.67 L min−1) was used to sample ambient aerosol particles. Then particles passed through a silica gel diffusion drier, where relative humidity (RH) was decreased to less than 30 %, before being sampled by the AAC-AE33. AAC-AE33 measured size-resolved absorption coefficient (σab,size-resolved) at a flow rate of 3 L min−1 in Changzhou and 2 L min−1 in Beijing. AAC was set to scan 12 logarithmically equally distributed aerodynamic sizes ranging from 200 nm to 1.5 µm in Changzhou and 150 nm to 1.5 µm in Beijing, respectively. It should be pointed out that the particle diameter (Dp) was of an aerodynamic size in this study. Particles of each scanned size were sampled for 5 min, so the time resolution of σab,size-resolved came to 1 h. The measured σab,size-resolved at wavelength 880 nm by the AE33 was used to derive eBCMSD because BC was the major contributor of aerosol absorption at 880 nm (Ramachandran and Rajesh, 2007).
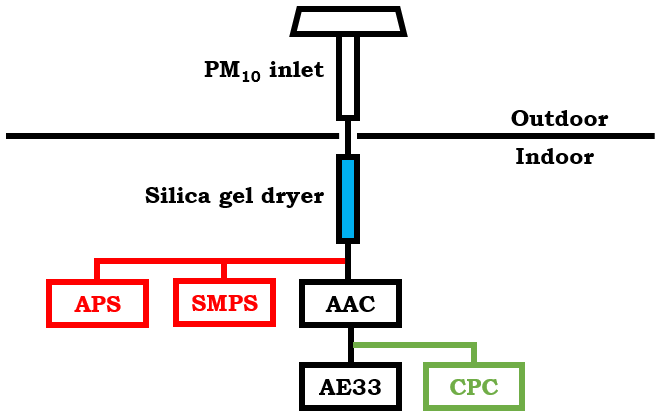
Figure 1Instrumental setup used in this study. Instruments used to measure Nsize-resolved was colored with red (green) for Changzhou (Beijing).
The principle of retrieving σab from the AE33 was proposed by Hansen et al. (1984) and is described here briefly. An aerosol-laden flow with a flow rate of F was input into the AE33, where the aerosol particles were collected on a region with area of S of a filter. The filter was illuminated by light sources at specific wavelengths. The part of the light transmitted through the particle-laden (particle-free) area of the filter and the transmitted light intensity was denoted as I (I0). The light attenuation (ATN) was defined as
Assuming ATN changed by ΔATN in time interval of Δt, the attenuation coefficient σATN was defined as
The light attenuation was actually caused by both absorption and scattering of particles as well as the filter, which was called multi-scattering effect. The multi-scattering effect was corrected based on the study of Zhao et al. (2020), where a parameter Cf=2.9 was introduced to derive σab:
Besides the multi-scattering effect, the loading effect also needed to be corrected, namely, the change in ATN was not linearly dependent on aerosol loading. Drinovec et al. (2015) developed the “dual-spot” technique to correct loading effect, which was adopted by this study.
MAC was required to convert the absorption coefficient into eBC mass concentration. The size-dependent MAC was modeled based on the scheme proposed by Zhao et al. (2021) at wavelength 880 nm, which required the size-resolved particle number concentration (Nsize-resolved). Concisely, taking 700 nm of Dp as an example, the number fraction of BC-containing particles (fBC) was assumed to be a fixed parameter (0.35), and the number concentration of BC-containing particles (NBC) at Dp of 700 nm could be derived by
where Δlog Dp was the logarithmic width of the Dp size bin. The fixed-fBC assumption led to ∼3 % uncertainty in derived meBC. We assumed that all BC-containing particles at Dp of 700 nm had the same core size DBC. An optimal DBC was found so that the calculated absorption (σab,calc) matched the measured absorption (σab,meas), namely
where ρBC was the density of BC and assumed to be a fixed value (1.8 g cm−3), MACMie was the Mie-calculated MAC at Dp of 700 nm and the optimal DBC. eBCMSD at Dp of 700 nm could be calculated by
The assumption on the MAC led to an ∼24 % uncertainty in the derived meBC. It should be noted that dust was not considered in this study. Nsize-resolved was measured by a scanning mobility particle sizer (SMPS, TSI, USA) at 0.3 L min−1 as well as an aerodynamic particle sizer (APS, TSI, USA) at 5 L min−1 in Changzhou and an AAC in tandem with a condensation particle counter (CPC, TSI, USA, AAC – CPC, Johnson et al., 2018) at 1 L min−1 in Beijing. The AAC-AE33 measured σab,size-resolved and determined eBCMSD synchronously. Therefore, the contribution of eBC>700 to both bulk absorption and meBC,bulk could be quantified simultaneously.
In this study, the bulk mass concentration of eBC-containing particles (meBC,bulk) was defined as
where was eBCMSD and the lower limit of integral was 200 nm in both Changzhou and Beijing for the convenience of comparison. The bulk mass concentration of eBC>700 () was defined as
The contribution of eBC>700 to meBC,bulk () was defined as
It should be noted that BC-containing particles of Dp lower than 200 nm and greater than 1500 nm were not considered in this study, which leads to a discrepancy between true () and estimated . By simple mathematical analysis, it could be proven that in the range of
where was actually meBC,bulk in this study.
Similarly, the bulk absorption coefficient (σab,bulk) was defined as
where was σab,size-resolved. The bulk absorption coefficient of eBC>700 () was defined as
The contribution of eBC>700 to σab,bulk () was defined as
2.3 Estimation of direct radiative forcing of equivalent black carbon
The direct radiative effect was one of the BC characteristics that raises extensive concerns. The SBDART model was employed to study the characteristics of DRFeBC. Specifically, the instantaneous DRFeBC was estimated at the top of atmosphere (TOA) under cloud-free conditions. Wavelengths from 250 nm to 4 µm were simulated in this study. Direct radiative forcing of aerosol (DRFaerosol) was defined as (Zhao et al., 2018)
where () was downward (upward) radiative irradiance flux at TOA with aerosol and () was downward (upward) radiative irradiance flux at TOA without aerosol. Direct radiative forcing of aerosol without eBC (DRFaerosol,noneBC) was defined as
where () was downward (upward) radiative irradiance flux at TOA with aerosol except eBC. The DRFeBC was defined as the difference between DRFaerosol and DRFaerosol,noneBC:
Similarly, the direct radiative forcing of eBC>700 (DRF) was defined as
where () was downward (upward) radiative irradiance flux at TOA with aerosol except eBC>700. The contribution of eBC>700 to DRFeBC () was defined as
SBDART simulation required information of surface albedo, vertical profiles of meteorological parameters and aerosol optical parameters. Surface albedo was acquired from Moderate Resolution Imaging Spectroradiometer (MODIS)/Terra surface reflectance data with temporal and spatial resolution of 1 d and 0.05∘ (MOD09CMG). The gridded data around the measurement site were averaged to represent surface albedo of the measurement site.
The vertical profile of meteorological parameters included vertical profile of pressure, temperature, water vapor and ozone, which were obtained from the fifth-generation ECMWF (European Center for Medium Range Weather Forecasts) reanalysis data for global climate and weather (ERA5). The ERA5 data had a temporal and spatial resolution of 1 h and 0.25∘ with 38 vertical layers from the surface to about 50 km above surface. At each layer, the gridded data around the measurement site were also averaged to represent meteorological parameters of the measurement site. The time resolution of meteorological parameters was averaged to daily to match that of surface albedo.
The vertical profile of aerosol optical parameters included the vertical profile of bulk aerosol extinction coefficient (σext,bulk), single scattering albedo (SSA) and asymmetry factor (g) at different wavelengths, which were parameterized based on the study of Zhao et al. (2019) and described here briefly. The bulk aerosol particle number concentration (Nbulk) was parameterized according to the aircraft study by Liu et al. (2009). Dry Nsize-resolved at different heights had the same shape after normalization by corresponding Nbulk. The parameterization of meBC,bulk and eBCMSD was the same as Nbulk and dry Nsize-resolved. As for mixing state, 51 % of eBC mass was assumed to be externally mixed and the rest of the eBC mass was assumed to be internally mixed with core–shell geometry (Ma et al., 2012) in each size bin. For the case of aerosol without eBC-containing particles (larger than 700 nm), eBCMSD (larger than 700 nm) was set to 0. The aerosol optical parameters varying with height-dependent RH were calculated by Mie scattering theory and κ-Köhler theory (Petters and Kreidenweis, 2007) assuming hygroscopic growth parameter of 0.22 (Tan et al., 2019). The refractive indices of eBC, water and non-eBC material without water were assumed 1.8+0.54i (average among the wavelengths 450, 550 and 700 nm) (Kuang et al., 2015), (wavelength 550 nm) and (wavelength 550 nm) (Wex et al., 2002), respectively. The refractive index of non-eBC material mixed with water after hygroscopic growth was derived by volume-weighted rule (Wex et al., 2002). In short, real-time measured eBCMSD and Nsize-resolved were used as boundary conditions at ground level to construct a parameterized vertical aerosol profile. When calculating aerosol optical parameters at each altitude, the mixing state of BC-containing particles was assumed to be the same at each altitude, each time and each Dp. With the above information, the vertical profiles of σext,bulk, SSA and g could be calculated based on Mie theory. The time resolution of aerosol optical parameters was averaged to daily in order to match that of surface albedo.
3.1 Case study
A pollution episode took place from 31 October to 6 November 2021 in Beijing, which was used for case study to illustrate the large variability in eBC>700. The geometric mean diameter () of eBCMSD was defined as
which was used to depict the spectral variation in eBCMSD because eBCMSD did not always have an explicit modal pattern and the corresponding peak diameter was not always easy to differentiate.
With the development of pollution, shifted apparently from around 400 to around 600 nm (Fig. 2a). meBC,bulk () increased from less than 0.5 (0.15) µg m−3 to as large as 2.5 (1.0) µg m−3 (by 5.0 (6.6) times). σab,bulk () increased from less than 4 (1) Mm−1 to as large as 25 (10) Mm−1 (by 6.3 (10.0) times). DRFeBC (DRF) increased from 1 (0.2) W m−2 to as large as 4 (1) W m−2 (by 4.0 (5.0) times). It could be seen that the variability in eBC>700 was significant. , and increased from about 20 %, 20 % and 20 % to as large as 50 %, 50 % and 40 %, respectively (Fig. 2b), clearly showing the important role of eBC>700 in BC mass, absorption and radiative effect.
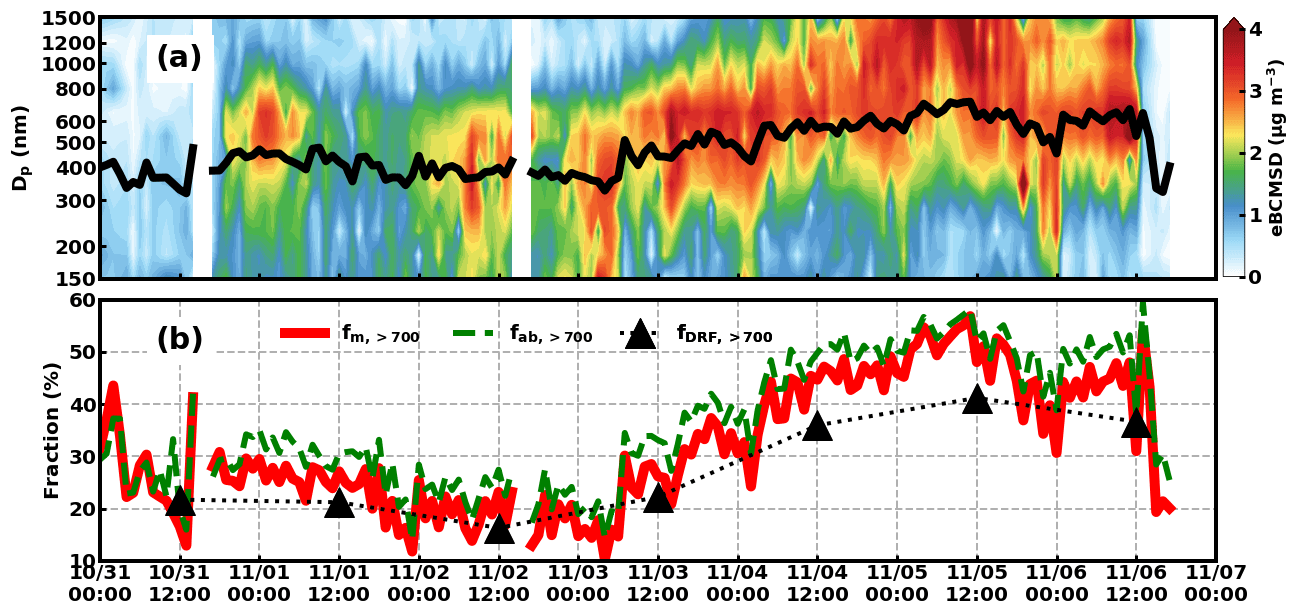
Figure 2(a) eBCMSD from 31 October to 6 November 2021 in Beijing and (b) the corresponding (solid red line), (dashed green line) as well as (dotted black line with triangle marker). The solid black line was .
3.2 Equivalent black carbon mass size distribution
3.2.1 Overview
The time series of eBCMSD in Changzhou and Beijing is shown in Fig. S1a and b1–b4 in the Supplement. eBCMSD was presented with normalized probability density function (pdf) to study general characteristics of eBCMSD. Figure 3a1 and 3a2 were the normalized pdf over the whole campaign of Changzhou and Beijing, respectively. It could be seen that eBCMSD in Changzhou was significantly different from that in Beijing. There were two modes in the median of eBCMSD in Changzhou, which peaked at around 240 and 1249 nm, respectively. Yu et al. (2010) found three modes in ECMSD, namely around 300 nm, 1 µm and 5 µm, and named them condensation mode, droplet mode and coarse mode, respectively. Following the nomenclature by Yu et al. (2010), the mode peaking at 240 and 1249 nm could be termed condensation mode and droplet mode, respectively. In contrast, only condensation mode was identified in median eBCMSD in Beijing, which peaked at 427 nm. The variation in eBCMSD, defined as the difference between the upper quartile and lower quartile, in Changzhou was overall smaller than that in Beijing. The variation in the eBCMSD value in Changzhou (Beijing) ranged from 0.52 (0.54) to 0.91 (1.73) µg m−3, with an average value of 0.75 (1.05) µg m−3. The maximum upper quartile of eBCMSD in Changzhou was 1.58 µg m−3. In comparison, the upper quartile of eBCMSD in Beijing reached up to 2.14 µg m−3, indicating the evolution of eBCMSD in Beijing was more drastic than that in Changzhou.
3.2.2 Evolution with respect to pollution level
In order to investigate the evolution of eBCMSD under different pollution stages, eBCMSD was grouped into three periods: (1) clean period in which meBC,bulk was lower than 0.5 µg m−3, (2) transitional period in which meBC,bulk was greater than 0.5 µg m−3 but lower than 1.0 µg m−3 and (3) polluted period in which meBC,bulk was greater than 1.0 µg m−3. Data from the clean, transitional and polluted periods accounted for 22.6 % (30.9 %), 51.3 % (31.9 %) and 26.0 % (37.2 %) of total data in Changzhou (Beijing), respectively, showing that Changzhou (Beijing) was dominated by the transitional (polluted) period in this study.
In the clean period, there was no distinct difference in eBCMSD between Changzhou (Fig. 3b1) and Beijing (Fig. 3b2). eBCMSD in Changzhou and Beijing did not exhibit an obvious modal structure in the size range of measurement. The value of eBCMSD in both Changzhou and Beijing decreased with increasing Dp in general. For Changzhou (Beijing), the median of eBCMSD decreased from 0.87 (0.47) µg m−3 at 200 nm to 0.26 (0.26) µg m−3 at 1500 nm, with an average value of 0.42 (0.34) µg m−3. The variation in eBCMSD in Changzhou (Beijing) was 0.24 (0.24) to 0.47 (0.55) µg m−3, with an average value of 0.32 (0.35) µg m−3, showing that the variation in eBCMSD in Changzhou was comparable to that in Beijing.
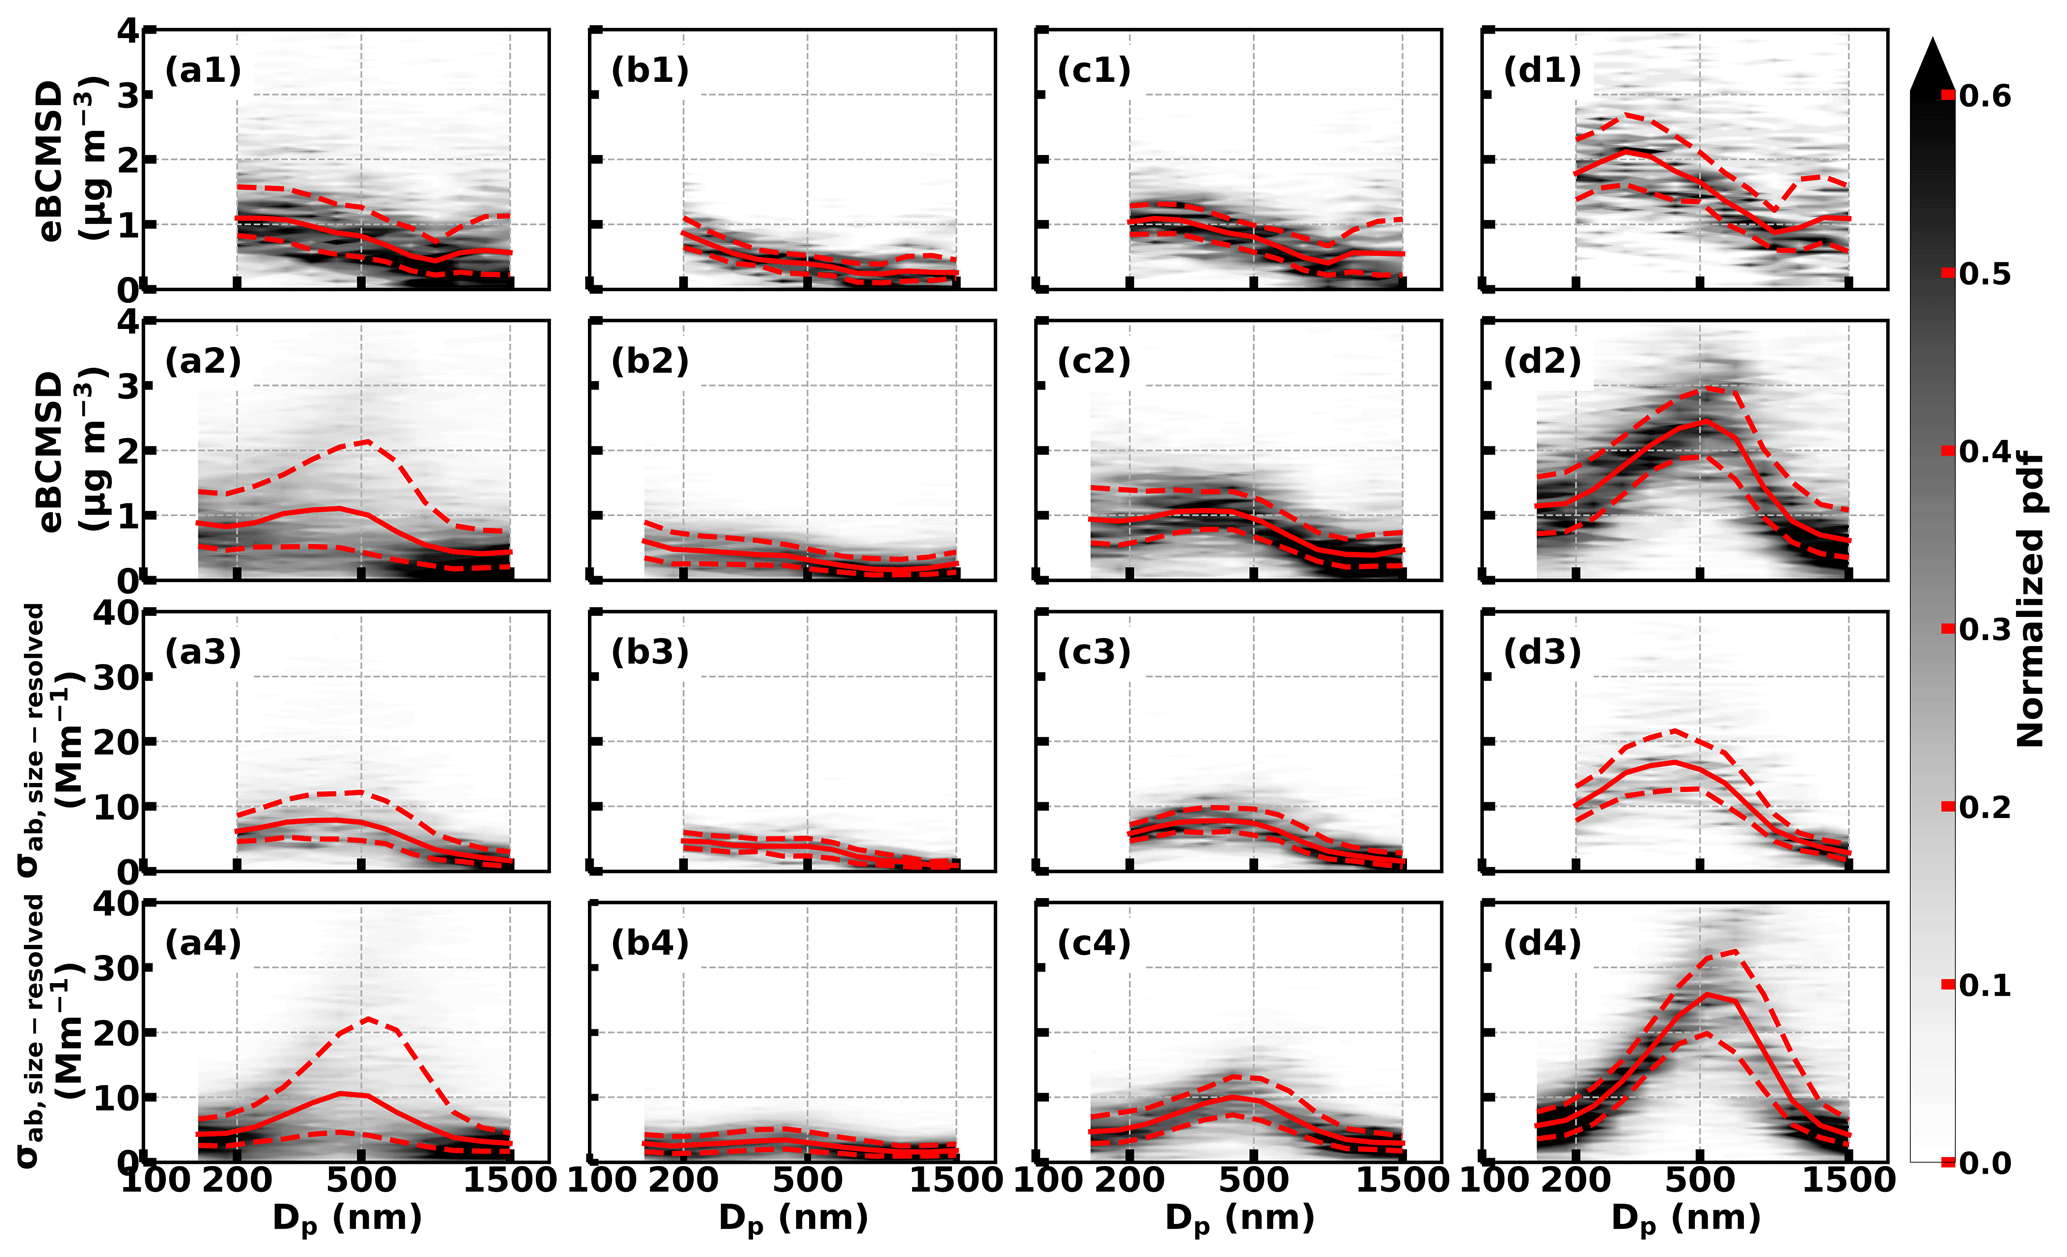
Figure 3Normalized pdf of eBCMSD measured in (a1–d1) Changzhou and (a2–d2) Beijing as well as σab,size-resolved measured in (a3–d3) Changzhou and (a4–d4) Beijing. Panels (a1)–(a4), (b1)–(b4), (c1)–(c4) and (d1)–(d4) were statistics over the whole campaign, clean period, transitional period and polluted period, respectively. The solid red line shows the median and the dashed red lines the lower and upper quartiles.
As the polluted stage evolved to the transitional period, the values of eBCMSD increased in both Changzhou (Fig. 3c1) and Beijing (Fig. 3c2) compared to those in the clean period. The variation in eBCMSD in Changzhou (Beijing) reached 0.41 (0.44) to 0.86 (0.86) µg m−3 with an average value of 0.53 (0.61) µg m−3, about twice as much as that in the clean period. It could be seen that the values of the median and variation in eBCMSD in Changzhou were comparable to those in Beijing. However, the pattern of eBCMSD in Changzhou was obviously different from that in Beijing. The peak value of median eBCMSD was at 240 (347) nm in Changzhou (Beijing). Median eBCMSD in Changzhou exhibited two modes, namely condensation mode and droplet mode, with boundary at around 866 nm. In comparison, median eBCMSD in Beijing only had one mode, namely condensation mode. It should be noted that two modes (one mode) meant that there were two distinct groups (one group) of BC-containing particles with respect to Dp, not the BC core size (DBC). The difference in the peak diameter of condensation mode between Changzhou and Beijing was as large as 107 nm. Median eBCMSD in the clean period was subtracted from that at transitional period to study eBC mass increment at each Dp, as shown in Fig. S4a1. It could be clearly seen that mass increment in Changzhou peaked at 289 and 1249 nm, contributing to condensation mode and droplet mode in eBCMSD, respectively. In contrast, mass increment in Beijing only peaked at 385 nm, contributing to condensation mode in eBCMSD.
As the pollution stage came to the polluted period, the value of eBCMSD increased drastically in both Changzhou (Fig. 3d1) and Beijing (Fig. 3d2) compared to that in the clean period. Both the median value and the variation in eBCMSD increased with the development of pollution. The median eBCMSD increased from 0.88 (0.61) to 2.12 (2.45) µg m−3, with an average value of 1.49 (1.52) µg m−3 in Changzhou (Beijing), about 4 times as much as the median eBCMSD in the clean period. The variation in eBCMSD in Changzhou (Beijing) reached 0.60 (0.73) to 1.11 (1.06) µg m−3, with an average value of 0.92 (0.94) µg m−3, about 3 times as much as that in the clean period. The difference in pattern of eBCMSD between Changzhou and Beijing became more distinct. Median eBCMSD in Changzhou clearly exhibited a bimodal structure where the condensation mode and droplet mode peaked at 289 and 1249 nm, respectively. Median eBCMSD in Beijing exhibited a unimodal structure where the condensation mode peaked a 527 nm. As shown in Fig. S4b1, the peak of mass increment in Changzhou (Beijing) shifted from 289 (385) to 347 (527) nm, varied by 58 (142) nm. The significant difference in the shift of the peak indicated that the aging processes at the regional background site were significantly different from those at the urban site.
3.2.3 Contribution of equivalent black carbon-containing particles larger than 700 nm to bulk equivalent black carbon mass concentration
The median (lower quartile–upper quartile) of meBC,bulk was 0.73 (0.52–1.03) µg m−3 in Changzhou and 0.79 (0.43–1.31) µg m−3 in Beijing (Fig. 4a1). The median of meBC,bulk was comparable between Changzhou and Beijing. The variation in meBC,bulk in Changzhou, 0.51 µg m−3, was smaller than that in Beijing, 0.88 µg m−3. in Changzhou was overall comparable to that in Beijing (Fig. 4a2). was 0.20 (0.13–0.32) µg m−3 in Changzhou and 0.18 (0.10–0.33) µg m−3 in Beijing. Therefore, eBC>700 was ubiquitous. Considering that the variation in in Changzhou, 0.19 µg m−3, was comparable to that in Beijing, 0.23 µg m−3, the larger variation in meBC,bulk in Beijing was mainly from eBC-containing particles of less than 700 nm. was 27.8 % (20.9 %–36.5 %) in Changzhou and 24.1 % (17.5 %–34.2 %) in Beijing (Fig. 4a3), indicating that eBC>700 was overall one-quarter of meBC,bulk. in Changzhou was slightly larger than that in Beijing, which was contributed by the droplet mode of eBCMSD in Changzhou. A summary of meBC is presented in Table 1.
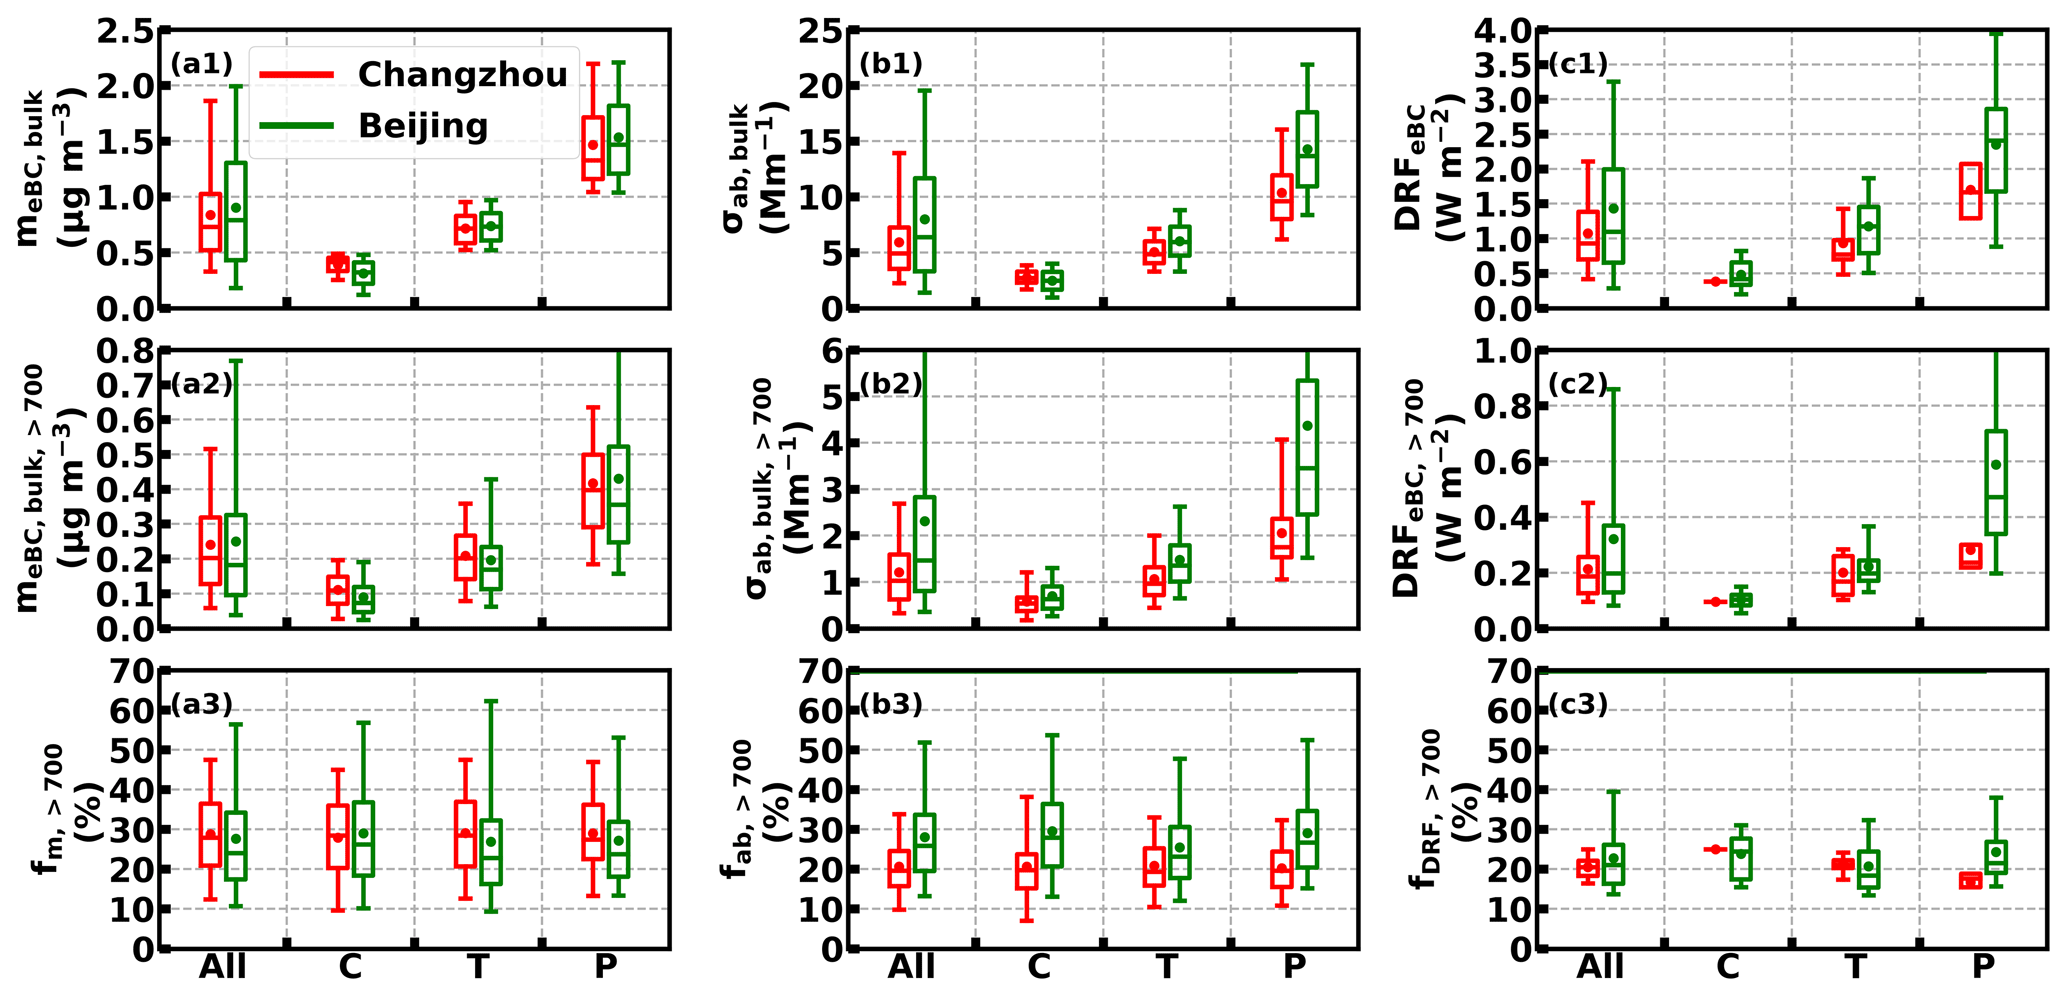
Figure 4Box plots of (a1) meBC,bulk, (a2) , (a3) , (b1) σab,bulk, (b2) , (b3) , (c1) DRFeBC, (c2) DRF and (c3) over the whole campaign (All), clean (C), transitional (T) and polluted (P) period, respectively. The box extends from the first quartile to the third quartile with a line at the median. The whiskers mark the 5th and 95th percentiles. The circle inside the box is the mean value. Statistics from Changzhou (Beijing) are colored red (green). The 95th percentile of under the polluted period for Beijing (a2) was 1.00 µg m−3. The 95th percentile of and that under the polluted period for Beijing (b2) was 7.80 and 10.30 Mm−1, respectively. The 95th percentile of DRF under polluted period for Beijing (c2) was 1.41 W m−2.
The statistics of mass contribution of eBC>700 were studied with different pollution stages. As shown in Fig. 4a1, meBC,bulk increased from 0.41 (0.33–0.45) µg m−3 in the clean period through 0.71 (0.58–0.83) µg m−3 in the transitional period to 1.33 (1.16–1.71) µg m−3 in the polluted period (by 3.2 times) in Changzhou and increased from 0.32 (0.22–0.41) µg m−3 in the clean period through 0.73 (0.61–0.85) µg m−3 in the transitional period to 1.47 (1.21–1.82) µg m−3 in the polluted period (by 4.6 times) in Beijing. As shown in Fig. 4a2, the change in with pollution level was substantial in both Changzhou and Beijing. For Changzhou, increased from 0.11 (0.07–0.15) µg m−3 in the clean period to 0.20 (0.14–0.27) µg m−3 in the transitional period, and reached 0.40 (0.29–0.50) µg m−3 in the polluted period, increasing by as much as 3.6 times from the clean period to the polluted period. For Beijing, increased from 0.07 (0.05–0.12) µg m−3 in the clean period to 0.17 (0.11–0.23) µg m−3 in the transitional period, and reached 0.36 (0.25–0.52) µg m−3 in the polluted period, increasing by as much as 5.1 times from the clean period to the polluted period. The change in meBC,bulk and was overall consistent with the development of pollution, leading to an inconspicuous change in (Fig. 4a3). in Changzhou changed from 28.5 % (20.3 %–36.0 %) in the clean period through 28.4 % (20.7 %–36.9 %) in the transitional period to 27.4 % (22.6 %–36.2 %) in the polluted period. in Beijing varied from 26.2 % (18.4 %–36.8 %) in the clean period through 22.8 % (16.3 %–32.3 %) in the transitional period to 23.8 % (18.1 %–31.9 %) in the polluted period.
3.2.4 Diurnal cycle
It could be seen clearly that the value of eBCMSD during daytime was overall lower than that during nighttime in both Changzhou (Fig. 5a1) and Beijing (Fig. 5a2), indicating that eBCMSD was regulated by the planetary boundary layer or difference in surface emission source (Liu et al., 2019). For Changzhou (Beijing), eBCMSD from 10:00 to 18:00 (08:00 to 18:00; all times listed in the text are UTC+8) was obviously lower that from 20:00 to 06:00 (20:00 to 06:00). Accordingly, meBC,bulk in Changzhou reached a minimum of 0.56 (0.48–0.88) µg m−3 at 12:00 and a maximum of 0.97 (0.80–1.24) µg m−3 at 21:00 (Fig. 5b1). meBC,bulk in Beijing reached a minimum of 0.65 (0.42–1.02) µg m−3 at 14:00 and a maximum of 1.08 (0.55–1.52) µg m−3 at 00:00 (Fig. 5b2). The apparent diurnal cycle was found in the condensation mode of eBCMSD, which was mostly less than 700 nm. In contrast, a diurnal cycle was not obvious for eBCMSD larger than 700 nm for both Changzhou and Beijing. Consequently, in Changzhou (Fig. 5c1) and Beijing (Fig. 5c2) did not exhibit an obvious diurnal cycle. in both Changzhou and Beijing fluctuated around 0.2 µg m−3, consistent with Sect. 3.2.3. Combining the diurnal variation in meBC,bulk and , was negatively correlated to meBC,bulk according to Eq. (9) with a higher value during the daytime and a lower value during the nighttime. reached a maximum of 35.4 % (26.6 %–41.1 %) at 09:00 and reached a minimum of 23.6 % (13.9 %–30.8 %) at 21:00 in Changzhou (Fig. 5d1). reached a maximum of 31.0 % (20.8 %–36.9 %) at 15:00 and reached a minimum of 23.5 % (16.1 %–27.8 %) at 01:00 in Beijing (Fig. 5d2).
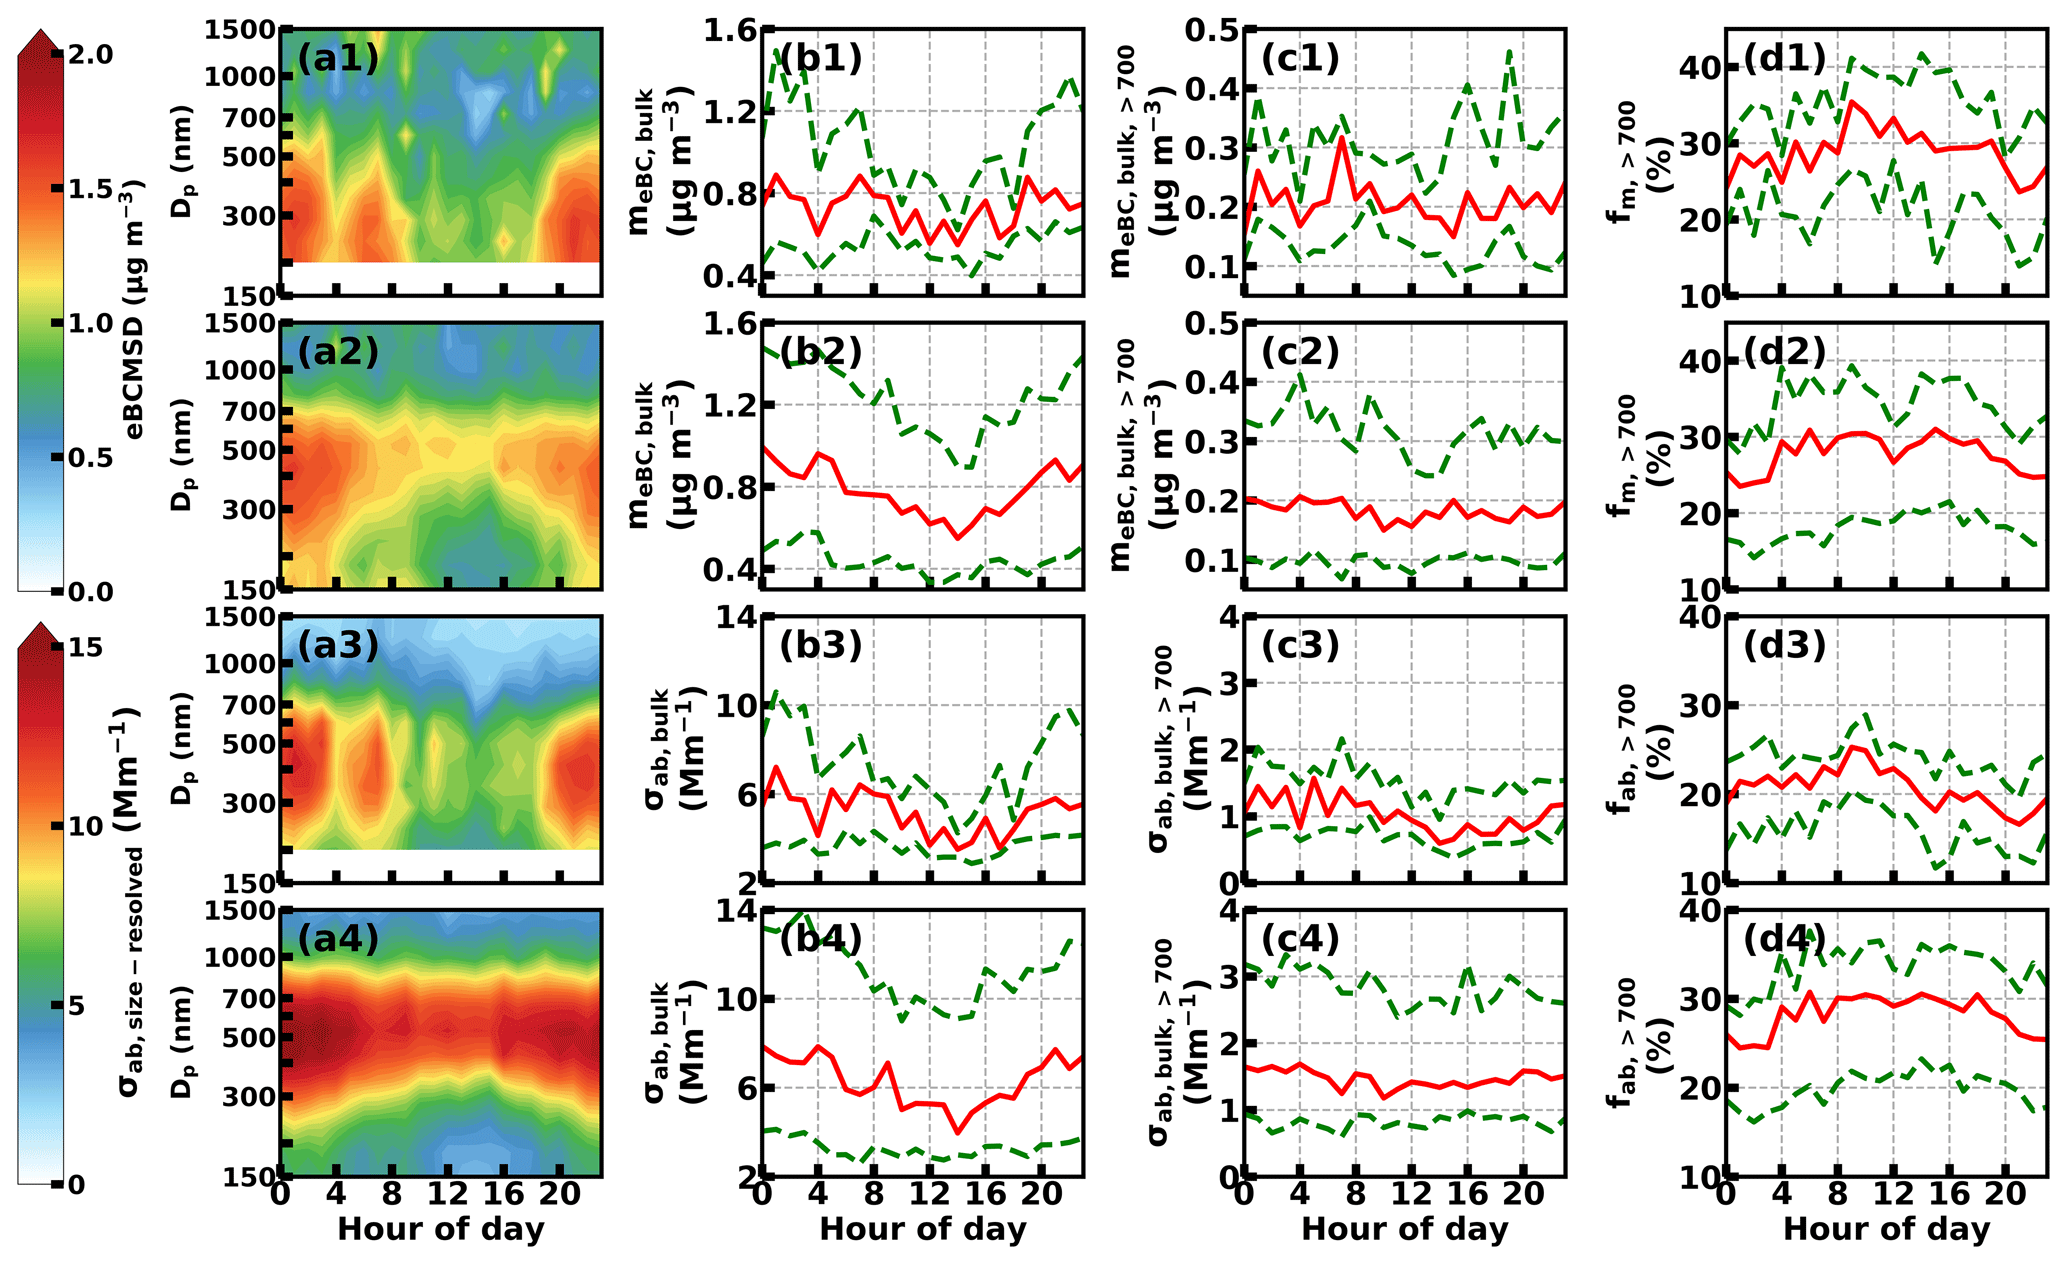
Figure 5Diurnal variation in (a1) eBCMSD, (b1) meBC,bulk, (c1) , (d1) in Changzhou; (a2) eBCMSD, (b2) meBC,bulk, (c2) , (d2) in Beijing; (a3) σab,size-resolved, (b3) σab,bulk, (c3) , (d3) in Changzhou and (a4) σab,size-resolved, (b4) σab,bulk, (c4) , (d4) in Beijing. The solid green line shows the median and the dashed red lines the lower and upper quartiles.
3.3 Size-resolved absorption coefficient
3.3.1 Overview
The general characteristics (time series) of σab,size-resolved in Changzhou and Beijing are shown in Fig. 3a3 (Fig. S2a) and Fig. 3a4 (Fig. S2b1–S2b4), respectively. The median σab,size-resolved in both Changzhou and Beijing exhibited a unimodal structure. For Changzhou (Beijing), σab,size-resolved had a maximum value of 7.88 (10.59) Mm−1 at 416.1 (427.2) nm and a minimum value of 1.63 (2.90) Mm−1 at 1500 (1500) nm, with an average value of 5.39 (6.21) Mm−1. The maximum value was 4.9 (3.7) times larger than the minimum value in Changzhou (Beijing), showing the significant dependence of absorption on particle size. Dp which had a higher median value of σab,size-resolved corresponded to a larger variation on the whole. The variation in σab,size-resolved ranged from 2.25 (2.82) Mm−1 at 1500 (1500) nm to 7.43 (17.90) Mm−1 at 500 (527) nm, with an average value of 4.99 (8.97) Mm−1 in Changzhou (Beijing). The variation in σab,size-resolved was as large as the median value of σab,size-resolved in both Beijing and Changzhou, showing the large variability in BC absorption. The variation in σab,size-resolved in Beijing was overall 1.8 times larger than that in Changzhou, indicating that the evolution of σab,size-resolved in different sites could be significantly different.
3.3.2 Evolution with respect to pollution level
σab,size-resolved was grouped into three periods based on meBC,bulk as described in Sect. 3.2.2. In the clean period, the value of σab,size-resolved overall decreased with increasing Dp in both Changzhou (Fig. 3b3) and Beijing (Fig. 3b4), and the pattern of σab,size-resolved had no obvious modal structure. In Changzhou (Beijing), the value of σab,size-resolved decreased from 4.67 (3.43) Mm−1 at 200 (427) nm to 0.88 (1.80) Mm−1 at 1500 (1500) nm, with an average value of 2.95 (2.49) Mm−1. The variation in σab,size-resolved in Changzhou (Beijing) ranged from 1.06 (1.57) to 2.72 (3.12) Mm−1, with an average value of 2.04 (2.47) Mm−1.
During the transitional period, the unimodal pattern could be identified in both Changzhou (Fig. 3c3) and Beijing (Fig. 3c4). Median σab,size-resolved peaked at 416 (427) nm with a value of 7.80 (10.04) Mm−1 in Changzhou (Beijing). Median σab,size-resolved in the clean period was subtracted from that in the transitional period to study the absorption increment at each Dp, as shown in Fig. S4a2. The increment of σab,size-resolved in Changzhou (Beijing) had a maximum value of 3.94 (6.61) Mm−1 at 416 (427) nm and a minimum value of 0.66 (1.15) Mm−1 at 1500 (1500) nm. The increment of absorption was greatest at around 420 nm and lowest at 1500 nm, showing the significant difference in the change in absorption at different Dp with the development of pollution. The maximum increment of absorption in Beijing was 1.7 times larger than that in Changzhou. Hence, the evolution of absorption could be different substantially in different locations. The variation in σab,size-resolved in Changzhou (Beijing) ranged from 1.94 (2.32) to 4.03 (6.43) Mm−1, with an average value of 3.08 (4.45) Mm−1, increasing by about 1.5 times compared to the clean period.
In the polluted period, the unimodal pattern of σab,size-resolved was significant in both Changzhou (Fig. 3d3) and Beijing (Fig. 3d4). Median σab,size-resolved peaked at 416 (527) nm with a value of 16.79 (25.85) Mm−1 and had a minimum value of 2.85 (4.23) Mm−1 at 1500 (1500) nm in Changzhou (Beijing). Compared to the transitional period, peak diameter remained unchanged in Changzhou but increased by 100 nm in Beijing, indicating the evolution of σab,size-resolved with aging process was different between the regional background site and a typical urban site. The increment of absorption in Changzhou (Beijing) was most significant at 416 (527) nm with a value of 12.93 (22.94) Mm−1 and least significant at 1500 (1500) nm with a value of 1.97 (2.44) Mm−1, as shown in Fig. S4b2. It could be seen that the diameter of increment in absorption remain unchanged in Changzhou and shifted by 100 nm in Beijing, indicating that absorption at different Dp varied differently at different locations with the deterioration of pollution. The variation in σab,size-resolved in Changzhou (Beijing) ranged from 2.19 (3.82) to 9.05 (15.61) Mm−1, with an average value of 5.72 (8.22) Mm−1, increasing by about 3 times compared to the clean period, indicating that the variability in σab,size-resolved increased with the development of pollution.
3.3.3 Contribution of equivalent black carbon-containing particles larger than 700 nm to bulk absorption coefficient
It could be seen from the time series of σab,size-resolved in both Changzhou (Fig. S2a) and Beijing (Fig. S2b1–S2b4) that absorption of eBC>700 was non-negligible. σab,bulk was 4.93 (3.53–7.24) Mm−1 in Changzhou and 6.37 (3.31–11.68) Mm−1 in Beijing on the whole, as shown in Fig. 4b1. Both median and variation in σab,bulk in Changzhou were less than that in Beijing. was 1.03 (0.62–1.59) Mm−1 in Changzhou, accounting for 19.6 % (15.8 %–24.6 %) of σab,bulk, and 1.47 (0.81–2.83) Mm−1 in Beijing, accounting for 25.9 % (19.6 %–33.7 %) of σab,bulk, respectively, as shown in Fig. 4b2 and b3. It could be clearly seen that eBC>700 contributed substantially to the total absorption, and should be explicitly considered in BC radiative estimation. A summary of σab is presented in Table 1.
With the aggravation of pollution, the change in meBC,bulk in Changzhou was overall in agreement with that in Beijing (Fig. 4a1). However, the change in σab,bulk with the development of pollution was different between Changzhou and Beijing (Fig. 4b1). In the clean period, σab,bulk in Changzhou with a value of 2.71 (2.30–3.28) Mm−1 was comparable to that in Beijing with a value of 2.47 (1.65–3.28) Mm−1. In the transitional period, σab,bulk was 4.83 (4.04–6.02) Mm−1 in Changzhou and 5.93 (4.72–7.33) Mm−1 in Beijing. The deviation in σab,bulk was about 1 Mm−1 between Changzhou and Beijing. In the polluted period, σab,bulk was 9.61 (7.99–11.93) Mm−1 in Changzhou and 13.65 (10.94–17.59) Mm−1 in Beijing. The deviation in σab,bulk came to 4 Mm−1 between Changzhou and Beijing. It could be seen that with the development of pollution, the change in σab,bulk in Changzhou was less than that in Beijing. MACbulk, defined as the ratio of median σab,bulk to median meBC,bulk, changed from 6.61 (7.72) m2 g−1 through 6.80 (8.13) m2 g−1 to 7.23 (9.29) m2 g−1 in Changzhou (Beijing). The increase in MACbulk in both Changzhou and Beijing with the aggravation of pollution indicated the aging of BC. MACbulk in Changzhou was overall lower than that in Beijing and increased more slowly than that in Beijing with the development of pollution, indicating that the BC properties and aging process in Changzhou (regional background site) differ from that in Beijing (typical urban site).
in both Changzhou and Beijing increased with the development of pollution, as shown in Fig. 4b2. increased from 0.54 (0.62–1.59) through 0.96 (0.72–1.32) to 1.75 (1.53–2.36) Mm−1 in Changzhou and increased from 0.63 (0.43–0.91) through 1.36 (1.01–1.79) to 3.45 (2.46–5.34) Mm−1 in Beijing. increased by 3.2 (5.5) times in Changzhou (Beijing). The relative increase in was overall consistent with that of σab,bulk in both Changzhou and Beijing. As a result, there was no significant change in with the development of pollution (Fig. 4b3). varied from 19.8 % (15.2 %–23.8 %) through 19.3 % (15.9 %–25.3 %) to 19.6 % (15.5 %–24.5 %) in Changzhou and varied from 27.9 % (20.7 %–36.4 %) through 23.2 % (17.8 %–30.7 %) to 26.7 % (20.4 %–34.7 %) in Changzhou. It could be seen that the increase in in Changzhou was less than that in Beijing with the development of pollution. Specifically, in Beijing was 2.0 times larger than that in Changzhou, showing that the change in with the aggravation of pollution could be different significantly in different sites.
3.3.4 Diurnal cycle
σab,size-resolved exhibited a clear diurnal cycle in both Changzhou (Fig. 5a3) and Beijing (Fig. 5a4) with a lower value of σab,size-resolved during daytime and a higher value during nighttime. Accordingly, σab,bulk had a minimum value of 3.51 (3.16–4.26) Mm−1 at 14:00 and a maximum value of 7.20 (3.80–10.58) Mm−1 at 01:00 in Changzhou (Fig. 5b3). σab,bulk had a minimum value of 3.96 (2.97–9.10) Mm−1 at 14:00 and a maximum value of 7.86 (4.04–13.19) Mm−1 at 00:00 in Beijing (Fig. 5b4), reflecting regulation by the planetary boundary layer. In contrast, in Changzhou (Fig. 5c3) and Beijing (Fig. 5c4) did not exhibit an obvious diurnal cycle. Therefore, , inversely proportional to σab,bulk, had a higher value during daytime and a lower value during nighttime. For Changzhou, reached a maximum at 09:00 with a value of 25.3 % (20.4 %–27.4 %) and came to minimum at 21:00 with a value of 16.6 % (13.0 %–19.6 %) (Fig. 5d3). For Beijing, reached a maximum at 10:00 with a value of 30.4 (21.1 %–36.3 %) and came to minimum at 01:00 with a value of 24.5 % (17.2 %–28.1 %) (Fig. 5d4).
3.4 Direct radiative forcing of equivalent black carbon
3.4.1 Overview
The time series of DRFeBC in Changzhou and Beijing is shown in Fig. S3a1 and S3b1–S3b4, respectively. It can be seen that DRFeBC varied significantly in both Changzhou and Beijing. DRFeBC was estimated to be 0.93 (0.70–1.39) W m−2 in Changzhou and 1.10 (0.65–2.00) W m−2 in Beijing, respectively (Fig. 4c1). The variation in DRFeBC was as large as the median value of DRFeBC, clearly indicating the large variability in the BC radiative effect. DRFeBC increased substantially with the aggravation of pollution (Fig. 4c1). DRFeBC increased from 0.38 (0.38–0.38) through 0.77 (0.70–0.98) to 1.67 (1.29–2.07) W m−2 (by 4.4 times) in Changzhou and from 0.42 (0.33–0.66) through 1.17 (0.79–1.45) to 2.41 (1.68–2.86) W m−2 (by 5.7 times) in Beijing with the development of pollution. A summary of DRFeBC is presented in Table 1.
3.4.2 Contribution of equivalent black carbon-containing particles larger than 700 nm to direct radiative forcing of equivalent black carbon
DRF was estimated to be 0.19 (0.13–0.26) W m−2 in Changzhou and 0.20 (0.13–0.37) W m−2 in Beijing (Fig. 4c2), respectively, which accounted for 20.5 % (18.4 %–22.2 %) and 21.0 (16.3–26.1 %) of DRFeBC (Fig. 4c3), respectively. Therefore, eBC>700 contributed an important portion of the BC radiative effect. With the aggravation of pollution, DRF increased substantially and was different regionally (Fig. 4c2), DRF increased from 0.10 (0.10–0.10) through 0.17 (0.12–0.26) to 0.24 (0.22–0.30) W m−2 (by 2.4 times) in Changzhou and from 0.10 (0.08–0.12) through 0.20 (0.17–0.24) to 0.47 (0.34–0.71) W m−2 (by 4.7 times) in Beijing. The characteristics of with increasing pollution was complicated (Fig. 4c3). varied from 25.0 % (25.0 %–25.0 %) through 21.1 % (20.3 %–22.3 %) to 17.6 % (15.5 %–18.9 %) in Changzhou, exhibiting a decreasing trend. However, varied from 24.4 % (17.4 %–27.7 %) through 18.4 % (15.4 %–24.5 %) to 21.5 % (19.1 %–26.9 %) in Changzhou, without systematical change.
Black carbon (BC) mass size distribution (BCMSD) is an important factor influencing environmental and radiative effect of BC. However, current BCMSD measurements mainly focus on BC-containing particles of less than 700 nm. The characteristics of BC-containing particles of greater than 700 nm (BC>700) have remain uncertain due to technical limitations. In this study, the characteristics of equivalent BC>700 (eBC>700) were measured and studied based on field measurements in eastern China.
Equivalent BCMSD (eBCMSD) was measured from 150 nm up to 1.5 µm with a time resolution of 1 h based on the method proposed by Zhao et al. (2022), where eBCMSD was determined by an aerodynamic aerosol classifier (AAC) in tandem with a model AE33 aethalometer (AAC-AE33), and size-resolved particle number concentration was measured concurrently to model the influence of particle size on mass absorption cross section (Zhao et al., 2021). AAC-AE33 was applied to two field measurements in eastern China, namely Changzhou, located on the Yangtze River Delta from 17 May to 3 June 2021, and Beijing, located on the North China Plain from 29 October 2021 to 26 January 2022. Changzhou was a regional background site and Beijing was a typical urban site. The direct radiative forcing of eBC (DRFeBC) was estimated using the Santa Barbara DISORT (discrete ordinates radiative transfer) atmospheric radiative transfer (SBDART) model (Ricchiazzi et al., 1998).
eBCMSD was different between Changzhou and Beijing. Campaign-averaged eBCMSD in Changzhou exhibited two modes, peaking at 240 and 1249 nm, respectively. In contrast, campaign-averaged eBCMSD in Beijing exhibited one mode, peaking at 427 nm. eBC>700 was ubiquitous in both Changzhou and Beijing. The campaign-averaged mass, absorption and radiative contribution of eBC>700 to bulk eBC mass concentration (meBC,bulk), bulk absorption coefficient (σab,bulk) and DRFeBC in Changzhou and Beijing were 27.8 % (20.9 %–36.5 %) and 24.1 % (17.5 %–34.2 %), 19.6 % (15.8 %–24.6 %) and 25.9 % (19.6 %–33.7 %) and 20.5 % (18.4 %–22.2 %) and 21.0 % (16.3 %–26.1 %), respectively, reflecting the important role of eBC>700 in the environment and climate. Both eBCMSD and the size-resolved absorption coefficient (σab,size-resolved) exhibited diurnal variations, with a lower value during the daytime and a higher value during the nighttime in both Changzhou and Beijing.
With the aggravation of pollution, the evolution of eBCMSD and σab,size-resolved in Changzhou was significantly different from that in Beijing. The peak diameter of eBCMSD shifted from 240 (347) to 289 (527) nm in Changzhou (Beijing) and the peak diameter of σab,size-resolved shifted from 416 (427) to 416 (527) nm in Changzhou (Beijing), indicating that the aging process at the regional background site was distinct from that at the urban site. The value of both eBCMSD and σab,size-resolved increased with the development of pollution in both Changzhou and Beijing. Accordingly, meBC,bulk, σab,bulk and DRFeBC in Changzhou (Beijing) increased by 3.2 (4.6), 3.5 (5.5) and 4.4 (5.7) times, respectively. meBC,bulk, σab,bulk and DRFeBC of eBC>700 in Changzhou (Beijing) increased by 3.6 (5.1), 3.2 (5.5) and 2.4 (4.7) times, respectively, clearly showing the large variation in eBC>700. The case study showed that the contribution of eBC>700 to meBC,bulk, σab,bulk and DRFeBC could increase from 20 % to 50 %, from about 20 % to 50 % and from 20 % to 40 %, respectively. Therefore, BC>700 is an important part of BC-containing particles and it is highly recommended to take BC>700 into account in both BC field measurements and model evaluation of BC climate effects.
The code and measurement data used in this study are available upon request to the authors. The data used in this study are also available online at: https://pan.baidu.com/s/1IE2lyPg0vb8O_GPTl-dSog?pwd=pzi8&_at_=1700667424889#list/path=_dataForACP (login required; Zhao, 2023).
The supplement related to this article is available online at: https://doi.org/10.5194/acp-23-14889-2023-supplement.
CZ determined the main goal of this study. WZ carried experiments out and prepared the paper with contributions from all co-authors.
The contact author has declared that none of the authors has any competing interests.
Publisher’s note: Copernicus Publications remains neutral with regard to jurisdictional claims made in the text, published maps, institutional affiliations, or any other geographical representation in this paper. While Copernicus Publications makes every effort to include appropriate place names, the final responsibility lies with the authors.
This research has been supported by the National Natural Science Foundation of China (grant no. 42275070).
This paper was edited by Stefania Gilardoni and reviewed by two anonymous referees.
Artaxo, P., Fernandes, E. T., Martins, J. V., Yamasoe, M. A., Hobbs, P. V., Maenhaut, W., Longo, K. M., and Castanho, A.: Large-scale aerosol source apportionment in Amazonia, J. Geophys. Res.-Atmos., 103, 31837–31847, https://doi.org/10.1029/98jd02346, 1998.
Berner, A., Reischl, G., and Puxbaum, H.: Size distribution of traffic derived aerosols, Sci. Total Environ., 36, 299–303, https://doi.org/10.1016/0048-9697(84)90280-8, 1984.
Bond, T. C.: Spectral dependence of visible light absorption by carbonaceous particles emitted from coal combustion, Geophys. Res. Lett., 28, 4075–4078, https://doi.org/10.1029/2001gl013652, 2001.
Bond, T. C. and Bergstrom, R. W.: Light absorption by carbonaceous particles: An investigative review, Aerosol Sci. Tech., 40, 27–67, https://doi.org/10.1080/02786820500421521, 2006.
Bond, T. C., Streets, D. G., Yarber, K. F., Nelson, S. M., Woo, J. H., and Klimont, Z.: A technology-based global inventory of black and organic carbon emissions from combustion, J. Geophys. Res.-Atmos., 109, D14203, https://doi.org/10.1029/2003jd003697, 2004.
Bond, T. C., Doherty, S. J., Fahey, D. W., Forster, P. M., Berntsen, T., DeAngelo, B. J., Flanner, M. G., Ghan, S., Karcher, B., Koch, D., Kinne, S., Kondo, Y., Quinn, P. K., Sarofim, M. C., Schultz, M. G., Schulz, M., Venkataraman, C., Zhang, H., Zhang, S., Bellouin, N., Guttikunda, S. K., Hopke, P. K., Jacobson, M. Z., Kaiser, J. W., Klimont, Z., Lohmann, U., Schwarz, J. P., Shindell, D., Storelvmo, T., Warren, S. G., and Zender, C. S.: Bounding the role of black carbon in the climate system: A scientific assessment, J. Geophys. Res.-Atmos., 118, 5380–5552, https://doi.org/10.1002/jgrd.50171, 2013.
Chakrabarty, R. K., Beres, N. D., Moosmuller, H., China, S., Mazzoleni, C., Dubey, M. K., Liu, L., and Mishchenko, M. I.: Soot superaggregates from flaming wildfires and their direct radiative forcing, Sci. Rep.-UK, 4, 5508, https://doi.org/10.1038/srep05508, 2014.
Chow, J. C., Watson, J. G., Crow, D., Lowenthal, D. H., and Merrifield, T.: Comparison of IMPROVE and NIOSH Carbon Measurements, Aerosol Sci. Tech., 34, 23–34, https://doi.org/10.1080/02786820119073, 2001.
Drinovec, L., Močnik, G., Zotter, P., Prévôt, A. S. H., Ruckstuhl, C., Coz, E., Rupakheti, M., Sciare, J., Müller, T., Wiedensohler, A., and Hansen, A. D. A.: The “dual-spot” Aethalometer: an improved measurement of aerosol black carbon with real-time loading compensation, Atmos. Meas. Tech., 8, 1965–1979, https://doi.org/10.5194/amt-8-1965-2015, 2015.
Fuller, K. A., Malm, W. C., and Kreidenweis, S. M.: Effects of mixing on extinction by carbonaceous particles, J. Geophys. Res.-Atmos., 104, 15941–15954, https://doi.org/10.1029/1998jd100069, 1999.
Guo, Y. H.: Characteristics of size-segregated carbonaceous aerosols in the Beijing-Tianjin-Hebei region, Environ. Sci. Pollut. R., 23, 13918–13930, https://doi.org/10.1007/s11356-016-6538-z, 2016.
Hansen, A. D. A., Rosen, H., and Novakov, T.: The aethalometer - an instrument for the real-time measurement of optical-absorption by aerosol-particles, Sci. Total Environ., 36, 191–196, https://doi.org/10.1016/0048-9697(84)90265-1, 1984.
Johnson, T. J., Irwin, M., Symonds, J. P. R., Olfert, J. S., and Boies, A. M.: Measuring aerosol size distributions with the aerodynamic aerosol classifier, Aerosol Sci. Tech., 52, 655–665, https://doi.org/10.1080/02786826.2018.1440063, 2018.
Kuang, Y., Zhao, C. S., Tao, J. C., and Ma, N.: Diurnal variations of aerosol optical properties in the North China Plain and their influences on the estimates of direct aerosol radiative effect, Atmos. Chem. Phys., 15, 5761–5772, https://doi.org/10.5194/acp-15-5761-2015, 2015.
Liu, D., Joshi, R., Wang, J., Yu, C., Allan, J. D., Coe, H., Flynn, M. J., Xie, C., Lee, J., Squires, F., Kotthaus, S., Grimmond, S., Ge, X., Sun, Y., and Fu, P.: Contrasting physical properties of black carbon in urban Beijing between winter and summer, Atmos. Chem. Phys., 19, 6749–6769, https://doi.org/10.5194/acp-19-6749-2019, 2019.
Liu, D. T., Whitehead, J., Alfarra, M. R., Reyes-Villegas, E., Spracklen, D. V., Reddington, C. L., Kong, S. F., Williams, P. I., Ting, Y. C., Haslett, S., Taylor, J. W., Flynn, M. J., Morgan, W. T., McFiggans, G., Coe, H., and Allan, J. D.: Black-carbon absorption enhancement in the atmosphere determined by particle mixing state, Nat. Geosci., 10, 184–188, https://doi.org/10.1038/ngeo2901, 2017.
Liu, P. F., Zhao, C. S., Zhang, Q., Deng, Z. Z., Huang, M. Y., Ma, X. C., and Tie, X. X.: Aircraft study of aerosol vertical distributions over Beijing and their optical properties, Tellus B, 61, 756–767, https://doi.org/10.1111/j.1600-0889.2009.00440.x, 2009.
Ma, N., Zhao, C. S., Müller, T., Cheng, Y. F., Liu, P. F., Deng, Z. Z., Xu, W. Y., Ran, L., Nekat, B., van Pinxteren, D., Gnauk, T., Müller, K., Herrmann, H., Yan, P., Zhou, X. J., and Wiedensohler, A.: A new method to determine the mixing state of light absorbing carbonaceous using the measured aerosol optical properties and number size distributions, Atmos. Chem. Phys., 12, 2381–2397, https://doi.org/10.5194/acp-12-2381-2012, 2012.
Matsui, H., Hamilton, D. S., and Mahowald, N. M.: Black carbon radiative effects highly sensitive to emitted particle size when resolving mixing-state diversity, Nat. Commun., 9, 3446, https://doi.org/10.1038/s41467-018-05635-1, 2018.
Moosmuller, H., Chakrabarty, R. K., and Arnott, W. P.: Aerosol light absorption and its measurement: A review, J. Quant. Spectrosc. Ra., 110, 844–878, https://doi.org/10.1016/j.jqsrt.2009.02.035, 2009.
Peng, J. F., Hu, M., Guo, S., Du, Z. F., Zheng, J., Shang, D. J., Zamora, M. L., Zeng, L. M., Shao, M., Wu, Y. S., Zheng, J., Wang, Y., Glen, C. R., Collins, D. R., Molina, M. J., and Zhang, R. Y.: Markedly enhanced absorption and direct radiative forcing of black carbon under polluted urban environments, P. Natl. Acad. Sci. USA, 113, 4266-4271, https://doi.org/10.1073/pnas.1602310113, 2016.
Petters, M. D. and Kreidenweis, S. M.: A single parameter representation of hygroscopic growth and cloud condensation nucleus activity, Atmos. Chem. Phys., 7, 1961–1971, https://doi.org/10.5194/acp-7-1961-2007, 2007.
Petzold, A., Ogren, J. A., Fiebig, M., Laj, P., Li, S.-M., Baltensperger, U., Holzer-Popp, T., Kinne, S., Pappalardo, G., Sugimoto, N., Wehrli, C., Wiedensohler, A., and Zhang, X.-Y.: Recommendations for reporting “black carbon” measurements, Atmos. Chem. Phys., 13, 8365–8379, https://doi.org/10.5194/acp-13-8365-2013, 2013.
Ramachandran, S. and Rajesh, T. A.: Black carbon aerosol mass concentrations over Ahmedabad, an urban location in western India: Comparison with urban sites in Asia, Europe, Canada, and the United States, J. Geophys. Res.-Atmos., 112, D06211, https://doi.org/10.1029/2006jd007488, 2007.
Ricchiazzi, P., Yang, S. R., Gautier, C., and Sowle, D.: SBDART: A research and teaching software tool for plane-parallell radiative transfer in the Earth's atmosphere, B. Am. Meteorol. Soc., 79, 2101–2114, https://doi.org/10.1175/1520-0477(1998)079<2101:SARATS>2.0.CO;2, 1998.
Schwarz, J. P., Gao, R. S., Fahey, D. W., Thomson, D. S., Watts, L. A., Wilson, J. C., Reeves, J. M., Darbeheshti, M., Baumgardner, D. G., Kok, G. L., Chung, S. H., Schulz, M., Hendricks, J., Lauer, A., Karcher, B., Slowik, J. G., Rosenlof, K. H., Thompson, T. L., Langford, A. O., Loewenstein, M., and Aikin, K. C.: Single-particle measurements of midlatitude black carbon and light-scattering aerosols from the boundary layer to the lower stratosphere, J. Geophys. Res.-Atmos., 111, D16207, https://doi.org/10.1029/2006JD007076, 2006.
Schwarz, J. P., Spackman, J. R., Fahey, D. W., Gao, R. S., Lohmann, U., Stier, P., Watts, L. A., Thomson, D. S., Lack, D. A., Pfister, L., Mahoney, M. J., Baumgardner, D., Wilson, J. C., and Reeves, J. M.: Coatings and their enhancement of black carbon light absorption in the tropical atmosphere, J. Geophys. Res.-Atmos., 113, D03203, https://doi.org/10.1029/2007JD009042, 2008.
Szopa, S., Naik, V., Adhikary, B., Artaxo, P., Berntsen, T., Collins, W. D., Fuzzi, S., Gallardo, L., Kiendler Scharr, A., Klimont, Z., Liao, H., Unger, N., and Zanis, P.: Short-Lived Climate Forcers, in: Climate Change 2021: The Physical Science Basis. Contribution of Working Group I to the Sixth Assessment Report of the Intergovernmental Panel on Climate Change, edited by: Masson-Delmotte, V., Zhai, P., Pirani, A., Connors, S. L., Péan, C., Berger, S., Caud, N., Chen, Y., Goldfarb, L., Gomis, M. I., Huang, M., Leitzell, K., Lonnoy, E., Matthews, J. B. R., Maycock, T. K., Waterfield, T., Yelekçi, O., Yu, R., and Zhou, B., Cambridge University Press, Cambridge, United Kingdom and New York, NY, USA, https://doi.org/10.1017/9781009157896, 2021.
Tan, W., Zhao, G., Yu, Y., Li, C., Li, J., Kang, L., Zhu, T., and Zhao, C.: Method to retrieve cloud condensation nuclei number concentrations using lidar measurements, Atmos. Meas. Tech., 12, 3825–3839, https://doi.org/10.5194/amt-12-3825-2019, 2019.
Tavakoli, F. and Olfert, J. S.: An Instrument for the Classification of Aerosols by Particle Relaxation Time: Theoretical Models of the Aerodynamic Aerosol Classifier, Aerosol Sci. Tech., 47, 916–926, https://doi.org/10.1080/02786826.2013.802761, 2013.
Wang, H. L., An, J. L., Zhu, B., Shen, L. J., Duan, Q., and Shi, Y. Z.: Characteristics of Carbonaceous Aerosol in a Typical Industrial City-Nanjing in Yangtze River Delta, China: Size Distributions, Seasonal Variations, and Sources, Atmosphere, 8, 73, https://doi.org/10.3390/atmos8040073, 2017.
Wang, J. D., Wang, S. X., Wang, J. P., Hua, Y., Liu, C., Cai, J., Xu, Q. C., Xu, X. T., Jiang, S. Y., Zheng, G. J., Jiang, J. K., Cai, R. L., Zhou, W., Chen, G. Z., Jin, Y. Z., Zhang, Q., and Hao, J. M.: Significant Contribution of Coarse Black Carbon Particles to Light Absorption in North China Plain, Environ. Sci. Technol. Lett., 9, 134–139, https://doi.org/10.1021/acs.estlett.1c00953, 2022.
Wex, H., Neususs, C., Wendisch, M., Stratmann, F., Koziar, C., Keil, A., Wiedensohler, A., and Ebert, M.: Particle scattering, backscattering, and absorption coefficients: An in situ closure and sensitivity study, J. Geophys. Res.-Atmos., 107, 8122, https://doi.org/10.1029/2000jd000234, 2002.
Yu, H., Wu, C., Wu, D., and Yu, J. Z.: Size distributions of elemental carbon and its contribution to light extinction in urban and rural locations in the pearl river delta region, China, Atmos. Chem. Phys., 10, 5107–5119, https://doi.org/10.5194/acp-10-5107-2010, 2010.
Zhang, R. Y., Khalizov, A. F., Pagels, J., Zhang, D., Xue, H. X., and McMurry, P. H.: Variability in morphology, hygroscopicity, and optical properties of soot aerosols during atmospheric processing, P. Natl. Acad. Sci. USA, 105, 10291–10296, https://doi.org/10.1073/pnas.0804860105, 2008.
Zhao, G., Zhao, C., Kuang, Y., Bian, Y., Tao, J., Shen, C., and Yu, Y.: Calculating the aerosol asymmetry factor based on measurements from the humidified nephelometer system, Atmos. Chem. Phys., 18, 9049–9060, https://doi.org/10.5194/acp-18-9049-2018, 2018.
Zhao, G., Tao, J., Kuang, Y., Shen, C., Yu, Y., and Zhao, C.: Role of black carbon mass size distribution in the direct aerosol radiative forcing, Atmos. Chem. Phys., 19, 13175–13188, https://doi.org/10.5194/acp-19-13175-2019, 2019.
Zhao, G., Yu, Y., Tian, P., Li, J., Guo, S., and Zhao, C.: Evaluation and Correction of the Ambient Particle Spectral Light Absorption Measured Using a Filter-based Aethalometer, Aerosol Air Qual. Res., 20, 1833–1841, https://doi.org/10.4209/aaqr.2019.10.0500, 2020.
Zhao, W.: Measurement data of equivalent black carbon mass size distribution larger than 700 nm, pan.baidu [data set], https://pan.baidu.com/s/1IE2lyPg0vb8O_GPTl-dSog?pwd=pzi8&_at_=1700667424889#list/path=%2FdataForACP, last access: 22 November 2023.
Zhao, W., Tan, W., Zhao, G., Shen, C., Yu, Y., and Zhao, C.: Determination of equivalent black carbon mass concentration from aerosol light absorption using variable mass absorption cross section, Atmos. Meas. Tech., 14, 1319–1331, https://doi.org/10.5194/amt-14-1319-2021, 2021.
Zhao, W., Zhao, G., Li, Y., Guo, S., Ma, N., Tang, L., Zhang, Z., and Zhao, C.: New method to determine black carbon mass size distribution, Atmos. Meas. Tech., 15, 6807–6817, https://doi.org/10.5194/amt-15-6807-2022, 2022.