the Creative Commons Attribution 4.0 License.
the Creative Commons Attribution 4.0 License.
 | 06 Jan 2020
Spatial and temporal variability in the ice-nucleating ability of alpine snowmelt and extension to frozen cloud fraction
Killian P. Brennan
Robert O. David
Nadine Borduas-Dedekind
Ice-nucleating particles (INPs) produce ice from supercooled water droplets through heterogeneous freezing in the atmosphere. INPs have often been collected at the Jungfraujoch research station (at 3500 m a.s.l.) in central Switzerland; yet spatially diverse data on INP occurrence in the Swiss Alps are scarce and remain uncharacterized. We address this scarcity through our Swiss alpine snow sample study which took place during the winter of 2018. We collected a total of 88 fallen snow samples across the Alps at 17 different locations and investigated the impact of altitude, terrain, time since last snowfall and depth upon freezing temperatures. The INP concentrations were measured using the home-built DRoplet Ice Nuclei Counter Zurich (DRINCZ) and were then compared to spatial, temporal and physicochemical parameters. Boxplots of the freezing temperatures showed large variability in INP occurrence, even for samples collected 10 m apart on a plain and 1 m apart in depth. Furthermore, undiluted samples had cumulative INP concentrations ranging between 1 and 200 INP mL−1 of snowmelt over a temperature range of −5 to −19 ∘C. From this field-collected dataset, we parameterized the cumulative INP concentrations per cubic meter of air as a function of temperature with the following equation , comparing well with previously reported precipitation data presented in Petters and Wright (2015).
When assuming (1) a snow precipitation origin of the INPs, (2) a cloud water content of 0.4 g m−3 and (3) a critical INP concentration for glaciation of 10 m−3, the majority of the snow precipitated from clouds with glaciation temperatures between −5 and −20 ∘C. Based on the observed variability in INP concentrations, we conclude that studies conducted at the high-altitude research station Jungfraujoch are representative for INP measurements in the Swiss Alps. Furthermore, the INP concentration estimates in precipitation allow us to extrapolate the concentrations to a frozen cloud fraction. Indeed, this approach for estimating the liquid water-to-ice ratio in mixed-phase clouds compares well with aircraft measurements, ground-based lidar and satellite retrievals of frozen cloud fractions. In all, the generated parameterization for INP concentrations in snowmelt could help estimate cloud glaciation temperatures.
- Article
(1541 KB) -
Supplement
(1171 KB) - BibTeX
- EndNote


The supercooled liquid water-to-ice ratio significantly alters the radiative and dynamic properties of mixed-phase clouds. The abundance of ice crystals in a cloud can influence its optical transmissivity and reflectivity, as well as affect the formation of precipitation (Matus and L'Ecuyer, 2017; Mülmenstädt et al., 2015; Prenni et al., 2007; Vergara-Temprado et al., 2018). Homogenous freezing of cloud droplets only occurs at temperatures below −38 ∘C (Koop, 2004; Pruppacher and Klett, 2010; Stöckel et al., 2005), yet heterogeneous nucleation which involves the presence of ice-nucleating particles (INPs) can occur at warmer temperatures (Fletcher, 1962; Pruppacher and Klett, 2010; Vali et al., 2015). Aerosol–cloud interactions, including INP–cloud interactions, currently contribute to the largest uncertainty in total anthropogenic radiative forcing in global climate models (Boucher and Quaas, 2013) and hence constraining INP concentrations and better predicting the liquid water-to-ice ratio could help reduce this uncertainty. Indeed, a growing number of INP parameterizations are helping to better constrain and predict INP concentrations as a function of temperature (DeMott et al., 2010; Petters and Wright, 2015; Phillips et al., 2008, 2012), surface area (Niemand et al., 2012) or organic carbon (Borduas-Dedekind et al., 2019; Wilson et al., 2015).
Mixed-phase clouds are responsible for the majority of precipitation over land (Hande and Hoose, 2017; Henneberg et al., 2017; Mülmenstädt et al., 2015; Murray et al., 2012) through immersion freezing, defined by the freezing of cloud droplets due to the presence of an immersed INP (de Boer et al., 2011). As the majority of ice precipitation in mixed-phase clouds is initiated via immersion freezing, the composition (de Boer et al., 2011), abundance and sources of INPs responsible for the precipitation can be obtained through the analysis of precipitation samples (Fan et al., 2018; Morris et al., 2014; Petters and Wright, 2015; Stopelli et al., 2015; Wright et al., 2014). Indeed, INP concentrations have been measured in precipitation samples such as rain, snow, hail, and sleet and have been recently revisited to obtain a representative INP concentration range for different temperatures (Petters and Wright, 2015). Examples of precipitation samples with ice-nucleating activity have been collected in the US (Failor et al., 2017; Hader et al., 2014; Hill et al., 2014; Petters and Wright, 2015; Wright et al., 2014), Canada (Rangel-Alvarado et al., 2019; Vali, 1966, 1971a), France (Joly et al., 2014), Switzerland (Creamean et al., 2019; Stopelli et al., 2014, 2017) and Israel (Zipori et al., 2018). Furthermore, geographically diverse precipitation samples have shown consistent immersion freezing activity due to biological material (Christner et al., 2008a, b). These field studies highlight the ubiquitous presence of INPs in precipitation while simultaneously emphasizing high variability in INP concentrations.
Meanwhile, studies conducted in the laboratory to further understand heterogeneous ice nucleation have found mineral dust, metallic oxides and biological material to be efficient INPs (Hoose and Moehler, 2012; Kanji et al., 2017). Efficient INPs may also originate from extracts of plant-based material, including proteinaceous material and polysaccharides (Augustin et al., 2013; Dreischmeier et al., 2017; Koop and Zobrist, 2009; Pummer et al., 2012, 2015; Wilson et al., 2015). In addition, organic matter may also act as INPs in the immersion freezing mode (Borduas-Dedekind et al., 2019; Hill et al., 2016; Hiranuma et al., 2015; Irish et al., 2019; Knackstedt et al., 2018; Knopf et al., 2018; Wilson et al., 2015).
Field measurements of INPs in the Swiss Alps are largely bound to the high-altitude research station Jungfraujoch (Boose et al., 2016; Chou et al., 2011; Conen et al., 2012, 2017; Ehrman et al., 2001; Farrington et al., 2016; Hammer et al., 2018; Lacher et al., 2017, 2018a, b; Lloyd et al., 2015; Meola et al., 2015; Mertes et al., 2007; Nillius et al., 2013; Stopelli et al., 2016, 2017). Due to its common free-tropospheric conditions, measurements of INPs at Jungfraujoch can be representative of INP concentrations globally. However, the impact of local sources and INPs present in the boundary layer cannot be ascertained. Therefore, to determine the representativeness of free-tropospheric INP measurements across the Swiss Alps, geographically diverse sampling sites are required.
Thus, the first purpose of this study was to determine the heterogeneity of INP occurrence in the Swiss Alps and to investigate its correlation with various physicochemical properties and sampling site characteristics. A total of 88 snow samples were collected using sterile Teflon tubes in the winter of 2018 across 17 locations on 15 different days spanning an approximate area of 35 752 km2 in the Swiss Alps. INPs in the snowmelt were measured in the immersion freezing mode using the DRoplet Ice Nuclei Counter Zurich (DRINCZ) (David et al., 2019). The ability of the snowmelt to freeze is reported as 96 freezing temperatures in one-dimensional boxplots. Furthermore, this study investigates INP occurrence by location, time, altitude, snow depth, snow age, total organic carbon, conductivity and size. We further propose a parameterization of INP as a function of temperature to complement the dataset from Petters and Wright (2015).
The second purpose of this study was to extrapolate our measured INP concentrations to frozen cloud fractions within mixed-phase clouds over the Swiss Alps. The first assumption is that the INPs quantified originated solely from precipitation without contributions from dry deposition. We then assumed a cloud water content of 0.4 g m−3 (Petters and Wright, 2015) to determine the cumulative concentration of INPs in air and subsequently assumed a critical number of INPs for cloud glaciation, ranging between 10 and 1000 m−3. From this information, glaciation temperatures of mixed-phase clouds and supercooled liquid water-to-ice ratio were estimated. Finally, we discuss the limitations of our approach for arriving at frozen cloud fractions as well as compare our results with aircraft measurements, ground-based lidar measurements, satellite retrievals and global circulation models (McCoy et al., 2016).
Table 1List of dates, sites (latitude and longitude), altitude, location including the Swiss canton and number (n) of samples collected, during this Swiss alpine snow sample study. Additional details with recorded parameters for each sample are available in the Supplement. See Fig. S5 for selected images of the different sites.
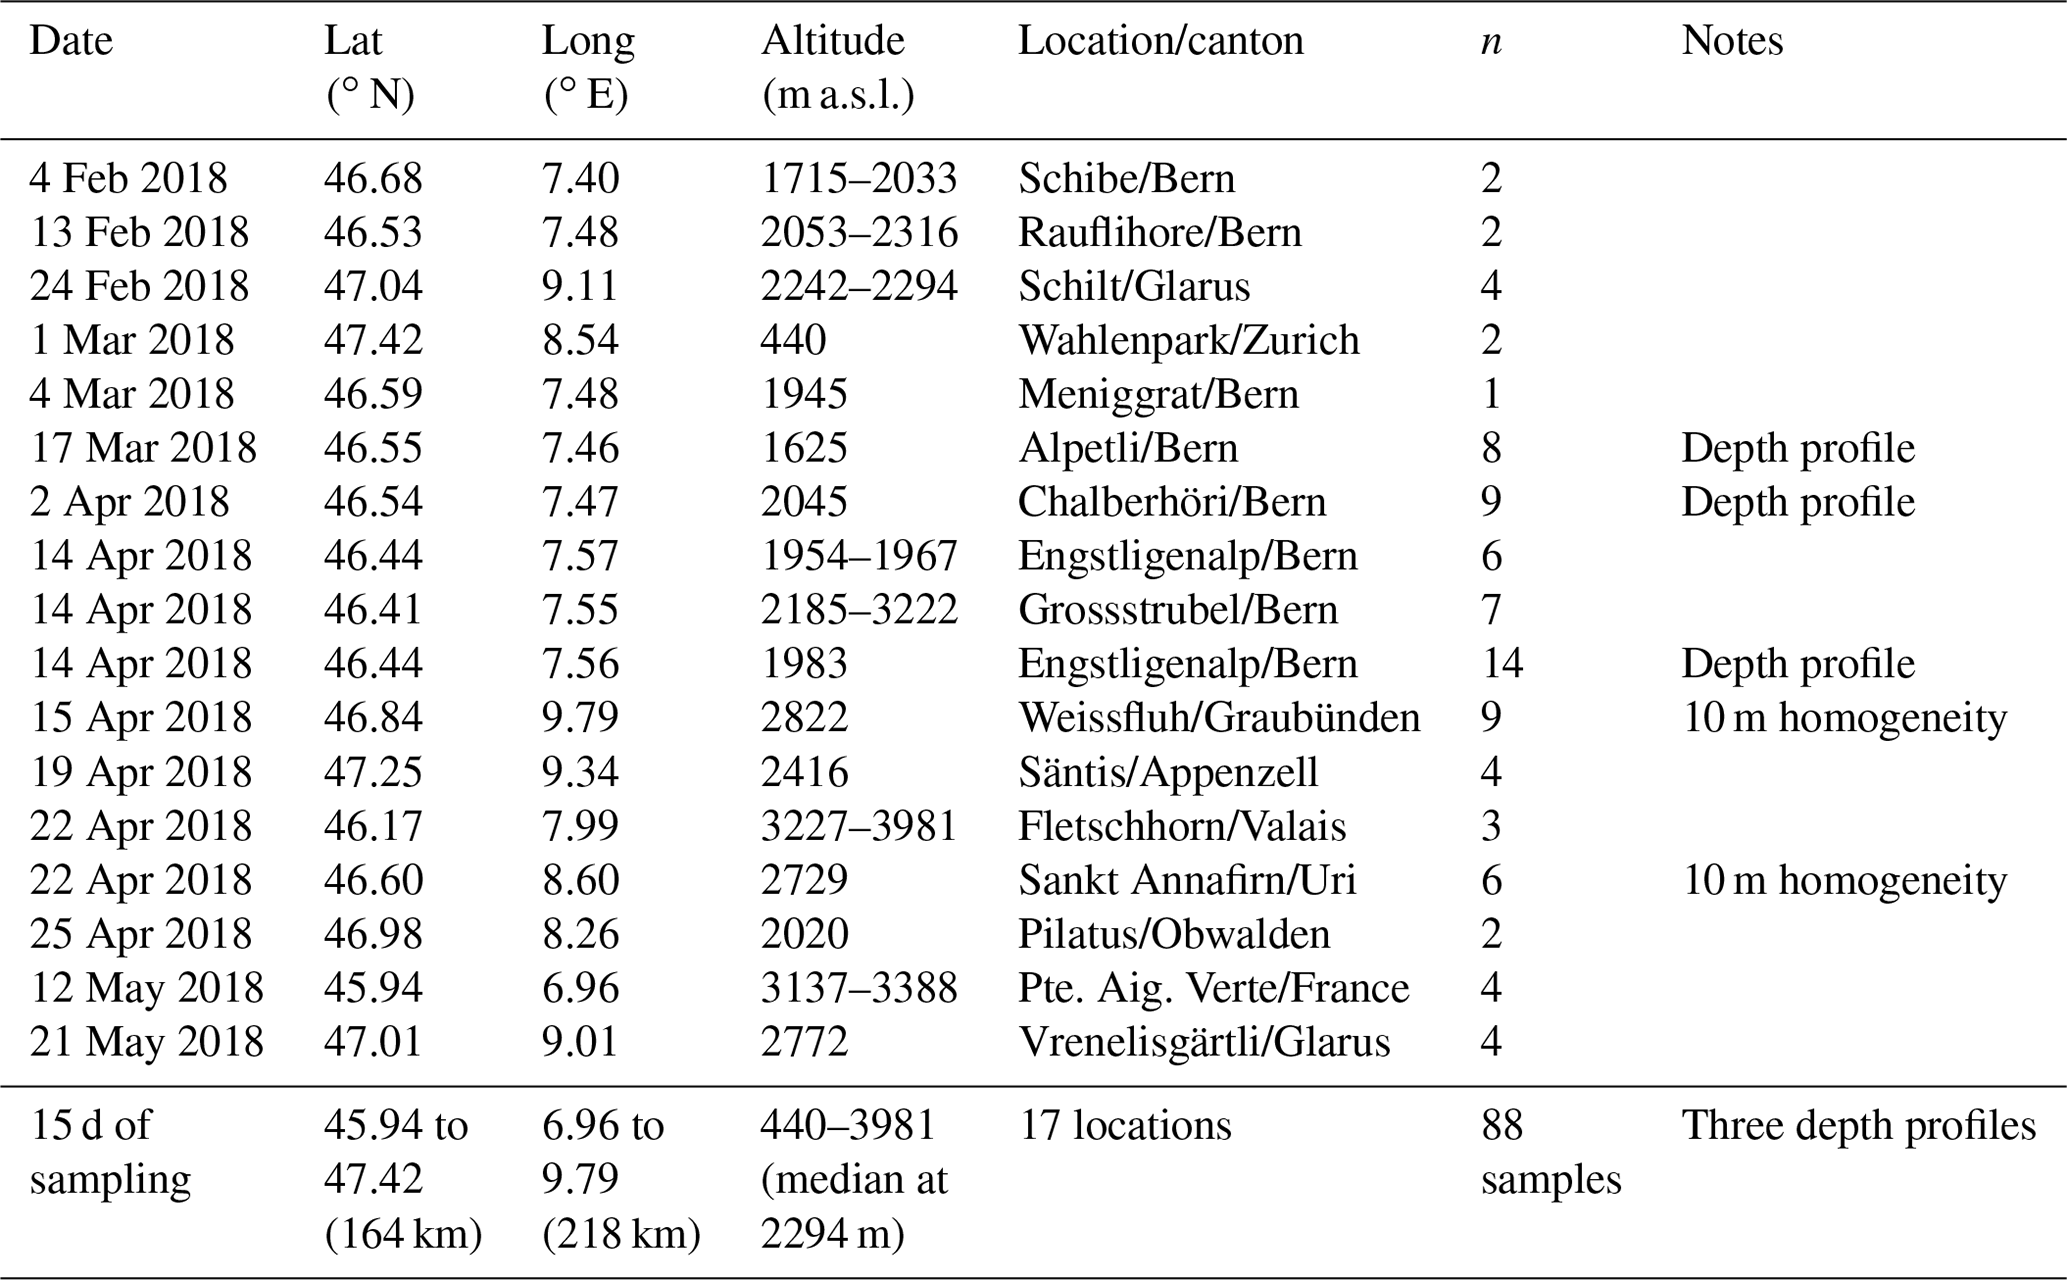

Figure 1Map of all sampling sites (colored dots) within the Swiss border (white outline). The circled sites are within the canton of Bern and include Schibe, Rauflihore, Meniggrat, Alpetli, Chalberhöri, Engstligenalp and Grossstrubel. The high-altitude alpine research station Jungfraujoch is identified with a star for reference, although no snowmelt was collected at that site. The respective altitudes of the sampling sites are shown on the color bar to the right, scattered in the x direction to avoid overlapping of points. The terrain elevation is greyscale shaded according to a digital elevation model produced using Copernicus data and information funded by the European Union – EU-DEM layers (European Environment Agency, 2018). See Fig. S5 for selected images of the sites.
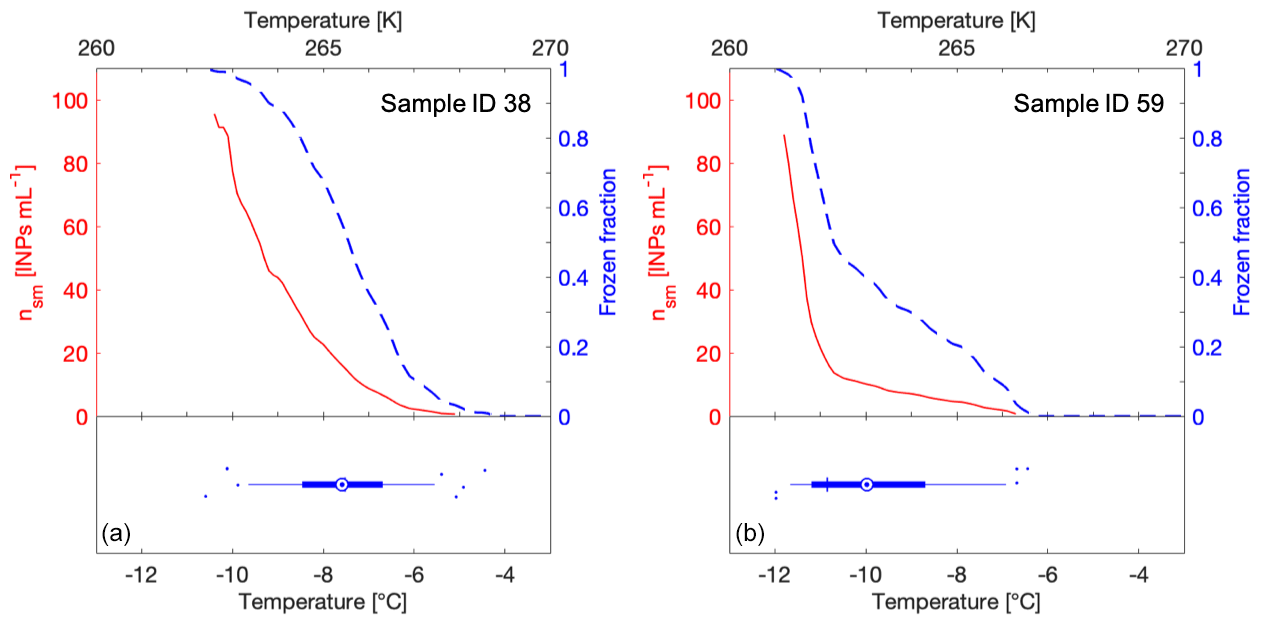
Figure 2Examples of FF curves (blue y axis), freezing temperature boxplots (bottom of the graphs) and INP concentrations (nsm) (red y axis) generated for two snowmelt samples (from sample 38 and from sample 59; see Table S1). In the boxplot, the thin blue vertical line shows the median and is equal to T50, the mean is shown as a blue circle with a concentric dot. The blue box ranges from the 25th to the 75th percentiles, whereas the whiskers extend from the 5th to the 95th percentiles. Outliers are drawn as blue dots and scattered vertically to avoid overlapping. Panel (a) shows a linear FF curve with overlapping T50 and median values in the boxplot, whereas panel (b) shows a FF curve with a kink with T50 and median values differing by at least 1 ∘C.
2.1 Sampling sites
Snow sampling locations were selected to provide a breadth of elevation, terrain type, distances from Jungfraujoch and snow age during one winter season to represent conditions in the Swiss alpine area during the winter of 2018 (Fig. 1). The campaign took place between February and May 2018 and the sites were accessed by ski or by alpinism. All samples were taken from undisturbed top layer snow, unless it was a depth profile. Specifically, 17 sites throughout the Swiss Alps were chosen (Tables 1 and S1 in the Supplement). Two of these sites were within the boundaries of two different ski resorts, Davos (Weissfluh) and Andermatt (Sankt Annafirn). Considering the altitudes at which these samples where obtained as well as an absence of operating snow canons during the sampling days, we expect to not have sampled any artificial snow. The coordinates of the sampling sites were measured using the GPS on a smartphone, and span an area of 218 km from east to west and 164 km from north to south to cover an approximate area of 35 752 km2. The altitudes of the sampling sites ranged from 440 to 3981 m a.s.l. (above sea level) with a median value of 2294 m a.s.l. (Fig. 1) and therefore cover a wide range of altitudes within the Alps according to the Bundesamt für Landestopografie swisstopo (2018). Based on the date and time of sampling, snow age representing the time span between the snowfall event and the sampling instance was determined by using the snowpack database (Institut für Schnee- und Lawinenforschung, SLF, 2018). More specifically, we used the snowfall history at the SLF measurement station closest to the sampling site, typically within a few kilometers and at most within 10 km. Exceptionally for Pilatus, the closest SLF station was within 25 km due to fewer stations in the Luzern region.
2.2 Sampling procedure
Previously reported snow collection procedures for INP studies have involved a Teflon-coated tray put in place before snowfall (Stopelli et al., 2017). This method is convenient and adequate for alpine research stations where appropriate accommodation is available. However, to assess the heterogeneity of INPs in the Alps, we needed to access remote locations. Collecting snow samples from the top of the snowpack allows sampling in multiple locations compared to other precipitation collection procedures, such as rainfall collection, which require sampling site infrastructure. Through ski-touring and alpine mountaineering, we accessed 17 different locations for one-time snow sampling. Indeed, no infrastructure was necessary and remote locations as high as 3981 m a.s.l. could be uniquely accessed.
Snow samples were collected in sterile 50 mL polypropylene conical centrifuge tubes (Techno Plastic Products AG, Switzerland) without pre-treatment. In fact, preliminary pre-treatment testing showed physical degradation of the polypropylene material under heated conditions (125 ∘C in an oven) and when washed with organic solvents such as acetone and ethanol (Fig. S1 in the Supplement). For every Techno Plastic Products tube batch, a tube was filled with 20 mL of molecular biology reagent water (89079-460, Sigma Aldrich, USA) and placed in a freezer at −20 ∘C (untreated tube samples in Fig. S1). These reference water samples were later measured alongside the snow samples to generate background water values for measurement comparison. The exact collection procedure for gathering snow samples is described step by step in the Supplement. Briefly, the collection was performed by a skier or an alpinist wearing nitrile gloves and they ensured that only the tubes came in contact with the snow. The snow was inertially compacted and the tubes were sealed. After collection, the snow samples were kept as cold as possible until the return to the laboratory, during which some of the snow did melt. Nonetheless, refreezing experiments suggested little difference in frozen fraction (see Fig. 3), allowing us to conclude minimal sample degradation during transport. Since three of the collected 88 snowmelt samples had freezing temperature distributions at the water background of DRINCZ (Fig. S2), we can suggest that no to little contamination could have been introduced during the snow sampling.

Figure 3Refreezing and triplicate data at different locations show that the variability is within the instrument error of 0.9 ∘C. The standard deviation of the refreezings (±0.47 ∘C) is comparable to the standard deviation of the triplicates (±0.28 ∘C). In the boxplots, the blue vertical line shows the median and is equal to T50. The mean is shown as a blue circle with a concentric dot and the box ranges from the 25th to the 75th percentiles. The whiskers extend from the 5th to the 95th percentiles.
Snow depth profiles were dug with an aluminum avalanche rescue shovel and were dug until the underlaying dirt or rock surface was reached (see Fig. 10 for a site photo). The side of the freshly dug hole was then scraped with the shovel to expose untouched snow at all depths and to remove possible cross-contamination from the ground during the digging process. The depths of the samples collected within the snowpack were determined with a graduated avalanche rescue probe (Mammut AG, Switzerland). Sample depths were distributed throughout the snowpack depending on the number of sampling tubes available on the specific trip.
2.3 Immersion freezing experiments and data analysis with DRINCZ
The DRoplet Ice Nuclei Counter Zurich (DRINCZ) technique used in this study, as well as the data processing and analysis are described in depth by David et al. (2019). Additional information on the immersion freezing experimental details and on the frozen fraction (FF) analysis and can also be found in the Supplement.
The instrument DRINCZ yields the FF from the number of wells frozen at a given temperature (nfrz(T)) and the total number of wells (ntot=96). A FF curve is a monotonic function of temperature and is derived according to Eq. (1). In other words, the frozen fraction stays the same or rises with decreasing temperatures.
The DRINCZ technique is limited to snow samples that freeze at temperatures above −22.5 ∘C, since 50 % of the wells of the water background freeze at that temperature ( ∘C).
In addition to showing FF versus temperature in a two-dimensional curve graph (blue line in Fig. 2), we show all 96 raw data points as freezing temperatures in a boxplot (bottom half of Fig. 2a and b). The blue box ranges from the 25th to the 75th percentiles of freezing temperatures, whereas the whiskers extend from the 5th to the 95th percentiles. Within the boxplot, the median, equal to T50, is shown as a thin perpendicular blue line to the box and the mean is shown as a blue circle with a concentric dot (Fig. 2). When the mean and the median values overlap, the FF curve is more or less linear (Fig. 2a). However, when the mean and median values differ by one degree or more, the FF curve has a kink or bump in its slope (Fig. 2b), often observed for biological INPs in a so-called warm mode (Creamean et al., 2019). The boxplot graphing method reduces the required number of dimensions from two to one for displaying a single experiment. This visualization allows for the clear side-by-side comparison of every sample measured in this study and uses all 96 data points without trimming (Fig. S2).
In order to extrapolate the FF determined by DRINCZ into an INP concentration, Poisson distribution calculations were used as in Eq. (2) (Vali, 1971b, 2019):
where nsm(T) is the cumulative INP concentration per milliliter of snowmelt as a function of temperature, and Vd is the droplet volume in milliliters (0.05 mL) (Fig. 2). Although different arguments on omitting the first two wells exist (DeMott et al., 2016; Polen et al., 2018), we argue that trimming enhances representativeness, reproducibility and confidence in the processing of the data from FF to INP concentrations. Thus, the first two wells to freeze out of the 96 wells were omitted for calculating cumulative INP concentrations.
Furthermore, triplicates showed good reproducibility; T50 values of sample triplicates fell within 1 ∘C (Fig. 3) and standard deviations did not depend on average freezing temperature, consistent with Wright et al. (2013). Refreezing results showed a similar spread in T50 values as the triplicates, which suggests that the IN activity of the samples is only minimally affected by freezing (Fig. 3). Consistent with the observed spread in triplicate freezing temperatures, the reported temperature uncertainty of DRINCZ is ±0.9∘C (David et al., 2019). Finally, background corrections for the freezing temperatures were not necessary, as all of the T50 values were statistically above the water background of the instrument. Only three of the 88 samples had 75th percentile freezing temperatures overlapping with the mean of the background water: samples 21, 24 and 62 (Table S1). No further data manipulation was carried out for these samples as the conclusions drawn from these freezing temperatures were the same with or without a correction (Table S1).
2.4 Physicochemical analyses
The Swiss alpine snow samples were submitted to chemical analyses in an attempt to correlate parameters to INP concentrations. In particular, total organic carbon (TOC), pH and conductivity measurements were made for all samples, whereas filtering procedures were conducted for a subset of 17 samples.
The TOC was quantified as the non-purgeable organic carbon (NPOC) in solution using a TOC analyzer (TOC-L CSH, Shimadzu, Japan). This instrument uses a 680 ∘C combustion catalytic oxidation method, while providing quantification in water samples above 0.1 mg C L−1. A detection limit of 4 µg C L−1 is achieved through the use of a nondispersive infrared (NDIR) detector. Method sparge time and gas flow were 1.5 mins and 80 mL, respectively. For the NPOC calibration, two calibration solutions were prepared with concentrations of 20±0.2 and 2±0.02 mg C L−1 from a potassium phthalate TOC standard solution of 1000 mg C L−1 (Sigma-Aldrich).
pH values were measured with a Metrohm pH glass electrode and the values obtained were consistent across all samples, ranging between 5.2 and 6.2. Considering the error on the pH measurements from the unbuffered snowmelt solutions, the pH of all the samples was within error and consequently was not ascribed to any INP variability.
The conductivity of the snowmelt was measured using a handheld conductivity meter (LAQUAtwin COND, Horiba, Japan). It uses a small sample volume (less than 0.5 mL) and has an accuracy of ±1 µS cm−1 for conductivity measurements between 0 and 1999 µS cm−1. The instrument was calibrated with a 1413 µS cm−1 standard solution. Before the measurement was obtained, the sensor was washed three times with nanopure Milli-Q water, and then 1 mL of the sample was flushed over the sensor for conditioning.
Finally, to classify the size of INPs in the snow samples, the samples were filtered through cellulose acetate membrane filters with pore sizes of 0.2 and 0.45 µm (514-0063, VWR, USA). In addition, samples were filtered with a 0.02 µm pore filter (Whatman® Anotop® syringe filters, Sigma Aldrich) similarly to Irish et al., (2017). The filtered samples, including molecular biology reagent water blanks, were then measured with DRINCZ. Tests with glass fiber filters with pose sizes of 0.7 µm (SF1300-07, BGB Analytik, USA) yielded lower freezing temperatures than with the cellulose acetate membrane filters and were thus not used further for this study.
Table 2Correlation analyses between T50 values and different physicochemical and terrain parameters calculated with the Matlab standard linear fit model. R2 values characterize the linear relationship between T50 and the parameter; the p value identifies whether the correlation is statistically significant (p value < 0.01 is considered significant); n represents the number of snowmelt samples used in the correlation.
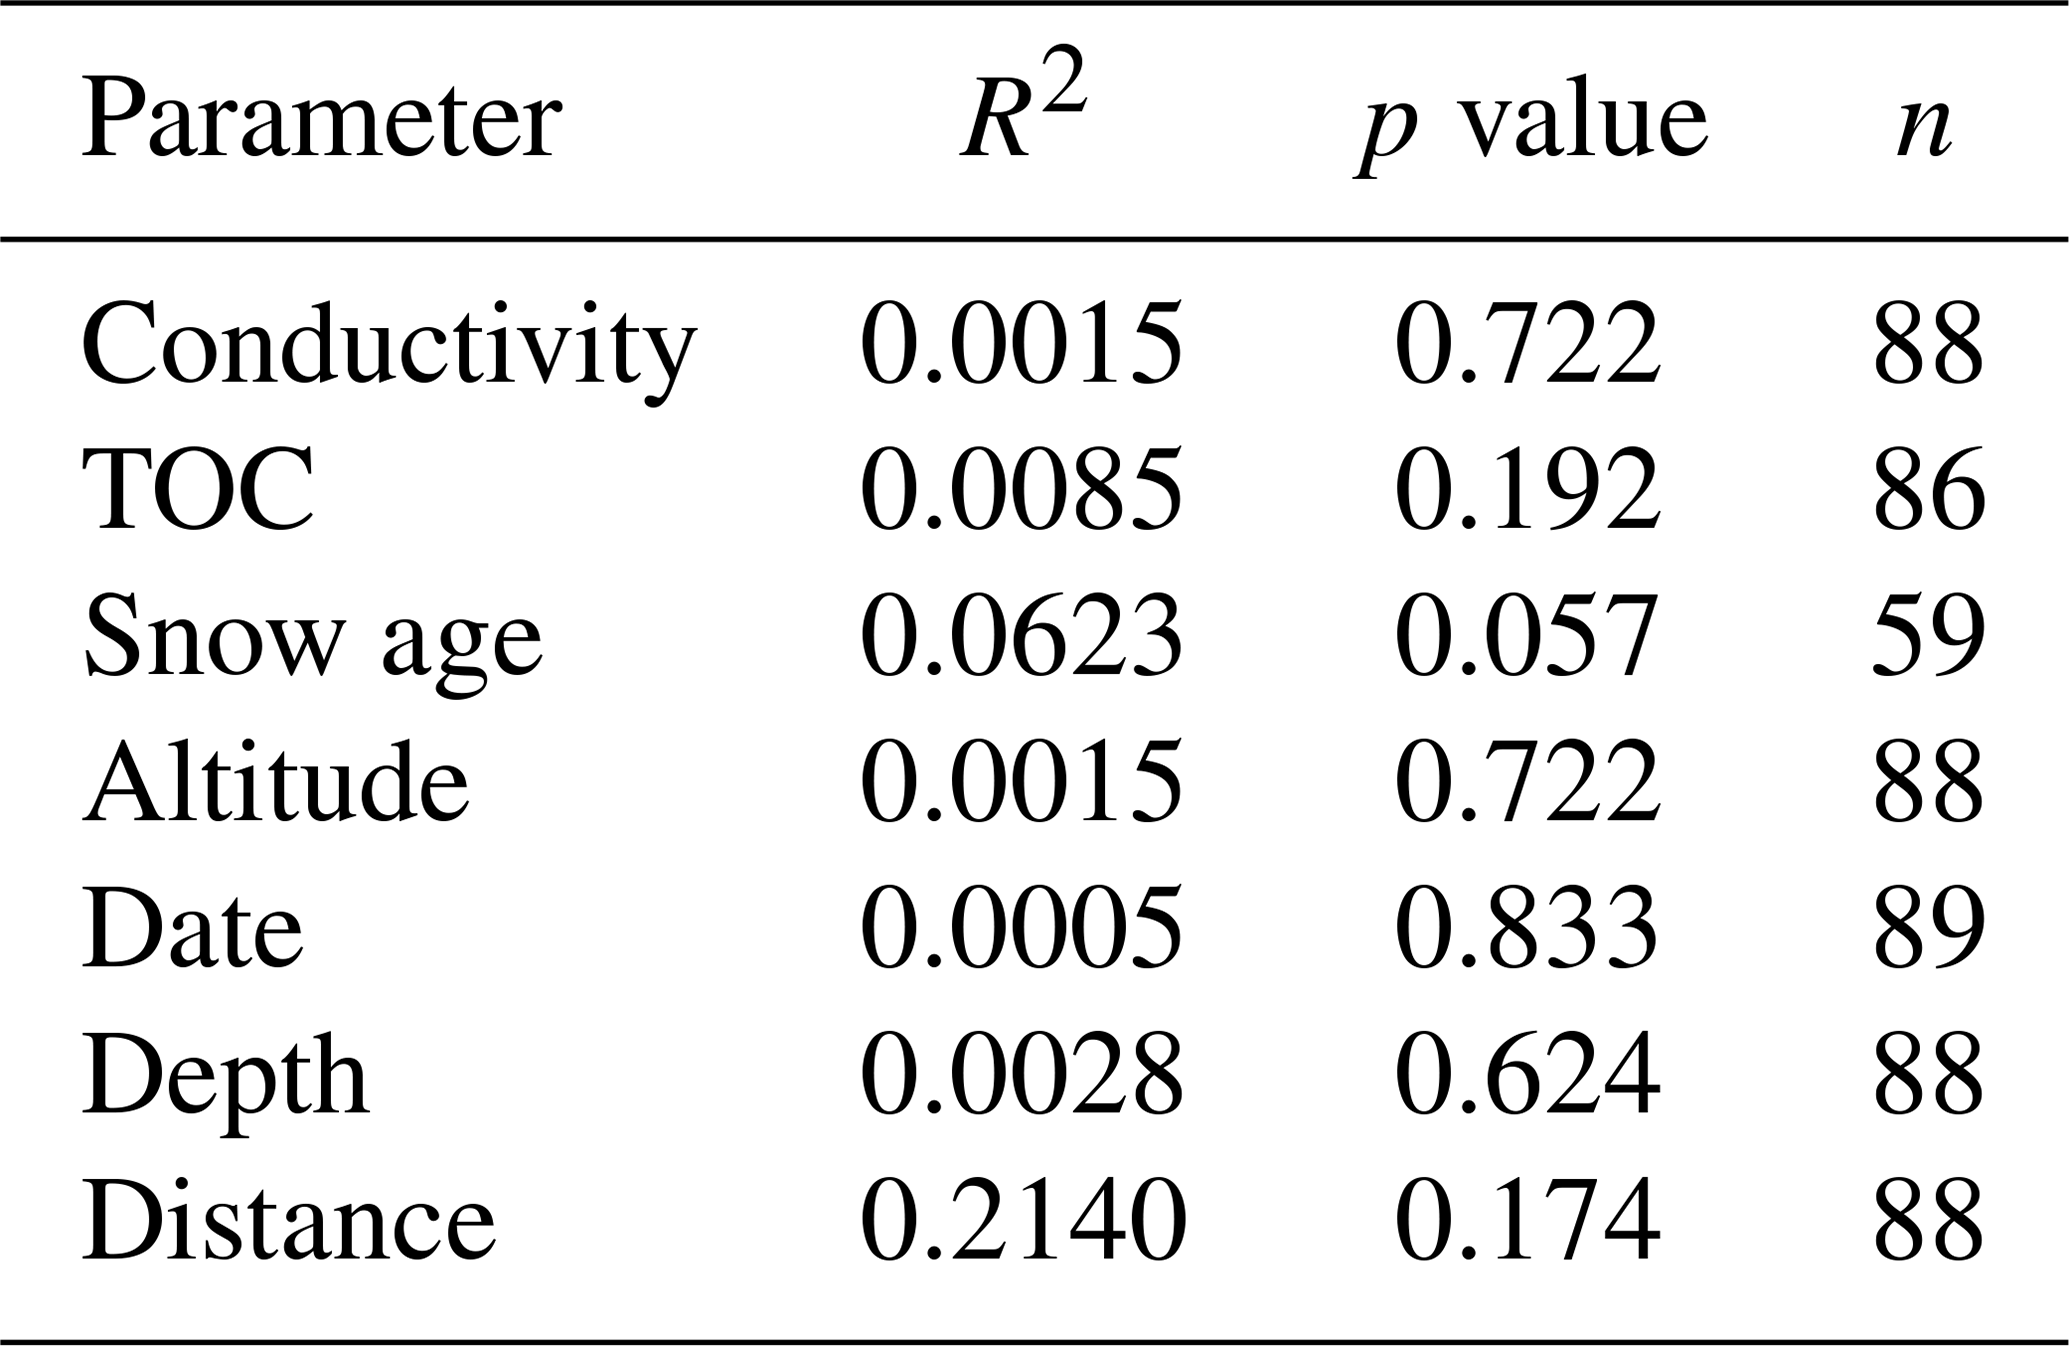
This study investigated the freezing temperatures of 88 snow samples collected over 15 d and 17 different locations during the winter of 2018 in the Swiss Alps. The T50 values and freezing temperatures are presented in three sections: physiochemical properties, times series and sampling site characteristics. T50 values from the entire dataset ranged between −5.3 and −21.6 ∘C with a mean value of ∘C (Table S1), all above the DRINCZ instrument's detection limit. We also report correlation analysis using T50 as the temperature where FF = 0.5 (Table 2). We first use T50 values to compare samples to different physicochemical properties of the snowmelt, such as TOC, conductivity and particle size, as well as to collection time within the winter season. We then use freezing temperature boxplots to compare the freezing behavior of samples based on terrain, altitude and snow age. Next, INP concentrations in precipitation were estimated and a parameterization is derived based on a temperature dependence. Finally, we extrapolate the INP concentrations to frozen cloud fractions to infer glaciation temperature and liquid water-to-ice ratio of mixed-phase clouds over the Swiss Alps in the winter of 2018.
3.1 Physicochemical properties
3.1.1 Chemical properties
To study the INP concentration dependence on chemical parameters, T50 values were compared to total organic carbon (TOC) and conductivity measurements (Fig. 4). Organic carbon values ranged between 0.3 and 5.2 mg C L−1, with a median of 0.64 mg C L−1 and an average of 0.9±0.7 mg C L−1, similar to a TOC range of 1.3 to 4.0 mg C L−1 previously measured in snow samples in North America (Rangel-Alvarado et al., 2015). The sample with the highest TOC value of 5.2 mg C L−1 was collected at Grossstrubel in Valais at 2638 m a.s.l. (Fig. 4 and Table S1). Its T50 value was −14.2 ∘C, and nothing was remarkably unique about this location. Furthermore, 13 snow samples were collected the same day with TOC values closer to the average concentration. Low TOC concentrations were found to span the entire range of T50 values, indicating no correlation between TOC and freezing temperatures of the snowmelt (Table 2). Wilson et al. (2015) proposed an INP parameterization for sea surface microlayer samples based on TOC; however our snowmelt samples suggest no correlation with organic carbon content.

Figure 4Scatterplot of T50 versus conductivity. TOC is shown in color and the three most conductive samples are labeled with the sample number and sampling site. The range of the conductivity instrument background is shaded in grey.
Conductivity is a measurement of ionic strength of the snowmelt, and salt can lower the freezing temperatures of a sample. However, conductivity values of the snowmelt ranged from 0 to 14 µS cm−1 with a median at 3 µS cm−1 and an average of 4.1±2.5 µS m−1. The three samples with the highest conductivity measurements were samples 88, 96 and 73 and were from Fletschhorn, Pointe Aiguille Verte and Weissfluh, respectively (Fig. 4). These samples had TOC concentrations close to 1 mg C L−1 and uncorrelated with T50 values. The conductivity values of this dataset are small and close to the limit of detection of the conductivity meter, approximately representing salt concentrations below 400 µM of, for example, NaCl.
The pH values obtained were consistent across all snowmelt samples, ranging between 5.2 and 6.2. This result is consistent with a pH of unbuffered pure water in equilibrium with atmospheric CO2. The pH variability has no clear effect on IN ability and lies within the uncertainty of the measurement.
Note that the chemical properties of the snowmelt are representative of all types of aerosols present within the collected snow sample. Yet, only a subset of these aerosols are INPs and can thus be related to the freezing temperatures. Since total aerosol concentrations are several orders of magnitude greater than INP concentrations (Kanji et al., 2017), the chemical signature of an INP is possibly lost among total aerosol chemistry, even if the INPs are expected to be concentrated in precipitation samples. Therefore, it is not possible to develop a meaningful parameterization for INP concentrations based on TOC or conductivity from the snowmelt samples collected in this study (Fig. 4).
3.1.2 Snowmelt filtration experiments
Determining the size of INPs may be useful in identifying their sources, transport and sedimentation pathways in the atmosphere. The snowmelt was thus filtered to three sizes: 0.45, 0.20 and 0.02 µm (Fig. 5). Filtrates from 0.45 and 0.20 µm filters retained the ice activity of the unfiltered sample. Three exceptions were observed from Fig. 5; three of the highest T50 values from the unfiltered snowmelt lost between half and all of their ice-nucleating ability. On the other hand, filtrates from 0.02 µm filtrations completely removed the ice-nucleating activity of the original snowmelt. We wondered whether salts from the filter could have been introduced into our sample, leading to a freezing point depression. However, the conductivity of molecular biology reagent water (89079-460, Sigma Aldrich, USA) filtered through a 0.02 µm filter was measured at 4 µS cm−1, a value too small to lead to a noticeable freezing point depression. We conclude that the low freezing fractions observed with the 0.02 µm filtrates of the snowmelt were indeed due to loss of INPs in solution. We further conclude that most INPs in the collected snow samples were between 0.20 and 0.02 µm in size.
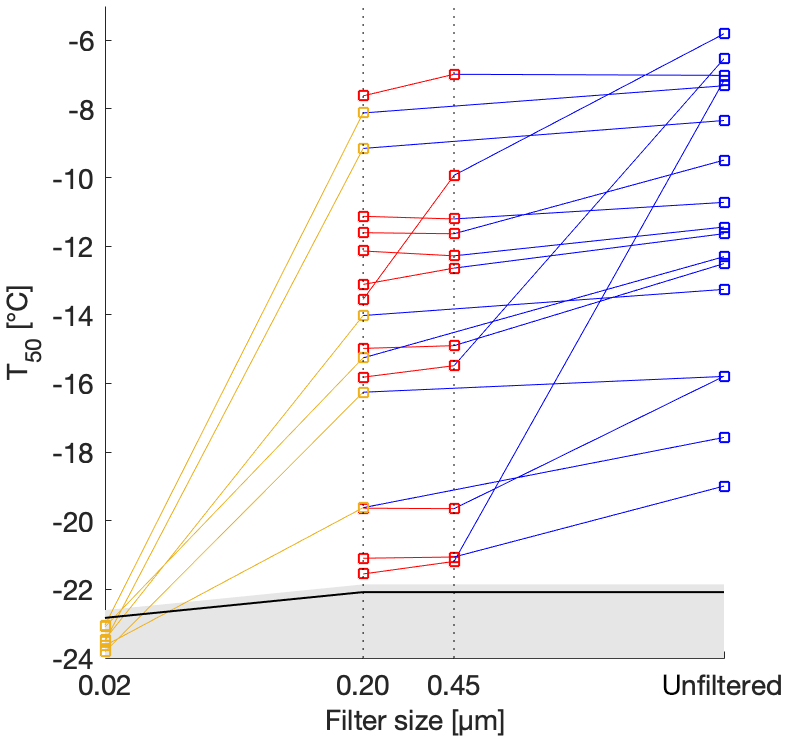
Figure 5T50 as a function of filter pore size for selected samples. The T50 values of the background molecular biology reagent water are shown in black. The grey shaded area above the line represents 1 standard deviation. The samples were filtered through 0.02, 0.20 and 0.45 µm and the lines connect the different filtrates of the same sample. The T10 version of this graph can be found in the Supplement for further comparison with Irish et al. (2017) and with Wilson et al. (2015).
This sizing test suggests that most of the INPs were found in the accumulation mode and smaller, and consequently only a few, albeit the most active, INPs were present in the coarse mode (0.5–5 µm) and larger. Sizes relevant for dry deposition are therefore only sparsely represented in our samples, suggesting that the majority of INPs found in the snowmelt were deposited in the snowpack through wet deposition by snow precipitation. This observation is expected and consistent with INPs preferentially removed during precipitation events (Stopelli et al., 2015). In addition, we make the same conclusion by plotting T10 as a function of filter sizes which gave the same trend in the size dependence of INPs (Fig. S3). Although T10 has been used in previous studies (Irish et al., 2017), T50 was chosen here, as it was used in the rest of our analysis and as the same conclusions can be drawn from both values.
The majority of INPs found within our samples were smaller than 0.20 µm, consistent with findings of existing studies on organic matter (Irish et al., 2017, 2019; Wilson et al., 2015). In contrast, Mason et al. (2016) found that the majority of INP particles had aerodynamic diameters in the coarse mode when sampled from ambient air. However, it is important to note that it is not possible to determine the change in particle morphology when particles are immersed in water, and therefore the same INPs may be responsible for the observed ice nucleation activity in precipitation and air samples. Regardless, the size classification of INPs from this study provides further support for the limited role of bacteria in ice nucleation over the Swiss Alps, since bacteria are larger than 0.20 µm. However, the role of bacterial fragments or proteinaceous material from sources such as fungi and plant pollen cannot be excluded (Hartmann et al., 2013; Pummer et al., 2012, 2015).
3.2 Time series of T50 values
The variability of T50 values was observed throughout the measurement period and there was no trend over time (Fig. 6). Noticeably, all samples taken in May 2018 had TOC values above the dataset average, and specifically above 1.2 mg C L−1; however the time since their last snowfall was only 1–2 d, and so these samples were still relatively fresh (Table S1). Nonetheless, the scatter of T50 values indicates no trend overtime of the freezing temperatures of INPs, consistent with a lack of seasonality in INP concentrations measured by a continuous-flow diffusion chamber at Jungfraujoch (Lacher et al., 2018a). The absence of time dependency of the INP occurrence within the campaign timeframe indicates that the variability is consistently large throughout the entire time span investigated.

Figure 6Time series distribution of the T50 values during the entire field campaign, displayed as months in 2018. TOC values of the samples are shown on a color scale and conductivity values are shown on a marker size scale.
3.3 Spatial, altitudinal, snow age and depth variability of freezing temperatures
3.3.1 Spatial heterogeneity of freezing temperatures
To assess the local variability of INP concentrations spatially, samples from the same site, sampled on the same day, were compared based on their distance from each other (Fig. 7). The sampling site at Schilt showed consistent freezing temperatures for samples separated by only 5 m but showed a difference in T50 of 4 ∘C for the sample located 300 m away, within a similar environment. Furthermore, the Sankt Annafirn site also displayed little variability of the median and mean freezing temperatures within a 5 m trajectory on top of the snowpack (Fig. 7). Thus, we find that for two sites, snowmelt samples displayed similar INP concentrations within a radius of approximately 5 m. However, 300 m was enough to observe differences in INP concentrations, as was observed at Schilt.
'
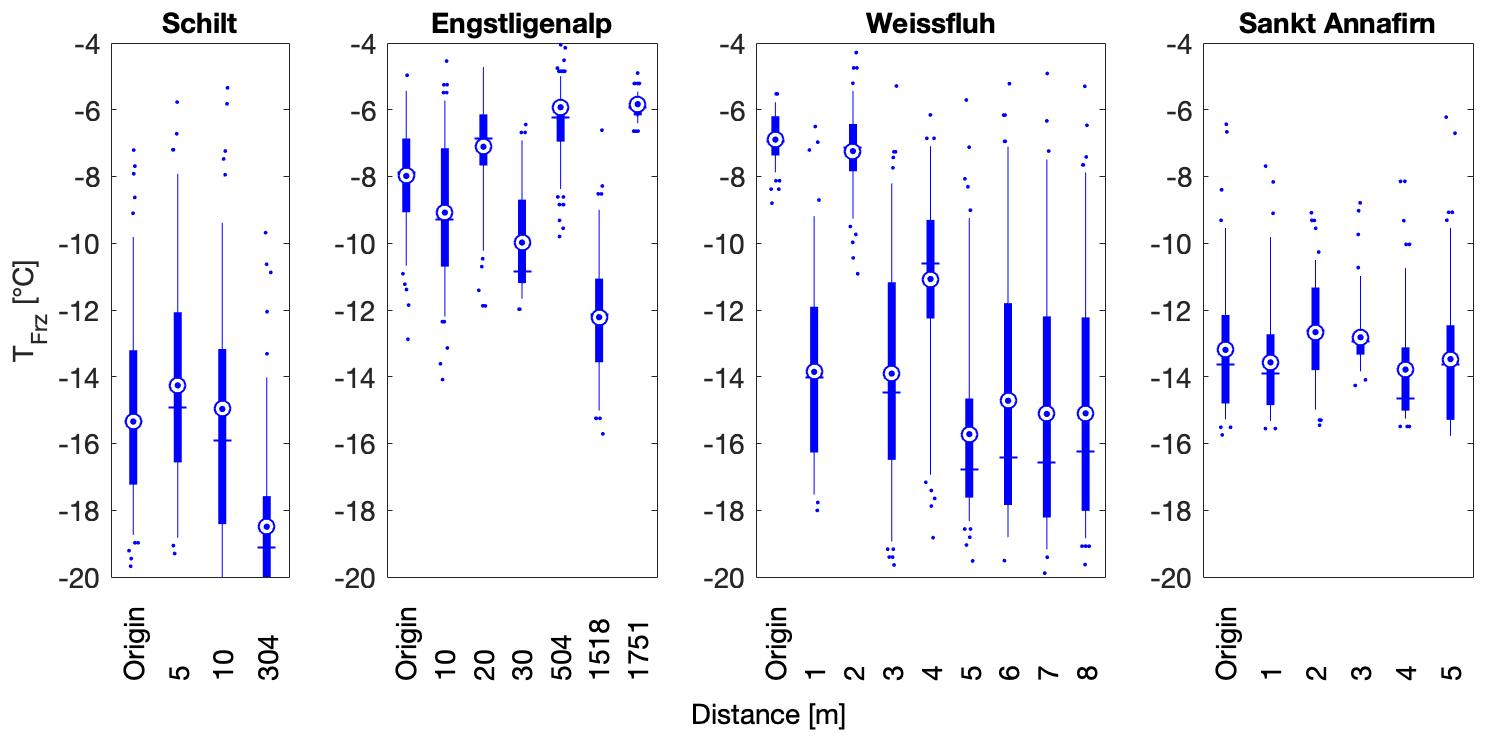
Figure 7Spatial distribution of freezing temperatures of snow samples collected at four different flat sites, at Schilt on 24 February 2018, at Engstligenalp on 14 April 2018, at Weissfluh on 15 April 2018 and at Sankt Annafirn on 22 April 2018. Weissfluh and Sankt Annafirn are particularly striking since the snow samples collected at these sites show heterogeneity within 1 m distances. All the samples at the same location were collected on the same day. In the boxplots, the blue vertical line shows the median and is equal to T50, the mean is shown as a blue circle with a concentric dot and the box ranges from the 25th to the 75th percentiles, and the whiskers extend from the 5th to the 95th percentiles.
However, for two other sites, Engstligenalp and Weissfluh, the T50 values of snowmelt varied by up to 8 and 10 ∘C, respectively (Fig. 7). We studied the snowmelt at Engstligenalp due to its location in a flat flood plain of approximately 1 km × 2 km in size (Fig. S4). Because of the topographical homogeneity of the Engstligenalp site, similar local sources of INPs were expected. However, within the plain of less than 2 km, a difference in T50 of 8 ∘C was observed (Fig. 7). Additionally, samples taken on the side of a snow hill at the Weissfluh site showed a wider spread in freezing temperatures within a distance of only 8 m. Both the Engstligenalp and Weissfluh sites displayed visual evidence of snowdrift, which could explain the large variability observed compared to the Schilt and Sankt Annafirn sites (Fig. 7). In fact, wind drift can lead to an extremely heterogeneous snowpack (Gauer, 2001), which could lead to locally heterogenous INP concentrations. Specifically, at Weissfluh, the origin sample and the samples at distances of 2 and somewhat at 4 m had significantly warmer T50 temperatures and a narrower spread in freezing temperatures than the snowmelt samples at other distances. The narrow spread suggests that the INPs responsible for the observed freezing in these samples (at origin and at 2 m) were abundant at these locations but inhomogeneous across the plain (Fig. 7).
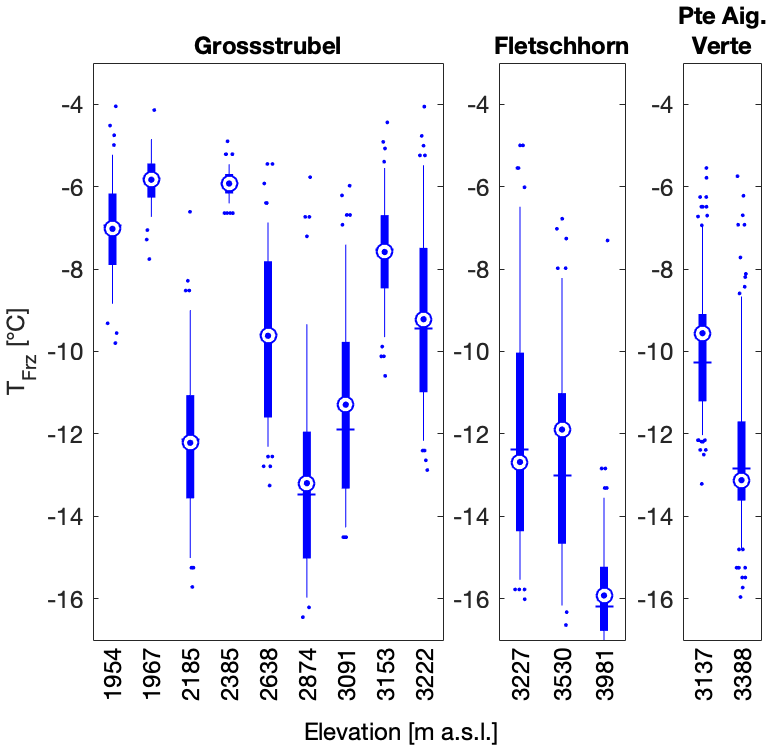
Figure 8Snow samples were collected at different altitudes at Grossstrubel on 14 April 2018, at Fletschhorn on 22 April 2018 and at Pointe Aiguille Verte on 12 May 2018. In the boxplots, the blue vertical line shows the median and is equal to T50, the mean is shown as a blue circle with a concentric dot and the box ranges from the 25th to the 75th percentiles, and the whiskers extend from the 5th to the 95th percentiles. Note that the two Pointe Aiguille Verte boxplots contain 192 data points each as two individual snow samples were collected at the same location and thus combine for this figure.
3.3.2 Altitude dependency of freezing temperatures
To investigate the influence of boundary layer and local sources of INPs on snowfall across the Swiss Alps, sampling sites were chosen to cover a broad range in altitude. The sampling sites ranged in altitude between 440 and 3981 m a.s.l. with a median altitude of 2294 m (Table 1), thereby covering a range of sites affected by rare snow events (in Zurich at 440 m a.s.l.) and by eternal snowpack (at Fletschhorn at 3981 m a.s.l.). When investigating the role of altitude on INP occurrence in the same sampling region there is a qualitative decrease in T50 at higher altitudes for the sites Fletschhorn and Pointe Aiguille Verte (Fig. 8). The reasons are potentially twofold. First, the more active INPs nucleate ice at warmer temperatures and are therefore removed earlier and lower in the clouds (Stopelli et al., 2015). Second, INPs in the boundary layer are advected into the cloud due to orographic lifting or turbulence at the top of the boundary layer. Indeed, Lacher et al. (2018b) saw an increase in INP concentrations during periods of boundary layer air at Jungfraujoch, albeit at much colder sampling conditions than measured in this study.
In contrast to an altitude dependence observed at Fletschhorn and Pointe Aiguille Verte, Grossstrubel had no clear dependence on median and mean freezing temperatures with altitude, although samples at altitudes lower than 2500 m had significantly narrower spreads of the 25th and 75th percentiles (Fig. 8). Considering the observed spatial variability when sampling at distances over 5 m, it is difficult to disentangle the effect of altitude and of spatial variability in INP occurrence. This dataset is therefore limited in its ability to compare free-tropospheric snowfall and snowfall influenced by the boundary layer to assess the importance of boundary layer aerosols on ice formation in clouds.
3.3.3 Snow age through time and depth
The effect of snow age on the TOC, conductivity and freezing temperatures was evaluated using two types of snow sampling and data analysis. The first method involved classifying the T50 temperatures of the snowmelt as a function of the day of the last snowfall reported at the nearest SLF station. The second method involved digging through the snowpack to the ground and collecting samples along the depth profile (see photo in Fig. 10).
Comparing different snowpack ages, which we define as the number of days between the most recent snowfall at the nearest SLF site and the sampling day, allows the assessment of variables affecting snow properties since precipitation, including (1) dry scavenging (Zhang et al., 2001); (2) microbial, plant and mineral effects from underlaying ground; (3) photochemical and ozone aging (Borduas-Dedekind et al., 2019; Gute and Abbatt, 2018; Kanji et al., 2013); (4) melt-process influence (Colbeck, 1981; Kuhn, 2001); (5) rainfall; and (6) sublimation and deposition within the snowpack and between the snowpack and the atmosphere (Birkeland et al., 1998). The correlation between snow age and T50 was however found to be insignificant (Fig. 9). However, the highest TOC value of 5.2 mg C L−1 was observed for snowmelt sampled on 4 April 2018, 9 d after the last snowfall, which could have allowed the surface snow to concentrate (Figs. 6 and 9). However, this hypothesis does not hold across the rest of the samples. Based on this result, we conclude that INP concentrations are not preferentially found in fresh snow samples nor are they concentrated over time nor is there significant dry deposition. This result is consistent with Hartmann et al. (2019), who found similar variability and concentrations of INPs in ice cores, which have much longer aging times. However, it is important to note that we did not investigate the meteorological conditions between snowfall and sampling, nor did we measure the INP concentration at the same location on different days without any snowfall in between the days. Thus, weathering, which has been shown to affect the INP concentration in collected snow samples (Stopelli et al., 2014), and dry deposition could have occurred to some extent. Nonetheless, we can conclude that the role of aging does not change the INP activity beyond the natural variability of the samples.
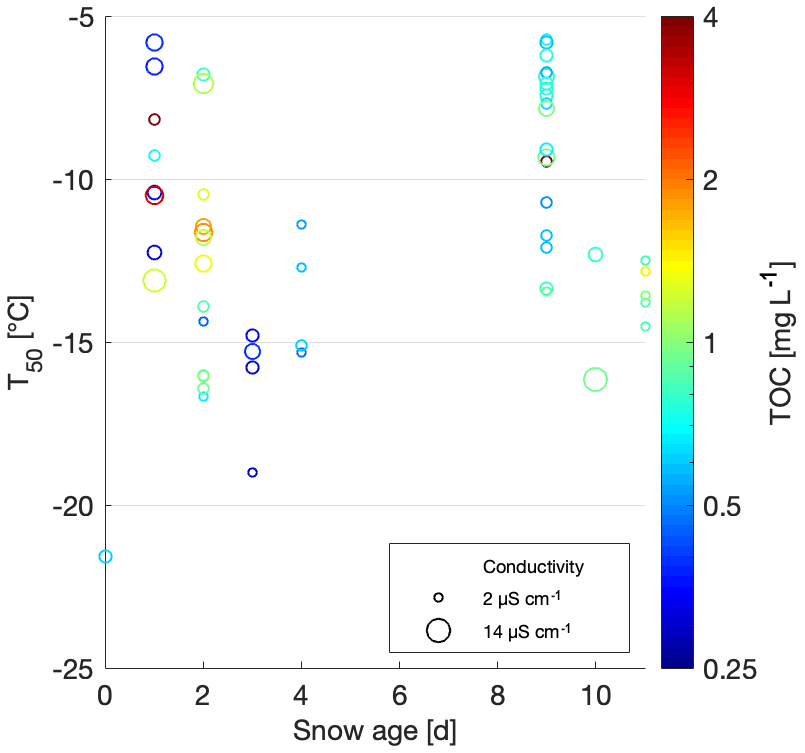
Figure 9Scatterplot of T50 versus minimum snow age. TOC values of the samples are shown on a color scale, and the marker surface area represents the conductivity.
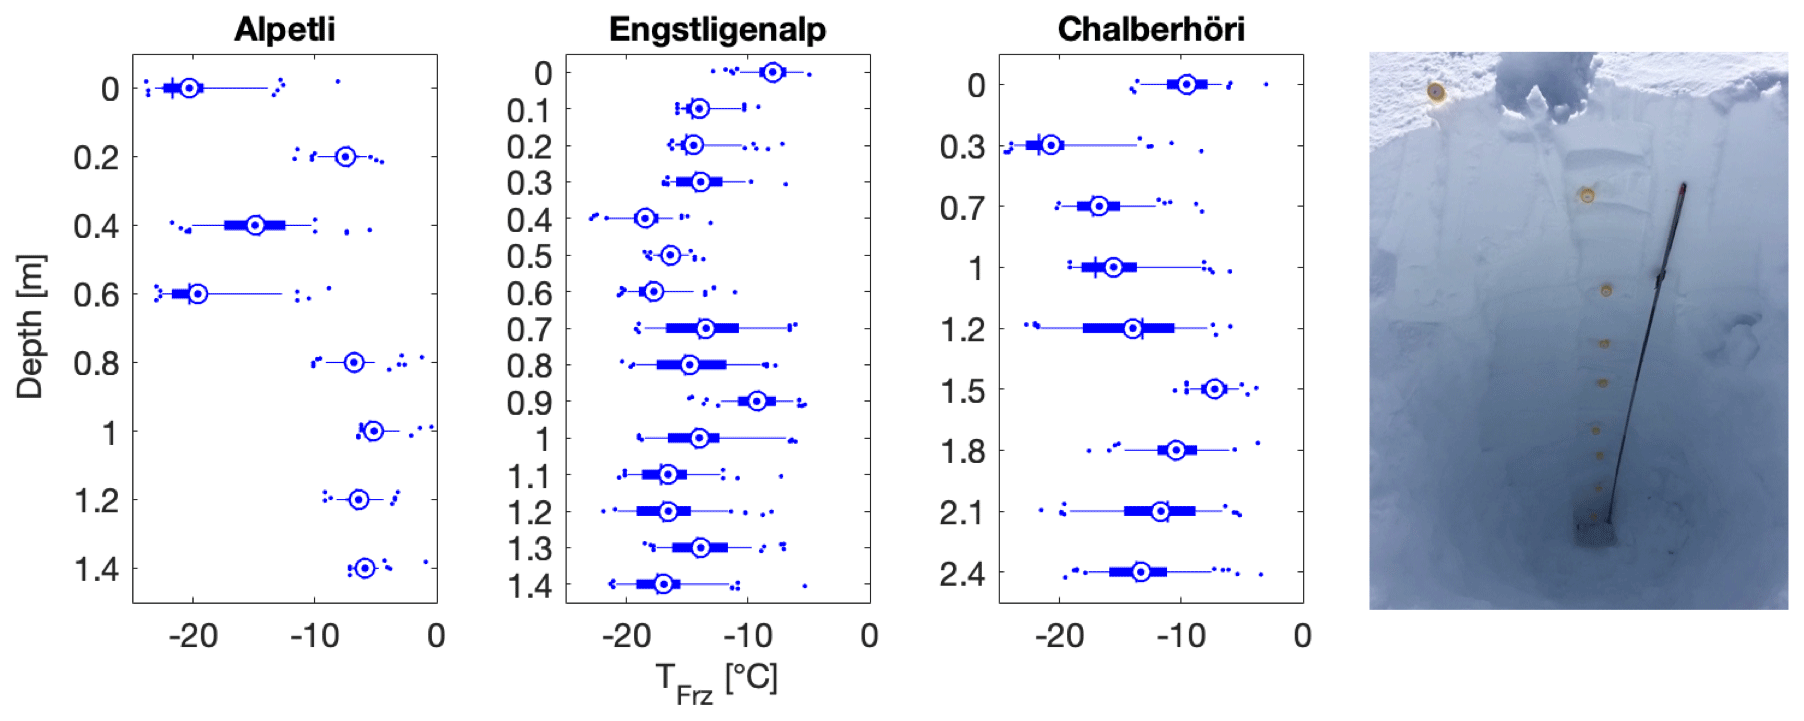
Figure 10Depth profiles of snowmelt freezing temperatures at three different sampling sites, namely at Alpetli on 17 March 2018, at Engstligenalp on 14 April 2018 and at Chalberhöri on 2 April 2018 (Table 1). Right inset: a 2.7 m deep snow profile was dug with an aluminum avalanche rescue shovel at the sampling site Engstligenalp. The probe depicted is an avalanche rescue probe and was used to measure the snow depth. The fresh layer snow was 9 d old and the first snowfall at that site was recorded on 23 November 2017. In the boxplots, the blue concentric dot is the mean, the blue horizontal line is the median, the box is the 25th to the 75th percentiles, and the whiskers extend from the 5th to the 95th percentiles.
Sampling depth profiles in the snowpack permitted a comparison of snow that precipitated at different times in the same location without the logistical burden of returning to the site several times during the field campaign. Of note, the first widespread snowfalls that reached altitudes below 2000 m a.s.l. were registered on 6 November 2017, and thus the oldest snow and the deepest depth samples would have precipitated no earlier than this date. The depth samples in all three locations were very diverse, with T50 values ranging from −20 to −5 ∘C (Fig. 10). The depth profile sites of Alpetli and Chalberhöri were separated by only 1.5 km and were sampled 16 d apart, so one could have expected a similar pattern in the depth profile if INP concentration were driven on the synoptic scale. However, no similarity or trend was found as a function of depth at the three sites (Fig. 10).
Furthermore, the Alpetli site had consistently warmer T50 values at depths of more than 0.8 m from the surface of the snowpack in comparison to the other two sampling sites (Fig. 10). Between 0 and 0.6 m beneath the snow at Alpetli however there was a wide spread in INP occurrence, and the freezing temperatures were similar to the boxplots of the other sites (Fig. 10). The high activity of the INPs at Alpetli might be dominated by its particular proximity to trees shedding biogenic particles, known to efficiently nucleate ice (Morris et al., 2014). In contrast, the profiles at Engstligenalp and Chalberhöri had less variability in INP activity with depth and had a mean T50 value of −13.1 and −12.7 ∘C, respectively. Since the lower half of depth samples at the Alpetli site contained more efficient INPs in higher concentrations, we considered whether this high efficiency was due to contamination from the underlying soil or any organic matter within the soil, which has been shown to act as efficient INPs in the immersion freezing mode (Hill et al., 2016; O'Sullivan et al., 2014; Suski et al., 2018; Tobo et al., 2014). As the depth of efficient INPs extends well above the bottom of the profile (Fig. 10) and as the other two depth profiles do not display this behavior, we conclude that contamination from the underlying soil is likely not responsible for the high T50 values observed in the lower half of the Alpetli profile.
Although the age and exposure of the individual snow samples are unknown, there is no systematic decrease in INP activity with depth, consistent with our snow age observations and with literature ice core measurements (Hartmann et al., 2019). Therefore, we argue that snow depth profile measurements are an appropriate method to analyze the concentration of INPs over a winter season. However, a study comparing the concentration of INPs in freshly fallen snow to that of the same corresponding snow in a depth profile is warranted. Ultimately, such a study would help to understand the representativeness of the chronology within a snow depth profile, the influence of aging on INPs and the impact of dry deposition on the concentration of INPs on a snow surface.
3.4 INP concentration parameterization
Next, the freezing temperatures were converted into cumulative INP concentrations within the snowmelt (nsm) following Eq. (2). The nsm values were extrapolated to cumulative INP concentrations in air (cair) by assuming a cloud water content (CWC) of 0.4 g m−3 (Petters and Wright, 2015) and a density of water of 1 g mL−1 (ρw), according to Eq. (3). This calculation assumes no dry deposition contribution (see section on snow age) and no scavenging of INPs during snow precipitation (Petters and Wright, 2015). Nonetheless, we appreciate that scavenging of microbial ice nucleators during rain events can occur (Hanlon et al., 2017).
A two-dimensional histogram of all INP concentrations could be obtained by binning the INP concentrations to a 1 ∘C bin width laterally and a logarithmically constant bin width vertically (Fig. 11). The probability scale represents the probability of observing INPs within a given temperature and concentration bin based on all of our 88 observations, including the depth profiles. The measured temperatures for a given INP concentration fell nicely within values found in previously published studies (Petters and Wright, 2015) and furthermore within field studies conducted at Jungfraujoch (Conen et al., 2012; Stopelli et al., 2014, 2016, 2017) (Fig. 11).
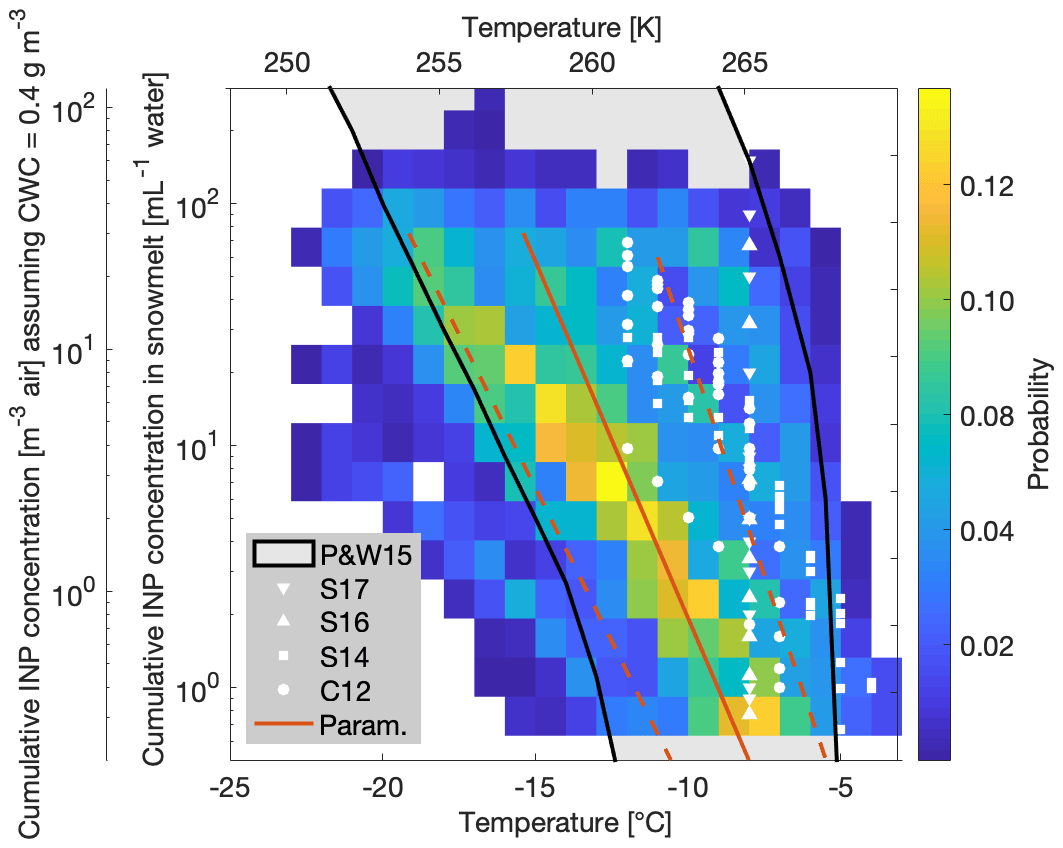
Figure 11Observations in INP concentrations in snowmelt (nsm) and in air (cair) for all of the measurements (88 samples) as a function of temperature. The observations are shown as probability in a two-dimensional histogram. The grey area with black borders shows the concentrations found in the literature (Petters and Wright, 2015). The white symbols correspond to other field studies in the Swiss Alps (Conen et al., 2012; Stopelli et al., 2014, 2016, 2017), with the parameterizations and in red (solid) and 1σ SD (standard deviations) thereof (dashed).
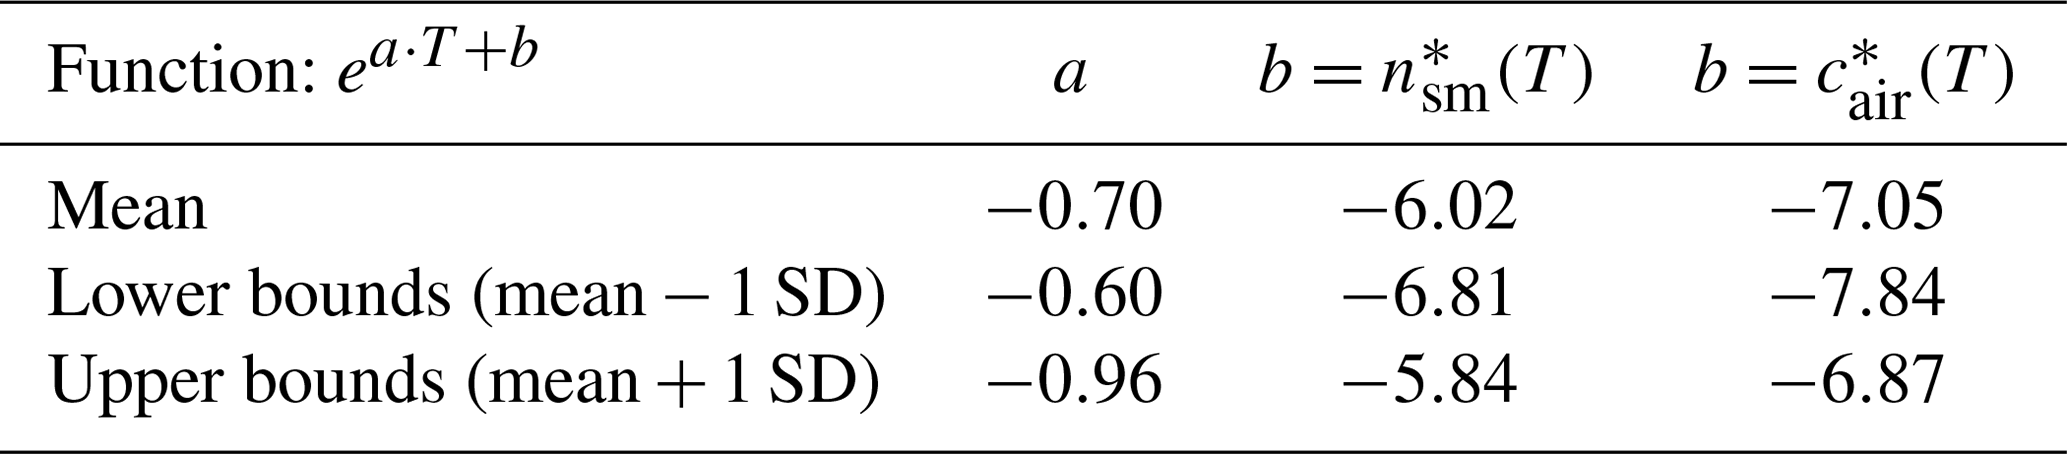
The large variability in temperatures and INP concentrations made it difficult to find a clear influencing factor on INP occurrence, consistent with other field studies (Garimella et al., 2017; Lacher et al., 2018a; Welti et al., 2018). Diverse sampling sites in multiple regions with varying environmental factors and their accompanying uncertainties complicated the determination of INP concentration predictive factors. Yet, Stopelli et al. (2016) found that upstream precipitation and wind speed accounted for 75 % of the observed INP variability at the Jungfraujoch site. Unfortunately, these meteorological parameters could not be assessed in this study. Nonetheless, this study's dataset was used to generate a parameterization for potential applications in simulating INP concentrations as a function of temperature (Fig. 11, Table 3). The parameterizations are given as for snowmelt and for air, where and are defined as the cumulative concentrations of INPs per milliliter of snowmelt and per cubic meter of air, respectively, as a function of temperature (Table 3). Note that the asterisk is used to denote the parameterization values and to distinguish them from the measured values from our study. In particular, the parameterization can be directly applied to general circulation models in order to predict INP concentrations as a function of temperature.
Table 3Coefficients of the INP concentration parameterization, based on values between 0.2 and 90 INPs per milliliter and 0.08 and 36 m−3.
The large variability throughout the dataset suggests that differing synoptic conditions influenced the snow at different time spans. Although contributing factors to INP occurrence are likely due to differing source regions and microphysical pathways upstream of the sampling locations, they could not be matched with physical or chemical properties (Table 2). Additionally, high variability values of snowmelt within close proximity of each other on the same day suggest that a site-specific contributing factor would be responsible. However, another explanation for local variability in INP occurrence is the wind drift, which might have transported snow during or after a precipitation event or might have uncovered an older layer, which was then later sampled next to a freshly precipitated layer. These complicating effects yield a heterogeneous snowpack (Gauer, 2001), consistent with the measured heterogenous INP concentrations in this study. Nonetheless, the total measured INP concentrations fall well within the range of previously published values (Fig. 11). Due to the fact that INP occurrence in the measured snow samples has been determined as not site specific, the studies conducted at Jungfraujoch measuring the free troposphere are representative for INP assessments across the Swiss Alps.
An accurate onset temperature of ice nucleation in supercooled clouds and the subsequent temperature transition to mixed-phase and eventually to glaciated clouds are important factors for determining cloud lifetime and thus radiative forcing. Yet, these onset and transition temperatures are variable and lead to large uncertainties in weather and climate models (Boucher and Quaas, 2013; Prenni et al., 2007; Vergara-Temprado et al., 2018). The glaciation temperature of a cloud further depends on the supersaturation within the cloud and is highly sensitive to updraft velocity (Korolev et al., 2017; Korolev and Isaac, 2003; Korolev, 2008). As ice crystal concentrations in clouds can be several orders of magnitude higher than INP concentrations (Wex et al., 2010), secondary ice processes can play an important role in the evolution of supercooled clouds (Beck et al., 2018; Hallett and Mossop, 1974; Lauber et al., 2018; Mignani et al., 2019; Petters and Wright, 2015). However, the process of ice multiplication is not fully understood, with multiplication factors ranging from 1 to multiple orders of magnitude (Mignani et al., 2019; Wang, 2013). Nevertheless, it has been proposed that complete glaciation of supercooled clouds can be initiated through ice multiplication with fewer than 10 INPs per cubic meter (cair) (Crawford et al., 2012; Mason, 1996) by the process of riming and ice splintering (Hallett and Mossop, 1974; Mossop, 1978). Therefore, by choosing a threshold for the number of INPs required to glaciate a cloud, say 10 m−3, we can estimate the frozen cloud fractions based on our cumulative INP concentrations (Fig. 12).
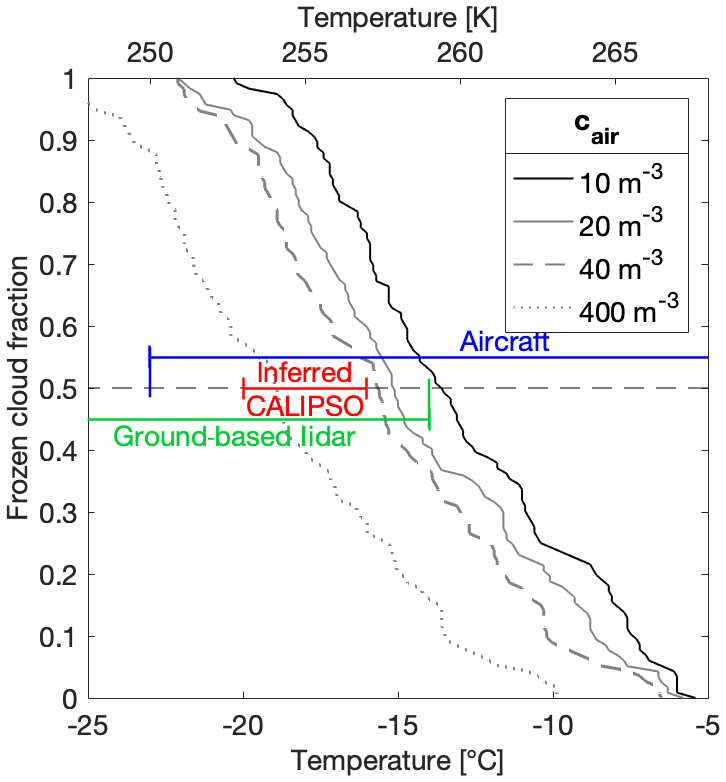
Figure 12Frozen cloud fraction as a function of temperature derived from all 88 samples from this study at four different critical INP concentrations necessary for cloud glaciation, namely 10, 20 and 40 m−3. The frozen cloud fraction was further estimated using the parameterization to 400 m−3 (see text). The aircraft (blue), inferred CALIPSO (red) and ground-based lidar (green) temperature ranges for 50 % frozen cloud fractions are adapted from McCoy et al. (2016).
Specifically, we identified the freezing temperature from all 88 of our samples which corresponded to a calculated cair value of 10 m−3 (also equivalent to 25 mL−1 of snowmelt (nsm). We then sorted these 88 temperatures from warmest to coldest and plotted them in a linear space from 0 to 1, corresponding to a frozen cloud fraction (Fig. 12). We repeated this analysis with assumptions of cair values of 20 m−3 and of 40 m−3 required for cloud glaciation. However, the highest INP concentration from this study did not exceed ∼200 m−3 because of the −22.5 ∘C limit of detection of DRINCZ. This temperature thus limits the extrapolation of frozen cloud fractions to lower temperatures. Yet, since other studies suggest that hundreds of INPs per cubic meter can be necessary for cloud glaciation to occur (McCoy et al., 2016), in contrast to the lower limit of 10 m−3 by Crawford et al. (2012), we use our parameterization to estimate the frozen cloud fraction from INP concentrations an order of magnitude higher. The change in temperature required for to increase by an order of magnitude can be calculated as and is equal to −3.3 ∘C. Thus, to extend the frozen cloud fraction using 400 m−3 as the INP concentration necessary for cloud glaciation, the frozen cloud fraction at 40 m−3 was translated to colder temperatures by −3.3 ∘C (Fig. 12).
Our 50 % frozen cloud fractions fall within the range reported from airborne, ground-based and satellite measurements as summarized in McCoy et al. (2016) (Fig. 12). Furthermore, these results are remarkably consistent with the typically observed transition zones between supercooled liquid and ice clouds in models and observations (Costa et al., 2017; Henneberg et al., 2017; Lohmann et al., 2016; McCoy et al., 2016; Pithan et al., 2014). Indeed, global circulation models partition liquid and ice in a given atmospheric volume as a monotonic function of temperature, but precipitation and freezing and melting cycles affect the liquid water-to-ice ratio, thereby modifying the cloud-phase transition in often poorly constrained ways (Cesana et al., 2015; McCoy et al., 2015). Thus, temperature remains the dominant effect on influencing liquid cloud fraction (Tan et al., 2014).
Freezing temperature box plots for all 88 snowmelt samples and images of the sampling sites are available in the Supplement. All recorded data, that is 96 freezing temperatures per sample, are deposited in the ETH Research Collection data repository at https://doi.org/10.3929/ethz-b-000387058 (Borduas-Dedekind, 2019). MATLAB data analysis codes are available upon request.
The supplement related to this article is available online at: https://doi.org/10.5194/acp-20-163-2020-supplement.
ROD and NBD designed the field study with contributions from KPB. KPB and NBD collected the samples. KPB conducted the experiments and analyzed the data with contributions from ROD and NBD. The paper was written by all authors.
The authors declare that they have no conflict of interests.
The authors acknowledge Robin Beglinger, Rafael Bonafini, Liam Brennan, Franz Friebel and Damian Urwyler for their expert ski touring and alpine mountaineering help in collecting snow samples. The authors thank Michael Rösch for technical assistance with DRINCZ and Ulrike Lohmann for insightful discussions.
This research has been supported by the Swiss National Science Foundation Ambizione grant (grant no. PZ00P2_179703) and by ETH Zurich. Robert O. David recognizes the Swiss National Science Foundation (grant no. 200021_156581) during his PhD work.
This paper was edited by Hinrich Grothe and reviewed by two anonymous referees.
Augustin, S., Wex, H., Niedermeier, D., Pummer, B., Grothe, H., Hartmann, S., Tomsche, L., Clauss, T., Voigtländer, J., Ignatius, K., and Stratmann, F.: Immersion freezing of birch pollen washing water, Atmos. Chem. Phys., 13, 10989–11003, https://doi.org/10.5194/acp-13-10989-2013, 2013.
Beck, A., Henneberger, J., Fugal, J. P., David, R. O., Lacher, L., and Lohmann, U.: Impact of surface and near-surface processes on ice crystal concentrations measured at mountain-top research stations, Atmos. Chem. Phys., 18, 8909–8927, https://doi.org/10.5194/acp-18-8909-2018, 2018.
Birkeland, K. W., Johnson, R. F., and Schmidt, D. S.: Near-Surface Faceted Crystals Formed by Diurnal Recrystallization: A Case Study of Weak Layer Formation in the Mountain Snowpack and its Contribution to Snow Avalanches, Arct. Alp. Res., 30, 200–204, https://doi.org/10.2307/1552135, 1998.
Boose, Y., Kanji, Z. A., Kohn, M., Sierau, B., Zipori, A., Crawford, I., Lloyd, G., Bukowiecki, N., Herrmann, E., Kupiszewski, P., Steinbacher, M., and Lohmann, U.: Ice Nucleating Particle Measurements at 241 K during Winter Months at 3580 m MSL in the Swiss Alps, J. Atmos. Sci., 73, 2203–2228, https://doi.org/10.1175/JAS-D-15-0236.1, 2016.
Borduas-Dedekind, N., Ossola, R., David, R. O., Boynton, L. S., Weichlinger, V., Kanji, Z. A., and McNeill, K.: Photomineralization mechanism changes the ability of dissolved organic matter to activate cloud droplets and to nucleate ice crystals, Atmos. Chem. Phys., 19, 12397–12412, https://doi.org/10.5194/acp-19-12397-2019, 2019.
Boucher, O. and Quaas, J.: Water vapour affects both rain and aerosol optical depth, Nat. Geosci., 6, 4–5, 2013.
Bundesamt für Landestopografie swisstopo: Swiss Geoportal, Landkarte , available at: https://map.geo.admin.ch, last access: 19 June 2018.
Cesana, G., Waliser, D. E., Jiang, X., and Li, J.-L. F.: Multimodel evaluation of cloud phase transition using satellite and reanalysis data, J. Geophys. Res.-Atmos., 120, 7871–7892, https://doi.org/10.1002/2014JD022932, 2015.
Chou, C., Stetzer, O., Weingartner, E., Jurányi, Z., Kanji, Z. A., and Lohmann, U.: Ice nuclei properties within a Saharan dust event at the Jungfraujoch in the Swiss Alps, Atmos. Chem. Phys., 11, 4725–4738, https://doi.org/10.5194/acp-11-4725-2011, 2011.
Christner, B. C., Cai, R., Morris, C. E., McCarter, K. S., Foreman, C. M., Skidmore, M. L., Montross, S. N., and Sands, D. C.: Geographic, seasonal, and precipitation chemistry influence on the abundance and activity of biological ice nucleators in rain and snow, P. Natl. Acad. Sci. USA, 105, 18854–18859, https://doi.org/10.1073/pnas.0809816105, 2008a.
Christner, B. C., Morris, C. E., Foreman, C. M., Cai, R., and Sands, D. C.: Ubiquity of Biological Ice Nucleators in Snowfall, Science, 319, 1214–1214, https://doi.org/10.1126/science.1149757, 2008b.
Colbeck, S. C.: A simulation of the enrichment of atmospheric pollutants in snow cover runoff, Water Resour. Res., 17, 1383–1388, https://doi.org/10.1029/WR017i005p01383, 1981.
Conen, F., Henne, S., Morris, C. E., and Alewell, C.: Atmospheric ice nucleators active = −12 ∘C can be quantified on PM10 filters, Atmos. Meas. Tech., 5, 321–327, https://doi.org/10.5194/amt-5-321-2012, 2012.
Conen, F., Bukowiecki, N., Gysel, M., Steinbacher, M., Fischer, A., and Reimann, S.: Low number concentration of ice nucleating particles in an aged smoke plume, Q. J. Roy. Meteorol. Soc., 144, 1991–1994, https://doi.org/10.1002/qj.3312, 2017.
Costa, A., Meyer, J., Afchine, A., Luebke, A., Günther, G., Dorsey, J. R., Gallagher, M. W., Ehrlich, A., Wendisch, M., Baumgardner, D., Wex, H., and Krämer, M.: Classification of Arctic, midlatitude and tropical clouds in the mixed-phase temperature regime, Atmos. Chem. Phys., 17, 12219–12238, https://doi.org/10.5194/acp-17-12219-2017, 2017.
Crawford, I., Bower, K. N., Choularton, T. W., Dearden, C., Crosier, J., Westbrook, C., Capes, G., Coe, H., Connolly, P. J., Dorsey, J. R., Gallagher, M. W., Williams, P., Trembath, J., Cui, Z., and Blyth, A.: Ice formation and development in aged, wintertime cumulus over the UK: observations and modelling, Atmos. Chem. Phys., 12, 4963–4985, https://doi.org/10.5194/acp-12-4963-2012, 2012.
Creamean, J. M., Mignani, C., Bukowiecki, N., and Conen, F.: Using freezing spectra characteristics to identify ice-nucleating particle populations during the winter in the Alps, Atmos. Chem. Phys., 19, 8123–8140, https://doi.org/10.5194/acp-19-8123-2019, 2019.
David, R. O., Cascajo-Castresana, M., Brennan, K. P., Rösch, M., Els, N., Werz, J., Weichlinger, V., Boynton, L. S., Bogler, S., Borduas-Dedekind, N., Marcolli, C., and Kanji, Z. A.: Development of the DRoplet Ice Nuclei Counter Zurich (DRINCZ): validation and application to field-collected snow samples, Atmos. Meas. Tech., 12, 6865–6888, https://doi.org/10.5194/amt-12-6865-2019, 2019.
de Boer, G., Morrison, H., Shupe, M. D., and Hildner, R.: Evidence of liquid dependent ice nucleation in high-latitude stratiform clouds from surface remote sensors, Geophys. Res. Lett., 38, L01803, https://doi.org/10.1029/2010gl046016, 2011.
DeMott, P. J., Prenni, A. J., Liu, X., Kreidenweis, S. M., Petters, M. D., Twohy, C. H., Richardson, M. S., Eidhammer, T., and Rogers, D. C.: Predicting global atmospheric ice nuclei distributions and their impacts on climate, P. Natl. Acad. Sci. USA, 107, 11217–11222, https://doi.org/10.1073/pnas.0910818107, 2010.
DeMott, P. J., Hill, T. C. J., McCluskey, C. S., Prather, K. A., Collins, D. B., Sullivan, R. C., Ruppel, M. J., Mason, R. H., Irish, V. E., Lee, T., Hwang, C. Y., Rhee, T. S., Snider, J. R., McMeeking, G. R., Dhaniyala, S., Lewis, E. R., Wentzell, J. J. B., Abbatt, J., Lee, C., Sultana, C. M., Ault, A. P., Axson, J. L., Martinez, M. D., Venero, I., Santos-Figueroa, G., Stokes, M. D., Deane, G. B., Mayol-Bracero, O. L., Grassian, V. H., Bertram, T. H., Bertram, A. K., Moffett, B. F., and Franc, G. D.: Sea spray aerosol as a unique source of ice nucleating particles, P. Natl. Acad. Sci. USA, 113, 5797–5803, https://doi.org/10.1073/pnas.1514034112, 2016.
Dreischmeier, K., Budke, C., Wiehemeier, L., Kottke, T., and Koop, T.: Boreal pollen contain ice-nucleating as well as ice-binding “antifreeze” polysaccharides, Sci. Rep., 7, 41890, https://doi.org/10.1038/srep41890, 2017.
Ehrman, S. H., Schwikowski, M., Baltensperger, U., and Ga, H. W.: Sampling and chemical analysis of ice crystals as a function of size, Atmos. Environ., 35, 5371–5376, https://doi.org/10.1016/S1352-2310(01)00294-1, 2001.
European Environment Agency: Digital Elevation Modell, European Environment Agency, available at: https://www.eea.europa.eu/data-and-maps/data/eea-reference-grids-2/gis-files/switzerland-shapefile, last access: 29 May 2018.
Failor, K. C., Schmale 3rd, D. G., Vinatzer, B. A., and Monteil, C. L.: Ice nucleation active bacteria in precipitation are genetically diverse and nucleate ice by employing different mechanisms, ISME J., 11, 2740–2753, https://doi.org/10.1038/ismej.2017.124, 2017.
Fan, J., Rosenfeld, D., Zhang, Y., Giangrande, S. E., Li, Z., Machado, L. A. T., Martin, S. T., Yang, Y., Wang, J., Artaxo, P., Barbosa, H. M. J., Braga, R. C., Comstock, J. M., Feng, Z., Gao, W., Gomes, H. B., Mei, F., Pöhlker, C., Pöhlker, M. L., Pöschl, U., and de Souza, R. A. F.: Substantial convection and precipitation enhancements by ultrafine aerosol particles, Science, 359, 411–418, https://doi.org/10.1126/science.aan8461, 2018.
Farrington, R. J., Connolly, P. J., Lloyd, G., Bower, K. N., Flynn, M. J., Gallagher, M. W., Field, P. R., Dearden, C., and Choularton, T. W.: Comparing model and measured ice crystal concentrations in orographic clouds during the INUPIAQ campaign, Atmos. Chem. Phys., 16, 4945–4966, https://doi.org/10.5194/acp-16-4945-2016, 2016.
Fletcher, N. H.: Surface structure of water and ice, Philos. Mag., 7, 255–269, https://doi.org/10.1080/14786436208211860, 1962.
Garimella, S., Rothenberg, D. A., Wolf, M. J., Wang, C., and Cziczo, D. J.: How Uncertainty in Field Measurements of Ice Nucleating Particles Influences Modeled Cloud Forcing, J. Atmos. Sci., 75, 179–187, https://doi.org/10.1175/JAS-D-17-0089.1, 2017.
Gauer, P.: Numerical modeling of blowing and drifting snow in Alpine terrain, J. Glaciol., 47, 97–110, https://doi.org/10.3189/172756501781832476, 2001.
Gute, E. and Abbatt, J. P. D.: Oxidative Processing Lowers the Ice Nucleation Activity of Birch and Alder Pollen, Geophys. Res. Lett., 45, 1647–1653, https://doi.org/10.1002/2017GL076357, 2018.
Hader, J. D., Wright, T. P., and Petters, M. D.: Contribution of pollen to atmospheric ice nuclei concentrations, Atmos. Chem. Phys., 14, 5433–5449, https://doi.org/10.5194/acp-14-5433-2014, 2014.
Hallett, J. and Mossop, S. C.: Production of secondary ice particles during the riming process, Nature, 249, 26–28, https://doi.org/10.1038/249026a0, 1974.
Eriksen Hammer, S., Mertes, S., Schneider, J., Ebert, M., Kandler, K., and Weinbruch, S.: Composition of ice particle residuals in mixed-phase clouds at Jungfraujoch (Switzerland): enrichment and depletion of particle groups relative to total aerosol, Atmos. Chem. Phys., 18, 13987–14003, https://doi.org/10.5194/acp-18-13987-2018, 2018.
Hande, L. B. and Hoose, C.: Partitioning the primary ice formation modes in large eddy simulations of mixed-phase clouds, Atmos. Chem. Phys., 17, 14105–14118, https://doi.org/10.5194/acp-17-14105-2017, 2017.
Hanlon, R., Powers, C., Failor, K., Monteil, C. L., Vinatzer, B. A., and Schmale, D. G.: Microbial ice nucleators scavenged from the atmosphere during simulated rain events, Atmos. Environ., 163, 182–189, https://doi.org/10.1016/j.atmosenv.2017.05.030, 2017.
Hartmann, M., Blunier, T., Brügger, S. O., Schmale, J., Schwikowski, M., Vogel, A., Wex, H., and Stratmann, F.: Variation of Ice Nucleating Particles in the European Arctic Over the Last Centuries, Geophys. Res. Lett., 46, 4007–4016, https://doi.org/10.1029/2019GL082311, 2019.
Hartmann, S., Augustin, S., Clauss, T., Wex, H., Šantl-Temkiv, T., Voigtländer, J., Niedermeier, D., and Stratmann, F.: Immersion freezing of ice nucleation active protein complexes, Atmos. Chem. Phys., 13, 5751–5766, https://doi.org/10.5194/acp-13-5751-2013, 2013.
Henneberg, O., Henneberger, J., and Lohmann, U.: Formation and development of orographic mixed-phase clouds, J. Atmos. Sci., 74, 3703–3724, https://doi.org/10.1175/JAS-D-16-0348.1, 2017.
Hill, T. C. J., Moffett, B. F., DeMott, P. J., Georgakopoulos, D. G., Stump, W. L., and Franc, G. D.: Measurement of ice nucleation-active bacteria on plants and in precipitation by quantitative PCR, Appl. Environ. Microbiol., 80, 1256–1267, https://doi.org/10.1128/AEM.02967-13, 2014.
Hill, T. C. J., DeMott, P. J., Tobo, Y., Fröhlich-Nowoisky, J., Moffett, B. F., Franc, G. D., and Kreidenweis, S. M.: Sources of organic ice nucleating particles in soils, Atmos. Chem. Phys., 16, 7195–7211, https://doi.org/10.5194/acp-16-7195-2016, 2016.
Hiranuma, N., Möhler, O., Yamashita, K., Tajiri, T., Saito, A., Kiselev, A., Hoffmann, N., Hoose, C., Jantsch, E., Koop, T., and Murakami, M.: Ice nucleation by cellulose and its potential contribution to ice formation in clouds, Nat. Geosci., 8, 273–277, https://doi.org/10.1038/ngeo2374, 2015.
Hoose, C. and Moehler, O.: Heterogeneous ice nucleation on atmospheric aerosols: a review of results from laboratory experiments, Atmos. Chem. Phys., 12, 9817–9854, https://doi.org/10.5194/acp-12-9817-2012, 2012.
Institut für Schnee- und Lawinenforschung SLF: Snowheight and Snowfall Measurements, available at: https://www.slf.ch/de/lawinenbulletin-und-schneesituation/messwerte.html, last access: 19 June 2018.
Irish, V. E., Elizondo, P., Chen, J., Chou, C., Charette, J., Lizotte, M., Ladino, L. A., Wilson, T. W., Gosselin, M., Murray, B. J., Polishchuk, E., Abbatt, J. P. D., Miller, L. A., and Bertram, A. K.: Ice-nucleating particles in Canadian Arctic sea-surface microlayer and bulk seawater, Atmos. Chem. Phys., 17, 10583–10595, https://doi.org/10.5194/acp-17-10583-2017, 2017.
Irish, V. E., Hanna, S. J., Willis, M. D., China, S., Thomas, J. L., Wentzell, J. J. B., Cirisan, A., Si, M., Leaitch, W. R., Murphy, J. G., Abbatt, J. P. D., Laskin, A., Girard, E. and Bertram, A. K.: Ice nucleating particles in the marine boundary layer in the Canadian Arctic during summer 2014, Atmos. Chem. Phys., 19, 1027–1039, https://doi.org/10.5194/acp-19-1027-2019, 2019.
Joly, M., Amato, P., Deguillaume, L., Monier, M., Hoose, C., and Delort, A.-M.: Quantification of ice nuclei active at near 0 ∘C temperatures in low-altitude clouds at the Puy de Dôme atmospheric station, Atmos. Chem. Phys., 14, 8185–8195, https://doi.org/10.5194/acp-14-8185-2014, 2014.
Kanji, Z. A., Welti, A., Chou, C., Stetzer, O., and Lohmann, U.: Laboratory studies of immersion and deposition mode ice nucleation of ozone aged mineral dust particles, Atmos. Chem. Phys., 13, 9097–9118, https://doi.org/10.5194/acp-13-9097-2013, 2013.
Kanji, Z. A., Ladino, L. A., Wex, H., Boose, Y., Burkert-Kohn, M., Cziczo, D. J., and Krämer, M.: Overview of Ice Nucleating Particles, Meteorol. Monogr., 58, 1.1–1.33, https://doi.org/10.1175/AMSMONOGRAPHS-D-16-0006.1, 2017.
Knackstedt, K., Moffett, B. F., Hartmann, S., Wex, H., Hill, T. C. J., Glasgo, E., Reitz, L., Augustin-Bauditz, S., Beall, B., Bullerjahn, G. S., Fröhlich-Nowoisky, J., Grawe, S., Lubitz, J., Stratmann, F., and McKay, R. M.: A terrestrial origin for abundant riverine nanoscale ice-nucleating particles, Environ. Sci. Technol., 6, 1454, https://doi.org/10.1021/acs.est.8b03881, 2018.
Knopf, D. A., Alpert, P. A., and Wang, B.: The role of organic aerosol in atmospheric ice nucleation: A review, ACS Earth Space Chem., 2, 168–202, https://doi.org/10.1021/acsearthspacechem.7b00120, 2018.
Koop, T.: Homogeneous Ice Nucleation in Water and Aqueous Solutions, Z. Phys. Chem., 218, 1231–1258, https://doi.org/10.1524/zpch.218.11.1231.50812, 2004.
Koop, T. and Zobrist, B.: Parameterizations for ice nucleation in biological and atmospheric systems, Phys. Chem. Chem. Phys., 11, 10839–10850, https://doi.org/10.1039/b914289d, 2009.
Korolev, A. and Isaac, G.: Phase transformation of mixed-phase clouds, Q. J. Roy. Meteorol. Soc., 129, 19–38, https://doi.org/10.1256/qj.01.203, 2003.
Korolev, A., McFarquhar, G., Field, P. R., Franklin, C., Lawson, P., Wang, Z., Williams, E., Abel, S. J., Axisa, D., Borrmann, S., Crosier, J., Fugal, J., Krämer, M., Lohmann, U., Schlenczek, O., Schnaiter, M., and Wendisch, M.: Mixed-Phase Clouds: Progress and Challenges, Meteorol. Monogr., 58, 5.1–5.50, https://doi.org/10.1175/AMSMONOGRAPHS-D-17-0001.1, 2017.
Korolev, A. V.: Rates of phase transformations in mixed-phase clouds, Q. J. Roy. Meteorol. Soc., 134, 595–608, https://doi.org/10.1002/qj.230, 2008.
Kuhn, M.: The nutrient cycle through snow and ice, a review, Aquat. Sci., 63, 150–167, https://doi.org/10.1007/PL00001348, 2001.
Lacher, L., Lohmann, U., Boose, Y., Zipori, A., Herrmann, E., Bukowiecki, N., Steinbacher, M., and Kanji, Z. A.: The Horizontal Ice Nucleation Chamber (HINC): INP measurements at conditions relevant for mixed-phase clouds at the High Altitude Research Station Jungfraujoch, Atmos. Chem. Phys., 17, 15199–15224, https://doi.org/10.5194/acp-17-15199-2017, 2017.
Lacher, L., DeMott, P. J., Levin, E. J. T., Suski, K. J., Boose, Y., Zipori, A., Herrmann, E., Bukowiecki, N., Steinbacher, M., Gute, E., Abbatt, J. P. D., Lohmann, U., and Kanji, Z. A.: Background Free-Tropospheric Ice Nucleating Particle Concentrations at Mixed-Phase Cloud Conditions, J. Geophys. Res.-Atmos., 123, 10506–10525, https://doi.org/10.1029/2018JD028338, 2018a.
Lacher, L., Steinbacher, M., Bukowiecki, N., Herrmann, E., Zipori, A., and Kanji, Z. A.: Impact of Air Mass Conditions and Aerosol Properties on Ice Nucleating Particle Concentrations at the High Altitude Research Station Jungfraujoch, Atmosphere, 9, 363, https://doi.org/10.3390/atmos9090363, 2018b.
Lauber, A., Kiselev, A., Pander, T., Handmann, P., and Leisner, T.: Secondary ice formation during freezing of levitated droplets, J. Atmos. Sci., 75, 2815–2826, https://doi.org/10.1175/JAS-D-18-0052.1, 2018.
Lloyd, G., Choularton, T. W., Bower, K. N., Gallagher, M. W., Connolly, P. J., Flynn, M., Farrington, R., Crosier, J., Schlenczek, O., Fugal, J., and Henneberger, J.: The origins of ice crystals measured in mixed-phase clouds at the high-alpine site Jungfraujoch, Atmos. Chem. Phys., 15, 12953–12969, https://doi.org/10.5194/acp-15-12953-2015, 2015.
Lohmann, U., Henneberger, J., Henneberg, O., Fugal, J. P., Bühl, J., and Kanji, Z. A.: Persistence of orographic mixed-phase cloud, Geophys. Res. Lett., 43, 10512–10519, https://doi.org/10.1002/2016GL071036, 2016.
Mason, B. J.: The rapid glaciation of slightly supercooled cumulus clouds, Q. J. Roy. Meteorol. Soc., 122, 357–365, https://doi.org/10.1002/qj.49712253003, 1996.
Mason, R. H., Si, M., Chou, C., Irish, V. E., Dickie, R., Elizondo, P., Wong, R., Brintnell, M., Elsasser, M., Lassar, W. M., Pierce, K. M., Leaitch, W. R., MacDonald, A. M., Platt, A., Toom-Sauntry, D., Sarda-Estève, R., Schiller, C. L., Suski, K. J., Hill, T. C. J., Abbatt, J. P. D., Huffman, J. A., DeMott, P. J., and Bertram, A. K.: Size-resolved measurements of ice-nucleating particles at six locations in North America and one in Europe, Atmos. Chem. Phys., 16, 1637–1651, https://doi.org/10.5194/acp-16-1637-2016, 2016.
Matus, A. V. and L'Ecuyer, T. S.: The role of cloud phase in Earth's radiation budget: Cloud Phase In Earth's Radiation Budget, J. Geophys. Res.-Atmos., 122, 2559–2578, https://doi.org/10.1002/2016JD025951, 2017.
McCoy, D. T., Burrows, S. M., Wood, R., Grosvenor, D. P., Elliott, S. M., Ma, P.-L., Rasch, P. J., and Hartmann, D. L.: Natural aerosols explain seasonal and spatial patterns of Southern Ocean cloud albedo, Sci. Adv., 1, e1500157, https://doi.org/10.1126/sciadv.1500157, 2015.
McCoy, D. T., Tan, I., Hartmann, D. L., Zelinka, M. D., and Storelvmo, T.: On the relationships among cloud cover, mixed-phase partitioning, and planetary albedo in GCMs: Cloud cover, mixed-phase, and albedo, J. Adv. Model. Earth Syst., 8, 650–668, https://doi.org/10.1002/2015MS000589, 2016.
Meola, M., Lazzaro, A., and Zeyer, J.: Bacterial Composition and Survival on Sahara Dust Particles Transported to the European Alps, Front. Microbiol., 6, 1454, https://doi.org/10.3389/fmicb.2015.01454, 2015.
Mertes, S., Verheggen, B., Walter, S., Connolly, P., Ebert, M., Schneider, J., Bower, K. N., Cozic, J., Weinbruch, S., Baltensperger, U., and Weingartner, E.: Counterflow Virtual Impactor Based Collection of Small Ice Particles in Mixed-Phase Clouds for the Physico-Chemical Characterization of Tropospheric Ice Nuclei: Sampler Description and First Case Study, Aerosol Sci. Tech., 41, 848–864, https://doi.org/10.1080/02786820701501881, 2007.
Mignani, C., Creamean, J. M., Zimmermann, L., Alewell, C., and Conen, F.: New type of evidence for secondary ice formation at around −15 ∘C in mixed-phase clouds, Atmos. Chem. Phys., 19, 877–886, https://doi.org/10.5194/acp-19-877-2019, 2019.
Morris, C. E., Conen, F., Alex Huffman, J., Phillips, V., Pöschl, U., and Sands, D. C.: Bioprecipitation: a feedback cycle linking Earth history, ecosystem dynamics and land use through biological ice nucleators in the atmosphere, Global Change Biol., 20, 341–351, https://doi.org/10.1111/gcb.12447, 2014.
Mossop, S. C.: Some Factors Governing Ice Particle Multiplication in Cumulus Clouds, J. Atmos. Sci., 35, 2033–2037, https://doi.org/10.1175/1520-0469(1978)035<2033:SFGIPM>2.0.CO;2, 1978.
Mülmenstädt, J., Sourdeval, O., Delanoë, J., and Quaas, J.: Frequency of occurrence of rain from liquid-, mixed-, and ice-phase clouds derived from A-Train satellite retrievals, Geophys. Res. Lett., 42, 6502–6509, https://doi.org/10.1002/2015GL064604, 2015.
Murray, B. J., O'Sullivan, D., Atkinson, J. D., and Webb, M. E.: Ice nucleation by particles immersed in supercooled cloud droplets, Chem. Soc. Rev., 41, 6519–6554, https://doi.org/10.1039/c2cs35200a, 2012.
Niemand, M., Möhler, O., Vogel, B., Vogel, H., Hoose, C., Connolly, P., Klein, H., Bingemer, H., DeMott, P., Skrotzki, J., and Leisner, T.: A Particle-Surface-Area-Based Parameterization of Immersion Freezing on Desert Dust Particles, J. Atmos. Sci., 69, 3077–3092, https://doi.org/10.1175/JAS-D-11-0249.1, 2012.
Nillius, B., Frank, F., Bingemer, H., Curtius, J., and Bundke, U.: Measurements of IN and BIO-IN with the fast ice nucleus chamber FINCH at Mt. Zugspitze, Mt. Puy de Dôme and Jungfraujoch during fall and winter, AIP Con. P., 1527, 960–963, https://doi.org/10.1063/1.4803432, 2013.
O'Sullivan, D., Murray, B. J., Malkin, T. L., Whale, T. F., Umo, N. S., Atkinson, J. D., Price, H. C., Baustian, K. J., Browse, J., and Webb, M. E.: Ice nucleation by fertile soil dusts: relative importance of mineral and biogenic components, Atmos. Chem. Phys., 14, 1853–1867, https://doi.org/10.5194/acp-14-1853-2014, 2014.
Petters, M. D. and Wright, T. P.: Revisiting ice nucleation from precipitation samples, Geophys. Res. Lett., 42, 8758–8766, https://doi.org/10.1002/2015GL065733, 2015.
Phillips, V. T. J., DeMott, P. J., and Andronache, C.: An empirical parameterization of heterogeneous ice nucleation for multiple chemical species of aerosol, J. Atmos. Sci., 65, 2757–2783, https://doi.org/10.1175/2007jas2546.1, 2008.
Phillips, V. T. J., Demott, P. J., Andronache, C., Pratt, K. A., Prather, K. A., Subramanian, R. and Twohy, C.: Improvements to an Empirical Parameterization of Heterogeneous Ice Nucleation and Its Comparison with Observations, J. Atmos. Sci., 70, 378–409, https://doi.org/10.1175/JAS-D-12-080.1, 2012.
Pithan, F., Medeiros, B., and Mauritsen, T.: Mixed-phase clouds cause climate model biases in Arctic wintertime temperature inversions, Clim. Dynam., 43, 289–303, https://doi.org/10.1007/s00382-013-1964-9, 2014.
Polen, M., Brubaker, T., Somers, J., and Sullivan, R. C.: Cleaning up our water: reducing interferences from nonhomogeneous freezing of “pure” water in droplet freezing assays of ice-nucleating particles, Atmos. Meas. Tech., 11, 5315–5334, https://doi.org/10.5194/amt-11-5315-2018, 2018.
Prenni, A. J., Harrington, J. Y., Tjernström, M., DeMott, P. J., Avramov, A., Long, C. N., Kreidenweis, S. M., Olsson, P. Q., and Verlinde, J.: Can Ice-Nucleating Aerosols Affect Arctic Seasonal Climate?, B. Am. Meteorol. Soc., 88, 541–550, https://doi.org/10.1175/BAMS-88-4-541, 2007.
Pruppacher, H. R. and Klett, J. D.: Microphysics of Clouds and Precipitation, 2nd Edn., Springer Netherlands, available at: https://www.springer.com/de/book/9780792342113 (last access: 30 May 2018), 2010.
Pummer, B. G., Bauer, H., Bernardi, J., Bleicher, S., and Grothe, H.: Suspendable macromolecules are responsible for ice nucleation activity of birch and conifer pollen, Atmos. Chem. Phys., 12, 2541–2550, https://doi.org/10.5194/acp-12-2541-2012, 2012.
Pummer, B. G., Budke, C., Augustin-Bauditz, S., Niedermeier, D., Felgitsch, L., Kampf, C. J., Huber, R. G., Liedl, K. R., Loerting, T., Moschen, T., Schauperl, M., Tollinger, M., Morris, C. E., Wex, H., Grothe, H., Pöschl, U., Koop, T., and Fröhlich-Nowoisky, J.: Ice nucleation by water-soluble macromolecules, Atmos. Chem. Phys., 15, 4077–4091, https://doi.org/10.5194/acp-15-4077-2015, 2015.
Rangel-Alvarado, R. B., Nazarenko, Y., and Ariya, P. A.: Snow-borne nanosized particles: Abundance, distribution, composition, and significance in ice nucleation processes, J. Geophys. Res.-Atmos., 120, 11760–11774, https://doi.org/10.1002/2015JD023773, 2015.
Rangel-Alvarado, R. B., Willis, C. E., Kirk, J. L., St Louis, V. L., Amyot, M., Bélanger, D., and Ariya, P. A.: Athabasca oil sands region snow contains efficient micron and nano-sized ice nucleating particles, Environ. Pollut., 252, 289–295, https://doi.org/10.1016/j.envpol.2019.05.105, 2019.
Stöckel, P., Weidinger, I. M., Baumgärtel, H., and Leisner, T.: Rates of Homogeneous Ice Nucleation in Levitated H2O and D2O Droplets, J. Phys. Chem. A, 109, 2540–2546, https://doi.org/10.1021/jp047665y, 2005.
Stopelli, E., Conen, F., Zimmermann, L., Alewell, C., and Morris, C. E.: Freezing nucleation apparatus puts new slant on study of biological ice nucleators in precipitation, Atmos. Meas. Tech., 7, 129–134, https://doi.org/10.5194/amt-7-129-2014, 2014.
Stopelli, E., Conen, F., Morris, C. E., Herrmann, E., Bukowiecki, N., and Alewell, C.: Ice nucleation active particles are efficiently removed by precipitating clouds, Sci. Rep., 5, 16433, https://doi.org/10.1038/srep16433, 2015.
Stopelli, E., Conen, F., Morris, C. E., Herrmann, E., Henne, S., Steinbacher, M., and Alewell, C.: Predicting abundance and variability of ice nucleating particles in precipitation at the high-altitude observatory Jungfraujoch, Atmos. Chem. Phys., 16, 8341–8351, https://doi.org/10.5194/acp-16-8341-2016, 2016.
Stopelli, E., Conen, F., Guilbaud, C., Zopfi, J., Alewell, C., and Morris, C. E.: Ice nucleators, bacterial cells and Pseudomonas syringae in precipitation at Jungfraujoch, Biogeosciences, 14, 1189–1196, https://doi.org/10.5194/bg-14-1189-2017, 2017.
Suski, K. J., Hill, T. C. J., Levin, E. J. T., Miller, A., DeMott, P. J., and Kreidenweis, S. M.: Agricultural harvesting emissions of ice-nucleating particles, Atmos. Chem. Phys., 18, 13755–13771, https://doi.org/10.5194/acp-18-13755-2018, 2018.
Tan, I., Storelvmo, T., and Choi, Y.-S.: Spaceborne lidar observations of the ice-nucleating potential of dust, polluted dust, and smoke aerosols in mixed-phase clouds, J. Geophys. Res.-Atmos., 119, 6653–6665, https://doi.org/10.1002/2013JD021333, 2014.
Tobo, Y., DeMott, P. J., Hill, T. C. J., Prenni, A. J., Swoboda-Colberg, N. G., Franc, G. D., and Kreidenweis, S. M.: Organic matter matters for ice nuclei of agricultural soil origin, Atmos. Chem. Phys., 14, 8521–8531, https://doi.org/10.5194/acp-14-8521-2014, 2014.
Vali, G.: Sizes of Atmospheric Ice Nuclei, Nature, 212, 384–385, https://doi.org/10.1038/212384a0, 1966. Vali, G.: Freezing Nucleus Content of Hail and Rain in Alberta, J. Appl. Meteorol., 10, 73–78, https://doi.org/10.1175/1520-0450(1971)010<0073:FNCOHA>2.0.CO;2, 1971a.
Vali, G.: Quantitative evaluation of experimental results an the heterogeneous freezing nucleation of supercooled liquids, J. Atmos. Sci., 28, 402–409, https://doi.org/10.1175/1520-0469(1971)028<0402:QEOERA>2.0.CO;2, 1971b.
Vali, G.: Revisiting the differential freezing nucleus spectra derived from drop-freezing experiments: methods of calculation, applications, and confidence limits, Atmos. Meas. Tech., 12, 1219–1231, https://doi.org/10.5194/amt-12-1219-2019, 2019.
Vali, G., DeMott, P. J., Möhler, O., and Whale, T. F.: Technical Note: A proposal for ice nucleation terminology, Atmos. Chem. Phys., 15, 10263–10270, https://doi.org/10.5194/acp-15-10263-2015, 2015.
Vergara-Temprado, J., Miltenberger, A. K., Furtado, K., Grosvenor, D. P., Shipway, B. J., Hill, A. A., Wilkinson, J. M., Field, P. R., Murray, B. J., and Carslaw, K. S.: Strong control of Southern Ocean cloud reflectivity by ice-nucleating particles, P. Natl. Acad. Sci. USA, 115, 2687–2692, https://doi.org/10.1073/pnas.1721627115, 2018.
Wang, P. K.: Physics and Dynamics of Clouds and Precipitation, Cambridge University Press, Cambridge, 2013.
Welti, A., Müller, K., Fleming, Z. L., and Stratmann, F.: Concentration and variability of ice nuclei in the subtropical maritime boundary layer, Atmos. Chem. Phys., 18, 5307–5320, https://doi.org/10.5194/acp-18-5307-2018, 2018.
Wex, H., McFiggans, G., Henning, S., and Stratmann, F.: Influence of the external mixing state of atmospheric aerosol on derived CCN number concentrations, Geophys. Res. Lett., 37, L10805, https://doi.org/10.1029/2010GL043337, 2010.
Wilson, T. W., Ladino, L. A., Alpert, P. A., Breckels, M. N., Brooks, I. M., Browse, J., Burrows, S. M., Carslaw, K. S., Huffman, J. A., Judd, C., Kilthau, W. P., Mason, R. H., McFiggans, G., Miller, L. A., Najera, J. J., Polishchuk, E., Rae, S., Schiller, C. L., Si, M., Temprado, J. V., Whale, T. F., Wong, J. P. S., Wurl, O., Yakobi-Hancock, J., Abbatt, J. P. D., Aller, J. Y., Bertram, A. K., Knopf, D. A., and Murray, B. J.: A marine biogenic source of atmospheric ice-nucleating particles, Nature, 525, 234–238, 2015.'
Wright, T. P., Petters, M. D., Hader, J. D., Morton, T., and Holder, A. L.: Minimal cooling rate dependence of ice nuclei activity in the immersion mode, J. Geophys. Res.-Atmos., 118, 10535–10543, https://doi.org/10.1002/jgrd.50810, 2013.
Wright, T. P., Hader, J. D., McMeeking, G. R., and Petters, M. D.: High Relative Humidity as a Trigger for Widespread Release of Ice Nuclei, Aerosol Sci. Tech., 48, i–v, https://doi.org/10.1080/02786826.2014.968244, 2014.
Zhang, L., Gong, S., Padro, J., and Barrie, L.: A size-segregated particle dry deposition scheme for an atmospheric aerosol module, Atmos. Environ., 35, 549–560, https://doi.org/10.1016/S1352-2310(00)00326-5, 2001.
Zipori, A., Reicher, N., Erel, Y., Rosenfeld, D., Sandler, A., Knopf, D. A., and Rudich, Y.: The Role of Secondary Ice Processes in Midlatitude Continental Clouds, J. Geophys. Res.-Atmos., 123, 762–777, https://doi.org/10.1029/2018JD029146, 2018.