the Creative Commons Attribution 4.0 License.
the Creative Commons Attribution 4.0 License.
 | 09 Dec 2019
Six-year source apportionment of submicron organic aerosols from near-continuous highly time-resolved measurements at SIRTA (Paris area, France)
Yunjiang Zhang
Olivier Favez
Jean-Eudes Petit
Francesco Canonaco
Francois Truong
Nicolas Bonnaire
Vincent Crenn
Tanguy Amodeo
Andre S. H. Prévôt
Jean Sciare
Valerie Gros
Alexandre Albinet
Organic aerosol (OA) particles are recognized as key factors influencing air quality and climate change. However, highly time-resolved long-term characterizations of their composition and sources in ambient air are still very limited due to challenging continuous observations. Here, we present an analysis of long-term variability of submicron OA using the combination of an aerosol chemical speciation monitor (ACSM) and a multiwavelength Aethalometer from November 2011 to March 2018 at a peri-urban background site of the Paris region (France). Source apportionment of OA was achieved via partially constrained positive matrix factorization (PMF) using the multilinear engine (ME-2). Two primary OA (POA) and two oxygenated OA (OOA) factors were identified and quantified over the entire studied period. POA factors were designated as hydrocarbon-like OA (HOA) and biomass burning OA (BBOA). The latter factor presented a significant seasonality with higher concentrations in winter with significant monthly contributions to OA (18 %–33 %) due to enhanced residential wood burning emissions. HOA mainly originated from traffic emissions but was also influenced by biomass burning in cold periods. OOA factors were distinguished between their less- and more-oxidized fractions (LO-OOA and MO-OOA, respectively). These factors presented distinct seasonal patterns, associated with different atmospheric formation pathways. A pronounced increase in LO-OOA concentrations and contributions (50 %–66 %) was observed in summer, which may be mainly explained by secondary OA (SOA) formation processes involving biogenic gaseous precursors. Conversely, high concentrations and OA contributions (32 %–62 %) of MO-OOA during winter and spring seasons were partly associated with anthropogenic emissions and/or long-range transport from northeastern Europe. The contribution of the different OA factors as a function of OA mass loading highlighted the dominant roles of POA during pollution episodes in fall and winter and of SOA for highest springtime and summertime OA concentrations. Finally, long-term trend analyses indicated a decreasing feature (of about −175 ng m−3 yr−1) for MO-OOA, very limited or insignificant decreasing trends for primary anthropogenic carbonaceous aerosols (BBOA and HOA, along with the fossil-fuel and biomass-burning black carbon components) and no statistically significant trend for LO-OOA over the 6-year investigated period.
- Article
(8687 KB) -
Supplement
(2963 KB) - BibTeX
- EndNote


Organic aerosol (OA) particles account for a large mass fraction of submicron particulate matter (PM1) in the atmosphere (Zhang et al., 2007) and play a key role in regional air pollution and climate (Boucher et al., 2013). Primary OA (POA) originates from direct emissions of primary sources (e.g., fossil-fuel and biomass combustion). Secondary OA (SOA) is formed from atmospheric oxidation processes of gas precursors, i.e., volatile organic compounds (VOCs) (Kroll and Seinfeld, 2008; Hallquist et al., 2009; Nozière et al., 2015). Some typical SOA formation processes in the atmosphere, such as photochemistry (Xu et al., 2017), aqueous-phase oxidation (Gilardoni et al., 2016) and heterogeneous reactions (Xu et al., 2015), are observed. Due to their multiplicity and complexity, these various sources and physicochemical mechanisms remain poorly documented and understood.
Although numerous time-limited field campaigns allowed us to greatly improve our knowledge of OA properties in the last decade (e.g., Jimenez et al., 2009; Lanz et al., 2010; Zhang et al., 2011; Shrivastava et al., 2017; Li et al., 2017; Srivastava et al., 2018a, and references therein), similar studies performed on a long-term scale remain scarce and particularly challenging (Fröhlich et al., 2015a; Schlag et al., 2016; Bozzetti et al., 2017; Daellenbach et al., 2017; Sun et al., 2018). Long-term observations with high temporal resolution and source apportionment of OA are nevertheless necessary to better quantify the contribution of airborne OA particles to air quality and to set up scientifically sound emission control strategies. They can also contribute to a better understanding of the atmospheric fate of OA and reduce uncertainties associated with its (in)direct radiative forcing.
Online aerosol characterization techniques, such as aerosol mass spectrometry (AMS), have demonstrated their capacity to improve our knowledge of key aerosol chemical components – such as OA – by providing highly time-resolved mass spectral data for the nonrefractory PM1 fraction (NR-PM1) (Jayne et al., 2000; Canagaratna et al., 2007). Using receptor model approaches, especially positive matrix factorization (PMF) (Paatero and Tapper, 1994), OA measured by AMS techniques can be further portioned into various source factors using statistic models (Ulbrich et al., 2009; Zhang et al., 2011). For example, hydrocarbon-like OA (HOA) is frequently identified within urban environments and attributed to primary emissions from fuel consumption (Zhang et al., 2007; Jimenez et al., 2009), while biomass burning OA (BBOA) is often resolved specifically during cold seasons or within wild fire plumes (Alfarra et al., 2007; Lanz et al., 2010; Zhou et al., 2017). Oxygenated OA (OOA), commonly considered a surrogate for SOA, is ubiquitously observed in urban, suburban and remote environments (Zhang et al., 2007, 2011; Srivastava et al., 2018a; Crippa et al., 2014). OOA can be further separated into different fractions, being for instance classified according to its atmospheric aging described as more oxidized (MO-OOA) or less oxidized (LO-OOA) compared to each other (Jimenez et al., 2009; Ng et al., 2011a; Sun et al., 2018). Different OOA factors can also be identified as relevant to various sources of SOA precursors, such as anthropogenic activities (e.g., traffic and biomass burning emissions) (Gilardoni et al., 2016; Gentner et al., 2017) and biogenic emissions (e.g., isoprene and monoterpenes) (Xu et al., 2015; Zhang et al., 2018; Freney et al., 2018) in specific regions and/or seasons. Such source apportionment has the potential to assess the efficiency of air pollution mitigation by current emission control strategies.
Based on being better suited for long-term monitoring applications due to lower cost and easier maintenance than AMS, an aerosol chemical speciation monitor (ACSM) has been designed to provide continuous measurements of the main nonrefractory chemical species within submicron aerosols (Ng et al., 2011b). As for the AMS, OA mass spectra obtained by the ACSM can be used in PMF analysis for quantification of OA sources (e.g., Sun et al., 2012; Fröhlich et al., 2015b; Zhang et al., 2015). So far, several time-extended OA source apportionment studies have been reported based on ACSM measurements at various sites (Canonaco et al., 2015; Fröhlich et al., 2015a; Schlag et al., 2016; Reyes-Villegas et al., 2016; Rattanavaraha et al., 2017; Sun et al., 2018). However, these studies have been limited to periods of up to 2 years durations.
The longest ACSM time series recorded so far (from end of 2011 onwards) is used here to investigate OA sources at a regional background site of the Paris region (France), which is one of the largest urbanized regions in Europe. It has already been demonstrated that OA plays a dominant role in controlling atmospheric pollution in this region (Bressi et al., 2013; Petit et al., 2015). Furthermore, time-limited (typically, 1–2 months) measurement campaigns demonstrated that primary fine aerosols are mainly influenced there by traffic emissions all over the year and residential wood burning during cold seasons, while secondary aerosols originate from both local production and regional transport (Sciare et al., 2011; Crippa et al., 2013a, b; Petit et al., 2014; Srivastava et al., 2018b). Furthermore, such a background site can be considered representative of air quality at a regional scale, including neighboring northwestern countries (Bressi et al., 2013, 2014). In the present study, main OA factors were identified and quantified from seasonal PMF analyses (total 25 seasons) on the 6-year ACSM datasets, with the objective of understanding sources and long-term temporal trends of these factors. In this respect, sporadic and/or minor OA sources were not accounted for in this study. The seasonal variations, weekly and diel cycles, and the long-term temporal trends of the major OA factors were investigated. The relative contributions of the various POA and SOA fractions were also plotted as a function of total submicron OA loadings with the objective to better identify the main OA sources responsible for regional pollution episodes. Finally, the geographical origins of high loadings of SOA factors were investigated using air mass back-trajectory analyses.
Long-term submicron aerosol online measurements used in this study were performed from 1 November 2011 to 26 March 2018 at the SIRTA facility (Site Instrumental de Recherche par Télédétection Atmosphérique; 2.15∘ E, 48.71∘ N; https://sirta.ipsl.fr/, last access: 28 November 2019). This exploratory platform is part of the European Aerosols, Clouds and Trace gases Research InfraStructure (ACTRIS, https://www.actris.eu, last access: 28 November 2019) (e.g., Pandolfi et al., 2018). It is located 25 km southwest of Paris city center and is considered representative of the background air quality of the Paris region (Haeffelin et al., 2005; Petit et al., 2015). More information about the environmental features of the sampling site area is given in the introduction above.
Major submicron aerosol chemical species, i.e., OA, nitrate, sulfate, ammonium, and chloride, were measured using a quadrupole ACSM. These measurements were performed continuously, always using the same instrument. Over the whole investigated period, the data capture is of about 87 %, and missing data correspond to two field campaigns performed elsewhere (in fall 2012 and March 2013) and to a few technical breakdown and maintenance periods. Briefly, fine aerosols are sampled into the ACSM system through a 100 µm diameter critical orifice mounted at the inlet of the PM1 aerodynamic lens (Liu et al., 2007; Ng et al., 2011b). Then, submicron aerosol particles are impacted and vaporized at a temperature (T) of about 600 ∘C and detected using electron impact (70 eV) ionization mass spectrometry. The ACSM was operated at a time resolution of about 30 min with a scan rate of 0.2 s amu−1 from m∕z 12 to 150 amu (atomic mass unit). Coarse particles were removed upstream using an URG Corporation cyclone separator (with the size cutoff diameter of 2.5 µm). Calibrations of the detector response factor were performed regularly (typically every 6 months) using ammonium nitrate solutions (Ng et al., 2011b; Freney et al., 2019). The 1.4 default value was used for the OA relative ion efficiency for the whole dataset (Canagaratna et al., 2007). The composition-dependent collection efficiency correction recommended by Middlebrook et al. (2012) was applied to the whole ACSM data used here. The accuracy of these ACSM measurements and the overall good working conditions of the instrument were verified through the participation in the ACTRIS ACSM intercomparison exercises that took place at SIRTA in November–December 2013 (Crenn et al., 2015; Fröhlich et al., 2015b) and March–April 2016 (Freney et al., 2019, and Fig. S1 in the Supplement).
Co-located multiwavelength Aethalometer (Magee Scientific) datasets were also available for the purpose of the study, providing complementary information on equivalent black carbon (eBC) concentrations and sources. Two Aethalometers were used successively: from November 2011 to February 2013 (AE31 model) and then from March 2013 to March 2018 (AE33 model). Both instruments measure aerosol light attenuation at seven wavelengths, i.e., 370, 470, 520, 590, 660, 880 and 950 nm. The detailed descriptions of the AE31 operation at SIRTA and Aethalometer data analysis can be found in Petit et al. (2015). The AE33 is an advanced Aethalometer version, which allows for better assessment and compensation of the filter-loading effect using two simultaneous light attenuation measurements performed at different rates of particle accumulation onto the filter tape (Drinovec et al., 2015, 2017). An excellent agreement (R=0.94, slope ) between AE31 and AE33 for measuring eBC mass concentrations has been demonstrated by Drinovec et al. (2015), suggesting a negligible influence of measurement uncertainties between the two instruments on quantification of eBC concentrations. In this work, the mass concentration of eBC was estimated from an attenuation measurement performed at 880 nm as described by Petit et al. (2015) and Zhang et al. (2018). A correction factor of 1.64 was applied to raw absorption data delivered by the instrument as recommended within the ACTRIS network (Zanatta et al., 2016). Furthermore, eBC could be discriminated between its two main combustion sources, i.e., fossil-fuel combustion (eBCff) and wood burning emissions (eBCwb) using the Aethalometer model (Sandradewi et al., 2008; Favez et al., 2010; Sciare et al., 2011; Drinovec et al., 2015). For these calculations, absorption Angström exponent (AAE) values – in the wavelength range 470–950 nm – of 0.9 and 1.7 for eBCff and eBCwb, respectively, were estimated by the AAE distributions observed in this study (see Fig. S2). Meanwhile, those values are in a good agreement with the recommended values by Zotter et al. (2017).
In addition to ACSM and AE33 measurements, co-located offline analyses were performed from daily (24 h) PM2.5 filter samples, collected and analyzed for their elemental and organic carbon contents (EC and OC, respectively) following the ACTRIS recommendations (Zanatta et al., 2017; Zhang et al., 2018). Briefly, filters were collected using a low-volume sampler (Partisol model 2025; Thermo Scientific) equipped upstream with a VOC denuder system. Mass concentrations of OC and EC from August 2012 to March 2018 were then quantified using a Sunset Lab OC/EC analyzer implemented with the EUSAAR-2 thermal–optical protocol (Cavalli et al., 2010). As shown in Fig. S3, good agreements are obtained between eBC and EC measurements (r2=0.79, slope =0.94; N=1185) and between OA and OC measurements (r2=0.68). The slope of 2.14 obtained between submicron OA measured by the ACSM and PM2.5 OC filter-based methods corresponded to the higher range of values generally observed at (sub)urban background sites – typically 1.6–2.2 (e.g., Bae et al., 2006; Aiken et al., 2008; Favez et al., 2010; Sun et al., 2011; Canagaratna et al., 2015, and references therein) – and may be partly explained by the fact that the filter sampling setup was designed to minimize positive sampling artifacts but does not prevent negative ones. Results obtained from these comparisons with filter-based measurements supported the validity of the datasets used in the present study.
Co-located measurements of nitric oxide (NO) and nitrogen dioxide (NO2) were performed with a analyzer (model T200UP, Teledyne API, USA). Data measurements were used to further constrain traffic-related OA sources. The meteorological parameters, including temperature (T), relative humidity (RH), wind speed (WS), wind direction (WD), boundary layer height (BLH) and precipitation, were obtained from the main SIRTA ground-based meteorological station (located at about 4 km northeast of the aerosol monitoring site). It should be noted that the BLH data were achieved in combining a diagnostic of the surface stability from high-frequency sonic anemometer measurements and light detection and ranging (lidar) attenuated backscatter gradients from aerosols and clouds (Pettie et al., 2015; Dupont et al., 2016).
3.1 PMF analysis
The OA source apportionment was performed using the PMF algorithm (Paatero and Tapper, 1994). Organic concentration and error matrices were exported from the ACSM Local software (v 1.5.11.2). Only m∕z values ranging from 13 to 100 were applied in the PMF analysis due to larger uncertainties for larger m∕z ions and large interferences of naphthalene (m∕z 128) signals (Sun et al., 2012). Down-weighting of the m∕z 44 group of ions for the PMF model analysis was performed following procedures implemented in the ACSM Local software and following the data treatment strategy proposed by Ulbrich et al. (2009).
When using PMF, it may be difficult to distinguish between factors with similar spectral profiles, especially for ACSM datasets, which are associated with larger uncertainties compared to AMS (Sun et al., 2012; Zhang et al., 2015; Fröhlich et al., 2015b). The source finder (SoFi) toolkit, implemented with the ME-2 solver (Paatero, 1999), has been developed by Canonaco et al. (2013) to better address this limitation. SoFi provides robust functions which allow us to constrain chosen factor profiles and/or time series. In particular, the a-value approach makes use of range-defining scalar values (with a values ranging from 0 to 1) in order to better elucidate specific PMF factor profile(s) with a chosen degree of freedom; the higher the a value, the less constrained the OA profile is (Canonaco et al., 2013). In the present work, this a-value approach has been used to constrain profiles of POA factors. Some previous studies have already been performed at SIRTA using high-resolution time-of-flight AMS (HR-ToF-AMS) along with PMF analysis during short-time campaigns (typically around 3–4 weeks), leading to the identification of HOA, BBOA, and a cooking OA (COA) factor (Crippa et al., 2013a, b; Fröhlich et al., 2015b). Mass spectra obtained from these studies were used here as references to constrain POA factors because of the prior knowledge of source information as constraint. Conversely, mass spectral profiles of possible OOA factors were left unconstrained. It should be noted that Crippa et al. (2013a) resolved up to three different types of OOA factors and/or a marine OA (MOA) factor when combining HR-ToF-AMS and proton-transfer-reaction mass spectrometer (PTR-MS) datasets obtained during a summer and a winter campaign at SIRTA.
OOA factor profiles may differ with time, notably due to seasonal variations of several parameters such as meteorological conditions, photochemistry, atmospheric lifetime, air mass origin and/or gaseous precursor origins. In order to better account for such variability, individual PMF analyses were performed on a 3-month basis, i.e., winter (December–January–February), spring (March–April–May), summer (June–July–August), and fall (September–October–November), with a total number of 25 different PMF runs (7 for winters and 6 for each of the other seasons). November 2011 and March 2018 data were included in the winter 2011–2012 and winter 2017–2018 analyses, respectively.
To evaluate the influence of the chosen temporal PMF window (i.e., time duration of data used in ME-2 runs) on the seasonal ME-2 model results, different time frames (i.e., 15, 30, 60, 90 and 120 d) were tested. As shown in Fig. S4 (with 2017 winter data as an example), the excellent consistency of those results from different scenarios suggests a very limited influence of the given PMF windows on determining the outputs of ME-2 analyses. To better assess the variations in primary and secondary OA in different seasons over the 6-year period and to allow for some degrees of freedom within the model runs, the main OA factors, including both POA factors (HOA and BBOA) and two SOA factors (a less oxidized OOA (LO-OOA) and a more oxidized OOA (MO-OOA)), were calculated as the average of 50 convergent ME-2 runs with the a values varying from 0 to 0.4. Moreover, results obtained with an a value of 0.2 were also compared to these results for sensitivity analyses (Fig. S5). The diagnostics of the final OA-factor solution are further discussed in Sect. 4.1.
3.2 Influence of biogenic SOA
Biogenic SOA (BSOA) might have a significant influence on OA loadings in mid-latitude regions during summertime and be further apportioned using AMS techniques (e.g., Leaitch et al., 2011; Canonaco et al., 2015). For that reason, the influence of this biogenic OA source was specifically investigated in the present study. To do so, BSOA derived from terpene emissions (BSOAt) was taken as a surrogate for total BSOA, and the temperature dependence of the BSOAt formation process yield during summertime was simulated using a terpene emission model (Goldstein et al., 2009; Schurgers et al., 2009; Leaitch et al., 2011, and references therein). This model is designed to quantify biogenic emissions over global and regional scales. The emission rate (γ) is estimated by an exponential curve function (Eq. 1), which is describing the relation between terpene emission rate and leaf temperature. As we assumed changes in leaf temperature to be the same as ambient temperature, this could then result, in part, in uncertainties for the model calculation. In addition, this temperature-dependent model reflects vapor pressure changes caused by temperature; however, changes in vapor pressure due to changes in the concentrations in the storage pool of terpene are not covered by the model (Schurgers et al., 2009). Therefore, this emission model is useful to simulate the short-term emissions because of temperature changes (Schurgers et al., 2009).
where γ0 stands for the emission rate (µg g−1 h−1) at standard conditions, and β is an empirical constant chosen here to be equal to 0.09 K−1 (Schurgers et al., 2009; Leaitch et al., 2011). As reported by previous studies, biogenic terpene emissions could be a major source of such a PMF LO-OOA factor observed during summertime in western Europe (e.g., Canonaco et al., 2015; Daellenbach et al., 2017; Daellenbach et al., 2019). Given that BSOAt was assumed to be mainly included in the LO-OOA fraction in the present work, BSOAt estimated concentrations were compared to LO-OOA concentration data points corresponding to the daytime maximum temperature (at approximately 16:00–17:00 LT, local time) in summer. Assuming that LO-OOA could actually be mostly composed of BSOAt during this period of the day and following the procedure described by Leaitch et al. (2011), the daily mass concentrations of BSOAt were estimated as follows:
where Tmin corresponds to the lowest daily maximum temperature observed across the investigated summer seasons (i.e., 12 ∘C ±1 ∘C) and LO-OOA(observed at Tmin) corresponds to the mean LO-OOA concentration obtained for these data points (0.7±0.3 µg m−3, N=17).
3.3 Trend analysis
The multiyear trends of monthly mean OA factors and total OA, as well as other chemical components (including eBCwb, eBCff, nitrate, sulfate and total PM1), were analyzed using the Mann–Kendall (MK) trend test (Mann, 1945). The trend slope was calculated using Theil–Sen estimator (Sen, 1968). Before performing the MK trend test, the normality and seasonality of the OA factors were examined, respectively. The normality of the mass concentrations of the OA factors was examined by the Shapiro–Wilk normality test (Shapiro and Wilk, 1965). As a result of the Shapiro–Wilk normality test, all datasets of the mass concentrations of the four OA factors were not normally distributed cases. The MK test associated with Sen's estimator of slope is insensitive to outliers, while it is not appropriate for the chosen dataset with significant seasonality. The Kruskal–Wallis test (Kruskal and Wallis, 1952) was performed to evaluate the seasonality of monthly average datasets at the 5 % significance level. If the seasonality of the data is insignificant, the MK test was used for the trend analysis, while the seasonal MK test was then applied for the data with significant seasonality. In addition, to further compare the differences between the MK test and the seasonal MK test in our trend analysis, both methods have been applied for all datasets (see Table S1 in the Supplement). The trend computation was performed here using a R trend package (Pohlert, 2018).
3.4 Air mass back-trajectory analysis
The HYbrid Single-Particle Lagrangian Integrated Trajectory model (HYSPLIT) (Draxler and Rolph, 2003; Stein et al., 2015) was applied to calculate 72 h back trajectories hourly arriving at SIRTA at a height of 100 m above ground level, based on the Global Data Assimilation System (GDAS) meteorological data. The potential source contribution function model (PSCF) (Polissar et al., 1999) was used in this study to investigate the potential source origins that may contribute to high concentrations of OA factors at SIRTA. This analysis was achieved with a resolution of for each grid cell, using the ZeFir toolkit (Petit et al., 2017). The probability function for a given grid cell (i,j), where i stands for the latitude and j for the longitude, is related to observed concentrations that are higher than a threshold value, which is defined by Eq. (3):
where mij is the total number of selected trajectory endpoints (i,j) associated with receptor concentrations of PMF factors higher than the threshold value, and nij is the total number of back-trajectory endpoints at each grid cell (i,j). The 75th percentile of each OA factor during the entire study was used as the threshold value to calculate mij. To reduce uncertainty caused by small nij values for the PSCF modeling, an arbitrary weighting function (wij) was applied (Waked et al., 2014). To minimize the influence of some trajectories on the possible pathways of air mass transport, observed data points associated with low-wind-speed conditions (WS < 4 m s−1) were filtered out. In addition, observed data points at SIRTA during the period with any hourly precipitation events (precipitation > 0 mm) were removed to reduce influence of wet deposition on ambient aerosol concentrations.
4.1 Identification of the main OA factors
4.1.1 Determination of the optimum factor number
The optimal number of PMF OA factors shall be determined by the distribution of the main sources at a given sampling site. Based on results obtained from the compilation of previous AMS studies reported in the Paris region, two POA factors – HOA and BBOA – and two OOA fractions – MO-OOA and LO-OOA – are undoubtedly a major fraction of submicron aerosols in Paris area over the year (Crippa et al., 2013a, b; Freutel et al., 2013; Petit et al., 2014; Fröhlich et al., 2015b). Another POA source, i.e., COA, has also been identified using HR-ToF-AMS during previous campaigns in the Paris region (Crippa et al., 2013a, b; Fröhlich et al., 2015b). However, the distinction between COA and HOA factors based solely on ACSM measurements remains challenging due to highly similar mass spectra and uncertainties associated with the ACSM low mass spectral resolution (Petit et al., 2014; Fröhlich et al., 2015b).
To better assess a potential role of COA in our source apportionment study, several ME-2 runs were conducted constraining either three POA factors (HOA, BBOA, COA) or two (HOA, BBOA). In these tests, POA reference mass spectra determined by Fröhlich et al. (2015b) were employed as anchor profiles (with a values ranging from 0 to 0.4 with steps of 0.05). PMF solutions with a factor number ranging from 3 to 6 were investigated on ACSM datasets corresponding to different seasons of different years (December 2011–February 2012, March–May 2015, June–August 2017, September–November 2017, December 2017–February 2018). Results obtained from these preliminary individual PMF runs showed very good consistency between them with two unconstrained OOA factors – MO-OOA and LO-OOA – always appearing in the 4-factor (with constrained HOA and BBOA factor) and 5-factor (with constrained HOA, BBOA and COA factor) solutions. Conversely, 3- and 6-factor PMF analyses generally led to unsatisfactory solutions.
Figures 1 and S6 present results obtained for the 4- and 5-factor solutions, respectively, for the winter 2017–2018 period, taken here as an example. In both cases, mass spectra are in good agreement with those reported in the literature. However, the COA and BBOA factors are displaying very similar diel patterns, leading to surprisingly good correlations between the two factors (Fig. S7). In order to further evaluate possible COA contribution at SIRTA, we applied an m∕z-tracer algorithm (Mohr et al., 2012), trying to identify pure cooking aerosol signals. The distribution of the estimated COA signals is centered at about 0, as illustrated by Fig. S8. This could be probably explained by the very little pure cooking influence that could not be quantified by the lower resolution quadrupole ACSM than AMS, which is logically in agreement with negligible cooking source at the sampling site area nearby. Altogether, it could then be concluded that the constrained COA-like aerosols at SIRTA were primarily linked with wood burning emissions, while pure cooking aerosols were probably present loadings that were too low to be properly quantified within the present study. This assumption is consistent with conclusions drawn by other studies performed at SIRTA, e.g., based on an online (ACSM) dataset (Petit et al., 2014) and a combining PMF method using online (ACSM) and offline (4 h filter sampling) datasets (Srivastava et al., 2019), as well as other studies showing that the COA factor could not be solely attributed to cooking aerosols (e.g., Freutel et al., 2013; Dall'Osto et al., 2015).
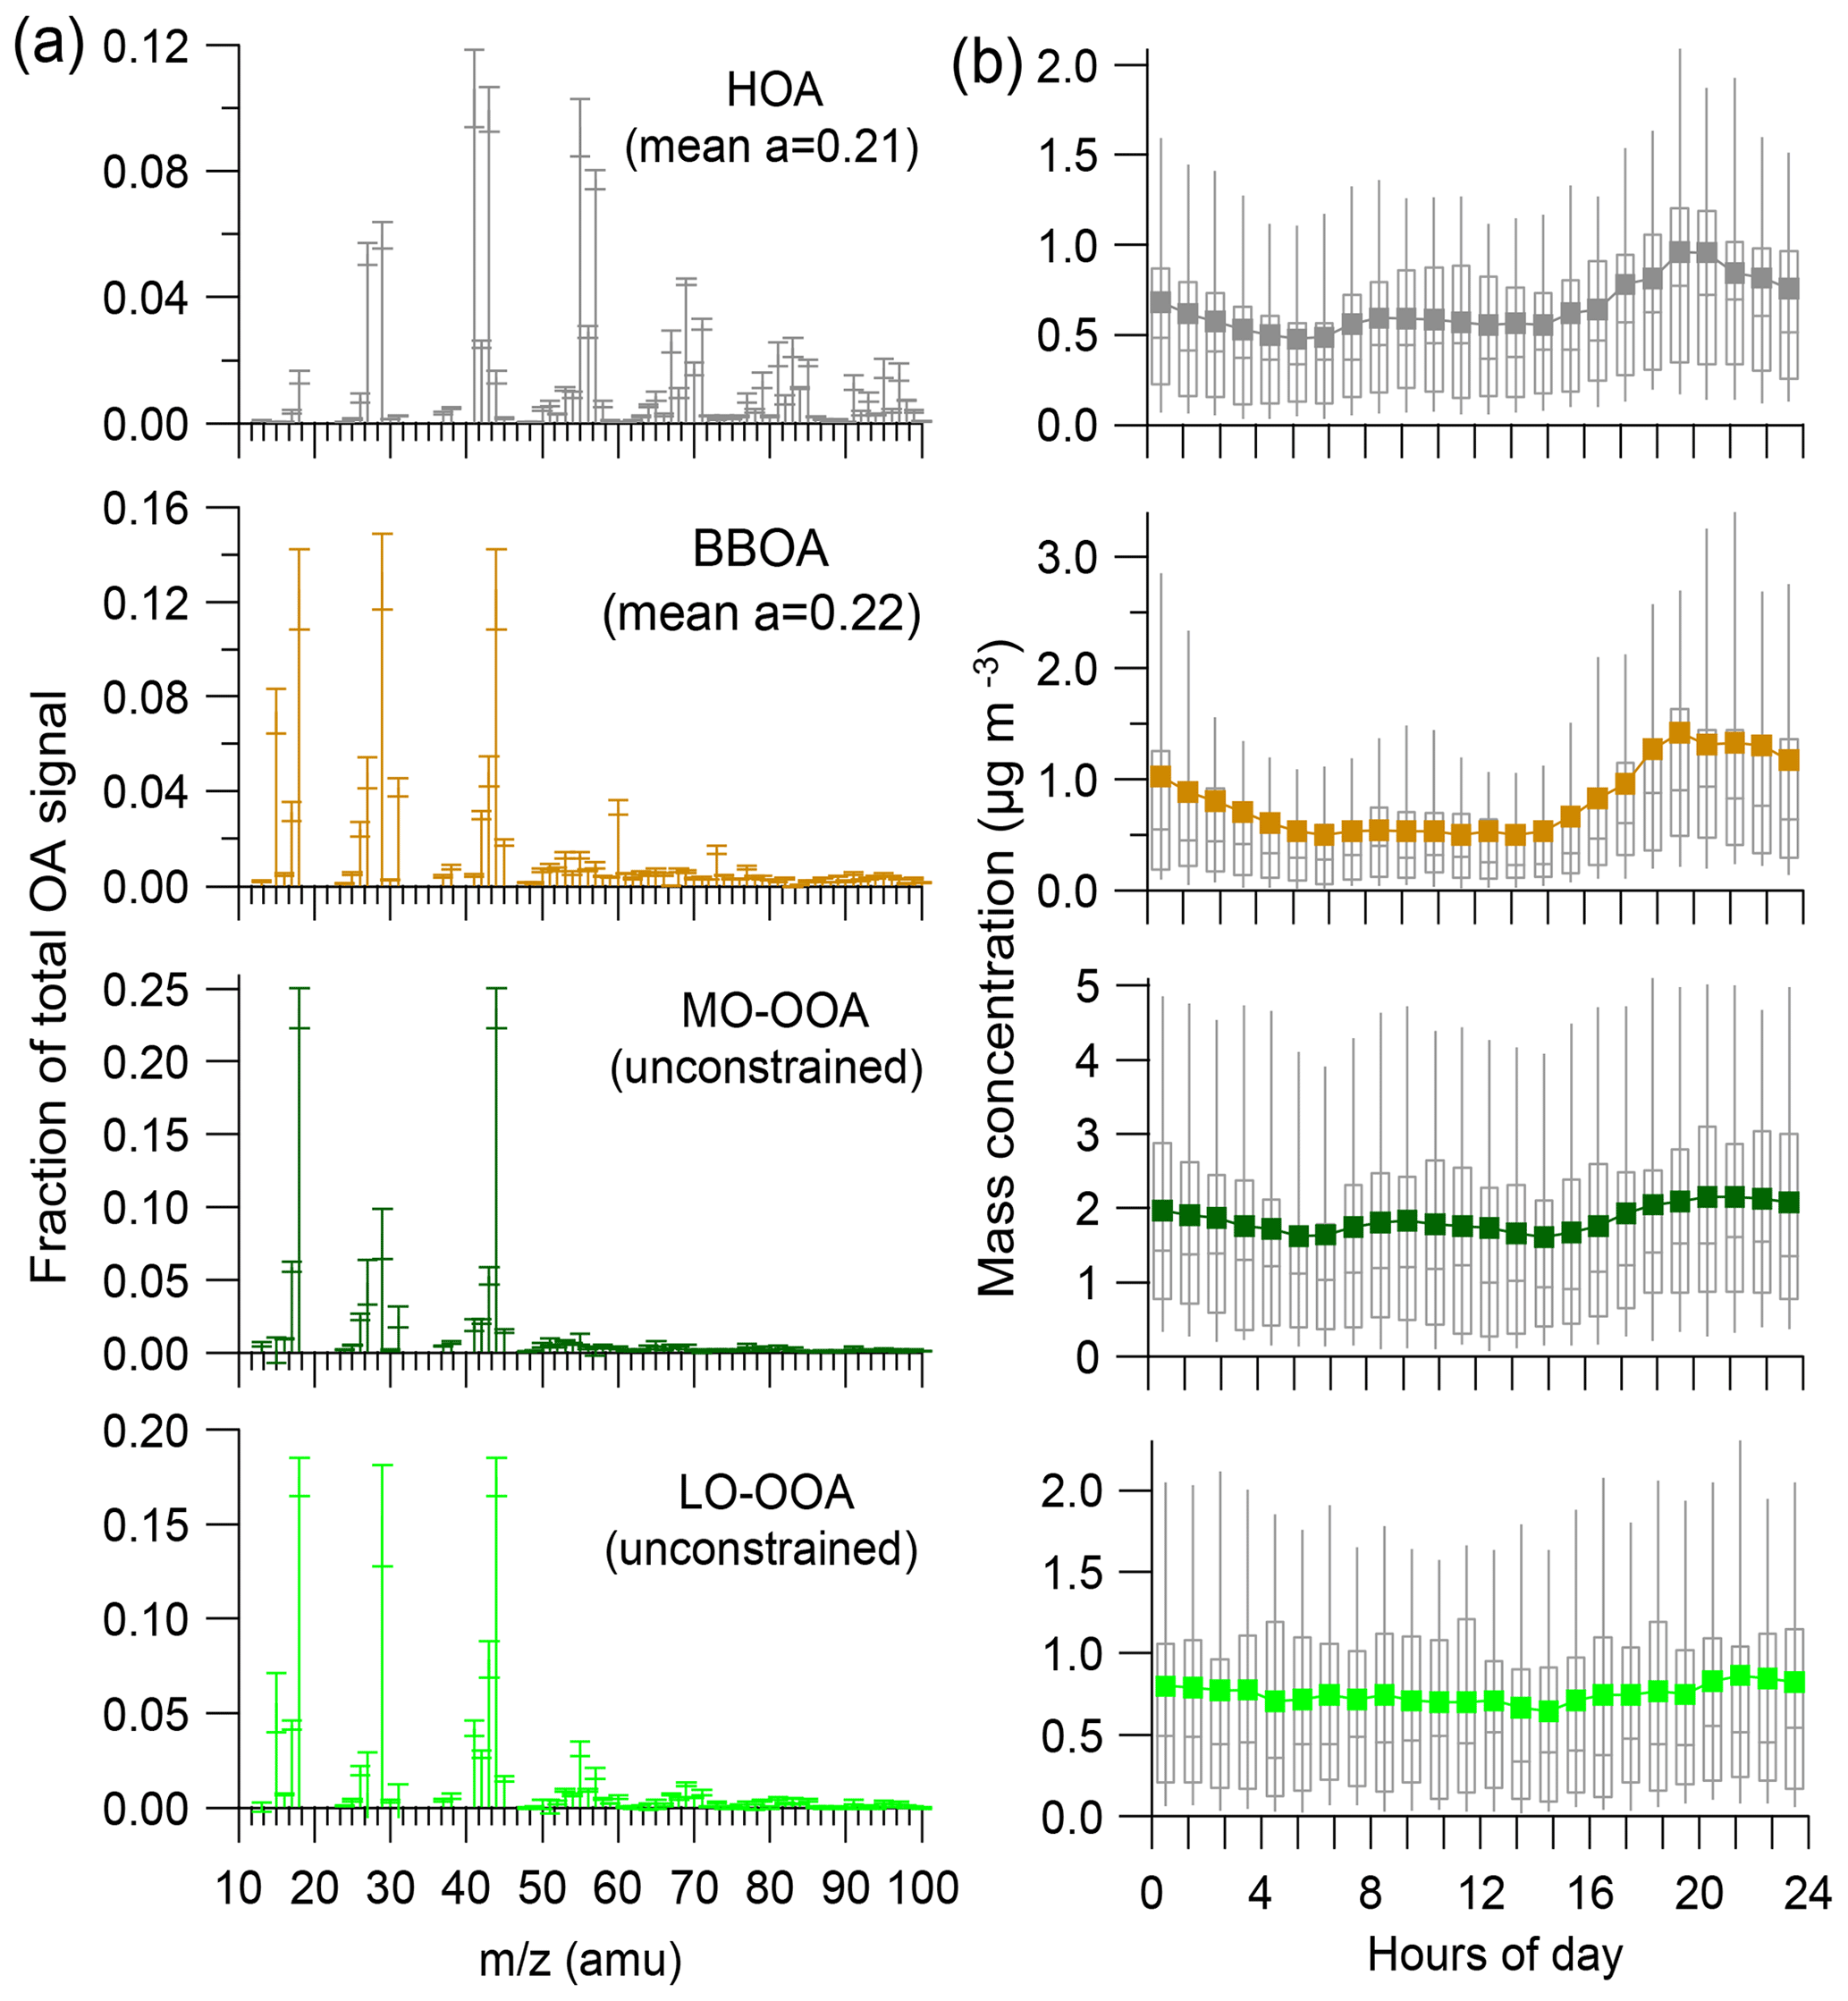
Figure 1Mass spectra (a) and diel variations (b) of four OA factors obtained from the 4-factor solution of ME-2 runs for winter 2017–2018. In (a), error bars in each plot present 1 standard deviation. Stick lines indicate average values over all selected ME-2 runs. Averaged a values for the constrained factors during the ME-2 runs are also shown. In (b), the upper and lower boundaries of boxes indicate the 75th and 25th percentiles, respectively; the vertical lines within the box correspond to median values; the whiskers above and below boxes refer to 95th and 10th percentiles, respectively; and solid colored lines represent mean values.
Therefore, the 4-factor solution, including two constrained POA factors (BBOA and HOA) and two unconstrained factors, was chosen here as the “best estimate” for the PMF runs performed over the long-term dataset. A total of 25 seasonal and individual PMF analyses were then conducted using a similar procedure. The seasonal OOA factor mass spectra are presented in Fig. S9, showing high seasonal consistency for each OA factor. Moreover, as shown in Fig. S10, the distribution of residuals derived from these 4-factor solution ME-2 runs was sharply centered at around 0, suggesting an insignificance of possible unresolved OA factor(s). The correlations of OA factors with their tracers were examined to globally evaluate the 4-factor PMF solution (see Figs. S11 and S12). As shown in Fig. S11a, HOA is correlated well (r2=0.54) with NOx, a common tracer of primary combustion sources (e.g., traffic emissions). While HOA shows a relatively weaker correlation (r2=0.33) with eBCff (Fig. S11b), this could be explained by two possible reasons: (i) uncertainties of the Aethalometer model that could not be evaluated by the present study and (ii) the HOA factor here could not be reprehensive for pure fossil-fuel combustion POA. BBOA presents an overall good correlation (r2=0.50) with eBCwb (Fig. S11c), suggesting important influence of wood burning emissions on this factor production. Based on the filter-based dataset, primary OC (POC) and secondary OC (SOC) were calculated using a method of OC-to-EC mass ratio (see Fig. S12). Overall, POA (sum of HOA and BBOA) versus POC (r2=0.47) and SOA (sum of LO-OOA and MO-OOA) versus SOC (r2=0.38) have acceptable correlations during the entire filter measurement period. Thus, all of these comparison results could additionally support our “best estimation” for selecting such 4-factor PMF solution across the entire period.
4.1.2 Source attribution
BBOA mass spectra are quite constant throughout the seasons and present characteristic peaks at m∕z 29, 60 and 73, indicative of biomass burning combustion (Fig. S9). As shown in Fig. 2a, BBOA diel cycles displayed well-marked patterns with strong nighttime maxima. This confirms the predominance of residential wood burning activities on BBOA concentrations at SIRTA and in the Paris region, as already shown previously (e.g., Favez et al., 2009; Sciare et al., 2011; Crippa et al., 2013b; Petit et al., 2014). As expected, BBOA diel cycles are similar to the ones obtained for eBCwb, except for small eBCwb morning peaks that were not observed for BBOA (possibly due to uncertainties of the Aethalometer model). Interestingly, the higher concentrations of eBCwb and BBOA were observed on Saturday and Sunday, reflecting the weekend effect likely due to enhanced residential wood burning emissions.
Compared to BBOA, HOA shows a more complex weekly diel pattern (Fig. 2b). Its pattern is generally similar to eBCff and NOx (both being considered here as markers for traffic emissions). HOA presents two peaks during the working day, one in the morning and another in the evening. Morning peaks, occurring during traffic rush hour, are clearly indicative of road transport contributions, confirming HOA as a proxy for traffic emissions. However, HOA evening peaks occur globally later than eBCff and NOx ones (21:00–22:00 LT vs. 19:00 LT , respectively) and much lower ratios are observed between HOA and eBCff in the morning than in the evening. This might be partly explained by (i) higher eBC traffic emission factor in the morning and/or (ii) impacts of residential heating sources, e.g., wood and/or heating oil burning (Lin et al., 2018), on the HOA concentrations in the late evening. Moreover, eBCff shows a clear weekend effect, with a less-pronounced pattern on Saturday and Sunday due to road transport reduction, while HOA displays intense nighttime peaks during the weekend. This HOA mean pattern was substantially influenced by winter data, whereas summertime patterns display better consistency between HOA, eBCff and NOx (Fig. S13). Altogether, these results suggest that this HOA is considered a mixed factor partly composed of both traffic and residential heating aerosols. This statement is in good agreement with conclusions from complementary studies showing wood burning contribution to HOA at the same site (Petit et al., 2014; Srivastava et al., 2019).
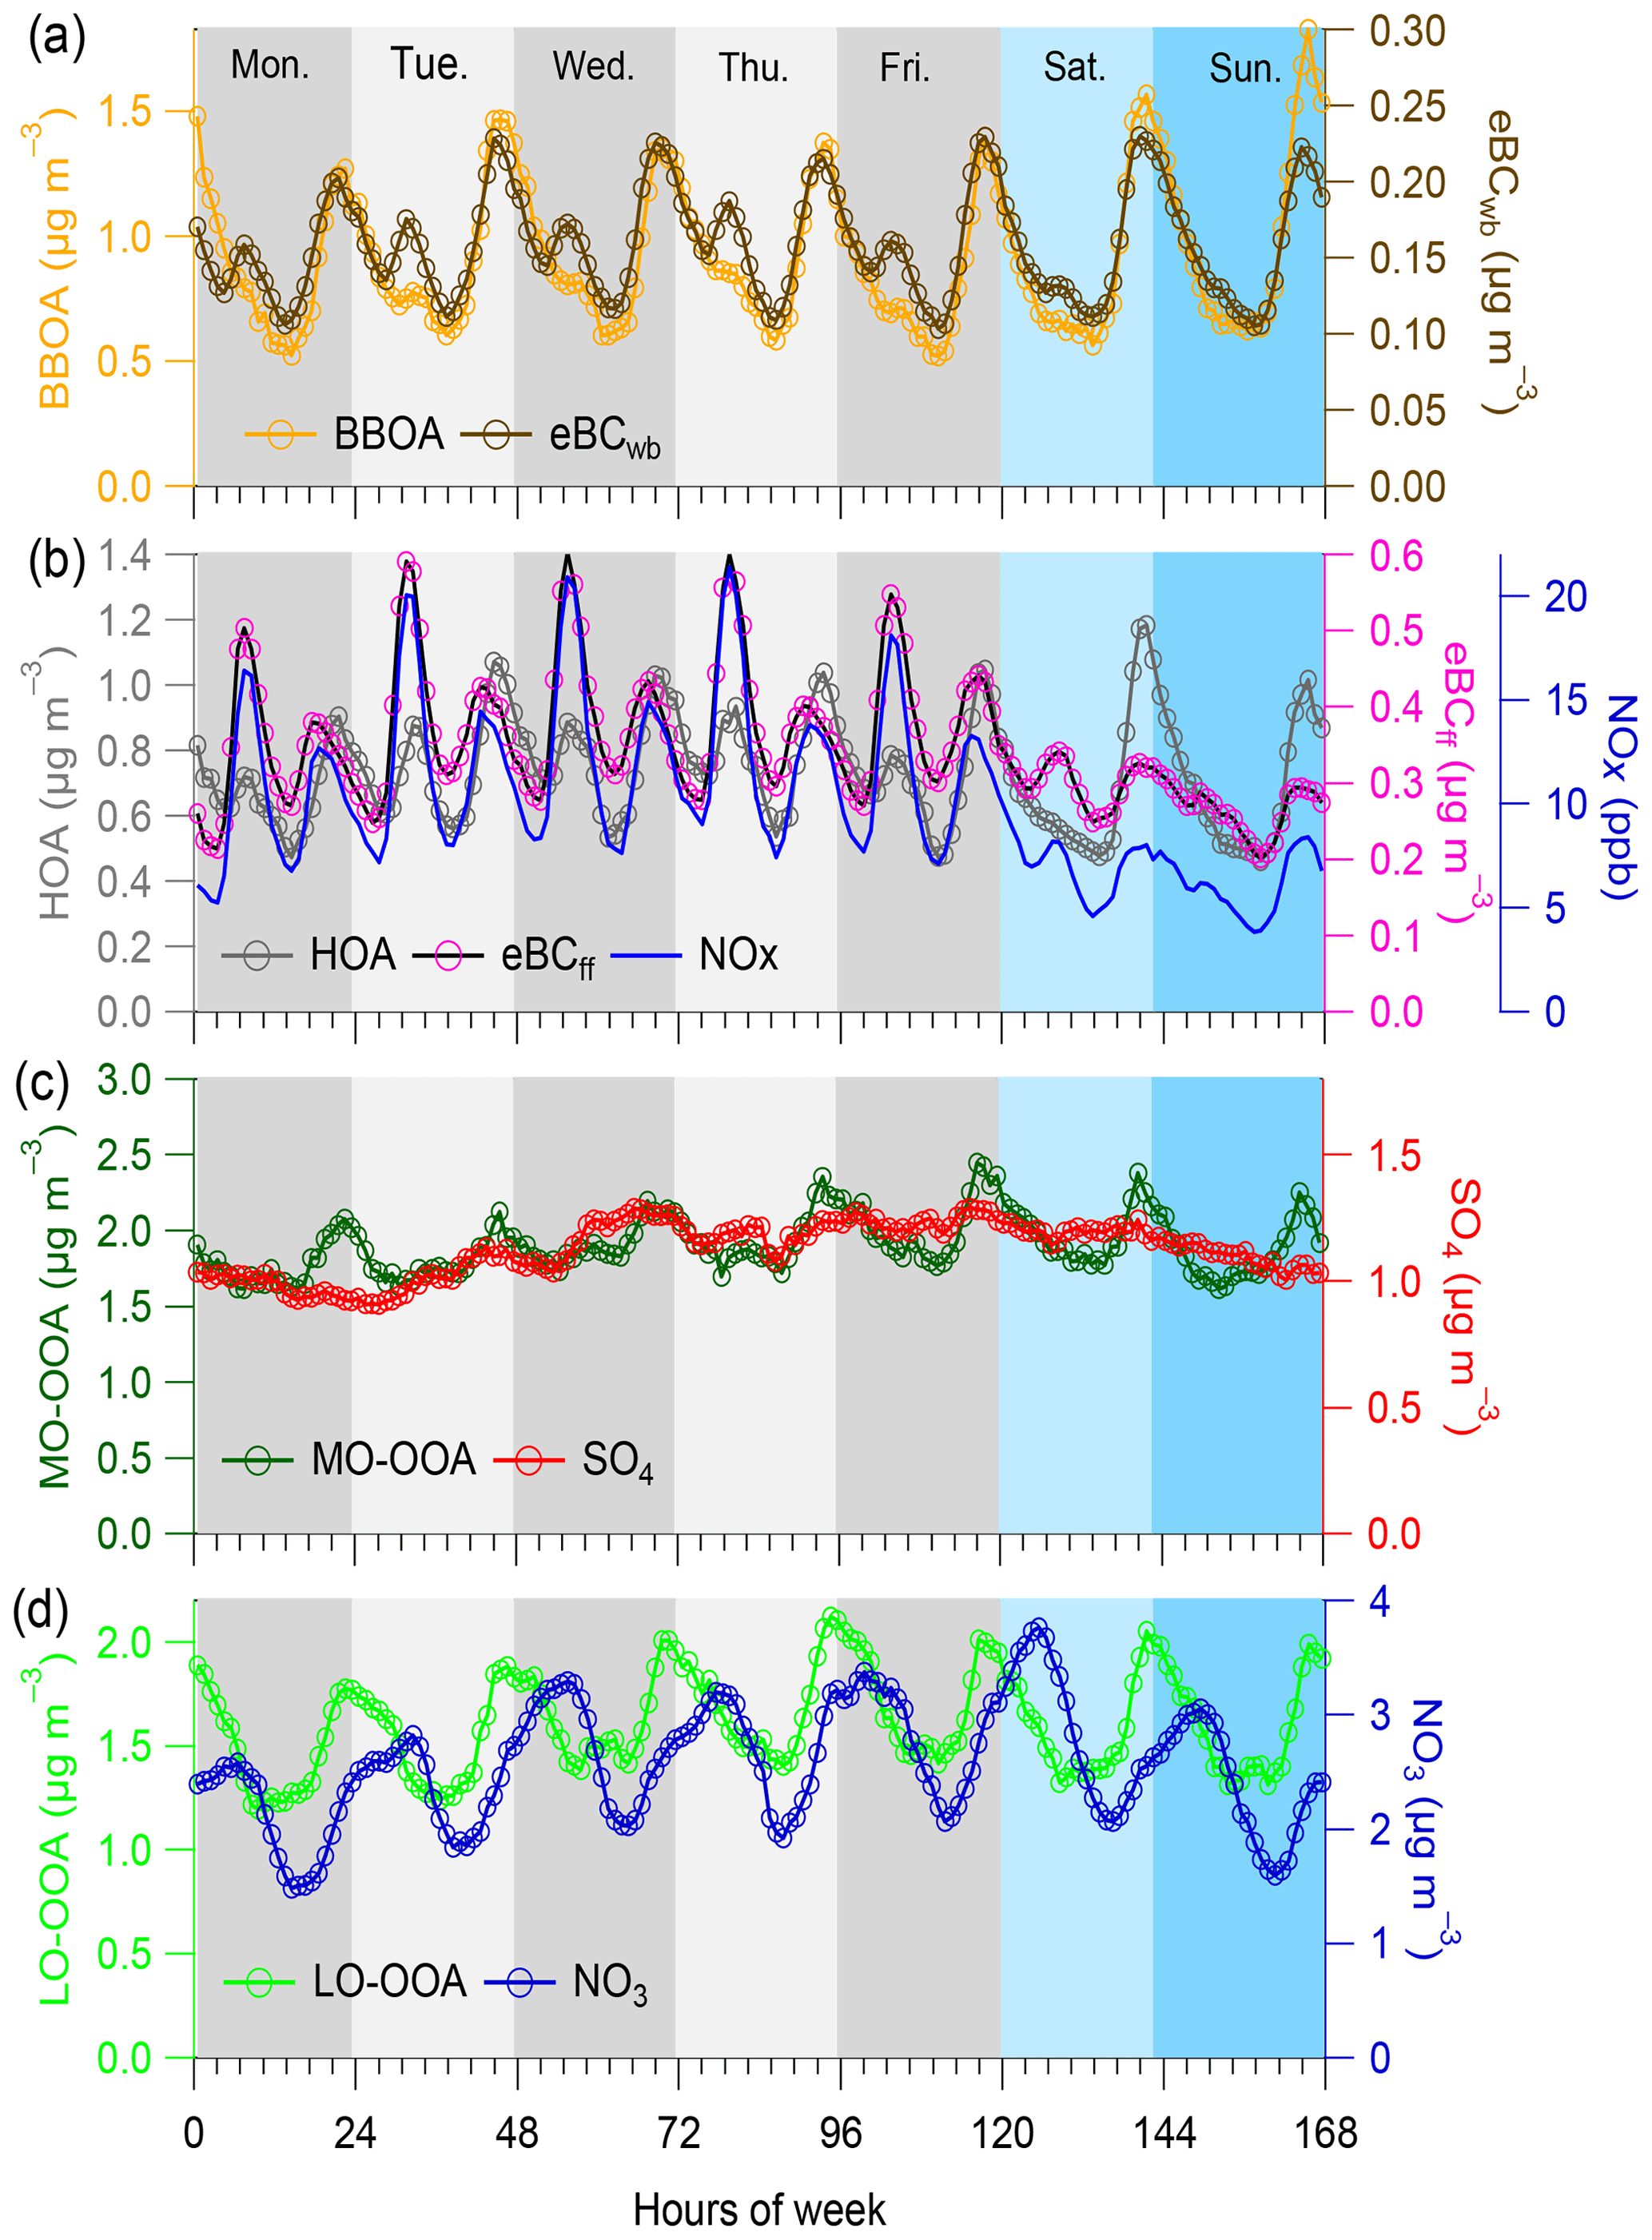
Figure 2Weekly cycles averaged for the entire period of study for (a) HOA, (b) BBOA, (c) MO-OOA and (d) LO-OOA, along with possible external tracers (eBCwb, eBCff and NOx, sulfate, and nitrate, respectively). Weekdays are colored (every 24 h) in different gray shading and weekend days in different blue shading.
As presented in Figs. 1a and S9, MO-OOA mass spectra present a strong peak at m∕z 44. In fact, this spectrum has been widely reported as low volatility OOA (LV-OOA) and considered composed of highly oxidized and aged SOA (Lanz et al., 2007; Ulbrich et al., 2009; Zhang et al., 2011; Ng et al., 2011a). Overall, MO-OOA had a weak correlation (r2=0.23) with sulfate during the entire period, supporting their different source origins to some extent. Compared to the poorly pronounced diel variability of sulfate, this MO-OOA factor exhibits a slight enhancement at nighttime (Fig. 2c), suggesting a possible local formation mechanism involving nighttime chemistry, on top of its overall regional feature. The geographic origins of the MO-OOA factor are further discussed in Sect. 4.2.1 for each season.
The mass spectra of LO-OOA in this study present a higher m∕z 43 and a lower m∕z 44 (Figs. 1a and S9) compared to MO-OOA, which is consistent with the mass spectral pattern of previously reported freshly formed semivolatile OOA (SV-OOA) (Jimenez et al., 2009; Ng et al., 2010). The diel variations in LO-OOA display higher concentrations during nighttime than daytime (Fig. 2d), with relative variations much more pronounced than for the MO-OOA diel pattern, highlighting important roles of nighttime chemistry and/or gas–particle partitioning in the LO-OOA formation. These results support different formation pathways of the two OOA fractions. In addition, LO-OOA and nitrate present different diel cycles, suggestive of different formation processes and sources between each other. Different diel cycles of LO-OOA in different seasons have been also observed, which are further discussed in Sect. 4.2.1. In winter, LO-OOA mass spectra have higher contributions of m∕z 29 and elevated m∕z, i.e., starting from m∕z 60, than during other seasons (Fig. S9). Such characteristics suggest a major influence of biomass burning emissions onto the LO-OOA factor during wintertime, as previously proposed from measurements in the Paris region (e.g., Crippa et al., 2013b). Conversely, in summer, this factor may be significantly influenced by BSOA formation (Canonaco et al., 2015; Daellenbach et al., 2017). To investigate this possible origin, we checked if the summertime LO-OOA concentrations at higher daily temperature were following the temperature dependence similar to the one expected for the formation of terpene SOA, as explained in Sect. 3.2. Results of these calculations are presented in Fig. 3. The LO-OOA concentrations substantially increase with temperature, showing a good agreement with the estimated BSOAt formation exponential profiles. However, when comparing with estimation derived from Eq. (2) (referred to Fig. 3), the observed LO-OOA displays substantially higher loadings than estimated BSOAt at highest concentration range. This could be partly due to the influence of regional transport and atmospheric dilution on aerosol loadings and some possible uncertainties (such as unclear formation mechanism of biogenic SOA at SIRTA) which were not considered in the BSOAt estimation. These comparison results between observation and estimation indicates that the LO-OOA factor observed in summer might be mainly associated with biogenic sources. This is aligned with the VOCs seasonal patterns observed in the Paris region (Baudic et al., 2016), although the underlying SOA formation mechanism is still unclear and needs to be further investigated (Beekmann et al., 2015). Further discussion about seasonality of the LO-OOA factor is given in Sect. 4.2.1.
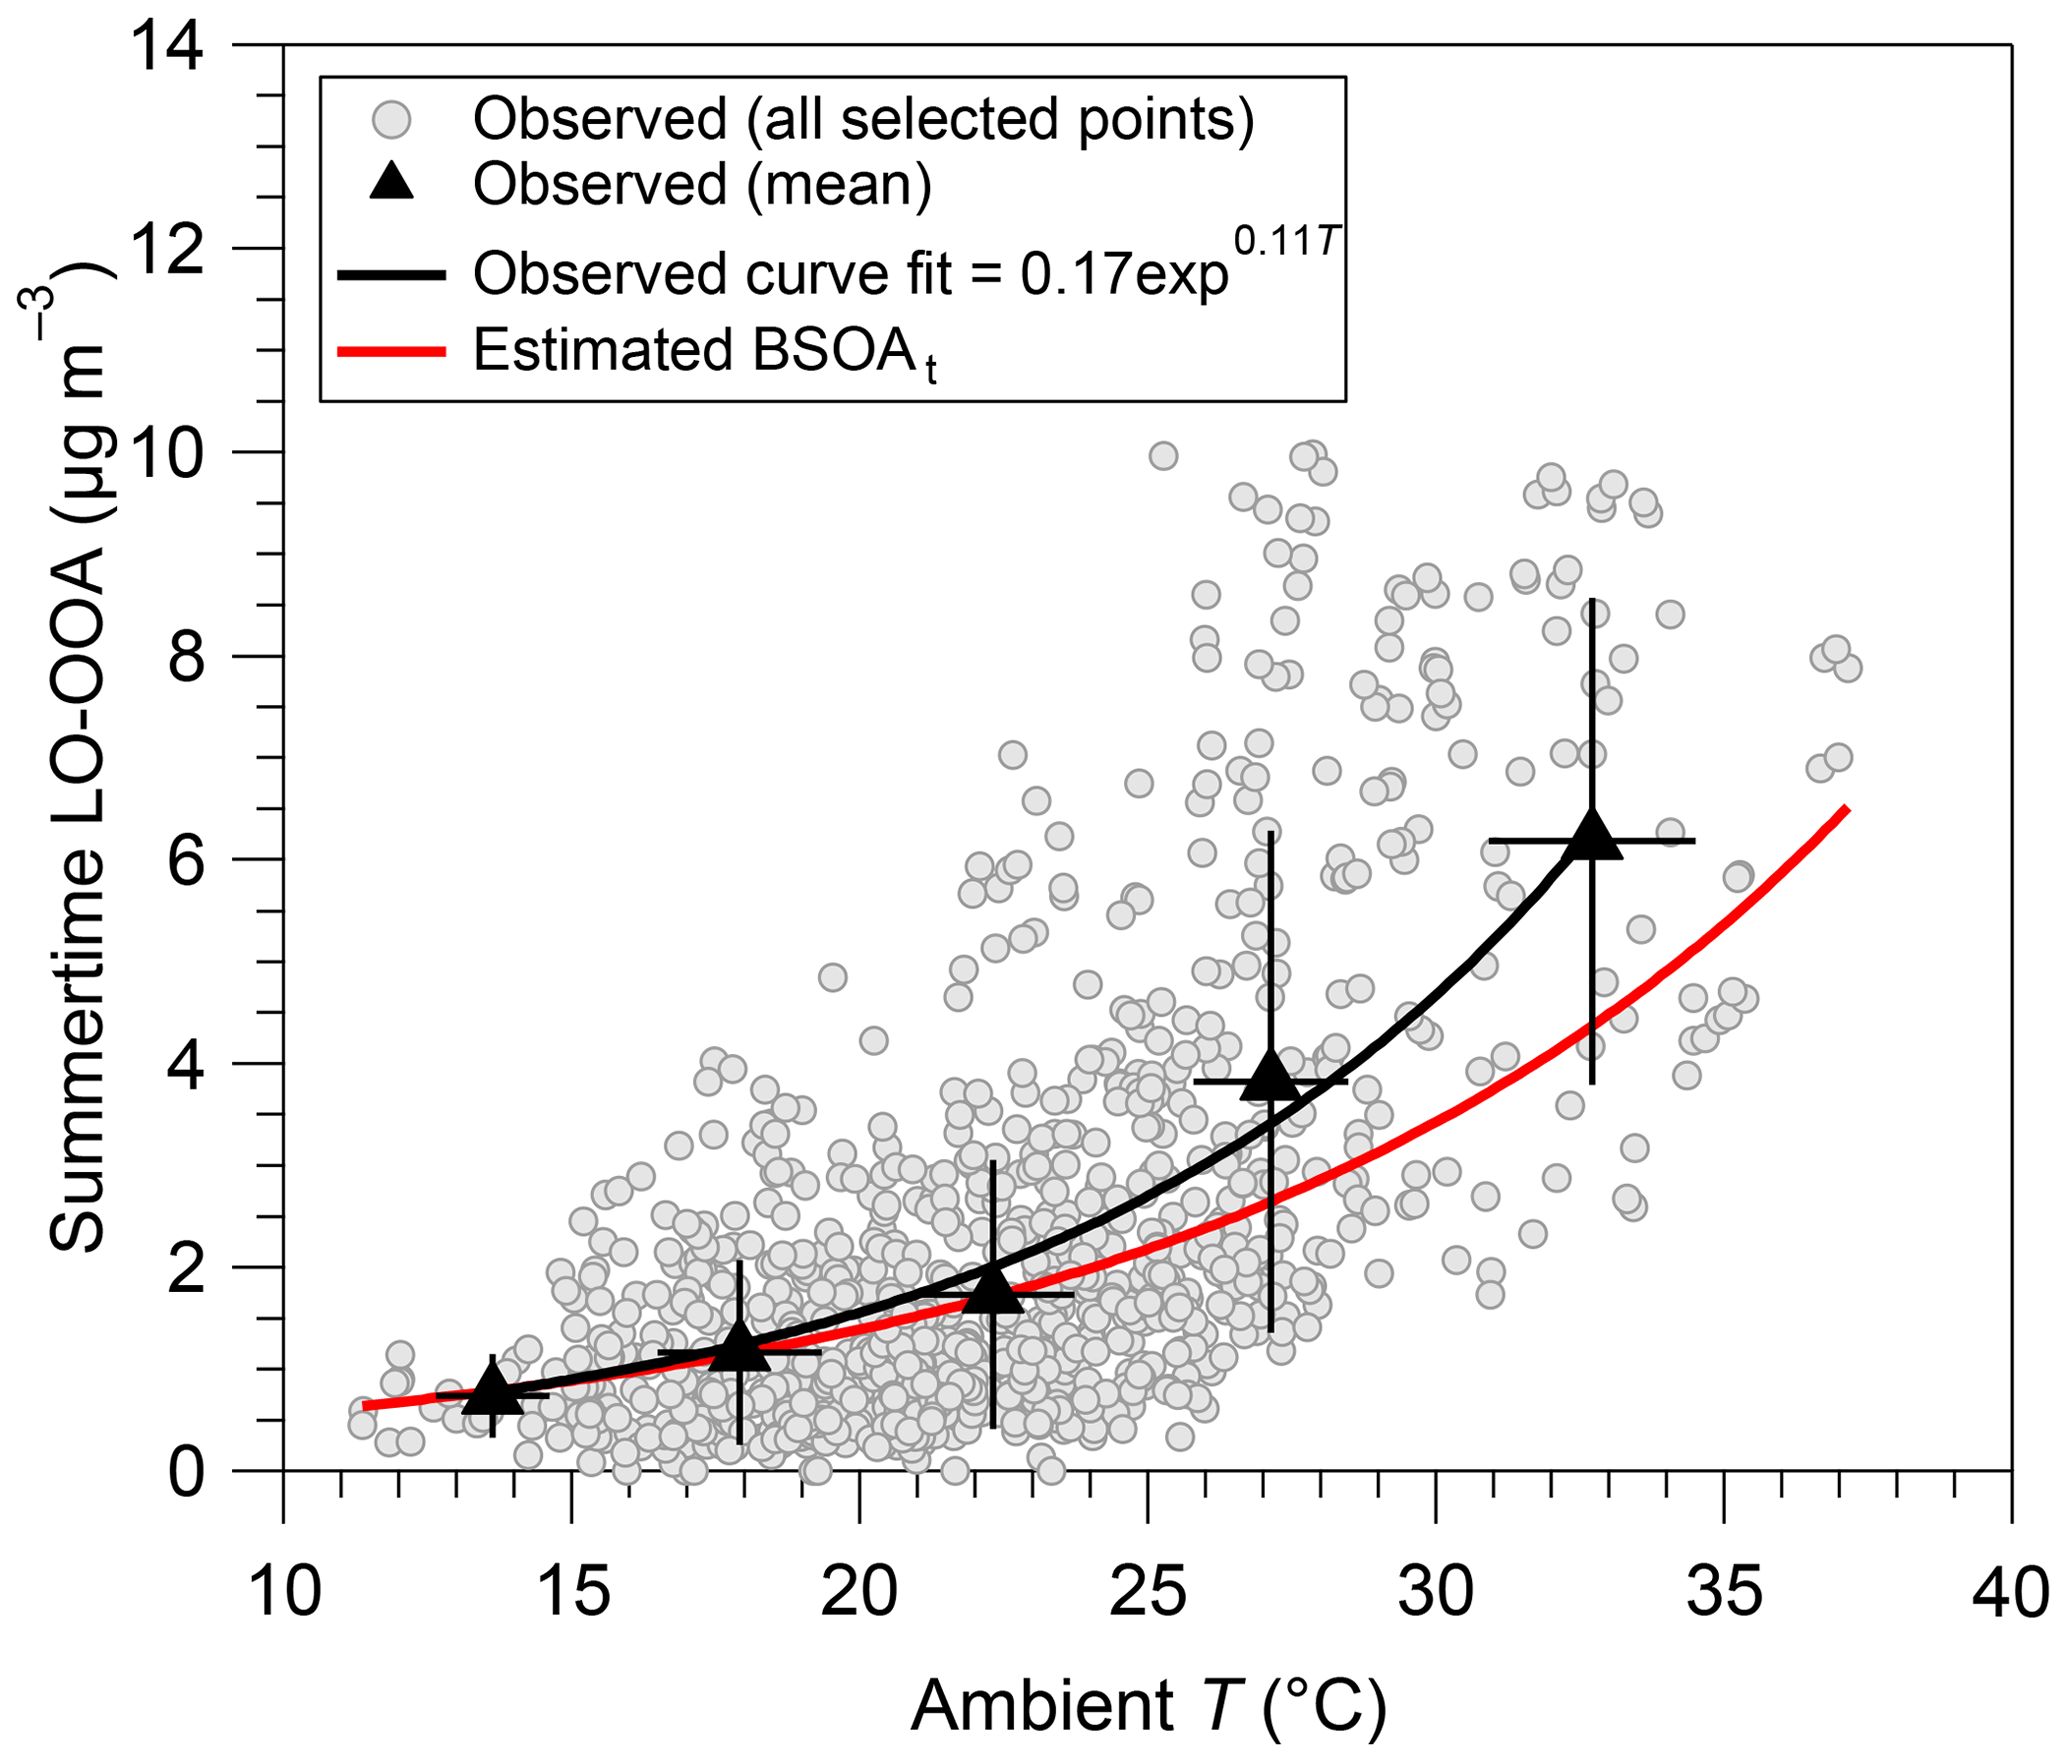
Figure 3Temperature dependence of summertime LO-OOA obtained from observation and observationally constrained calculation based on the biogenic terpene emissions model (Schurgers et al., 2009; Leaitch et al., 2011).
4.2 OA factor temporal variations
Figure 4 presents time series of total submicron OA and its four main factor components (namely HOA, BBOA, MO-OOA and LO-OOA) together with key meteorological parameters: BLH, RH and T, during the entire investigated period. Most meteorological parameters present seasonal cycles. Total submicron OA presented dynamic variations during all seasons with hourly average concentrations ranging from 0.03 to 77.5 µg m−3 and daily average values from 0.2 to 41.3 µg m−3. There was no clear seasonality for the total monthly average OA concentrations, varying from 4.8 to 5.1 µg m−3. However, each individual OA factor displayed intra- and interannual variations, which are discussed in this section.
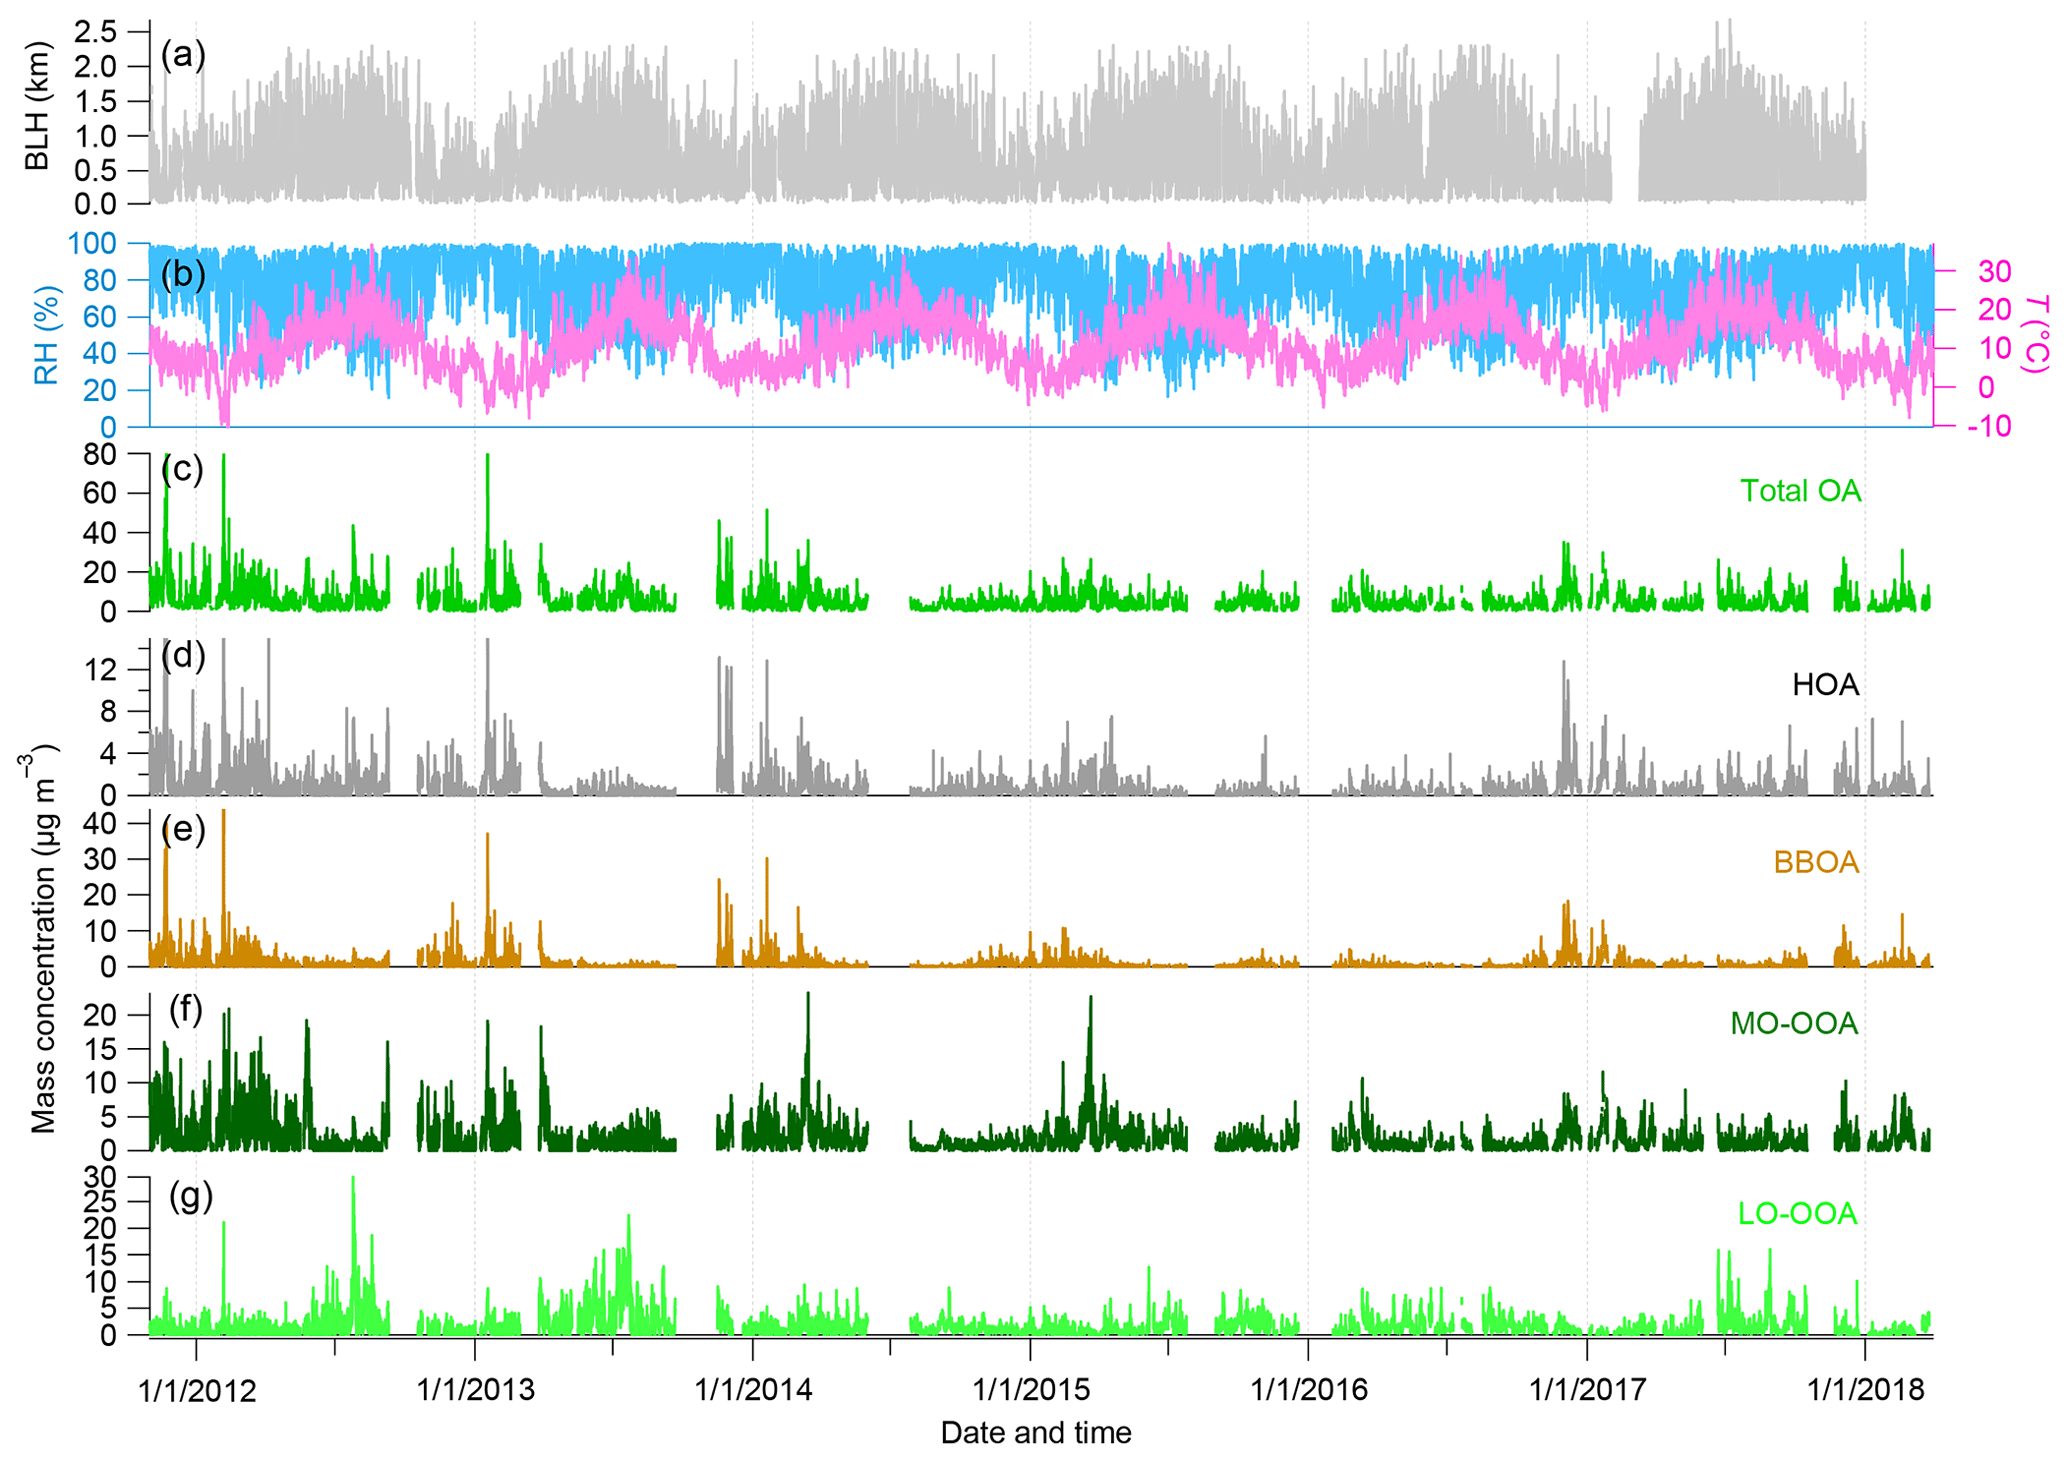
Figure 4Time series of meteorological parameters, i.e., (a) boundary layer height (BLH); (b) relative humidity (RH) and temperature (T); and mass concentrations of (c) total OA and four OA PMF factors, i.e., (d) HOA, (e) BBOA, (f) MO-OOA, and (g) LO-OOA.
4.2.1 Monthly and seasonal variations in OA factors
Figure 5 illustrates monthly average concentrations obtained for each OA factor over the studied period. HOA monthly concentrations vary from 0.4 to 1.3 µg m−3 and display a statistically insignificant seasonal trend (p > 0.05, Fig. 5a). Nevertheless, the mass concentration of HOA is nearly twice higher during cold months (in the range of 0.9–1.3 µg m−3, from November to March) than in other months (in the range of 0.4–0.5 µg m−3 from April to October). This monthly cycle of HOA could be partially explained by lower BLH conditions and the influence of more intense emissions of biomass burning in cold seasons than in warm seasons (Figs. 4 and S14). As illustrated by Fig. S15, HOA clearly presents two peaks (in the morning and late evening) for each season. The evening HOA peak is about 1.3–1.5 times higher than the morning peak in winter and fall seasons when high loadings of BBOA are observed as well. Although dynamic processes (establishment of a stable nighttime boundary layer) cannot be excluded, these results point to a possible contribution of biomass burning emissions to the HOA factor in the evening during cold months, as discussed before from the diel cycles of OA factors.

Figure 5Monthly variations in the four OA factors and associated Kruskal–Wallis p values for detecting seasonality. The box plots describe the different percentiles (10th, 25th, 50th, 75th, and 90th) and the mean (solid gray circle).
As shown in Fig. 5b, BBOA displays a statistically significant seasonal pattern trend (p < 0.0001) with higher monthly mean concentrations (1.1–1.9 µg m−3) during cold months (November–March) than during the April–September period (0.3–0.5 µg m−3). This seasonal dependence of wood burning emissions is associated with the residential heating activities in the Paris region. BBOA presents a seasonal dependence of its diel cycle, as presented in Fig. S15. In particular, BBOA shows an evident peak at evening and nighttime in winter, spring and fall, while it presents a stable diel cycle during summertime. The highest seasonally averaged nighttime peak (up to 2.4 µg m−3) is observed in winter, highlighting a significant enhancement of wood burning emissions and influence of meteorological conditions (such as low BLH) during this season (Fig. S14).
Monthly average mass concentrations of MO-OOA present a significant seasonal trend (p < 0.05), varying from 1.0 in September to 3.5 µg m−3 in March (Fig. 5c), in agreement with previous studies performed in Europe (Schlag et al., 2016; Daellenbach et al., 2017; Bozzetti et al., 2017). The highest MO-OOA mass concentrations observed in the cold months are somehow similar to the seasonal variation in BBOA. MO-OOA diel cycles also present a seasonal variation, with significant increase during evening and nighttime in winter, spring and fall (Fig. S15). In order to minimize the effect of atmospheric dilution and regional transport, the mass concentration of MO-OOA was normalized to sulfate, the latter one being considered a regional secondary production marker (Petit et al., 2015 and Fig. S16). As shown in Fig. S16, the correlations between MO-OOA and sulfate are found to be strongly BBOA and wind speed dependent. For high wind speed and low BBOA concentrations, the mean MO-OOA-to-sulfate ratio is close to 1, while it reaches up to 8 under high BBOA and low-to-medium wind speed. This is consistent with the assumption of an enhancement of MO-OOA formation in the presence of substantial biomass burning emissions, which have been reported as a major anthropogenic SOA source (Heringa et al., 2011; Tiitta et al., 2016; Bertrand et al., 2017; Stavroulas et al., 2019; Daellenbach et al., 2019). Actually, both MO-OOA and LO-OOA factors may be significantly influenced by wood burning emissions as they are displaying similar correlations with eBCwb for highest MO-OOA-to-sulfate ratios during wintertime (Fig. 6).
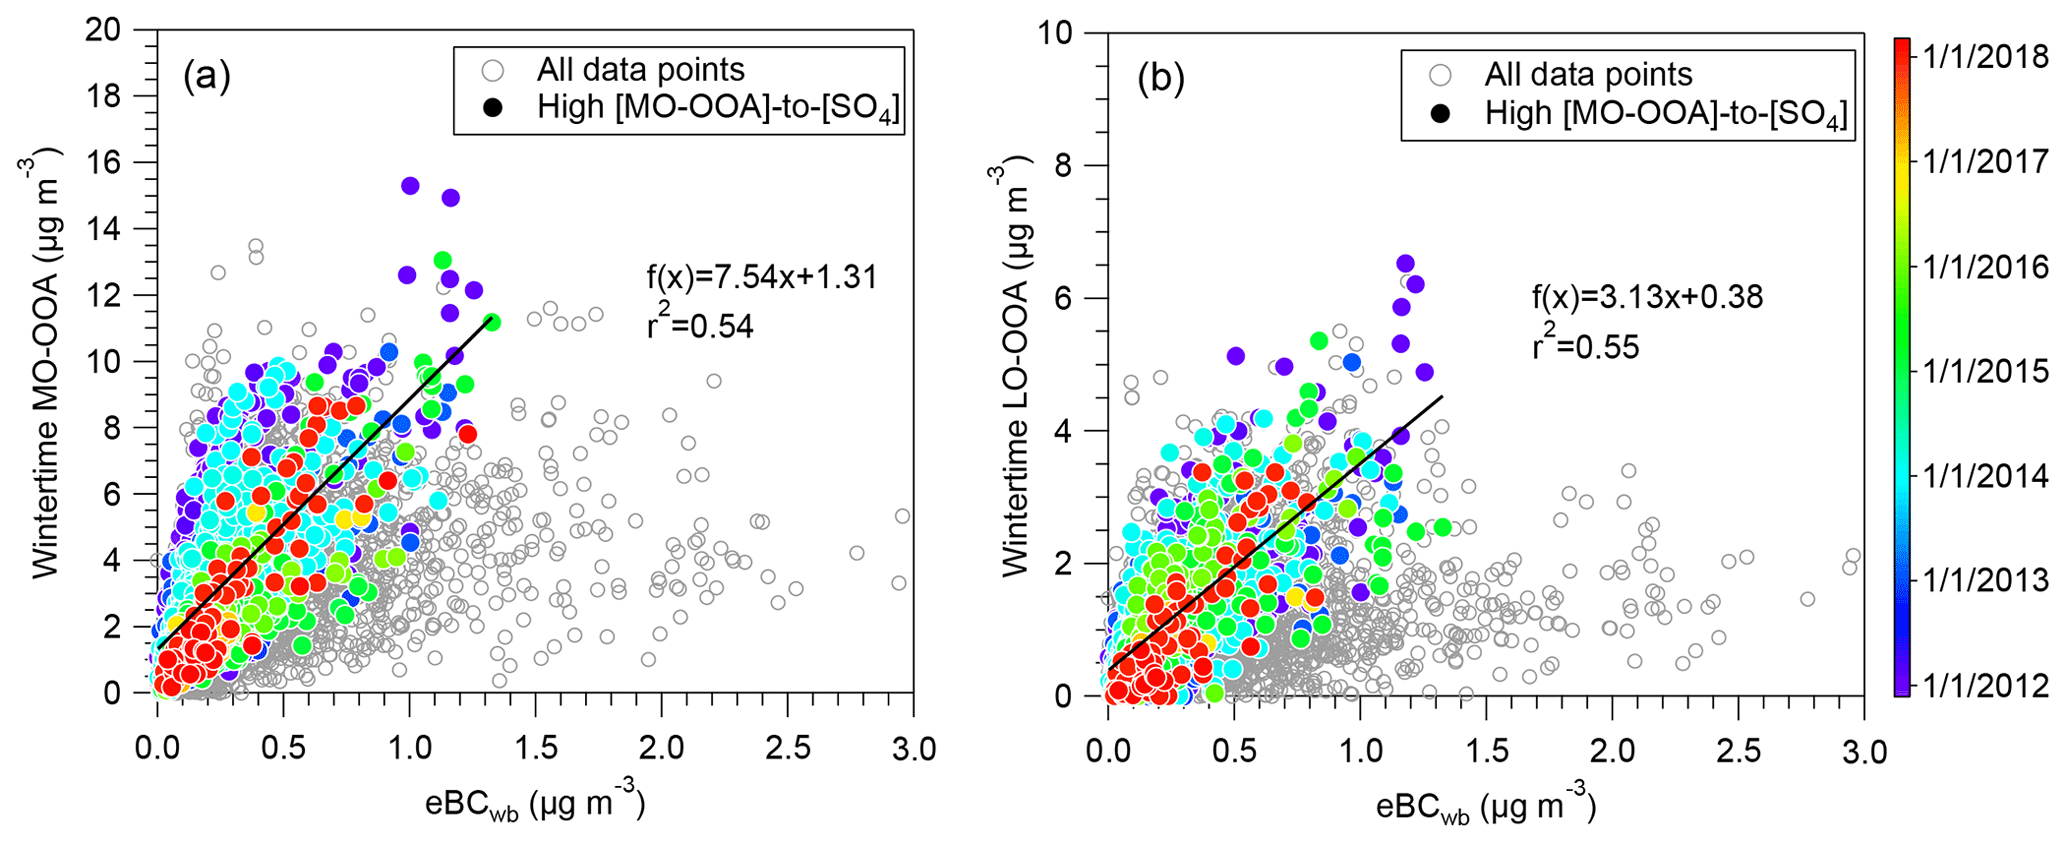
Figure 6Correlations between SOA factors (MO-OOA and LO-OOA) with a BB-related tracer (eBCwb) during wintertime. The color-coded solid circle points (in panels a and b) are the data points corresponding to high ratios of [MO-OOA]-to-[SO4] (more than 8), for which the curve fits are performed.
As shown in Fig. S17, high concentrations of MO-OOA are generally observed at high RH (> 80 %) and low temperature (< 0 ∘C) conditions during wintertime. This low air temperature condition could be associated with a possible scenario for increase in the MO-OOA precursor emissions from biomass burning by residential heating activities during wintertime. As Fig. S18 shows, the MO-OOA-to-sulfate ratio shows a significant enhancement as a function of RH in winter, suggesting that the aqueous-phase heterogeneous processes may represent an important pathway for the local MO-OOA formation in winter as proposed by Gilardoni et al. (2016). Conversely, there are no obvious RH–temperature dependent patterns for the MO-OOA in spring (Fig. S17), indicative of more complex formation processes during this season. In summer, MO-OOA displays an evident increase from early afternoon to evening (Fig. S15), suggesting significant local photochemical production of SOA particles in summer with higher temperature and increased solar radiation (Petit et al., 2015). As a matter of fact, MO-OOA presents high concentrations under high temperature (> 25 ∘C) and low RH (< 65 %) summertime conditions (Fig. S17). In conclusion, and despite relatively constant mass spectra all over the year, MO-OOA appears to originate from various season-dependent formation pathways and sources (such as biomass burning and biogenic sources) that should still be investigated in more detail.
The LO-OOA mass spectra with high f43∕f44 ratios are frequently observed in spring, summer and fall, whereas a lower ratio is obtained for winter (Fig. S9). These different mass spectra of LO-OOA could be partially explained by season-dependent formation mechanisms and sources. The monthly mean mass concentrations of LO-OOA vary from 0.8 to 3.6 µg m−3 (Fig. 5d) and show a statistically significant seasonality (p < 0.001) with higher concentrations during warm months and lower during cold months. As discussed above, the high summertime LO-OOA concentrations are assessed to be mainly linked with BSOA formation. As presented in Fig. S17, the temperature–RH dependence of the LO-OOA factor is very different according to the season. In particular, the highest wintertime LO-OOA concentrations are mainly observed at low temperature and high RH conditions, suggesting that gas–particle partitioning may play an important role in LO-OOA formation during this season. As shown in Fig. 6b, LO-OOA shows a good correlation (r2=0.55) with eBCwb at high MO-OOA-to-sulfate ratio conditions during wintertime, in agreement with the case of MO-OOA, which suggests that wood burning emissions could also contribute to the LO-OOA formation during winter. This is consistent with freshly formed SOA originating from primary biomass burning emissions, as reported by previous studies (Crippa et al., 2013b; Zhang et al., 2015; Sun et al., 2018; Stavroulas et al., 2019). In summer, the LO-OOA concentrations present a strong positive temperature dependence, while the RH dependence is not clear, indicating that photochemical production of LO-OOA became more important in summer than in winter. Moreover, high concentrations of the summertime LO-OOA are observed during the two distinct time periods in a day, i.e., early afternoon (around 12:00–15:00 LT) and nighttime (around 22:00–05:00 LT), which is different from the diel variations in other seasons with high concentrations only during nighttime (Fig. S15). These LO-OOA diel variations may reflect different formation pathways across a day in summer. Photochemical processes might dominate the LO-OOA production at daytime, while nighttime chemistry and/or gas–particle partitioning might promote its formation at low temperature conditions at night.
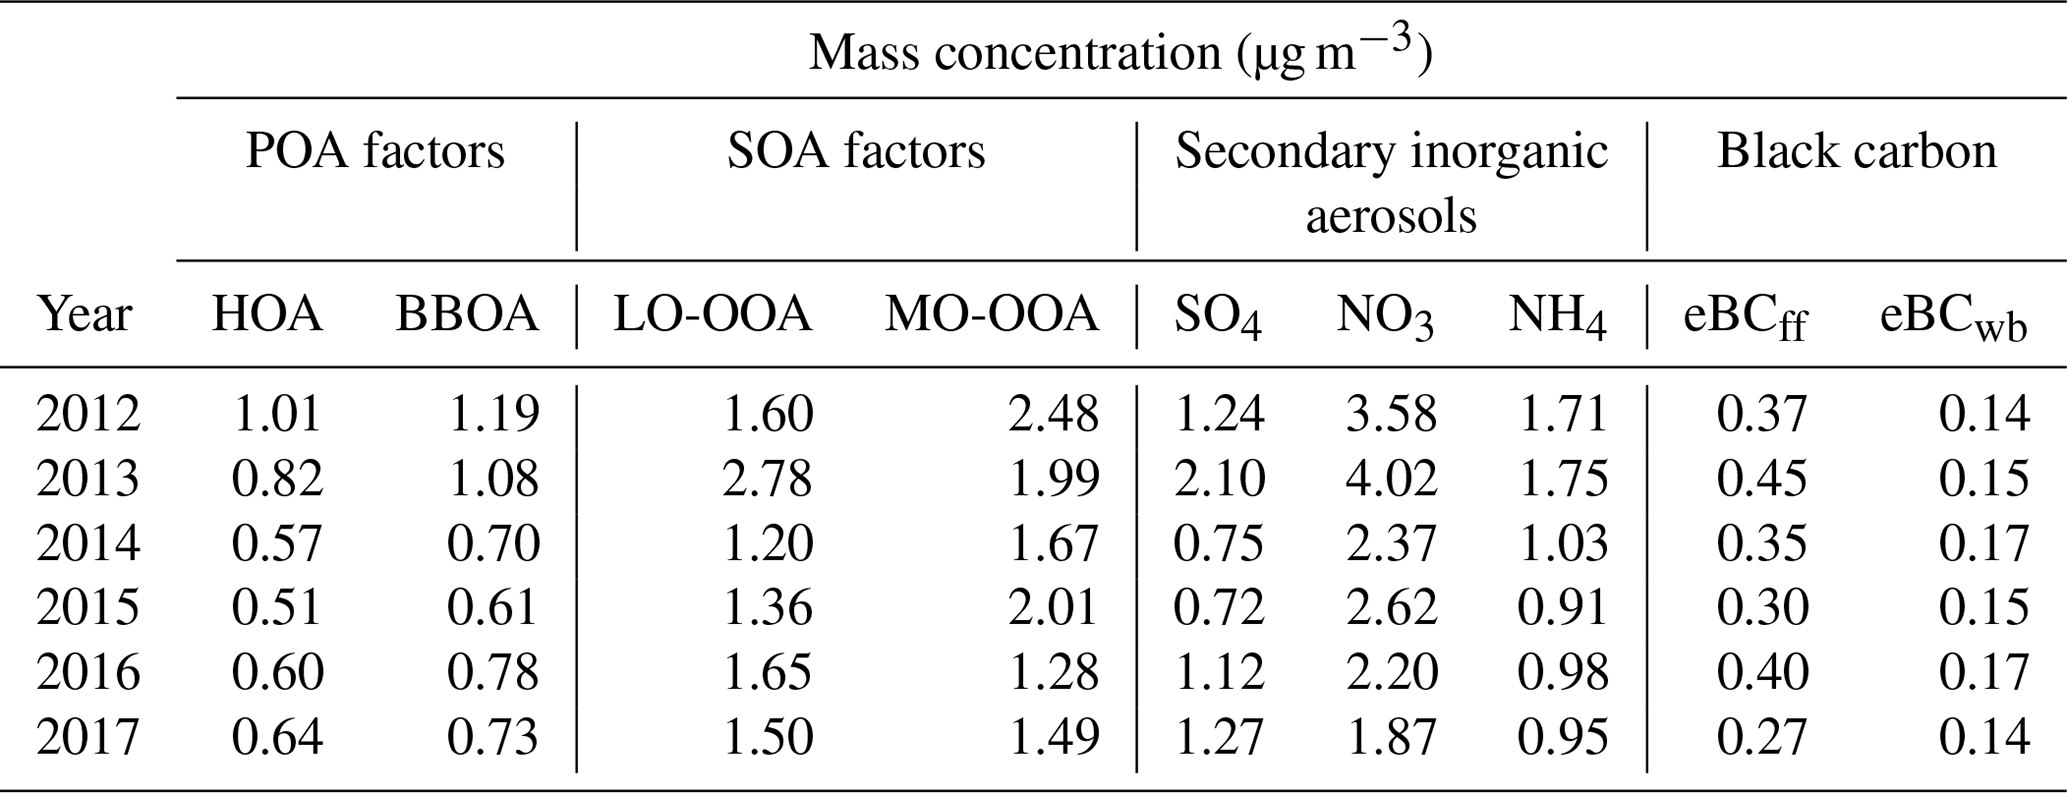
Table 1Annual average mass concentration of OA factors, secondary inorganic aerosols (sulfate, nitrate and ammonium) and eBC components.
4.2.2 Long-term temporal trends
Figure 7 presents the results obtained from the trend analysis of the 6-year monthly time series of the four OA factors, total OA, the two eBC components, secondary inorganic species (sulfate and nitrate) and total PM1 (the sum of NR-PM1 and eBC). The significance and magnitude of these trends were examined using the MK p value and Sen's slope, respectively. Annual mean mass concentrations of these OA factors and aerosol chemical species are given in Table 1.
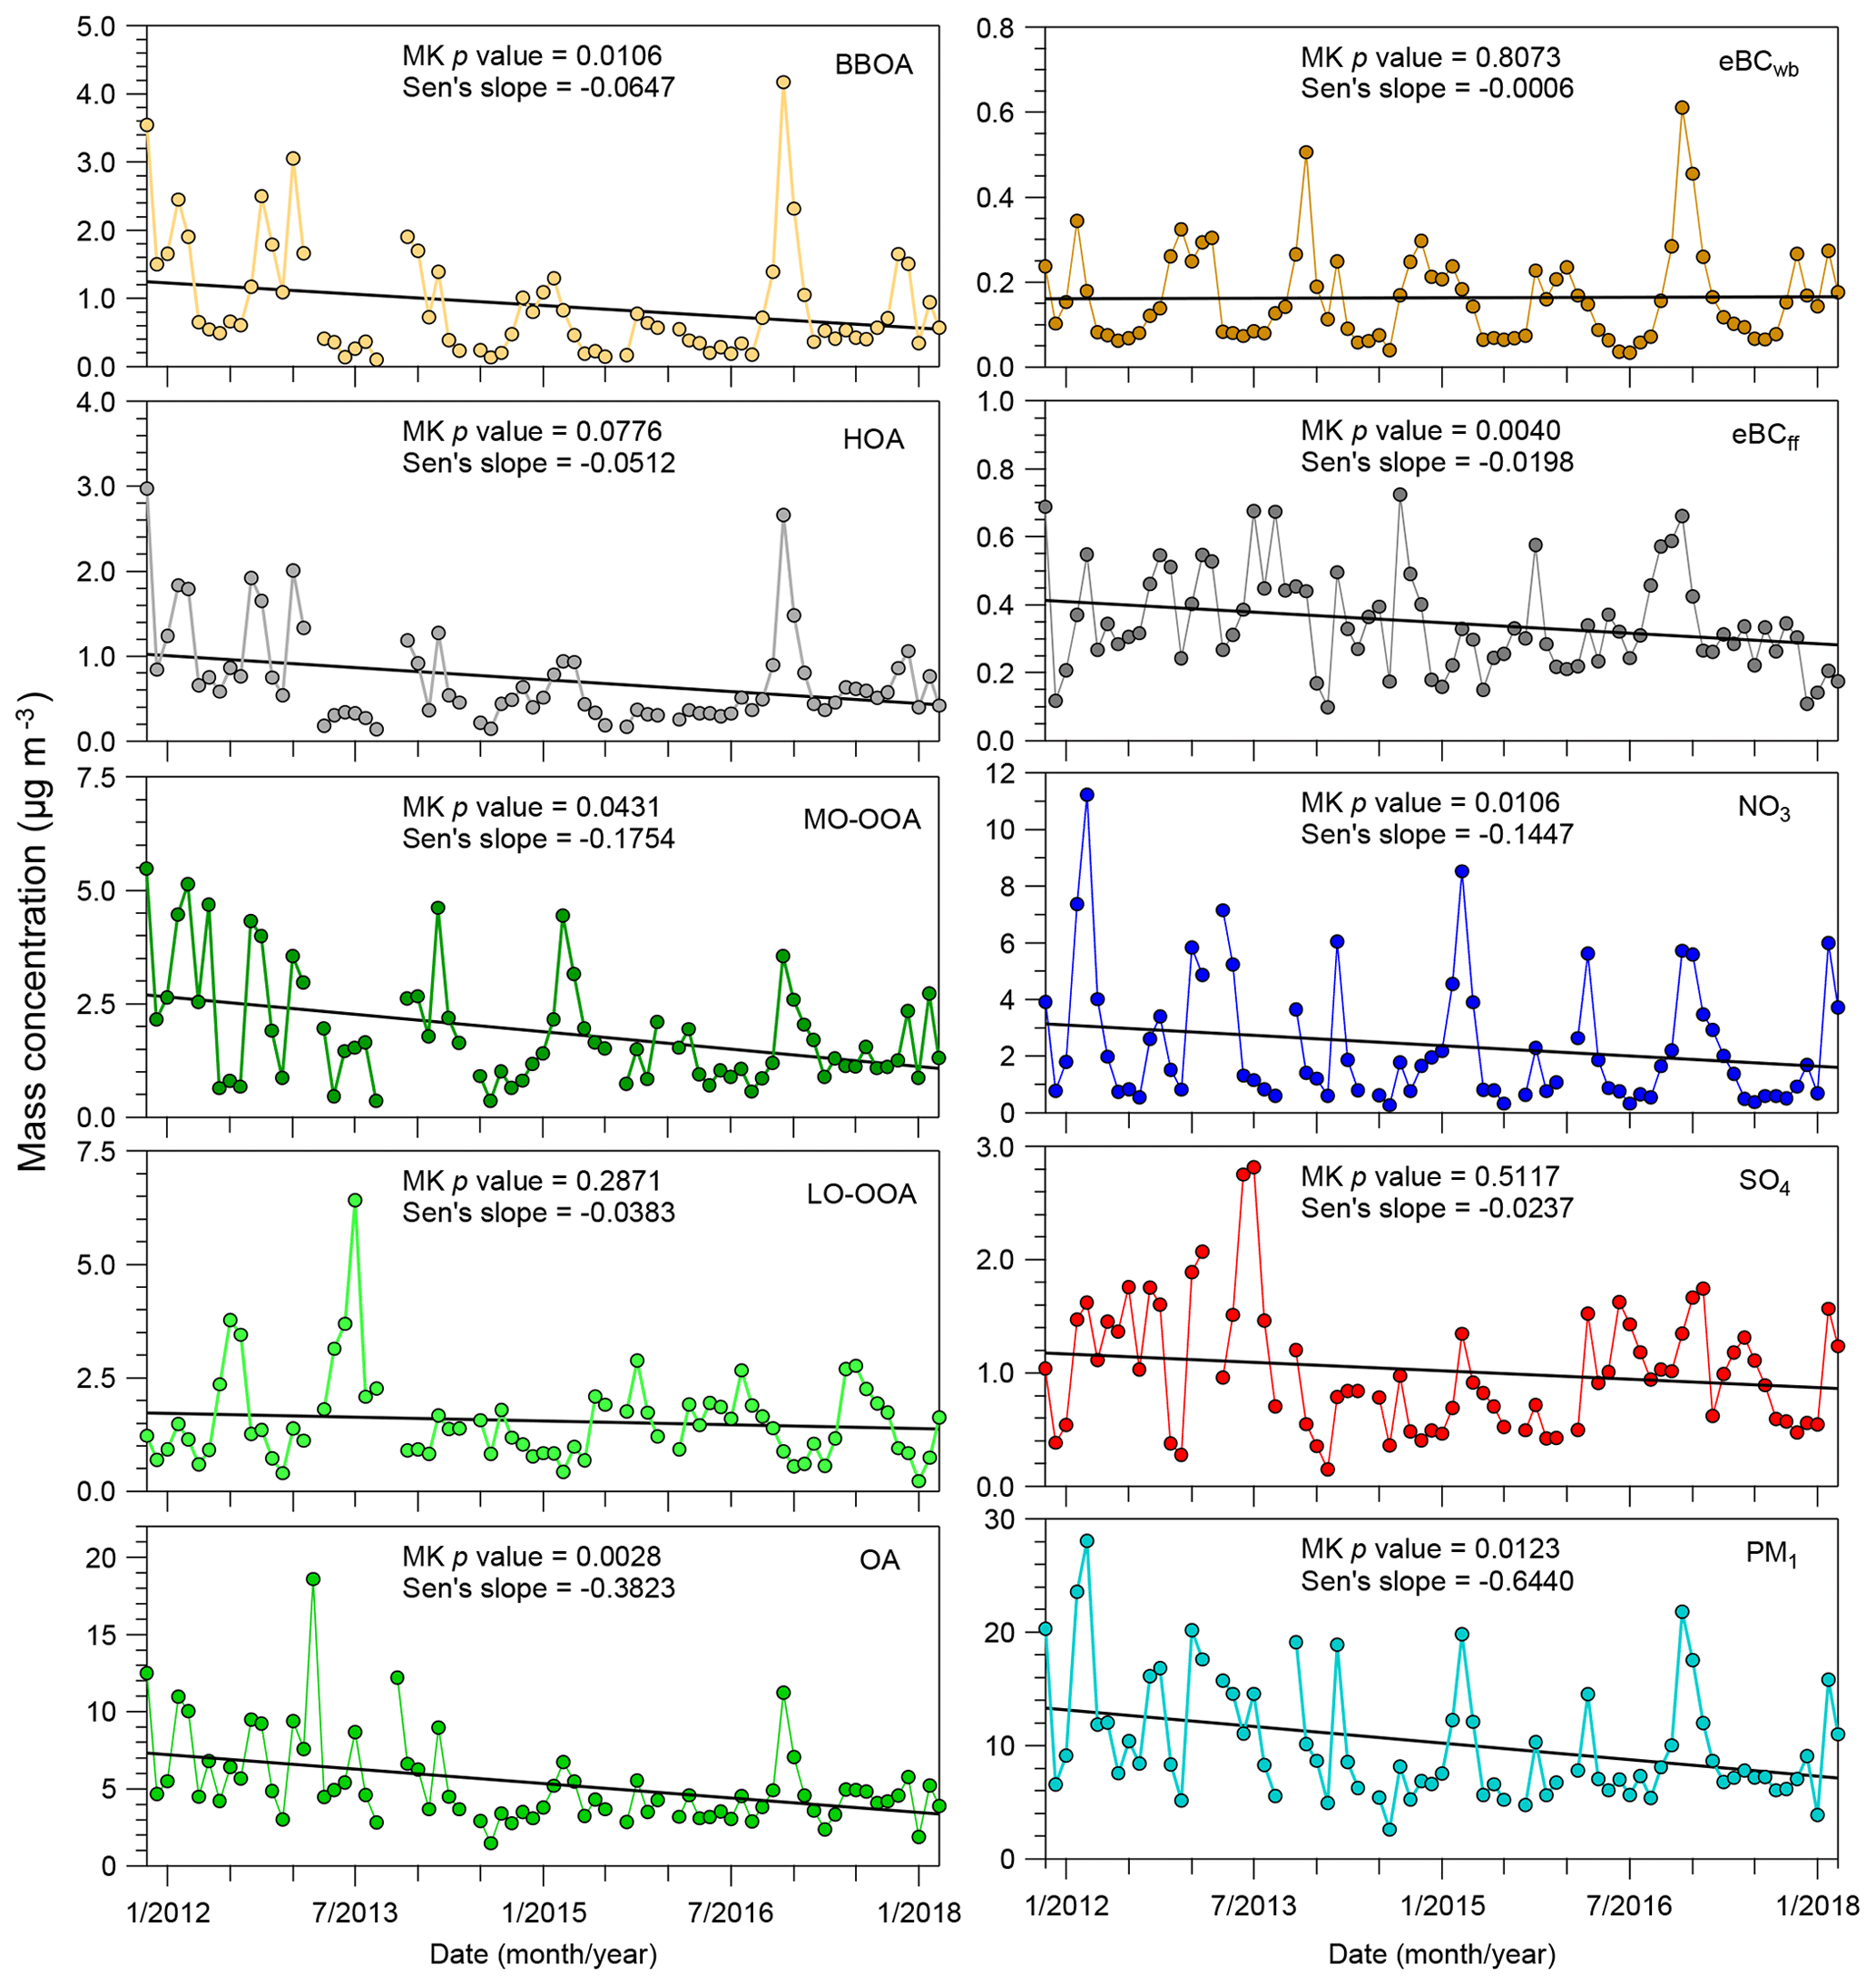
Figure 7Temporal trends of monthly mass concentrations of different chemical speciation, including eBCwb, eBCff, SO4 (sulfate), NO3 (nitrate), four OA factors, total OA and total PM1(the sum of NR-PM1 and eBC). The MK or seasonal MK tests associated with estimated Sen's slope (µg m−3 yr−1) were used for the trend analysis.
BBOA presents a statistically significant decreasing trend (p < 0.05) with a Sen's slope of about −65 ng m−3 per year in the Paris region. On the other hand, eBCwb concentration trends appear quite stable over the investigated period. Two possible reasons may explain the discrepancy in trend results between BBOA and eBCwb. It may be hypothesized that a limited overall improvement of woodstove performances in the Paris region could have influenced BBOA emission factors more than eBCwb ones (Saleh et al., 2014) but no evidence has been found to support this assumption. Similarly, but in the opposite way, eBCff was found to have a significant decreasing trend, while the HOA trend was found to be statistically insignificant (p value > 0.05). However, if removing the high concentration peaks observed in December (for which an important contribution of wood burning HOA can be expected), the MK p value is reduced to be 0.03, which would be indicative of a significant decreasing trend (with a related Sen's slope of −59 ng m−3 yr−1). These results would be in line with a reduction of PM1 traffic emissions (−37 %) over the past years (2012–2017) in France, as estimated by the French emission inventory state operator (CITEPA, 2018). However, such trend analyses should be performed on longer datasets for a much better evaluation of the pollution control strategies (both on road transport and residential heating emissions) in the Paris region.
MO-OOA shows a significant decreasing trend (p < 0.05) with a Sen's slope of −175 ng m−3 per year. Considering the overwhelming secondary origin of this factor, this significant decreasing trend may be partially explained by an overall reduction of anthropogenic VOCs emissions (−13 %) in France (CITEPA, 2018) and even in a larger spatial scale, e.g., the western European region, during 2012–2017. LO-OOA presents no significant trend (with p > 0.05). As discussed above, higher LO-OOA loadings may be linked to BSOA formation, especially at summertime. The stability of LO-OOA concentrations over time may be linked to limited changes in biogenic VOC emissions and/or in relevant oxidant concentrations that control the SOA burden in the atmosphere. The effect of anthropogenic–biogenic interaction mechanisms on biogenic SOA formation – e.g., involving NOx, as reported by previous studies in urban regions (Budisulistiorini et al., 2015; Zhang et al., 2017) – could also partially explain the limited changes for the long-term trend of LO-OOA at SIRTA. Detailed LO-OOA formation processes involved here still need to be further investigated. Nevertheless, it may be assumed that reductions of anthropogenic VOC emissions only cannot be sufficient to weaken the total SOA background concentrations in the Paris area.
The trends are more significant for total OA (p < 0.005, about −382 ng m−3 yr−1), as well as for nitrate (p of about 0.01 and approximately −145 ng m−3 yr−1) and total PM1 (p of about 0.002, and approximately −644 ng m−3 yr−1), than for sulfate (with a p value around 0.5117). In addition to SO2 emitted from anthropogenic sources (e.g., industrial and shipping emissions) (Hoesly et al., 2018), natural sources (e.g., volcanic emissions) (Boichu et al., 2019) could also influence the sulfate budget in western Europe. This suggests that regional aerosol chemistry modeling simulations by using different SO2 emission sectors may help to further explain the temporal trends of sulfate. Meanwhile, it should be noted that the sulfate trend here could be probably influenced by the ACSM measurement uncertainties (Crenn et al., 2015; Freney et al., 2019), which could not be fully quantified here. Overall, these decreasing trends could reflect the response of the PM concentrations to the decrease in anthropogenic source emissions during these last years in Europe. Reduction in NOx (−19 %) came with a negligible change in NH3 emissions (+2 %) over the French region during recent years (2012–2017), which may support the fact that the decreasing trend in particulate nitrate was likely driven by the NOx emissions control in the Paris region (CITEPA, 2018). A continuous effort to reduce POA emissions and SOA precursors (VOCs) may lead to the decrease in both the total OA and fine PM budgets (EMEP, 2016; CITEPA, 2018).
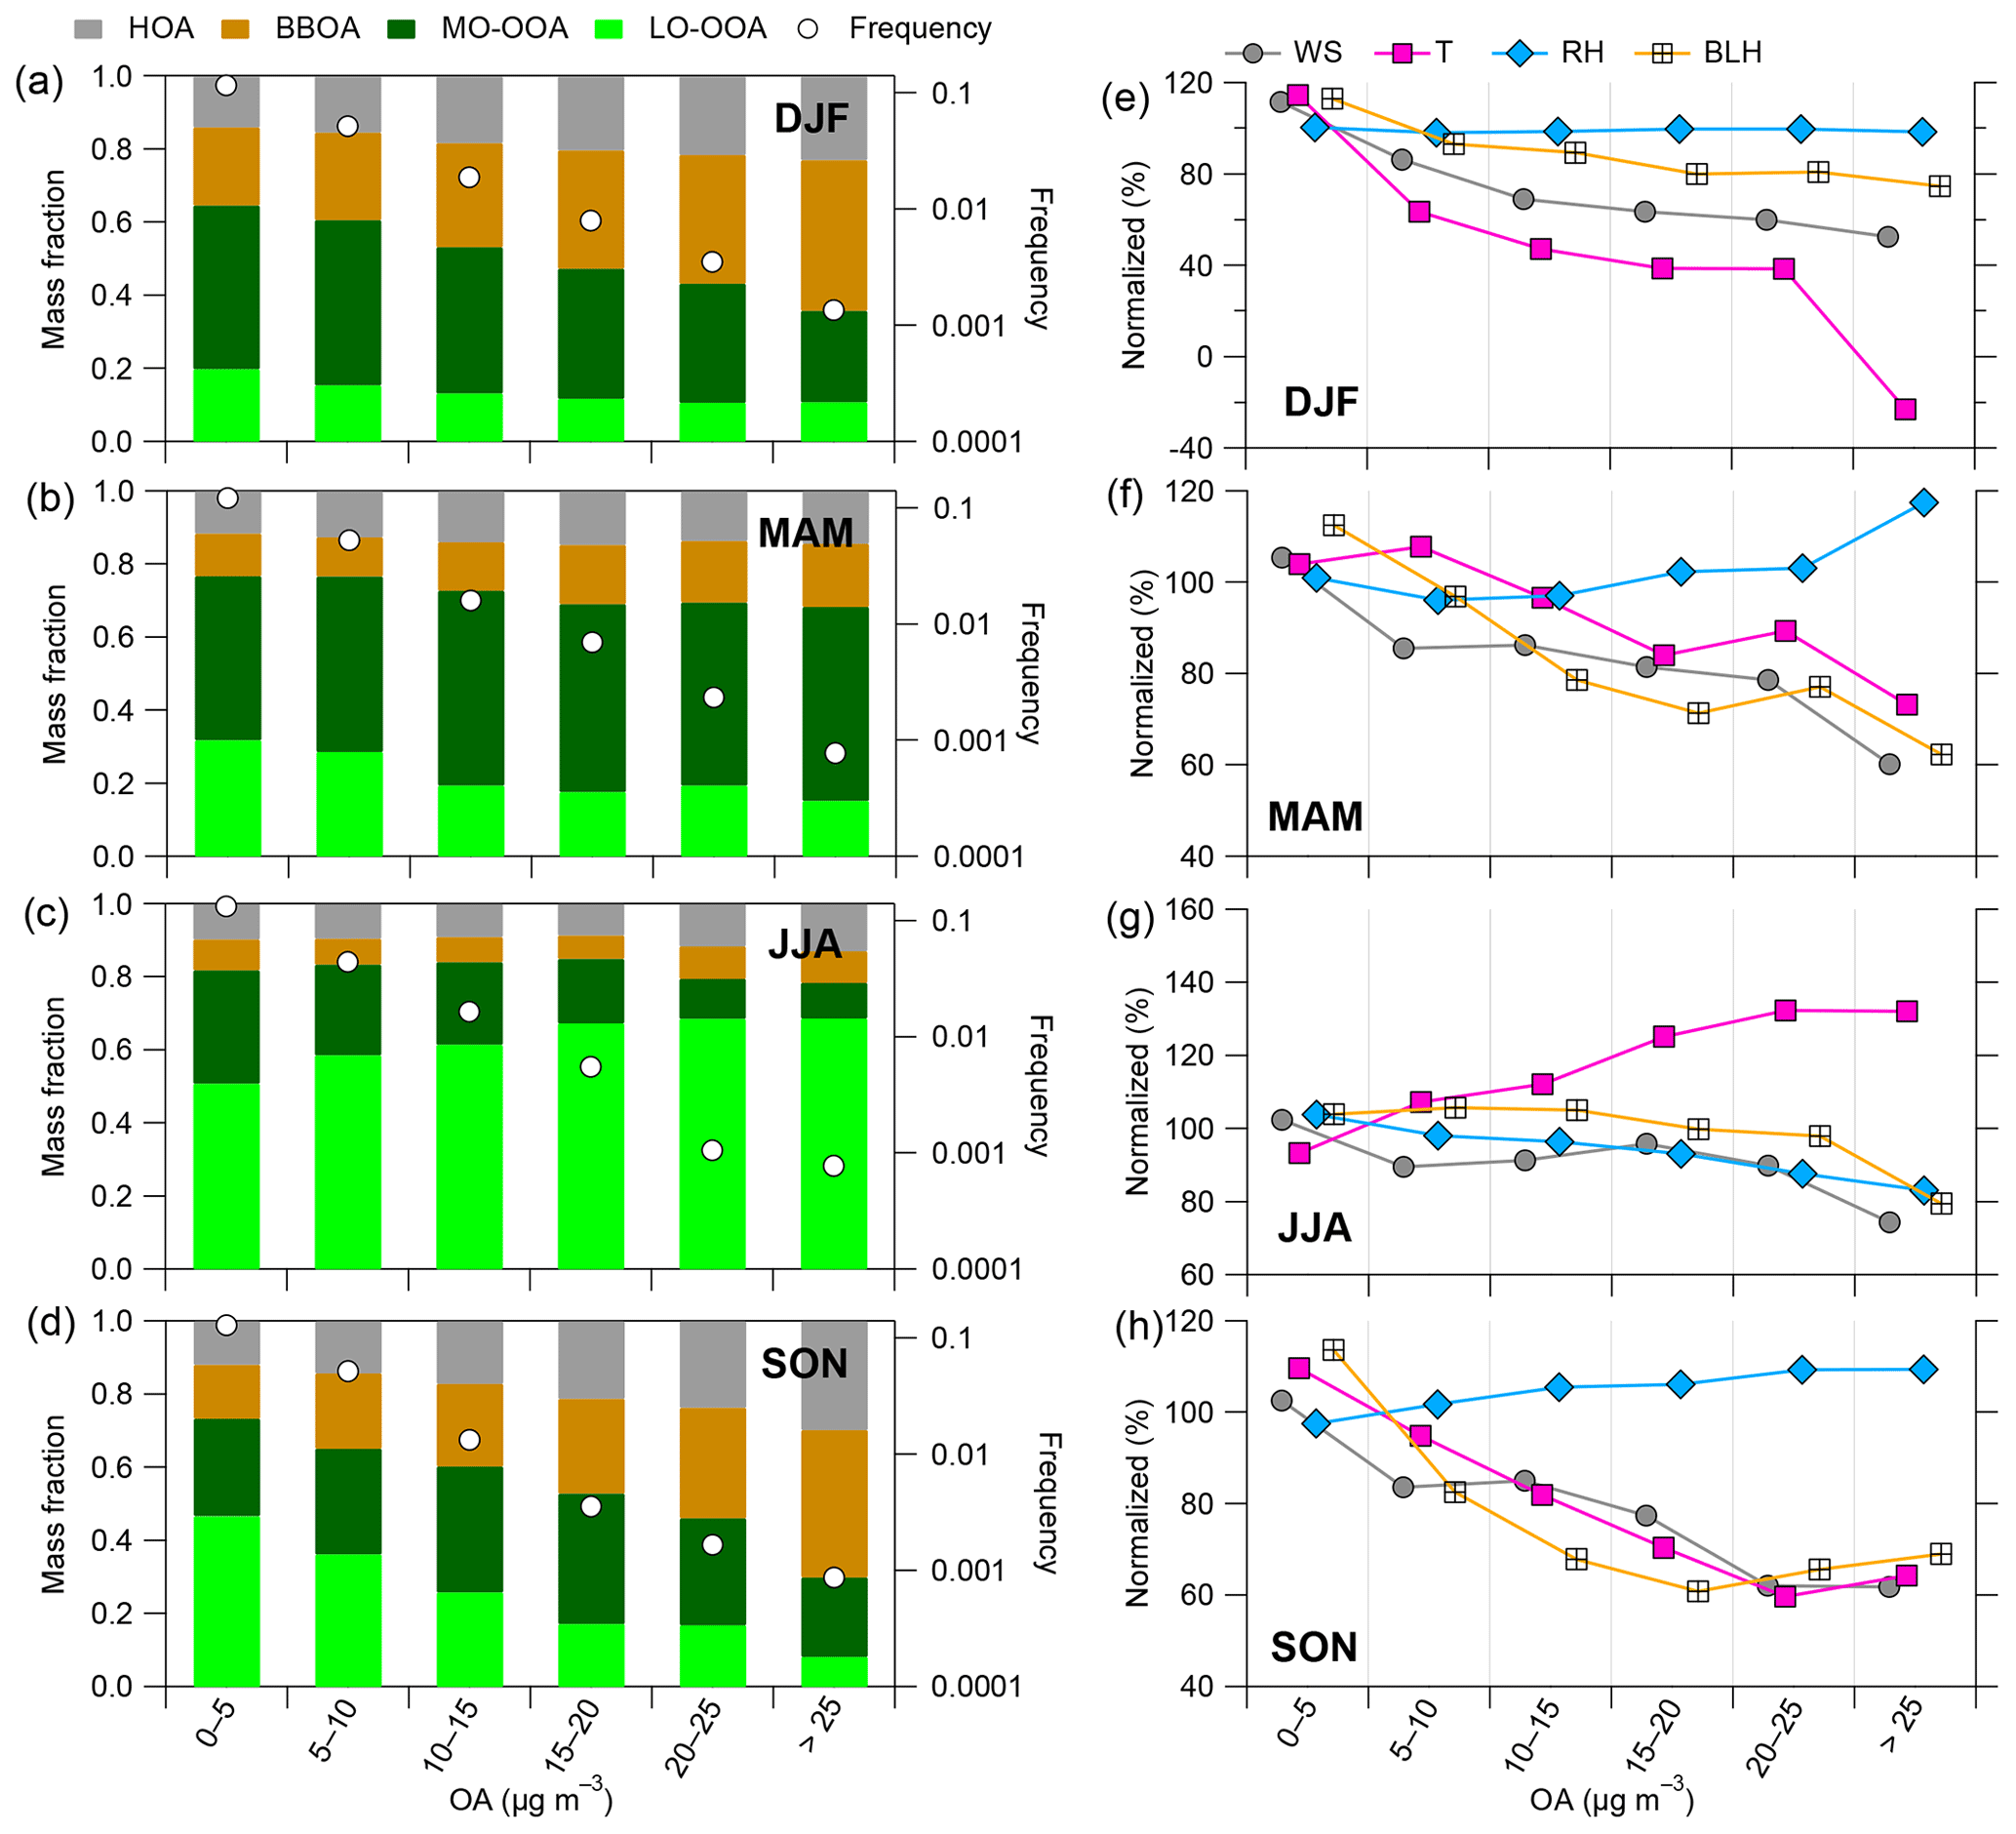
Figure 8(a–d) Mass fraction of OA factors and (e–h) meteorological parameters (i.e., WS, T, RH and BLH) as a function of OA mass loadings in four seasons: winter (DJF), spring (MAM), summer (JJA) and fall (SON), along with frequency distributions (white circle points). The percent change of all meteorological parameters was normalized based on the average values over the 6-year period considered here.
4.3 OA source contribution as a function of OA concentrations
Figure 8 presents the contribution of the four OA sources as a function of total submicron OA mass loadings or each season along with percent changes in meteorological conditions. In winter and fall (Fig. 8e and h), all meteorological parameters – except limited changes in RH – show negative relationships as a function of the OA mass concentrations, confirming the coincidence of low temperature, low WS and/or low BLH in the formation of pollution episodes (Dupont et al., 2016). POA contributions gradually increase from 35 % (27 %) up to 64 % (70 %) as a function of OA mass concentrations in winter (fall) (Fig. 8a and d). These results illustrate the major role of primary sources during periods with high OA concentrations during the cold seasons. In particular, BBOA contribution gradually increase from 21 % (15 %) to 41 % (40 %) in winter (fall) along with OA mass loading increase.
In spring, OA composition is radically changed and is dominated by the two OOA fractions, with almost constant average contributions (68 %–77 %), regardless of OA concentration levels (Fig. 8b), indicating the major role in SOA during this season. MO-OOA presents higher contributions to OA (45 %–53 %) than LO-OOA (15 %–31 %), suggesting that the formation of aged SOA plays a key role on the build-up of episodes with high OA concentrations during springtime. As shown in Fig. 8f, the percent changes in temperature, WS and BLH gradually decrease with increasing OA concentrations. By contrast, RH shows a positive relationship with OA mass concentrations, with the largest RH enhancement (16 %) at the highest OA-loading bin (> 25 µg m−3). This may suggest that high RH is the most favorable environmental condition for SOA formation during springtime OA pollution episodes, as supported by a high contribution of OOA factors at the highest OA concentration level (Fig. 8b). In addition, although BBOA contributions remained relatively limited, they increase from 11 % to 17 % when OA increased from less than 10 to > 25 µg m−3. This may reveal a non-negligible influence of wood burning emissions during early spring pollution episodes.
In summer, OA was also dominated by the two OOA fractions (around 80 %–85 % at all OA-loading bins). The LO-OOA contribution gradually increased from 51 % to 69 % as a function of OA mass loading associated with a significant increase in temperature (Fig. 8c and g). Other meteorological variables (i.e., RH, WS and BLH) showed relatively stable changes across different OA mass loadings (Fig. 8g). These results confirm that high OA concentrations during summer are strongly determined by temperature-driven biogenic SOA formation processes.

Figure 9Seasonal wind dependence of POA factors. (a) Wind rose plots color coded by wind speed (m s−1), and (b) BBOA and (c) HOA, color-coded by mass concentrations (µg m−3).
4.4 Potential geographic origins
Figure 9 presents seasonal wind-dependent variations of the POA factors. Wind rose plots (Fig. 9a) present the greatest frequency (up to approximate 32 %) of winds associated with southwestern wind direction in all seasons. In spring, the occurrences of air masses from the west, northwest, north and northeast sectors are comparable (about 15 %). As presented in Fig. 9b, BBOA shows high concentrations associated with the eastern wind sectors, except in summer, which is in agreement with the location of the residential area on the eastern and western parts of SIRTA. Compared to other seasons, high concentrations of BBOA are also observed linking to western wind sectors in winter, which may imply more intense biomass burning from larger scales during colder months. As discussed above, HOA is a mixed factor with biomass burning aerosols during wintertime, which therefore presents a similar wind-dependent pattern as BBOA (Fig. 9b and c). In spring, summer and fall, HOA presents a distinct pattern with high concentrations associated with northeastern wind sectors from urban area of Paris, suggesting that the short-range transport from the urban Paris area may strongly impact the HOA concentrations at SIRTA.
Figure 10 shows maps of the most probable geographic origins of the two OOA factors for each season based on PSCF analysis. In winter, MO-OOA presents high PSCF values over the Benelux, Germany and Poland, showing a major influence of long-range transport of OA from northeastern sectors. Those results may suggest more intense SOA production and aging processes at regional scale for continental air masses. As a matter of fact, MO-OOA shows wider potential source regions than LO-OOA, which is assessed as fresh SOA and could be mainly formed at more local scale in winter. Moreover, the impact of transport from northeastern regions – hosting intense anthropogenic activities (e.g., industries) – onto MO-OOA concentrations may also support a significant anthropogenic origin for this aged SOA factor.
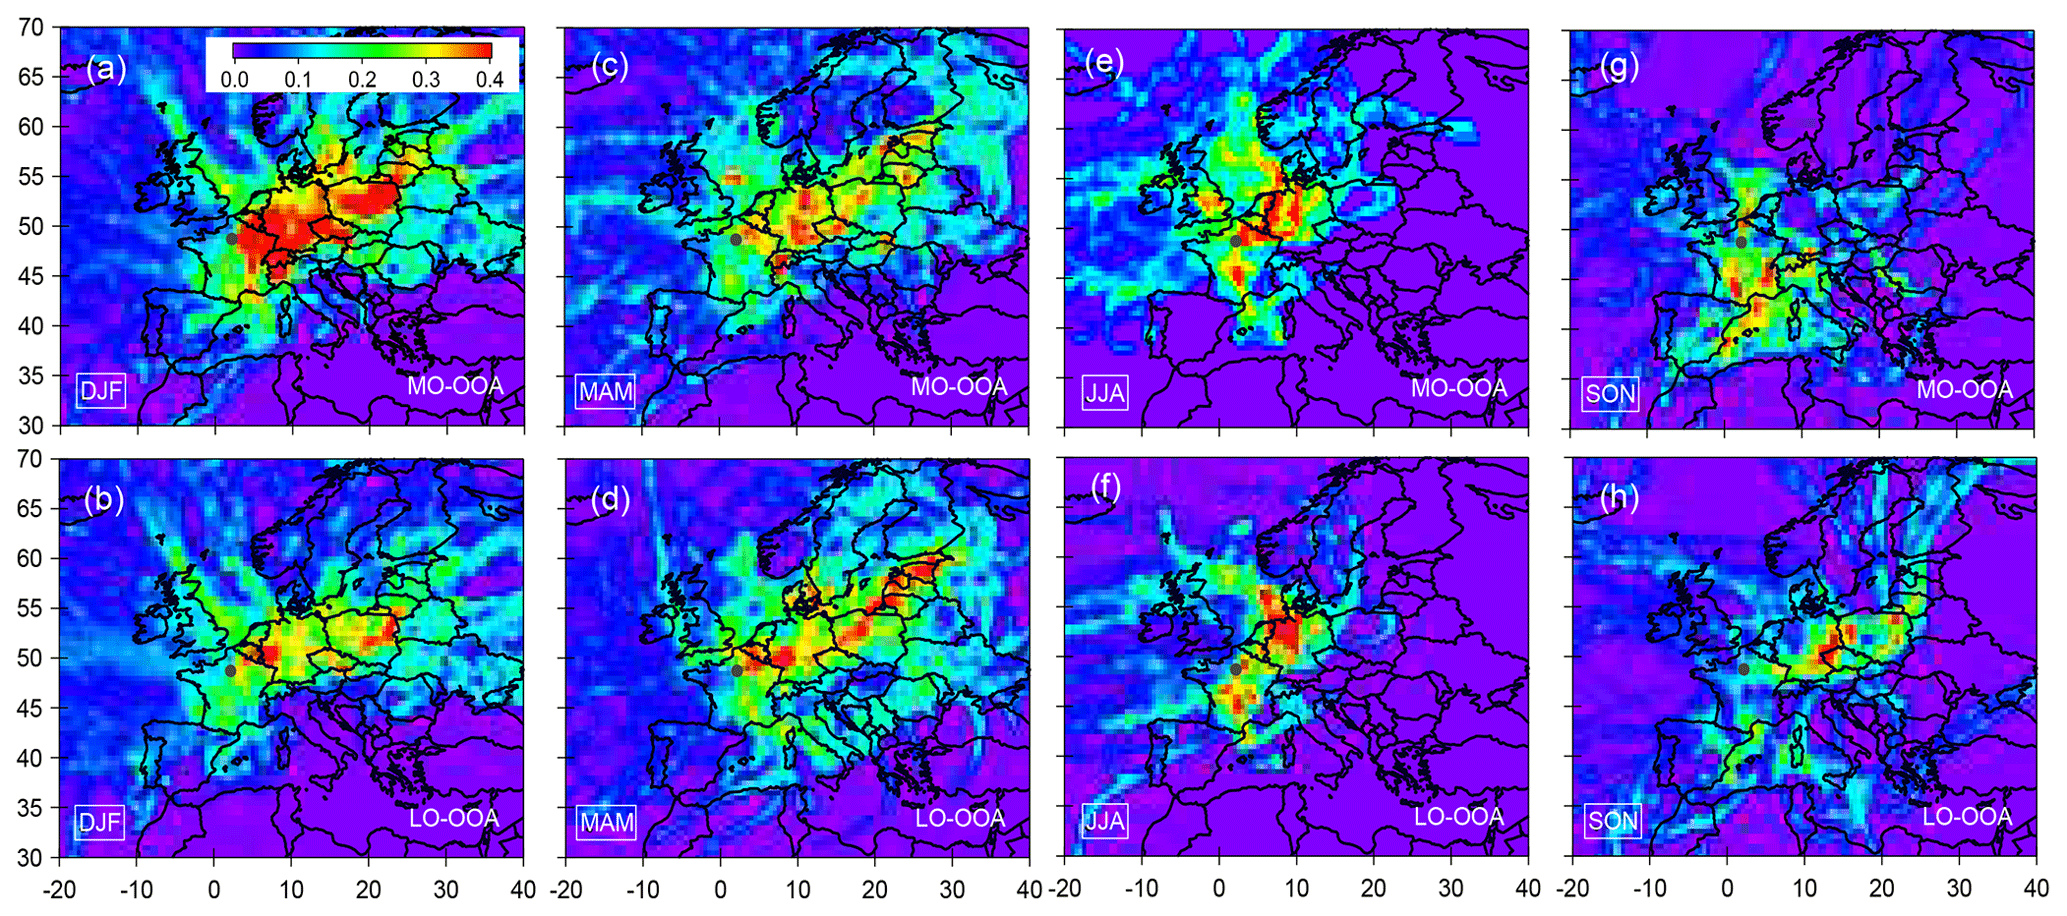
Figure 10Maps for potential source origins of regional transport that may contribute to SOA (including MO-OOA and LO-OOA) burdens at SIRTA. Observed data points with wind speed (less than 4 m s−1) and in the presence of precipitation events are filtered for the PSCF calculation. The solid black point in each plot represents the location of the sampling site.
As shown in Fig. 10c and d, both MO-OOA and LO-OOA present high springtime PSCF values originating from the northeastern regions too, which can participate in pollution episodes frequently observed during this season (Petit et al., 2015; Srivastava et al., 2018b). Therefore, mitigation of VOC emissions at the regional scale could help to reduce the substantial influence of OA on PM limit value exceedances during this season. A narrower distribution of potential source regions was observed in summer and fall, compared to winter and spring. MO-OOA presents potential source regions mainly from the northeast in summer, while it has a high potential source region originating from the south in fall (Fig. 10g).
All these results indicated that significant reduction of the SOA burden in the Paris region does not only require the limitation of local source emissions but also needs a synergistic control strategy for the regional sources, especially from northeastern European regions. In this respect, they confirmed conclusions reached by previous short-term campaigns (e.g., Sciare et al., 2010; Crippa et al., 2013b; Freutel et al., 2013; Beekman et al., 2015).
A comprehensive OA source apportionment has been achieved over the region of Paris from November 2011 to March 2018. Four factors, comprising HOA, BBOA, MO-OOA and LO-OOA, have been identified and selected to ensure consistency of PMF factor solution over 6 years in this study. Mean annual contributions of these factors to OA were of 11 %–16 % (HOA), 14 %–19 % (BBOA), 25 %–42 % (LO-OOA), and 30 %–45 % (MO-OOA), respectively. BBOA presented a statistically significant seasonal pattern with highest concentrations during cold months, due to residential wood burning emissions. The contribution of BBOA increased with increasing concentration of OA mass in winter and fall – along with decreasing boundary layer height and wind speed – highlighting the importance of biomass burning emissions for OA pollution under stagnant meteorological conditions. HOA presented temporal variations similar to BBOA in cold months, which was partly related to the fact that wood burning emissions also contributed to HOA burden. BBOA and HOA exhibited very limited (< 70 ng m−3 yr−1) and not significant (at the 5 % significance level) decreasing trends. These results imply that specific mitigation strategies (e.g., emission control), especially for residential wood burning, are still necessary for substantial improvement of air quality in the cold season in the Paris region. Moreover, residential biomass burning emissions could be assumed as an important air pollution source over western Europe, while such a source remains largely unregulated.
LO-OOA and MO-OOA presented different seasonal variations, reflecting different formation mechanisms and/or precursor sources. LO-OOA displayed a pronounced seasonal cycle, with highest contributions to total OA in summer (50 %–66 %) and lowest ones in winter (12 %–19 %). Enhanced LO-OOA production during the warm season was assessed to be mainly driven by biogenic SOA formation. This factor showed no significant long-term trend (p > 0.05) for the studied period. MO-OOA presented a higher contribution to OA in wintertime (35 %–51 %) and springtime (32 %–62 %) than during the rest of the year. PSCF analyses suggested a high probability of MO-OOA long-range transport from northeastern Europe towards the Paris region. MO-OOA displayed a significant (p < 0.05) decreasing trend (of about −175 ng m−3 yr−1), which might reflect the effect of the emission control strategy of anthropogenic SOA precursors at the regional scale over the last decade. However, future work is needed to fully understand chemical properties of these SOA factors corresponding to different origins over different seasons in the Paris region and to quantify the impact of emission control on ambient SOA burden.
The data have been presented in the text, table and figures as well as the Supplement. Additional related data can be made available upon request (olivier.favez@ineris.fr).
The supplement related to this article is available online at: https://doi.org/10.5194/acp-19-14755-2019-supplement.
OF, AA and VG designed and led the study. YZ conducted the data analyses. J-EP, FT, NB, VC, TA and JS provided the field observations. FC and AP supported the source apportionment analyses. YZ and OF interpreted the data and wrote the article, with inputs from all coauthors.
The authors declare that they have no conflict of interest.
This work greatly benefited from discussions within the COLOSSAL COST action CA16109. Yunjiang Zhang acknowledges the China Scholarship Council for a PhD scholarship.
This research has been supported by the EU-FP7 and H2020 ACTRIS projects (grant nos. 262254 and 654109), by the National Center for Scientific Research (CNRS), by the French alternatives energies and Atomic Energy Commission (CEA), and by the French ministry of Environment through its funding to the reference laboratory for air quality monitoring (LCSQA).
This paper was edited by Eleanor Browne and reviewed by two anonymous referees.
Aiken, A. C., DeCarlo, P. F., Kroll, J. H., Worsnop, D. R., Huffman, J. A., Docherty, K. S., Ulbrich, I. M., Mohr, C., Kimmel, J. R., Sueper, D., Sun, Y., Zhang, Q., Trimborn, A., Northway, M., Ziemann, P. J., Canagaratna, M. R., Onasch, T. B., Alfarra, M. R., Prévôt, A. S. H., Dommen, J., Duplissy, J., Metzger, A., Baltensperger, U., and Jimenez, J. L.: O/C and OM/OC ratios of primary, secondary, and ambient organic aerosols with high-resolution time-of-flight aerosol mass spectrometer, Environ. Sci. Technol., 42, 4478–4485, 2008.
Alfarra, M. R., Prevot, A. S. H., Szidat, S., Sandradewi, J., Weimer, S., Lanz, V. A., Schreiber, D., Mohr, M., and Baltensperger, U.: Identification of the Mass Spectral Signature of Organic Aerosols from Wood Burning Emissions, Environ. Sci. Technol., 41, 5770–5777, https://doi.org/10.1021/es062289b, 2007.
Bae, M.-S., Demerjian, K. L., and Schwab, J. J.: Seasonal estimation of organic mass to organic carbon in PM2.5 at rural and urban locations in New York state, Atmos. Environ., 40, 7467–7479, https://doi.org/10.1016/j.atmosenv.2006.07.008, 2006.
Baudic, A., Gros, V., Sauvage, S., Locoge, N., Sanchez, O., Sarda-Estève, R., Kalogridis, C., Petit, J.-E., Bonnaire, N., Baisnée, D., Favez, O., Albinet, A., Sciare, J., and Bonsang, B.: Seasonal variability and source apportionment of volatile organic compounds (VOCs) in the Paris megacity (France), Atmos. Chem. Phys., 16, 11961–11989, https://doi.org/10.5194/acp-16-11961-2016, 2016.
Beekmann, M., Prévôt, A. S. H., Drewnick, F., Sciare, J., Pandis, S. N., Denier van der Gon, H. A. C., Crippa, M., Freutel, F., Poulain, L., Ghersi, V., Rodriguez, E., Beirle, S., Zotter, P., von der Weiden-Reinmüller, S.-L., Bressi, M., Fountoukis, C., Petetin, H., Szidat, S., Schneider, J., Rosso, A., El Haddad, I., Megaritis, A., Zhang, Q. J., Michoud, V., Slowik, J. G., Moukhtar, S., Kolmonen, P., Stohl, A., Eckhardt, S., Borbon, A., Gros, V., Marchand, N., Jaffrezo, J. L., Schwarzenboeck, A., Colomb, A., Wiedensohler, A., Borrmann, S., Lawrence, M., Baklanov, A., and Baltensperger, U.: In situ, satellite measurement and model evidence on the dominant regional contribution to fine particulate matter levels in the Paris megacity, Atmos. Chem. Phys., 15, 9577–9591, https://doi.org/10.5194/acp-15-9577-2015, 2015.
Bertrand, A., Stefenelli, G., Bruns, E. A., Pieber, S. M., Temime-Roussel, B., Slowik, J. G., Prévôt, A. S. H., Wortham, H., El Haddad, I., and Marchand, N.: Primary emissions and secondary aerosol production potential from woodstoves for residential heating: Influence of the stove technology and combustion efficiency, Atmos. Environ., 169, 65–79, https://doi.org/10.1016/j.atmosenv.2017.09.005, 2017.
Bressi, M., Sciare, J., Ghersi, V., Bonnaire, N., Nicolas, J. B., Petit, J.-E., Moukhtar, S., Rosso, A., Mihalopoulos, N., and Féron, A.: A one-year comprehensive chemical characterisation of fine aerosol (PM2.5) at urban, suburban and rural background sites in the region of Paris (France), Atmos. Chem. Phys., 13, 7825–7844, https://doi.org/10.5194/acp-13-7825-2013, 2013.
Bressi, M., Sciare, J., Ghersi, V., Mihalopoulos, N., Petit, J.-E., Nicolas, J. B., Moukhtar, S., Rosso, A., Féron, A., Bonnaire, N., Poulakis, E., and Theodosi, C.: Sources and geographical origins of fine aerosols in Paris (France), Atmos. Chem. Phys., 14, 8813–8839, https://doi.org/10.5194/acp-14-8813-2014, 2014.
Boichu, M., Favez, O., Riffault, V., Petit, J.-E., Zhang, Y., Brogniez, C., Sciare, J., Chiapello, I., Clarisse, L., Zhang, S., Pujol-Söhne, N., Tison, E., Delbarre, H., and Goloub, P.: Large-scale particulate air pollution and chemical fingerprint of volcanic sulfate aerosols from the 2014–2015 Holuhraun flood lava eruption of Bárðarbunga volcano (Iceland), Atmos. Chem. Phys., 19, 14253–14287, https://doi.org/10.5194/acp-19-14253-2019, 2019.
Boucher, O., Randall, D., Artaxo, P., Bretherton, C., Feingold, G., Forster, P., Kerminen, V.-M., Kondo, Y., Liao, H., Lohmann, U., Rasch, P., Satheesh, S. K., Sherwood, S., Stevens, B., and Zhang, X. Y.: Clouds and Aerosols, in: Climate Change 2013: The Physical Science Basis. Contribution of Working Group I to the Fifth Assessment Report of the Intergovernmental Panel on Climate Change, edited by: Stocker, T. F., Qin, D., Plattner, G.-K., Tignor, M., Allen, S. K., Boschung, J., Nauels, A., Xia, Y., Bex, V., and Midgley, P. M., Cambridge University Press, Cambridge, United Kingdom and New York, NY, USA, 571–658, 2013.
Bozzetti, C., El Haddad, I., Salameh, D., Daellenbach, K. R., Fermo, P., Gonzalez, R., Minguillón, M. C., Iinuma, Y., Poulain, L., Elser, M., Müller, E., Slowik, J. G., Jaffrezo, J.-L., Baltensperger, U., Marchand, N., and Prévôt, A. S. H.: Organic aerosol source apportionment by offline-AMS over a full year in Marseille, Atmos. Chem. Phys., 17, 8247–8268, https://doi.org/10.5194/acp-17-8247-2017, 2017.
Budisulistiorini, S. H., Li, X., Bairai, S. T., Renfro, J., Liu, Y., Liu, Y. J., McKinney, K. A., Martin, S. T., McNeill, V. F., Pye, H. O. T., Nenes, A., Neff, M. E., Stone, E. A., Mueller, S., Knote, C., Shaw, S. L., Zhang, Z., Gold, A., and Surratt, J. D.: Examining the effects of anthropogenic emissions on isoprene-derived secondary organic aerosol formation during the 2013 Southern Oxidant and Aerosol Study (SOAS) at the Look Rock, Tennessee ground site, Atmos. Chem. Phys., 15, 8871–8888, https://doi.org/10.5194/acp-15-8871-2015, 2015.
Canagaratna, M. R., Jayne, J. T., Jimenez, J. L., Allan, J. D., Alfarra, M. R., Zhang, Q., Onasch, T. B., Drewnick, F., Coe, H., Middlebrook, A., Delia, A., Williams, L. R., Trimborn, A. M., Northway, M. J., DeCarlo, P. F., Kolb, C. E., Davidovits, P., and Worsnop, D. R.: Chemical and microphysical characterization of ambient aerosols with the aerodyne aerosol mass spectrometer, Mass Spectrom. Rev., 26, 185–222, https://doi.org/10.1002/mas.20115, 2007.
Canagaratna, M. R., Jimenez, J. L., Kroll, J. H., Chen, Q., Kessler, S. H., Massoli, P., Hildebrandt Ruiz, L., Fortner, E., Williams, L. R., Wilson, K. R., Surratt, J. D., Donahue, N. M., Jayne, J. T., and Worsnop, D. R.: Elemental ratio measurements of organic compounds using aerosol mass spectrometry: characterization, improved calibration, and implications, Atmos. Chem. Phys., 15, 253–272, https://doi.org/10.5194/acp-15-253-2015, 2015.
Canonaco, F., Crippa, M., Slowik, J. G., Baltensperger, U., and Prévôt, A. S. H.: SoFi, an IGOR-based interface for the efficient use of the generalized multilinear engine (ME-2) for the source apportionment: ME-2 application to aerosol mass spectrometer data, Atmos. Meas. Tech., 6, 3649–3661, https://doi.org/10.5194/amt-6-3649-2013, 2013.
Canonaco, F., Slowik, J. G., Baltensperger, U., and Prévôt, A. S. H.: Seasonal differences in oxygenated organic aerosol composition: implications for emissions sources and factor analysis, Atmos. Chem. Phys., 15, 6993–7002, https://doi.org/10.5194/acp-15-6993-2015, 2015.
Cavalli, F., Viana, M., Yttri, K. E., Genberg, J., and Putaud, J.-P.: Toward a standardised thermal-optical protocol for measuring atmospheric organic and elemental carbon: the EUSAAR protocol, Atmos. Meas. Tech., 3, 79–89, https://doi.org/10.5194/amt-3-79-2010, 2010.
CITEPA: Édition mars: Inventaire des émissions de polluants atmosphériques en France métropolitaine, format CEE-NU, available at: https://cibe.fr/wp-content/uploads/2018/08/2018-CITEPA-Inventaire-émissions-polluants.pdf (last access: 30 May 2019), 2018.
Crenn, V., Sciare, J., Croteau, P. L., Verlhac, S., Fröhlich, R., Belis, C. A., Aas, W., Äijälä, M., Alastuey, A., Artiñano, B., Baisnée, D., Bonnaire, N., Bressi, M., Canagaratna, M., Canonaco, F., Carbone, C., Cavalli, F., Coz, E., Cubison, M. J., Esser-Gietl, J. K., Green, D. C., Gros, V., Heikkinen, L., Herrmann, H., Lunder, C., Minguillón, M. C., Močnik, G., O'Dowd, C. D., Ovadnevaite, J., Petit, J.-E., Petralia, E., Poulain, L., Priestman, M., Riffault, V., Ripoll, A., Sarda-Estève, R., Slowik, J. G., Setyan, A., Wiedensohler, A., Baltensperger, U., Prévôt, A. S. H., Jayne, J. T., and Favez, O.: ACTRIS ACSM intercomparison – Part 1: Reproducibility of concentration and fragment results from 13 individual Quadrupole Aerosol Chemical Speciation Monitors (Q-ACSM) and consistency with co-located instruments, Atmos. Meas. Tech., 8, 5063–5087, https://doi.org/10.5194/amt-8-5063-2015, 2015.
Crippa, M., Canonaco, F., Slowik, J. G., El Haddad, I., DeCarlo, P. F., Mohr, C., Heringa, M. F., Chirico, R., Marchand, N., Temime-Roussel, B., Abidi, E., Poulain, L., Wiedensohler, A., Baltensperger, U., and Prévôt, A. S. H.: Primary and secondary organic aerosol origin by combined gas-particle phase source apportionment, Atmos. Chem. Phys., 13, 8411–8426, https://doi.org/10.5194/acp-13-8411-2013, 2013a.
Crippa, M., DeCarlo, P. F., Slowik, J. G., Mohr, C., Heringa, M. F., Chirico, R., Poulain, L., Freutel, F., Sciare, J., Cozic, J., Di Marco, C. F., Elsasser, M., Nicolas, J. B., Marchand, N., Abidi, E., Wiedensohler, A., Drewnick, F., Schneider, J., Borrmann, S., Nemitz, E., Zimmermann, R., Jaffrezo, J.-L., Prévôt, A. S. H., and Baltensperger, U.: Wintertime aerosol chemical composition and source apportionment of the organic fraction in the metropolitan area of Paris, Atmos. Chem. Phys., 13, 961–981, https://doi.org/10.5194/acp-13-961-2013, 2013b.
Crippa, M., Canonaco, F., Lanz, V. A., Äijälä, M., Allan, J. D., Carbone, S., Capes, G., Ceburnis, D., Dall'Osto, M., Day, D. A., DeCarlo, P. F., Ehn, M., Eriksson, A., Freney, E., Hildebrandt Ruiz, L., Hillamo, R., Jimenez, J. L., Junninen, H., Kiendler-Scharr, A., Kortelainen, A.-M., Kulmala, M., Laaksonen, A., Mensah, A. A., Mohr, C., Nemitz, E., O'Dowd, C., Ovadnevaite, J., Pandis, S. N., Petäjä, T., Poulain, L., Saarikoski, S., Sellegri, K., Swietlicki, E., Tiitta, P., Worsnop, D. R., Baltensperger, U., and Prévôt, A. S. H.: Organic aerosol components derived from 25 AMS data sets across Europe using a consistent ME-2 based source apportionment approach, Atmos. Chem. Phys., 14, 6159–6176, https://doi.org/10.5194/acp-14-6159-2014, 2014.
Daellenbach, K. R., Stefenelli, G., Bozzetti, C., Vlachou, A., Fermo, P., Gonzalez, R., Piazzalunga, A., Colombi, C., Canonaco, F., Hueglin, C., Kasper-Giebl, A., Jaffrezo, J.-L., Bianchi, F., Slowik, J. G., Baltensperger, U., El-Haddad, I., and Prévôt, A. S. H.: Long-term chemical analysis and organic aerosol source apportionment at nine sites in central Europe: source identification and uncertainty assessment, Atmos. Chem. Phys., 17, 13265–13282, https://doi.org/10.5194/acp-17-13265-2017, 2017.
Daellenbach, K. R., Kourtchev, I., Vogel, A. L., Bruns, E. A., Jiang, J., Petäjä, T., Jaffrezo, J.-L., Aksoyoglu, S., Kalberer, M., Baltensperger, U., El Haddad, I., and Prévôt, A. S. H.: Impact of anthropogenic and biogenic sources on the seasonal variation in the molecular composition of urban organic aerosols: a field and laboratory study using ultra-high-resolution mass spectrometry, Atmos. Chem. Phys., 19, 5973–5991, https://doi.org/10.5194/acp-19-5973-2019, 2019.
Dall'Osto, M., Paglione, M., Decesari, S., Facchini, M. C., O'Dowd, C., Plass-Duellmer, C., and Harrison, R. M.: On the Origin of AMS “Cooking Organic Aerosol” at a Rural Site, Environ. Sci. Technol., 49, 13964–13972, https://doi.org/10.1021/acs.est.5b02922, 2015.
Draxler, R. R. and Rolph, G. D.: HYSPLIT (HYbrid Single-Particle Lagrangian Integrated Trajectory) Model Access via NOAA ARL READY Website. NOAA Air Resources Laboratory, Silver Spring, MD, available at: http://www.arl.noaa.gov/ready/hysplit4.html (last access: 28 November 2019), 2003.
Drinovec, L., Močnik, G., Zotter, P., Prévôt, A. S. H., Ruckstuhl, C., Coz, E., Rupakheti, M., Sciare, J., Müller, T., Wiedensohler, A., and Hansen, A. D. A.: The ”dual-spot” Aethalometer: an improved measurement of aerosol black carbon with real-time loading compensation, Atmos. Meas. Tech., 8, 1965–1979, https://doi.org/10.5194/amt-8-1965-2015, 2015.
Drinovec, L., Gregorič, A., Zotter, P., Wolf, R., Bruns, E. A., Prévôt, A. S. H., Petit, J.-E., Favez, O., Sciare, J., Arnold, I. J., Chakrabarty, R. K., Moosmüller, H., Filep, A., and Močnik, G.: The filter-loading effect by ambient aerosols in filter absorption photometers depends on the coating of the sampled particles, Atmos. Meas. Tech., 10, 1043–1059, https://doi.org/10.5194/amt-10-1043-2017, 2017.
Dupont, J.-C., Haeffelin, M., Badosa, J., Elias, T., Favez, O., Petit, J.-E., Meleux, F., Sciare, J., Crenn, V., and Bonne, J.-L.: Role of the boundary layer dynamics effects on an extreme air pollution event in Paris, Atmos. Environ., 141, 571–579, https://doi.org/10.1016/j.atmosenv.2016.06.061, 2016.
EMEP: Air pollution trends in the EMEP region between 1990 and 2012, CCC-report 1/2016, avaialbe at: http://publications.iass-potsdam.de/pubman/item/escidoc:1622889:8/component/escidoc:1622890/1622889.pdf (last access: 30 May 2019), 2016.
Favez, O., Cachier, H., Sciare, J., Sarda-Estève, R., and Martinon, L.: Evidence for a significant contribution of wood burning aerosols to PM2.5 during the winter season in Paris, France, Atmos. Environ., 43, 3640–3644, https://doi.org/10.1016/j.atmosenv.2009.04.035, 2009.
Favez, O., El Haddad, I., Piot, C., Boréave, A., Abidi, E., Marchand, N., Jaffrezo, J.-L., Besombes, J.-L., Personnaz, M.-B., Sciare, J., Wortham, H., George, C., and D'Anna, B.: Inter-comparison of source apportionment models for the estimation of wood burning aerosols during wintertime in an Alpine city (Grenoble, France), Atmos. Chem. Phys., 10, 5295–5314, https://doi.org/10.5194/acp-10-5295-2010, 2010.
Freney, E., Sellegri, K., Chrit, M., Adachi, K., Brito, J., Waked, A., Borbon, A., Colomb, A., Dupuy, R., Pichon, J.-M., Bouvier, L., Delon, C., Jambert, C., Durand, P., Bourianne, T., Gaimoz, C., Triquet, S., Féron, A., Beekmann, M., Dulac, F., and Sartelet, K.: Aerosol composition and the contribution of SOA formation over Mediterranean forests, Atmos. Chem. Phys., 18, 7041–7056, https://doi.org/10.5194/acp-18-7041-2018, 2018.
Freney, E., Zhang, Y., Croteau, P., Amodeo, T., Williams, L., Truong, F., Petit, J.-E., Sciare, J., Sarda-Esteve, R., Bonnaire, N., Arumae, T., Aurela, M., Bougiatioti, A., Mihalopoulos, N., Coz, E., Artinano, B., Crenn, V., Elste, T., Heikkinen, L., Poulain, L., Wiedensohler, A., Herrmann, H., Priestman, M., Alastuey, A., Stavroulas, I., Tobler, A., Vasilescu, J., Zanca, N., Canagaratna, M., Carbone, C., Flentje, H., Green, D., Maasikmets, M., Marmureanu, L., Minguillon, M. C., Prevot, A. S. H., Gros, V., Jayne, J., and Favez, O.: The second ACTRIS inter-comparison (2016) for Aerosol Chemical Speciation Monitors (ACSM): Calibration protocols and instrument performance evaluations, Aerosol Sci. Tech., 53, 830–842, https://doi.org/10.1080/02786826.2019.1608901, 2019.
Freutel, F., Schneider, J., Drewnick, F., von der Weiden-Reinmüller, S.-L., Crippa, M., Prévôt, A. S. H., Baltensperger, U., Poulain, L., Wiedensohler, A., Sciare, J., Sarda-Estève, R., Burkhart, J. F., Eckhardt, S., Stohl, A., Gros, V., Colomb, A., Michoud, V., Doussin, J. F., Borbon, A., Haeffelin, M., Morille, Y., Beekmann, M., and Borrmann, S.: Aerosol particle measurements at three stationary sites in the megacity of Paris during summer 2009: meteorology and air mass origin dominate aerosol particle composition and size distribution, Atmos. Chem. Phys., 13, 933–959, https://doi.org/10.5194/acp-13-933-2013, 2013.
Fröhlich, R., Cubison, M. J., Slowik, J. G., Bukowiecki, N., Canonaco, F., Croteau, P. L., Gysel, M., Henne, S., Herrmann, E., Jayne, J. T., Steinbacher, M., Worsnop, D. R., Baltensperger, U., and Prévôt, A. S. H.: Fourteen months of on-line measurements of the non-refractory submicron aerosol at the Jungfraujoch (3580 m a.s.l.) – chemical composition, origins and organic aerosol sources, Atmos. Chem. Phys., 15, 11373–11398, https://doi.org/10.5194/acp-15-11373-2015, 2015a.
Fröhlich, R., Crenn, V., Setyan, A., Belis, C. A., Canonaco, F., Favez, O., Riffault, V., Slowik, J. G., Aas, W., Aijälä, M., Alastuey, A., Artiñano, B., Bonnaire, N., Bozzetti, C., Bressi, M., Carbone, C., Coz, E., Croteau, P. L., Cubison, M. J., Esser-Gietl, J. K., Green, D. C., Gros, V., Heikkinen, L., Herrmann, H., Jayne, J. T., Lunder, C. R., Minguillón, M. C., Močnik, G., O'Dowd, C. D., Ovadnevaite, J., Petralia, E., Poulain, L., Priestman, M., Ripoll, A., Sarda-Estève, R., Wiedensohler, A., Baltensperger, U., Sciare, J., and Prévôt, A. S. H.: ACTRIS ACSM intercomparison – Part 2: Intercomparison of ME-2 organic source apportionment results from 15 individual, co-located aerosol mass spectrometers, Atmos. Meas. Tech., 8, 2555–2576, https://doi.org/10.5194/amt-8-2555-2015, 2015b.
Gentner, D. R., Jathar, S. H., Gordon, T. D., Bahreini, R., Day, D. A., El Haddad, I., Hayes, P. L., Pieber, S. M., Platt, S. M., de Gouw, J., Goldstein, A. H., Harley, R. A., Jimenez, J. L., Prévôt, A. S. H., and Robinson, A. L.: Review of Urban Secondary Organic Aerosol Formation from Gasoline and Diesel Motor Vehicle Emissions, Environ. Sci. Technol., 51, 1074–1093, https://doi.org/10.1021/acs.est.6b04509, 2017.
Gilardoni, S., Massoli, P., Paglione, M., Giulianelli, L., Carbone, C., Rinaldi, M., Decesari, S., Sandrini, S., Costabile, F., Gobbi, G. P., Pietrogrande, M. C., Visentin, M., Scotto, F., Fuzzi, S., and Facchini, M. C.: Direct observation of aqueous secondary organic aerosol from biomass-burning emissions, P. Natl. Acad. Sci. USA, 113, 10013–10018, https://doi.org/10.1073/pnas.1602212113, 2016.
Goldstein, A. H., Koven, C. D., Heald, C. L., and Fung, I. Y.: Biogenic carbon and anthropogenic pollutants combine to form a cooling haze over the southeastern United States, P. Natl. Acad. Sci. USA, 106, 8835–8840, https://doi.org/10.1073/pnas.0904128106, 2009.
Haeffelin, M., Barthès, L., Bock, O., Boitel, C., Bony, S., Bouniol, D., Chepfer, H., Chiriaco, M., Cuesta, J., Delanoë, J., Drobinski, P., Dufresne, J.-L., Flamant, C., Grall, M., Hodzic, A., Hourdin, F., Lapouge, F., Lemaître, Y., Mathieu, A., Morille, Y., Naud, C., Noël, V., O'Hirok, W., Pelon, J., Pietras, C., Protat, A., Romand, B., Scialom, G., and Vautard, R.: SIRTA, a ground-based atmospheric observatory for cloud and aerosol research, Ann. Geophys., 23, 253–275, https://doi.org/10.5194/angeo-23-253-2005, 2005.
Hallquist, M., Wenger, J. C., Baltensperger, U., Rudich, Y., Simpson, D., Claeys, M., Dommen, J., Donahue, N. M., George, C., Goldstein, A. H., Hamilton, J. F., Herrmann, H., Hoffmann, T., Iinuma, Y., Jang, M., Jenkin, M. E., Jimenez, J. L., Kiendler-Scharr, A., Maenhaut, W., McFiggans, G., Mentel, Th. F., Monod, A., Prévôt, A. S. H., Seinfeld, J. H., Surratt, J. D., Szmigielski, R., and Wildt, J.: The formation, properties and impact of secondary organic aerosol: current and emerging issues, Atmos. Chem. Phys., 9, 5155–5236, https://doi.org/10.5194/acp-9-5155-2009, 2009.
Heringa, M. F., DeCarlo, P. F., Chirico, R., Tritscher, T., Dommen, J., Weingartner, E., Richter, R., Wehrle, G., Prévôt, A. S. H., and Baltensperger, U.: Investigations of primary and secondary particulate matter of different wood combustion appliances with a high-resolution time-of-flight aerosol mass spectrometer, Atmos. Chem. Phys., 11, 5945–5957, https://doi.org/10.5194/acp-11-5945-2011, 2011.
Hoesly, R. M., Smith, S. J., Feng, L., Klimont, Z., Janssens-Maenhout, G., Pitkanen, T., Seibert, J. J., Vu, L., Andres, R. J., Bolt, R. M., Bond, T. C., Dawidowski, L., Kholod, N., Kurokawa, J.-I., Li, M., Liu, L., Lu, Z., Moura, M. C. P., O'Rourke, P. R., and Zhang, Q.: Historical (1750–2014) anthropogenic emissions of reactive gases and aerosols from the Community Emissions Data System (CEDS), Geosci. Model Dev., 11, 369–408, https://doi.org/10.5194/gmd-11-369-2018, 2018.
Jayne, J. T., Leard, D. C., Zhang, X., Davidovits, P., Smith, K. A., Kolb, C. E., and Worsnop, D. R.: Development of an Aerosol Mass Spectrometer for Size and Composition Analysis of Submicron Particles, Aerosol Sci. Tech., 33, 49–70, https://doi.org/10.1080/027868200410840, 2000.
Jimenez, J. L., Canagaratna, M. R., Donahue, N. M., Prevot, A. S. H., Zhang, Q., Kroll, J. H., DeCarlo, P. F., Allan, J. D., Coe, H., Ng, N. L., Aiken, A. C., Docherty, K. S., Ulbrich, I. M., Grieshop, A. P., Robinson, A. L., Duplissy, J., Smith, J. D., Wilson, K. R., Lanz, V. A., Hueglin, C., Sun, Y. L., Tian, J., Laaksonen, A., Raatikainen, T., Rautiainen, J., Vaattovaara, P., Ehn, M., Kulmala, M., Tomlinson, J. M., Collins, D. R., Cubison, M. J., Dunlea, J., Huffman, J. A., Onasch, T. B., Alfarra, M. R., Williams, P. I., Bower, K., Kondo, Y., Schneider, J., Drewnick, F., Borrmann, S., Weimer, S., Demerjian, K., Salcedo, D., Cottrell, L., Griffin, R., Takami, A., Miyoshi, T., Hatakeyama, S., Shimono, A., Sun, J. Y., Zhang, Y. M., Dzepina, K., Kimmel, J. R., Sueper, D., Jayne, J. T., Herndon, S. C., Trimborn, A. M., Williams, L. R., Wood, E. C., Middlebrook, A. M., Kolb, C. E., Baltensperger, U., and Worsnop, D. R.: Evolution of Organic Aerosols in the Atmosphere, Science, 326, 1525–1529, https://doi.org/10.1126/science.1180353, 2009.
Kroll, J. H. and Seinfeld, J. H.: Chemistry of secondary organic aerosol: Formation and evolution of low-volatility organics in the atmosphere, Atmos. Environ., 42, 3593–3624, https://doi.org/10.1016/j.atmosenv.2008.01.003, 2008.
Kruskal, W. H. and Wallis, W. A.: Use of Ranks in One-Criterion Variance Analysis, J. Am. Stat. Assoc., 47, 583–621, https://doi.org/10.2307/2280779, 1952.
Lanz, V. A., Alfarra, M. R., Baltensperger, U., Buchmann, B., Hueglin, C., and Prévôt, A. S. H.: Source apportionment of submicron organic aerosols at an urban site by factor analytical modelling of aerosol mass spectra, Atmos. Chem. Phys., 7, 1503–1522, https://doi.org/10.5194/acp-7-1503-2007, 2007.
Lanz, V. A., Prévôt, A. S. H., Alfarra, M. R., Weimer, S., Mohr, C., DeCarlo, P. F., Gianini, M. F. D., Hueglin, C., Schneider, J., Favez, O., D'Anna, B., George, C., and Baltensperger, U.: Characterization of aerosol chemical composition with aerosol mass spectrometry in Central Europe: an overview, Atmos. Chem. Phys., 10, 10453–10471, https://doi.org/10.5194/acp-10-10453-2010, 2010.
Leaitch, W. R., Macdonald, A. M., Brickell, P. C., Liggio, J., Sjostedt, S. J., Vlasenko, A., Bottenheim, J. W., Huang, L., Li, S.-M., Liu, P. S. K., Toom-Sauntry, D., Hayden, K. A., Sharma, S., Shantz, N. C., Wiebe, H. A., Zhang, W., Abbatt, J. P. D., Slowik, J. G., Chang, R. Y. W., Russell, L. M., Schwartz, R. E., Takahama, S., Jayne, J. T., and Ng, N. L.: Temperature response of the submicron organic aerosol from temperate forests, Atmos. Environ., 45, 6696–6704, https://doi.org/10.1016/j.atmosenv.2011.08.047, 2011.
Li, Y. J., Sun, Y., Zhang, Q., Li, X., Li, M., Zhou, Z., and Chan, C. K.: Real-time chemical characterization of atmospheric particulate matter in China: A review, Atmos. Environ., 158, 270–304, https://doi.org/10.1016/j.atmosenv.2017.02.027, 2017.
Lin, C., Huang, R.-J., Ceburnis, D., Buckley, P., Preissler, J., Wenger, J., Rinaldi, M., Facchini, M. C., O'Dowd, C., and Ovadnevaite, J.: Extreme air pollution from residential solid fuel burning, Nature Sustainability, 1, 512–517, https://doi.org/10.1038/s41893-018-0125-x, 2018.
Liu, P. S. K., Deng, R., Smith, K. A., Williams, L. R., Jayne, J. T., Canagaratna, M. R., Moore, K., Onasch, T. B., Worsnop, D. R., and Deshler, T.: Transmission Efficiency of an Aerodynamic Focusing Lens System: Comparison of Model Calculations and Laboratory Measurements for the Aerodyne Aerosol Mass Spectrometer, Aerosol Sci. Tech., 41, 721–733, https://doi.org/10.1080/02786820701422278, 2007.
Middlebrook, A. M., Bahreini, R., Jimenez, J. L., and Canagaratna, M. R.: Evaluation of Composition-Dependent Collection Efficiencies for the Aerodyne Aerosol Mass Spectrometer using Field Data, Aerosol Sci. Tech., 46, 258–271, https://doi.org/10.1080/02786826.2011.620041, 2012.
Mohr, C., DeCarlo, P. F., Heringa, M. F., Chirico, R., Slowik, J. G., Richter, R., Reche, C., Alastuey, A., Querol, X., Seco, R., Peñuelas, J., Jiménez, J. L., Crippa, M., Zimmermann, R., Baltensperger, U., and Prévôt, A. S. H.: Identification and quantification of organic aerosol from cooking and other sources in Barcelona using aerosol mass spectrometer data, Atmos. Chem. Phys., 12, 1649–1665, https://doi.org/10.5194/acp-12-1649-2012, 2012.
Mann, H. B.: Nonparametric Tests Against Trend, Econometrica, 13, 245–259, https://doi.org/10.2307/1907187, 1945.
Ng, N. L., Canagaratna, M. R., Zhang, Q., Jimenez, J. L., Tian, J., Ulbrich, I. M., Kroll, J. H., Docherty, K. S., Chhabra, P. S., Bahreini, R., Murphy, S. M., Seinfeld, J. H., Hildebrandt, L., Donahue, N. M., DeCarlo, P. F., Lanz, V. A., Prévôt, A. S. H., Dinar, E., Rudich, Y., and Worsnop, D. R.: Organic aerosol components observed in Northern Hemispheric datasets from Aerosol Mass Spectrometry, Atmos. Chem. Phys., 10, 4625–4641, https://doi.org/10.5194/acp-10-4625-2010, 2010.
Ng, N. L., Canagaratna, M. R., Jimenez, J. L., Chhabra, P. S., Seinfeld, J. H., and Worsnop, D. R.: Changes in organic aerosol composition with aging inferred from aerosol mass spectra, Atmos. Chem. Phys., 11, 6465–6474, https://doi.org/10.5194/acp-11-6465-2011, 2011a.
Ng, N. L., Herndon, S. C., Trimborn, A., Canagaratna, M. R., Croteau, P. L., Onasch, T. B., Sueper, D., Worsnop, D. R., Zhang, Q., Sun, Y. L., and Jayne, J. T.: An Aerosol Chemical Speciation Monitor (ACSM) for Routine Monitoring of the Composition and Mass Concentrations of Ambient Aerosol, Aerosol Sci. Tech., 45, 780–794, https://doi.org/10.1080/02786826.2011.560211, 2011b.
Nozière, B., Kalberer, M., Claeys, M., Allan, J., D'Anna, B., Decesari, S., Finessi, E., Glasius, M., Grgić, I., Hamilton, J. F., Hoffmann, T., Iinuma, Y., Jaoui, M., Kahnt, A., Kampf, C. J., Kourtchev, I., Maenhaut, W., Marsden, N., Saarikoski, S., Schnelle-Kreis, J., Surratt, J. D., Szidat, S., Szmigielski, R., and Wisthaler, A.: The Molecular Identification of Organic Compounds in the Atmosphere: State of the Art and Challenges, Chem. Rev., 115, 3919–3983, https://doi.org/10.1021/cr5003485, 2015.
Paatero, P.: The Multilinear Engine – A Table-Driven, Least Squares Program for Solving Multilinear Problems, Including the n-Way Parallel Factor Analysis Model, J. Comput. Graph. Stat., 8, 854–888, 10.1080/10618600.1999.10474853, 1999.
Paatero, P. and Tapper, U.: Positive matrix factorization: A non-negative factor model with optimal utilization of error estimates of data values, Environmetrics, 5, 111–126, https://doi.org/10.1002/env.3170050203, 1994.
Pandolfi, M., Alados-Arboledas, L., Alastuey, A., Andrade, M., Angelov, C., Artiñano, B., Backman, J., Baltensperger, U., Bonasoni, P., Bukowiecki, N., Collaud Coen, M., Conil, S., Coz, E., Crenn, V., Dudoitis, V., Ealo, M., Eleftheriadis, K., Favez, O., Fetfatzis, P., Fiebig, M., Flentje, H., Ginot, P., Gysel, M., Henzing, B., Hoffer, A., Holubova Smejkalova, A., Kalapov, I., Kalivitis, N., Kouvarakis, G., Kristensson, A., Kulmala, M., Lihavainen, H., Lunder, C., Luoma, K., Lyamani, H., Marinoni, A., Mihalopoulos, N., Moerman, M., Nicolas, J., O'Dowd, C., Petäjä, T., Petit, J.-E., Pichon, J. M., Prokopciuk, N., Putaud, J.-P., Rodríguez, S., Sciare, J., Sellegri, K., Swietlicki, E., Titos, G., Tuch, T., Tunved, P., Ulevicius, V., Vaishya, A., Vana, M., Virkkula, A., Vratolis, S., Weingartner, E., Wiedensohler, A., and Laj, P.: A European aerosol phenomenology – 6: scattering properties of atmospheric aerosol particles from 28 ACTRIS sites, Atmos. Chem. Phys., 18, 7877–7911, https://doi.org/10.5194/acp-18-7877-2018, 2018.
Petit, J.-E., Favez, O., Sciare, J., Canonaco, F., Croteau, P., Močnik, G., Jayne, J., Worsnop, D., and Leoz-Garziandia, E.: Submicron aerosol source apportionment of wintertime pollution in Paris, France by double positive matrix factorization (PMF2) using an aerosol chemical speciation monitor (ACSM) and a multi-wavelength Aethalometer, Atmos. Chem. Phys., 14, 13773–13787, https://doi.org/10.5194/acp-14-13773-2014, 2014.
Petit, J.-E., Favez, O., Sciare, J., Crenn, V., Sarda-Estève, R., Bonnaire, N., Močnik, G., Dupont, J.-C., Haeffelin, M., and Leoz-Garziandia, E.: Two years of near real-time chemical composition of submicron aerosols in the region of Paris using an Aerosol Chemical Speciation Monitor (ACSM) and a multi-wavelength Aethalometer, Atmos. Chem. Phys., 15, 2985–3005, https://doi.org/10.5194/acp-15-2985-2015, 2015.
Petit, J.-E., Favez, O., Albinet, A., and Canonaco, F.: A user-friendly tool for comprehensive evaluation of the geographical origins of atmospheric pollution: Wind and trajectory analyses, Environ. Modell. Softw., 88, 183–187, https://doi.org/10.1016/j.envsoft.2016.11.022, 2017.
Pohlert, T.: Non-Parametric Trend Tests and Change-Point Detection, R package, available at: https://cran.r-project.org/web/packages/trend/vignettes/trend.pdf (last access: 28 November 2019), 2018.
Polissar, A. V., Hopke, P. K., Paatero, P., Kaufmann, Y. J., Hall, D. K., Bodhaine, B. A., Dutton, E. G., and Harris, J. M.: The aerosol at Barrow, Alaska: long-term trends and source locations, Atmos. Environ., 33, 2441–2458, https://doi.org/10.1016/S1352-2310(98)00423-3, 1999.
Rattanavaraha, W., Canagaratna, M. R., Budisulistiorini, S. H., Croteau, P. L., Baumann, K., Canonaco, F., Prevot, A. S. H., Edgerton, E. S., Zhang, Z., Jayne, J. T., Worsnop, D. R., Gold, A., Shaw, S. L., and Surratt, J. D.: Source apportionment of submicron organic aerosol collected from Atlanta, Georgia, during 2014–2015 using the aerosol chemical speciation monitor (ACSM), Atmos. Environ., 167, 389–402, 2017.
Reyes-Villegas, E., Green, D. C., Priestman, M., Canonaco, F., Coe, H., Prévôt, A. S. H., and Allan, J. D.: Organic aerosol source apportionment in London 2013 with ME-2: exploring the solution space with annual and seasonal analysis, Atmos. Chem. Phys., 16, 15545–15559, https://doi.org/10.5194/acp-16-15545-2016, 2016.
Saleh, R., Robinson, E. S., Tkacik, D. S., Ahern, A. T., Liu, S., Aiken, A. C., Sullivan, R. C., Presto, A. A., Dubey, M. K., Yokelson, R. J., Donahue, N. M., and Robinson, A. L.: Brownness of organics in aerosols from biomass burning linked to their black carbon content, Nat. Geosci., 7, 647–650, https://doi.org/10.1038/ngeo2220, 2014.
Sandradewi, J., Prévôt, A. S. H., Szidat, S., Perron, N., Alfarra, M. R., Lanz, V. A., Weingartner, E., and Baltensperger, U.: Using Aerosol Light Absorption Measurements for the Quantitative Determination of Wood Burning and Traffic Emission Contributions to Particulate Matter, Environ. Sci. Technol., 42, 3316–3323, https://doi.org/10.1021/es702253m, 2008.
Schlag, P., Kiendler-Scharr, A., Blom, M. J., Canonaco, F., Henzing, J. S., Moerman, M., Prévôt, A. S. H., and Holzinger, R.: Aerosol source apportionment from 1-year measurements at the CESAR tower in Cabauw, the Netherlands, Atmos. Chem. Phys., 16, 8831–8847, https://doi.org/10.5194/acp-16-8831-2016, 2016.
Schurgers, G., Arneth, A., Holzinger, R., and Goldstein, A. H.: Process-based modelling of biogenic monoterpene emissions combining production and release from storage, Atmos. Chem. Phys., 9, 3409–3423, https://doi.org/10.5194/acp-9-3409-2009, 2009.
Sciare, J., d'Argouges, O., Zhang, Q. J., Sarda-Estève, R., Gaimoz, C., Gros, V., Beekmann, M., and Sanchez, O.: Comparison between simulated and observed chemical composition of fine aerosols in Paris (France) during springtime: contribution of regional versus continental emissions, Atmos. Chem. Phys., 10, 11987–12004, https://doi.org/10.5194/acp-10-11987-2010, 2010.
Sciare, J., d'Argouges, O., Sarda-Estève, R., Gaimoz, C., Dolgorouky, C., Bonnaire, N., Favez, O., Bonsang, B., and Gros, V.: Large contribution of water-insoluble secondary organic aerosols in the region of Paris (France) during wintertime, J. Geophys. Res.-Atmos., 116, D22203, https://doi.org/10.1029/2011JD015756, 2011.
Sen, P. K.: Estimates of the Regression Coefficient Based on Kendall's Tau, J. Am. Stat. Assoc., 63, 1379–1389, doc:10.2307/2285891, 1968.
Shapiro, S. S. and Wilk, M. B.: An Analysis of Variance Test for Normality (Complete Samples), Biometrika, 52, 591–611, https://doi.org/10.2307/2333709, 1965.
Shrivastava, M., Cappa, C. D., Fan, J., Goldstein, A. H., Guenther, A. B., Jimenez, J. L., Kuang, C., Laskin, A., Martin, S. T., Ng, N. L., Petaja, T., Pierce, J. R., Rasch, P. J., Roldin, P., Seinfeld, J. H., Shilling, J., Smith, J. N., Thornton, J. A., Volkamer, R., Wang, J., Worsnop, D. R., Zaveri, R. A., Zelenyuk, A., and Zhang, Q.: Recent advances in understanding secondary organic aerosol: Implications for global climate forcing, Rev. Geophys., 55, 509–559, https://doi.org/10.1002/2016RG000540, 2017.
Srivastava, D., Favez, O., Perraudin, E., Villenave, E., and Albinet, A.: Comparison of Measurement-Based Methodologies to Apportion Secondary Organic Carbon (SOC) in PM2.5: A Review of Recent Studies, Atmosphere, 9, 452, https://doi.org/10.3390/atmos9110452, 2018a.
Srivastava, D., Favez, O., Bonnaire, N., Lucarelli, F., Haeffelin, M., Perraudin, E., Gros, V., Villenave, E., and Albinet, A.: Speciation of organic fractions does matter for aerosol source apportionment. Part 2: Intensive short-term campaign in the Paris area (France), Sci. Total Environ., 634, 267–278, https://doi.org/10.1016/j.scitotenv.2018.03.296, 2018b.
Srivastava, D., Daellenbach, K. R., Zhang, Y., Bonnaire, N., Chazeau, B., Perraudin, E., Gros, V., Villenave, E., Prévôt, A. S. H., El Haddad, I., Favez, O., and Albinet, A.: Comparison of different methodologies to discriminate between primary and secondary organic aerosols, Sci. Total Environ., 690, 944–955, 2019.
Stavroulas, I., Bougiatioti, A., Grivas, G., Paraskevopoulou, D., Tsagkaraki, M., Zarmpas, P., Liakakou, E., Gerasopoulos, E., and Mihalopoulos, N.: Sources and processes that control the submicron organic aerosol composition in an urban Mediterranean environment (Athens): a high temporal-resolution chemical composition measurement study, Atmos. Chem. Phys., 19, 901–919, https://doi.org/10.5194/acp-19-901-2019, 2019.
Stein, A. F., Draxler, R. R., Rolph, G. D., Stunder, B. J. B., Cohen, M. D., and Ngan, F.: NOAA's HYSPLIT atmospheric transport and dispersion modeling System, B. Am. Meteorol. Soc., 96, 2059e2077, https://doi.org/10.1175/BAMS-D-14-00110.1, 2015.
Sun, Y., Wang, Z., Dong, H., Yang, T., Li, J., Pan, X., Chen, P., and Jayne, J. T.: Characterization of summer organic and inorganic aerosols in Beijing, China with an Aerosol Chemical Speciation Monitor, Atmos. Environ., 51, 250–259, https://doi.org/10.1016/j.atmosenv.2012.01.013, 2012.
Sun, Y., Xu, W., Zhang, Q., Jiang, Q., Canonaco, F., Prévôt, A. S. H., Fu, P., Li, J., Jayne, J., Worsnop, D. R., and Wang, Z.: Source apportionment of organic aerosol from 2-year highly time-resolved measurements by an aerosol chemical speciation monitor in Beijing, China, Atmos. Chem. Phys., 18, 8469–8489, https://doi.org/10.5194/acp-18-8469-2018, 2018.
Sun, Y.-L., Zhang, Q., Schwab, J. J., Demerjian, K. L., Chen, W.-N., Bae, M.-S., Hung, H.-M., Hogrefe, O., Frank, B., Rattigan, O. V., and Lin, Y.-C.: Characterization of the sources and processes of organic and inorganic aerosols in New York city with a high-resolution time-of-flight aerosol mass apectrometer, Atmos. Chem. Phys., 11, 1581–1602, https://doi.org/10.5194/acp-11-1581-2011, 2011.
Tiitta, P., Leskinen, A., Hao, L., Yli-Pirilä, P., Kortelainen, M., Grigonyte, J., Tissari, J., Lamberg, H., Hartikainen, A., Kuuspalo, K., Kortelainen, A.-M., Virtanen, A., Lehtinen, K. E. J., Komppula, M., Pieber, S., Prévôt, A. S. H., Onasch, T. B., Worsnop, D. R., Czech, H., Zimmermann, R., Jokiniemi, J., and Sippula, O.: Transformation of logwood combustion emissions in a smog chamber: formation of secondary organic aerosol and changes in the primary organic aerosol upon daytime and nighttime aging, Atmos. Chem. Phys., 16, 13251–13269, https://doi.org/10.5194/acp-16-13251-2016, 2016.
Ulbrich, I. M., Canagaratna, M. R., Zhang, Q., Worsnop, D. R., and Jimenez, J. L.: Interpretation of organic components from Positive Matrix Factorization of aerosol mass spectrometric data, Atmos. Chem. Phys., 9, 2891–2918, https://doi.org/10.5194/acp-9-2891-2009, 2009.
Waked, A., Favez, O., Alleman, L. Y., Piot, C., Petit, J.-E., Delaunay, T., Verlinden, E., Golly, B., Besombes, J.-L., Jaffrezo, J.-L., and Leoz-Garziandia, E.: Source apportionment of PM10 in a north-western Europe regional urban background site (Lens, France) using positive matrix factorization and including primary biogenic emissions, Atmos. Chem. Phys., 14, 3325–3346, https://doi.org/10.5194/acp-14-3325-2014, 2014.
Xu, L., Guo, H., Boyd, C. M., Klein, M., Bougiatioti, A., Cerully, K. M., Hite, J. R., Isaacman-VanWertz, G., Kreisberg, N. M., Knote, C., Olson, K., Koss, A., Goldstein, A. H., Hering, S. V., de Gouw, J., Baumann, K., Lee, S.-H., Nenes, A., Weber, R. J., and Ng, N. L.: Effects of anthropogenic emissions on aerosol formation from isoprene and monoterpenes in the southeastern United States, P. Natl. Acad. Sci. USA, 112, 37–42, 10.1073/pnas.1417609112, 2015.
Xu, W., Han, T., Du, W., Wang, Q., Chen, C., Zhao, J., Zhang, Y., Li, J., Fu, P., Wang, Z., Worsnop, D. R., and Sun, Y.: Effects of Aqueous-Phase and Photochemical Processing on Secondary Organic Aerosol Formation and Evolution in Beijing, China, Environ. Sci. Technol., 51, 762–770, https://doi.org/10.1021/acs.est.6b04498, 2017.
Zanatta, M., Gysel, M., Bukowiecki, N., Müller, T., Weingartner, E., Areskoug, H., Fiebig, M., Yttri, K. E., Mihalopoulos, N., Kouvarakis, G., Beddows, D., Harrison, R. M., Cavalli, F., Putaud, J. P., Spindler, G., Wiedensohler, A., Alastuey, A., Pandolfi, M., Sellegri, K., Swietlicki, E., Jaffrezo, J. L., Baltensperger, U., and Laj, P.: A European aerosol phenomenology-5: Climatology of black carbon optical properties at 9 regional background sites across Europe, Atmos. Environ., 145, 346–364, https://doi.org/10.1016/j.atmosenv.2016.09.035, 2016.
Zhang, Q., Jimenez, J. L., Canagaratna, M. R., Allan, J. D., Coe, H., Ulbrich, I., Alfarra, M. R., Takami, A., Middlebrook, A. M., Sun, Y. L., Dzepina, K., Dunlea, E., Docherty, K., DeCarlo, P. F., Salcedo, D., Onasch, T., Jayne, J. T., Miyoshi, T., Shimono, A., Hatakeyama, S., Takegawa, N., Kondo, Y., Schneider, J., Drewnick, F., Borrmann, S., Weimer, S., Demerjian, K., Williams, P., Bower, K., Bahreini, R., Cottrell, L., Griffin, R. J., Rautiainen, J., Sun, J. Y., Zhang, Y. M., and Worsnop, D. R.: Ubiquity and dominance of oxygenated species in organic aerosols in anthropogenically-influenced Northern Hemisphere midlatitudes, Geophys. Res. Lett., 34, L13801, https://doi.org/10.1029/2007GL029979, 2007.
Zhang, Q., Jimenez, J. L., Canagaratna, M. R., Ulbrich, I. M., Ng, N. L., Worsnop, D. R., and Sun, Y.: Understanding atmospheric organic aerosols via factor analysis of aerosol mass spectrometry: a review, Anal. Bioanal. Chem., 401, 3045–3067, https://doi.org/10.1007/s00216-011-5355-y, 2011.
Zhang, Y., Tang, L., Sun, Y., Favez, O., Canonaco, F., Albinet, A., Couvidat, F., Liu, D., Jayne, J. T., Wang, Z., Croteau, P. L., Canagaratna, M. R., Zhou, H., Prévôt, A. S. H., and Worsnop, D. R.: Limited formation of isoprene epoxydiols–derived secondary organic aerosol (IEPOX-SOA) under NOx-rich environments in Eastern China, Geophys. Res. Lett., 2016, GL072368, https://doi.org/10.1002/2016GL072368, 2017.
Zhang, Y., Favez, O., Canonaco, F., Liu, D., Mocnik, G., Amodeo, T., Sciare, J., Prévôt, A. S. H., Gros, V., and Albinet, A.: Evidence of major secondary organic aerosol contribution to lensing effect black carbon absorption enhancement, npj Climate and Atmospheric Science, 1, 47, https://doi.org/10.1038/s41612-018-0056-2, 2018.
Zhang, Y. J., Tang, L. L., Wang, Z., Yu, H. X., Sun, Y. L., Liu, D., Qin, W., Canonaco, F., Prévôt, A. S. H., Zhang, H. L., and Zhou, H. C.: Insights into characteristics, sources, and evolution of submicron aerosols during harvest seasons in the Yangtze River delta region, China, Atmos. Chem. Phys., 15, 1331–1349, https://doi.org/10.5194/acp-15-1331-2015, 2015.
Zhou, S., Collier, S., Jaffe, D. A., Briggs, N. L., Hee, J., Sedlacek III, A. J., Kleinman, L., Onasch, T. B., and Zhang, Q.: Regional influence of wildfires on aerosol chemistry in the western US and insights into atmospheric aging of biomass burning organic aerosol, Atmos. Chem. Phys., 17, 2477–2493, https://doi.org/10.5194/acp-17-2477-2017, 2017.
Zotter, P., Herich, H., Gysel, M., El-Haddad, I., Zhang, Y., Močnik, G., Hüglin, C., Baltensperger, U., Szidat, S., and Prévôt, A. S. H.: Evaluation of the absorption Ångström exponents for traffic and wood burning in the Aethalometer-based source apportionment using radiocarbon measurements of ambient aerosol, Atmos. Chem. Phys., 17, 4229–4249, https://doi.org/10.5194/acp-17-4229-2017, 2017.