the Creative Commons Attribution 4.0 License.
the Creative Commons Attribution 4.0 License.
 | 04 Apr 2018
Measurements of aerosol and CCN properties in the Mackenzie River delta (Canadian Arctic) during spring–summer transition in May 2014
Paul Herenz
Heike Wex
Silvia Henning
Thomas Bjerring Kristensen
Florian Rubach
Anja Roth
Stephan Borrmann
Heiko Bozem
Hannes Schulz
Frank Stratmann
Within the framework of the RACEPAC (Radiation–Aerosol–Cloud Experiment in the Arctic Circle) project, the Arctic aerosol, arriving at a ground-based station in Tuktoyaktuk (Mackenzie River delta area, Canada), was characterized during a period of 3 weeks in May 2014. Basic meteorological parameters and particle number size distributions (PNSDs) were observed and two distinct types of air masses were found. One type were typical Arctic haze air masses, termed accumulation-type air masses, characterized by a monomodal PNSD with a pronounced accumulation mode at sizes above 100 nm. These air masses were observed during a period when back trajectories indicate an air mass origin in the north-east of Canada. The other air mass type is characterized by a bimodal PNSD with a clear minimum around 90 nm and with an Aitken mode consisting of freshly formed aerosol particles. Back trajectories indicate that these air masses, termed Aitken-type air masses, originated from the North Pacific. In addition, the application of the PSCF receptor model shows that air masses with their origin in active fire areas in central Canada and Siberia, in areas of industrial anthropogenic pollution (Norilsk and Prudhoe Bay Oil Field) and the north-west Pacific have enhanced total particle number concentrations (NCN). Generally, NCN ranged from 20 to 500 cm−3, while cloud condensation nuclei (CCN) number concentrations were found to cover a range from less than 10 up to 250 cm−3 for a supersaturation (SS) between 0.1 and 0.7 %. The hygroscopicity parameter κ of the CCN was determined to be 0.23 on average and variations in κ were largely attributed to measurement uncertainties.
Furthermore, simultaneous PNSD measurements at the ground station and on the Polar 6 research aircraft were performed. We found a good agreement of ground-based PNSDs with those measured between 200 and 1200 m. During two of the four overflights, particle number concentrations at 3000 m were found to be up to 20 times higher than those measured below 2000 m; for one of these two flights, PNSDs measured above 2000 m showed a different shape than those measured at lower altitudes. This is indicative of long-range transport from lower latitudes into the Arctic that can advect aerosol from different regions in different heights.


The Arctic region is particularly sensitive to climate forcing and reacts with amplifying feedbacks (e.g. the albedo–sea ice feedback) (Law and Stohl, 2007). Aerosol particles have the ability to modify these feedbacks in different ways. Black carbon depositions on ice surfaces can significantly change the surface albedo, supporting the uptake of heat due to absorption (Keegan et al., 2014). However, a change in the amount of available aerosol particles can also modify cloud properties and indirectly change the energy budget. Twomey (1974) found that an increased number concentration of cloud condensation nuclei (CCN) leads to smaller but more numerous cloud droplets if the same amount of water vapour is available for cloud formation. This can change the interaction with incoming shortwave radiation, increasing cloud reflectivity and therefore cooling. This effect might be of limited relevance in the Arctic since its surface is highly reflective due to snow and ice (Tietze et al., 2011). However, a higher droplet number concentration would also lead to increased cloud longwave emissivity, which warms the Earth's surface (Garrett et al., 2002; Lubin and Vogelmann, 2006). Since low-altitude clouds tend to be warmer than the Arctic surface, the Arctic is potentiality sensitive to this effect (Garrett et al., 2002). A shift of the droplet size distribution to smaller sizes can also affect cloud lifetime due to a possible later onset of precipitation (Albrecht, 1989). Hence the resulting issues that were the focus of Arctic aerosol studies in the last few years are the characterization of particle sources, their chemical and physical properties as well as the direct and indirect impacts of Arctic aerosol particles and pollutants on cloud-forming properties (Jacob et al., 2010).
It is well known that the origin of Arctic air masses is dependent on the season. Connected to that, there are recurring yearly cycles of both particle number concentrations (NCN) and particle number size distributions (PNSDs). Tunved et al. (2013) describe these cycles based on measurements taken for the years 2000 to 2010 at Mt. Zeppelin on Svalbard. In winter and spring the Arctic aerosol in general is dominated by long-range transport of mid-latitude air masses. The polar front is located further south in areas of high anthropogenic pollution so that anthropogenic industrial emissions reach the Arctic atmosphere (Iversen and Joranger, 1985). Also, biomass burning in Russia contributes to the high aerosol particle loading during winter and spring (Warneke et al., 2009). During polar night, the Arctic atmosphere is extremely stable, which prevents turbulent mixing between vertical layers and with that also cloud formation and precipitation (Shaw, 1981). Hence the so-called Arctic haze can be trapped for 15 to 30 days (Shaw, 1981, 1995). The major part of the Arctic haze consists of particulate organic matter (POM) and sulfate but also contains ammonium, nitrate, mineral dust, black carbon and heavy metals (Quinn et al., 2002). Reported PNSDs show an accumulation mode with NCN constantly increasing during the winter months from October until April from below 50 to above 200 cm−3 (Tunved et al., 2013).
During the transition from spring to summer an increased vertical mixing causes the presence of low-level clouds, and the related wet removal stops the Arctic haze period (Tunved et al., 2013), making the well-aged (Heintzenberg, 1980) Arctic haze particles of the accumulation mode disappear (Engvall et al., 2008; Tunved et al., 2013). Indeed, these precipitation-related scavenging processes, which are effective from late spring throughout the summer, were shown to be among the drivers of the yearly cycle in Arctic PNSDs (Browse et al., 2012; Croft et al., 2016a). Resulting low number concentrations of particles in the accumulation-mode size range enable new particle formation (NPF). The latter is also based on the presence of MSA (methanesulfonic acid), an oxidation product of DMS (dimethyl sulfide) that is emitted due to biological activity in the oceans (Quinn et al., 2007; Leaitch et al., 2013), with increasing emissions related to the decline of the Arctic sea ice cover (Sharma et al., 2012). Additionally, ammonia, also a contributor to NPF, was described to be connected to seabird colonies by Croft et al. (2016b) and Wentworth et al. (2016) and was discussed to have a far-ranging influence on the Arctic aerosol. In general, during the Arctic summer locally and freshly produced aerosol particle species are dominant, driven by an increase in both biological activity and photochemistry (Ström et al., 2009) and showing up as a pronounced Aitken mode in PNSDs in summer month, particularly in July and August (Tunved et al., 2013).
Consequently, the Arctic aerosol particle number size distribution and the particle number concentrations show a large seasonal variability (Tunved et al., 2013). Moreover, the sources and sinks for Arctic aerosol particles are subject to the fast changes in the Arctic that currently take place. Dall'Osto et al. (2017a), for instance, found a negative correlation between the Arctic sea ice extent and NPF events that were observed at Mt. Zeppelin (Svalbard). From this connection follows an increased new particle production due to the current decrease in the sea ice pack extent (Dall'Osto et al., 2017a).
Croft et al. (2016a) reported data collected in the years 2011 to 2013 from Mt. Zeppelin, i.e. examining different years than Tunved et al. (2013), together with additional data from Alert, Canada. Both yearly cycles of NCN and PNSDs were similar at Alert and Mt. Zeppelin and also similar to those discussed in Tunved et al. (2013). Croft et al. (2016a) suggest that the observed similarities at these two stations, which are 1000 km apart, and between the different years examined at Mt. Zeppelin indicate the existence of an annual cycle that spans the high Arctic. This assumption is corroborated by Nguyen et al. (2016), who reported comparable yearly cycles of number concentrations and PNSDs from the Villum Research Station in northern Greenland, only differing in more pronounced Aitken modes in the summer months. The shape of the yearly cycle of NCN and the most often occurring PNSDs observed in Tiksi, Russia, described in Asmi et al. (2016), were again similar to those observed at Mt. Zeppelin and Alert. However, number concentrations were higher in general in Tiksi, and NPF events occurred more readily, which is suggested to be related to regional continental sources of nucleating and condensing vapours. Generally, a comparison of PNSDs presented in Freud et al. (2017) from Alert, Villum Research Station, Mt. Zeppelin, Tiksi and Barrow (Alaska) shows some differences between Arctic sites due to local effects, but indicates that on a large scale there is a pronounced annual cycle in PNSDs with common features, with all Arctic sites sharing the Asian continent as the main large-scale source region of accumulation-mode aerosols.
Similarly, also the Arctic CCN number concentrations vary, with values between less than 100 cm−3 (pristine Arctic background), occasionally less than 1 cm−3 (Mauritsen et al., 2011) and up to 1000 cm−3 (in Arctic haze layers; Moore et al., 2011, and references therein). In the previously mentioned study by Dall'Osto et al. (2017a) it is also shown that the NPF events and the growth of these aerosol particles to a larger size can affect the CCN number concentration. Dall'Osto et al. (2017a) found an increase of the CCN number concentration (measured at a super saturation of 0.4 %) of 21 %, which is linked to NPF events. Within the NETCARE project based on summertime measurements in the Canadian Arctic Archipelago, high concentrations of newly formed particles were observed, particularly in the marine boundary layer and above clouds (Burkart et al., 2017a). One particle growth event measured during NETCARE was described in Willis et al. (2016), showing newly formed particles growing to sizes above 50 nm, subsequently being able to activate to cloud droplets at 0.6 % supersaturation (SS). For the same project, Leaitch et al. (2016) examined cloud droplet number concentrations for 62 cloud samples and reported that particles with comparably small diameters, below 50 nm, activated to cloud droplets in 40 % of all cases.
Besides the fact that aerosol particles need to have a certain size to act as CCN, also the aerosol particle chemistry matters in terms of the activation to a cloud droplet. The single hygroscopicity parameter κ (Petters and Kreidenweis, 2007) is commonly used to express the affinity of aerosol particles to water and characterizes their CCN activity. The hygroscopicity of the Arctic aerosol particulate matter (PM) was also found to show a seasonality. κ values determined from CCN measurements done on water-soluble PM collected in Spitsbergen by Silvergren et al. (2014) were between 0.3 and 0.7, with a minimum from March to May and a maximum in October. The past and future changes in the Arctic climate may cause changes of CCN number concentrations and their properties and consequently also to the sources and sinks of Arctic CCN. Hence there is a need for measurements in the Arctic region to quantify the condensation nuclei (CN) and CCN number concentrations, their sources and sinks as well as the aerosol particle hygroscopicity.
The data set presented in this study was recorded during the RACEPAC (Radiation–Aerosol–Cloud Experiment in the Arctic Circle) project, which took place in Inuvik (Canada) during April and May 2014. It was mostly an airborne campaign that aimed to measure all components required to describe the interaction of aerosol particles, clouds and radiation in the Arctic. In this framework an additional ground-based station in Tuktoyaktuk (≈ 130 km north of Inuvik) was installed and operated by the Max Planck Institute for Chemistry (MPI-C) to measure Arctic CCN and aerosol properties. The data set presented here contains concentrations of CN and CCN, PNSDs and inferred particle hygroscopicity values (κ) measured at the station in Tuktoyaktuk. Furthermore, a comparison of PNSDs measured at the ground-based station and on the research airplane Polar 6, operated by the Alfred Wegener Institute for Polar and Marine Research (AWI, Germany), is presented.
2.1 Measurement setup and data processing
The experimental setup used for this study is shown in Fig. 1. An aerosol inlet with a PM10 sampling head was installed on top of a measurement container at a height of 3.5 m a.g.l. Along a vertical tube (inner diameter of 2.5 cm) the aerosol was transported into the measurement container. Downstream horizontal tubes (inner diameter of 1 and 0.53 cm) distributed the aerosol to the instruments.
The total aerosol particle number concentration (NCN) was measured by a condensation particle counter (CPC, TSI model 3010) which was operated at a total flow rate of 1 L min−1. The CPC counts single aerosol particles between 10 nm (50 % of particles at this size are detected) and 3 µm. In parallel, the PNSD was measured by means of a scanning mobility particle sizer (SMPS, TSI model 3936 with CPC model 3025). The SMPS scanned aerosol particle mobility diameters from 13.6 to 736.5 nm with a time resolution of 5 min. Upstream of the SMPS an impactor with 1 µm cutoff diameter was installed and prior to the CPC and the SMPS the aerosol was dried using a diffusion dryer with silica gel. The airborne measurements of PNSDs on board the Polar 6 research aircraft were conducted by means of an Ultra-High Sensitivity Aerosol Spectrometer (UHSAS) that measured in a size range from 70 to 1 µm.
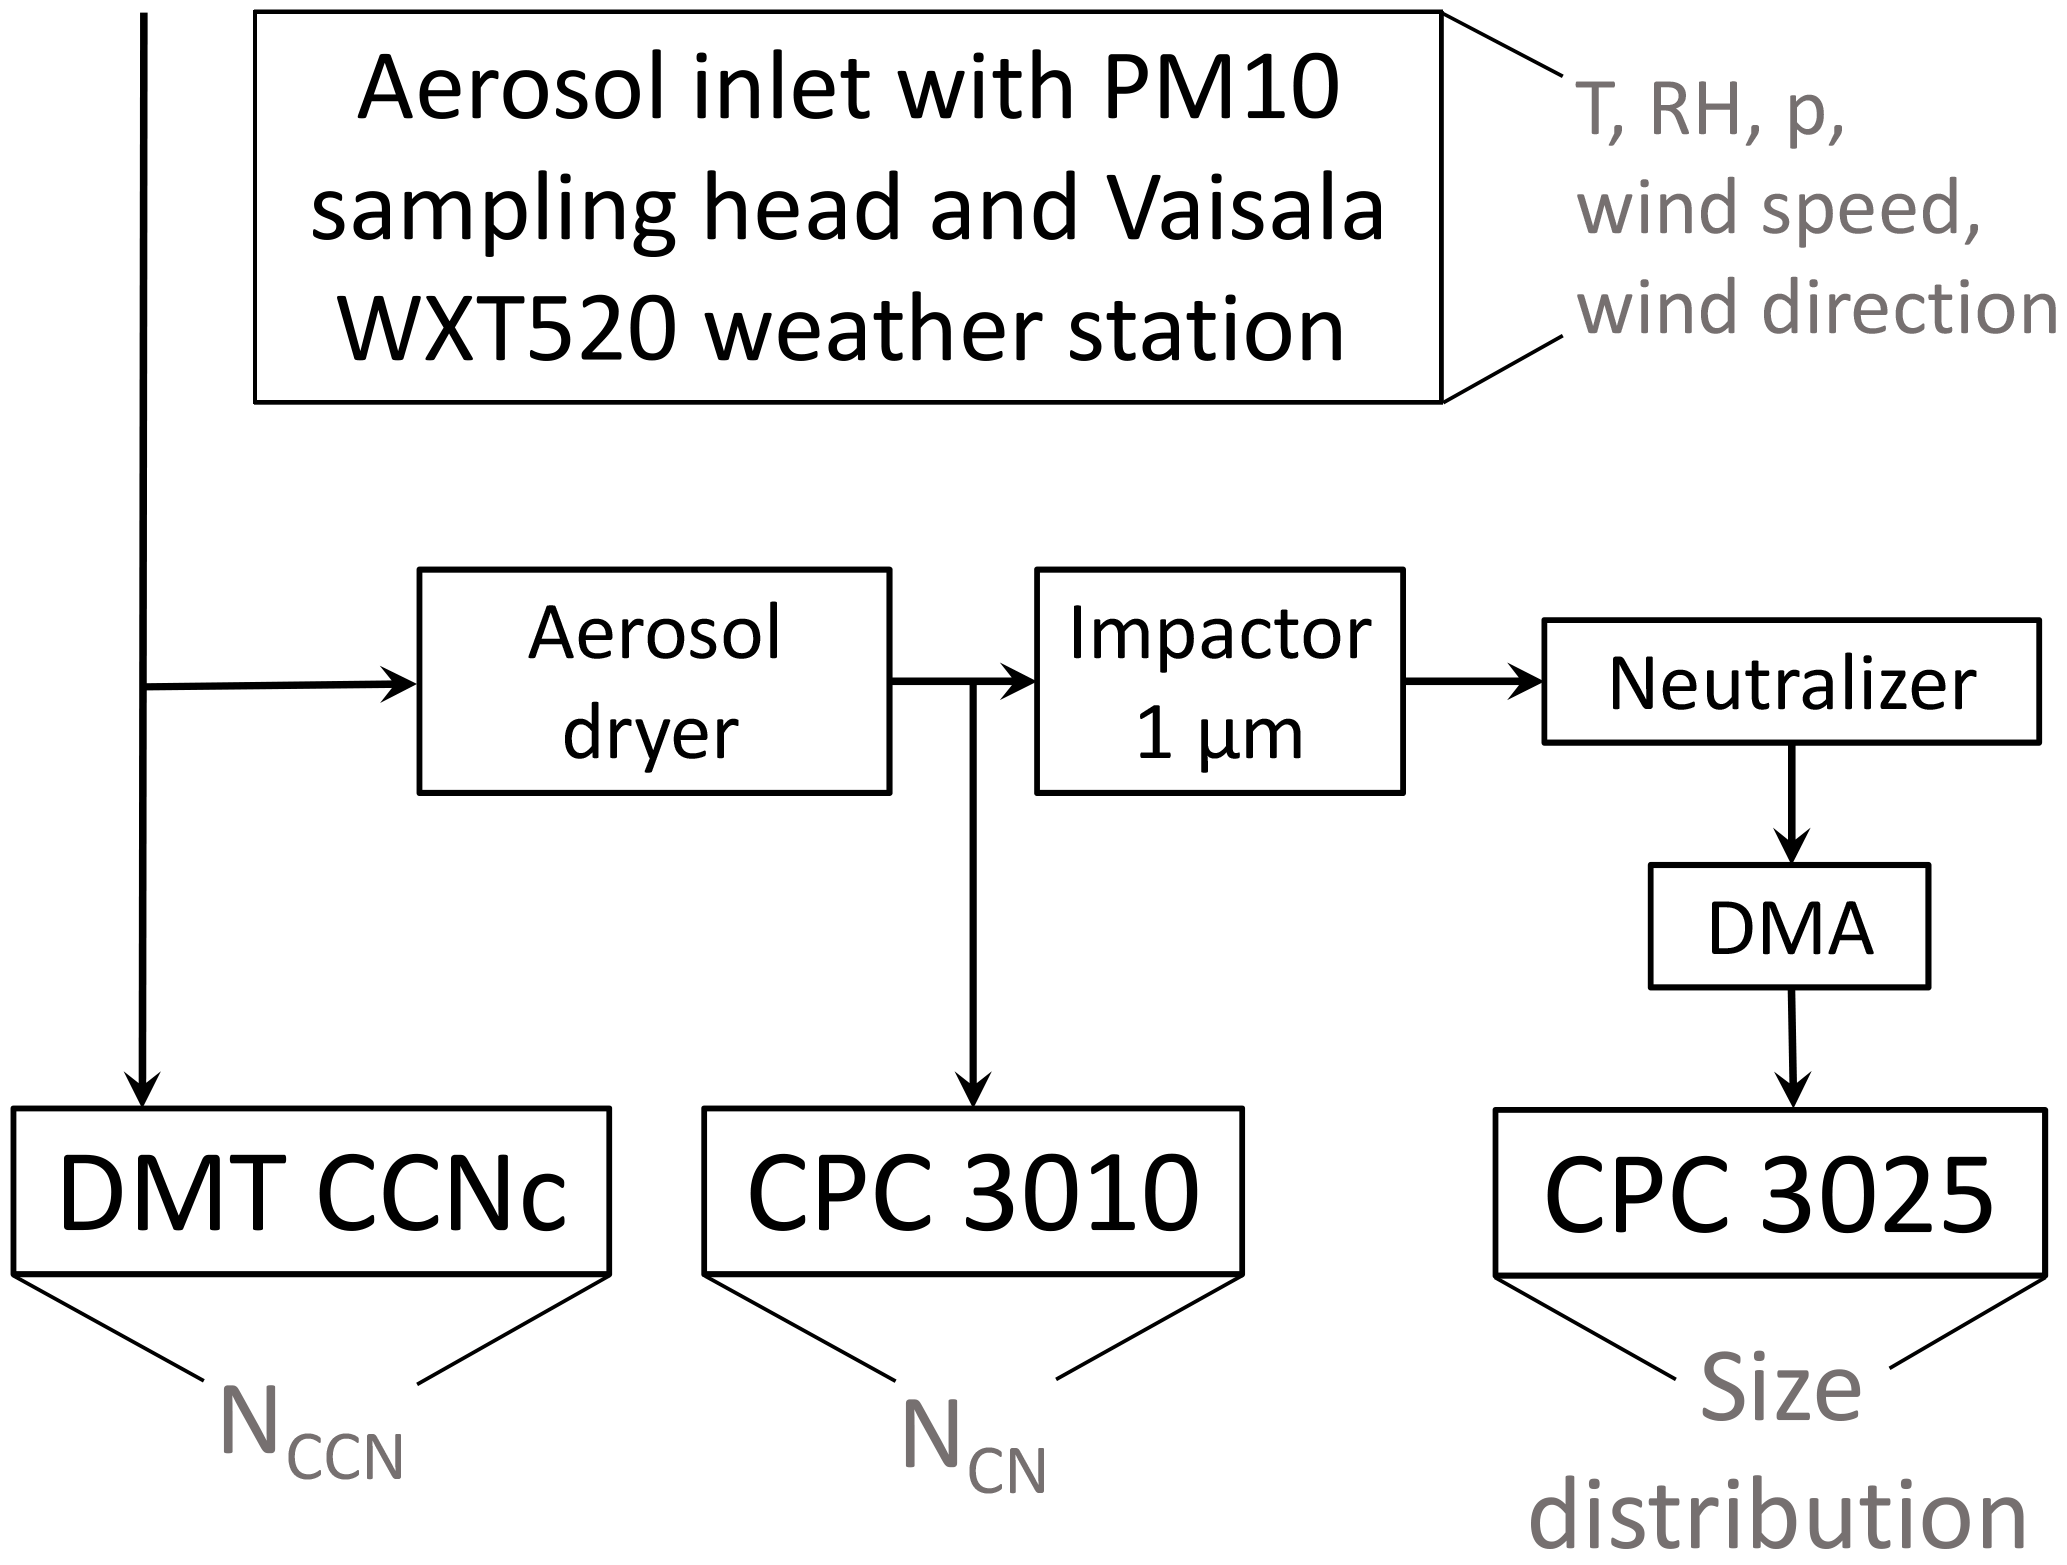
Figure 1Schematic depiction of the measuring setup implemented in the Tuktoyaktuk ground-based (container) station.
The number concentration of cloud condensation nuclei (NCCN) was measured using a cloud condensation nuclei counter (CCNc, Droplet Measurement Technologies (DMT), Boulder, USA). The CCNc is a continuous-flow thermal-gradient diffusion chamber which is described in detail in Roberts and Nenes (2005). The CCNc was operated as recommended by Gysel and Stratmann (2013) for polydisperse CCN measurements. By stepping the temperature gradient every 12 min the SS was varied between 0.1, 0.2, 0.3, 0.5 and 0.7 % at a constant total flow rate of 0.5 L min−1. For consistency checks between NCN and NCCN 1 % SS was also applied. To ensure stable column temperatures, the first 5 min and the last 30 s at each SS setting were excluded from the data analysis. The remaining data points were averaged. A SS calibration of the CCNc had been done at the cloud laboratory of the Leibniz Institute for Tropospheric Research (TROPOS) prior to the campaign to determine the relationship between the temperature gradient along the column and the effective SS. Based on recommendations given in Gysel and Stratmann (2013) and Rose et al. (2008), ammonium sulfate particles were size selected using a differential mobility analyzer (DMA-type Hauke medium) and then fed into a CPC (TSI model 3010) and CCNc, which were operated in parallel. This was done for all SS values that were also applied during the measurement campaign. A size-dependent activated fraction was obtained by dividing NCCN obtained at different sizes by the respective NCN. By fitting the resulting curve using a sigmoid function, the critical diameter dcrit (where 50 % of all singly charged particles are activated) was determined. Applying the Köhler theory (Köhler, 1936), these dcrit were used to determine the effective SS based on the theoretical activation diameter of ammonium sulfate particles. The resulting effective SS values for this study are 0.11, 0.21, 0.31, 0.51 and 0.70 %, respectively. These calibrated values were used for further calculations, while the values reported from here on in the text are rounded values.
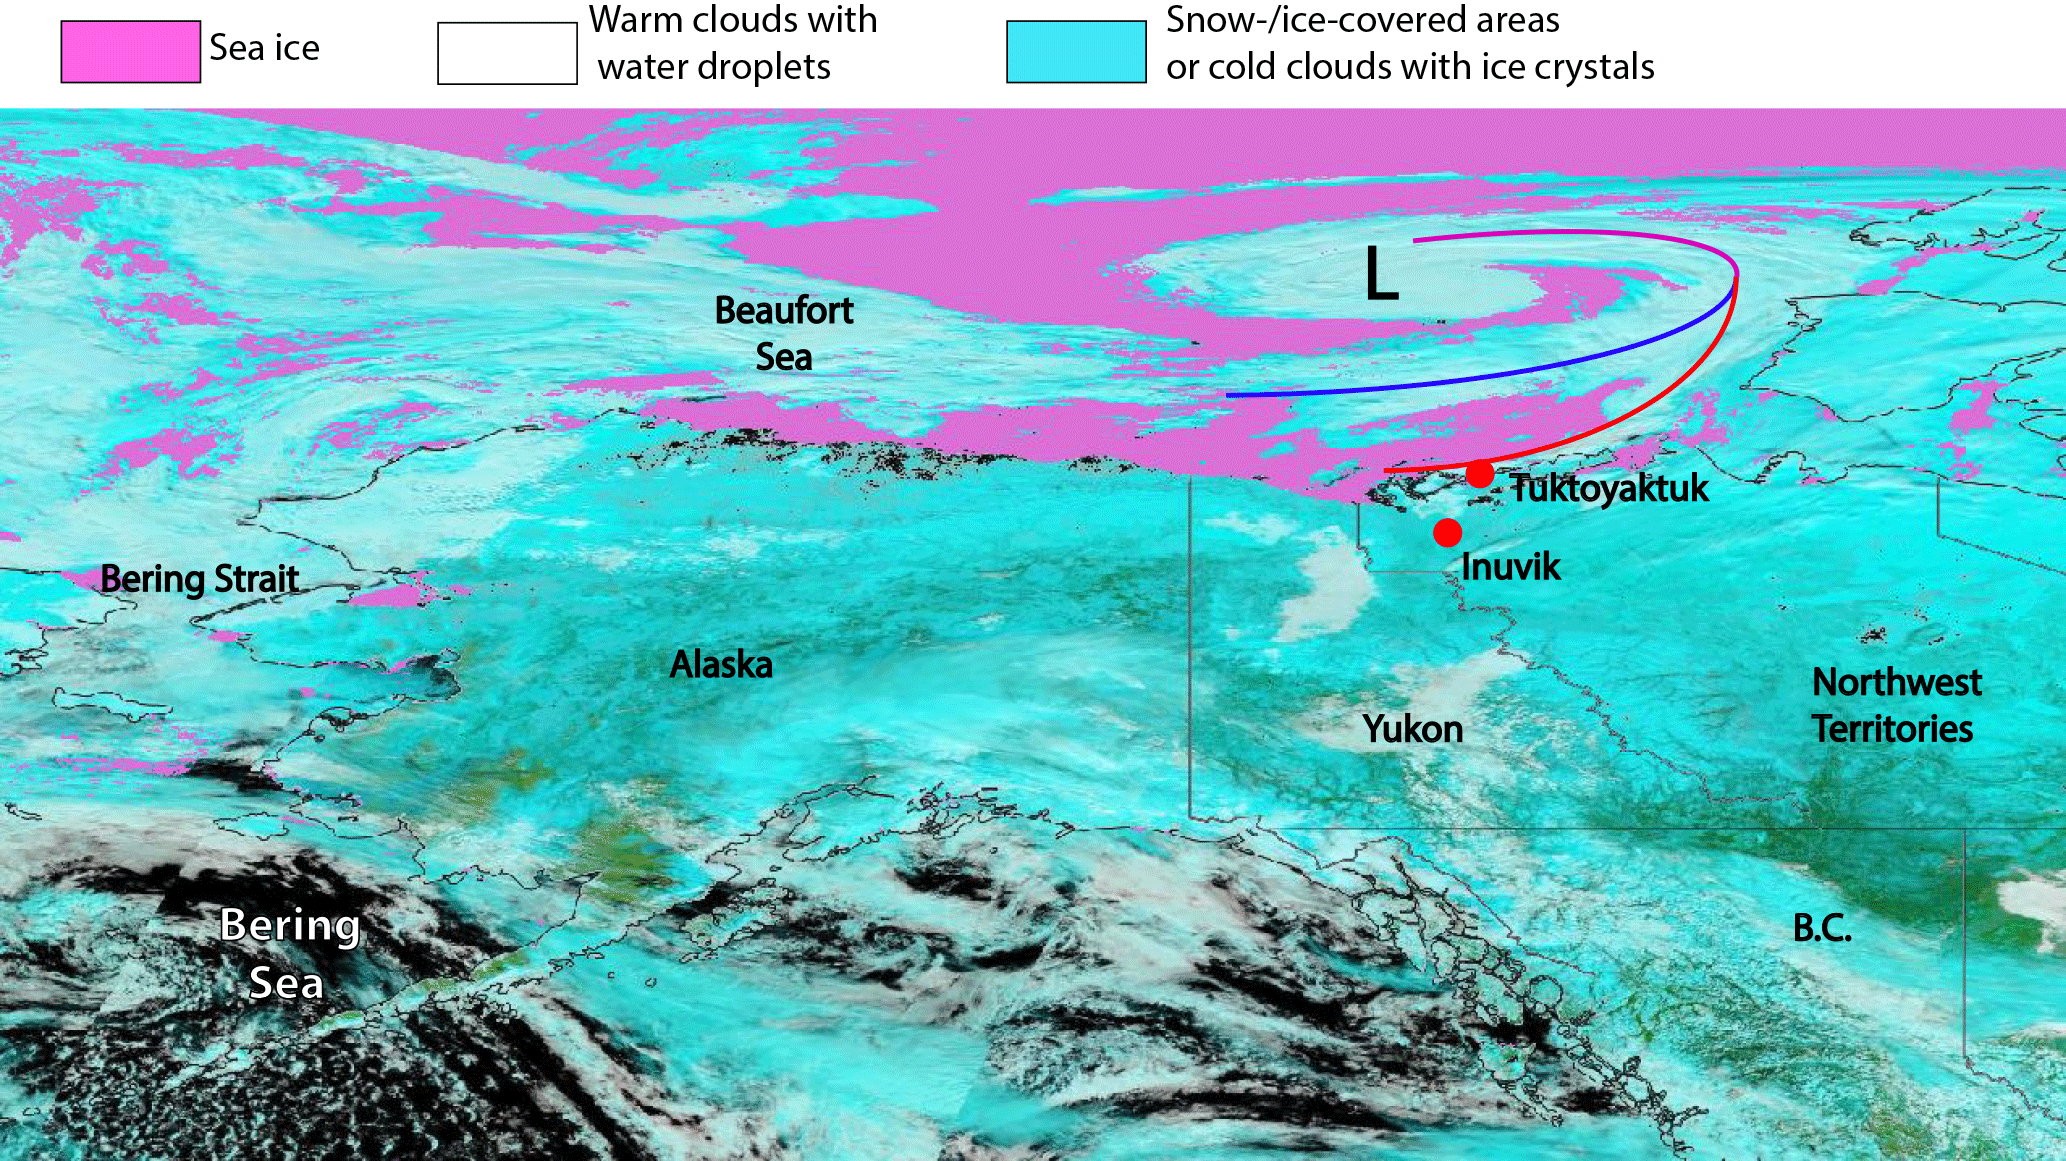
Figure 2Map of Alaska and the north-western part of Canada showing the position of Tuktoyaktuk and Inuvik together with two additional layers of the MODIS instrument (installed on TERRA, NASA). The sea ice extent layer shows the frozen ocean surface in pink. The corrected reflectance (bands 7, 2, 1) layer shows liquid water in dark blue or black. Ice on the surface or in the form of ice crystals in cold clouds will appear turquoise whereas small water droplets in warm clouds will appear white. A low-pressure system, which was relevant for the measurements in Tuktoyaktuk, and its corresponding fronts are marked. The map was created for 15 May 2014 using NASA Worldview (https://worldview.earthdata.nasa.gov/?map=-126.907471,36.373535,-117.415283,42.815918&products=baselayers,MODIS_Aqua_CorrectedReflectance_TrueColor~overlays,MODIS_Fires_All,sedac_bound&time=2012-08-23&switch=geographic).
2.2 Inferring particle hygroscopicity
Whether an aerosol particle acts as a CCN depends on its size, chemical composition and the water vapour saturation in its vicinity. Köhler theory can be used to model the critical saturation ratio Scrit required for activation of a particle to a droplet (Köhler, 1936). The water activity, one term entering this theory, can be expressed based on a single parameter representation, using the hygroscopicity parameter κ (Petters and Kreidenweis, 2007). The κ values reported in this study were calculated as follows, assuming the surface tension of the examined solution droplets (σs∕a) is that of pure water:
with
dcrit is the critical diameter at which particles are just large enough to be activated to a droplet when exposed to a certain saturation ratio, S. Mw and ρw are the molar mass and density of water while R and T are the ideal gas constant and the absolute temperature, respectively. To derive dcrit, simultaneously measured NCCN and PNSDs were used. It was assumed that the aerosol particles are internally mixed. From that it follows that at a given SS all particles become activated to droplets when their dry size is similar to or larger than dcrit. Hence dcrit is the diameter at which NCCN is equal to the value of the cumulative PNSD, with the integration being done from the largest measured diameter of the PNSD to lower diameters. The thus derived dcrit can then be used, together with the corresponding S (i.e. the calibrated SS at which NCCN was measured), to derive κ for the ambient particles, based on Eq. (1). The inferred κ values correspond to particles with sizes of roughly dcrit. The uncertainty in κ, which results from the uncertainties of the PNSD measurements and the SS of the CCNc, was determined by applying a Monte Carlo simulation (MCS) in a similar fashion as done by Kristensen et al. (2016). A detailed description of this method is given in Appendix A2.
For atmospheric particles, κ can range between almost 0 for insoluble (e.g. soot and some organics) and 1.4 for very hygroscopic (e.g. sodium chloride) particles (Petters and Kreidenweis, 2007). A generally good estimate for a continental κ of around 0.3 is given by Andreae and Rosenfeld (2008). Wex et al. (2010) report that the hygroscopicity of marine aerosol particles covers a broad range from several κ values below 0.1 up to fewer values of 1, with a dominating κ value of 0.45.
2.3 Measuring site and meteorology
All measurements presented in this study were performed during a period from 1 to 17 May 2014 at the outskirts of Tuktoyaktuk, a town of less than 1000 inhabitants in the Inuvik region of the Northwest Territories, Canada. Figure 2 shows a map of Alaska and the north-western part of Canada together with the sea ice extent layer and the corrected reflectance layer of MODIS (Moderate Resolution Imaging Spectroradiometer). Tuktoyaktuk is situated north of the Arctic circle (69∘26′ N, 133∘01′ W) on the shore of the Beaufort Sea and 5 m above sea level. The area around Tuktoyaktuk has a low population density. The nearest town with more than 1000 inhabitants is 130 km to the south (Inuvik). The Beaufort Sea is located directly to the north of Tuktoyaktuk, and it is typically covered with ice from October to June. The pink colour in Fig. 2 shows the extent of the sea ice on 15 May 2014. The area of the frozen sea surface covers the entire Beaufort Sea and extends to the south of the Bering Strait. Hence, it can be excluded that aerosol particles of marine origin are formed locally during the measuring period. The landscape surrounding the measurement station is comprised of flat Arctic tundra with a subarctic climate. The characteristic precipitation is less than 300 mm per year and the mean annual surface temperature is below 0 ∘C . The time series of the meteorological parameters temperature, relative humidity, pressure, wind speed and wind direction (Fig. 3) give an overview with respect to the ambient weather conditions during the whole sampling period. The measured temperature shows an increasing trend typical for the transition from Arctic spring to summer. This transition is driven by the increase of the daily incoming solar radiation and leads to a change in sea ice and snow cover and, consequently, to a change of Arctic aerosol particle sources. During this transition from spring to summer, the polar front is moving towards the north, resulting in a more frequent passage of low-pressure systems as well as enhanced dynamics and mixing in the boundary layer of subarctic areas. This can be seen in the high variability of the measured temperature (from −10 up to 15 ∘C) and the relative humidity (from 45 up to 95 %). Furthermore, sharp changes in all meteorological parameters indicate the passage of local low-pressure frontal systems (e.g. the pressure drop and the wind shift on 13 May that correspond to a cold front). Cold and warm fronts are marked with blue and red arrows in Fig. 3, respectively, indicating a fast air mass change. In Fig. 2 a low-pressure system, which was located over the Beaufort Sea, is visible due to the corrected reflectance layer. The corresponding warm front is also visible in the meteorological parameters of Fig. 3.
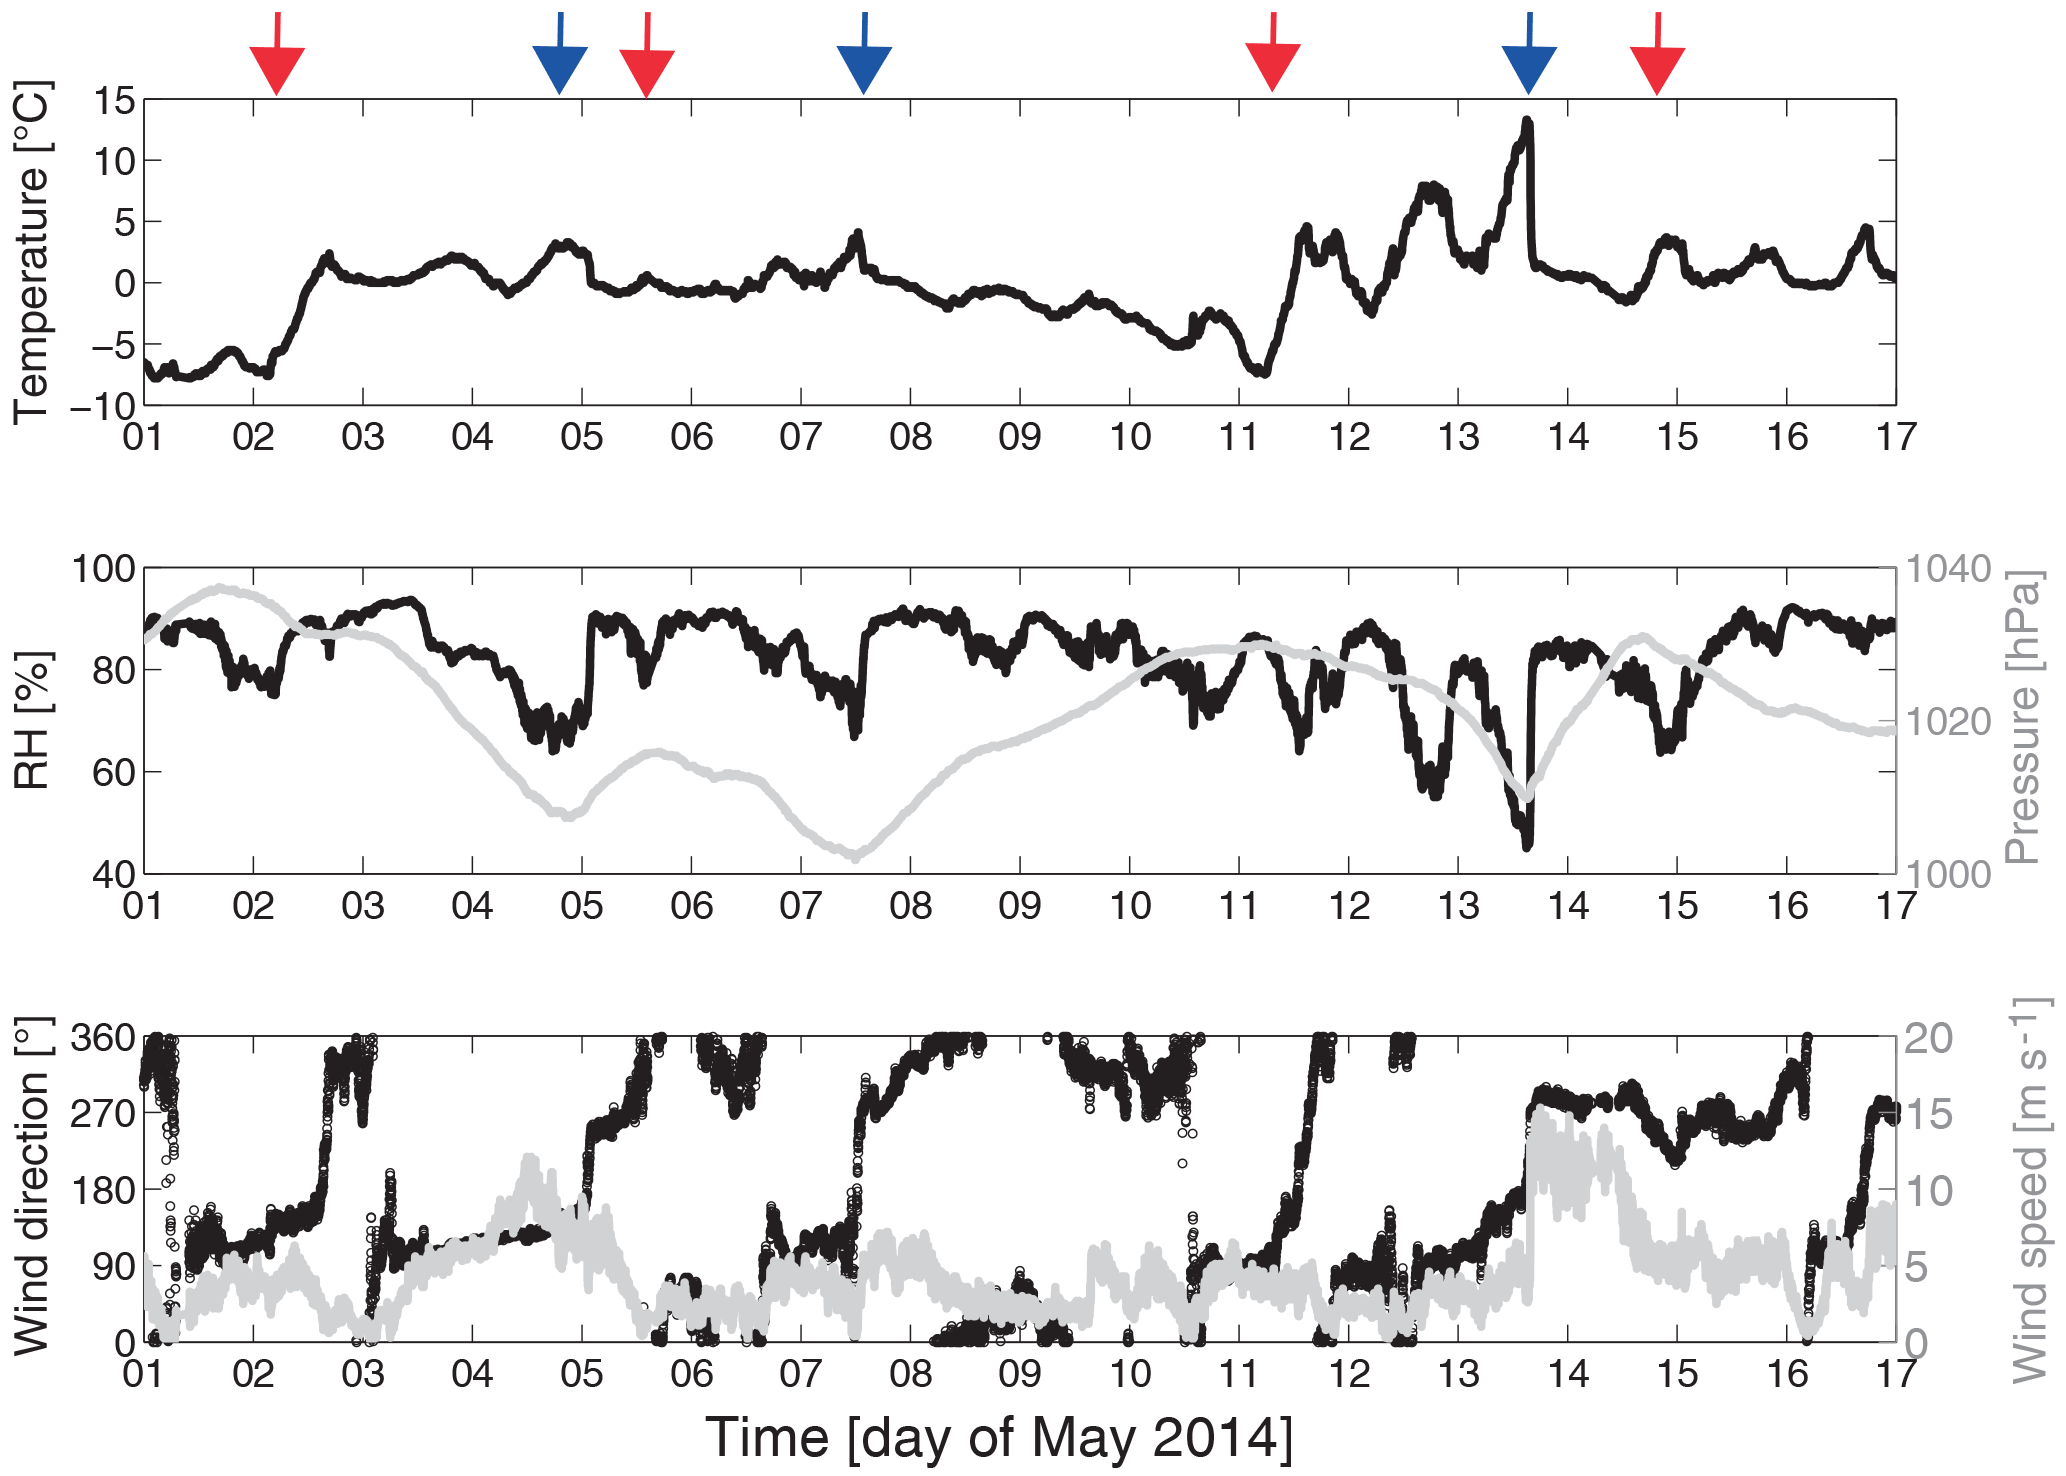
Figure 3Time series of temperature, pressure, relative humidity as well as wind speed and direction measured directly at the aerosol inlet at an altitude of 3.5 m above ground level covering the entire measurement period in May 2014. The passages of cold and warm fronts are marked with blue and red arrows, respectively.
3.1 Overview of NCN, NCCN and PNSD data for the entire measurement period

Figure 4Time series of NCN raw (grey) and NCN (i.e. the filtered data, black) as well as NCN raw>150 nm (light blue) and NCCN,0.1 (dark blue). The coloured boxes mark the three periods of measurements that were used for further analysis. The arrows at the top indicate the four overflight times of the Polar 6 research aircraft.
The measurements of all aerosol parameters recorded for this study were temporarily influenced by local anthropogenic sources. Local emissions from ground-based sources such as industrial combustion, oil heating and the generator for the container power as well as occasional air traffic led to intensive short-term peaks in the measured time series of NCN, NCCN at SS above 0.1 % and the PNSDs.
The grey line in Fig. 4 shows the raw time series of the measured total aerosol particle number concentration, where we will refer to these data using the parameter NCN raw. Besides a clear baseline of concentrations between less than 100 and 1000 cm−3, peaks up to more than 10 000 cm−3 occur during the whole sampling period. These peaks had a typical temporal duration of 1 to 5 min. Consequently, the first step of the data analysis was the application of a filter routine to eliminate time periods where the measurements were affected by local pollution. The filtering procedure is described in Appendix A1. The black dots in Fig. 4 are the remaining NCN data points. Note that especially during phases of high ambient pressure the local pollution is more intensive and the filter eliminates most of the data during these periods. Hence, on 2, 11–13 and 15 May almost no NCN data points remain. These are time periods that directly follow the maxima in the pressure time series of Fig. 3. Typical for high-pressure systems are temperature inversions near the ground level that can trap local emissions and cause an enhanced influence of local pollution. Furthermore, Fig. 4 shows NCCN measured at SS = 0.1 % (NCCN,0.1) and number concentrations of particles larger than 150 nm (integrated PNSD, NCN raw>150 nm) for the entire measurement period. For NCN raw>150 nm and NCCN,0.1 the filter procedure was not applied. Generally, NCN raw>150 nm and NCCN,0.1 show similar trends, and both do not show pronounced peaks as those seen for NCN raw. This indicates that the observed aerosol particles that we related to pollution occurred in the size range below 150 nm. We will elaborate on this below. It is, however, also worth noting that NCN raw>150 nm scatters much more than NCCN,0.1. This larger scatter originates in the higher frequency with which NCN raw>150 nm was measured. Over the whole measurement period a mean NCN of 188 cm−3 (and a median of 199 cm−3) was observed when excluding the pollution periods. This is in good agreement with an Arctic long-term study by Tunved et al. (2013) who report monthly mean NCN for May (observed at Mt. Zeppelin, Ny-Ålesund, Svalbard, from March 2000 to March 2010) being slightly above 200 cm−3. Generally they observed the highest concentrations between April and July, which can be traced back to aged anthropogenic Arctic haze aerosol earlier in this time period and to new particle formation later (Tunved et al., 2013). That these two kinds of aerosol also play a major role in context of the present study is discussed in the following two sections by using air mass back trajectories and the PNSDs. Figure 5 shows a comparison of the mean of all of those PNSDs which were detected during time periods that were marked as clean (PNSDc, corresponding to times when NCN is shown as black dots in Fig. 4) with the mean of all other PNSDs. The latter are those for which an influence of local pollution was assumed (PNSDp). Also shown in Fig. 5 are error bars that indicate the range between the 25 and 75 % percentiles. Both PNSDc and PNSDp are bimodal with an Aitken mode below 100 nm and an accumulation mode above 100 nm. Above 150 nm, the accumulation modes of both are almost equal, whereas the Aitken mode of PNSDp is more pronounced than that of PNSDc. Similar influences of local emission on PNSD were found at an urban background station in Helsinki by Wegner et al. (2012). They observed modes between 10 and 40 nm in median urban PNSD caused by traffic, domestic and district heating, comparable to our result, albeit at higher concentrations. The observations by Wegner et al. (2012) support our assumption made earlier that the observed high peaks in NCN raw originate from local pollution. It also demonstrates the usefulness of the applied filter (see Appendix A1). As for NCN, PNSDc also agrees well with the observations of Tunved et al. (2013). A PNSD shown in Tunved et al. (2013), representing the monthly median PNSD for May over a period of 10 years in an Arctic environment, shows the same characteristic as PNSDc of this study as shown in Fig. 5. Both are bimodal with a distinct accumulation mode and a smaller Aitken mode. The variability of PNSDc and the dependence on the air mass origin is discussed in Sect. 3.3.
After applying the filter on NCCN and the PNSDs only three distinct periods (Period 1: 3 May 07:00 to 5 May 00:00; Period 2: 7 May 00:10 to 7 May 09:00; Period 3: 16 May 05:00 to 16 May 12:15) of evaluable data remained, as these parameters were measured with a lower temporal resolution and were thus more prone to be effected by local pollution than NCN. The three periods are marked with a blue, green and red square in Fig. 4. This colour code is continuously used in the following figures. The arrows at the top of Fig. 4 indicate the four overflights of the Polar 6 research aircraft. For these times a comparison of ground-based and airborne PNSDs of different altitudes was done, which is discussed in Sect. 3.5.
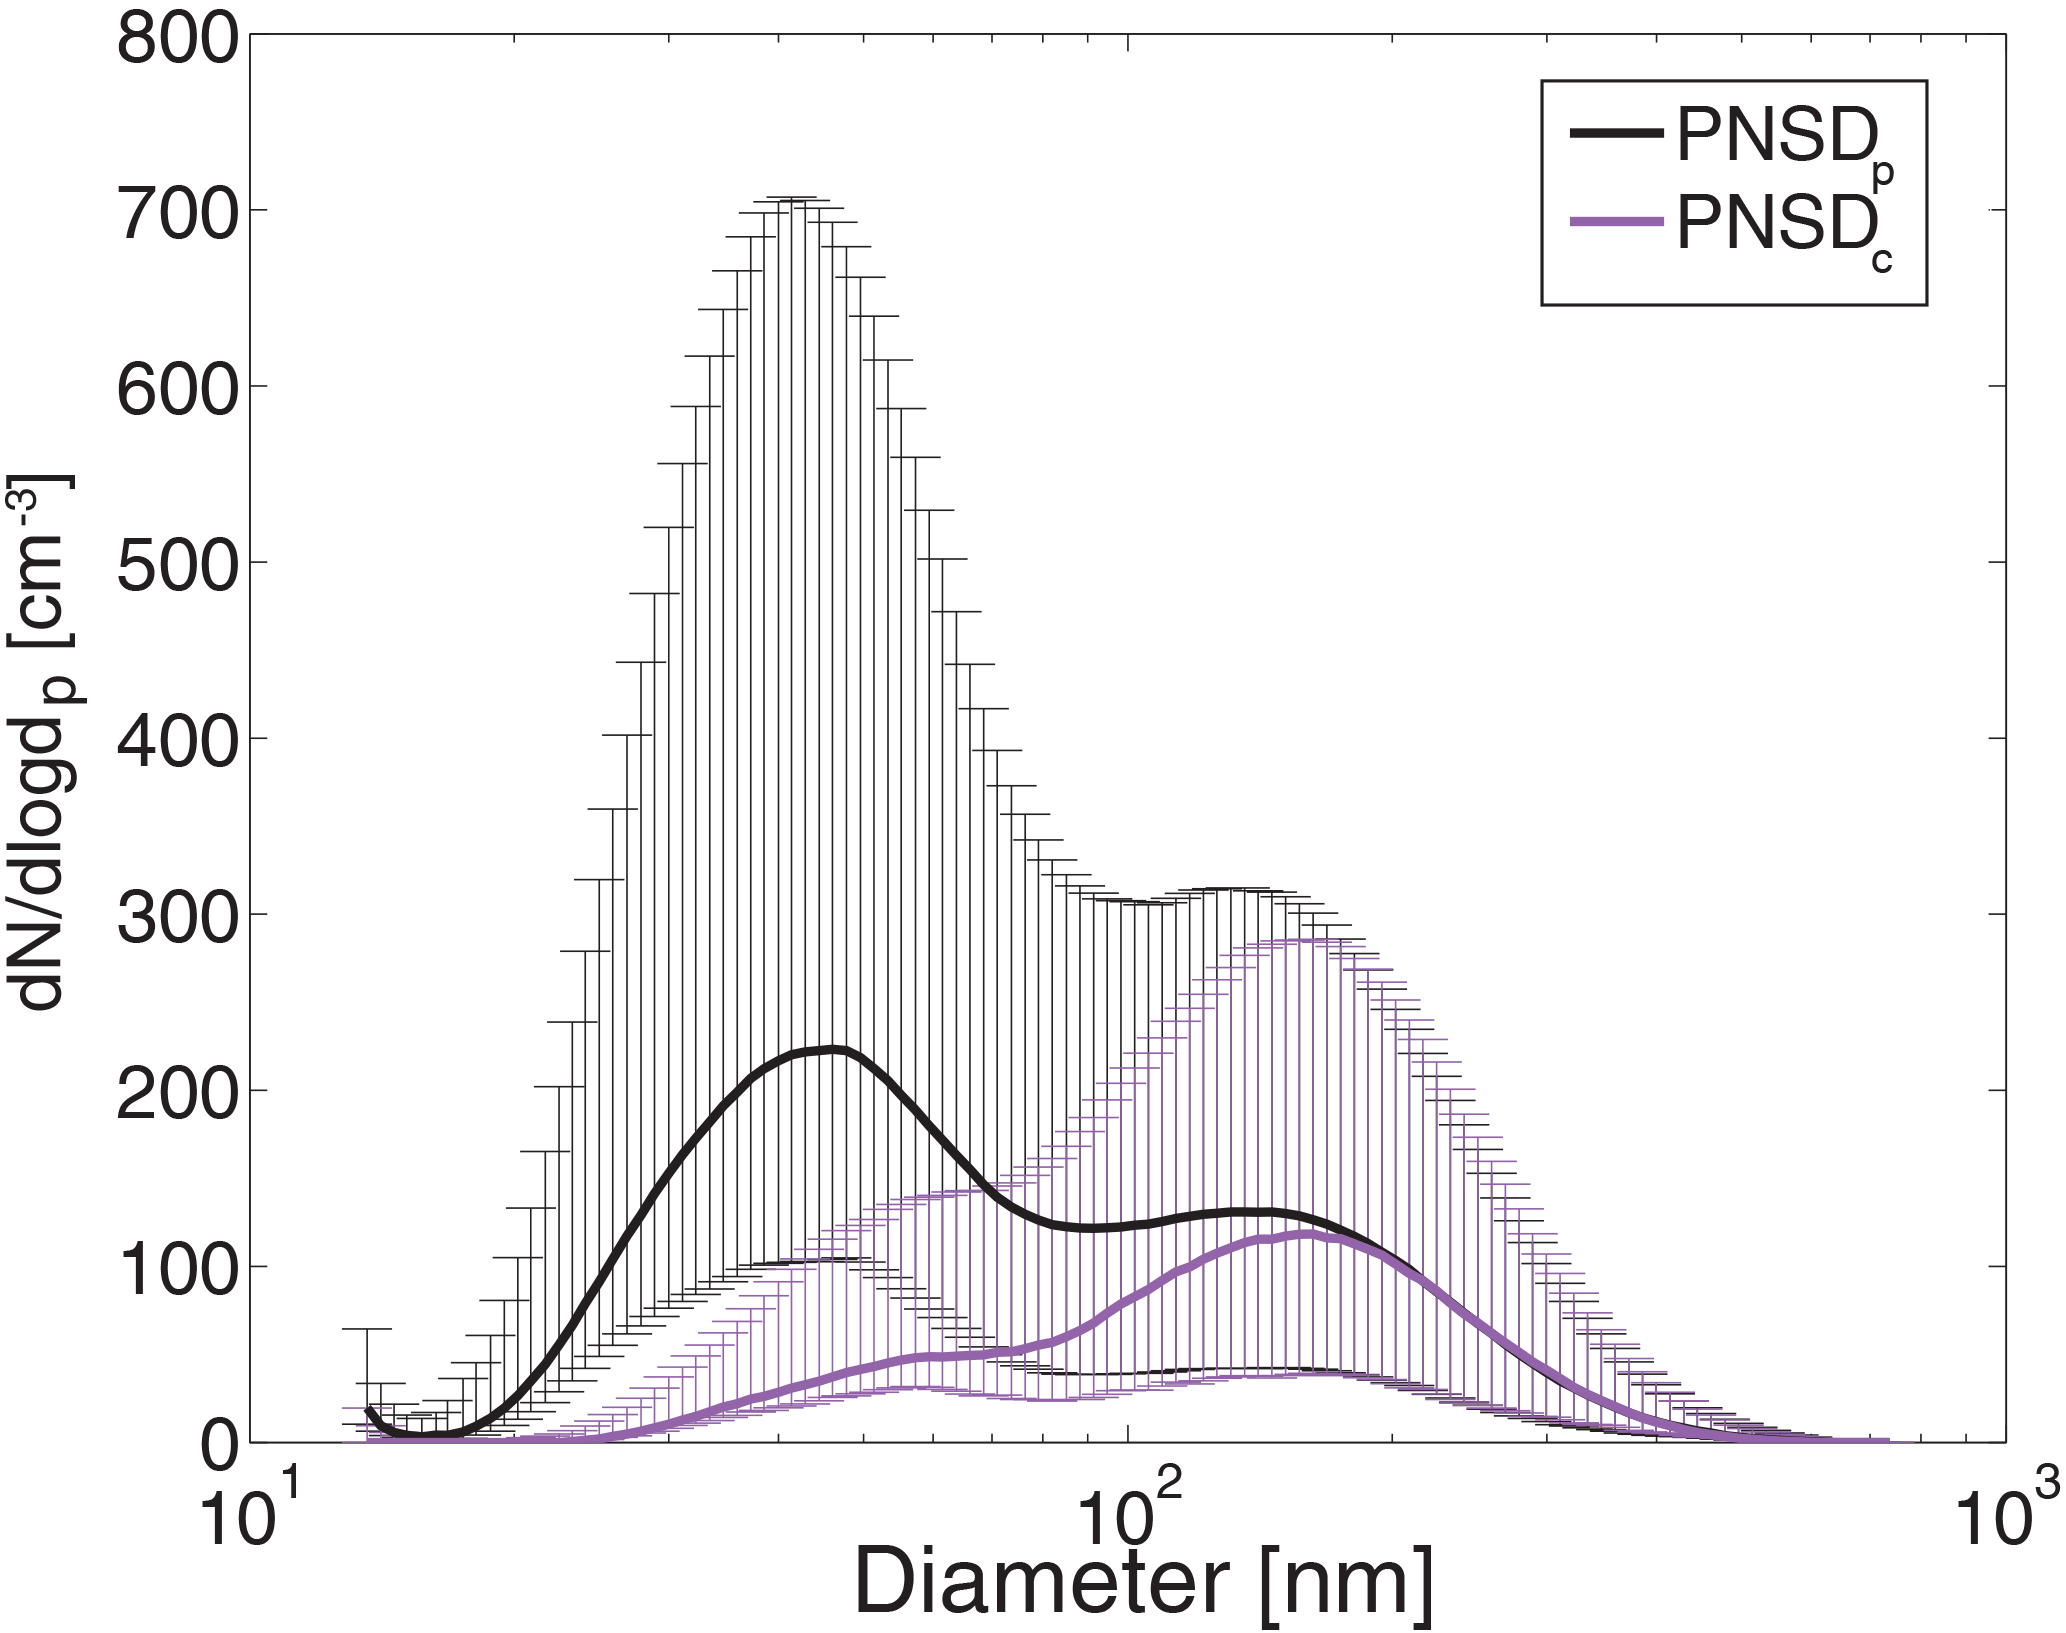
Figure 5Comparison of the median PNSDs for times which were assumed to be clean (PNSDc, purple) or polluted (PNSDp, black). The thin vertical lines (same colour code) indicate the range between the 25 and 75 % percentiles.
3.2 Identification of air mass origins and potential source regions
We applied two approaches to investigate the history of the measured air masses. First, the origin of the air masses of the three periods is identified by means of air mass back trajectories. Second, the potential source contribution function (PSCF), which is a residence time analysis that results in a probability field (Fleming et al., 2012), is applied to identify regions that potentially act as source regions for aerosol particles measured throughout the whole campaign.
3.2.1 Origin of sampled air masses of the three periods
To assess the origin of the air masses of the three periods we used the Lagrangian analysis tool (Sprenger and Wernli, 2015). The LAGRANTO backward trajectories were calculated based on analysis data from the European Centre of Medium-Range Weather Forecasts (ECMWF). The data used have a horizontal grid spacing of 0.5∘ and 137 vertical hybrid sigma-pressure levels from the surface up to 0.01 hPa. Hourly 10-day back trajectories were started in the region around Tuktoyaktuk (69.43∘ N, 133.00∘ W) at a pressure level of 25 hPa below surface pressure. More specifically, we initialized trajectories at 13 receptor sites in the horizontal plane, accounting for the uncertainty introduced due to the relatively coarse horizontal grid and the release at an individual point. One receptor site was directly at the coordinates of the measurement station and 12 were around the station. The upper panel of Fig. 6 depicts the bundle of trajectories for the three time periods.
Two main air mass origins were observed. The air masses of Period 2 originated in the north-east of Canada (in the province Nunavut). During May air masses from this area are typically highly contaminated due to high winter and springtime aerosol particle burdens which can be observed all over the Arctic (Shaw, 1995). In the following these air masses are termed “accumulation-type” air masses. The air masses of Period 3 originated in the south-west of Tuktoyaktuk (Eastern Russia, Kamchatka and the unfrozen North Pacific). In the following, these air masses are named “Aitken-type” air masses, and the naming of the air masses will be explained in the next subsection, Sect. 3.3. Furthermore, the trajectories indicate that Period 1 includes both accumulation- and Aitken-type air masses. The distribution of these two air masses during Period 1 is visible in the lower panel of Fig. 6. The figure shows the number of trajectories per hour (for Period 1) that originated east (Naccumulation) or west (NAitken) of Tuktoyaktuk. It can be seen that during the first part of Period 1 (until 16:00 on 4 May 2014) the air masses in Tuktoyaktuk were a mixture of accumulation- and Aitken-type air masses. Until 3 May Tuktoyaktuk was influenced by an anticyclone with a maximum pressure of 1035 hPa. The low-pressure gradient of this anticyclone led to a low wind velocity and a baffling wind (see lower panel of Fig. 3), which caused an alternation between the two air mass origins at the beginning of Period 1. The second part of Period 1 is characterized by a decreasing surface pressure and a constant easterly wind. NAitken decreased as well, with a temporal shift of less than 1 day, which indicates that only accumulation-type air masses were present at Tuktoyaktuk.
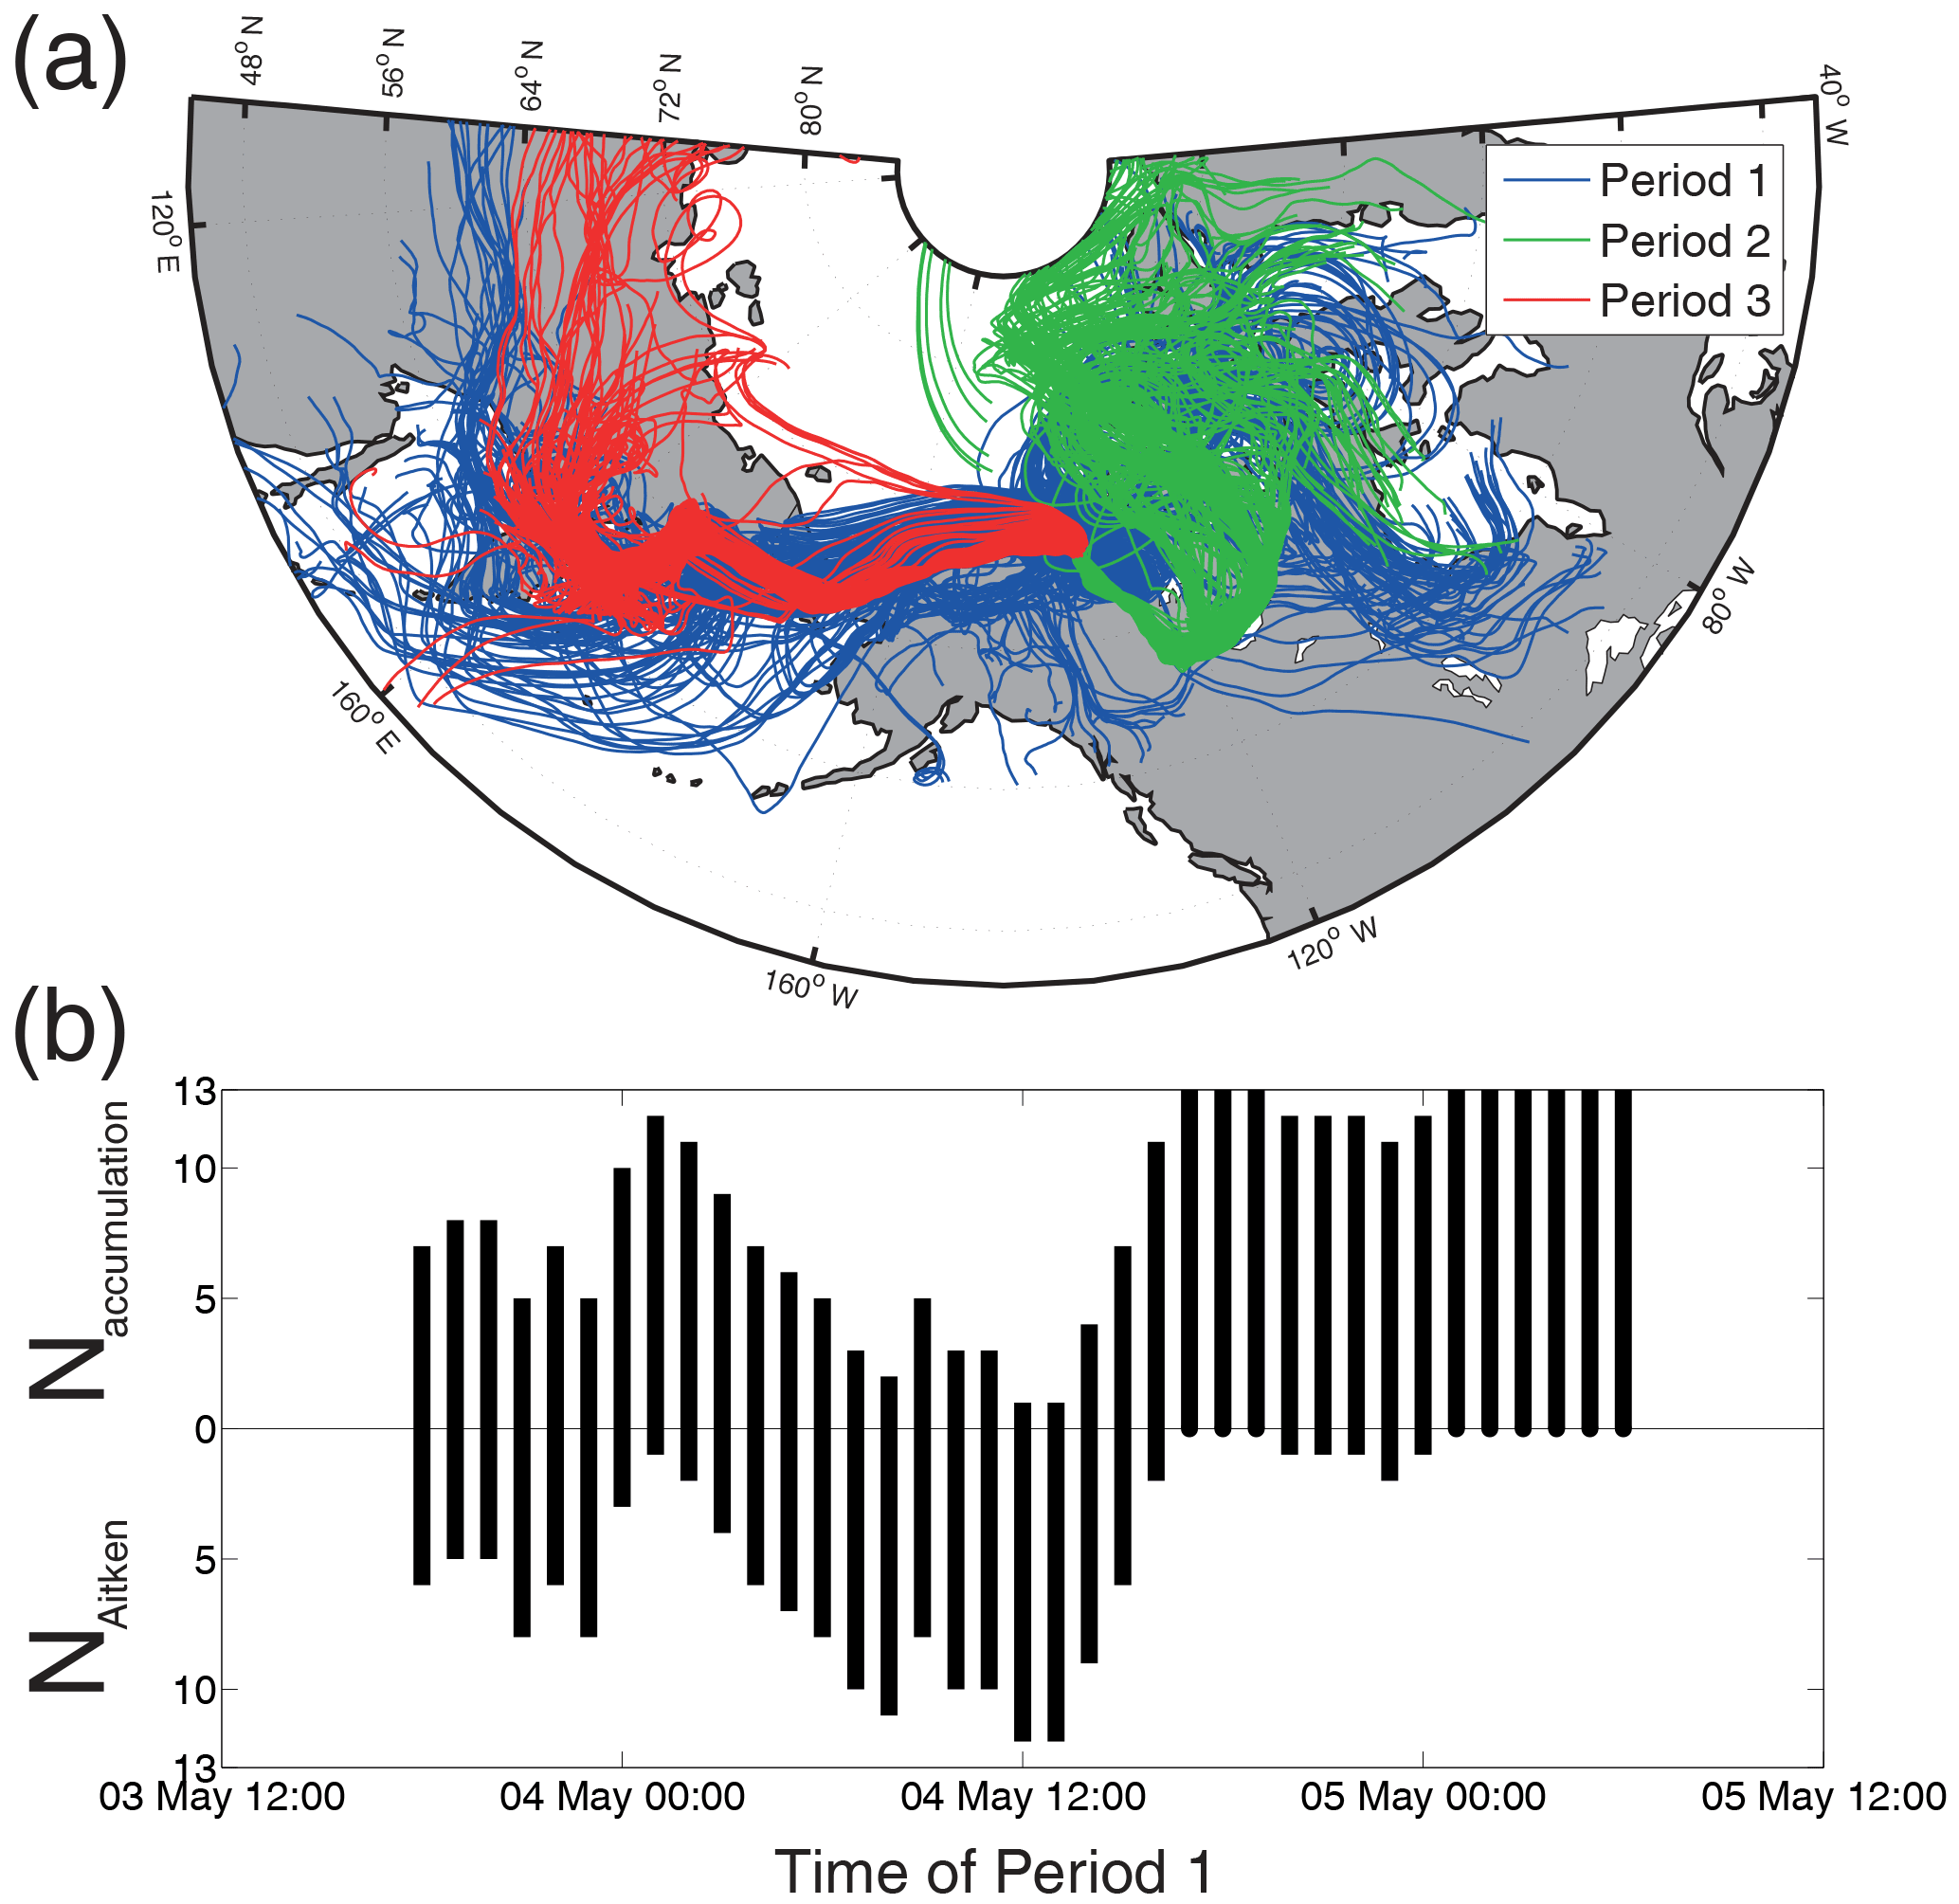
Figure 6(a) Ten-day back trajectories of the three periods started in and around Tuktoyaktuk at a pressure level of 25 hPa above the surface pressure. (b) The total number of 13 trajectories per hour of Period 1 was split up into the number of trajectories that came from east (Naccumulation) or west (NAitken) to illustrate the alternation of the air mass origin.
3.2.2 PSCF analysis
The PSCF is a receptor modelling method that is based on air mass back trajectories. Originally it was developed by Ashbaugh et al. (1985) and was previously applied in numerous studies, including high-latitude studies such as Dall'Osto et al. (2017b) (Antarctic) and Yli-Tuomi et al. (2003) (Arctic). This model is commonly used to identify regions that have the potential to contribute to high values of measured concentrations at a receptor site. In the present study, the NOAA HYSPLIT trajectory model was used to calculate hourly resolved 10-day back trajectories based on 1×1∘ Global Data Assimilation System (GDAS) meteorological data. To account for uncertainties in back trajectory analysis, every hour a set of 15 back trajectories was calculated that was composed of five different plane locations (one exactly at the measurement station and four in close proximity around it) at three altitudes (100, 200 and 300 m above the surface level). We apply the PSCF model according to Hopke (2016) on hourly average NCN values with the 75 % percentile as threshold value. The threshold value defines which NCN value is considered as a high concentration. We calculated the PSCF on the basis of 5×5∘ grid cells. To account for bad statistics in grid cells with a low trajectory density, a weighting function according to Waked et al. (2014) was applied. The spatial distribution of the PSCF of NCN is mapped in Fig. 7. The map shows several areas of enhanced PSCF values that can be linked to potential source regions. One of these spots of enhanced PSCF values is located in central Canada, which potentially can be linked to biomass burning. To prove this possible connection, we used the MODIS Active Fire Product (MCD14ML) to display the active wild fire spots that occurred between 21 April and 17 May 2014 as magenta dots on the map. Due to the local proximity of these enhanced PSCF values and a spot of detected active fires south of them, it is possible to measure high NCN values due to biomass burning in central Canada.
Also active fires detected in Siberia show coincidence with a spot of enhanced PSCF values. From a detailed analysis on a daily basis we see that this region of high PSCF values shows the occurrence of active fires throughout the whole time of analysis. Another spot in Siberia can be explained due to its proximity to Norilsk (red square in Fig. 7), which is considered to be an Arctic point source for emissions due to nickel mining and aluminum plants. Although improvement has been achieved since the 1980s, Norilsk still remains one of the largest sources of anthropogenic Arctic air pollution, mainly due to the emission of particulates and sulfur dioxide (AMAP, 2006). Another point source of anthropogenic Arctic emissions is the Prudhoe Bay Oil Field in North Alaska, marked with a red diamond in Fig. 7. Gunsch et al. (2017) and Kolesar et al. (2017) recently found the emissions of Prudhoe Bay Oil Field to cause increased NCN values and have impact on growth events of nucleation and Aitken-mode aerosol particles. Our PSCF analysis results in a spot of increased PSCF values in the vicinity of Prudhoe Bay Oil Field. This indicates that Prudhoe Bay Oil Field emissions potentially lead to enhanced NCN values measured in Tuktoyaktuk. The largest area of enhanced PSCF values is the area of the north-west Pacific. This region seems to overall cause relatively high NCN values measured at Tuktoyaktuk, most likely due to marine emissions. A detailed discussion about the impact of marine emissions on the aerosol particles measured in Tuktoyaktuk is presented in the following section.
The above discussed PSCF results give a rough idea about the location of possible aerosol particle sources for our measurements at Tuktoyaktuk. However, in our case, the precision of the PSCF method is limited due to the small amount of data.
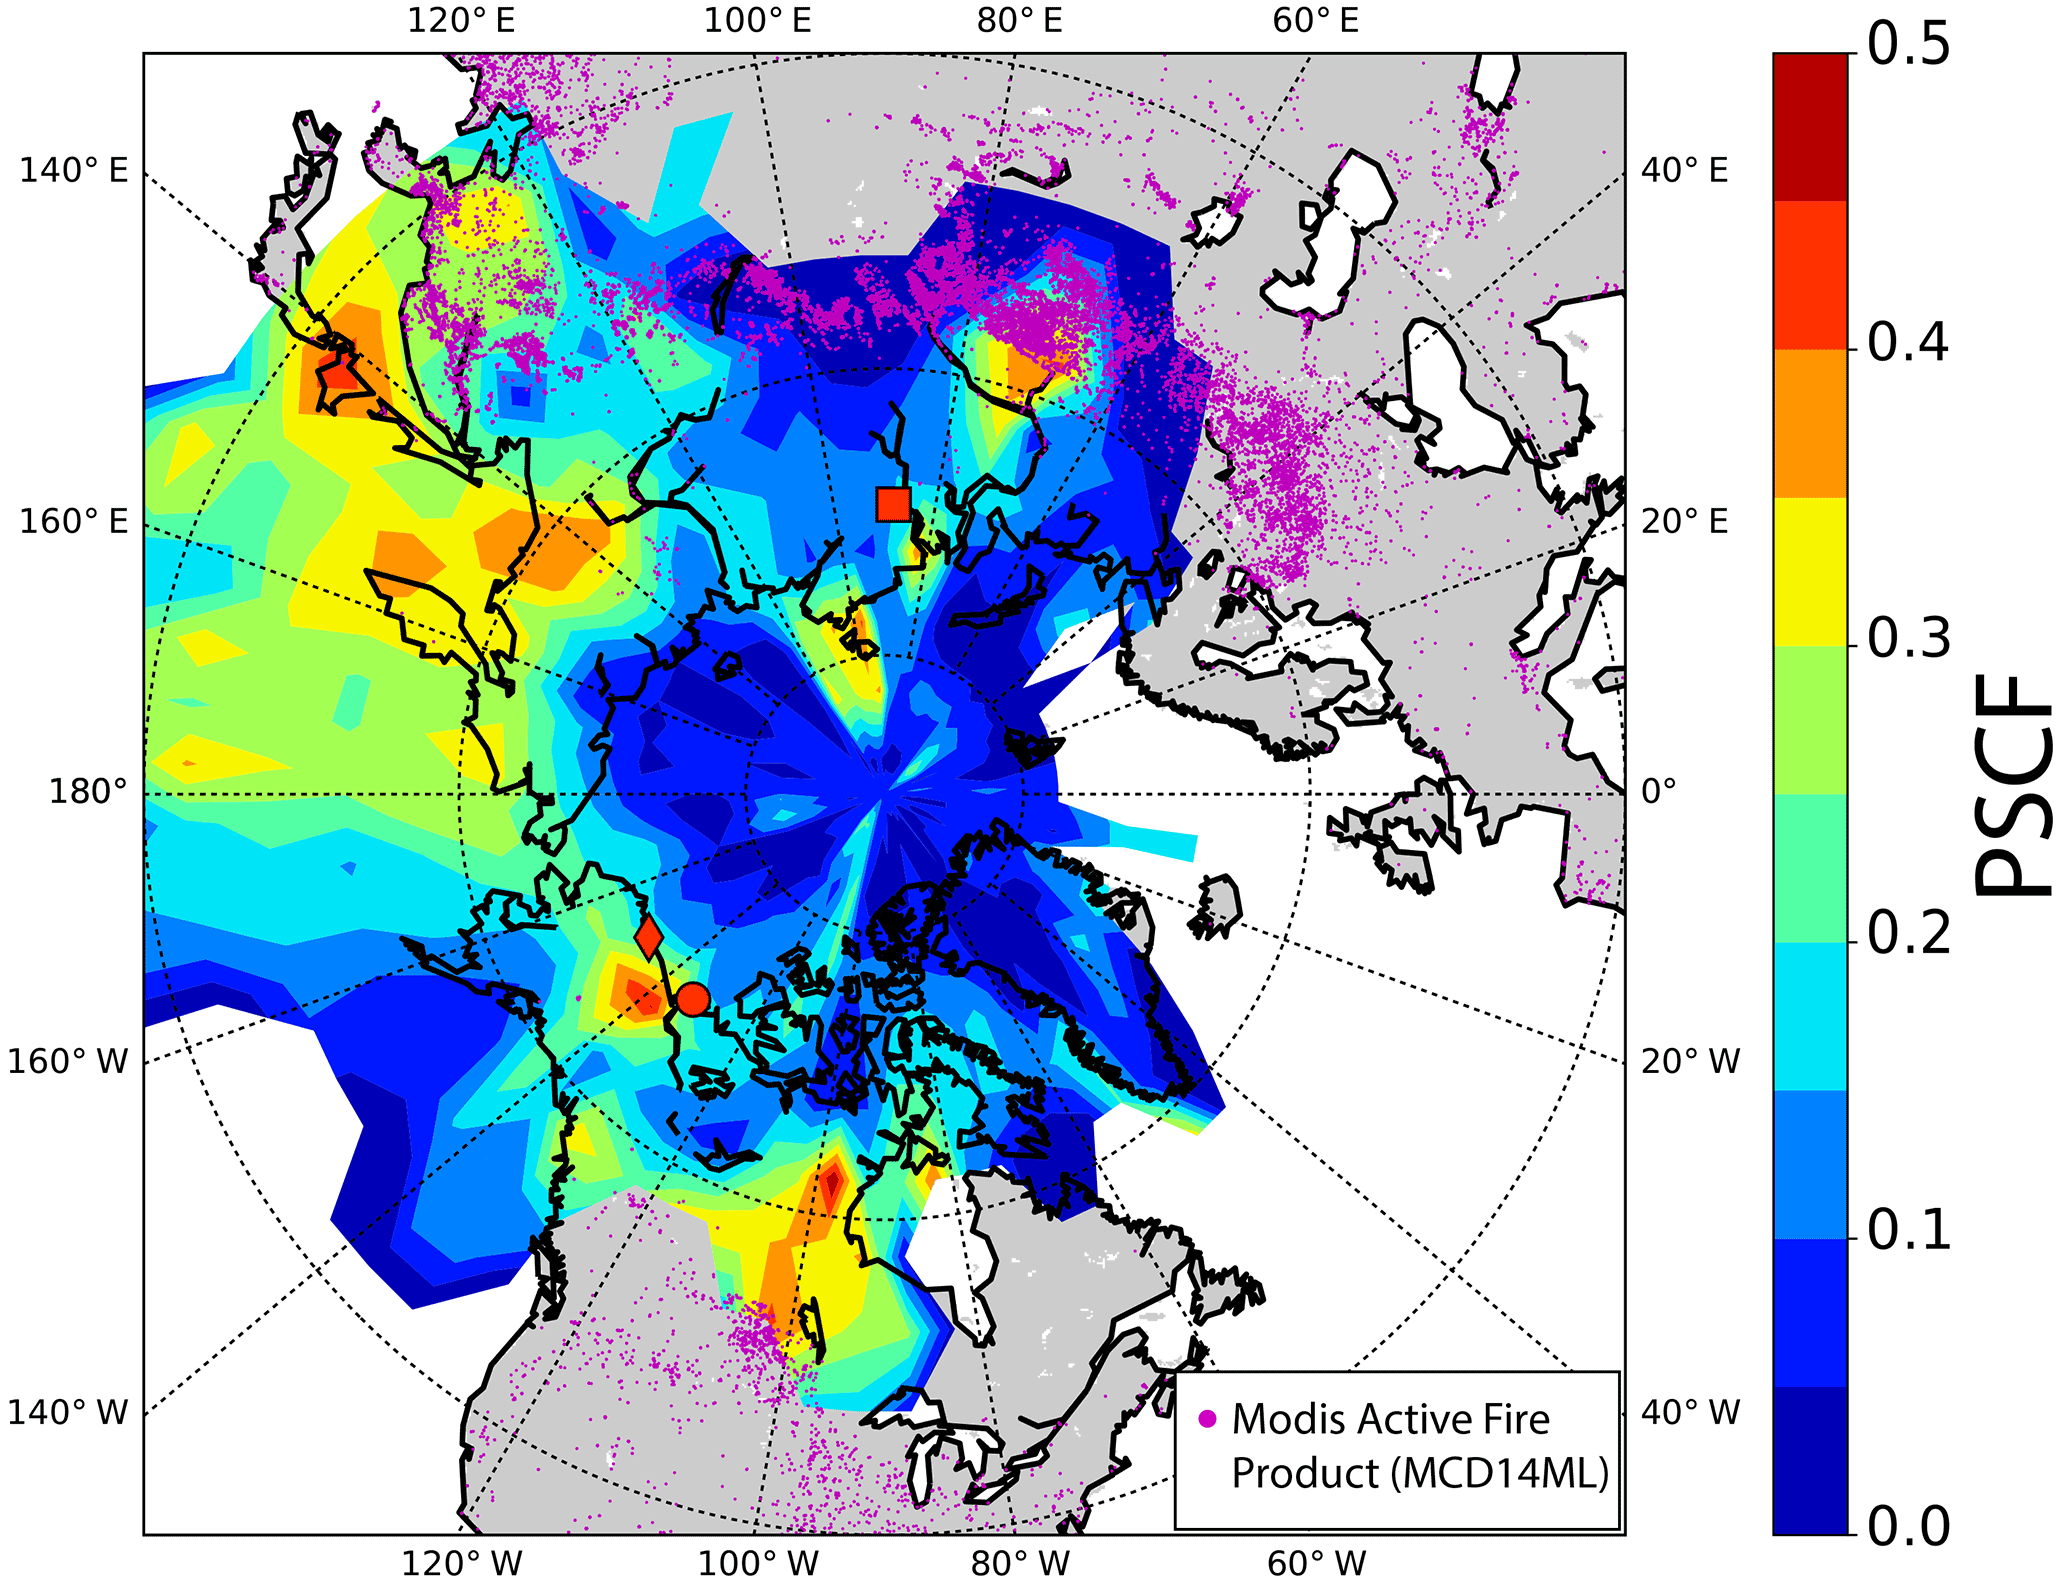
Figure 7Map showing the PSCF function of NCN, calculated on the basis of concentrations exceeding the 75 % percentile. The colour bar indicates the PSCF value and the red dot, the diamond and the square indicate the position of Tuktoyaktuk, Prudhoe Bay (Alaska, USA) and Norilsk (Russia), respectively. The purple dots display the location of active fire spots that occurred between 21 April and 17 May 2014, detected by MODIS (Active Fire Product – MCD14ML).
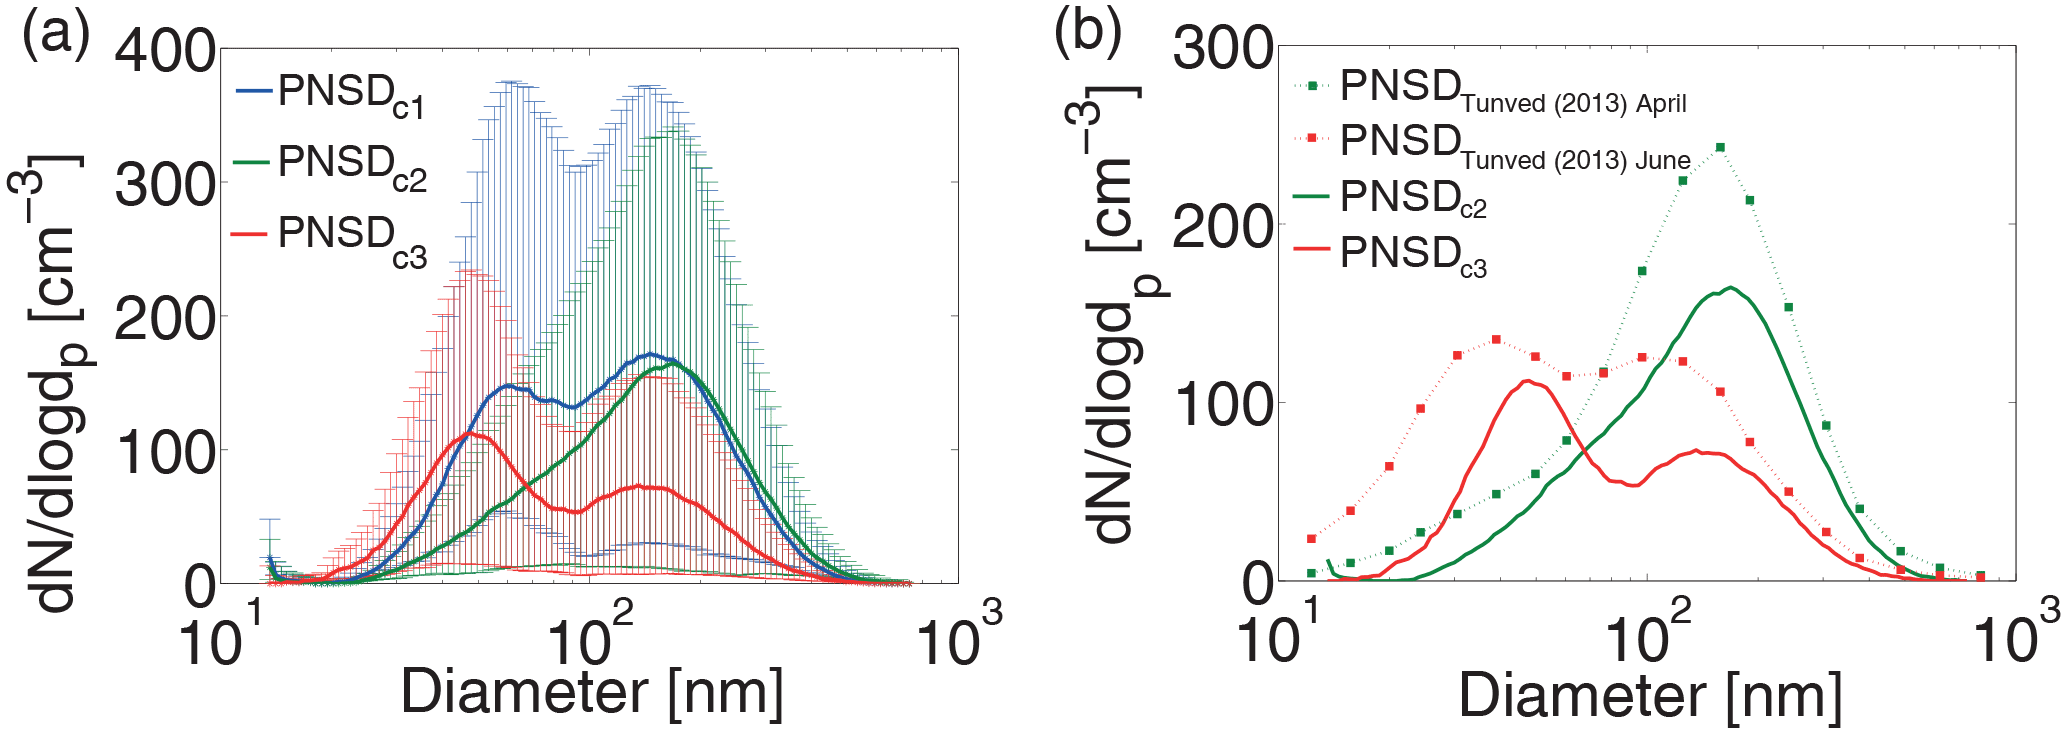
Figure 8(a) Thick lines show the median PNSD of Period 1 (blue), Period 2 (green) and Period 3 (red). The thin vertical lines (same colour code) indicate the range between the 25 and 75 % percentiles. (b) Comparison of the median PNSD of periods 2 and 3 with 10-year median PNSD of April and June observed by Tunved et al. (2013) on Svalbard. The PNSDs observed by Tunved et al. (2013) for April and June are comparable in shape with PNSDc2 and PNSDc3, respectively.
3.3 PNSD of the three periods
Figure 8a shows the median of the PNSDc of the three periods discussed in Sect. 3.2.1, together with the 25 and 75 % percentiles. They were computed to examine their dependence on the origin of the air mass. The PNSDc of Period 1 (PNSDc1) and Period 3 (PNSDc3) are bimodal with an Aitken mode below 100 nm and an accumulation mode above 100 nm, whereas that of Period 2 (PNSDc2) only shows the accumulation mode. The large variability we observed in the shape of the PNSD is typical for the transition period from Arctic spring to summer, i.e. higher variation of source regions during the Arctic summer. As described in more detail in the introduction, although there is a pronounced annual cycle in PNSDs in the Arctic, common features concerning PNSDs are shared across the Arctic (Freud et al., 2017), and we use PNSDs reported in Tunved et al. (2013) for comparison with our data in the following, as these were the first long-term data describing the annual cycle. PNSDc2 is similar to the PNSD that Tunved et al. (2013) observed for March and April on Svalbard. A direct comparison of PNSDc2 and the median April PNSD of Tunved et al. (2013) is shown in Fig. 8b. The monomodal accumulation-mode aerosol is characteristic for the Arctic haze, which mainly consists of POM and sulfate (Quinn et al., 2002). Single particle analysis of aerosol particles samples taken at the Zeppelin Observatory, Svalbard, that occurred before the transition to the Arctic summer showed a dominance of spherical organic-like particles in the submicrometer range with an Eurasian influence (Behrenfeld et al., 2008). These Arctic haze aerosol particles typically are well aged (Heintzenberg, 1980; Quinn et al., 2002). Due to the shape of PNSDc2, and since the air mass of Period 2 has its origin in a region where conditions in May are still winterly, it is very likely that we observed a typical Arctic haze air mass. In contrast, PNSDc3 is comparable to PNSDs that are reported by Tunved et al. (2013) for June and July. PNSDc3 and the median June PNSD of Tunved et al. (2013) are depicted in Fig. 8b. In addition to the accumulation mode the bimodal summertime Arctic PNSD shows an Aitken mode which most likely originates from particles formed by new particle formation (Engvall et al., 2008; Wiedensohler et al., 2011). A common precursor gas for new particle formation is DMS emitted from oceanic phytoplankton. This precursor is known to be more abundant during the Arctic summer when the marine biological activity has its maximum. An indicator for the presence of DMS is its oxidation product, MSA (Quinn et al., 2007). MSA also could be directly detected as a component of the PM itself in remote marine background aerosol and in plankton bloom areas (Zorn et al., 2008). Quinn et al. (2007) report the concentration of MSA for several Arctic measurement stations (e.g. Barrow and Alert – Tuktoyaktuk is located between the two) during at least 7 years. The MSA concentration starts to increase in April and has two maxima during the summertime, where both maxima were observed in Alert and Barrow (Quinn et al., 2007). The later maximum occurs in July and August and is due to the local productivity of phytoplankton while the surface water is free of ice. The earlier maximum, which occurs around the time of our measurements, can be associated with long-range transport from marine source regions from the North Pacific (Li et al., 1993). This fits well with the source region we found for the air mass of PNSDc3 and can explain the presence of the Aitken-mode particles. The minimum between the Aitken and the accumulation mode can be explained by previous cloud processing during which further material was added to activated droplets via aqueous phase oxidation. After the evaporation of cloud droplets this process creates the bimodal PNSD with the Hoppel minimum (Hoppel et al., 1994). In our case the Hoppel minimum can be found at around 90 nm. While cloud processing is a well-known process for gaining PM and growing particles to larger sizes, particles can also grow by generation of PM directly from the gas phase, as described recently for Arctic conditions in e.g. Willis et al. (2016), Burkart et al. (2017b) and Collins et al. (2017). The observed minimum in the PNSD occurs when new particle formation takes place either by adding small particles to an already aged air mass or by mixing of different air masses with one air mass containing aged and the other one newly formed particles, where one could come from aloft. It should also be mentioned that it was recently described in Gunsch et al. (2017) and Kolesar et al. (2017) that emissions from Prudhoe Bay oil field, which is located at the northern shore of Alaska roughly 700 km west of our measurement location, influenced Arctic PNSDs by adding both high concentrations of small particles and particulate mass to larger particles. In summary, there is a number of reasons that can add to the observed bimodality of the size distribution, but small, comparably newly formed particles will make up the observed Aitken mode in all cases. Sources of the precursor gases forming these particles will differ from spring to summer, as mentioned above (Li et al., 1993).
In Sect. 3.2.1 it is described that the back trajectories for Period 1 altered between the two source regions. This observation is supported by the shape of PNSDc1, which suggests that both source regions contribute to the aerosol particles observed during this period. PNSDc1 is bimodal (similar to PNSDc3) but with a less pronounced Hoppel minimum and a distinct accumulation mode (similar to PNSDc2). Due to the strongly alternating air mass origins during Period 1, the attempt to separate the two cases in PNSD1 did not succeed, and the aerosol particle population reported for Period 1 in this study comprises a mixture between accumulation- and Aitken-type air masses. However, due to the absence of detailed information on the composition of the aerosol particles such considerations remain speculative.

Figure 9The time series of NCN and NCCN in panel (a), dcrit in panel (b) and the inferred κ values in panel (c). The error bars of NCN and NCCN show the standard deviation whereas the error bars of dcrit and κ show uncertainties that are determined by means of a Monte Carlo simulation. The blue data points show the unfiltered data corresponding to SS = 0.1 %. The other colours correspond to the filtered data (SS ≥ 0.1 %) of periods 1, 2 and 3, marked with the blue, green and red box, respectively.
3.4 Critical diameter dcrit and hygroscopicity parameter κ
In Sect. 2.2 it is described how the critical diameter dcrit and the hygroscopicity parameter κ can be determined based on the measured NCCN and PNSD. dcrit and κ were derived for (i) the whole measurement period using unfiltered NCCN,0.1 and corresponding PNSD and (ii) the three selected periods described above, using filtered NCCN at all SS and PNSDc. Figure 9 shows the time series of NCN and NCCN (mean concentration with standard deviation as error bars) in the upper panel, dcrit in the middle panel and κ in the lower panel. Note that data concerning all SS are only available during the three selected periods. In Sect. 3.1 we describe that the pollution occurred in the size range below 150 nm. NCCN measured at SS higher than 0.1 % are affected by local pollution due to the lower dcrit (dcrit is discussed in detail below) and thus are not analysed for the whole measurement period except the three periods. The uncertainties for dcrit and κ as given by the error bars were determined by the use of a MCS. A detailed description of this method is given in Appendix A2. (The uncertainties for dcrit are typically smaller than the symbol size.)
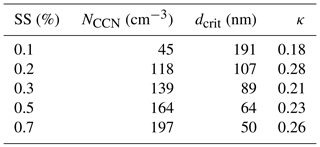
During the whole measurement period the unfiltered NCCN,0.1 covers a range between less than 10 and 200 cm−3 with a median of 45.2 cm−3. The median dcrit values as well as the median concentrations for the filtered NCCN are presented in Table 1. The corresponding inferred values for κ are representative for aerosol particles with sizes in the size range close to dcrit and therefore can be assigned to the modes in the PNSD. Therefore, κ derived for SS = 0.1 % displays the hygroscopicity of the accumulation mode as dcrit for SS = 0.1 % is in the neighbourhood of the maximum of this mode. κ values for SS = 0.2 and SS = 0.3 % are representative for the size range close to the Hoppel minimum, whereas κ values for SS = 0.5 and SS = 0.7 % are representative for the Aitken mode. The median κ values for SS = 0.1, 0.2, 0.3, 0.5 and 0.7 % are 0.18, 0.28, 0.21, 0.23 and 0.26, respectively. These values are summarized in Table 1. For periods 1, 2 and 3, the κ values averaged over all SS are 0.22, 0.23 and 0.26, respectively. We will discuss in the following how these κ values relate to the measurement uncertainty.
Figure 10a shows the probability density function of all κ values that are presented in the lower panel of Fig. 9. The blue line displays the median of the inferred κ values which is 0.23 and the red lines are the 5 and 95 % percentiles. The width between these percentiles, σs,all SS, amounts to 0.23. To check whether these inferred κ values allow a physical interpretation of the variability of κ, the MCS was used, as described in the Appendix A2. In short, using MCSs, the uncertainty for each κ value was determined separately based on uncertainties in dcrit, NCCN and Scrit. This uncertainty was again expressed as the width between the 5 and 95 % percentiles. The separate widths were averaged, yielding σMC,all SS, which was determined to be 0.16. To resolve physically driven changes, σs,all SS should be significantly larger than σMC,all SS (at least twice as large). But only amounts to 1.44, which indicates that 70 % () of the variability in the observed κ values is related to measurement uncertainties of the PNSD and the SS in the CCNc. For corroboration, the same analysis was done based on a subset of all data. In Fig. 10b the κ values at SS = 0.1 % are displayed as a probability density function with a median of 0.19 and a width between the 5 and 95 % (σs,0.1) percentiles of 0.23. The width between the 5 and 95 % percentiles of the MCS (σMC,0.1, only for SS = 0.1 %) is 0.14 so that the ratio between both is 1.64. Hence 60 % of the variability in the observed κ values at SS = 0.1 % is related to measurement uncertainties. Summarizing, it can be stated that our observed κ values show no significant dependencies on the SS or the air mass origin that can be resolved with our setup and method.
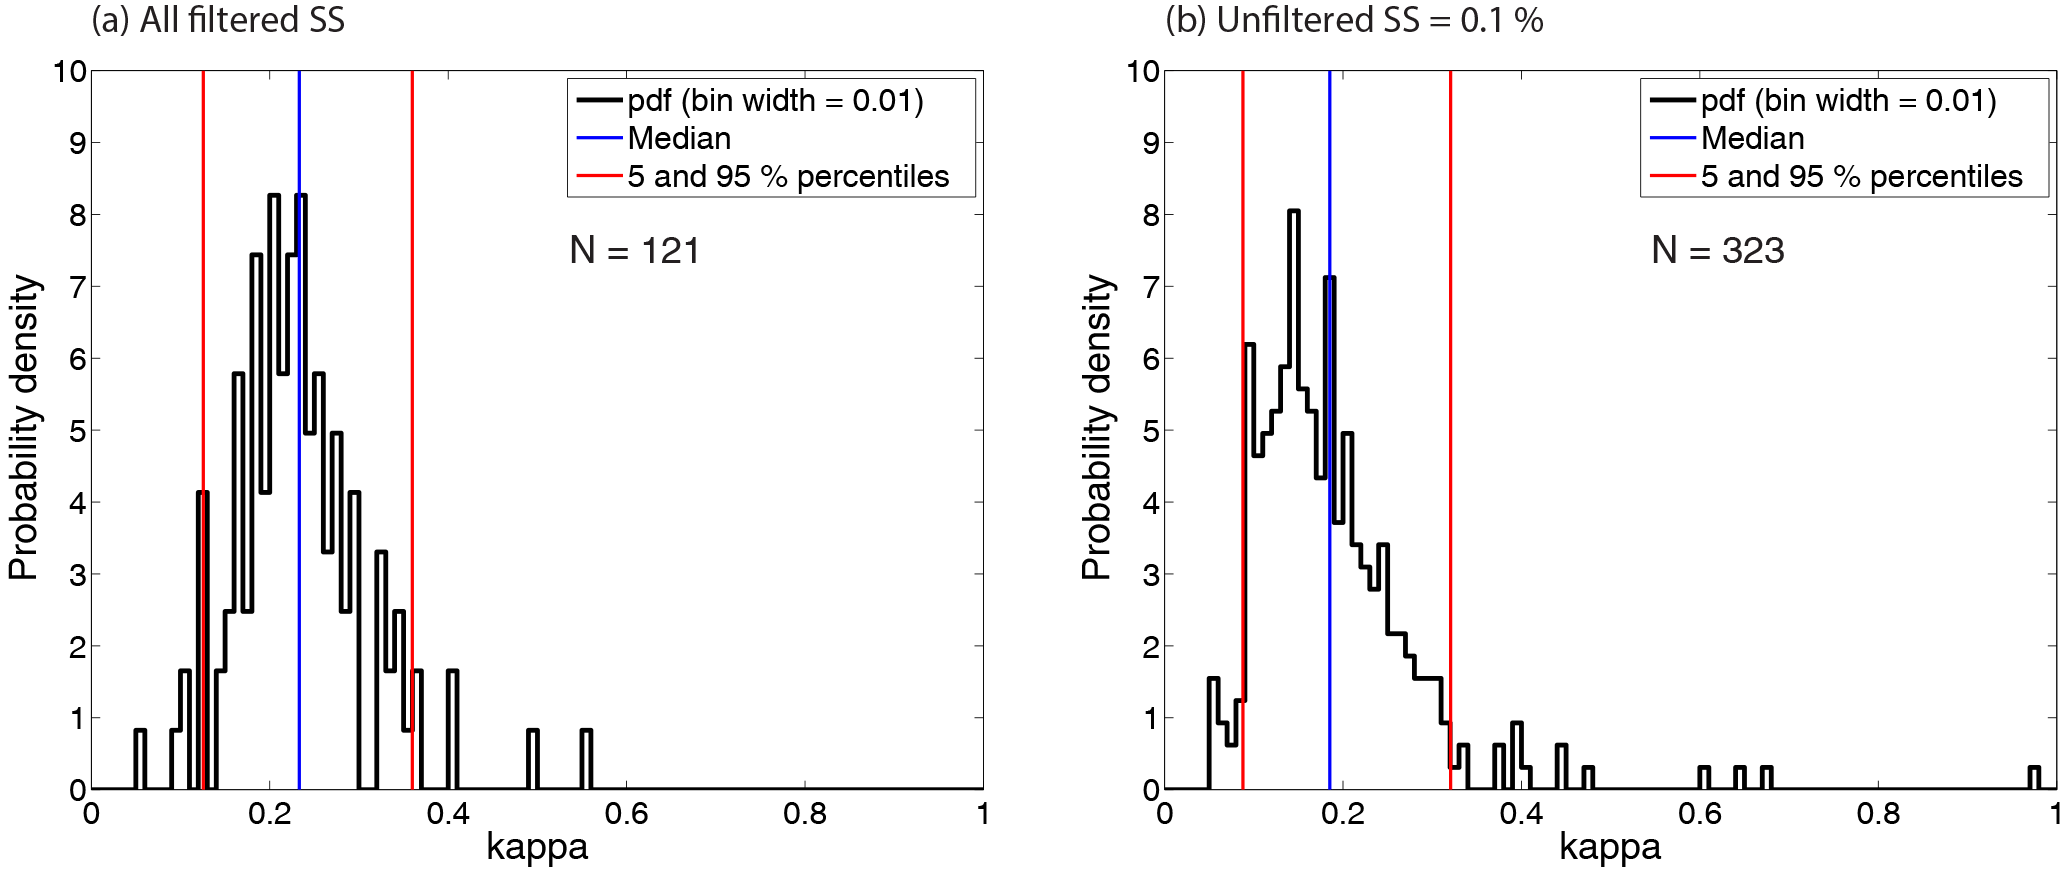
Figure 10(a) Probability density function (pdf) of all inferred κ values (filtered values of all supersaturations) of the lower panel of Fig. 9. (b) Probability density function for κ values at SS = 0.1 % (inferred from the unfiltered CCN and PNSD data of Fig. 4). The blue line displays the median and the red lines show the 5 and 95 % percentiles of the probability density function.
Kammermann et al. (2010) measured NCCN and inferred dcrit and κ in a subpolar environment during a ground-based measurement campaign in northern Sweden for SS from 0.1 to 0.7 % in July 2007. They report κ values in the range of 0.07 to 0.21. Moore et al. (2011) and Lathem et al. (2013) report κ values from airborne measurements in Alaska (April 2008) and Northern Canada (June to July 2008), respectively. Both observed values between 0.05 and 0.3 within a SS range of 0.1 to 0.6 %. Lower κ are likely to indicate a higher organic fraction in these environments. Particularly for Kammermann et al. (2010), the lowest values can be explained by the local proximity to the Stordalen mire, which is known to emit biogenic precursors of organic aerosol particles. In a modelling study by Pringle et al. (2010), the annual mean κ values at the surface in the region around Tuktoyaktuk were approximately 0.3. Overall the κ values derived in this study are comparable to previously published values.
Table 1Median values of NCCN, dcrit and κ for different SS. Values for SS = 0.1 % are calculated using the unfiltered data that cover the entire measurement period, whereas the values for SS = 0.2, 0.3, 0.5 and 0.7 % are calculated using the filtered data of periods 1, 2 and 3.
3.5 Comparison of height-resolved airborne and ground-based PNSDs
During the campaign four overflights of the Polar 6 research aircraft were performed. Overflights 1 and 2 were single overflights at a constant altitude of 600 and 200 m, respectively. During overflights 3 and 4 eight legs in altitudes between 300 and 3000 m were flown. The comparison of the airborne and ground-based measured PNSDs of the four overflights is shown in Fig. 11. Arrows in Fig. 4 indicate the times when the four overflights took place. For overflights 1 and 2 simultaneous measurements of filtered PNSDc exist. For overflights 3 and 4 the closest filtered PNSDc measurements have a temporal distance of 7 and 6 h to the time of overflight, respectively. Hence, for the comparison in case of overflights 3 and 4 the unfiltered PNSDd measurements are used. The airborne PNSDs measured by means of an UHSAS were recorded with a time resolution of 1 s and extrapolated to standard pressure (1013.25 hPa). In Fig. 11 the UHSAS distributions are generally displayed as the median of 100 measured distributions. Additional bars that indicate the range between the 25 and 75 % percentiles are added to the distributions of overflights 1 and 2. PNSDc and PNSDd, which were measured at the ground, are shown for ambient pressure.

Figure 11PNSDs measured at the ground-based station and on the Polar 6 research aircraft during four overflights. Overflights 1 and 2 took place in 200 m and 600 m, whereas overflights 3 and 4 were profile flights at altitudes between 300 and 3000 m. Airborne measurements from 70 nm up to 1 µm were done using an UHSAS, while ground-based PNSDcs and PNSDds of aerosol particle diameters from 13.6 up to 736.5 nm were measured using a SMPS as indicated in the setup of Fig. 1.
For overflights 1 and 2, the ground-based PNSDcs agree well with the airborne PNSD in the overlapping size range of 70 to 736.5 nm, where airborne measurements were carried out at 600 and 200 m, respectively. Vertical temperature profiles observed by radiosondes over Inuvik show temperature inversions at altitudes of 1500 and 700 m for overflights 1 and 2, respectively (not shown here). This indicates that during these two distinct time periods the ground-based measurements of PNSDs are representative for the atmospheric boundary layer.
For overflights 3 and 4, the measured PNSDs varied with respect to the particle number concentration and shape for the flights in different altitudes between 300 and 3000 m. The airborne PNSDs of overflight 3 show the same shape at all eight heights with a clear decrease of the number concentration at lower heights. The integration of the PNSD measured at 300 m (black line) gives a total particle number concentration of 24 particles per cm3, whereas it is 512 cm−3 at an altitude of 3000 m, i.e. 20 times higher. However the shape of the PNSDs does not change with height, as all distributions are monomodal with a maximum at approximately 150 nm. The ground-based PNSDd in the size range above 150 nm agrees best with the airborne PNSD that was measured at 1200 m. At smaller sizes no comparison can be done, as the local pollution produces a large mode below 150 nm. The ambient temperature recorded at the Polar 6 aircraft during overflight 3 indicates a temperature inversion near an altitude of 2000 m. For further investigation back trajectories at altitudes of 1000, 2000 and 3000 m were calculated to investigate the history of air masses at different altitudes. The trajectories arriving at altitudes of 1000 and 2000 m show an air mass origin in the area of the North Pacific, comparable to Period 3 in Sect. 3.2.1. But the trajectory that arrived in 3000 m indicates an air mass origin in the central Arctic and over Greenland. Hence, the origin of the air masses and the relatively higher particle number concentration in the accumulation mode of the PNSD may indicate that the typical aged Arctic spring aerosol, which was observed during Period 2, is present above the temperature inversion. This aerosol could be mixed down to lower layers accompanied by a dilution process, but aerosol observed at the lower levels is likely mostly of a different origin. Overflight 4 shows that the airborne PNSDs also may differ in shape depending on the height. The PNSDs between 1750 and 3000 m are monomodal with a maximum between 100 and 200 nm. Also, a comparably high particle number concentration was measured at an altitude of 3000 m. The PNSDs at lower heights imply a second mode below 100 nm. This Aitken mode is also present in the ground-based PNSDd, which fits the airborne PNSDs that were measured below 1200 m. The air masses above 1750 m show characteristics of the typical aged Arctic accumulation-type aerosol (comparable to Period 2) whereas the air masses below 1200 m seem to consist of aerosol of marine origin (comparable to Period 3). For overflight 4, two temperature inversions were recorded between 2500 and 3000 m. The temperature inversions and the different shapes of the PNSDs are indicative of the presence of different air masses during overflight 4, although air mass back trajectories that arrived at 1000, 2000 and 3000 m indicate an air mass origin over the North Pacific for all three heights.
Stone et al. (2014) explain that layering of Arctic aerosol, as we observed it during overflight 4, is a function of where the aerosol particle sources are located. Thereby the crucial factors are the different pathways of aerosol transport in the lower Arctic troposphere. The cold air of the lower Arctic troposphere is covered by surfaces of constant potential temperature and forms a dome over the Arctic (Law and Stohl, 2007). According to Stohl (2006) three transport pathways are possible: (1) low-level transport followed by ascent along the surfaces of constant potential temperature; (2) only low-level transport; (3) uplift outside the Arctic followed by transport in the upper troposphere and descent in the Arctic. It is likely that the aerosol particles we observed in the upper levels of overflights 3 and 4 were transported via pathway 1 or 3 whereas pathway 2 might be responsible for the occurrence of the bimodal PNSD below 1200 m during overflight 4.
Note that the altitude-resolved PNSDs presented here only represent a short snapshot in time. Hence, our observations do not describe how the transition from Arctic spring to summer affects the Arctic PNSD in the different lower layers of the troposphere. However, the measurements during all four overflights show that the ground-based PNSD is similar to the airborne PNSD of the lowest tropospheric layers. Therefore it can be rejected that local natural sources contribute significantly to our measurements during the observed time period, at least after removing signals from local pollution. It is more likely that aerosol particles or their precursor gases are advected via long-range transport from lower latitudes in different height layers and mixed down in the lower Arctic troposphere.
Arctic CCN and aerosol particle properties were measured during the RACEPAC campaign in May 2014 both on the ground and during four overflights. Due to the occurrence of local pollution, a filtering procedure had to be applied before the ground-based data set was further evaluated to obtain estimates for the background conditions. The local pollution caused peaks in up to more than 10 000 cm−3 with a typical temporal duration of 1 to 5 min in NCN. A comparison of the PNSDs of the polluted and the unpolluted periods shows that the local pollution significantly contributed to the measured particle number concentration below a size of 150 nm. As a consequence of this, NCCN and κ obtained for SS = 0.1 % could be analysed for the whole measurement period, as these were not affected by pollution events of particle sizes below 150 nm, while NCCN and κ at all other measured SS as well as the PNSDs were analysed for three distinct time periods only. Ten-day back trajectories that were computed for the three periods showed that air masses from two different origins were investigated. Air masses with an origin in north-eastern Canada were typically dominated by Arctic haze. The corresponding monomodal PNSD shows an accumulation mode which most likely contains well-aged particles that have an Eurasian origin (Behrenfeld et al., 2008). The other origin of air masses observed in our study is the region of the North Pacific and Eastern Russia. The corresponding bimodal PNSD shows an additional mode of smaller particles that may be attributed to new particle formation and growth potentially due to oxidation products of marine emissions of DMS (Engvall et al., 2008; Wiedensohler et al., 2011). This variability in the PNSD is typical for the transition from Arctic spring to summer during April, May and June (Engvall et al., 2008). Further, the PSCF receptor model was applied to identify possible source regions for aerosol particles measured at Tuktoyaktuk. We found air masses with their origin in active fire areas in central Canada and Siberia, in areas of industrial anthropogenic pollution (Norilsk and Prudhoe Bay Oil Field) and in the area of the north-west Pacific to cause enhanced NCN values. Thus, these regions are considered to be potential source regions of Arctic aerosol particles. CCN number concentrations were found to cover a range between less than 10 and 250 cm−3 for SS between 0.1 and 0.7 %, respectively. Applying the κ-Köhler theory (Petters and Kreidenweis, 2007) the hygroscopicity parameter κ was inferred. The median κ of all SS and all three evaluated periods is 0.23. At SS = 0.1 %, for which the whole measurement period could be evaluated, we found a mean κ of 0.19. The estimated random errors typically exceed the observed variation in the inferred κ values. Consequently, it was not possible to distinguish κ values related to different air masses or particle sizes.
Simultaneous measurements at the ground-based measuring station in Tuktoyaktuk and on the research aircraft Polar 6 show a qualitative good agreement of ground-based PNSDs with PNSDs of the lowest tropospheric layers (up to 1200 m when measurements at this height were present) during four overflights. Hence, it can be excluded that local natural sources contribute significantly to our ground-based measurements during the observed time period and that the ground-based measurements of PNSDcs (without influence of local pollution) are representative for the atmospheric boundary layer in the area of Tuktoyaktuk during the measurement period. Moreover, two profile flights show that the PNSDs measured inside and above the atmospheric boundary layer can vary in shape and integrated particle number concentration. We observed the largest particle number concentrations in the highest layer (3000 m). It can be assumed that the aerosol is advected via long-range transport from lower latitudes in different height layers and mixed down in the lower Arctic troposphere. Certainly, the underlying database that was used for this analysis is small. However, as the conditions in the Arctic are changing very rapidly, such measurements do have a value for future reference as they document the situation at a specific time period during the change.
The data are available through the World Data Center PANGAEA (https://www.pangaea.de/) after May 2018. A link to the data can be found under this paper's assets tab on ACP's journal website.
A1 Post-processing and filtering of the raw data set
Measurements of NCN, NCCN and PNSD were contaminated due to local particle sources, and so a filter routine had to be applied. The filter completely removes data points at time periods during which the pollution occurred. NCN is the parameter that is most sensitive to the pollution since it was detected with the lowest time resolution (1 s) and pollution occurred in a size range smaller than 150 nm in diameter, which is covered by the CPC 3010. Pollution events were identified due to a fast (some seconds) and intensive increase of NCN, which is well visible in the NCN time series. Consequently, the gradient in the NCN time series was used as a filter criterion. The peaks that occurred due to local pollution events could be identified best by searching for an absolute gradient between two NCN measuring points of at least ±20 particles per cm3 s. For further analysis, NCCN and PNSD that were measured in a time span of 400 s before and after a pollution peak occurred were neglected. The 400 s originated from the sampling frequency of NCCN (400 s) and PNSD (318 s).
During the measurement period technical problems occurred with the CPC 3025, which was a part of the SMPS system. This resulted in a non-uniform consistency between NCN measured with the CPC 3010 and the NCN of the integrated PNSD measured with a CPC 3025. Hence, the PNSDs were variably corrected so that the integrated total number concentration was consistent with NCN measured with the CPC 3010.
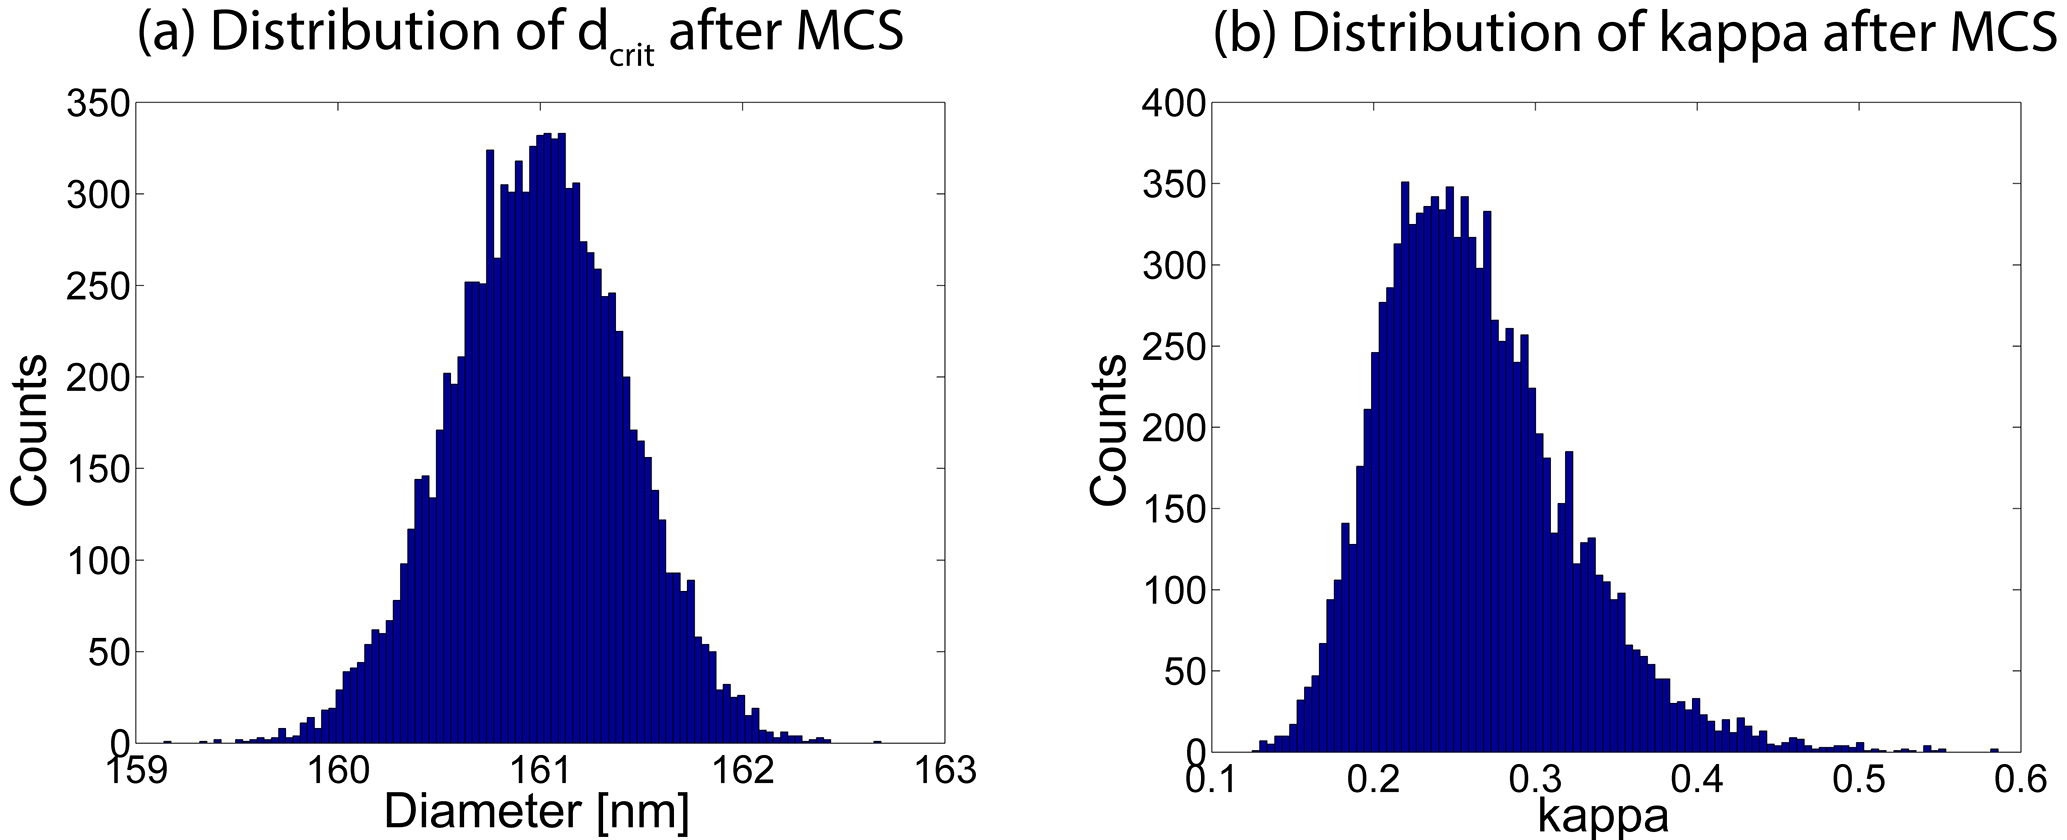
Figure A1(a) Distribution of 10 000 dcrit values after applying the MCS. The mean and the standard deviation of this distribution are the final dcrit and its uncertainty due to the 5 % uncertainty in the particle number concentration of each size bin in the PNSD, respectively. (b) Distribution of 10 000 κ values after applying the MCS. As this results in a log-normal distribution of κ values it is more appropriate to use the median and percentiles as the final κ value and its uncertainty, respectively.
Determination and error estimation of dcrit and κ using a Monte Carlo simulation (MCS)
Measurements of PNSD and NCCN come along with device-specific uncertainties. For instance, the particle diameter that is selected with a DMA can be assumed to have an uncertainty of 3 % and the measured particle number concentration an uncertainty of 5 %, corresponding to 1 standard deviation (Gysel and Stratmann, 2013). Moreover, the effective SS in the CCN counter has a relative uncertainty of 3.5 % for SS above 0.2 %, corresponding to 1 standard deviation. These uncertainties have been inferred from several SS calibrations that were performed at the Leibniz Institute for Tropospheric Research (TROPOS). Below SS = 0.2 % the same absolute uncertainty as for SS = 0.2 % can be assumed (Gysel and Stratmann, 2013). To consider the impact of these uncertainties on dcrit and κ in a realistic way, a MCS based on random normal distributions was used. This following general equation was applied:
where u is the relative uncertainty, p a random number, s is the measured signal and sMC the resulting MCS signal. This was done for 10 000 random and normally distributed numbers p, with a mean of 0 and a standard deviation of 1, which then results in 10 000 values for sMC with a variability that is characterized by u.
In a first step, the uncertainty in dcrit was obtained by a MCS based on one exemplary PNSD, the related NCCN and a 5 % uncertainty in the particle number concentration. Equation (A1) was used to vary the particle number concentration of each size bin of the PNSD to calculate 10 000 dcrit values, of which a distribution is shown in Fig. A1a. The mean and standard deviation of these 10 000 dcrit values can be taken from this distribution, and the overall uncertainty in dcrit was derived from those values together with the 3 % uncertainty in the particle sizing due to the DMA, using error propagation. This was then done for all PNSDs. The resulting uncertainties are shown as error bars in the middle panel of Fig. 9.
κ and the corresponding error bars in the lower panel of Fig. 9 are inferred by means of Eq. (1), where dcrit and Scrit, which is the effective SS of the CCN counter, are 10 000 times Monte Carlo simulated (same procedure as for dcrit). Since the connection between κ and SS is logarithmic, the resulting distribution of the 10 000 κ values is a log-normal distribution, as can be seen in Fig. A1b for one exemplary case. Consequently, our final inferred κ and its uncertainty are the median and the 5 and 95 % percentiles of this distribution, respectively. The average of all widths between the 5 and 95 % percentiles is the value we compared with the width between the 5 and 95 % percentiles of all median κ values to make a statement about the significance of our results.
The authors declare that they have no conflict of interest.
This article is part of the special issue “BACCHUS – Impact of Biogenic versus Anthropogenic emissions on Clouds and Climate: towards a Holistic UnderStanding (ACP/AMT/GMD inter-journal SI)”. It is not associated with a conference.
This work was part of RACEPAC (Radiation–Aerosol–Cloud Experiment in the
Arctic Circle) and we thank the RACEPAC coordination team (University of
Leipzig, TROPOS Leipzig, MPI-C Mainz) for initiating and organizing the
campaign. Furthermore, we acknowledge the AWI (Alfred Wegener Institute, Helmholtz Centre for Polar and Marine Research) Bremerhaven for fruitful
scientific collaboration and providing the aircraft. We also thank the
Canadian Polar Continental Shelf Program (PCSP), the Aurora Research
Institute and their staff for logistic and administrative support, in
particular for obtaining the necessary licences (PCSP project number 71614,
and ARI research licence number 15407) and the permissions to operate the
station and to conduct the overflights. We gratefully acknowledge the
support and help from the people of the Inuvialuit hamlet of Tuktoyaktuk.
Significant financial support was also provided by internal sources of the
Max Planck Society for the setup and operation of the Tuktoyaktuk station, as
well as for the execution of the Polar 6 research flights. Furthermore, this work
was partially funded by the EU FP7-ENV-2013 program “Impact of Biogenic vs.
Anthropogenic emissions on Clouds and Climate: towards a Holistic
UnderStanding” (BACCHUS), project number 603445. Thomas Bjerring Kristensen
acknowledges funding from the German Federal Ministry of Education and
Research (BMBF) project no. 01LK1222B.
Edited by: Hinrich Grothe
Reviewed by: three anonymous referees
Albrecht, B.: Aerosols, cloud microphysics, and fractional cloudiness, Science, 245, 1227–1230, 1989. a
AMAP: AMAP Assessment 2006: Acidifying Pollutants, Arctic Haze, and Acidification in the Arctic., Arctic Monitoring and Assessment Programme (AMAP), 2006. a
Andreae, M. O. and Rosenfeld, D.: Aerosol-cloud-precipitation interactions. Part 1. The nature and sources of cloud-active aerosols, Earth-Sci. Rev., 89, 13–41, https://doi.org/10.1016/j.earscirev.2008.03.001, 2008. a
Ashbaugh, L. L., Malm, W. C., and Sadeh, W. Z.: A residence time probability analysis of sulfur concentrations at grand Canyon National Park, Atmos. Environ., 19, 1263–1270, https://doi.org/10.1016/0004-6981(85)90256-2, 1985. a
Asmi, E., Kondratyev, V., Brus, D., Laurila, T., Lihavainen, H., Backman, J., Vakkari, V., Aurela, M., Hatakka, J., Viisanen, Y., Uttal, T., Ivakhov, V., and Makshtas, A.: Aerosol size distribution seasonal characteristics measured in Tiksi, Russian Arctic, Atmos. Chem. Phys., 16, 1271–1287, https://doi.org/10.5194/acp-16-1271-2016, 2016. a
Behrenfeld, U., Krejci, R., Ström, J., and Stohl, A.: Chemical properties of Arctic aerosol particles collected at the Zeppelin station during the aerosol transition period in May and June of 2004, Tellus B, 60, 405–415, https://doi.org/10.1111/j.1600-0889.2008.00349.x, 2008. a, b
Browse, J., Carslaw, K. S., Arnold, S. R., Pringle, K., and Boucher, O.: The scavenging processes controlling the seasonal cycle in Arctic sulphate and black carbon aerosol, Atmos. Chem. Phys., 12, 6775–6798, https://doi.org/10.5194/acp-12-6775-2012, 2012. a
Burkart, J., Willis, M. D., Bozem, H., Thomas, J. L., Law, K., Hoor, P., Aliabadi, A. A., Köllner, F., Schneider, J., Herber, A., Abbatt, J. P. D., and Leaitch, W. R.: Summertime observations of elevated levels of ultrafine particles in the high Arctic marine boundary layer, Atmos. Chem. Phys., 17, 5515–5535, https://doi.org/10.5194/acp-17-5515-2017, 2017. a
Burkart, J., Hodshire, A. L., Mungall, E. L., Pierce, J. R., Collins, D. B., Ladino, L. A., Lee, A. K. Y., Irish, V., Wentzell, J. J. B., Liggio, J., Papakyriakou, T., Murphy, J., and Abbatt, J.: Organic condensation and particle growth to CCN sizes in the summertime marine Arctic is driven by materials more semivolatile than at continental sites, Geophys. Res. Lett., 44, 10725–10734, https://doi.org/10.1002/2017GL075671, 2017b. a
Collins, D. B., Burkart, J., Chang, R. Y.-W., Lizotte, M., Boivin-Rioux, A., Blais, M., Mungall, E. L., Boyer, M., Irish, V. E., Massé, G., Kunkel, D., Tremblay, J.-É., Papakyriakou, T., Bertram, A. K., Bozem, H., Gosselin, M., Levasseur, M., and Abbatt, J. P. D.: Frequent ultrafine particle formation and growth in Canadian Arctic marine and coastal environments, Atmos. Chem. Phys., 17, 13119–13138, https://doi.org/10.5194/acp-17-13119-2017, 2017. a
Croft, B., Martin, R. V., Leaitch, W. R., Tunved, P., Breider, T. J., D'Andrea, S. D., and Pierce, J. R.: Processes controlling the annual cycle of Arctic aerosol number and size distributions, Atmos. Chem. Phys., 16, 3665–3682, https://doi.org/10.5194/acp-16-3665-2016, 2016a. a, b, c
Croft, B., Wentworth, G. R., Martin, R. V., Leaitch, W. R., Murphy, J. G., Murphy, B. N., Kodros, J. K., Abbatt, J. P. D., and Pierce, J. R.: Contribution of Arctic seabird-colony ammonia to atmospheric particles and cloud-albedo radiative effect, Nat. Commun., 7, 13444, https://doi.org/10.1038/ncomms13444, 2016b. a
Dall'Osto, M., Beddows, D. C. S., Tunved, P., Krejci, R., Ström, J., Hansson, H.-C., Yoon, Y. J., Park, K.-T., Becagli, S., Udisti, R., Onasch, T., O'Dowd, C. D., Simó, R., and Harrison, R. M.: Arctic sea ice melt leads to atmospheric new particle formation, Sci. Rep., 7, 3318, https://doi.org/10.1038/s41598-017-03328-1, 2017a. a, b, c, d
Dall'Osto, M., Ovadnevaite, J., Paglione, M., Beddows, D. C., Ceburnis, D., Cree, C., Cortés, P., Zamanillo, M., Nunes, S. O., Pérez, G. L., Ortega-Retuerta, E., Emelianov, M., Vaqué, D., Marrasé, C., Estrada, M., Sala, M. M., Vidal, M., Fitzsimons, M. F., Beale, R., Airs, R., Rinaldi, M., Decesari, S., Facchini, M. C., Harrison, R. M., O'Dowd, C., and Simó, R.: Antarctic sea ice region as a source of biogenic organic nitrogen in aerosols, Sci. Rep., 7, 6047, https://doi.org/10.1038/s41598-017-06188-x, 2017b. a
Engvall, A.-C., Krejci, R., Ström, J., Treffeisen, R., Scheele, R., Hermansen, O., and Paatero, J.: Changes in aerosol properties during spring-summer period in the Arctic troposphere, Atmos. Chem. Phys., 8, 445–462, https://doi.org/10.5194/acp-8-445-2008, 2008. a, b, c, d
Fleming, Z. L., Monks, P. S., and Manning, A. J.: Review: Untangling the influence of air-mass history in interpreting observed atmospheric composition, Atmos. Res., 104–105, 1–39, https://doi.org/10.1016/j.atmosres.2011.09.009, 2012. a
Freud, E., Krejci, R., Tunved, P., Leaitch, R., Nguyen, Q. T., Massling, A., Skov, H., and Barrie, L.: Pan-Arctic aerosol number size distributions: seasonality and transport patterns, Atmos. Chem. Phys., 17, 8101–8128, https://doi.org/10.5194/acp-17-8101-2017, 2017. a, b
Garrett, T. J., Radke, L. F., and Hobbs, P. V.: Aerosol Effects on Cloud Emissivity and Surface Longwave Heating in the Arctic, J. Atmos. Sci., 59, 769–778, https://doi.org/10.1175/1520-0469(2002)059<0769:AEOCEA>2.0.CO;2, 2002. a, b
Gunsch, M. J., Kirpes, R. M., Kolesar, K. R., Barrett, T. E., China, S., Sheesley, R. J., Laskin, A., Wiedensohler, A., Tuch, T., and Pratt, K. A.: Contributions of transported Prudhoe Bay oil field emissions to the aerosol population in Utqiagvik, Alaska, Atmos. Chem. Phys., 17, 10879–10892, https://doi.org/10.5194/acp-17-10879-2017, 2017. a, b
Gysel, M. and Stratmann, F.: WP3 – NA3: In-situ chemical, physical and optical properties of aerosols, Deliverable D3.11: Standardized protocol for CCN measurements, Tech. rep., available at: http://www.actris.net/Portals/97/Publications/quality standards/aerosol insitu/WP3_D3.13_M24_CCNC_SOP_v130514.pdf (last access: 27 March 2018), 2013. a, b, c, d
Heintzenberg, J.: Particle size distribution and optical properties of Arctic haze, Tellus, 32, 251–260, https://doi.org/10.1111/j.2153-3490.1980.tb00952.x, 1980. a, b
Hopke, P. K.: Review of receptor modeling methods for source apportionment, J. Air Waste Manag. Assoc., 66, 237–259, https://doi.org/10.1080/10962247.2016.1140693, 2016. a
Hoppel, W. A., Frick, G. M., Fitzgerald, J. W., and Larson, R. E.: Marine boundary layer measurements of new particle formation and the effects nonprecipitating clouds have on aerosol size distribution, J. Geophys. Res.-Atmos., 99, 14443–14459, https://doi.org/10.1029/94JD00797, 1994. a
Iversen, T. and Joranger, E.: Arctic air pollution and large scale atmospheric flows, Atmos. Environ., 19, 2099–2108, 1985. a
Jacob, D. J., Crawford, J. H., Maring, H., Clarke, A. D., Dibb, J. E., Emmons, L. K., Ferrare, R. A., Hostetler, C. A., Russell, P. B., Singh, H. B., Thompson, A. M., Shaw, G. E., McCauley, E., Pederson, J. R., and Fisher, J. A.: The Arctic Research of the Composition of the Troposphere from Aircraft and Satellites (ARCTAS) mission: design, execution, and first results, Atmos. Chem. Phys., 10, 5191–5212, https://doi.org/10.5194/acp-10-5191-2010, 2010. a
Kammermann, L., Gysel, M., Weingartner, E., Herich, H., Cziczo, D. J., Holst, T., Svenningsson, B., Arneth, A., and Baltensperger, U.: Subarctic atmospheric aerosol composition: 3. Measured and modeled properties of cloud condensation nuclei, J. Geophys. Res.-Atmos., 115, d04202, https://doi.org/10.1029/2009JD012447, 2010. a, b
Keegan, K. M., Albert, M. R., McConnell, J. R., and Baker, I.: Climate change and forest fires synergistically drive widespread melt events of the Greenland Ice Sheet, P. Natl. Acad. Sci., 111, 7964–7967, https://doi.org/10.1073/pnas.1405397111, 2014. a
Köhler, H.: The nucleus in and the growth of hygroscopic droplets, Trans. Faraday Soc., 32, 1152–1161, https://doi.org/10.1039/TF9363201152, 1936. a, b
Kolesar, K. R., Cellini, J., Peterson, P. K., Jefferson, A., Tuch, T., Birmili, W., Wiedensohler, A., and Pratt, K. A.: Effect of Prudhoe Bay emissions on atmospheric aerosol growth events observed in Utqiagrvik (Barrow), Alaska, Atmos. Environ., 152, 146–155, https://doi.org/10.1016/j.atmosenv.2016.12.019, 2017. a, b
Kristensen, T. B., Müller, T., Kandler, K., Benker, N., Hartmann, M., Prospero, J. M., Wiedensohler, A., and Stratmann, F.: Properties of cloud condensation nuclei (CCN) in the trade wind marine boundary layer of the western North Atlantic, Atmos. Chem. Phys., 16, 2675–2688, https://doi.org/10.5194/acp-16-2675-2016, 2016. a
Lathem, T. L., Beyersdorf, A. J., Thornhill, K. L., Winstead, E. L., Cubison, M. J., Hecobian, A., Jimenez, J. L., Weber, R. J., Anderson, B. E., and Nenes, A.: Analysis of CCN activity of Arctic aerosol and Canadian biomass burning during summer 2008, Atmos. Chem. Phys., 13, 2735–2756, https://doi.org/10.5194/acp-13-2735-2013, 2013. a
Law, K. S. and Stohl, A.: Arctic Air Pollution: Origins and Impacts, Science, 315, 1537–1540, https://doi.org/10.1126/science.1137695, 2007. a, b
Leaitch, R. W., Sharma, S., Huang, L., Toom-Sauntry, D., Chivulescu, A., Macdonald, A. M., von Salzen, K., Pierce, J. R., Bertram, A. K., Schroder, J. C., Shantz, N. C., Chang, R. Y.-W., and Norman, A.-L.: Dimethyl sulfide control of the clean summertime Arctic aerosol and cloud, Elem. Sci. Anthr., 1, 17, https://doi.org/10.12952/journal.elementa.000017, 2013. a
Leaitch, W. R., Korolev, A., Aliabadi, A. A., Burkart, J., Willis, M. D., Abbatt, J. P. D., Bozem, H., Hoor, P., Köllner, F., Schneider, J., Herber, A., Konrad, C., and Brauner, R.: Effects of 20–100 nm particles on liquid clouds in the clean summertime Arctic, Atmos. Chem. Phys., 16, 11107–11124, https://doi.org/10.5194/acp-16-11107-2016, 2016. a
Li, S.-M., Barrie, L. A., and Sirois, A.: Biogenic sulfur aerosol in the Arctic troposphere: 2. Trends and seasonal variations, J. Geophys. Res.-Atmos., 98, 20623–20631, https://doi.org/10.1029/93JD02233, 1993. a, b
Lubin, D. and Vogelmann, A. M.: A climatologically significant aerosol longwave indirect effect in the Arctic, Nature, 439, 453–456, 2006. a
Mauritsen, T., Sedlar, J., Tjernström, M., Leck, C., Martin, M., Shupe, M., Sjogren, S., Sierau, B., Persson, P. O. G., Brooks, I. M., and Swietlicki, E.: An Arctic CCN-limited cloud-aerosol regime, Atmos. Chem. Phys., 11, 165–173, https://doi.org/10.5194/acp-11-165-2011, 2011. a
Moore, R. H., Bahreini, R., Brock, C. A., Froyd, K. D., Cozic, J., Holloway, J. S., Middlebrook, A. M., Murphy, D. M., and Nenes, A.: Hygroscopicity and composition of Alaskan Arctic CCN during April 2008, Atmos. Chem. Phys., 11, 11807–11825, https://doi.org/10.5194/acp-11-11807-2011, 2011. a, b
Nguyen, Q. T., Glasius, M., Sørensen, L. L., Jensen, B., Skov, H., Birmili, W., Wiedensohler, A., Kristensson, A., Nøjgaard, J. K., and Massling, A.: Seasonal variation of atmospheric particle number concentrations, new particle formation and atmospheric oxidation capacity at the high Arctic site Villum Research Station, Station Nord, Atmos. Chem. Phys., 16, 11319–11336, https://doi.org/10.5194/acp-16-11319-2016, 2016. a
Petters, M. D. and Kreidenweis, S. M.: A single parameter representation of hygroscopic growth and cloud condensation nucleus activity, Atmos. Chem. Phys., 7, 1961–1971, https://doi.org/10.5194/acp-7-1961-2007, 2007. a, b, c, d
Pringle, K. J., Tost, H., Pozzer, A., Pöschl, U., and Lelieveld, J.: Global distribution of the effective aerosol hygroscopicity parameter for CCN activation, Atmos. Chem. Phys., 10, 5241–5255, https://doi.org/10.5194/acp-10-5241-2010, 2010. a
Quinn, P. K., Miller, T. L., Bates, T. S., Ogren, J. A., Andrews, E., and Shaw, G. E.: A 3-year record of simultaneously measured aerosol chemical and optical properties at Barrow, Alaska, J. Geophys. Res.-Atmos., 107, AAC 8-1–AAC 8-15, https://doi.org/10.1029/2001JD001248, 2002. a, b, c
Quinn, P. K., Shaw, G., Andrews, E., Dutton, E. G., Ruoho-Airola, T., and Gong, S. L.: Arctic haze: current trends and knowledge gaps, Tellus B, 59B, 99–114, https://doi.org/10.1111/j.1600-0889.2006.00238.x, 2007. a, b, c, d
Roberts, G. C. and Nenes, A.: A continuous-flow streamwise thermal-gradient CCN chamber for atmospheric measurements, Aerosol Sci. Technol., 39, 206–221, https://doi.org/10.1080/027868290913988, 2005. a
Rose, D., Gunthe, S. S., Mikhailov, E., Frank, G. P., Dusek, U., Andreae, M. O., and Pöschl, U.: Calibration and measurement uncertainties of a continuous-flow cloud condensation nuclei counter (DMT-CCNC): CCN activation of ammonium sulfate and sodium chloride aerosol particles in theory and experiment, Atmos. Chem. Phys., 8, 1153–1179, https://doi.org/10.5194/acp-8-1153-2008, 2008. a
Sharma, S., Chan, E., Ishizawa, M., Toom-Sauntry, D., Gong, S. L., Li, S. M., Tarasick, D. W., Leaitch, W. R., Norman, A., Quinn, P. K., Bates, T. S., Levasseur, M., Barrie, L. A., and Maenhaut, W.: Influence of transport and ocean ice extent on biogenic aerosol sulfur in the Arctic atmosphere, J. Geophys. Res.-Atmos., 117, https://doi.org/10.1029/2011jd017074, 2012. a
Shaw, G.: Eddy diffusion transport of Arctic pollution from the mid-latitudes: A preliminary model, Atmos. Environ., 15, 1483–1490, https://doi.org/10.1016/0004-6981(81)90356-5, 1981. a, b
Shaw, G. E.: The Arctic Haze Phenomenon, B. Am. Meteorol. Soc., 76, 2403–2413, https://doi.org/10.1175/1520-0477(1995)076<2403:TAHP>2.0.CO;2, 1995. a, b
Silvergren, S., Wideqvist, U., Ström, J., Sjogren, S., and Svenningsson, B.: Hygroscopic growth and cloud forming potential of Arctic aerosol based on observed chemical and physical characteristics (a 1 year study 2007–2008), J. Geophys. Res.-Atmos., 119, 14080–14097, https://doi.org/10.1002/2014JD021657, 2014. a
Sprenger, M. and Wernli, H.: The LAGRANTO Lagrangian analysis tool – version 2.0, Geosci. Model Dev., 8, 2569–2586, https://doi.org/10.5194/gmd-8-2569-2015, 2015. a
Stohl, A.: Characteristics of atmospheric transport into the Arctic troposphere, J. Geophys. Res.-Atmos., 111, d11306, https://doi.org/10.1029/2005JD006888, 2006. a
Stone, R. S., Sharma, S., Herber, A., Eleftheriadis, K., and Nelson, D. W.: A characterization of Arctic aerosols on the basis of aerosol optical depth and black carbon measurements, Elem. Sci. Anth., 2, 27, https://doi.org/10.12952/journal.elementa.000027, 2014. a
Ström, J., Engvall, A.-C., Delbart, F., Krecji, R., and Treffeisen, R.: On small particles in the Arctic summer boundary layer: observations at two different heights near Ny-Ålesund, Svalbard, Tellus B, 61, 473–482, https://doi.org/10.1111/j.1600-0889.2008.00412.x, 2009. a
Tietze, K., Riedi, J., Stohl, A., and Garrett, T. J.: Space-based evaluation of interactions between aerosols and low-level Arctic clouds during the Spring and Summer of 2008, Atmos. Chem. Phys., 11, 3359–3373, https://doi.org/10.5194/acp-11-3359-2011, 2011. a
Tunved, P., Ström, J., and Krejci, R.: Arctic aerosol life cycle: linking aerosol size distributions observed between 2000 and 2010 with air mass transport and precipitation at Zeppelin station, Ny-Ålesund, Svalbard, Atmos. Chem. Phys., 13, 3643–3660, https://doi.org/10.5194/acp-13-3643-2013, 2013. a, b, c, d, e, f, g, h, i, j, k, l, m, n, o, p, q, r, s
Twomey, S.: Pollution and the planetary albedo, Atmos. Environ., 8, 1251–1256, 1974. a
Waked, A., Favez, O., Alleman, L. Y., Piot, C., Petit, J.-E., Delaunay, T., Verlinden, E., Golly, B., Besombes, J.-L., Jaffrezo, J.-L., and Leoz-Garziandia, E.: Source apportionment of PM10 in a north-western Europe regional urban background site (Lens, France) using positive matrix factorization and including primary biogenic emissions, Atmos. Chem. Phys., 14, 3325–3346, https://doi.org/10.5194/acp-14-3325-2014, 2014. a
Warneke, C., Bahreini, R., Brioude, J., Brock, C. A., de Gouw, J. A., Fahey, D. W., Froyd, K. D., Holloway, J. S., Middlebrook, A., Miller, L., Montzka, S., Murphy, D. M., Peischl, J., Ryerson, T. B., Schwarz, J. P., Spackman, J. R., and Veres, P.: Biomass burning in Siberia and Kazakhstan as an important source for haze over the Alaskan Arctic in April 2008, Geophys. Res. Lett., 36, https://doi.org/10.1029/2008GL036194, 2009. a
Wegner, T., Hussein, T., Hämeri, K., Vesala, T., Kulmala, M., and Weber, S.: Properties of aerosol signature size distributions in the urban environment as derived by cluster analysis, Atmos. Environ., 61, 350–360, https://doi.org/10.1016/j.atmosenv.2012.07.048, 2012. a, b
Wentworth, G. R., Murphy, J. G., Croft, B., Martin, R. V., Pierce, J. R., Côté, J.-S., Courchesne, I., Tremblay, J.-É., Gagnon, J., Thomas, J. L., Sharma, S., Toom-Sauntry, D., Chivulescu, A., Levasseur, M., and Abbatt, J. P. D.: Ammonia in the summertime Arctic marine boundary layer: sources, sinks, and implications, Atmos. Chem. Phys., 16, 1937–1953, https://doi.org/10.5194/acp-16-1937-2016, 2016. a
Wex, H., McFiggans, G., Henning, S., and Stratmann, F.: Influence of the external mixing state of atmospheric aerosol on derived CCN number concentrations, Geophys. Res. Lett., 37, L10805, https://doi.org/10.1029/2010GL043337, 2010. a
Wiedensohler, A., Covert, D., Swietlicki, E., Aalto, P., Heintzenberg, J., and Leck, C.: Occurrence of an ultrafine particle mode less than 20 nm in diameter in the marine boundary layer during Arctic summer and autumn, Tellus B, 48, 213–222, 2011. a, b
Willis, M. D., Burkart, J., Thomas, J. L., Köllner, F., Schneider, J., Bozem, H., Hoor, P. M., Aliabadi, A. A., Schulz, H., Herber, A. B., Leaitch, W. R., and Abbatt, J. P. D.: Growth of nucleation mode particles in the summertime Arctic: a case study, Atmos. Chem. Phys., 16, 7663–7679, https://doi.org/10.5194/acp-16-7663-2016, 2016. a, b
Yli-Tuomi, T., Hopke, P. K., Paatero, P., Basunia, M., Landsberger, S., Viisanen, Y., and Paatero, J.: Atmospheric aerosol over Finnish Arctic: source analysis by the multilinear engine and the potential source contribution function, Atmos. Environ., 37, 4381–4392, https://doi.org/10.1016/S1352-2310(03)00569-7, 2003. a
Zorn, S. R., Drewnick, F., Schott, M., Hoffmann, T., and Borrmann, S.: Characterization of the South Atlantic marine boundary layer aerosol using an aerodyne aerosol mass spectrometer, Atmos. Chem. Phys., 8, 4711–4728, https://doi.org/10.5194/acp-8-4711-2008, 2008. a